Brooklyn Streetcar Feasibility Study: Existing Conditions Report
63
BROOKLYN STREETCAR FEASIBILITY STUDY
Transcript of Brooklyn Streetcar Feasibility Study: Existing Conditions Report

B R O O K L Y N S T R E E T C A RF E A S I B I L I T Y S T U D Y

EXISTING CONDITIONS REPORT

BROOKLYN STREETCAR FEASIBILITY STUDY
i
TABLE OF CONTENTS 1.0 INTRODUCTION.............................................................................................................................1‐1
1.1 PURPOSE OF THE STUDY ....................................................................................................1‐1 1.2 IDENTIFICATION OF FOCUS AREA AND STUDY AREA.........................................................1‐1 1.3 METHODOLOGY .................................................................................................................1‐1
2.0 LAND USE AND COMMUNITY CHARACTER...................................................................................2‐1 2.1 DEVELOPMENT HISTORY....................................................................................................2‐1
Focus Area...................................................................................................................................2‐1 Study Area...................................................................................................................................2‐4
2.2 LAND USE ...........................................................................................................................2‐5 Focus Area...................................................................................................................................2‐5 Study Area...................................................................................................................................2‐8
2.3 FUTURE DEVELOPMENT PLANS .......................................................................................2‐10 Focus Area.................................................................................................................................2‐10 Study Area.................................................................................................................................2‐14
2.4 ZONING ............................................................................................................................2‐15 Focus Area.................................................................................................................................2‐15 Study Area.................................................................................................................................2‐17
2.5 PUBLIC POLICY..................................................................................................................2‐17 Red Hook 197‐a Plan.................................................................................................................2‐17 Southwest Brooklyn Economic Development Zone and NYC Industrial Business Zone.............2‐18 Local Waterfront Revitalization Program.................................................................................2‐18 Brooklyn Waterfront Greenway Master Plan ...........................................................................2‐19 Transit‐Oriented Development .................................................................................................2‐19 New York City Bicycle Master Plan............................................................................................2‐19 PlaNYC.......................................................................................................................................2‐20
2.6 HISTORIC RESOURCES ......................................................................................................2‐20 2.7 CONCLUSION....................................................................................................................2‐26
3.0 SOCIAL AND ECONOMIC CHARACTERISTICS ...............................................................................3‐27 3.1 DEMOGRAPHICS...............................................................................................................3‐27
Population.................................................................................................................................3‐27 Density ......................................................................................................................................3‐27 Age ............................................................................................................................................3‐29 Ethnicity ....................................................................................................................................3‐29 Educational Attainment............................................................................................................3‐31 Income ......................................................................................................................................3‐32
3.2 HOUSING..........................................................................................................................3‐33

EXISTING CONDITIONS REPORT
ii
3.3 EMPLOYMENT.................................................................................................................. 3‐34 3.4 ENVIRONMENTAL JUSTICE COMMUNITIES ..................................................................... 3‐35 3.5 CONCLUSION ................................................................................................................... 3‐38
4.0 TRANSPORTATION...................................................................................................................... 4‐39 4.1 ACCESS AND CIRCULATION.............................................................................................. 4‐39
Vehicular Access and Circulation.............................................................................................. 4‐39 Transit Access and Circulation.................................................................................................. 4‐40 Parking Regulations.................................................................................................................. 4‐43
4.2 TRAVEL CHARACTERISTICS............................................................................................... 4‐46 Residents (Journey‐to‐work)..................................................................................................... 4‐46 Employees (Reverse Journey‐to‐Work)..................................................................................... 4‐49
4.3 CONCLUSION ................................................................................................................... 4‐52 5.0 PRINCIPAL CONCLUSIONS .......................................................................................................... 5‐54
FIGURES FIGURE 1‐1: STUDY AREA AND FOCUS AREA ...................................................................................... 1‐2 FIGURE 2‐1: LAND USE ........................................................................................................................ 2‐6 FIGURE 2‐2: RECENTLY COMPLETED AND PLANNED DEVELOPMENT PROJECTS
WITHIN AND NEAR THE FOCUS AREA ....................................................................................... 2‐11 FIGURE 2‐3: HISTORIC DISTRICTS, BUILDINGS AND STRUCTURES (NORTHERN HALF
OF STUDY AREA)........................................................................................................................ 2‐24 FIGURE 2‐4: HISTORIC DISTRICTS, BUILDINGS, AND STRUCTURES (SOUTHERN HALF
OF STUDY AREA / FOCUS AREA)................................................................................................ 2‐25 FIGURE 3‐1: POPULATION AND EMPLOYMENT DENSITY.................................................................. 3‐28 FIGURE 3‐2: RACIAL COMPOSITION OF THE FOCUS AREA................................................................ 3‐30 FIGURE 3‐3: RACIAL COMPOSITION OF THE STUDY AREA ................................................................ 3‐30 FIGURE 3‐4: LEVEL OF EDUCATION IN THE FOCUS AREA.................................................................. 3‐31 FIGURE 3‐5: LEVEL OF EDUCATION IN THE STUDY AREA.................................................................. 3‐32 FIGURE 3‐6: ENVIRONMENTAL JUSTICE COMMUNITIES .................................................................. 3‐37 FIGURE 4‐1: EXISTING TRANSIT SERVICE........................................................................................... 4‐41 FIGURE 4‐2: BICYCLE ROUTES .......................................................................................................... 4‐44 FIGURE 4‐3: ON‐STREET PARKING REGULATIONS ............................................................................ 4‐45 FIGURE 4‐4: PLACE OF WORK FOR FOCUS AREA RESIDENTS............................................................ 4‐47 FIGURE 4‐5: MEANS OF TRANSPORTATION TO WORK FOR FOCUS AREA RESIDENTS ..................... 4‐48 FIGURE 4‐6: MEANS OF TRANSPORTATION TO WORK FOR STUDY AREA RESIDENTS...................... 4‐48 FIGURE 4‐7: TRAVEL TIME TO WORK FOR FOCUS AREA AND STUDY AREA RESIDENTS................... 4‐49 FIGURE 4‐8: PLACE OF RESIDENCE FOR FOCUS AREA WORKERS...................................................... 4‐50 FIGURE 4‐9: MODE OF TRAVEL TO WORK FOR FOCUS AREA WORKERS .......................................... 4‐51 FIGURE 4‐10: MODE OF TRAVEL TO WORK FOR STUDY AREA WORKERS ........................................ 4‐51 FIGURE 4‐11: TRAVEL TIME TO WORK FOR FOCUS AREA AND STUDY AREA WORKERS .................. 4‐52

BROOKLYN STREETCAR FEASIBILITY STUDY
iii
TABLES TABLE 2‐1: RECENTLY‐COMPLETED AND PLANNED DEVELOPMENT PROJECTS WITHIN
AND NEAR THE FOCUS AREA.....................................................................................................2‐12 TABLE 2‐2: FOCUS AREA AND STUDY AREA ZONING DISTRICTS .......................................................2‐16 TABLE 2‐3: HISTORIC DISTRICTS ........................................................................................................2‐20 TABLE 2‐4: HISTORIC BUILDINGS AND STRUCTURES........................................................................2‐21 TABLE 3‐1: RESIDENTIAL POPULATION (1990‐2010).........................................................................3‐27 TABLE 3‐2: POPULATION DENSITY.....................................................................................................3‐29 TABLE 3‐3: AGE DISTRIBUTION..........................................................................................................3‐29 TABLE 3‐4: INCOME DISTRIBUTION...................................................................................................3‐32 TABLE 3‐5: MEDIAN HOUSEHOLD INCOME.......................................................................................3‐33 TABLE 3‐6: HOUSING UNITS AND RESIDENTIAL VACANCY RATES.....................................................3‐33 TABLE 3‐7: DISTRIBUTION OF RENTER AND OWNER OCCUPIED HOUSING UNITS ...........................3‐34 TABLE 3‐8: DISTRIBUTION OF EMPLOYMENT BY CATEGORY ............................................................3‐34 TABLE 3‐9: EMPLOYMENT DENSITY...................................................................................................3‐35 TABLE 3‐10: ENVIRONMENTAL JUSTICE CHARACTERISTICS OF THE FOCUS AREA............................3‐36 TABLE 4‐1: RIDERSHIP AT SUBWAY STATIONS WITHIN THE STUDY AREA ........................................4‐40 TABLE 4‐2: RIDERSHIP ON BUS ROUTES THAT SERVE THE STUDY AREA...........................................4‐42

EXISTING CONDITIONS REPORT
iv
This page intentionally left blank.

BROOKLYN STREETCAR FEASIBILITY STUDY
1‐1
1.0 INTRODUCTION
1.1 PURPOSE OF THE STUDY
The New York City Department of Transportation (NYCDOT) is investigating the potential of a streetcar to, from, and within the Red Hook neighborhood of Brooklyn. The intent of the study is to determine the current and future transportation needs of the Red Hook neighborhood and identify whether a streetcar can effectively meet these needs. In addition, the study will analyze streetcar routings and will provide an initial assessment of potential streetcar alternatives, analyzing alignment, constructability, costs, and benefits. This study is a first step in developing solutions to transportation access needs for Red Hook and provides an opportunity to evaluate the potential for re‐introducing the streetcar mode in Brooklyn. It will be followed by more detailed analysis if solutions are determined feasible.
This Existing Conditions Report provides a context for assessing the transportation needs of Red Hook and evaluating streetcar as a potential transit solution. It describes the land use, demographic, and community characteristics of Red Hook and adjacent areas and provides an overview of the existing transportation options for Red Hook’s residents, workers, and visitors.
1.2 IDENTIFICATION OF FOCUS AREA AND STUDY AREA
To evaluate the potential transit needs of Red Hook as well as potential connections to existing transit services in the Borough of Brooklyn, a Focus Area and a Study Area were established. The Focus Area is defined specifically as the neighborhood of Red Hook. The Study Area is much larger and encompasses the transit hubs of Downtown Brooklyn and adjacent neighborhoods.
The Focus Area (Red Hook) is located in Community District 6 of the Borough of Brooklyn. It is bounded by the Buttermilk Channel to the west, Hamilton Avenue, the Brooklyn‐Queens Expressway, and the Brooklyn‐Battery Tunnel to the north, the Gowanus Canal to the east, and the Gowanus Bay to the south (see Figure 1‐1). The Study Area borders the Focus Area to the north and includes the blocks between the Buttermilk Channel and East River waterfront to the west and north and Hoyt Street, Ashland Place and 2nd Avenue to the east. The Study Area includes the neighborhoods of Carroll Gardens, Cobble Hill, Brooklyn Heights, Downtown Brooklyn, DUMBO, Vinegar Hill, Boerum Hill, and Gowanus.
1.3 METHODOLOGY
This report summarizes data from a number of sources, including geographic information system data, field surveys, the U.S. Census, and a literature review. The Downtown Brooklyn Surface Transit Circulation Study was also used to identify land use and demographics for a large portion of the Study Area.
Demographic, economic, and travel characteristics are presented both for the Focus Area and the Study Area. The Focus Area statistics are the composite of data for the U.S. Census block groups within Red Hook as defined by the boundary shown in Figure 1‐1. Statistics for the Study Area are comprised of all of the Census block groups within the Study Area boundary shown in Figure 1‐1, including the Focus Area. Therefore, the Focus Area statistics are a subset of the factors presented for the Study Area.

EXISTING CONDITIONS REPORT
1‐2
FIGURE 1‐1: STUDY AREA AND FOCUS AREA

BROOKLYN STREETCAR FEASIBILITY STUDY
2‐1
2.0 LAND USE AND COMMUNITY CHARACTER
2.1 DEVELOPMENT HISTORY
The City of Brooklyn was established in 1834. At this time, it comprised individual settlements along its waterfront, including Downtown Brooklyn, Brooklyn Heights, Cobble Hill, Boerum Hill, and the Navy Yard area, including Vinegar Hill. The City of Brooklyn annexed other sections of the present‐day borough at various points throughout the 1800s.
In 1893, the first electric streetcar ran in Brooklyn. The introduction of these streetcars and other rail modes would change the borough from a collection of small towns into the City’s most populous borough. Originally comprised of ten independent operating companies, many lines were incorporated into the Brooklyn Rapid Transit Company (BRT). The BRT was one of the largest streetcar operators in the United States. In its peak, it had 80 lines and 3,000 streetcars. The BRT would eventually take over the elevated lines that had developed in the 1880’s and the various steam railroads that ran to Coney Island. The BRT had the vision to implement fast and far reaching transit service in Brooklyn. The c mbined BR rail and streetcar system allowed the public to easily travel between Manhattan and the far reaches of Brooklyn. As service was instituted in new areas, empty lots along the lines rapidly became homes and shopping areas. Consequently, the population of the borough grew.
Several
STREETCAR AT SMITH AND SACKETT STREETS
o T
streetcar lines ran through Red Hook. The
prominent in the Brooklyn landscape. However, the
FOCUS AREA
has a long history of industrial and maritime uses, taking advantage of its location on
Furman Street, Erie Basin, and Crosstown Lines ran along Columbia Street. The Hamilton Avenue Line ran between Red Hook and Bay Ridge.
Prior to World War II, streetcars were
STREETCAR CROSSING THE GOWANUS CANAL
automobile became increasingly more available and popular, and in the 1940’s, the City began an aggressive initiative to replace streetcars with buses. Starting in 1949, Brooklyn’s streetcar lines were converted to new buses with the Borough’s last streetcar running in 1956. Remnants of the former system remain in parts of Brooklyn, including track and electrical poles.
The Focus Areathe Buttermilk Channel and its proximity to the population centers of Brooklyn and Manhattan. In the 1840’s, the Atlantic Dock Company developed piers in the Atlantic Basin and soon thereafter, William Beard developed the wharves at the Erie Basin. The Red Hook Peninsula then quickly became one of the busiest shipping ports in the United States. By the beginning of the Civil War,

EXISTING CONDITIONS REPORT
2‐2
ships from all over the world docked at Red Hook, and through the mid‐20th century, the neighborhood bustled with shipping and related industries, employing over 7,000 people.
Originally built for the families of dockworkers, the Red Hook Houses opened in 1939 and was the first public housing complex in the City. Red Hook Houses is now the largest New York City Housing Authority (NYCHA) development in Brooklyn. It consists of Red Hook (East) and Red Hook (West). The combined 39‐acre development includes 33 buildings, 30 residential buildings and three non‐residential buildings. The residential buildings range in height from two to 14 stories and have a total of over 2,800 apartments. Since their completion, the Red Hook Houses have comprised the largest portion of Red Hook’s residential population and occupy much of its interior blocks.
The development of Red Hook Houses occurred in concert with the construction of Red Hook Park.
des weakened substantially in Red Hook and New
In 1934, the City assigned former industrial sites that it owned to the New York City Department of Parks and Recreation (DPR). Other parcels that are now part of Red Hook Park came under DPR’s jurisdiction between 1935 and 1947. Gilmore D. Clarke, a prominent landscape designer, laid out its original development plan during the tenure of Robert Moses. Today, Red Hook Park occupies nearly 59 acres, and includes a recreation center, a pool, athletic facilities, a jogging path, and picnic areas.
Red Hook’s population peaked in about 1950. However, changes in the shipping industry, the construction of Interstate 278 (also referred to as the Brooklyn‐Queens Expressway and Gowonus Expressway in the Focus Area and Study Area) and Brooklyn‐Battery Tunnel, and the removal of its streetcar service would quickly deteriorate and isolate the community, resulting in a drastic decline in its residential and employment populations.
After 1950, the shipping and manufacturing traYork City in general. Overland transport of goods increasingly replaced maritime shipping and cargo companies began to favor alternative ports along the East Coast. Red Hook’s primary industry and population declined substantially as a result. However, in the 1960s, the Port Authority of New York and New Jersey opened a new container port—the Red Hook Marine Terminal—to provide a modern cargo facility that met new standards in marine commerce. Although helping to foster Red Hook’s traditional economic base, the facility required much less labor than previous facilities.
BROOKLYN MARINE TERMINAL BROOKLYN‐BATTERY TUNNEL ENTRANCE
BROOKLYN STREETCAR FEASIBILITY STUDY
2‐3
Interstate 278 and Brooklyn Battery Tunnel were built in the Focus Area following World War II. Interstate 278 is a major east‐west highway that runs from New Jersey to the Bronx via Staten Island, Brooklyn, and Queens. In the Focus Area, Interstate 278 runs along Red Hook’s eastern and northern edges. Entrances to the Brooklyn Battery Tunnel, which runs under the East River and connects Brooklyn and Manhattan, are situated at Red Hook’s northern edge. These transportation facilities quickly established de‐facto neighborhood borders for Red Hook and effectively cut it off physically and socially from adjacent neighborhoods.
Red Hook’s economic base and population continued to decline through the 1980s. Numerous residential, commercial, and industrial buildings were abandoned. By 1990, the population of Red Hook dropped to 10,500, a 50 percent decline from its 1950 population.
In 1994, Community Board 6 and local stakeholders developed a comprehensive strategic plan (197‐a Plan) to spur the revitalization of Red Hook’s population and economy with improvements to housing, social services, and business and industrial activities. In that same year, New York State Governor Mario Cuomo designated Red Hook and the nearby Sunset Park and Gowanus neighborhoods as the Southwest Brooklyn Economic Development Zone (now the Southwest Brooklyn Empire Zone). Combined, the 197‐a Plan and the economic incentives provided by the State have resulted in substantial reinvestment in the area. Projects have included the refurbishment and new construction of neighborhood parks, the opening of the Red Hook Community Justice Center, and the renovation of the Sullivan Street Hotel as affordable housing.
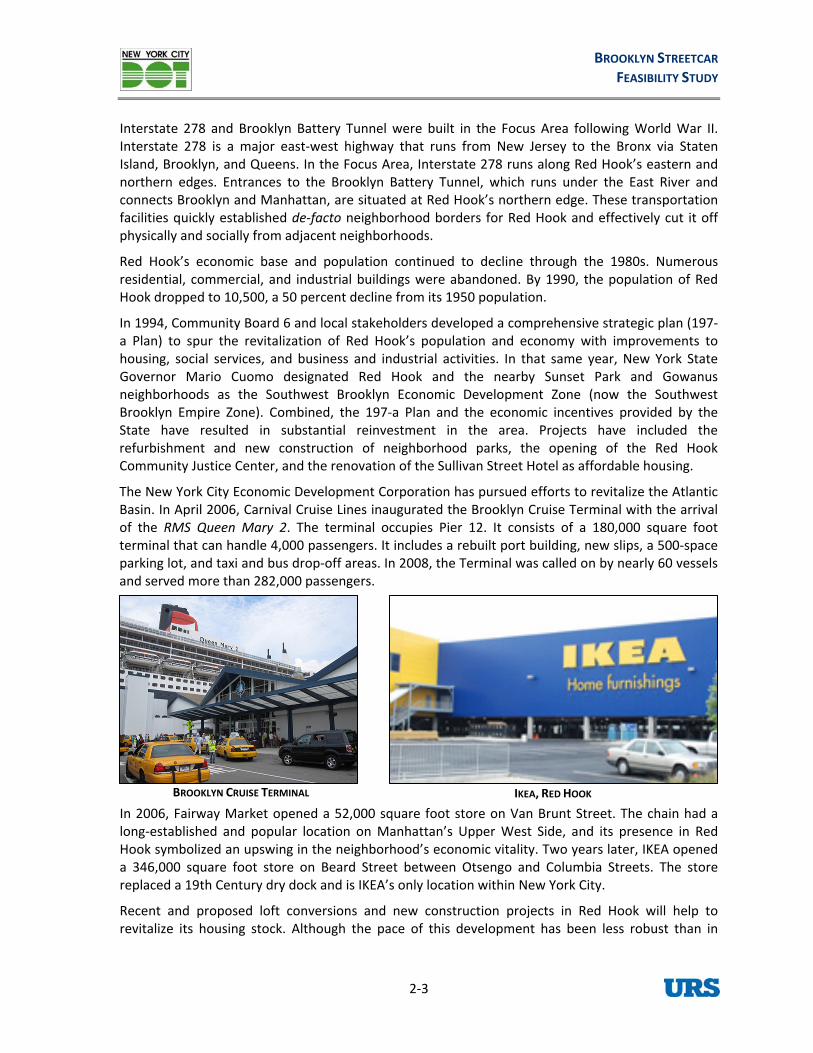
The New York City Economic Development Corporation has pursued efforts to revitalize the Atlantic Basin. In April 2006, Carnival Cruise Lines inaugurated the Brooklyn Cruise Terminal with the arrival of the RMS Queen Mary 2. The terminal occupies Pier 12. It consists of a 180,000 square foot terminal that can handle 4,000 passengers. It includes a rebuilt port building, new slips, a 500‐space parking lot, and taxi and bus drop‐off areas. In 2008, the Terminal was called on by nearly 60 vessels and served more than 282,000 passengers.
BROOKLYN CRUISE TERMINAL IKEA, RED HOOK
In 2006, Fairway Market opened a 52,000 square foot store on Van Brunt Street. The chain had a long‐established and popular location on Manhattan’s Upper West Side, and its presence in Red Hook symbolized an upswing in the neighborhood’s economic vitality. Two years later, IKEA opened a 346,000 square foot store on Beard Street between Otsengo and Columbia Streets. The store replaced a 19th Century dry dock and is IKEA’s only location within New York City.
Recent and proposed loft conversions and new construction projects in Red Hook will help to revitalize its housing stock. Although the pace of this development has been less robust than in

EXISTING CONDITIONS REPORT
2‐4
DUMBO, Williamsburg, and other historically, industrial areas of Brooklyn, these projects demonstrate a renewed interest in the area and its potential for growth.
STUDY AREA
The Brooklyn Bridge opened in 1883, bringing vehicular, trolley, and pedestrian traffic to Downtown Brooklyn and its surrounding neighborhoods. This triggered substantial growth in municipal, commercial, and residential land use in the downtown area and its surrounding commuter neighborhoods. In 1908, the Interborough Rapid Transit (IRT) subway line was extended from Manhattan to Brooklyn, with stations at Borough Hall, Hoyt Street, Nevins Street, and Atlantic Avenue. This accelerated development in the borough and generated a drive for larger and denser development in Downtown Brooklyn and surrounding areas. The rapid pace of development continued until the Great Depression.
Following World War II, the nation’s industries began moving out of inner cities, with negative consequences for manufacturing centers like Brooklyn. Middle‐class households also fled the inner cities, affecting most of the neighborhoods in the Study Area. As a result, many apartment buildings were abandoned, and many of the active industrial and commercial uses in the Study Area became low performance commercial uses (auto‐repair shops, gas stations, parking lots) or vacant lots. Several policies were enacted by New York City agencies including the New York City Department of Housing Preservation and Development (HPD) and the New York City Planning Commission (CPC) to counteract the deterioration of Brooklyn’s neighborhoods. These initiatives included the Atlantic Terminal Urban Renewal Area (ATURA) in 1968, the Schermerhorn‐Pacific Urban Renewal Area (SPURA) in Boerum Hill in 1974, and the Brooklyn Center Urban Renewal Plan (BCURP). In the 1970’s ATURA spurred the development of the Atlantic Terminal Houses, and the Atlantic Center Mall and SPURA sought to redevelop an area of Boerum Hill for affordable housing.
The City’s urban renewal efforts and a 1980s real estate boom fueled an economic revival for many communities in the Study Area, which continues today. The MetroTech Center was developed in 1986 as a result of the MetroTech Urban Renewal Plan (MURP). Currently, MetroTech is a sixteen‐acre corporate and academic complex with more than five million square feet of commercial and municipal office space in twelve buildings ranging in height from eight to thirty‐two stories. Other high‐rise office buildings have followed, and Downtown Brooklyn is now a major employment center in the City. Brownstones in Cobble Hill, Vinegar Hill, and Carroll Gardens were refurbished and many new retailers, restaurants, and bars opened on the commercials strips of these neighborhoods. The many industrial loft buildings in DUMBO were redeveloped as luxury housing. To preserve the historic character of the Study Area amidst this flurry of development, the City designated many areas as landmark districts. Much of Brooklyn Heights was designated as a Historic District (New York City’s first) in 1965, followed by sections of Cobble Hill (1969, expanded in 1988), Boerum Hill (1973), Carroll Gardens (1973), Vinegar Hill (1997), and DUMBO (2007).
METROTECH CENTER
New development continues to occur in the Study Area guided by new planning initiatives. Downtown Brooklyn has been the focus of City planning efforts including the establishment of the Special Downtown Brooklyn District (2001) and the Downtown Brooklyn Development project (2004). These initiatives seek to focus development in Downtown Brooklyn to strengthen business,

BROOKLYN STREETCAR FEASIBILITY STUDY
2‐5
preserve historic architectural resources, provide a buffer between large‐scale business uses of the Downtown core and surrounding low‐ to medium‐density residential neighborhoods, and to improve transit access through the area.
The area around Long Island Rail Road’s (LIRR) Atlantic Terminal is also rapidly redeveloping. In 2004, the Atlantic Terminal/Bank of New York Tower, which includes retail and office uses, opened above the LIRR Atlantic Terminal on the northeast corner of Flatbush and Atlantic Avenues. The areas across Flatbush and Atlantic Avenue from the LIRR Terminal and above the LIRR Atlantic Yards are in the process of a major redevelopment, including a basketball arena, high‐rise residential
buildings, office and retail uses, a school, and open space.
bandoned waterfront sites in the Study Area have also been the focus of recent public initiatives. he City and State are building Brooklyn Bridge Park, a multi‐use recreational facility that will occupy iers and upland parcels between Atlantic Avenue and the Brooklyn Bridge. The Brooklyn Navy Yard nd adjacent sites also continue to be developed with light industrial and commercial uses, including ovie studies, workshops, and small, niche industrial production companies.
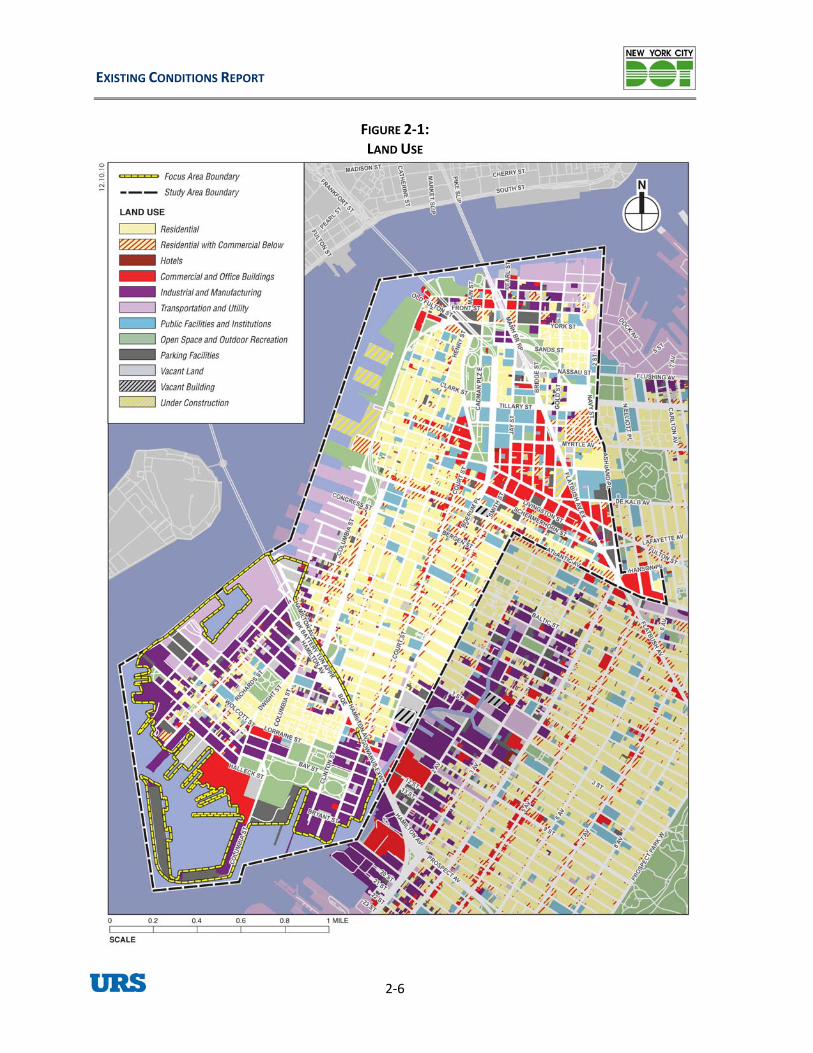
.2 LAND USE
ATLANTIC YARDS REDEVELOPMENT PLAN
ATpam
2
Figure 2‐2 shows land uses in the Focus Area and Study Area.
OCUS AREA
he Focus Area is defined primarily by industrial and manufacturing uses along the waterfront and sidential uses in its interior (see Figure 2‐2). Its primary commercial corridor is Van Brunt Street.
wo of the Port of New York and New Jersey’s important marine transportation facilities are located the Focus Area—the Red Hook klyn Cruise Terminal. Small‐scale
and manufacturing businesses (warehouses, auto body shops, glass manufacturers, and
F
Tre
Tinindustrial
Container Terminal and the Broo
food processors) are found in areas north of Verona Street, south of Coffey Street, and west of Van Brunt Street. These small‐scale uses are also peppered throughout the neighborhood, including streets that are predominately residential in use.
EXISTING CONDITIONS REPORT
2‐6
FIGURE 2‐1: LAND USE

BROOKLYN STREETCAR FEASIBILITY STUDY
2‐7
The most common residential building typ us are small‐to‐medium sized three‐to‐six story apartment buildings, particularly in the red by Van Brunt Street to the west, Verona Street to the north, Richards Street to the east, and Coffey Street to the south. High‐rise residential buildings, notably the Red Hook Houses, predominate east of Richards Street. The Red Hook Houses stretch from Richards Street to Clinton Street and 9th Street to Lorraine Street. Approximately 8,000 people live in the Red Hook Houses, comprising almost 80 percent of the Focus Area’s population.
es in the foc area borde
MIXED RESIDENTIAL AND INDUSTRIAL STREET IN RED HOOKRESIDENTIAL STREET IN RED HOOK
RED HOOK HOUSES

EXISTING CONDITIONS REPORT
2‐8
Commercial retail uses, catering to the local community, are found throughout the Focus Area. The largest concentration of such uses is along Van Brunt Street and are primarily housed on the ground floors of medium sized (three‐to six‐story) residential buildings. A handful of restaurants, bars, bakeries, check cashing stores, beauty salons, variety stores, small grocery stores, and delis can be found along the length of Van Brunt Street. Large retail uses in the Focus Area include IKEA at Richards and Beard Streets and the Fairway Supermarket at Van Brunt and Reed Streets.
The Focus Area has a number of institutional and public facilities. Educational facilities include P.S. 5, the South Brooklyn Community High School, and the Agnes Y. Humphrey School for Leadership. is also served by FDNY Engine Company 202, Ladder Company 101, a branch of the Brooklyn Public ibrary at 7 Wolcott Street, and a U.S. Post Office at 615 Clinton Street. The Red Hook Community stice Center, opened in 2000 and located at 88 Visitation Place, serves as a neighborhood court
The Focus Area also has various social service and religious institutions such as the South rooklyn Health Center, the Mercy Home for Children, and churches of various denominations.
he largest open space in the Focus Area is Red Hook Park. It is a 59‐acre public park, bordered by tsego, Bay, Hicks, Lorraine, Court, and Halleck Streets, and includes a pool, running track, and
recreation center. Other parks include Coffey Park, between King, Verona, Richards, and Dwight treets; and Louis Valentino, Jr. Park, on the waterfront at Coffey Street. The Red Hook Houses also rovide open space, including play areas and other amenities.
STUDY AREA
The Study Area is historically characterized by industrial uses along its waterfront, commercial uses in Downtown Brooklyn and along neighborhood thoroughfares, and residential uses in most other locations. Interstate 278, which sweeps through the western and northern portions of the Study Area, has divided the industrial waterfront from the upland residential and commercial areas since the 1960’s. However, recent redevelopment efforts have and will continue to transform the waterfront.
Just north of Red Hook is the Columbia Street Waterfront, located along the East River and Buttermilk Channel, west of Interstate 278 and south of Atlantic Avenue. This area contains a mix of residential and light industrial uses with working waterfront activities along its western edge. Vacant lots are scattered throughout this area, some of which are used for surface parking. The area is undergoing growth, with new restaurants, art galleries, and residential development. Columbia Street, the main thoroughfare in the neighborhood, contains local retail uses that are generally found on the ground floor of three‐ or four‐story residential buildings. The side streets are lined with rowhouses, with some new apartment conversions such as those centered along Tiffany Place. The waterfront includes the Red Hook Marine Terminal and Van Voorhees Park. Long Island College Hospital occupies a complex of buildings around Hicks and Amity Streets.
East and north of the Columbia Street Waterfront, the Carroll Gardens, Cobble Hill, Boerum Hill, and Brooklyn Heights neighborhoods are characterized by medium density residential (three‐ to six‐story) apartment buildings on local streets, with commercial activities concentrated along major corridors such as Smith Street, Court ontague Street. Along these corridors, commercial activities are primarily housed on the ground floors of medium sized residentiaapartment buildings, and comprise restaurants, delis, small grocery stores, and other businesses catering to the local community. In addition to the three‐ and four‐story rowhouses, there are also modern mid‐rise apartment buildings, including Clark Cadman Tower and Whitman Close
1ItLJuhouse.B
TO
Sp
Street, and Ml

BROOKLYN STREETCAR FEASIBILITY STUDY
2‐9
Townhouses, on the west side of Cadman Plaza West north of Tillary Street, and large NYCHA complexes adjacent to the industrial areas bordering the Gowanus Canal (Warren Street Houses, Gowanus Houses, and Wyckoff Gardens). A prominent destination in Brooklyn Heights is the Brooklyn Heights Promenade, a public open space at the western edge of the neighborhood situated on an elevated platform over Interstate 278. The promenade, which features a walkway, benches, and a small playground, extends from Orange Street south to Remsen Street. The piers and adjacent
and
er east, it supports higher density uses mixed with older mid‐rise buildings and newer
is also located on
waterfront areas west of Interstate 278 and north of Atlantic Avenue are being redeveloped as Brooklyn Bridge Park.
RESIDENTIAL STREET IN COBBLE HILL RENDERING OF BROOKLYN BRIDGE PARK
Atlantic Avenue is the main arterial dividing Cobble Hill and Boerum Hill and Brooklyn Heights Downtown Brooklyn. It is a two‐way, east‐west thoroughfare with two travel lanes in each direction, relatively heavy traffic, and parking typically along both sides of the street. Atlantic Avenue is designated a truck route by NYCDOT. Along Atlantic Avenue in the Cobble Hill and Brooklyn Heights sections, buildings are typically four‐ to eight‐story residential apartment buildings with ground‐level commercial uses, including restaurants, bars, antique stores, a supermarket, and smaller grocery stores. Furthfree‐standing commercial structures. The Brooklyn House of Detention, at Atlantic Avenue and Boerum Place, is a 750‐bed prison. It was closed since 2003, but is slated to reopen in 2011. The intersection of Atlantic Avenue, Fourth Avenue, and Flatbush Avenue brings together some of the highest volume arterials in Brooklyn. It is surrounded by big box retail uses including two malls, and is the northwest boundary of the Atlantic Yards redevelopment, which is currently underway.
Downtown Brooklyn is New York City’s third largest central business district (CBD) after Midtown and Downtown Manhattan, and it also serves as a government center. A large complex of City, State, and Federal institutions is located in buildings in and around Cadman Plaza, including the U.S. Federal Courthouse, Brooklyn Criminal Court, Brooklyn Family Court, the New York State Supreme Court, and the New York City Housing Court. The central post office for BrooklynCadman Plaza, between Johnson and Tillary Streets. MetroTech is a sixteen‐acre corporate and academic complex with more than five million square feet of office space in twelve buildings ranging in height from eight to thirty‐two stories. There are also several educational institutions in Downtown Brooklyn, including New York University’s Polytech campus, the New York City College of Technology, Long Island University’s Brooklyn campus, St. Francis College, Brooklyn Law School, and a number of public and private primary and secondary schools.
The largest retail area in Downtown Brooklyn is the Fulton Street Mall, which extends along Fulton Street between Adams Street and Flatbush Avenue. Fulton Street is restricted to bus and pedestrian
EXISTING CONDITIONS REPORT
2‐10
Brooklyn Bridge and Brooklyn Bridge Park, which is currently being developed.
2.3 FUTURE DEVELOPMENT PLANS
As shown in Table 2‐1, a number of development projects were recently completed or are planned in and near the Focus Area and Study Area. Figure 2‐2 shows the developments in the Focus Area.
FOCUS AREA
Within the Focus Area, there are seven recently‐completed or proposed projects. Three are small residential projects, generally resulting in three to five new units per building. One is a small industrial property, and another is a synagogue. The largest proposed development is at 160 Imlay
Flatbush Avenue is a major two‐way north‐south arterial running the entire length of Brooklyn and leading to the Manhattan Bridge in the Study Area. It has heavy traffic volumes and is characterized by large‐scale institutional and large national chain retail uses. Atlantic Terminal and the Atlantic Center Mall are located at Atlantic Avenue and Flatbush Avenue. Atlantic Terminal is a transportation hub with access to several New York City Transit subway lines and the LIRR.
The DUMBO neighborhood is characterized by large residential loft buildings converted from industrial uses, with ground‐floor commercial. Vinegar Hill is a smaller‐scale residential neighborhood with two‐ to three‐story apartment buildings and a waterfront dominated by the Hudson Avenue Generating Station, a Consolidated Edison power plant along almost the entire Vinegar Hill waterfront, from Gold Street to Jay Street.
There are several small parks scattered throughout the Study Area, and a handful of larger open spaces including Cadman Plaza, bordered by Cadman Plaza East and West, Tillary Street, an
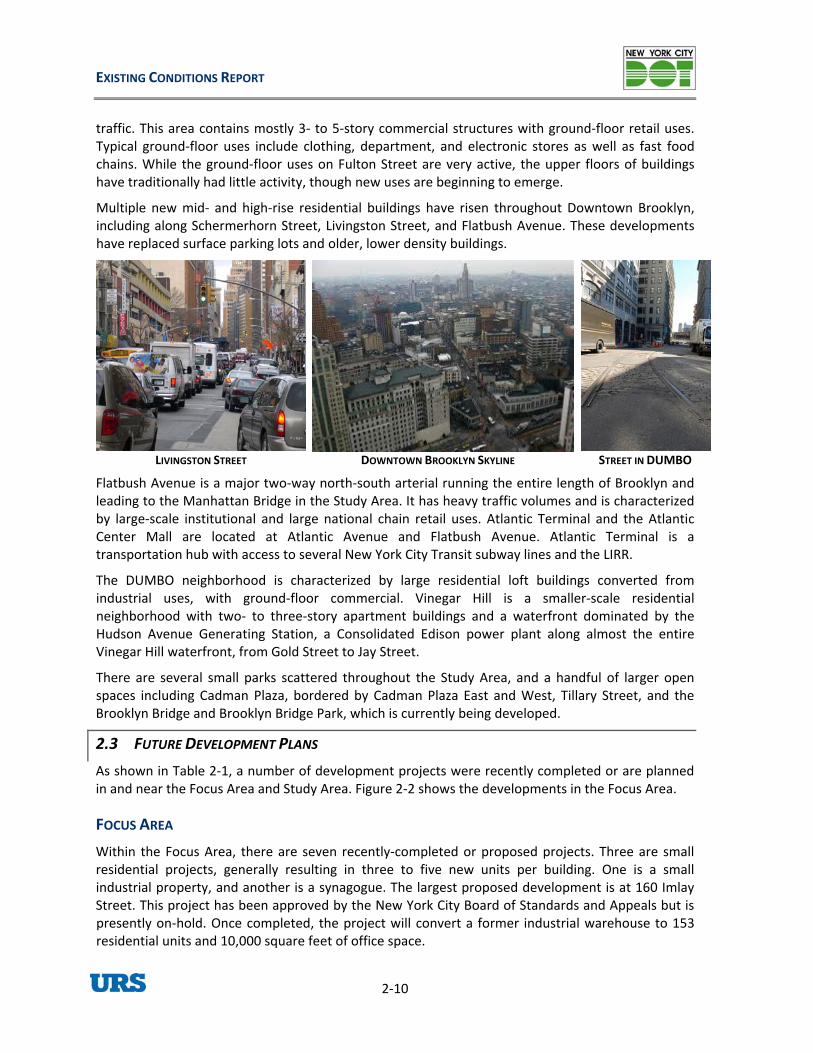
traffic. This area contains mostly 3‐ to 5‐story commercial structures with ground‐floor retail uses. Typical ground‐floor uses include clothing, department, and electronic stores as well as fast food chains. While the ground‐floor uses on Fulton Street are very active, the upper floors of buildings have traditionally had little activity, though new uses are beginning to emerge.
Multiple new mid‐ and high‐rise residential buildings have risen throughout Downtown Brooklyn, including along Schermerhorn Street, Livingston Street, and Flatbush Avenue. These developments have replaced surface parking lots and older, lower density buildings.
presently on‐hold. Once completed, the project will convert a former industrial warehouse to 153 residential units and 10,000 square feet of office space.
Street. This project has been approved by the New York City Board of Standards and Appeals but is
LIVINGSTON STREET STR T IN DUMBODOWNTOWN BROOK N SKYLINE EE LY
d the

BROOKLYN STREETCAR FEASIBILITY STUDY
2‐11
FIGURE 2‐2: LOPMENT PROJERECENTLY COMPLETED AND PLANNED DEVE CTS WITHIN AND NEAR THE FOCUS AREA

BROOKLYN STREETCAR FEASIBILITY STUDY
2‐12
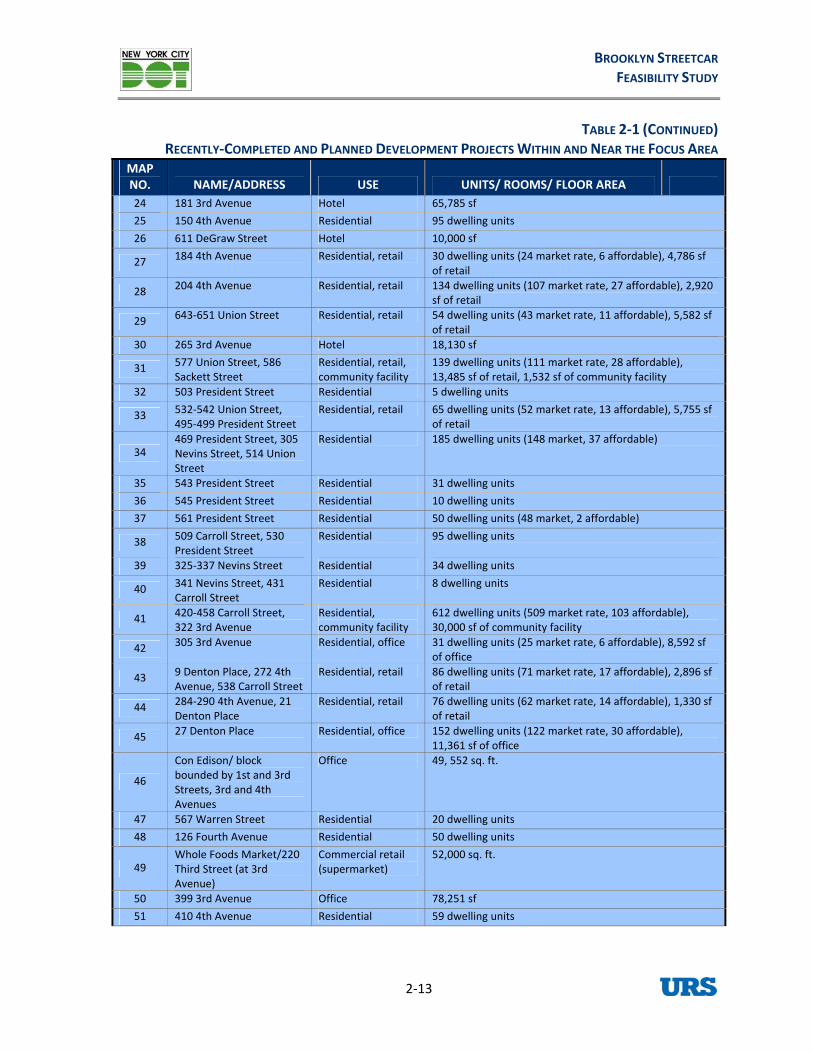
TABLE 2‐1:RECENTLY‐COMPLETED AND PLANNED DEVELOPMENT PROJECTS WITHIN AND NEAR THE FOCUS AREA
MAP NO. NAME/ADDRESS USE UNITS/ ROOMS/ FLOOR AREA
WITHIN FOCUS AREA
69 160 Imlay Street Residential, office, parking
153 units, 153 parking spaces, 9,000 sf office, 1 floor office conforming to existing zoning
70 162‐166 Beard Street Residential 4 dwelling units
71 440 Van Brunt Street Residential, Office 9,149 sf mixed‐use building with art studio on first floor, office on second floor, and one dwelling unit on third
72 216 Conover Street Industrial 6,000 sf 73 141 Dwight Street Synagogue 4,500 sf 74 96 Lorraine Street Residential 11,000 sf building with 8 dwelling units
75 25‐33 Carroll Street Residential Rezone M1‐1 to R6B to Construct an 8‐unit Residential Building
NEAR FO AREA CUS
1 436 4th Avenue Residential Information unknown; construction activity observed no records available at DOB
2 26 4th Street Residential 11 dwelling units
3 92 Third Street Hotel/Office 33,000 sf
4 517 Court Street Residential/Community Facility
6 dwelling units, ground‐floor retail, and diagnostic & treatment facility
5 245 Hamilton Avenue Residential 20 dwelling units
6 671 Henry Street Residential 5 dwelling units
7 103‐113 3rd Street Residential 45 dwelling units
8 141 3rd Street Residential, office 152 dwelling units (122 market rate, 30 affordable), 11,361 sf of office
9 363‐365 Bond Street Residential, retail,
community facility, open space
447 dwelling units (317 market rate, 130 affordable), 2,000 sf of community facility, 2,000 sf of retail, and a portion of the total 0.6‐acres of open space
10 360 Smith Street Residential 46 dwelling units
11 340‐346 Bond Street (at Carroll Street)
Residential 24 dwelling units
12 361 Carroll Street Residential 15 dwelling units
13 313‐325, 327‐333 Bond Street; 383 Carroll Street
Residential, retail 297 dwelling units (238 market rate, 59 affordable), 14,810 sf of retail
14 307 Bond Street Residential, retail 87 dwelling units (70 market rate, 17 affordable), 7,125 sf of retail
15 306 Bond Street Residential 11 dwelling units
16 290 Sackett Street Residential, retail, community facility
32 dwelling units
17 151 Carroll Street Residential 8 dwelling units
18 287 Bond Street, 498‐510 Sackett Street
Residential 148 dwelling units (118 market rate, 30 affordable)
19 285 Bond Street, 495 Sackett Street
Residential, retail 186 dwelling units (149 market, 37 affordable), 11,875 sf of retail
20 253‐261 Bond Street Residential 90 dwelling units (72 market, 18 affordable)
21 191 Douglass Street Residential 10 dwelling units
22 213 Bond Street Residential 21 dwelling units
23 462 Baltic Street Office 35,551 sf
BROOKLYN STREETCAR FEASIBILITY STUDY
2‐13
TABLE 2‐1 (CONTINUED)RECENTLY‐COMPLETED AND PLANNED DEVELOPMENT PROJECTS WITHIN AND NEAR THE FOCUS AREA
MAP NO. NAME/ADDRESS USE UNITS/ ROOMS/ FLOOR AREA 24 181 3rd Avenue Hotel 65,785 sf
25 150 4th Avenue Residential 95 dwelling units
26 611 DeGraw Street Hotel 10,000 sf
27 184 4th Avenue Residential, retail 30 dwelling units (24 market rate, 6 affordable), 4,786 sf of retail
28 204 4th Avenue Residential, retail 134 dwelling units (107 market rate, 27 affordable), 2,920 sf of retail
29 643‐651 Union Street Residential, retail 54 dwelling units (43 market rate, 11 affordable), 5,582 sf of retail
30 265 3rd Avenue Hotel 18,130 sf
31 577 Union Street, 586 Sackett Street
Residential, retail, community facility
139 dwelling units (111 market rate, 28 affordable), 13,485 sf of retail, 1,532 sf of community facility
32 503 President Street Residential 5 dwelling units
33 532‐542 Union Street, 495‐499 President Street
Residential, retail 65 dwelling units (52 market rate, 13 affordable), 5,755 sf of retail
34 469 President Street, 305 Nevins Street, 514 Union Street
Residential 185 dwelling units (148 market, 37 affordable)
35 543 President Street Residential 31 dwelling units
36 545 President Street Residential 10 dwelling units
37 561 President Street Residential 50 dwelling units (48 market, 2 affordable)
38 509 Carroll Street, 530 President Street
Residential 95 dwelling units
39 325‐337 Nevins Street Residential 34 dwelling units
40 341 Nevins Street, 431 Carroll Street
Residential 8 dwelling units
41 420‐458 Carroll Street, 322 3rd Avenue
Residential, community facility
612 dwelling units (509 market rate, 103 affordable), 30,000 sf of community facility
42 305 3rd Avenue Residential, office 31 dwelling units (25 market rate, 6 affordable), 8,592 sf of office
43 9 Denton Place, 272 4th Avenue, 538 Carroll Street
Residential, retail 86 dwelling units (71 market rate, 17 affordable), 2,896 sf of retail
44 284‐290 4th Avenue, 21 Denton Place
Residential, retail 76 dwelling units (62 market rate, 14 affordable), 1,330 sf of retail
45 27 Denton Place Residential, office 152 dwelling units (122 market rate, 30 affordable), 11,361 sf of office
46
Con Edison/ block bounded by 1st and 3rd Streets, 3rd and 4th Avenues
Office 49, 552 sq. ft.
47 567 Warren Street Residential 20 dwelling units
48 126 Fourth Avenue Residential 50 dwelling units
49 Whole Foods Market/220 Third Street (at 3rd Avenue)
Commercial retail (supermarket)
52,000 sq. ft.
50 399 3rd Avenue Office 78,251 sf
51 410 4th Avenue Residential 59 dwelling units
EXISTING CONDITIONS REPORT
2‐14
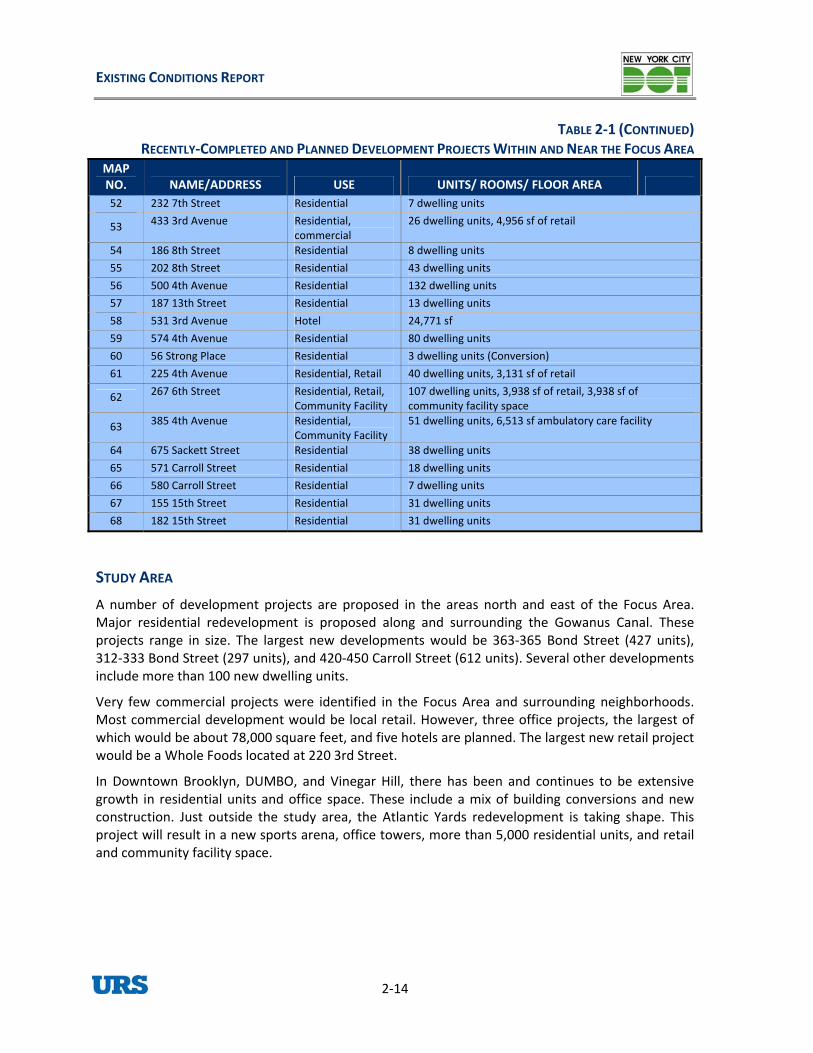
TABLE 2‐1 (CONTINUED)RECENTLY‐COMPLETED AND PLANNED DEVELOPMENT PROJECTS WITHIN AND NEAR THE FOCUS AREA
MAP NO. NAME/ADDRESS USE UNITS/ ROOMS/ FLOOR AREA 52 232 7th Street Residential 7 dwelling units
53 433 3rd Avenue Residential, commercial
26 dwelling units, 4,956 sf of retail
54 186 8th Street Residential 8 dwelling units
55 202 8th Street Residential 43 dwelling units
56 500 4th Avenue Residential 132 dwelling units
57 187 13th Street Residential 13 dwelling units
58 531 3rd Avenue Hotel 24,771 sf
59 574 4th Avenue Residential 80 dwelling units
60 56 Strong Place Residential 3 dwelling units (Conversion)
61 225 4th Avenue Residential, Retail 40 dwelling units, 3,131 sf of retail
62 267 6th Street Residential, Retail, Community Facility
107 dwelling units, 3,938 sf of retail, 3,938 sf of community facility space
63 385 4th Avenue Residential, Community Facility
51 dwelling units, 6,513 sf ambulatory care facility
64 675 Sackett Street Residential 38 dwelling units
65 571 Carroll Street Residential 18 dwelling units
66 580 Carroll Street Residential 7 dwelling units
67 155 15th Street Residential 31 dwelling units
68 182 15th Street Residential 31 dwelling units
STUDY A
A numbe projects in M r re men on projects The large me , 312 Bond Street (297 units), and 420‐450 Carrol (612 units). Several other developments include m el
Ve few s w th Most com velopment would be local reta ver, three office projects, the largest of which wo squ e h oject would be located 3rd Street.
In wn BO, and Vinegar Hill, there has been and continues to be extensive growth i and office space. These include a mix of building conversions and new co ruc the st the Atla velopment is taking shape. This project w sport ice tow 5,000 residential units, and retail and com
REA
r of development sidential redevelop
are proposedt is proposed al
the areas north and east of the Focus Area.g and surrounding the Gowanus Canal. Theseajo
range in size. st new develop nts would be 363‐365 Bond Street (427 units)l Street ‐333
ore than 100 new dw ling units.
ry commercial projectmercial de
ere identified in e Focus Area and surrounding neighborhoods.il. Howe
uld be about 78,000 are feet, and fiv otels are planned. The largest new retail pr a Whole Foods
town Brooklyn, DUMn residential units
at 220
Do
nst tion. Just outside udy area, ntic Yards redeill result in a new s arena, off ers, more than munity facility space.

BROOKLYN STREETCAR FEASIBILITY STUDY
2‐15
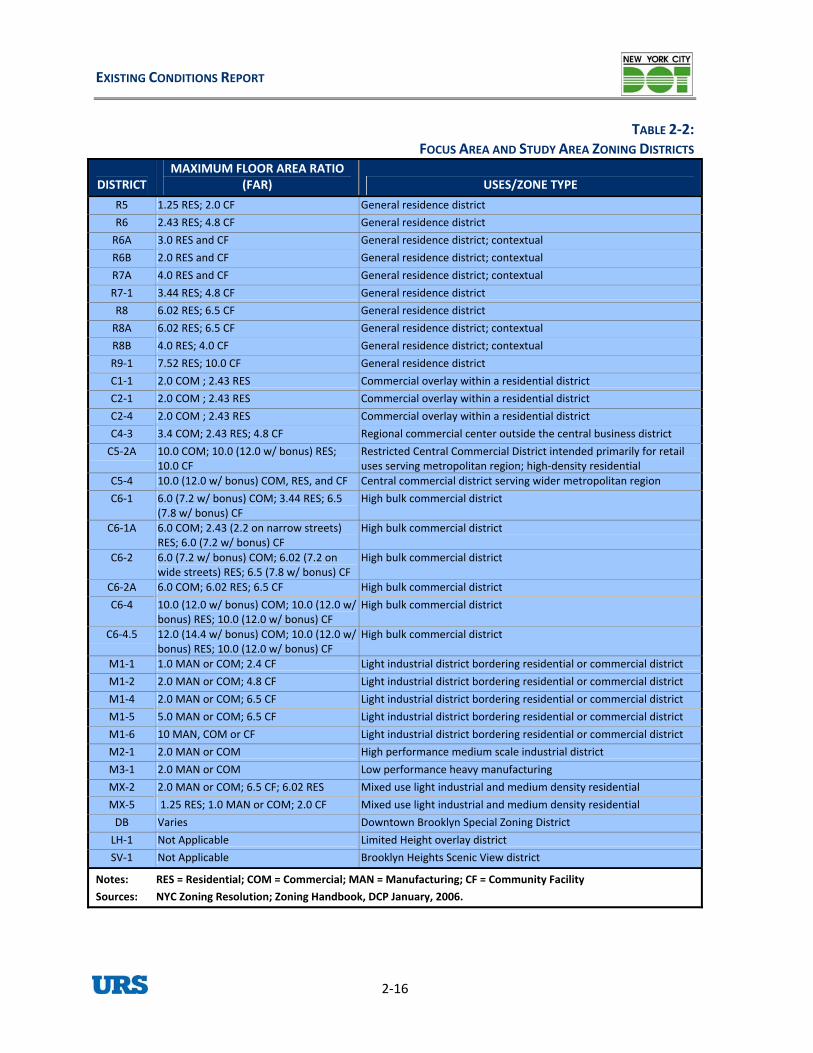
2.4 ZONING
Generally, transit acce al areas outside Downtow dium density, exce for near Avenue ts at other locations m density re also w us Area, however, is arily zoned for manufactu er density residential uses. Much of its zoning reflects th isto character o s Area. T n of this zoning policy and lack of ea acce pacity tran has likel comparatively lower growth in Re oo entifies th a and the Study Area. The New Yo the Foc d Study ed in Appendix A.
FOCUS A
The d Hook is generally and M3‐1 districts. The nort of Red Ho m acturing districts with high performanc t buffer between lower‐pe rma uring dist jacent ance standards are minimum require um allowable limits on noise, vibration, smoke, od and f indust 1‐1 dist clude warehouses, woodworking shops, a repair wholes storage facilities. M2‐1 districts al ma s that fa light an rial areas. Performance standards fo ese lower th in M1 d districts are intended for heavy in trie e noise, t ollutants power plants, solid waste ansfer facilities, recycling plants, and fuel supply depots.
ocks of the Focus Area are R5 and R6 zoning districts. R5 districts are medium density districts typified by three‐ to four‐story apartment buildings and rowhouses. R6
along portions of Hamilton Avenue. C1 districts are
d in 2002 in the area south of Coffey Street
l uses are not permitted in manufacturing districts and vice versa.
Downtown Brooklyn is zoned high density as it is a commercial center and has ampless. The residenti n Brooklyn are generally me
housing developmenpt new construction Atlantic and public. These mediu districts a
ring and lowell‐served by transit. The Foc
prime h ric industrial f the Focu he combinatiosy ss to high ca sit service y contributed tod H k. Table 2‐2 id e zoning districts in the Focus Arerk City zoning maps for us Area an Area are provid
REA
Re waterfront zoned as manufacturing with M1‐1, M2‐1,heast portion ok is also zoned
e standards thaanufacturing. M1‐1 districts are manuftypically serve as a
rfo nce manufact ricts and adments or maxim
commercial or residential districts. Perform
or, other effects o rial uses. M ricts typically inuto storage and shops, and ale service and
low nufacturing use ll between d heavy industr th districts are an those istricts. M3‐1 dus s that generat raffic, or p . Typical uses include
tr
The interior blgeneral residencedistricts are also medium density general residence districts. Apartment houses in R6 districts can range from low‐rise three‐story buildings to mid‐rise, eight‐ to 10‐story buildings.
Commercial zoning districts in the Focus Area include a C1‐1 overlay along Van Brunt Street, C1‐3 districts along two blocks of Lorraine Street, and a C1‐2 district on the south side of 9th Street. There are also small commercial zoning districtsgenerally local retail districts in residential neighborhoods and are often overlaid on residential zones to allow ground‐level retail. Typical uses in C1 districts include grocery stores, small dry cleaning establishments, restaurants, and barber shops.
An MX‐5 special use district (M1‐1/R5) was mappebetween Conover and Van Brunt Streets. Targeted for industrial areas, this district allows for the development of residential, commercial, community facilities, and light manufacturing/industrial by combining manufacturing zoning (M1) with residential zoning (R3‐R10). Commercial, residential, and light manufacturing uses can occupy the same lot side by side or use the same building. Under conventional zoning, residentia
EXISTING CONDITIONS REPORT
2‐16
TABLE 2‐2: FOCUS AREA AND STUDY AREA ZONING DISTRICTS
DISTRICT MAXIMUM FLOOR AREA RATIO
(FAR) USES/ZONE TYPE
R5 1.25 RES; 2.0 CF General residence district
R6 2.43 RES; 4.8 CF General residence district
R6A 3.0 RES and CF General residence district; contextual
R6B 2.0 RES and CF General residence district; contextual
R7A 4.0 RES and CF General residence district; contextual
R7‐1 3.44 RES; 4.8 CF General residence district
R8 6.02 RES; 6.5 CF General residence district
R8A 6.02 RES; 6.5 CF General residence district; contextual
R8B 4.0 RES; 4.0 CF General residence district; contextual
R9‐1 7.52 RES; 10.0 CF General residence district
C1‐1 2.0 COM ; 2.43 RES Commercial overlay within a residential district
C2‐1 2.0 COM ; 2.43 RES Commercial overlay within a residential district
C2‐4 2.0 COM ; 2.43 RES Commercial overlay within a residential district
C4‐3 3.4 COM; 2.43 RES; 4.8 CF Regional commercial center outside the central business district
C5‐2A 10.0 COM; 10.0 (12.0 w/ bonus) RES; 10.0 CF
Restricted Central Commercial District intended primarily for retail uses serving metropolitan region; high‐density residential
C5‐4 10.0 (12.0 w/ bonus) COM, RES, and CF Central commercial district serving wider metropolitan region
C6‐1 6.0 (7.2 w/ bonus) COM; 3.44 RES; 6.5 (7.8 w/ bonus) CF
High bulk commercial district
C6‐1A 6.0 COM; 2.43 (2.2 on narrow streets) RES; 6.0 (7.2 w/ bonus) CF
High bulk commercial district
C6‐2 6.0 (7.2 w/ bonus) COM; 6.02 (7.2 on wide streets) RES; 6.5 (7.8 w/ bonus) CF
High bulk commercial district
C6‐2A 6.0 COM; 6.02 RES; 6.5 CF High bulk commercial district
C6‐4 10.0 (12.0 w/ bonus) COM; 10.0 (12.0 w/bonus) RES; 10.0 (12.0 w/ bonus) CF
High bulk commercial district
C6‐4.5 12.0 (14.4 w/ bonus) COM; 10.0 (12.0 w/bonus) RES; 10.0 (12.0 w/ bonus) CF
High bulk commercial district
M1‐1 1.0 MAN or COM; 2.4 CF Light industrial district bordering residential or commercial district
M1‐2 2.0 MAN or COM; 4.8 CF Light industrial district bordering residential or commercial district
M1‐4 2.0 MAN or COM; 6.5 CF Light industrial district bordering residential or commercial district
M1‐5 5.0 MAN or COM; 6.5 CF Light industrial district bordering residential or commercial district
M1‐6 10 MAN, COM or CF Light industrial district bordering residential or commercial district
M2‐1 2.0 MAN or COM High performance medium scale industrial district
M3‐1 2.0 MAN or COM Low performance heavy manufacturing
MX‐2 2.0 MAN or COM; 6.5 CF; 6.02 RES Mixed use light industrial and medium density residential
MX‐5 1.25 RES; 1.0 MAN or COM; 2.0 CF Mixed use light industrial and medium density residential
DB Varies Downtown Brooklyn Special Zoning District
LH‐1 Not Applicable Limited Height overlay district
SV‐1 Not Applicable Brooklyn Heights Scenic View district
Notes: RES = Residential; COM = Commercial; MAN = Manufacturing; CF = Community Facility
NYC Zoning Resolution; Zoning Handbook, DCP January, 2006. Sources:
BROOKLYN STREETCAR FEASIBILITY STUDY
2‐17
STUDY AREA
Zoning districts in the Study Area include: R6, R6AC4 ‐2, C6‐2A, C6‐4, and districts; C1‐1, C2‐4 comm overlay districts; M1‐1, M1‐2, M2‐1, and M3‐1
ma actu MX‐2 mixed‐use ited height overlay districts. In addition, wntown Brooklyn f Brooklyn District (DB), an not umber of areas are d
Th ter on Hill and Carroll G (M1‐1) and residential (R 6B terior blocks have ntial zoning (R6, R6A, and R6B). Co erc ricts (C1‐1, C1‐4, C2 mbia, Smith, and Court Streets as we At There are also a sm g Smith Street near the boundary oll Gardens and Red
Al w klyn Heights is zon t is designated the SV‐1 Brooklyn Heights Sc t, which regulates oklyn Heights to th ter r of Brooklyn He residential R6 R7 rcial overlay dist reet and a C1‐5 overlay is provided the
DUMBO a gar Hill contain a mix of r cluding m m , wa on o dges. Other areas are generally residential e and commercial overlay zones peppered borhoods.
M f D nsity commercial districts. The a als n rict. Developments within this di ar gulations, ground floor retail requireme ween commercial and residential areas.
2.5 PUB
, R6B, R7A, R7‐1, R8A, and R9‐1 residential districts; C2‐1, and
‐3, C5‐2A, C5‐4, C6‐1, C6‐1A, C6ercial
C6‐4.5 commercial M1‐4, M1‐5,
nuf ring districts; district; and LH‐1 limportions of Do all within the Special Downtown
d as ed below, a n esignated historic districts.
e wa front of Clint ardens is zoned manufacturing6A, R , and R7A). In medium density residemm ial overlay dist ‐1, and C2‐4) line Colull as lantic Avenue. all number of M3‐1 zones alon
between Carr Hook.
ong its aterfront, Broo ed M2‐1. Its waterfronenic View Distric development in a view plane from Bro
e wa front. The interio ights west of Court Street is primarily zoned and . A C1‐3 comme rict lines several blocks of Montague St
along Henry Street near
nd Vine
Clark Street Subway Station.
esidential and manufacturing zoning districts, inultiple ixed‐use designations. Generally the manufacturing designations are along the East Riverterfr t and in the area between the Br oklyn and Manhattan Bri
districts (R6 and R7). There ar throughout these neigh
also commercial zones
ost o owntown Brooklyn is mapped wpecial Dow
ith medium and high‐derea is o designated as the S town Brooklyn (DB) Diststrict e required to conform to specia
nts, and zones of transition betl height and setback re
LIC POLICY
Th re initiativ . So oli are citywide . Th ow some of the l ci in ly to both the Fo
R O
In , th roved : A Plan fo m unit e area’s fut dev ent. The 197‐a Plan propo tial community and promote residential develop ic development, including op ni nts; preserve and ex improve services
ess and internal erfront access; promote Red Hook’s
ultural and historic resources; and rezone areas to promote development and maintain context.
ere a a number of public policy es that apply to the Focus Area and/or the Study Areame p cies, such as PlaNYC, initiatives while others are more localized undertakingse foll ing sections describe policies that are specific to the focus area and generatywide itiatives that app cus Area and the Study Area.
ED HO K 197‐A PLAN
1996 e New York City Council app a 197‐a Plan for Red Hook, Brooklyn. Red Hookr Com unity Regeneration is a comm y‐based plan that serves as a framework for thure elopm sed to: improve the existing residen
affordable ment; promote economportu ties for reside pand industrial and maritime activity;
to residents, including education and healthcare; improve transportation acccirculation for businesses and residents; improve public watc

EXISTING CONDITIONS REPORT
2‐18
While many plan initiatives would improve the ability to live and work in Red Hook and were widely
ess community felt that the
residential rezoning of industrial sites and the
Red Hook’s first full‐
MENT ZONE AND NYC INDUSTRIAL BUSINESS ZONE
ministered by the dustrial Development Corporation, a group of business owners, community
leaders, and elected officials formed in 1978 to bolster the local economy.
tment by the City to manufacturing use to
is also committed to providing technical and financial assistance to IBZs and making tax credits available to firms that relocate to IBZs.
d coastal zone. New York City and State have adopted policies aimed at protecting resources in the
supported, there were conflicting views on the introduction of new housing to the area. In particular, the business community objected to a wide‐scale, mixed‐use rezoning of the Red Hook and the introduction of residential uses at certain locations.
The 197‐a Plan recommended a change from industrial to mixed‐use zoning for many interior blocks of the Focus Area. While such zoning would allow for the continued operation of industrial uses, it would also provide for the as‐of‐right development of housing. The businintroduction of housing in these areas would not be appropriate and could impede their operations. The City Planning Commission agreed and narrowed the scope of the proposed mixed use zoning to a smaller number of blocks.
The 197‐a Plan reflected a commitment to increase the area’s population by providing for new affordable housing. The plan recommended the conversion of underused buildings. Although the 197‐a Plan acknowledged the retention of Red Hook’s maritime uses as one of its primary goals, the rezoning of industrial sites or publicly‐sponsored reoccupation of industrial buildings was considered by the business community to undermine the long‐time operation of industries in the area.
Some initiatives of the 197‐a Plan have been realized such as the opening ofservice bank branch in 1997, the refurbishment and new construction of neighborhood parks, the opening of the Red Hook Community Justice Center, and the renovation of the Sullivan Street Hotel as an affordable housing project. In 2006, the Fairway Market opened at 480‐500 Van Brunt Street in a former industrial building that was identified for new mixed‐use development in the 197‐a Plan.
SOUTHWEST BROOKLYN ECONOMIC DEVELOP
In 1994, New York State Governor Mario Cuomo designated Red Hook and the nearby Sunset Park and Gowanus neighborhoods as the Southwest Brooklyn Economic Development Zone (now the Southwest Brooklyn Empire Zone). This initiative was launched to provide tax credit incentives to spur business expansion and the creation of jobs. It is funded by the State and adSouthwest Brooklyn In
Most of the waterfront in the Focus Area also falls within the Southwest Brooklyn Industrial Business Zone (IBZ), which also includes the waterfronts of the adjacent neighborhoods of Gowanus and Sunset Park. An IBZ is defined as a manufacturing area that reflects the comminot implement zoning changes or variances that would allow a change fromresidential use. The Cityindustrial businesses within
Following implementation of the IBZ, a number of vacant waterfront sites were reoccupied. The Brooklyn Cruise Terminal and a large beverage distributor (Phoenix Beverage) are maritime and industrial uses that recently began operations within the Empire Zone and the IBZ.
LOCAL WATERFRONT REVITALIZATION PROGRAM
All of the Focus Area as well as DUMBO, Vinegar Hill, the Brooklyn Heights, Cobble Hill, and Carroll Gardens waterfront, and areas along the Gowanus Canal are within the City and State’s designate

BROOKLYN STREETCAR FEASIBILITY STUDY
2‐19
coastal zone. The City’s Waterfront Revitalization Program (WRP) contains 10 major policies focused on improving public access to the waterfront; reducing damage from flooding and other water‐related disasters; protecting water quality, sensitive habitats (such as wetlands), and the aquatic ecosystem; reusing abandoned waterfront structures; and promoting development with appropriate
tion advantages that make portions of the coastal zone especially
waterfront greenway have opened in the Study Area: between Old Fulton Street and Atlantic ic
terminal) designed to relax, and shop. In TOD
Bicycle Network Project ND), a joint of City Planning, Department of Parks and
The BND goals are to implement and
land uses. The principles of the WRP formed the basis for a New York City Department of City Planning study and the resulting adoption of new waterfront zoning. The New York City Planning Commission certifies whether a proposed action is in compliance with the city’s WRP. The New York State Department of State has this responsibility on the state level.
The Red Hook waterfront is designated a Significant Maritime and Industrial Area. These working waterfront areas have locavaluable as industrial areas. Public investment within the Significant Maritime and Industrial Area is intended to improve transportation access and maritime and industrial operations. The designation of Red Hook as a Significant Maritime and Industrial Area reflects the City’s commitment to maintain its maritime history and discourage the replacement of water‐dependent industry with high‐rise housing, office space, and other such uses.
BROOKLYN WATERFRONT GREENWAY MASTER PLAN
NYCDOT is developing a master plan to focus the implementation of the Brooklyn Waterfront Greenway, a 14‐mile, waterfront bicycle and pedestrian path, stretching from Sunset Park to Greenpoint. The goal of the project is to open underutilized stretches of the Brooklyn waterfront to recreation, and to provide a safe and attractive space for walking and cycling. Portions of the
Avenue within the newly‐constructed Brooklyn Bridge Park, and along Columbia Street from AtlantAvenue to DeGraw Street, just outside of the Focus Area. NYCDOT is currently evaluating options forthe Greenway’s alignment through the Focus Area.
TRANSIT‐ORIENTED DEVELOPMENT
Transit‐oriented development (TOD) is characterized by a high‐density mix of residential and commercial uses anchored by a transit center (typically a rail station orincrease mass transit use and provide places for people to live, work, communities, concentrated development is generally located within ¼ to ½ miles‐walking distance‐of a transit station, with the density of development decreasing outwards from the transit center. The New York City Zoning Resolution reflects the City’s policy of encouraging high density development in areas with significant mass transit access, with the goal of promoting the opportunity for people to work in the vicinity of their residences. Within the Study Area, the 2009 DUMBO rezoning furthers the City’s TOD goal.
NEW YORK CITY BICYCLE MASTER PLAN
The New York City Bicycle Master Plan was produced in the first phase of the Development (B DepartmentRecreation, and Department of Transportation project.maintain the city’s on‐ and off‐street bicycle network, to improve cycling safety, to improve bicycle access on bridges and mass transit, and to encourage cycling in public and private organizations. The

EXISTING CONDITIONS REPORT
2‐20
Bicycle Master Plan identifies portions of Clinton, Henry, Bergen, and Dean Streets in the Study Area as “priority routes” for improving and expanding the city’s on‐street network of cycling amenities.
PLANYC
In 2007, the Mayor’s Office of Long Term Planning and Sustainability released PlaNYC: A Greener, Greater New York. PlaNYC represents a comprehensive and integrated approach to planning for New York City’s future. It includes policies to address three key challenges that the City faces over the next 20 years: (1) population growth; (2) aging infrastructure; and (3) global climate change.
re identified for the Focus Area in the Mayor’s Office of Strategic Planning 2010 PlaNYC progress report.
fice of Long‐Term Planning and Sustainability,
Elements of the plan are organized into six categories—land, water, transportation, energy, air quality, and climate change—with corresponding goals and initiatives. Some of the general PlaNYC policy initiatives have been or are in the process of being implemented throughout the city, including both the Focus Area and the Study Area. PlaNYC developments specific to the study area include: a new public plaza opened in DUMBO in 2007; and the implementation or enhancement of bicycle lanes in Cobble Hill, Boerum Hill, Downtown Brooklyn, and along the Columbia Street waterfront. No specific PlaNYC initiatives we
Local Law 17 of 2008 established the New York City Ofand the requirement for this office to develop and implement a comprehensive long‐term sustainability plan. Local Law 17 of 2008 requires the sustainability plan to be updated by April 2011 and every four years thereafter. PlaNYC is the City’s long‐term sustainability plan until such time as it is updated by the Office of Long‐Term Planning and Sustainability.
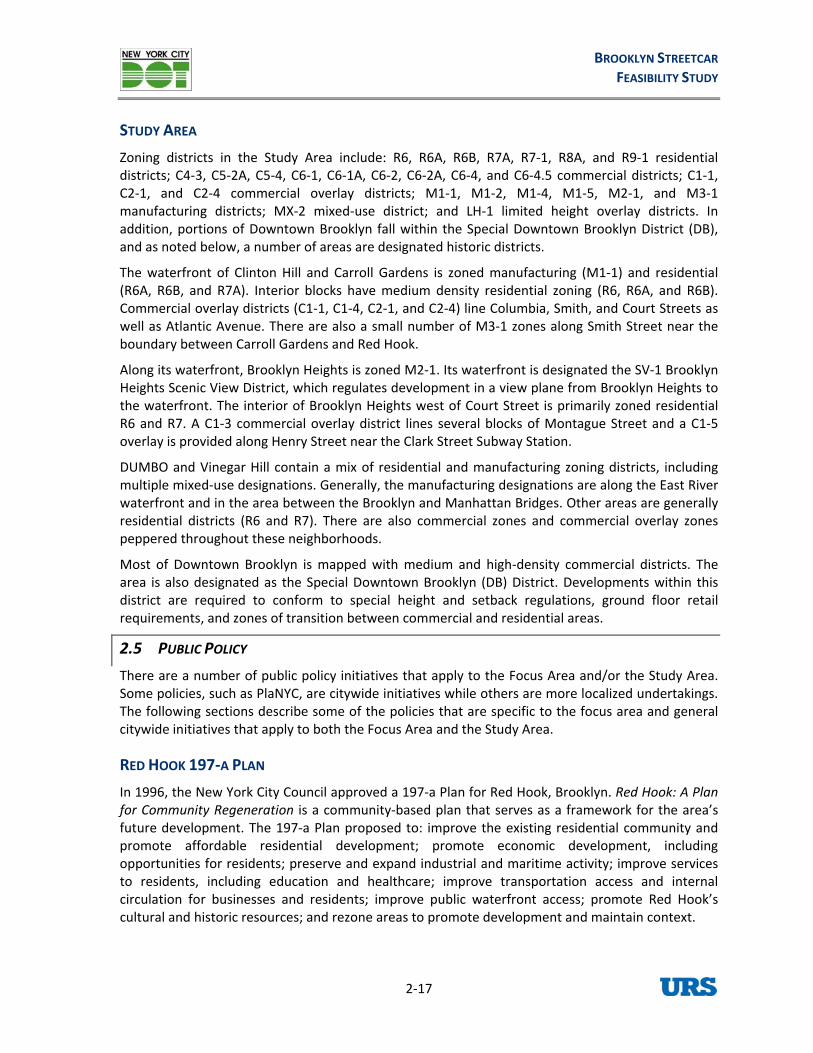
2.6 HISTORIC RESOURCES
The Study Area contains a number of historic districts (see Table 2‐3) and landmarked buildings and structures (see Table 2‐4 and Figures 2‐4 and 2‐5).
TABLE 2‐3:HISTORIC DISTRICTS
NAME NHL LPC S/NRS/NR‐
ELIGIBLE NYCL‐
ELIGIBLE
Admirals Row Historic District X
Boerum Hill Historic District X X
Brooklyn Heights Historic District X X X
Brooklyn Navy Yard Historic District X
Carroll Gardens Historic District X X
Carroll Gardens Historic District Extension X X
Cobble Hill Historic District and Extension X X
DUMBO Historic District X X
Fulton Ferry Historic District X X
Gowanus Canal Historic District X
Vinegar Hill Historic District X
Notes: NHL = National Historic Landmark; LPC = New York City Landmark or Historic District; S/NR = State and National Register of Historic Places; NYCL = New York City Landmark

BROOKLYN STREETCAR FEASIBILITY STUDY
2‐21
TABLE 2‐4:HISTORIC BUILDINGS AND STRUCTURES
MAP NO. NAME ADDRESS NHL LPC S/NR
S/NR‐ELIGIBLE
NYCL‐ELIGIBLE
FOCUS AREA 58 Pier 41 Van Dyke Street and Ferris
Street X
59 Red Hook Stores 480‐500 Van Brundt Street X
60 Beard Stores 421‐573 Van Brundt Street X
61 99‐113 Van Dyke Street X X
62 Brooklyn Clay Retort and Fire Brick Works Storehouse
76‐86 Van Dyke Street X X
63 106‐110 Beard Street X X
64 Erie Basin Bulkhead Surrounding Richards Street south of Beard Street
X
65 Former Revere Sugar Refinery Richards Street south of Beard Street
X
66 Graving Dock No. 1 Erie Basin southwest of Beard Street (Ikea site)
X
67 Gantry Crane Erie Basin southwest of Beard Street (Ikea site)
X
68 Port Authority Grain Terminal Henry Street Basin, south of Halleck Street
X
69 Red Hook Play Center and Pool 155 Bay Street X X
70 IND 9th and 10th Street Subway Viaduct
Along 9th and 10th Streets between Smith Street and Fifth Avenue
X
STUDY AREA 1 Brooklyn Bridge X X X
2 Manhattan Bridge X
3 Brooklyn City Railroad Company 8 Cadman Plaza West X X
4 Thomson Meter Compa g ny Buildin 100‐110 Bridge Street X X
5 Commandant's House, Brooklyn Navy Yard
Evans Street at Little Street X
6 Plymouth Church of the Pilgrims 75 Hicks Street X X
7 Brooklyn Historical Society 128 Pierrepont Street X
8 St. Ann and the Holy Trinity Church
157 Montague Street X X
9 Brooklyn Trust Company Building 177‐179 Montague Street X X
10 United States Post Office and Court House, Brooklyn Central Office
271‐301 Cadman Plaza East X X
11 Former Public School 5 122 Tillary Street X
12 Joseph J. Jacobs Building, Polytechnic University
305‐315 Jay Street X
13 First Free Congregational Church 311 Bridge Street X X
14 Lefferts‐Laidlaw House 136 Clinton Street X
15 IRT Borough Hall Subway Station Junction of Joralemon, Court, and Adams Streets
X X

EXISTING CONDITIONS REPORT
2‐22
TABLE 2‐4 (CONTINUED)HISTORIC BUILDINGS AND STRUCTURES
MAP NO. NAME ADDRESS NHL LPC S/NR
S/NR‐ELIGIBLE
NYCL‐ELIGIBLE
16 Brooklyn City Hall (aka Brooklyn Borough Hall)
209 Joralemon Street X X
17 345 Adams Street X X
18 Brooklyn Friends School 375 Pearl Street X
19 Brooklyn Fire Headquarters 365‐367 Jay Street X X
20 New York and New Jersey Telephone and Telegraph Building
81 Willoughby Street X X
21 Duffield Street Houses 182‐188 Duffield Street X
22 Long Island Headquarters of the New York Telephone Company
97‐105 Willoughby Street X X
23 St. Boniface Church 111 Willoughby Street X
24 423 Fulton Street X
25 Atlantic Avenue Tunnel Atlantic Avenue between Boerum Place and Columbia Street
X
26 Former Board of Education Headquarters
110 Livingston Street X X
27 Gage & Tollner Restaurant 372 Fulton Street X X
28 376 Fulton Street X X
29 Board of Education Building 131 Livingston Street X X
30 Former America Fore Building 141 Livingston Street X X
31 386‐388 Fulton Street X
32 Former Abraham & Strauss Buildings
418‐430 Fulton Street and 15‐29 Gallatin Place
X X
33 495 Fulton Street X
34 233 Duffield Street X X
35 Offerman Building 503‐513 Fulton Street X X
36 446 Fulton Street X
37 A.I. Namm & Son Department Store
450‐458 Fulton Street X
38 Dime Savings Bank 9 DeKalb Avenue X
39 Friends Meeting House and School 110 Schermerhorn Street X X
40 Brooklyn Central Courthouse 120 Schermerhorn Street X X
41 State Street Houses 291‐299, 290‐324 State Street
X X
42 Former Loesser's Department Store
25 Elm Place X
43 565‐571 Fulton Street X
44 308‐310 Livingston Street X X
45 Pioneer Warehouses 37‐53 and 74‐92 Rockwell Place
X X
46 Baptist Temple 360 Schermerhorn Street X
47 Former Public School 15 372 Schermerhorn Street X
48 522‐550 State Street X

BROOKLYN STREETCAR FEASIBILITY STUDY
2‐23
TABLE 2‐4 (CONTINUED)HISTORIC BUILDINGS AND STRUCTURES
MAP NO. NAME ADDRESS NHL LPC S/NR
S/NR‐ELIGIBLE
NYCL‐ELIGIBLE
49 IRT/BMT Atlantic Avenue Subway Station
Intersection of Atlantic, Flatbush, and 4th Avenues
X
50 Atlantic Avenue Control House Intersection of Atlantic and Flatbush Avenues
X
51 Wyckoff Street Rowblocks 74‐132 and 196‐258 Wyckoff Street
X X
52 Cobble Hill High School 347 Baltic Street X
53 Brooklyn Public Library, Carroll Gardens Branch
396 Clinton Street X
54 Brooklyn Union Gas Company Building
180 Union Street X
55 John Rankin House 440 Clinton Street X X
56 St. Paul's Protestant Episcopal Church
199 Carroll Street X
57 South Congregational Church Complex
358‐366 Court Street, 253‐269 President Street
X X
Notes: c Land k City Landmark r Historic Distric S/NR = Sta and Pla York City Lan mark
NHL = National HistoriNational Re
mark; LPC = New Yor o t; tegister of Historic ces; NYCL = New d
Large Area istric , incl ding m of Brooklyn H an The Brooklyn Heights Historic Distric the Brooklyn Bridge, Plymouth Church St. and the Holy Trinity Churc are N n s, wh est level of protection under Federal preser ws.
S a individual buildings are lis r listing n the nd National Register of H r nated or as ew York Cit Landmarks. In the cus Area, ere is a cluster of such st the waterfront betwee Van Brunt and Dwight S t e a in Brooklyn, particularly along eet and Fulton Street.
sections of the Study are designated historic d ts u ucheights, DUMBO, Vinegar Hill, d Carroll Gardens. t,
of the Pilgrims, and Ann h atio al Historic Landmark
vation laich receive the high
ever l ted or eligible fo o State aisto ic Places or are desig eligible for designation N y Fo
th ructures along ntree s. In the Study Area, ther
Jay Strre several historic structures Downtown
EXISTING CONDITIONS REPORT
2‐24
FIGURE 2‐3: HISTORIC DISTRICTS, BUILDINGS AND STRUCTURES (NORTHERN HALF OF STUDY AREA)

BROOKLYN STREETCAR FEASIBILITY STUDY
2‐25
FIGURE 2‐4: IC DISTRICTS, BUILDINGS, AND STRUCTURES (SOUTHERN HALF OF STUDY AREA / FOCUS HISTOR AREA)

EXISTING CONDITIONS REPORT
2‐26
2.7 CONCLUSION
The Depression. In the early portion of the period, development was fueled by maritime activities and industrial uses. As transportation, particularly subway and streetcar service, improved access to, from, and within these areas, there was rapid residential and commercial development. Downtown Brooklyn became a hub of municipal and retail uses in the borough, and many of its surrounding neighborhoods became the bedroom communities of its workers.
Following World War II, economic decline in the City’s industrial sector devastated the employment bases of Red Hook and other waterfront districts of Brooklyn. At the same time, many middle‐class residents fled inner city neighborhoods, resulting in the deterioration and abandonment of the housing stock and subsequent decline in support services.
In the 1980’s, portions of the Study Area began to turnaround. A real estate boom resulted in the construction of new high‐rise buildings in Downtown Brooklyn, and its surrounding neighborhoods were reoccupied by residents. Through the 1990’s this trend extended to DUMBO, where former warehouse and industrial buildings were converted to residential use, and in the first part of this decade new investment has extended to other waterfront areas.
In the Focus Area, the pace of new investment has been less robust than elsewhere in the study area, but the recent development of the Atlantic Basin and large‐scale retail uses indicate a renewed interest in the area. These large projects have been complemented by smaller residential conversions and a growing artist community. However, Red Hook remains isolated from surrounding areas and suffers from poor access to the borough’s transit infrastructure.
Focus Area and Study Area developed rapidly between the mid 1800’s and the Great

BROOKLYN STREETCAR FEASIBILITY STUDY
3‐27
3.0 SOCIAL AND ECONOMIC CHARACTERISTICS
3.1 DEMOGRAPHICS
This section describes the demographic profile of the combined Focus Area and Study Area.1 When appropriate, local statistics are compared to Brooklyn as a whole.
POPULATION
In 1990, the U.S. Bureau of the Census estimated that 10,846 residents lived in Red Hook. By 2000, the population decreased by approximately six percent to 10,215 residents. The Focus Area population has increased since 2000, and today is estimated at 10,695 people. In comparison, the overall Study Area’s population has steadily increased in the past 20 years. In 1990, approximately
SIDENTIAL POPULATION (1990‐2010)
79,973 residents lived within the area. By 2000, the population increased by approximately eight percent to 86,602 residents. The Study Area population has continued to increase and today is estimated at 93,457 people (see Table 3‐1).
TABLE 3‐1:RE
TOTAL POPULATION PERCENT CHANGE LOCATION 1990 2000 2010 1990‐2000 2000‐2010
Focus Area 10,846 10,215 10,695 ‐5.8% 4.7%
Study Area 79,973 86,602 93,457 8.3% 7.9%
Sources: 1990 and 2000 data from U.S. Bureau of the Census; 2010 estimates from ESRI.
DENSITY
Figure 3‐1 shows the geographic distribution of the Focus Area and Study Area residential population density and employment density (discussed in detail later), based on 2000 data from the U.S. Bureau of the Census. As shown, residents are more closely concentrated on interior blocks with fewer people along the waterfront. However, recently‐completed development and proposed development in DUMBO, Vinegar Hill, and the Columbia Street Waterfront will increase the population density of those waterfront neighborhoods.
1 This census profile is based on the 10 block groups that correspond most closely to Red Hook’s boundaries, and the 95 block groups
that correspond most closely to the Study Area’s boundaries. The Study Area is comprised of the following Brooklyn (Kings County) block groups: Census Tract 1, Block Groups 1, 2 and 3; Census Tract 3.01, Block Groups 1, 2, 3, 4 and 5; Census Tract 3.02, Block Group 1; Census Tract 5, Block Groups 1, 2, 3, 4 and 5; Census Tract 7, Block Groups 1, 2 and 3; Census Tract 9, Block Groups 1 and 2; Census Tract 11, Block Group 1; Census Tract 13, Block Groups 1 and 2; Census Tract 21, Block Groups 1, 2, 3 and 4; Census Tract 23, Block Group 1; Census Tract 25, Block Groups 1 and 2; Census Tract 27, Block Groups 1 and 2; Census Tract 31, Block Groups 2 and 3; Census Tract 33, Block Group 2; Census Tract 35, Block Groups 1 and 2; Census Tract 37, Block Groups 1 and 2; Census Tract 39, Block Groups 1 and 2; Census Tract 41, Block Groups 1 and 4; Census Tract 43, Block Groups 1, 2, 3 and 4; Census Tract 45, Block Groups 2, 3 and 4; Census Tract 47, Block Groups 1 and 2; Census Tract 49, Block Groups 1, 2 and 3; Census Tract 51, Block Groups 1, 2 and 3; Census Tract 55, Block Groups 1 and 2; Census Tract 57, Block Groups 1, 2, 3, and 4; Census Tract 59, Block Groups 1, 2 and 3; Census Tract 63, Block Groups 1 and 2; Census Tract 65, Block Groups 1, 2, 3, 4, 5, 6 and 7; Census Tract 67, Block Groups 1, 2, 3, 4 and 5; Census Tract 69, Block Groups 1, 2, 3 and 4; Census Tract 75, Block Groups 2, 3, 4, and 5; Census Tract 77, Block Groups 1, 2, 3 and 4; and Census Tract 85, Block Group 1. Red Hook is comprised of the following block groups: Census Tract 55, Block Groups 1 and 2; Census Tract 57, Block Groups 1, 2, 3, and 4; Census Tract 59, Block Groups 1, 2 and 3; and Census Tract 85, Block Group 1.

EXISTING CONDITIONS REPORT
3‐28
FIGURE 3‐1: POPULATION AND EMPLOYMENT DENSITY

BROOKLYN STREETCAR FEASIBILITY STUDY
3‐29
The Focus Area is approximately 0.87 squar pulation density is estimated at 12,323.56 persons per square mile. The o square miles. In comparison to the Focus Area, the Study Area is more dense and is estimated at 31,880.37 persons per square mile (see Table 3‐2).
TABLE 3‐2:POPULATION DENSITY
e miles. Its poverall Study Area is approximately 2.93
PERSONS PER SQUARE MILE PERCENT CHANGE LOCATION 1990 2000 2010 1990‐2000 2000‐2010
Focus Area 12,497.55 11,770.47 12,323.56 ‐5.8% 4.7%
Study Area 27,280.67 29,541.97 31,880.37 8.3% 7.9%
Sources: 1990 and 2000 data from U.S. Bureau of the Census; 2010 estimates from ESRI.
AGE
As shown in Table 3‐3, the majority of residents in the Focus Area are working age (20 to 64 years old), and approximately 30 percent are school aged (5 to 19 years old). About nine percent are under five years old and about nine percent are over 65 years old. In the Study Area, the percentage of working aged persons is much higher (nearly 71 percent) than in the Focus Area. The percentage of senior citizens is also higher (nearly 12 percent), but the percentage of children is lower (5.5 percent under five years and 12.2 percent school‐aged).
TABLE 3‐3:AGE DISTRIBUTION
FOCUS AREA STUDY AREA AGE COHORT 1990 2000 2010 1990 2000 2010
Under 5 Years 10.4% 8.5% 9.1% 5.7% 5.4% 5.5%
5 Years to 19 Years (School Aged) 28.4% 29.7% 25.1% 14.2% 13.7% 12.2%
20 Years to 64 Years (Working Aged) 53.1% 53.4% 57.0% 68.8% 70.3% 70.7%
Over 65 Years 8.1% 8.4% 8.8% 11.3% 10.6% 11.6%
Median Age 26.5 28.1 28.5 32.0 34.8 36.3
Sources: U.S Census, ESRI
ETHNICITY
As shown in Figure 3‐2, Red Hook is a racially diverse community. The Latino population is the largest ethnic group within the Focus Area, representing approximately 47 percent of the population. African Americans represent 42 percent of the Focus Area’s population. Whites represent eight percent of the Focus Area population, and Asians represent one percent. About two percent of the population identified themselves as two or more races.
In the Study Area, the largest percentage of the population is White (53 percent). African American and Latino each represent 19 percent of the population. About five percent of the population identified themselves as Asian; three percent identified themselves as two or more races, and 0.5 percent identified themselves as some other race (see Figure 3‐3).

EXISTING CONDITIONS REPORT
3‐30
FIGURE 3‐2: RACIAL COMPOSITION OF THE FOCUS AREA
OSITI THE S REA
FIGURE 3‐3: RACIAL COMP ON OF TUDY A

BROOKLYN STREETCAR FEASIBILITY STUDY
3‐31
EDUCATIONAL ATTAINMENT
the highest l residents based on 2000 . Over half of the Focus Area’s adult populations have completed a high school
educ ion. Approximately 10 percent of residents have completed an undergraduate degree rogram, and nearly three percent have completed a master’s or professional degree program.
49 percent of adult residents have not completed a high school education.
the Study Area, approximately 82 percent of the area’s adult residents have a high school diploma ee Figure 3‐5). About 29 percent have completed an undergraduate degree program, and 26 ercent have a master’s or professional degree. Approximately 18 percent of adult residents the ave not completed a high school education.
FIGURE 3‐4:
LEVEL OF EDUCATION IN THE FOCUS AREA
Figure 3‐4 showsCensus data
evel of educational attainment for Focus Area
atpAbout
In(sph

EXISTING CONDITIONS REPORT
3‐32
FIGURE 3‐5:
ccording $19,417. As in Table 3‐4, a substantial number of households (approximately 47.8 percent) earn less than
15,000 per year. Only 10.2 percent of the households earn more than $50,000 per year. By ontrast, in the Study Area, approximately 27 percent of households earn less than $25,000 per year, and the majority (52 percent) earns more than $50,000 per year.
TABLE 3‐4: INCOME DISTRIBUTION
LEVEL OF EDUCATION IN THE STUDY AREA
INCOME
Ashown
to Census forecasts, the 2010 median household income for the Focus Area is
$c
PERCENT OF FOCUS PERCENT OF STUDY ANNUAL INCOME AREA HOUSEHOLDS AREA HOUSEHOLDS
Less than $15,000 47.8% 18.0%
$15,000 to $24,999 19.6% 8.6%
$25,000 to $34,999 9.0% 8.7%
$35,000 to $49,999 13.4% 13.6%
$50,000 to $74,999 6.2% 17.5%
$75,000 to $99,999 2.2% 9.7%
$100,000 to $149,999 0.9% 11.4%
$150,000 to $199,999 0.3% 5.0%
$200,000 and above 0.6% 7.4%
Source: 2000 Census

BROOKLYN STREETCAR FEASIBILITY STUDY
3‐33
The median household income for the Focu ased slightly between 1989 and 1999, and has continued to increase in r e median household income creased by two percent between 1989 and 1999 and increased by 22 percent from 1999 to 2010. median household income has also increased for the Study Area (by 34 percent between 1989
nd 1999 and by 28 percent between 1999 and 2010).
TABLE 3‐5:MEDIAN HOUSEHOLD INCOME
s Area increecent years. As shown in Table 3‐5, th
inThea
LOCATION 1989 1999 2010 PERCENT CHANGE
1989‐1999 PERCENT CHANGE
1999‐2010
Focus Area $15,571 $15,928 $19,417 2% 22%
Study Area $38,203 $51,164 $65,631 34% 28%
Sources: 2000 U.S. Census; ESRI. All values in 2010 dollars, based on US Bureau of Labor Statistics, Consumer Price Index (CPI)
3.2 HOUSING
As shown in Table 3‐6, the Focus Area experienced a net gain of 134 dwelling units between 1990 nd 2000, an increase of approximately three percent. This is a much lower increase than the 8 ercent gain for the Study Area as a whole. Between 2000 and 2010, the Focus Area had a net gain 279 dwelling units (6.7 percent). Again, this is lower than the Study Area’s increase of 11.2 ercent. In addition, the vacancy rate for residential units in the Focus Area is one percent greater
than that for the Study Area (see Table 3‐6). Overall, however, the Focus Area has seen a greater housing units and has a lower vacancy rate than the borough of Brooklyn.
apofp
increase in
TABLE 3‐6:HOUSING UNITS AND RESIDENTIAL VACANCY RATES
HOUSING UNITS
NUMBER PERCENT CHANGE VACANCY RATE
LOCATION 1990 2000 2010 1990‐2000
2000‐2010 1990 2000 2010
Focus Area 4,019 4,153 4,432 3.3% 6.7% 4.7% 6.3% 7.7%
Study Area 37,906 40,813 45,398 7.7% 11.2% 7.8% 4.3% 6.5%
Brooklyn 873,671 930,866 977,590 6.5% 5.0% 5.2% 5.4% 7.9%
Sources: 1990 U.S. Census; Existing e s from ESRI, Inc.; 199 data from U.S. ates from ESRI, Inc and erican Community Sur
and 2000 data from stimate 0 and 2000Census; Existing estim the Am vey.
Housing in the Focus renter‐occu (see Table 3‐7). In approximately 93 percent of the renter‐occupied and percent were ‐occupied. This rate of renter occupan er than for the Study Area (68 percent renter d and 32 percent owner‐ rooklyn as a whole percent renter‐occu and 31 percent owner‐occupied).
Area is predominately pied 2000,owner housing units were seven
cy is much high ‐occupieoccupied) and for B (69 pied
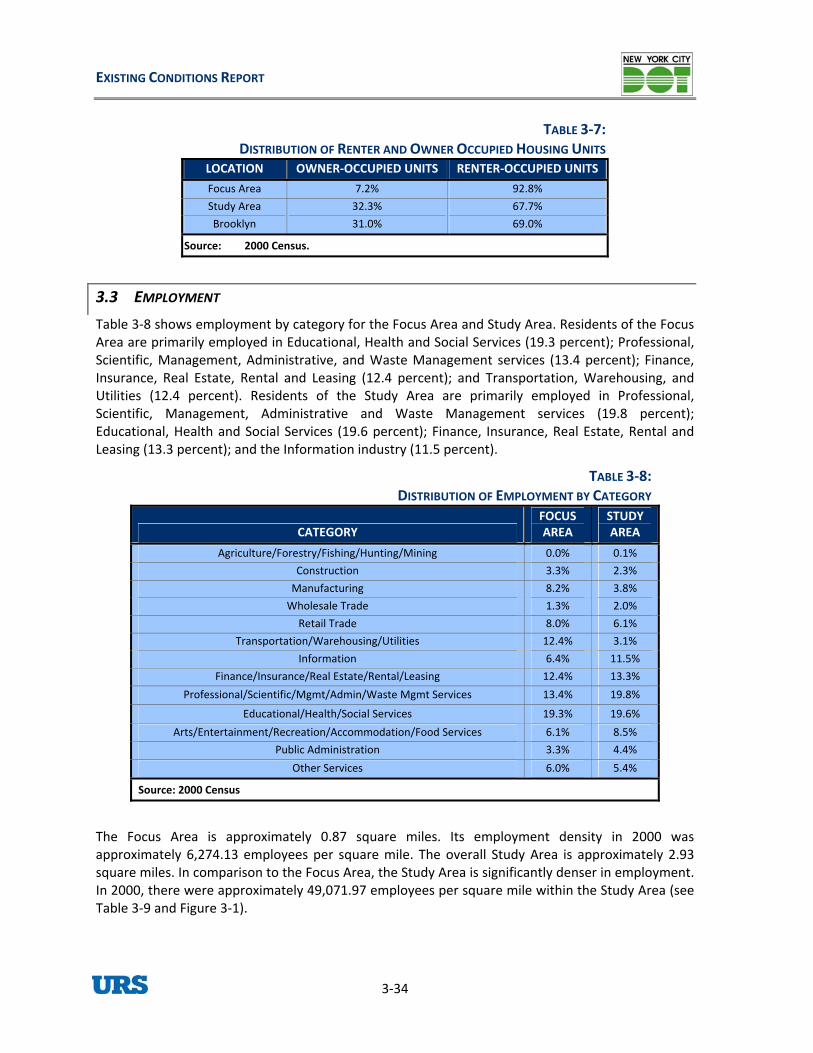
EXISTING CONDITIONS REPORT
3‐34
TABLE 3‐7: DISTRIBUTION OF RENTER AND OWNER OCCUPIED HOUSING UNITS
LOCATION OWNER‐OCCUPIED UNITS RENTER‐OCCUPIED UNITS
Focus Area 7.2% 92.8%
Study Area 32.3% 67.7%
Brooklyn 31.0% 69.0%
Source: 2000 Census.
3.3 MENTEMPLOY
Table s emp by ca r the rea and S Area. Resident he Focus A r , Scientific, M dministrative, and Waste Management services (13.4 percent); Finance, surance, Real Estate, Rental and Leasing (12.4 percent); and Transportation, Warehousing, and
(12.4 percent). Residents of the Study Area are primarily employed in Professional, gement, Administrative and Waste Management services (19.8 percent);
3‐8 show loyment tegory fo Focus A tudy s of trea are p imarily employed in Educational, Health and Social Services (19.3 percent); Professional
anagement, AInUtilities Scientific, ManaEducational, Health and Social Services (19.6 percent); Finance, Insurance, Real Estate, Rental and Leasing (13.3 percent); and the Information industry (11.5 percent).
TABLE 3‐8: DISTRIBUTION OF EMPLOYMENT BY CATEGORY
CATEGORY FOCUS AREA
STUDY AREA
Agriculture/Forestry/Fishing/Hunting/Mining 0.0% 0.1%
Construction 3.3% 2.3%
Manufacturing 8.2% 3.8%
Wholesale Trade 1.3% 2.0%
Retail Trade 8.0% 6.1%
Transportation/Warehousing/Utilities 12.4% 3.1%
Information 6.4% 11.5%
F /Insu eal Estate/Rental/Leasing inance rance/R 12.4% 13.3%
Profes ien Servsional/Sc tific/Mgmt/Admin/Waste Mgmt ices 13.4% 19.8%
Educa lt ervictional/Hea h/Social S es 19.3% 19.6%
Arts/Entertainment/Recreation/Accommodation/Food Services 6.1% 8.5%
Public Administration 3.3% 4.4%
Other Services 6.0% 5.4%
Source: 2000 Census
The Focus Area is approximately 0.87 square miles. Its employment density in 2000 was approximately 6,274.13 employees per square mile. The overall Study Area is approximately 2.93 square miles. In comparison to the Focus Area, the Study Area is significantly denser in employment. 2000, there were approximately 49,071.97 employees per square mile within the Study Area (see able 3‐9 and Figure 3‐1). InT
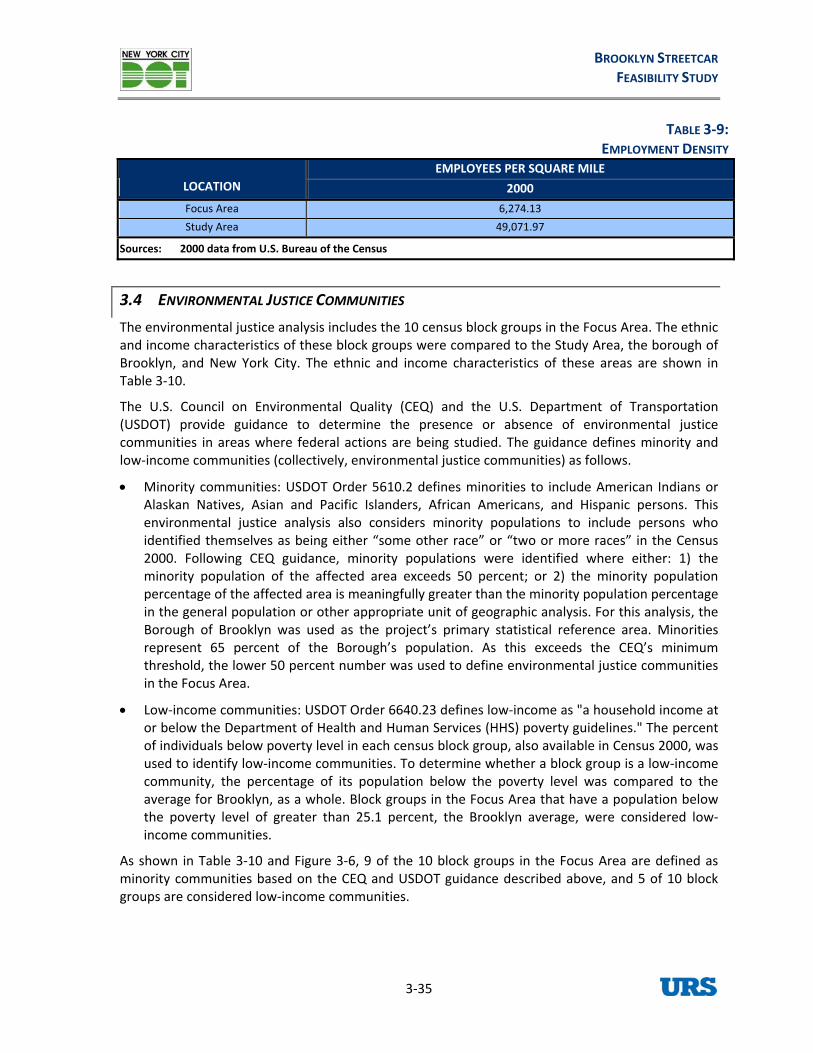
BROOKLYN STREETCAR FEASIBILITY STUDY
3‐35
TABLE 3‐9:T DENSITYEMPLOYMEN
EMPLOYEES PER SQUARE MILE LOCATION 2000
Focus Area 6,274.13
Study Area 49,071.97
Sources: 2000 U Census data from .S. Bureau of the
3.4 ENVIRONMENTAL JUSTICE COMMUNITIES
The environmental justice analysis includes the 10 census block groups in the Focus Area. The ethnic and income characteristics of these block groups were compared to the Study Area, the borough of Brooklyn, and New York City. The ethnic and income characteristics of these areas are shown in Table 3‐10.
The U.S. Council on Environmental Quality (CEQ) and the U.S. Department of Transportation (USDOT) provide guidance to determine the presence or absence of environmental justice communities in areas where federal actions are being studied. The guidance defines minority andlow‐income communities (collectively, environmental justice communi
ties) as follows.
• Minority communities: USDOT Order 5610.2 s or Alaskan Natives, Asian and Pacific Islanders, s. This environmental justice analysis minority populations who identified themselves as bein me other race” or “two or m es” Census 2000. Following were identifie e : 1) the minority population of the a exceeds 50 percent; or 2) ori percentage of the affected a gfully greater than the minorit ation ntage in the general population or unit of geographic analysis. r this , the Borough of Brooklyn was us roject’s primary statistical re ce area. rities represent 65 percent ion. As this excee CE threshold, the lower 50 perce was used to define environmental in the Focus Are
• Low‐income commu efines low‐income a at or below ) poverty lines." percent of individuals below pove sus block group, also available Census was used to identify low‐income . To determine whether a block up is ‐income com centage of its population below the poverty level was compared to the ave , as a whole. Block groups in the Focus Area that have a population below the poverty level of greater than 25.1 percent, the Brooklyn average, were considered low‐
defines minorities to include American Indian African Americans, and Hispanic person
also considersg either “so
to includeore rac
persons in the
CEQ guidance, minority populations d where itheraffected are the min ty populationrea is meanin y popul perce other appropriate Fo analysised as the p feren Mino
of the Borough’s populat ds the Q’s minimumnt number justice communities
a.
nities: USDOT Order 6640.23 d s "a household income the Department of Health and Human Services (HHS guide The
rty level in each cen in 2000, communities gro a low
munity, the perrage for Brooklyn
income communities.
As shown in Table 3‐10 and Figure 3‐6, 9 of the 10 block groups in the Focus Area are defined as minority communities based on the CEQ and USDOT guidance described above, and 5 of 10 block groups are considered low‐income communities.

BROOKLYN STREETCAR FEASIBILITY STUDY
3‐36
TABLE 3‐10: USTICE HARACTERISTICS OF THE FOCUS AREA ENVIRONMENTAL J C
POPULATION PROFILE BY RACE AND ETHNICITY* CENSUS TRACT (CT)/ BLOCK GROUP (BG) TOTAL WHITE % BLACK % ASIAN % OTHER % HISPANIC %
TOTAL MINORITY
INDIVIDUALS BELOW POVERTY LEVEL**
CT 55 BG 1 181 85 47.0% 4 2.2% 2 1.1% 14 7.7% 76 42.0% 53.0% 4.4%
CT 55 BG 2 26 16 61.5% 5 19.2% 0 0.0% 1 3.8% 4 15.4% 38.5% 0.0%
CT 57 BG 1 472 134 28.4% 66 14.0% 7 1.5% 13 2.8% 252 53.4% 71.6% 7.1%
CT 57 BG 2 537 102 19.0% 29 5.4% 8 1.5% 51 9.5% 347 64.6% 81.0% 38.7%
CT 57 BG 3 530 87 16.4% 65 12.3% 0 0.0% 35 6.6% 343 64.7% 83.6% 22.0%
CT 57 BG 4 92 43 46.7% 14 15.2% 1 1.1% 0 0.0% 34 37.0% 53.3% 25.7%
CT 59 BG 1 42 11 26.2% 4 9.5% 0 0.0% 1 2.4% 26 61.9% 73.8% 72.2%
CT 59 BG 2 471 62 13.2% 76 16.1% 4 0.8% 25 5.3% 304 64.5% 86.8% 41.1%
CT 59 BG 3 586 133 22.7% 101 17.2% 9 1.5% 47 8.0% 296 50.5% 77.3% 31.8%
CT 85 BG 1 7278 95 1.3% 3979 54.7% 24 0.3% 96 1.3% 3084 42.4% 98.7% 54.6%
Focus Area (Red Hook)
10,215 768 7.5% 4,343 42.5% 55 0.5% 283 2.8% 4,766 46.7% 92.5% 46.6%
Study Area 86,602 46,124 53.3% 16,547 19.1% 4,454 5.1% 3,378 3.9% 16,099 18.6% 46.7% 19.8%
Brooklyn 2,465,326 854,532 34.7% 848,583 34.4% 184,281 7.5% 90,052 3.6% 487,878 19.8% 65.3% 25.1%
New York City 8,008,278 2,801,267 35.0% 1,962,154 24.5% 780,229 9.7% 304,074 3.8% 2,160,554 27.0% 65.0% 21.0%
Notes:
* The racial hnic rth i ); Bl or African Ameri ispanic or Latino); Asian (Asian al His mer t ino; waiian and Other Pacific alone, not Hispanic or Latino; S er r atin t isp o; Persons of Hispanic origin y be of any race).
** Percent duals blish ' com s for poverty level defines p rty level.
*** Percenta old or l
and etone, notome oth
of indivi
ges in b
categories provided are fupanic or Latino); Other (Aace alone, not Hispanic or L
with incomes below esta
were identified as minority
er defined as: White (White alone, not Hican Indian and Alaska Native alone, noo; Two or more races, not Hispanic or La
ed poverty level. The U.S. Census Bureau
ow‐income communities.
spanic or Latino Hispanic or Latino); Hispanic (H
s established in
ack (Black Native Haanic or Latin
e threshold
can alone, not HIslander
ma
ove

BROOKLYN STREETCAR FEASIBILITY STUDY
3‐37
FIGURE 3‐6: J I UNIENVIRONMENTAL UST CE COMM TIES

EXISTING CONDITIONS REPORT
3‐38
Approximately 93 percent of the residen ocus Area are identified as minority—a substantially larger proportion rcent), Brooklyn (65 percent), and the City as a whole (65 percent). Slightly less than half of the Focus Area’s population (47 percent) identified themselves as Latino, making up the largest racial or ethnic group. African American/black comprised 42.5 percent of the area’s population. Asians and other minority groups accounted for approximately 2.5 percent of the population.
The percentage of low‐income residents in the Focus Area’s block groups range from 25.7 percent to 72.2 percent. Overall, the Focus Area has a low income population of nearly 47 percent. This is substantially higher than the Study Area (19.8 percent), the borough of Brooklyn (25.1 percent), and the City as a whole (21.8 percent).
Thus, the Focus Area is defined as an environmental justice community by the CEQ and USDOT guidance described above.
3.5 CONCLUSION
ts of the F than in the overall Study Area (46.7 pe
Over the past 20 years, the Focus Area has begun to recover from historic economic decline, and has seen an increase in residential and commercial development. Despite the consequent increase in residential and employee densities, however, the Focus Area continues to experience population and employment levels below their historic peak.
The Study Area has also seen an increase in residential and employment populations over the last 20 years. Outside of the dense Downtown Brooklyn area, neighborhoods in the Study Area have residential and employee densities similar to those of the Focus Area. However, the Focus Area and Study Area differ greatly in terms of income. According to Census forecasts, the 2010 median household income for the Focus Area is $19,417. A substantial number of households in the Focus Area earn less than $15,000 per year (48 percent), and few earn more than $50,000 per year (10%). By contrast, in the Study Area, approximately 27 percent of households earn less than $25,000 per year, and the majority earns more than $50,000 per year. As a consequence, automobile ownership rates in the Focus Area are significantly lower than in the Study Area, and much of the working‐age population of the Focus Area is dependent upon transit for its journey to work (see Section 4.2 below). It is therefore critical that the expanding Focus Area be considered for a substantial improvement to its transit service, and a streetcar is an important option to investigate in this context.

BROOKLYN STREETCAR FEASIBILITY STUDY
4‐39
4.0 TRANSPORTATION
4.1 ACCESS AND CIRCULATION
VEHICULAR ACCESS AND CIRCULATION
The Study Area consists of several neighborhoods with discrete street networks that connect at
The northeastern portion of the Study Area, from DUMBO to Atlantic Avenue, is traversed by the
theast, creating several irregular block sizes and skewed intersections venue and Fulton Street). South of Atlantic Avenue and through Brooklyn
generally follows rectangular grid pattern.
de and becomes an open cut highway through
a Focus Area’s east‐west running streets, including Wolcott, King, and Pioneer Streets are
iscontinuous because of the superblocks containing the Red Hook Houses and the adjacent Red ook Park. Many of the east‐west streets in the Focus Area are also cut off from direct access to the
Area by Interstate 278, the Brooklyn Battery Tunnel, and Hamilton Avenue.
Several Streets in the Study Area are designated by NYCDOT as through truck routes. These include Atlantic Avenue, Flatbush Avenue, and Interstate 278. Local truck routes include segments of Court Street, Smith Street, Schermerhorn Street, Tillary Street, Cadman Plaza West, Jay Street, Front Street, York Street, Sands Street, Navy Street, Furman Street, and Columbia Street. In the Focus Area, local truck routes include Van Brunt Street, Delevan Street, Hicks Street, Clinton Street, Court Street, Bay Street, and Beard Street.
individual points. Arterial roadways such as Flatbush Avenue, Tillary Street, Atlantic Avenue, and Hamilton Avenue form neighborhood boundaries and are the roadways that separate differing street grids.
Brooklyn and Manhattan Bridge ramps that lead to Flatbush Avenue and Adams Street. Flatbush Avenue runs northwest/sou(such as Flatbush AHeights, the Study Area
Interstate 278 also cuts through much of the periphery of the Study Area. The highway is elevated as it runs through the northern limits of Downtown Brooklyn, then it passes under the Brooklyn Bridge, after which the structure is double‐decked along the Brooklyn Heights waterfront. At Atlantic Avenue, Interstate 278 descends below graHicks Street. Access across Interstate 278 to the waterfront is provided at five of the 12 intersections from Atlantic to Hamilton Avenues–Congress, Kane, Sackett, Union, and Summit Streets. The Summit Street crossing is pedestrian‐only. Near Clinton Street, Interstate 278 becomes elevated and intersects with the Brooklyn‐Battery Tunnel portal and both travel southeasterly to Third Avenue. Hamilton Avenue runs below this portion of the Interstate 278.
Within the Focus Area, streets follow a grid pattern, primarily characterized by one‐way paired local streets and a few two‐way thoroughfares. Major two‐way streets in the Focus Area include Court, Clinton, Columbia, Richards, and Van Brunt Streets. These streets run north‐south and span the length of Red Hook, but are cut off from direct access to the Study Area by ramps to and from the Brooklyn Battery Tunnel and changes to street direction north of Hamilton Avenue. Clinton Street provides access to the Study Area via a circuitous series of turns at Hamilton Avenue, however, Clinton becomes one‐lane local street with one‐way northbound traffic north of Hamilton Avenue. Some of thedHStudy

EXISTING CONDITIONS REPORT
4‐40
TRANSIT ACCESS AND CIRCULATION
Figure 4‐1 shows the subway andcoverage in the Study Area varies
bus routes that traverse the Focus Area and Study Area. Transit greatly from north to south. North of Atlantic Avenue, several bus
subway conve ge, forming a transit hub. To the south, however, fewer buses and only direct subway service in the Focus Area.
wntown Brooklyn. The G train also crosses Downtown Brooklyn on its route between
Street. It runs over the Gowanus
TABLE 4‐1:R S S S A
and routes r two subway lines serve the area, with no
SUBWAYS Eleven subway routes cross into Brooklyn from Manhattan between Jay Street and Joralemon Streets in DoQueens and south Brooklyn. Most subway routes continue easterly or southeasterly from Downtown Brooklyn and exit the Study Area. However, the F and G trains continue southward to serve Cobble Hill and Carroll Gardens.
From Manhattan, the F train runs southward under Jay Street and Smith Street to Carroll Street. The train becomes elevated at Carroll Street, and turns eastward at 9th Canal, and then descends below ground again near Fifth Avenue. The G train runs under Hoyt Avenue through downtown Brooklyn. It merges with the F train at Atlantic Avenue and follows the F train route to its terminal at Church Avenue. The F and G subway station at Smith‐9th Street is the closest stop to the Focus Area, but accessing the Smith‐9th Street Station from Red Hook requires a bus ride or a lengthy and circuitous walk.
Table 4‐1 shows the average weekday, Saturday, Sunday, and annual ridership at subway stations within the Study Area.
IDERSHIP AT UBWAY TATIONS WITHIN THE TUDY REA
SUBWAY STATION AVERAGE WEEKDAY
AVERAGE SATURDAY
AVERAGE SUNDAY ANNUAL
Court St (M,R)/Borough Hall (2,3,4,5) 37,057 14,597 10,568 10,788,326
Atlantic Av (B,Q,2,3,4,5)/Pacific St (D,M,N,R) 31,408 21,052 16,575 10,039,490
Jay St‐Borough Hall (A,C,F) 30,177 13,080 9,083 8,871,247
DeKalb Av (B,M,Q,R) 16,835 7,864 5,621 5,014,623
Nevins St (2,3,4,5) 11,579 6,006 3,818 3,479,130
Bergen St (F,G) 10,154 6,594 5,268 3,228,987
Carroll St (F,G) 9,786 5,240 4,021 2,995,068
Hoyt‐Schermerhorn Sts (A,C,G) 9,642 4,455 3,075 2,862,942
Hoyt St (2,3) 6,341 3,155 2,197 1,902,962
High St (A,C) 6,045 3,494 2,859 1,888,271
Clark St (2,3) 5,269 3,692 3,020 1,706,174
Smith‐9 Sts (F,G) 4,579 2,995 2,466 1,465,834
Source: New York City Transit
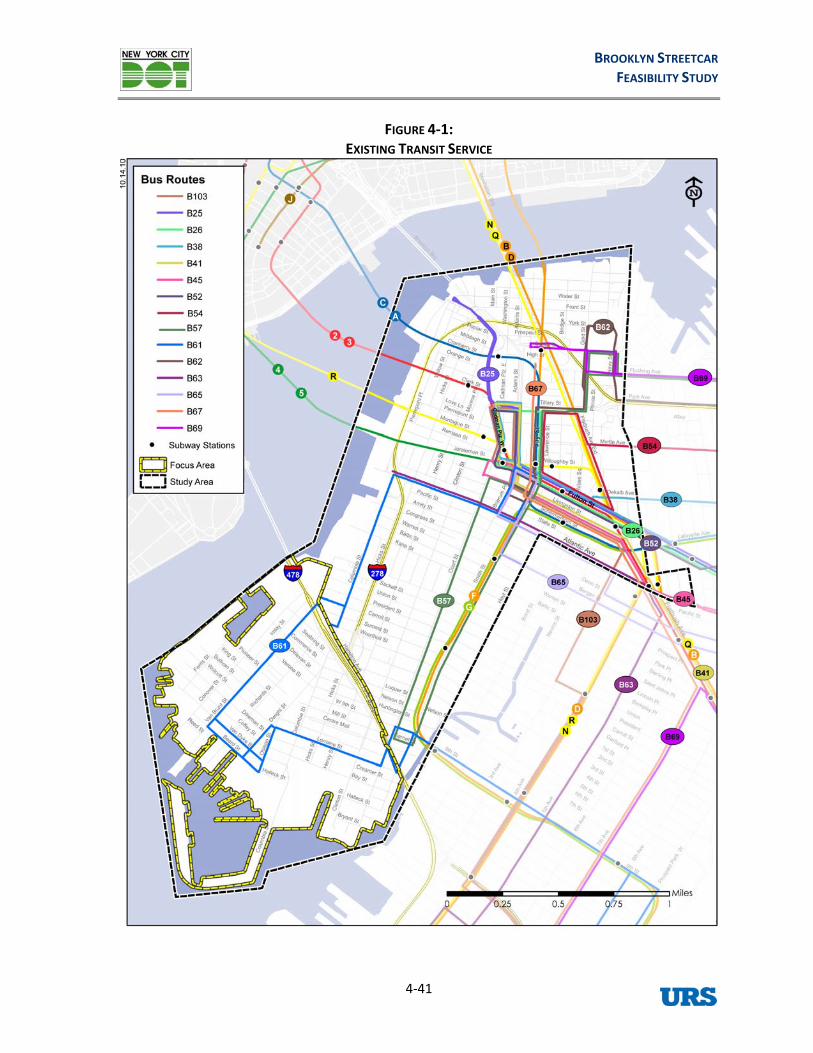
BROOKLYN STREETCAR FEASIBILITY STUDY
4‐41
FIGURE 4‐1: EXISTING TRANSIT SERVICE

EXISTING CONDITIONS REPORT
4‐42
BUSES Table 4‐2 lists the 15 bus routes th and shows their average weekday, Saturday, and Sunday ridership. Downtown Brooklyn is a major hub for the borough’s bus service with nearly all of the 15 routes either terminating or traversing the area. Bus service in the Focus Area is far more limited than in the Study Area in general.
TABLE 4‐2:RIDERSHIP ON BUS ROUTES THAT SERVE THE STUDY AREA
at serve the Study Area
ROUTE DESCRIPTION
AVERAGE WEEKDAY RIDERSHIP
AVERAGE SATURDAY RIDERSHIP
AVERAGE SUNDAY RIDERSHIP
SYSTEM WIDE RANK*
B25 Broadway Junction to DUMBO along the A/C subway line
12,983 9,666 6,413 66
B26 Ridgewood to Downtown Brooklyn via Halsey and Fulton Streets
10,811 8,690 6,154 82
B38 Ridgewood to Downtown Brooklyn via Kossuth Place and Dekalb Avenue (also runs LTD)
22,043 13,362 9,515 28
B41 Kings Plaza to Downtown Brooklyn via Flatbush 38,658 31,884 20,858 7
B45 Crown Heights to Downtown Brooklyn via St. Johns Pl/Atlantic Ave
8,627 6,629 4,448 97
B54 Ridgewood to Downtown Brooklyn via Myrtle Ave 12,249 7,664 5,489 76
B57 Gowanus to Maspeth via Smith/Court St 5,471 2,688 1,830 132
B61 Park Slope to Red Hook to Downtown Brooklyn** 11,013 7,085 5,105 N/A
B62 Long Island City to Downtown Brooklyn** 11,815 7,162 5,236 N/A
B63 Bay Ridge to Cobble Hill via 5th Ave 13,161 12,050 9,193 56
B52 Ridgewood to Downtown Brooklyn via Gates Ave 14,050 9,467 6,719 60
B65 Crown Heights to Downtown Brooklyn via Dean/Bergen St
4,754 2,923 2,054 142
B67 Kensington to Downtown Brooklyn via 7th Ave 6,560 3,149 2,274 123
B69 Kensington to Downtown Brooklyn via 7th Ave/Vanderbilt
2,286 1,089 830 168
B103 Canarsie to Downtown Brooklyn LTD 6,240 2,003 384 N/A
Notes: * Ranking of 194 local routes based on 2009 ridership
** October 2010
*** Average ridership for the period of January 2010 to July 2010.
Some routes have changed since these data have been collected
Sources: New York City Transit
In June 2010, NYCT implemented service change that resulted in the restructuring of bus routes in and near Red Hook. These changes discontinued routes and restructured others.
The B75 and B77 routes were discontinued. The B75 previously operated between Downtown Brooklyn (Sands and Jay Streets) and Windsor Terrace (20th Street and Prospect Park West) via Smith Street (northbound), Court Street (southbound), and 9th Street. The B75 generally paralleled the F and G train route. The B77 operated between Red Hook (Conover and Dikeman Streets) and

BROOKLYN STREETCAR FEASIBILITY STUDY
4‐43
Park Slope (5 Avenue and 10th Street) via Lorraine and 9th Streets. The B77 provided access
t Park West in Windsor Terrace. The B57 was also extended from Court and Livingston Streets to the Smith–9 Street (FG) subwoperating along Court and Smith Streets throu Cobble Hill d rroll s. The eroute replaces the northern portion of the B75Downtown Brooklyn.
is the primar rving Red Hook, m n tthe B61, which is a long and suffered from on e performance B62. now from Park then 9 r lum to ntown lyn. In October 2010, this route regi 11,000 boardings per weekday. The B62 runs from Downtown Brooklyn
B LES
Bicycle ro rated le path t at th ge approaches, a C out rtion Hook. separated (C I) pa e Focus On‐Str lass II ) bicycle tes ru ea nd Place/Adams Stre ith an nry Streets als lanes. s of e est con ns, cycl connect via 9 ean Stree the no yrtle A , Sands eet, a h (Cl nd stri ‐stree s II) bike es. Figure 4‐2 ithin th us Area tudy A
In the Focus Area, e III bike paths are provided along Bay Street, Creamer Street, Lorraine e pat provid ng Columbia Street s II a lass I urt St lass III Smith Street (Class I nly the h Stree connect to neighborhoods.
t o bike paths are planned in the Focus Area. lass II bike paths planned in the western portion of the Focus Area. Also
route from Mill Street to Bowne Dwight Street to Van Brunt Street.
ARKING REGULATIONS
n‐street parking regulations for key north‐south and east‐west corridors were collected from
or more of
between Red Hook and the 4 Avenue/9th Street Subway Station (F, G, N, R).
To provide alternative service for Red Hook customers, NYCT extended the B61 route. The B61 previously operated between Downtown Brooklyn and Red Hook, terminating at Beard and Otsego Streets. NYCT extended the B61 to 19th Street and Prospec
ay station, gh an Ca Garden xtended B57 between the Smith–9 Street (FG) subway station and
The B61 y bus route se along Colu bia and Va Brunt Stree s. As part of above‐described 2010 service changes, the
issues, was split into the B61 and
The B61 route runs
‐tim along Slope
th St eet, through Red Hook, and north on Costered over
bia Street Dow Brook
to Queens Plaza.
ICYC utes crisscross the Study Area. Sepa bicyc s exis e brid
long olumbia Street in Cobble Hill, and in the s hern po of Red Two morelass ths are planned or proposed in th Area. eet (C and III roun n rly the entire length of Clinton Street a Boerum et. Sm d He
o have significant lengths of bicycle In term ast‐w nectio ists canth, 3rd, Union, Bergen, and D ts. To rth, M venue Str
nd Sc ermerhorn Street have a mix of dedicated ass I) a ped, on t (Clas lanshows the designated bike routes w
ast‐west, Class
e Foc and S rea.
Street, and 9th Street. North‐south bik hs are ed alo (Clasnd C II), Clinton Street (Class II and III), Co reet (C ), and II). O 9t t and Clinton Street bike paths adjoining
As par f the New York City Bicycle Master Plan, newThere is a network of Cplanned are the extension of the Columbia Street Class II bikeStreet and extension of the Beard Street Class II bike path from
P
ONYCDOT’s STATUS parking database and were field verified. On‐street regulations are indicated on blocks where new or enhanced transit service may be possible. Figure 4‐3 summarizes on‐street regulations. Blocks were generally classified by their dominant regulation (75 percentone regulation). In cases where blocks were split evenly among more than one regulation, multiple regulations are shown.

EXISTING CONDITIONS REPORT
4‐44
FIGURE 4‐2: BICYCLE ROUTES

BROOKLYN STREETCAR FEASIBILITY STUDY
4‐45
FIGURE 4‐3: ET PARKING REGUON‐STRE LATIONS

EXISTING CONDITIONS REPORT
4‐46
The “No Parking / No Standing” category encompasses different regulations that restrict on‐street parking. Some examples a only; No parking 7 AM‐7 PM Monday through Friday; and No parking 8 AM‐6 PM Monday through Friday. No parking except authorized vehicles is proved at locations in Downtown Brooklyn. Other typical areas where parking is restricted are fire zones and school zones.
Atlantic Avenue and Downtown Brooklyn contain nearly all metered spaces. Atlantic Avenue’s “No Parking / No Standing” regulation is primarily for commercial loading and unloading. In the Focus Area, most streets are alternate side parking blocks. Industrial areas typically have prohibited parking except for commercial vehicles. Beard Street along the front of IKEA is a no standing zone.
4.2 TRAVEL CHARACTERISTICS
severalre: Commercial loading/unloading
This section describes the travel characteristics of residents and employees of the Focus Area and Study Area based on the 2000 Census Transportation Planning Package, which is the most recent information available at the block group level.
RESIDENTS (JOURNEY‐TO‐WORK)
According to the 2000 Census, 2,349 of the Focus Area’s residents are employed. Most of these residents work within New York City with many in the surrounding neighborhood and Downtown Brooklyn (see Figure 4‐4). Approximately 15 percent of residents work in the Focus Area, and another 11 percent commute to Downtown Brooklyn. About 13 percent commute to Lower Manhattan and 14 percent travel to Midtown Manhattan. Other areas with a notable concentration of workers from the Focus Area include the Greenpoint and Bushwick neighborhoods in Brooklyn, Long Island City, and the area near John F. Kennedy Airport.
As shown in Figure 4‐5, the majority (58 percent) of Focus Area residents commute to work by public transportation (subway or bus). About 14 percent of the residents drive alone to work; five percent carpool; and 18 percent of the residents walk to work.
There are a lower percentage of commuters by public transit in the Focus Area than in the Study Area. Whereas 58 percent of Focus Area residents use public transit to commute, 65 percent of Study Area residents commute by public transit (see Figure 4‐6). There is a corresponding difference in automobile commutes between the Focus Area and the Study Area. In the Focus Area, 18 percent commute by auto (drove alone or carpool) as compared to 13 percent for the Study Area.
In the Focus Area, commuters using public transit decreased by approximately one percent between 1990 and 2000 (59 percent in 1990 compared to 58 percent in 2000). Walk only commuters increased during this period, from 13 percent to 18 percent. There was a four percent reduction in the percentage of automobile commutes. Between 1990 and 2000, the percentage of drive alone commuters decreased by approximately one percent and the percentage of carpool commuters decreased by nearly five percent. In the overall Study Area, commuters using public transit increased by one percent, from 65 percent to 66 percent. At the same time, the percentage of drive alone commuters decreased by approximately two percent, and the percentage of carpool commuters decreased by approximately two percent.
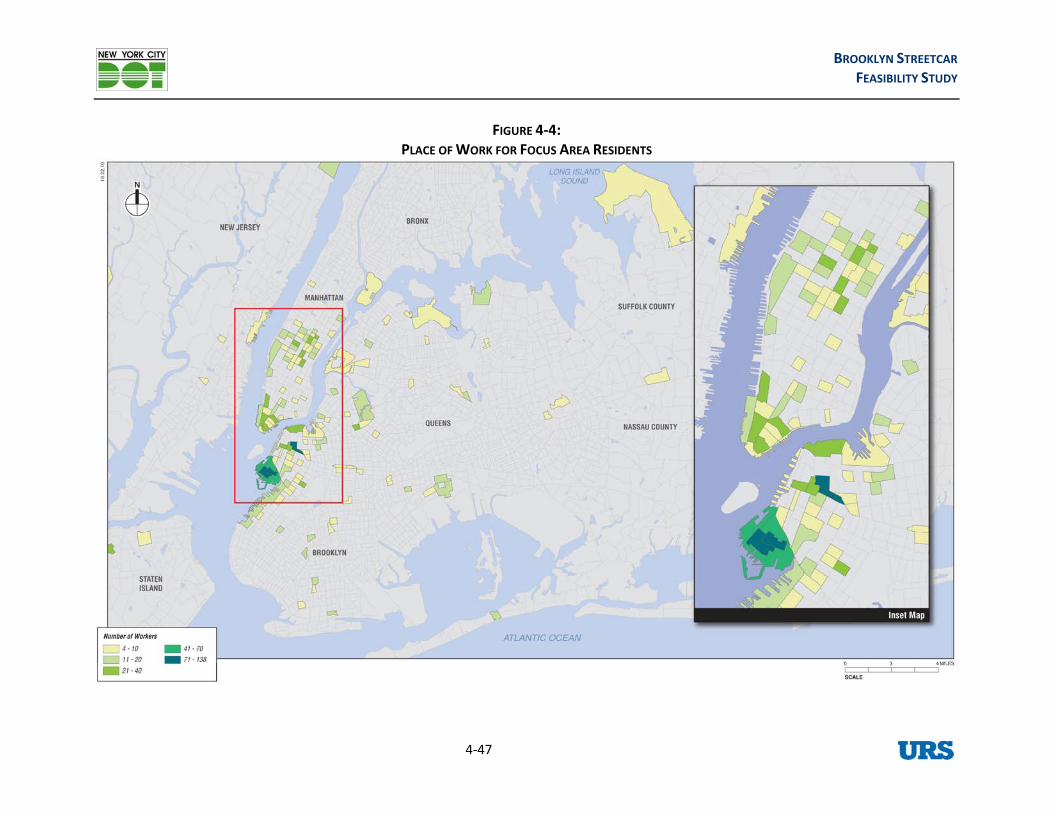
BROOKLYN STREETCAR FEASIBILITY STUDY
4‐47
IGURE 4‐4: OR FOCUS AREA RESIDENTS
FOF WORK PLACE F

TASK 1 EXISTING CONDITIONS REPORT
4‐48
FIGURE 4‐5: MEANS OF TRANSPORTATION TO WORK FOR FOCUS AREA RESIDENTS
FIGURE 4‐6:
MEANS OF TRANSPORTATION TO WORK FOR STUDY AREA RESIDENTS

BROOKLYN STREETCAR FEASIBILITY STUDY
4‐49
A relatively low percentage of households own in the Focus Area. About 83 percent of households do not percent own
than one vehicle. In the Study Area, 65 percent of households do not own a vehicle, 31 nt own one vehicle, and 4 percent own more than one vehicle.
Figure 4‐7 shows the distribution of travel time to work for the Focus Area and Study Area based on 2000 Census data. Generally, Focus Area residents have a longer commute
Study Area residents. In the Focus Area, 48 percent of the population reaches work in less than minutes, but 21 percent travels more than an hour to work. In the Study Area, approximately 55
nt of the population reaches work in less than 34 minutes, and nine percent travel more than hour to work.
FIGURE 4‐7: TRAVEL TIME TO WORK
EMPLOYEES (REVERSE JOURNEY‐TO‐WORK)
According to U.S. Census, there are 5,445 people who work in the Focus Area and 143,854 who work the Study Area. Figure 4‐8 shows the place of residence for Focus Area workers. Most people who
in Red Hook live within New York City, with many coming from the surrounding neighborhood from Brooklyn in general. Other areas with a high concentration of residents who work in the Area include Woodside, Jamaica, Howard Beach, and Lindenwood in Queens and Union City in Jersey. There are 345 (6.34 percent) people who work in Red Hook and also live in Red Hook.
shown in Figure 4‐9, the predominant mode of travel to work for individuals who work in the Area is by automobile (59 percent), and only eight percent of workers commute on foot. This tes that a large percentage of the workers of the Focus Area do not live in the Focus Area. ‐nine (29) percent of workers commute to the Focus Area by public transit. In the Study Area,
the largest portion of workers (49 percent) commutes by public transit. About 36 percent arrive by vehicular modes, and six percent commute by foot (see Figure 4‐10).
work
automobiles own a vehicle, 14 percent own one vehicle, and less than three
moreperce
populations,than34percean
As
in
andFocus
Focusindica
New
Twenty
FOR FOCUS AREA AND STUDY AREA RESIDENTS

TASK 1 EXISTING CONDITIONS REPORT
4‐50
FIGURE 4‐8: PLACE OF RESIDENCE FOR FOCUS AREA WORKERS

BROOKLYN STREETCAR FEASIBILITY STUDY
4‐51
FIGURE 4‐9: MODE OF TRAVEL TO WORK FOR FOCUS AREA WORKERS
FIGURE 4‐10:
MODE OF TRAVEL TO WORK FOR STUDY AREA WORKERS

EXISTING CONDITIONS REPORT
4‐52
Figure 4‐11 shows the distribution of travel time to work for employees of the Focus Area and Study Area, based on 2000 census data. Generally, have a longer commute than Focus Area workers. In the Stu Area, 39 percent ation c work less than 34 minutes,
33 percent travels m of Focus Area workers ach work in less than 34 minutes, while 26 percent travel more than an hour to work.
FIGURE 4‐11: TRAVEL TIME TO WORK FOR FOCUS AREA AND STUDY AREA WORKERS
.3 CONCLUSION
Study Area workersdy of the popul rea hes inore than an hour to work. Approximately 50 percentbut
re
4
Interstate 278 and the Brooklyn‐Battery Tunnel are prominent transportation facilities in the Focus rea and physically isolate it from surrounding areas of Brooklyn. As such, there is limited north‐outh and east‐west access to and from Red Hook.
he Focus Area has no direct subway service and is served by only one bus route—the B61. the B61 offers good coverage in Red Hook and operates every eight to nine minutes during
eak periods, many residents decry its lack of reliability, which may be related to the length of the ute and congestion encountered outside the Focus Area. The nearest subway station is Smith‐9th
Street (FG). Access to the subway is by a lengthy walk or a transfer from the B61.
Despite limited transit service, the largest share of Focus Area residents relies on the bus and ubway to commute. On the other hand, those who work in the Focus Area rely much more heavily n their automobiles than on transit or other modes. In both cases, the poor access to Red Hook
utes to long commutes for its residents and employees. Nearly 50 percent of residents ommute more than 45 minutes to work. More than 50 percent of its employees also commute more n 45 minutes to work.
As
TAlthoughpro
socontribc
tha

BROOKLYN STREETCAR FEASIBILITY STUDY
4‐53
Area residents and workers rely on transit for access to and from Red Hook. With limited options and poor connections, however, they endure long commutes. Even for the many that commute relatively short distances to places like Downtown Brooklyn, Lower Manhattan, and Midtown Manhattan, the commute is long. Improved transit services should focus on reducing travel times, improving connections to existing subway services, and serving common destinations.

EXISTING CONDITIONS REPORT
5‐54
5.0 PRINCIPAL CONCLUSIONS The Brooklyn highway network physically isolates the Focus Area from adjoining areas and there is limited transit service. Although the area experienced a rapid economic decline from 1950 to 1990, over the past twenty years and especially in the last decade, a focus on reinvestment has spurred both large‐ and small‐scale commercial, industrial, and residential development. The Focus Area’s residential and worker populations have grown in recent years, but the area remains poorly served by transit. Currently, there is one bus route that serves the Focus Area even though many of its residents rely on public transportation.
The Study Area, for the most part, is well served by public transportation. However, there has been rapid redevelopment along its waterfront with new recreational, residential, and commercial uses. Like the Focus Area, these waterfront sites, particularly those south of Atlantic Avenue, are not well served by public transportation, but many of their occupants also rely on transit service for their daily needs.

APPENDIX A