Brookfield Business Partners/media/Files/B/Brookfield-BBU-IR/events... · • BBU equity investment...
55
Brookfield Business Partners INVESTOR DAY SEPTEMBER 27, 2017
Transcript of Brookfield Business Partners/media/Files/B/Brookfield-BBU-IR/events... · • BBU equity investment...

Brookfield Business Partners
INVESTOR DAY
SEPTEMBER 27 , 2017

2
Today’s topics
Our Business• Solid foundation with sustainable competitive advantages
Year in Review• Executing on our long-term strategic goals
Operations and Financial Overview• Flexible balance sheet bolstered by strong cash flow
Our Growth Plans• Target 15 to 20% average return on our investments

3
Our Business

4
Brookfield Business Partners is aBusiness Services and Industrials companyfocused on long-term capital appreciation
BBUNYSE
BBU.UNTSX
$3.8BMARKET CAP

5
Brookfield Business Partners at a glance
B u s i n e s s S e r v i c e s | I n d u s t r i a l s
Note: As of June 30, 2017
$14.4BASSETS
65INVESTMENT PROFESSIONALS
~400LOCATIONS

6
Target of 15% to 20% average return on investments
Our strategy is to acquire and managehigh quality operations globally

7
Our advantages
• Proven track record over 30+ years of investing in and managing businesses
• Broad sourcing capability on a global scale
• Broad investment mandate supported by access to capital and financial flexibility
• Ability to pursue challenged businesses where competition is limited
• Expertise in real assets and ability to leverage Brookfield’s broad network
• Long term capital positions us as a preferred partner with management teams looking to grow

8
Today, we invest across four segments
Business Services
Construction
Industrial Operations
Energy

9
Polling Question #1
Where do you think BBU should be investing in the next 2 years?
a) North America
b) South America
c) Europe
d) Australia
e) India
f) China

10
Year in Review

11
In the last yearwe made significant progress in
expanding our scale and global footprintto generate long-term capital appreciation
for our unitholders

12
Diversified our business profile, created new and expanded existing operating platforms
Deployed or committed ~$3 billion1 of capital to acquire businesses with solid long-term fundamentals
Recycled capital to maximize returns
Raised capital to strengthen our balance sheet
A productive year
1) Includes capital invested or committed by institutional partners

13
BRK Ambiental
Greenergy
BG Fuels
Teekay Offshore
OLG’s GTA Concession
• Strong cash flow streams
• High barriers to entry and/or low production costs
• Opportunities to improve through our operational expertise
• Capability to leverage Brookfield’s broader platform
• Significant growth potential
• Well-positioned; favorable outcomes within our control
Secured or completed five acquisitions
~$3 billion of capital deployed1
1) Includes capital invested or committed by institutional partners

14
BRK Ambiental is a rare opportunity to acquire an attractive business…
70% controlling stake in Brazil’s largest private water distribution, collection and treatment company
• Serving 15 million people
• 22 municipal water and sewage treatment assets
• 4 industrial water assets
• Public concessions and public-private partnerships

15
… with growing, contracted cash flows
Investment highlights
• BBU equity investment of $383 million (26% BBU ownership)
• Executed transaction in a challenging environment
• Revenues supported by regulatory framework
• Embedded EBITDA growth
• Attractive risk adjusted returns on growth opportunities
• Platform company poised for growth
• Positioned to gain growing share of government-planned water improvements
Growth
16
Greenergy is the U.K’s leading provider of road fuels…
Acquisition of the U.K.’s largest fuel supplier with high barriers to entry
• ~300 kT of biodiesel production capacity
• Well located import and storage infrastructure
• Extensive distribution network delivering 18 billion+ liters of road fuels annually

17
… with significant opportunity for international growth
Investment highlights
• BBU equity investment of $37 million (14% BBU ownership)
• Clear market leader in U.K. road fuel supply
• Track record of strong free cash flow
• Scalable global fuel logistics and procurement core competency
• Significant upside driven by operational efficiencies, organic growth, capital projects and biofuels standards
• Further expansion into new markets including Europe, Brazil and Canada
Growth

18
Canadian Mobil Gas Stations is a stable business…
213 retail gas stations and associated convenience kiosks adjacent to sites of Canada’s leading grocery stores
• Introducing premier Mobil brand to Canada
• Retain existing customers with Loblaw’s PC Plus® loyalty program
• Long-term agreement with Imperial Oil to source fuel at favorable price

19
… with ability to generate steady free cash flow
Investment highlights
• BBU equity investment of $43 million (26% BBU ownership)
• High volume sites with throughput in top quartile of industry
• Stable industry with high free cash flow
• Exclusivity to develop new stations at 800+ locations adjacent to Canada’s leading grocer
• Expand network through tuck-in acquisitions
• Grow and diversify earnings with non-fuel convenience retail
Growth

20
Teekay Offshore is a highly contracted business…
Leading global provider of marine services and solutions to the oil industry
• Marine transportation and production services
• Offshore oil regions: North Sea, Brazil and Canada
• Global fleet with leading presence in key markets

21
… with growing, strong cash flows at an attractive entry price
Investment highlights
• BBU equity investment of approximately $310 million (~25% BBU ownership1)
• Cash flows underpinned by medium to long-term, fixed-rate contracts with limited direct commodity price exposure
1) Subject to syndication to institutional partners
• Contracted EBITDA growth from de-risked, late stage projects
• Significant growth opportunities for shuttle tankers in the North Sea
• Increasing demand in Brazil
Growth

22
• Includes three gaming facilities in theGreater Toronto area
• The largest casino concession everawarded in Canada
• Increasing cash flows and attractivegrowth prospects
• Opportunity to develop a fourth facility
• Partnership with Great Canadian Gaming Corporation
OLG GTA Concession1 is the largest casino award in Canada…
1) Ontario Lottery and Gaming Corporation’s Greater Toronto Area Bundle. There can be no assurance that Brookfield Business Partners will close this transaction

23
… with increasing cash flows and attractive growth prospects
Investment highlights
• Consortium’s expected total investment over C$1 billion funded by debtand equity
• Underserved market with attractive characteristics for gaming
• Long-term concession in protected market with stable, growing cash flows
• Revitalization of facilities to capitalize on strong underlying demand
• Attract players with new table games and VIP play
• Engage new customers with new facilities, including hotels and restaurants
• Potential for a fourth location
Growth

24
Polling Question #2
Which new segment would you like to see us invest in?
25
Emerging Businessesoperate below what we believe to be
trendline performance and have significant improvement potential

26
VALUE DRIVERS
Emerging Business1Operations
Improvement Market Price Volumes
GrafTech
North American Palladium
Ember
We have created value in our emerging businesses
We expect Company FFO from emerging businesses to increase
1) Represents only significant emerging businesses
27
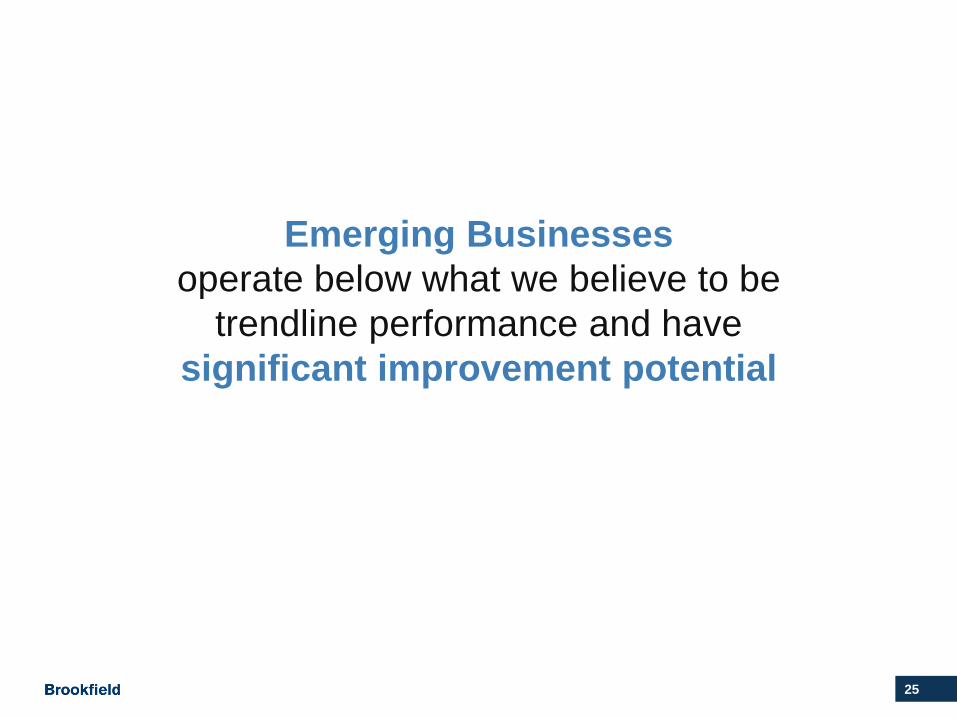
Our business is becoming more competitive…
Improved underlying businesses with our operational expertise during industry downturn, allowing us to uncover even greater value as industry recovers
• $100 million of sustainable operational improvements since acquisition
• Optimized production at lowest cost locations
• Re-engineered commercial strategy
• Divested non-core businesses
• 32% increase in payable palladium production since acquisition
• Active management drawing on Brookfield’s experience
• New mining method

28
Supply and demand fundamentals driving palladium prices over $900/oz
Natural gas pricing improvement coupled with an active hedging program provides greater certainty of cash flows with upside optionality
Constrained supply allows us to focus on economical value pricing compared to “cost-plus” pricing
… and we are beginning to benefit from price improvements in end markets
Pricing improvements should drive improved performance in 2018
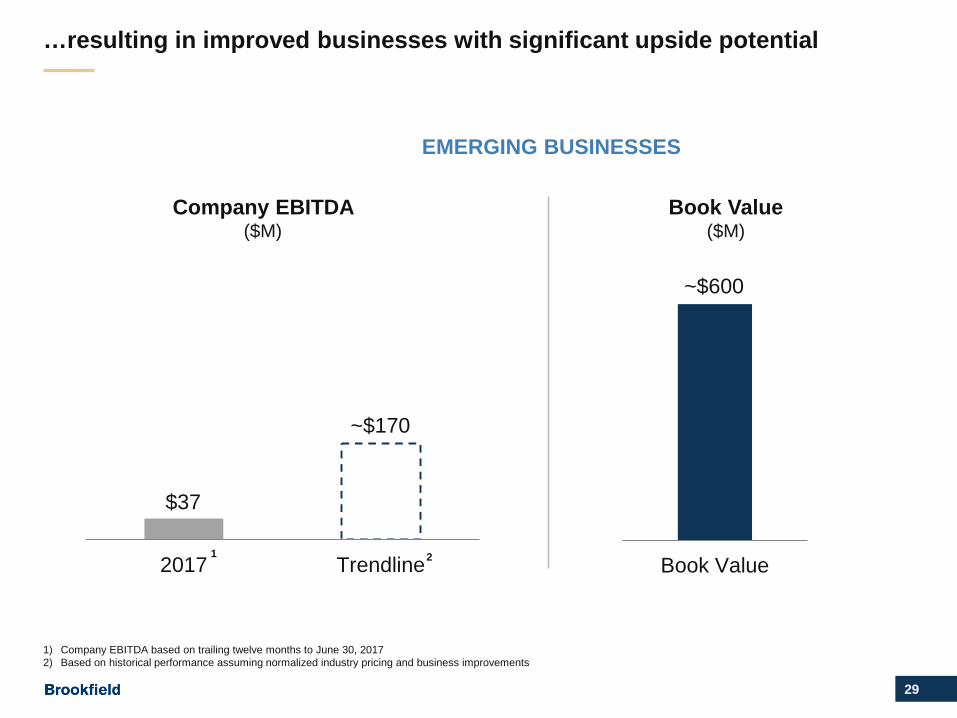
29
2017 Trendline
…resulting in improved businesses with significant upside potential
Company EBITDA ($M)
1 2
$37
~$170
Book Value
Book Value ($M)
EMERGING BUSINESSES
1) Company EBITDA based on trailing twelve months to June 30, 20172) Based on historical performance assuming normalized industry pricing and business improvements
~$600

30
Operations and Financial Overview

31
40%
18%14%
28%
Today our operations are grouped into four segments
Industrial OperationsConstruction
Business ServicesEnergy
$14.4BASSETS
$2.6BBOOK EQUITY
Note: As of June 30, 2017. Equity in graphs adjusted for transactions currently funded by debt, which will be replaced by equity. Excludes equity attributable to corporate and other

32
Our growth positions us to generate higher returns in the year ahead
($ billions) June 2017 December 2016
Assets $ 14.4 $ 8.2
Equity attributable to unitholders 2.6 2.5
($ millions) TTM June 2017 December 2016
Company FFO1 $ 243 $ 200
Company EBITDA1 170 240
1) Based on trailing twelve months

33
60%
14%
9%
5%
12%
Financial Advisory
40%
18%
14%
28%
Business Services: Services to real estate and other sectors
Energy
Construction ServicesBusiness
Services
Industrial Operations
Note: As of June 30, 2017. Equity in graphs adjusted for transactions currently funded by debt, which will be replaced by equity. Excludes equity attributable to corporate and other
Facilities Management
Road Fuels
Other
Business Services
Real Estate Services
$4.2BASSETS
$0.4BBOOK EQUITY

34
11%5%
55%
29%
40%
18%
14%28%
Industrial Operations: Manufacturing, mining and water provision
Energy
Construction Services
Graphite Electrodes
Water and Wastewater
Others
BusinessServices
IndustrialOperations
Industrial Operations
Palladium Mining
Note: As of June 30, 2017. Equity in graphs adjusted for transactions currently funded by debt, which will be replaced by equity. Excludes equity attributable to corporate and other
$5.9BASSETS
$0.5BBOOK EQUITY

35
40%
18%14%
28%
Construction: Services provided by a leading global contractor
Industrial Operations
Multiplex
Business ServicesEnergy
Note: As of June 30, 2017. Equity in graphs adjusted for transactions currently funded by debt, which will be replaced by equity. Excludes equity attributable to corporate and other
$2.5BASSETS
$1.0BBOOK EQUITY
36
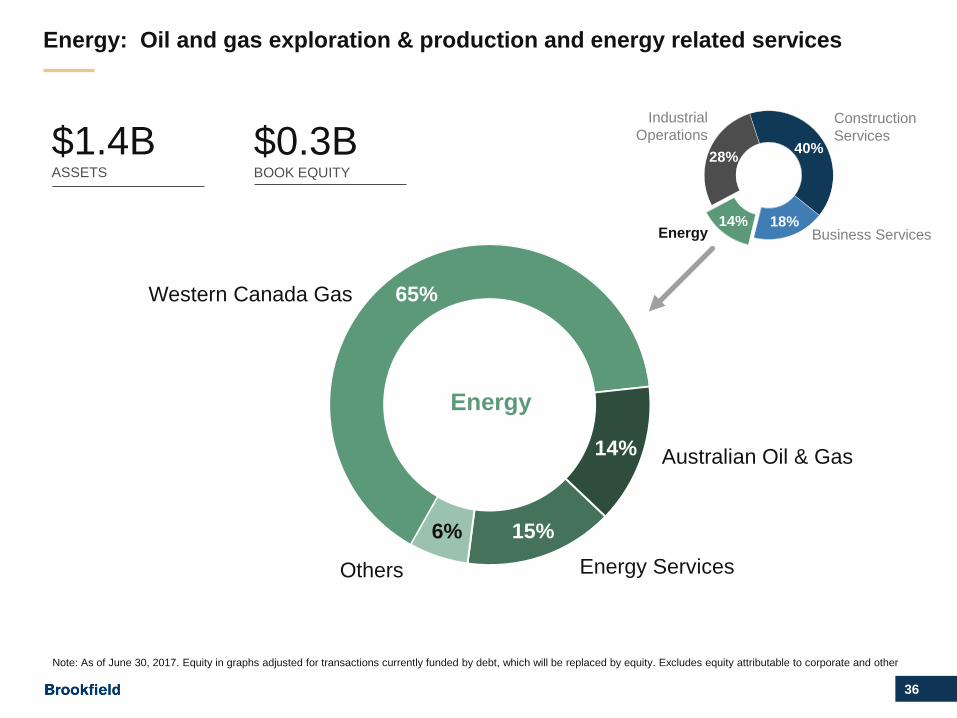
40%
18%14%
28%
Energy: Oil and gas exploration & production and energy related services
15%6%
65%
14%
Business Services
Construction Services
Energy
Australian Oil & Gas
Western Canada Gas
Energy ServicesOthers
IndustrialOperations
Energy
Note: As of June 30, 2017. Equity in graphs adjusted for transactions currently funded by debt, which will be replaced by equity. Excludes equity attributable to corporate and other
$1.4BASSETS
$0.3BBOOK EQUITY

37
Key financial objectives
Maintain disciplined financial risk management and a strong balance sheet with ample liquidity
Strategically refinance existing debt and manage leverage
Fund growth with cash flow from operations
Opportunistically monetize mature assets and operations

38
• Non-recourse financing at the operating asset level
• Weighted average debt maturity of 5.6 years1
• Maintain appropriate net debt to total capitalization for the business
60%
28%
12%
Disciplined financial risk management…
Maintaining a strong, flexible balance sheet
($ billions) June 2017Borrowings $ 3.2
Less cash & equivalents (1.0)
Net debt $ 2.2
Equity 5.3
Total $ 7.5
1) At June 30, 2017
Debt by Segment
Industrial Operations
Energy
Business Services

39
…with ample liquidity at the corporate level
~$1 billion of liquidity to take advantage of attractive opportunities
($ billions)
Cash $ 0.4Revolving facilities 0.7Available liquidity $ 1.1Committed for acquisitions1 (0.7)Recent unit issuance 0.6Pro-forma liquidity $1.0
1) Recently closed, announced and signed acquisitions

40
We will opportunistically recycle capital …
We harvest capital from mature assets and operations at the right time to optimize our company’s investment returns
InvestCapital
Available Capital
AddValue
Dispose of Investment

41
… which was exemplified by the sale of Maax
In January 2017, we sold our bath and shower products operations resulting in $92 million gain before tax for unitholders
• Acquired at the onset of the housing downtown in 2008
• Repositioned the company into a North American industry leader with lean operations
• Proceeds from disposition re-invested in recent acquisitions

42
$170
2017 Company EBITDA Business Improvement Acquisitions Pro-Forma Company EBITDA
$475 - $525
Growth through business improvements and acquisitions
Pro-forma Company EBITDA($ millions)
GrafTech
NAP
Ember
BG Fuels
Greenergy
OLG
BRK Ambiental
Teekay
1 2 3
1) Company EBITDA based on trailing twelve months to June 30, 2017 2) Based on historical average Company EBITDA in a normalized pricing environment and adjusting for operational improvements3) Based on historical average Company EBITDA contribution

43
Evolution of our value
Business Services $450 – $540
• Greenergy acquisition• BG Fuels acquisition• OLG GTA concession acquisition
8 – 10x $800 – $1,100
Industrials $360• GrafTech repositioning• BRK Ambiental acquisition4
• Business improvement7 – 8x $1,100 – $1,200
Construction $800 – $1,000 • Consistent value 8 – 10x $800 – $1,000
Energy $450 – $500 • Teekay acquisition5
• Business improvement $650 – $700
Corporate Cash • Funding acquisitions• Funds from equity offering $300
Total Valuation $2,200 – $2,600 $3,650 – $4,300
Value per unit $24 – $28 $29 – $3425 – 30%
($ millions, except per unit3)
2016Estimate
2017Estimate1,2,3
MultipleCompanyEBITDA
Price per flowing barrel of $19,000 to $21,0006
6 – 7x
1) Calculated using pro-forma Company EBITDA based on trailing twelve months to June 30, 2017, adjusted for impact of price increases, operational enhancements and contribution from acquisitions, as outlined on slide 42
2) Includes unitholders’ proportionate share of cash and cash equivalents and portfolio company debt financing, as applicable3) Figures rounded for presentation purposes4) BRK Ambiental included at acquisition price5) Teekay included at acquisition price6) Assumes production of 24,000 flowing barrels per day (attributable to unitholders)

44
1) Spin-off date of June 20, 2016 to September 25, 2017
Jun Jul Aug Sep Oct Nov Dec Jan Feb Mar Apr May Jun Jul Aug Sep
We have experienced strong share performance since spin-off1
2016 2017
$21.47
$29.6830%CAGR

45
Successful execution of our strategyand reinvestment of cash flow
generated from our businesswill drive additional value to unitholders

46
Polling Question #3
What performance metric is most relevant to you?
a) FFO
b) EBITDA
c) AFFO
d) Other

47
Our Growth Plans

48
Our business is well positioned for growth
We see significant opportunity to expand, with a focus on:
that strengthen and expand our segments and
geographic reach
Acquisitions
organically and through tuck-in acquisitions
Platform Business Growth

49
Opportunities in Services, Industrials and Energy
Current opportunity focus
Brazil and India pipelines continue to grow
U.S. and Europe are competitive environments
On-going initiative to consider new sectors

50
What makes a great long-term business
We will sell some businesses but keep others for the longer term
PredictableFree Cash Flows
PricingPower
Low Rateof Change
OperationalIntensity
Strong Competitive Position in Industry
High Barriersto Entry
High Returnon Capital
Demand, Growth, Scalability

51
Facilities Management Platform
• Services for occupiers of real estate
• Contracted cash flows and high renewal rates
• Scalable platform with organic growth
• Growth focus into Asia and the U.S.
Building operating platforms with significant scope and growth potential…
Johnson Controls
Integrated facilities management provider with 30,000+ locations
#2 provider of facilities management services in Canada
Joint venture partners in Canada / Australia facilities management
Provider of maintenance services for the petroleum industry in Canada
Critical environment facilities manager in a high growth industry
2013 2014 2015 2016 2017
RevenueUS$B
1
1) Revenue based on trailing twelve months to June 30, 2017
$0.8 $1.0$0.8
$1.3$1.6

52
Our segment allocation will continue to evolve
Flexible investment mandate supports greater diversification and entry intonew sectors
1) Segment allocation based on 2017 value estimates as described on slide 43. Does not include Brookfield Business Partners corporate assets and liabilities2) Potential based on achieving target returns, the reinvestment of cash flows into accretive investments, new unit capital and the successful recycling of capital
24%
33%
19%
24%
45%
20%
17%
18%
Spin-off
Today1
3 – 5 Years2
$2.0BMARKET CAP
$3.8BMARKET CAP
EquityBusiness ServicesIndustrial Operations
ConstructionEnergy
New SegmentNew Segment

53
Why invest in BBU
• Our current operations will grow through business improvement and long-term growth of platform companies
• We continue to have an active pipeline of potential opportunities and we have significant liquidity to execute these
• We have an experienced team with an active management approach and global capabilities
• The broader Brookfield platform provides us with a competitive advantage

54
Q & A

55
Important Cautionary Notes
All amounts are in U.S. dollars unless otherwisespecified. Unless otherwise indicated, the statistical andfinancial data in this presentation is presented as ofJune 30, 2017.
CAUTIONARY STATEMENT REGARDING FORWARD-LOOKING STATEMENTS AND INFORMATIONThis presentation contains “forward-looking information”within the meaning of Canadian provincial securities lawsand “forward-looking statements” within the meaning ofSection 27A of the U.S. Securities Act of 1933, asamended, Section 21E of the U.S. Securities ExchangeAct of 1934, as amended, “safe harbor” provisions of theUnited States Private Securities Litigation Reform Act of1995 and in any applicable Canadian securitiesregulations. Forward-looking statements includestatements that are predictive in nature, depend upon orrefer to future events or conditions, and includestatements regarding our and our subsidiaries’operations, business, financial condition, expectedfinancial results, performance, prospects, opportunities,priorities, targets, goals, ongoing objectives, strategiesand outlook, as well as the outlook for North Americanand international economies for the current fiscal yearand subsequent periods, and include, but are not limitedto, statements regarding our asset management. In somecases, forward-looking statements can be identified byterms such as “expects,” “anticipates,” “plans,” “believes,”“estimates,” “seeks,” “intends,” “targets,” “projects,”“forecasts” or negative versions thereof and other similarexpressions, or future or conditional verbs such as “may,”“will,” “should,” “would” and “could.”Although we believe that our anticipated future results,performance or achievements expressed or implied bythe forward-looking statements and information are basedupon reasonable assumptions and expectations, thereader should not place undue reliance on forward-looking statements and information because they involveknown and unknown risks, uncertainties and otherfactors, many of which are beyond our control, which maycause our and our subsidiaries’ actual results,performance or achievements to differ materially fromanticipated future results, performance or achievementsexpressed or implied by such forward-looking statementsand information.Factors that could cause actual results to differ materiallyfrom those contemplated or implied by forward-lookingstatements include, but are not limited to: the impact orunanticipated impact of general economic, political andmarket factors in the countries in which we do business;
the fact that our success depends on market demand forour products; the behavior of financial markets, includingfluctuations in interest rates and foreign exchanges rates;changes in inflation rates in North America andinternational markets; the performance of global equityand capital markets and the availability of equity and debtfinancing and refinancing within these markets; strategicactions including dispositions; the competitive market foracquisitions and other growth opportunities; our ability tosatisfy conditions precedent required to complete suchacquisitions; our ability to effectively integrate acquisitionsinto existing operations and attain expected benefits; theoutcome and timing of various regulatory, legal andcontractual issues; changes in accounting policies andmethods used to report financial condition (includinguncertainties associated with critical accountingassumptions and estimates); the effect of applying futureaccounting changes; business competition; operationaland reputational risks; technological change; changes ingovernment regulation and legislation within the countriesin which we operate; changes in tax laws; catastrophicevents, such as earthquakes and hurricanes; the possibleimpact of international conflicts and other developmentsincluding terrorist acts and cyberterrorism; and other risksand factors detailed from time to time in our documentsfiled with the securities regulators in Canada and theUnited States.We caution that the foregoing list of important factors thatmay affect future results is not exhaustive. When relyingon our forward-looking statements, investors and othersshould carefully consider the foregoing factors and otheruncertainties and potential events. Except as required bylaw, we undertake no obligation to publicly update orrevise any forward-looking statements or information inthis presentation, whether as a result of new information,future events or otherwise.
CAUTIONARY STATEMENT REGARDING USE OFNON-IFRS MEASURESThis presentation contains references to Company FFOand Company EBITDA that are not calculated inaccordance with, and do not have any standardizedmeaning prescribed by International Financial ReportingStandards (“IFRS”). We believe such non-IFRSmeasures including, but not limited to, Company fundsfrom operations (“Company FFO”) and CompanyEBITDA. As these non-IFRS measures ae not generallyaccepted accounting measures under IFRS, references toCompany FFO and Company EBITDA are thereforeunlikely to be comparable to similar measures presented
by other issuers and entities.We define Company FFO as net income excluding theimpact of depreciation and amortization, deferred incometaxes, breakage and transaction costs, non-cash gains orlosses and other items. Company FFO is presented net tounitholders, or net to parent company. When determiningCompany FFO, we include our proportionate share ofCompany FFO of equity accounted investments.Company FFO is further adjusted as Company EBITDAto exclude the impact of realized disposition gains(losses), interest expense, current income taxes, andrealized disposition gains, current income taxes andinterest expenses related to equity accountedinvestments. Company EBITDA is presented net tounitholders, or net to parent company. For furtherinformation on Company EBITDA see “Use of Non IFRSMeasures” on page 5 of the 2016 20-F. Our definition ofCompany FFO and Company EBITDA may differ fromdefinitions of Company FFO, Funds from Operations orCompany EBITDA used by other entities. We believe thatCompany FFO and Company EBITDA are usefulsupplemental measures that may assist investors inassessing the financial performance of BrookfieldBusiness Partners and its subsidiaries. Company FFOand Company EBITDA should not be considered as thesole measures of our performance and should not beconsidered in isolation from, or as a substitute for,analysis of our financial statements prepared inaccordance with IFRS. For further information onCompany FFO add Company EBITDA see “Use of NonIFRS Measures” on page 5 of the 2016 20-F.