BROILER Performance Objectives - Nestling 708 BROILER:Performance Objectives 02 2012 Introduction...
24
708 BROILER Performance Objectives 2012 An Aviagen Brand
Transcript of BROILER Performance Objectives - Nestling 708 BROILER:Performance Objectives 02 2012 Introduction...

708 BROILER
PerformanceObjectives
2012
An Aviagen Brand

ROSS 708 BROILER: Performance Objectives
02 2012
Introduction
This booklet contains the performance objectives for Ross 708 Broiler and is to be used with the Ross Broiler Management Manual.
Performance
These objectives indicate the performance achievable under good management and environmental conditions and when feeding nutrient levels described in the Ross 708 Broiler Nutrition Specification.
Producers may find that local factors prevent such performance being achieved. For example:
• The availability of raw materials may limit nutrient content and intake. • Extreme climatic conditions will reduce performance. • Economic considerations may limit choice of production systems.
Therefore average performance may be lower.
The objectives are presented in two sections to reflect the global nature of the publication. contains the performance data in metric measurement and contains imperial measurements.
In the tables values are rounded, this may result in small inaccuracies when using the objectives to calculate other performance statistics.
Yields will vary between processing plants depending on type of equipment used (e.g. carcass chilling technology, automated versus manual de-boning) and the exact portion being produced.
For further information on the management of Ross stock, please contact your local Technical Service Manager or the Technical Service Department.
gSectionlbSection

ROSS 308 BROILER: Performance ObjectivesROSS 708 BROILER: Performance Objectives
032012
Contents
04 Key Management Points
06-07 As-Hatched Performance
08-09 Male Performance
10-11 Female Performance
14-15 As-Hatched Performance
16-17 Male Performance
18-19 Female Performance
20-21 Carcass Yield
lbSection
lbSection
lbSection
gSection
gSection
gSection

Key Management Points
The Ross 708 is a robust, fast growing, feed efficient broiler with good meat yield. It is designed to satisfy the demands of customers who require consistency of performance and the versatility to meet a broad range of end product requirements. Cost effective production of chicken meat depends on achieving good bird performance and the following points are important for optimizing performance of the Ross 708 broiler:• Maximize chick quality by good management of hatching, storage and
transport conditions. • Design the brooding set-up to ensure easy access to water and feed at
placement and to ease the transition between supplementary systems and the automated feeders and drinkers at 4-5 days. Feed a highly digestible and nutritionally balanced Starter diet.
• Keep chicks in their thermal comfort zone by monitoring chick behavior, but beware of low relative humidities (less than 50% RH). Establish a minimum ventilation program from day one.
• Monitor crop fill, feeding and drinking behavior and 7-day live weight to allow continuous improvement of the brooding set-up.
• Keep birds in their thermal comfort zone throughout the growing period. Fast growing broilers produce large amounts of heat, particularly in the second half of the growout period. Keeping ambient temperatures less than 21ºC (69.8ºF) from 21 days onwards may improve growth rates.
• Maintain high standards of biosecurity and cleanliness to keep disease to a minimum.
ROSS 708 BROILER: Performance Objectives
04 2012
ROSS 308 BROILER: Performance ObjectivesROSS 708 BROILER: Performance Objectives
052012
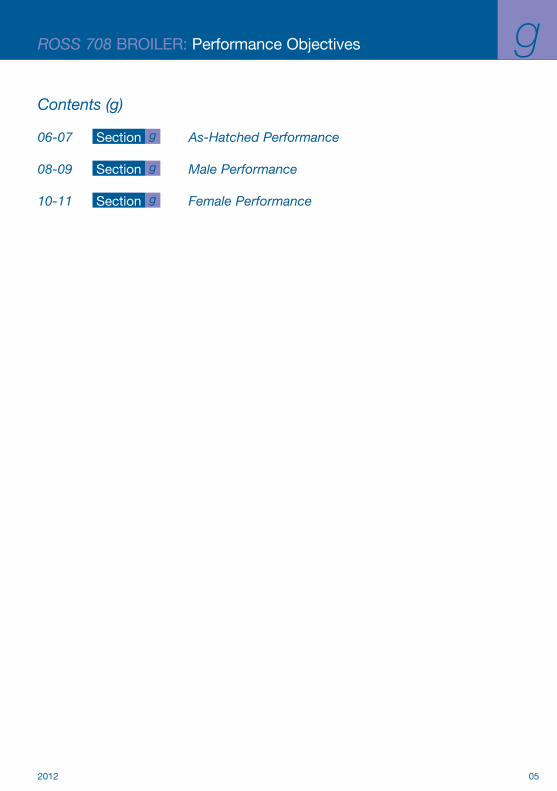
Contents (g)
06-07 As-Hatched Performance
08-09 Male Performance
10-11 Female Performance
gSection
gSection
gSection
g
Day Body weight
(g)1
Daily gain (g)
Av. daily gain/week
(g)
Daily intake (g)
Cum. intake (g)2
FCR3
0 42
1 54 12 12 12 0.221
2 69 15 15 27 0.395
3 85 17 18 45 0.533
4 104 19 22 67 0.643
5 126 21 25 92 0.732
6 150 24 28 120 0.805
7 176 27 19.21 32 153 0.865
8 206 30 36 189 0.916
9 239 33 40 229 0.959
10 274 36 45 273 0.997
11 313 39 49 323 1.031
12 355 42 54 376 1.061
13 399 45 59 435 1.089
14 447 48 38.68 64 499 1.115
15 498 51 69 568 1.140
16 552 54 74 642 1.163
17 609 57 80 722 1.186
18 669 60 86 808 1.208
19 731 62 91 899 1.230
20 796 65 97 996 1.251
21 864 68 59.52 103 1098 1.272
22 934 70 108 1207 1.292
23 1006 72 114 1321 1.313
24 1081 75 120 1441 1.333
25 1158 77 126 1567 1.354
26 1236 79 131 1698 1.374
27 1316 80 137 1835 1.394
28 1398 82 76.36 142 1977 1.414
29 1482 83 148 2125 1.434
30 1566 85 153 2278 1.454
31 1652 86 158 2436 1.474
32 1739 87 163 2599 1.495
33 1827 88 168 2767 1.515
34 1916 89 173 2940 1.535
35 2005 89 86.68 177 3118 1.555
ROSS 708 BROILER: Performance Objectives
06 2012
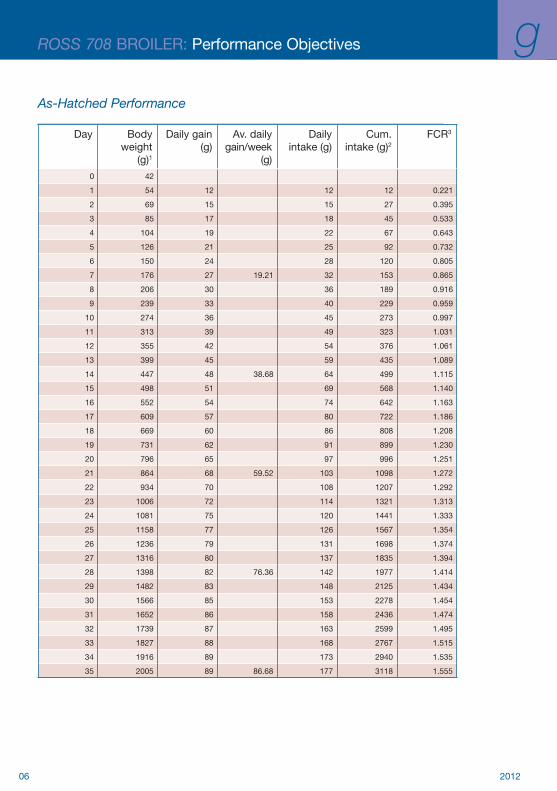
As-Hatched Performance
g
ROSS 308 BROILER: Performance ObjectivesROSS 708 BROILER: Performance Objectives
072012
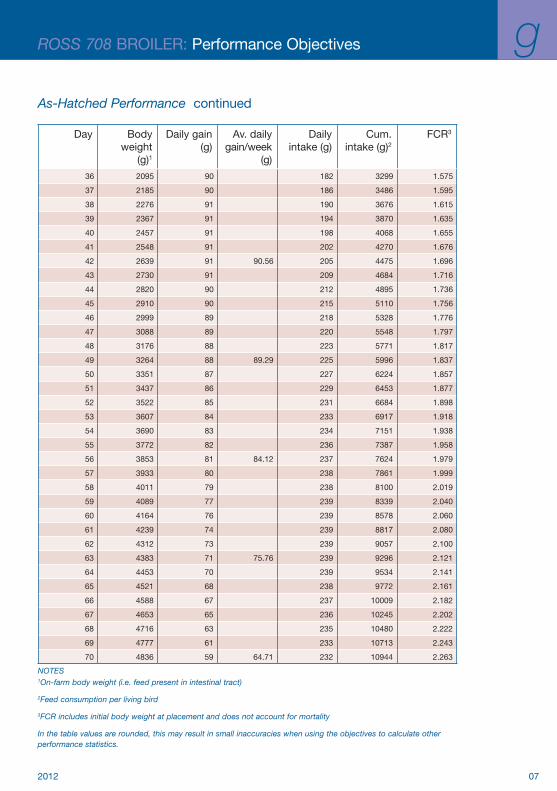
NOTES1On-farm body weight (i.e. feed present in intestinal tract)
2Feed consumption per living bird
3FCR includes initial body weight at placement and does not account for mortality
In the table values are rounded, this may result in small inaccuracies when using the objectives to calculate other performance statistics.
As-Hatched Performance continued
g
Day Body weight
(g)1
Daily gain (g)
Av. daily gain/week
(g)
Daily intake (g)
Cum. intake (g)2
FCR3
36 2095 90 182 3299 1.575
37 2185 90 186 3486 1.595
38 2276 91 190 3676 1.615
39 2367 91 194 3870 1.635
40 2457 91 198 4068 1.655
41 2548 91 202 4270 1.676
42 2639 91 90.56 205 4475 1.696
43 2730 91 209 4684 1.716
44 2820 90 212 4895 1.736
45 2910 90 215 5110 1.756
46 2999 89 218 5328 1.776
47 3088 89 220 5548 1.797
48 3176 88 223 5771 1.817
49 3264 88 89.29 225 5996 1.837
50 3351 87 227 6224 1.857
51 3437 86 229 6453 1.877
52 3522 85 231 6684 1.898
53 3607 84 233 6917 1.918
54 3690 83 234 7151 1.938
55 3772 82 236 7387 1.958
56 3853 81 84.12 237 7624 1.979
57 3933 80 238 7861 1.999
58 4011 79 238 8100 2.019
59 4089 77 239 8339 2.040
60 4164 76 239 8578 2.060
61 4239 74 239 8817 2.080
62 4312 73 239 9057 2.100
63 4383 71 75.76 239 9296 2.121
64 4453 70 239 9534 2.141
65 4521 68 238 9772 2.161
66 4588 67 237 10009 2.182
67 4653 65 236 10245 2.202
68 4716 63 235 10480 2.222
69 4777 61 233 10713 2.243
70 4836 59 64.71 232 10944 2.263

ROSS 708 BROILER: Performance Objectives
08 2012
Male Performance
g
Day Body weight
(g)1
Daily gain (g)
Av. daily gain/week
(g)
Daily intake (g)
Cum. intake (g)2
FCR3
0 42
1 54 13 12 12 0.215
2 69 15 15 27 0.387
3 86 17 18 45 0.523
4 104 19 21 66 0.634
5 126 21 25 91 0.723
6 150 24 28 119 0.797
7 177 27 19.40 32 152 0.858
8 207 30 36 188 0.910
9 240 33 41 229 0.955
10 276 36 45 274 0.994
11 315 39 50 324 1.028
12 358 43 55 379 1.059
13 404 46 60 439 1.087
14 453 49 39.44 66 504 1.114
15 506 53 71 576 1.139
16 562 56 77 653 1.162
17 621 59 83 735 1.185
18 683 63 89 824 1.206
19 749 66 95 920 1.228
20 818 69 102 1021 1.248
21 890 72 62.43 108 1129 1.269
22 965 75 114 1243 1.289
23 1042 77 121 1364 1.309
24 1122 80 127 1491 1.329
25 1205 83 134 1625 1.349
26 1290 85 140 1765 1.368
27 1377 87 146 1911 1.388
28 1466 89 82.34 153 2064 1.408
29 1557 91 159 2222 1.427
30 1650 93 165 2387 1.447
31 1745 94 171 2558 1.466
32 1840 96 176 2734 1.485
33 1938 97 182 2916 1.505
34 2036 98 187 3103 1.524
35 2135 99 95.50 192 3295 1.544

ROSS 308 BROILER: Performance ObjectivesROSS 708 BROILER: Performance Objectives
092012
Male Performance continued
g
NOTES1On-farm body weight (i.e. feed present in intestinal tract)
2Feed consumption per living bird
3FCR includes initial body weight at placement and does not account for mortality
In the table values are rounded, this may result in small inaccuracies when using the objectives to calculate other performance statistics.
Day Body weight
(g)1
Daily gain (g)
Av. daily gain/week
(g)
Daily intake (g)
Cum. intake (g)2
FCR3
36 2235 100 198 3493 1.563
37 2335 101 202 3695 1.582
38 2436 101 207 3902 1.602
39 2538 101 212 4114 1.621
40 2639 102 216 4330 1.641
41 2741 102 220 4550 1.660
42 2842 102 101.07 224 4774 1.679
43 2944 101 228 5001 1.699
44 3045 101 231 5232 1.718
45 3146 101 234 5466 1.738
46 3246 100 237 5704 1.757
47 3346 100 240 5944 1.777
48 3445 99 243 6187 1.796
49 3543 98 100.16 246 6433 1.815
50 3641 98 248 6681 1.835
51 3738 97 250 6931 1.854
52 3833 96 252 7183 1.874
53 3928 95 254 7436 1.893
54 4022 94 255 7692 1.913
55 4114 92 257 7949 1.932
56 4206 91 94.59 258 8207 1.951
57 4296 90 259 8466 1.971
58 4384 89 260 8726 1.990
59 4472 87 261 8987 2.010
60 4558 86 262 9249 2.029
61 4643 85 262 9511 2.049
62 4726 83 263 9774 2.068
63 4808 82 86.07 263 10037 2.088
64 4888 80 263 10300 2.107
65 4967 79 263 10563 2.126
66 5045 77 263 10826 2.146
67 5121 76 263 11088 2.165
68 5195 74 262 11351 2.185
69 5268 73 262 11612 2.204
70 5339 71 75.86 261 11873 2.224

ROSS 708 BROILER: Performance Objectives
10 2012
Female Performance
g
Day Body weight
(g)1
Daily gain (g)
Av. daily gain/week
(g)
Daily intake (g)
Cum. intake (g)2
FCR3
0 42
1 53 11 12 12 0.227
2 68 15 15 28 0.404
3 85 17 19 46 0.542
4 104 19 22 68 0.652
5 125 21 25 93 0.741
6 149 24 28 121 0.812
7 176 27 19.16 32 153 0.871
8 206 29 36 189 0.921
9 238 32 40 229 0.964
10 273 35 44 273 1.001
11 311 38 48 321 1.034
12 352 41 53 374 1.063
13 395 44 57 431 1.091
14 442 46 37.92 62 493 1.117
15 491 49 67 560 1.141
16 542 52 72 632 1.165
17 597 54 77 709 1.188
18 654 57 82 791 1.210
19 713 59 87 878 1.232
20 774 61 92 970 1.253
21 838 64 56.60 97 1068 1.274
22 903 66 103 1170 1.296
23 971 67 108 1278 1.317
24 1040 69 113 1391 1.337
25 1110 71 118 1508 1.358
26 1182 72 123 1631 1.379
27 1256 73 127 1758 1.400
28 1330 75 70.38 132 1890 1.421
29 1406 76 137 2027 1.441
30 1483 77 141 2168 1.462
31 1560 77 146 2313 1.483
32 1638 78 150 2463 1.504
33 1717 79 154 2617 1.524
34 1796 79 158 2775 1.545
35 1875 80 77.86 162 2937 1.566
ROSS 308 BROILER: Performance ObjectivesROSS 708 BROILER: Performance Objectives
112012
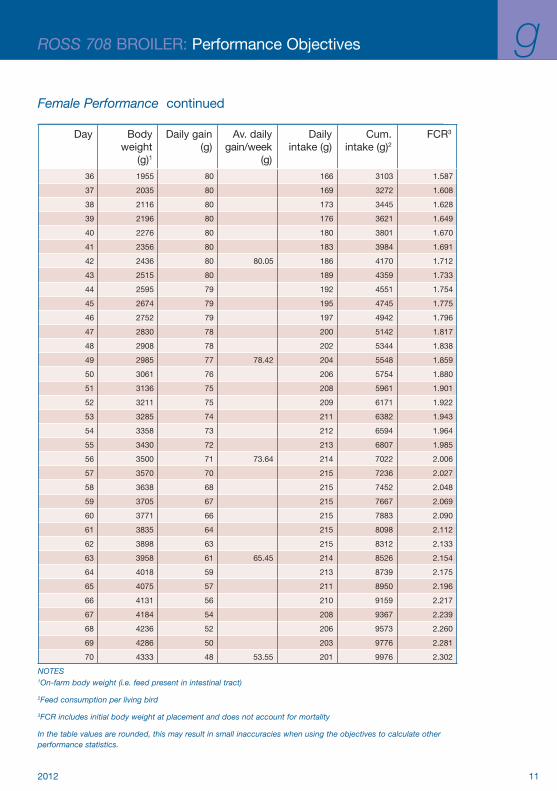
Female Performance continued
g
NOTES1On-farm body weight (i.e. feed present in intestinal tract)
2Feed consumption per living bird
3FCR includes initial body weight at placement and does not account for mortality
In the table values are rounded, this may result in small inaccuracies when using the objectives to calculate other performance statistics.
Day Body weight
(g)1
Daily gain (g)
Av. daily gain/week
(g)
Daily intake (g)
Cum. intake (g)2
FCR3
36 1955 80 166 3103 1.587
37 2035 80 169 3272 1.608
38 2116 80 173 3445 1.628
39 2196 80 176 3621 1.649
40 2276 80 180 3801 1.670
41 2356 80 183 3984 1.691
42 2436 80 80.05 186 4170 1.712
43 2515 80 189 4359 1.733
44 2595 79 192 4551 1.754
45 2674 79 195 4745 1.775
46 2752 79 197 4942 1.796
47 2830 78 200 5142 1.817
48 2908 78 202 5344 1.838
49 2985 77 78.42 204 5548 1.859
50 3061 76 206 5754 1.880
51 3136 75 208 5961 1.901
52 3211 75 209 6171 1.922
53 3285 74 211 6382 1.943
54 3358 73 212 6594 1.964
55 3430 72 213 6807 1.985
56 3500 71 73.64 214 7022 2.006
57 3570 70 215 7236 2.027
58 3638 68 215 7452 2.048
59 3705 67 215 7667 2.069
60 3771 66 215 7883 2.090
61 3835 64 215 8098 2.112
62 3898 63 215 8312 2.133
63 3958 61 65.45 214 8526 2.154
64 4018 59 213 8739 2.175
65 4075 57 211 8950 2.196
66 4131 56 210 9159 2.217
67 4184 54 208 9367 2.239
68 4236 52 206 9573 2.260
69 4286 50 203 9776 2.281
70 4333 48 53.55 201 9976 2.302
12 2012
ROSS 708 BROILER: Performance Objectives
Notes
ROSS 308 BROILER: Performance ObjectivesROSS 708 BROILER: Performance Objectives
132012
lbContents
14-15 As-Hatched Performance
16-17 Male Performance
18-19 Female Performance
lbSection
lbSection
lbSection
ROSS 708 BROILER: Performance Objectives
14 2012
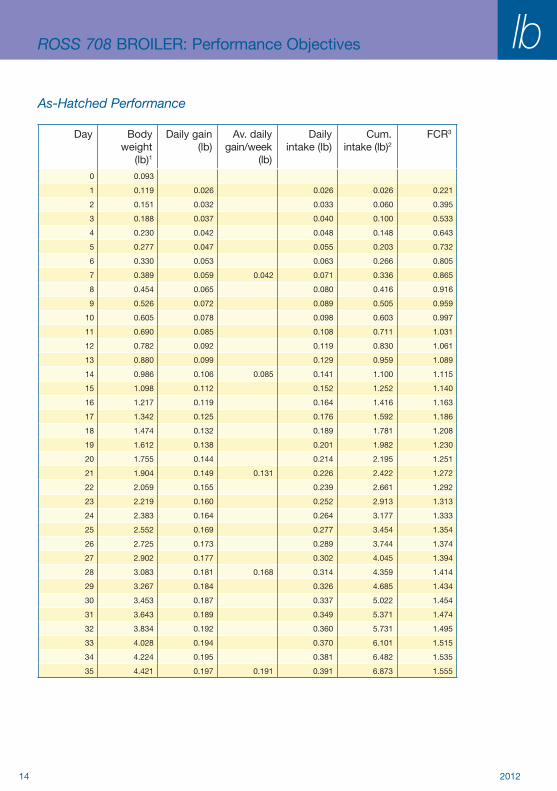
As-Hatched Performance
lb
Day Body weight
(lb)1
Daily gain (lb)
Av. daily gain/week
(lb)
Daily intake (lb)
Cum. intake (lb)2
FCR3
0 0.093
1 0.119 0.026 0.026 0.026 0.221
2 0.151 0.032 0.033 0.060 0.395
3 0.188 0.037 0.040 0.100 0.533
4 0.230 0.042 0.048 0.148 0.643
5 0.277 0.047 0.055 0.203 0.732
6 0.330 0.053 0.063 0.266 0.805
7 0.389 0.059 0.042 0.071 0.336 0.865
8 0.454 0.065 0.080 0.416 0.916
9 0.526 0.072 0.089 0.505 0.959
10 0.605 0.078 0.098 0.603 0.997
11 0.690 0.085 0.108 0.711 1.031
12 0.782 0.092 0.119 0.830 1.061
13 0.880 0.099 0.129 0.959 1.089
14 0.986 0.106 0.085 0.141 1.100 1.115
15 1.098 0.112 0.152 1.252 1.140
16 1.217 0.119 0.164 1.416 1.163
17 1.342 0.125 0.176 1.592 1.186
18 1.474 0.132 0.189 1.781 1.208
19 1.612 0.138 0.201 1.982 1.230
20 1.755 0.144 0.214 2.195 1.251
21 1.904 0.149 0.131 0.226 2.422 1.272
22 2.059 0.155 0.239 2.661 1.292
23 2.219 0.160 0.252 2.913 1.313
24 2.383 0.164 0.264 3.177 1.333
25 2.552 0.169 0.277 3.454 1.354
26 2.725 0.173 0.289 3.744 1.374
27 2.902 0.177 0.302 4.045 1.394
28 3.083 0.181 0.168 0.314 4.359 1.414
29 3.267 0.184 0.326 4.685 1.434
30 3.453 0.187 0.337 5.022 1.454
31 3.643 0.189 0.349 5.371 1.474
32 3.834 0.192 0.360 5.731 1.495
33 4.028 0.194 0.370 6.101 1.515
34 4.224 0.195 0.381 6.482 1.535
35 4.421 0.197 0.191 0.391 6.873 1.555

ROSS 308 BROILER: Performance ObjectivesROSS 708 BROILER: Performance Objectives
152012
As-Hatched Performance continued
lb
NOTES1On-farm body weight (i.e. feed present in intestinal tract)
2Feed consumption per living bird
3FCR includes initial body weight at placement and does not account for mortality
In the table values are rounded, this may result in small inaccuracies when using the objectives to calculate other performance statistics.
Day Body weight
(lb)1
Daily gain (lb)
Av. daily gain/week
(lb)
Daily intake (lb)
Cum. intake (lb)2
FCR3
36 4.619 0.198 0.401 7.274 1.575
37 4.818 0.199 0.410 7.684 1.595
38 5.017 0.200 0.419 8.104 1.615
39 5.217 0.200 0.428 8.532 1.635
40 5.418 0.200 0.437 8.969 1.655
41 5.618 0.200 0.445 9.413 1.676
42 5.818 0.200 0.200 0.452 9.866 1.696
43 6.018 0.200 0.460 10.326 1.716
44 6.217 0.199 0.467 10.793 1.736
45 6.415 0.198 0.474 11.266 1.756
46 6.612 0.197 0.480 11.746 1.776
47 6.808 0.196 0.486 12.232 1.797
48 7.003 0.195 0.491 12.723 1.817
49 7.196 0.193 0.197 0.496 13.219 1.837
50 7.388 0.192 0.501 13.721 1.857
51 7.577 0.190 0.506 14.226 1.877
52 7.765 0.188 0.510 14.736 1.898
53 7.951 0.186 0.513 15.249 1.918
54 8.134 0.183 0.517 15.766 1.938
55 8.316 0.181 0.519 16.286 1.958
56 8.494 0.179 0.185 0.522 16.807 1.979
57 8.670 0.176 0.524 17.331 1.999
58 8.843 0.173 0.526 17.857 2.019
59 9.014 0.170 0.527 18.384 2.040
60 9.181 0.167 0.527 18.911 2.060
61 9.345 0.164 0.528 19.439 2.080
62 9.506 0.161 0.528 19.966 2.100
63 9.663 0.157 0.167 0.527 20.493 2.121
64 9.817 0.154 0.526 21.019 2.141
65 9.968 0.150 0.524 21.543 2.161
66 10.114 0.147 0.522 22.066 2.182
67 10.257 0.143 0.520 22.586 2.202
68 10.396 0.139 0.517 23.103 2.222
69 10.531 0.135 0.514 23.618 2.243
70 10.662 0.131 0.143 0.511 24.128 2.263

16 2012
Male Performance
ROSS 708 BROILER: Performance Objectives lb
Day Body weight
(lb)1
Daily gain (lb)
Av. daily gain/week
(lb)
Daily intake (lb)
Cum. intake (lb)2
FCR3
0 0.093
1 0.120 0.030 0.026 0.026 0.215
2 0.152 0.032 0.033 0.059 0.387
3 0.189 0.037 0.040 0.099 0.523
4 0.230 0.042 0.047 0.146 0.634
5 0.277 0.047 0.055 0.201 0.723
6 0.331 0.053 0.063 0.263 0.797
7 0.390 0.059 0.043 0.071 0.335 0.858
8 0.456 0.066 0.080 0.415 0.910
9 0.528 0.073 0.090 0.504 0.955
10 0.608 0.080 0.100 0.604 0.994
11 0.694 0.087 0.110 0.714 1.028
12 0.788 0.094 0.121 0.835 1.059
13 0.890 0.101 0.133 0.967 1.087
14 0.998 0.109 0.087 0.144 1.112 1.114
15 1.114 0.116 0.157 1.269 1.139
16 1.238 0.123 0.170 1.439 1.162
17 1.369 0.131 0.183 1.621 1.185
18 1.507 0.138 0.196 1.818 1.206
19 1.652 0.145 0.210 2.028 1.228
20 1.803 0.152 0.224 2.251 1.248
21 1.962 0.158 0.138 0.238 2.489 1.269
22 2.127 0.165 0.252 2.741 1.289
23 2.297 0.171 0.266 3.008 1.309
24 2.474 0.177 0.280 3.288 1.329
25 2.656 0.182 0.295 3.583 1.349
26 2.844 0.187 0.309 3.891 1.368
27 3.036 0.192 0.323 4.214 1.388
28 3.233 0.197 0.182 0.336 4.550 1.408
29 3.433 0.201 0.350 4.900 1.427
30 3.638 0.205 0.363 5.263 1.447
31 3.846 0.208 0.376 5.639 1.466
32 4.058 0.211 0.389 6.027 1.485
33 4.272 0.214 0.401 6.428 1.505
34 4.488 0.216 0.413 6.841 1.524
35 4.706 0.218 0.211 0.424 7.265 1.544

ROSS 308 BROILER: Performance Objectives
172012
Male Performance continued
ROSS 708 BROILER: Performance Objectives lb
NOTES1On-farm body weight (i.e. feed present in intestinal tract)
2Feed consumption per living bird
3FCR includes initial body weight at placement and does not account for mortality
In the table values are rounded, this may result in small inaccuracies when using the objectives to calculate other performance statistics.
Day Body weight
(lb)1
Daily gain (lb)
Av. daily gain/week
(lb)
Daily intake (lb)
Cum. intake (lb)2
FCR3
36 4.927 0.220 0.435 7.700 1.563
37 5.148 0.222 0.446 8.147 1.582
38 5.371 0.223 0.457 8.603 1.602
39 5.594 0.223 0.466 9.070 1.621
40 5.818 0.224 0.476 9.545 1.641
41 6.042 0.224 0.485 10.030 1.660
42 6.266 0.224 0.223 0.493 10.524 1.679
43 6.490 0.224 0.502 11.025 1.699
44 6.713 0.223 0.509 11.535 1.718
45 6.935 0.222 0.517 12.051 1.738
46 7.156 0.221 0.523 12.575 1.757
47 7.376 0.220 0.530 13.104 1.777
48 7.595 0.219 0.536 13.640 1.796
49 7.812 0.217 0.221 0.541 14.181 1.815
50 8.027 0.215 0.546 14.728 1.835
51 8.240 0.213 0.551 15.279 1.854
52 8.451 0.211 0.556 15.835 1.874
53 8.660 0.209 0.560 16.394 1.893
54 8.866 0.206 0.563 16.957 1.913
55 9.070 0.204 0.566 17.524 1.932
56 9.272 0.201 0.209 0.569 18.093 1.951
57 9.470 0.199 0.572 18.664 1.971
58 9.666 0.196 0.574 19.238 1.990
59 9.859 0.193 0.576 19.814 2.010
60 10.049 0.190 0.577 20.391 2.029
61 10.236 0.187 0.578 20.969 2.049
62 10.419 0.184 0.579 21.548 2.068
63 10.600 0.181 0.190 0.580 22.128 2.088
64 10.777 0.177 0.580 22.708 2.107
65 10.951 0.174 0.580 23.287 2.126
66 11.122 0.171 0.579 23.867 2.146
67 11.289 0.167 0.579 24.446 2.165
68 11.453 0.164 0.578 25.023 2.185
69 11.614 0.160 0.577 25.600 2.204
70 11.771 0.157 0.167 0.575 26.176 2.224

18 2012
Female Performance
ROSS 708 BROILER: Performance Objectives lb
Day Body weight
(lb)1
Daily gain (lb)
Av. daily gain/week
(lb)
Daily intake (lb)
Cum. intake (lb)2
FCR3
0 0.093
1 0.118 0.025 0.027 0.027 0.227
2 0.150 0.032 0.034 0.061 0.404
3 0.187 0.037 0.041 0.102 0.542
4 0.229 0.042 0.048 0.150 0.652
5 0.277 0.047 0.055 0.205 0.741
6 0.329 0.053 0.063 0.268 0.812
7 0.388 0.059 0.042 0.071 0.338 0.871
8 0.453 0.065 0.079 0.417 0.921
9 0.524 0.071 0.088 0.505 0.964
10 0.601 0.077 0.097 0.602 1.001
11 0.685 0.084 0.106 0.708 1.034
12 0.775 0.090 0.116 0.824 1.063
13 0.871 0.096 0.126 0.951 1.091
14 0.973 0.102 0.084 0.137 1.087 1.117
15 1.082 0.108 0.147 1.235 1.141
16 1.196 0.114 0.158 1.393 1.165
17 1.316 0.120 0.170 1.563 1.188
18 1.441 0.125 0.181 1.744 1.210
19 1.572 0.130 0.192 1.936 1.232
20 1.707 0.135 0.203 2.139 1.253
21 1.847 0.140 0.125 0.215 2.354 1.274
22 1.991 0.144 0.226 2.580 1.296
23 2.140 0.148 0.237 2.817 1.317
24 2.292 0.152 0.248 3.066 1.337
25 2.448 0.156 0.259 3.325 1.358
26 2.607 0.159 0.270 3.595 1.379
27 2.769 0.162 0.281 3.876 1.400
28 2.933 0.164 0.155 0.291 4.167 1.421
29 3.100 0.167 0.301 4.468 1.441
30 3.269 0.169 0.311 4.779 1.462
31 3.439 0.171 0.321 5.100 1.483
32 3.611 0.172 0.330 5.430 1.504
33 3.785 0.173 0.339 5.770 1.524
34 3.959 0.175 0.348 6.118 1.545
35 4.135 0.175 0.172 0.357 6.475 1.566
ROSS 308 BROILER: Performance Objectives
192012
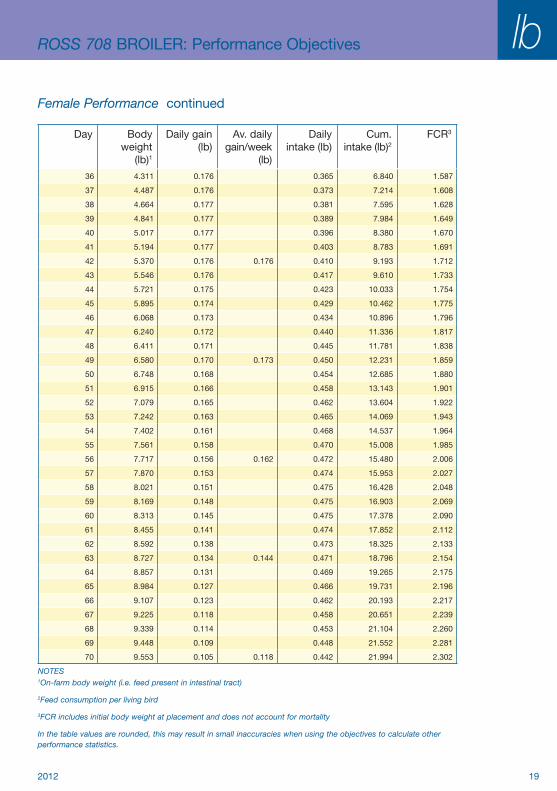
Female Performance continued
ROSS 708 BROILER: Performance Objectives lb
NOTES1On-farm body weight (i.e. feed present in intestinal tract)
2Feed consumption per living bird
3FCR includes initial body weight at placement and does not account for mortality
In the table values are rounded, this may result in small inaccuracies when using the objectives to calculate other performance statistics.
Day Body weight
(lb)1
Daily gain (lb)
Av. daily gain/week
(lb)
Daily intake (lb)
Cum. intake (lb)2
FCR3
36 4.311 0.176 0.365 6.840 1.587
37 4.487 0.176 0.373 7.214 1.608
38 4.664 0.177 0.381 7.595 1.628
39 4.841 0.177 0.389 7.984 1.649
40 5.017 0.177 0.396 8.380 1.670
41 5.194 0.177 0.403 8.783 1.691
42 5.370 0.176 0.176 0.410 9.193 1.712
43 5.546 0.176 0.417 9.610 1.733
44 5.721 0.175 0.423 10.033 1.754
45 5.895 0.174 0.429 10.462 1.775
46 6.068 0.173 0.434 10.896 1.796
47 6.240 0.172 0.440 11.336 1.817
48 6.411 0.171 0.445 11.781 1.838
49 6.580 0.170 0.173 0.450 12.231 1.859
50 6.748 0.168 0.454 12.685 1.880
51 6.915 0.166 0.458 13.143 1.901
52 7.079 0.165 0.462 13.604 1.922
53 7.242 0.163 0.465 14.069 1.943
54 7.402 0.161 0.468 14.537 1.964
55 7.561 0.158 0.470 15.008 1.985
56 7.717 0.156 0.162 0.472 15.480 2.006
57 7.870 0.153 0.474 15.953 2.027
58 8.021 0.151 0.475 16.428 2.048
59 8.169 0.148 0.475 16.903 2.069
60 8.313 0.145 0.475 17.378 2.090
61 8.455 0.141 0.474 17.852 2.112
62 8.592 0.138 0.473 18.325 2.133
63 8.727 0.134 0.144 0.471 18.796 2.154
64 8.857 0.131 0.469 19.265 2.175
65 8.984 0.127 0.466 19.731 2.196
66 9.107 0.123 0.462 20.193 2.217
67 9.225 0.118 0.458 20.651 2.239
68 9.339 0.114 0.453 21.104 2.260
69 9.448 0.109 0.448 21.552 2.281
70 9.553 0.105 0.118 0.442 21.994 2.302
ROSS 708 BROILER: Performance Objectives
20 2012
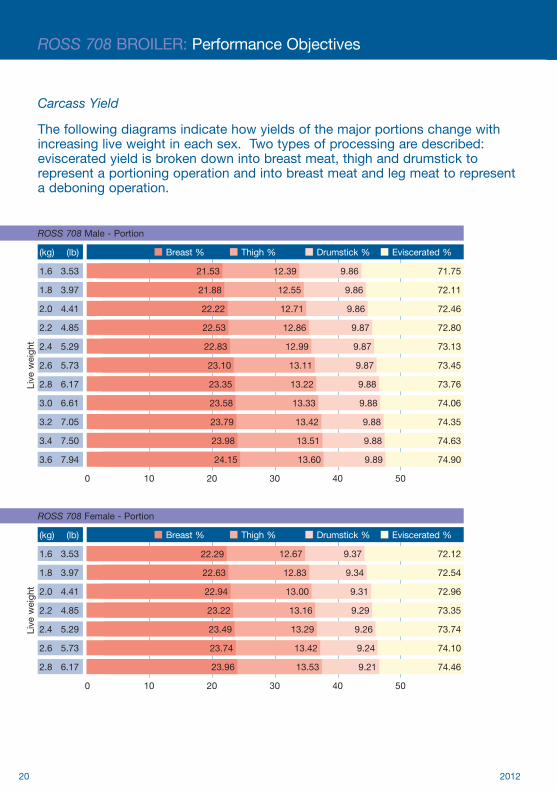
Carcass Yield
The following diagrams indicate how yields of the major portions change with increasing live weight in each sex. Two types of processing are described: eviscerated yield is broken down into breast meat, thigh and drumstick to represent a portioning operation and into breast meat and leg meat to represent a deboning operation.
71.759.8612.3921.53
72.119.8612.5521.88
72.469.8612.7122.22
72.809.8712.8622.53
73.139.8712.9922.83
73.459.8713.1123.10
73.769.8813.2223.35
74.069.8813.3323.58
74.359.8813.4223.79
74.639.8813.5123.98
74.909.8913.6024.15
Breast % Thigh % Drumstick % Eviscerated %
0 10 20 30 40 50
ROSS 708 Male - Portion
72.129.3712.6722.29
72.549.3412.8322.63
72.969.3113.0022.94
73.359.2913.1623.22
73.749.2613.2923.49
74.109.2413.4223.74
74.469.21 13.5323.96
Breast % Thigh % Drumstick % Eviscerated %
0 10 20 30 40 50
ROSS 708 Female - Portion
(kg) (lb)
1.6 3.53
1.8 3.97
2.0 4.41
2.2 4.85
2.4 5.29
2.6 5.73
2.8 6.17
3.0 6.61
3.2 7.05
3.4 7.50
3.6 7.94
(kg) (lb)
1.6 3.53
1.8 3.97
2.0 4.41
2.2 4.85
2.4 5.29
2.6 5.73
2.8 6.17
Live
wei
ght
Live
wei
ght

ROSS 308 BROILER: Performance ObjectivesROSS 708 BROILER: Performance Objectives
212012
37.51
37.96
38.35
38.70
39.05
39.36
39.65
39.93
40.18
40.40
40.60
21.53
21.88
22.22
22.53
22.83
23.10
23.35
23.58
23.79
23.98
24.15
15.98
16.08
16.13
16.17
16.22
16.26
16.30
16.35
16.39
16.42
16.45
Leg Meat % Breast % Total %
0 10 15 20 25 30 35 40
ROSS 708 Male - Debone
37.12
37.53
37.93
38.30
38.63
38.97
39.27
22.29
22.63
22.94
23.22
23.49
23.74
23.96
Leg Meat % Breast % Total %
0 10 15 20 25 30 35 40
ROSS 708 Female - Debone
(kg) (lb)
1.6 3.53
1.8 3.97
2.0 4.41
2.2 4.85
2.4 5.29
2.6 5.73
2.8 6.17
3.0 6.61
3.2 7.05
3.4 7.50
3.6 7.94
(kg) (lb)
1.6 3.53
1.8 3.97
2.0 4.41
2.2 4.85
2.4 5.29
2.6 5.73
2.8 6.17
Live
wei
ght
Live
wei
ght
Definitions of terms:
Eviscerated % eviscerated carcass (without neck, abdominal fat and internal organs) as a percentage of live weight.
Breast % breast meat (without skin and bone removed) as a percentage of live weight.
Thigh/Drumstick % whole thigh/drumstick (with skin and bone in) as a percentage of live weight.
Leg Meat % sum of deboned thigh (without skin) and deboned drumstick (without skin) as a percentage of live weight.
NOTE: These figures represent dry yield. They do not include any moisture retained during chilling or processing. Carcass component yields will vary among processing plants depending on, for example, type of equipment used and the exact portion(s) being produced.
15.31
15.23
15.14
15.08
14.99
14.90
14.83
ROSS 708 BROILER: Performance Objectives
22 2012
Notes

ROSS 308 BROILER: Performance ObjectivesROSS 708 BROILER: Performance Objectives
232012
Notes

2012
Every attempt has been made to ensure the accuracy and relevance of the information presented. However, Aviagen accepts no liability for the consequences of using the information for the management of chickens.
For further information on the management of Ross stock, please contact your local Technical Service Manager or the Technical Services Department.
www.aviagen.com