BROCCOLI/BROCCOLINI REGULAR ANALYSIS YEAR TO 21/02/2015.
21
BROCCOLI/ BROCCOLINI REGULAR ANALYSIS YEAR TO 21/02/2015
-
Upload
magdalene-sharp -
Category
Documents
-
view
217 -
download
3
Transcript of BROCCOLI/BROCCOLINI REGULAR ANALYSIS YEAR TO 21/02/2015.

BROCCOLI/BROCCOLINI REGULAR ANALYSISYEAR TO 21/02/2015

Copy
right
©20
12 T
he N
iels
en C
ompa
ny. C
onfid
entia
l and
pro
prie
tary
.
2
1. Market Overview
2. Demographics
3. Retail Health Situation by State
Agenda
This analysis is part of a vegetable consumer purchase data project funded by HIA using the vegetable levy and matched funds from the Australian Government. This report captures only Fresh Vegetables and excludes processed vegetables (e.g. Fresh Sweet Corn excluding Canned Sweet Corn; Fresh Beans excluding Canned Beans).

Copy
right
©20
12 T
he N
iels
en C
ompa
ny. C
onfid
entia
l and
pro
prie
tary
.
4Copy
right
© 2
014
The
Nie
lsen
Com
pany
. Con
fiden
tial a
nd p
ropr
ieta
ry.
HIGHLIGHTS
RECOMMENDATIONSVolume performance can be improved by enhancing the overall appeal and versatility of Broccoli not just for weekday dinners but for everyday meals as well. Expanding its appeal to broader family groups and Established Couples to regain dwindling shopper base given their high purchase frequency.
Recent March market reports* are pointing improvements in supply of Broccoli, thus easing the price constraint. Ride on this wave to aggressively promote the crop and advertise its uses/versatility.
*https://www.sydneyfresh.com.au/4_fresh-fruit-and-veg-market-update.htm http://fredsfruit.com/market-update/
Broccoli represents 4.3% of value and 4.4% volume market share. Its buyer base has reduced this year, however, they are spending more on Broccoli compared to last year.
Senior and Established Couples are key buyers for Broccoli; together, they account for 45% volume share while representing 42% buyers. Senior Couples have added buyers while their purchase frequency declined.
Larger households (3 or more members) are significant buyers for Broccoli and account for half of its volume sales. All household groups witnessed buyer contraction with 4-member households being the only group who increased their number of shopping trips.
All retailers except IGA have grown in terms of value sales of Broccoli this year. Broccoli declined by -2% in volume sales due to drop in Woolworths, IGA, ALDI and Non-Supermarkets.
Just over 60% of both Woolworths’ and Coles’ shoppers who buy Broccoli, prefer to purchase it at their respective retailers.
NSW, accounts for one-third of the national Broccoli sales and have added 40,266 buying households this year. However, this is offset by significant buyer leakage in QLD.

Copy
right
©20
12 T
he N
iels
en C
ompa
ny. C
onfid
entia
l and
pro
prie
tary
.
5Copy
right
© 2
014
The
Nie
lsen
Com
pany
. Con
fiden
tial a
nd p
ropr
ieta
ry.
Market OverviewBroccoli/Broccolini

Copy
right
©20
14 T
he N
iels
en C
ompa
ny. C
onfid
entia
l and
pro
prie
tary
.
6
Share of Market VolumeTotal VegetablesAustralia
Share of Market ValueTotal VegetablesAustralia
Value market share remains stable at 4.3% for Broccoli, however, volume share reduced down to 4.4%, this year.
Source: Nielsen Homescan
Last year This year
19.4% 19.6%
22.8% 22.4%
10.8% 11.1%
11.0% 10.6%
10.1% 10.1%
5.6% 5.3%
5.6% 5.9%4.9% 5.1%3.1% 3.2%2.2% 2.3%
4.5% 4.4%
Last year This year
36.5% 36.7%
11.4% 11.5%
4.7% 4.5%
14.2% 14.0%
4.2% 4.1%3.9% 4.2%3.0% 3.0%2.4% 2.7%7.8% 7.6%7.5% 7.5%
4.3% 4.3%

Copy
right
©20
14 T
he N
iels
en C
ompa
ny. C
onfid
entia
l and
pro
prie
tary
.
7T. Vegetables Broccoli/Broccol-
iniPotatoes Sweet Corn Carrots Asian Vegetables Zucchini
365.3
20.743.8
13.5 18.3 10.8 12.3
380.5
21.446.1
14.0 18.0 11.4 13.8
T. Vegetables Broccoli/Broccol-ini
Potatoes Sweet Corn Carrots Asian Vegetables Zucchini
99.7
76.3
95.0
54.6
94.5
32.9
64.6
99.6
75.9
94.3
54.4
94.5
32.6
63.3
How many Households buy?
How much (Kg) do they buy per year?
How much ($) do they spend per year?
This YearLast year
Source: Nielsen Homescan
Broccoli witnessed a loss of 31,174 buying households this year along with a decline in their consumption. However, average annual spend has risen substantially compared to last year.
T. Vegetables Broccoli/Broccol-ini
Potatoes Sweet Corn Carrots Asian Vegetables Zucchini
88.9
5.2
21.2
3.210.1
1.6 3.4
87.4
5.1
20.7
3.310.2
1.7 3.2
Copy
right
©20
14 T
he N
iels
en C
ompa
ny. C
onfid
entia
l and
pro
prie
tary
.
8
How much ($) do they spend per occasion?
How much (Kg) do they buy per occasion?
How often do they buy?
Source: Nielsen Homescan
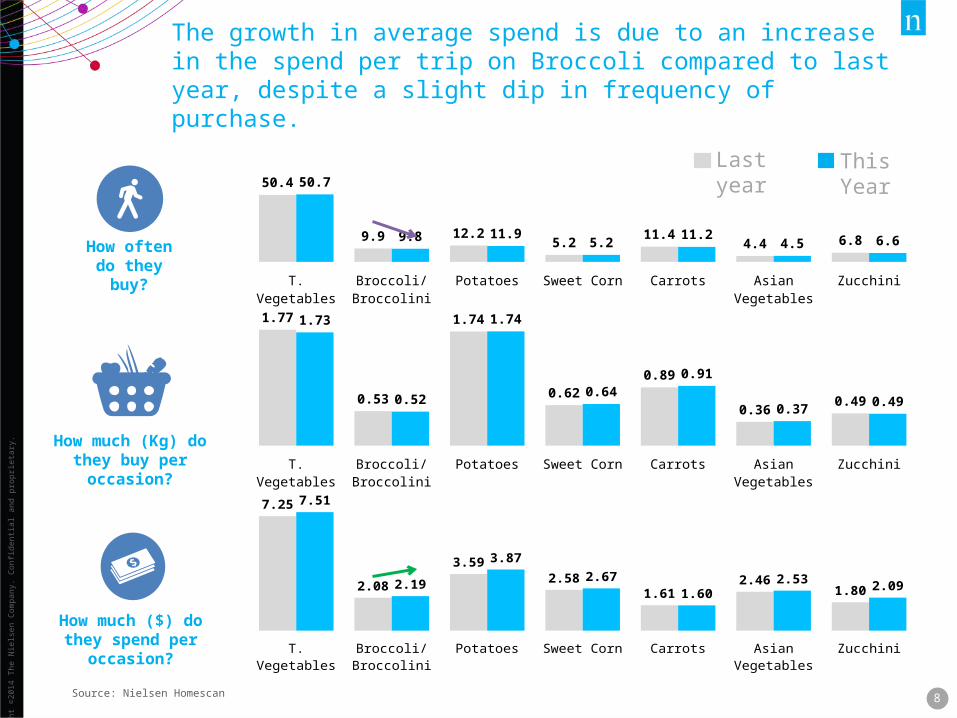
The growth in average spend is due to an increase in the spend per trip on Broccoli compared to last year, despite a slight dip in frequency of purchase.
This YearLast year
T. Vegetables Broccoli/Broccol-ini
Potatoes Sweet Corn Carrots Asian Vegetables Zucchini
50.4
9.9 12.25.2
11.44.4 6.8
50.7
9.8 11.95.2
11.24.5 6.6
T. Vegetables Broccoli/Broccol-ini
Potatoes Sweet Corn Carrots Asian Vegetables Zucchini
1.77
0.53
1.74
0.620.89
0.360.49
1.73
0.52
1.74
0.640.91
0.37 0.49
T. Vegetables Broccoli/Broccol-ini
Potatoes Sweet Corn Carrots Asian Vegetables Zucchini
7.25
2.08
3.592.58
1.612.46
1.80
7.51
2.19
3.87
2.671.60
2.53 2.09

Copy
right
©20
14 T
he N
iels
en C
ompa
ny. C
onfid
entia
l and
pro
prie
tary
.
9Source: Nielsen Homescan
4 W
/E 2
3/03
/201
3
4 W
/E 2
0/04
/201
3
4 W
/E 1
8/05
/201
3
4 W
/E 1
5/06
/201
3
4 W
/E 1
3/07
/201
3
4 W
/E 1
0/08
/201
3
4 W
/E 0
7/09
/201
3
4 W
/E 0
5/10
/201
3
4 W
/E 0
2/11
/201
3
4 W
/E 3
0/11
/201
3
4 W
/E 2
8/12
/201
3
4 W
/E 2
5/01
/201
4
4 W
/E 2
2/02
/201
4
4 W
/E 2
2/03
/201
4
4 W
/E 1
9/04
/201
4
4 W
/E 1
7/05
/201
4
4 W
/E 1
4/06
/201
4
4 W
/E 1
2/07
/201
4
4 W
/E 0
9/08
/201
4
4 W
/E 0
6/09
/201
4
4 W
/E 0
4/10
/201
4
4 W
/E 0
1/11
/201
4
4 W
/E 2
9/11
/201
4
4 W
/E 2
7/12
/201
4
4 W
/E 2
4/01
/201
5
4 W
/E 2
1/02
/201
5
32.6 31.7
38.140.5 40.6 41.8
38.935.4
32.2 33.4
25.830.3 30.2 32.1
37.2 38.5 39.8 38.9
31.8
42.837.5
34.431.1
27.1 29.3 28.0
0.8 0.8
0.90.9 1.0 1.0
0.9
0.9 0.90.8
0.70.8 0.8 0.8
0.8 0.90.9 0.9
0.9
1.00.9
0.80.8
0.8 0.8 0.8
Penetration of households Average volume per household every 4 weeks
Less households are buying Broccoli in the last 4 weeks compared to the same time last year. Their volume consumption has stabilised after peaking in August ‘14.
Kg

Copy
right
©20
14 T
he N
iels
en C
ompa
ny. C
onfid
entia
l and
pro
prie
tary
.
10Source: Nielsen Homescan
4 W
/E 2
3/03
/201
3
4 W
/E 2
0/04
/201
3
4 W
/E 1
8/05
/201
3
4 W
/E 1
5/06
/201
3
4 W
/E 1
3/07
/201
3
4 W
/E 1
0/08
/201
3
4 W
/E 0
7/09
/201
3
4 W
/E 0
5/10
/201
3
4 W
/E 0
2/11
/201
3
4 W
/E 3
0/11
/201
3
4 W
/E 2
8/12
/201
3
4 W
/E 2
5/01
/201
4
4 W
/E 2
2/02
/201
4
4 W
/E 2
2/03
/201
4
4 W
/E 1
9/04
/201
4
4 W
/E 1
7/05
/201
4
4 W
/E 1
4/06
/201
4
4 W
/E 1
2/07
/201
4
4 W
/E 0
9/08
/201
4
4 W
/E 0
6/09
/201
4
4 W
/E 0
4/10
/201
4
4 W
/E 0
1/11
/201
4
4 W
/E 2
9/11
/201
4
4 W
/E 2
7/12
/201
4
4 W
/E 2
4/01
/201
5
4 W
/E 2
1/02
/201
5
32.6 31.7
38.140.5 40.6 41.8
38.935.4
32.2 33.4
25.830.3 30.2 32.1
37.2 38.5 39.8 38.9
31.8
42.837.5
34.431.1
27.1 29.3 28.0
3.4
4.2
3.8
3.12.9 2.8
3.1 3.0
3.7 3.63.8 3.8 3.9
4.3
3.5 3.5 3.53.3
5.0
3.5
2.93.2
3.3 3.23.5
4.5
Penetration of households Average $ spend per household every 4 weeks
The average spend on Broccoli is considerably higher in Feb ‘15 compared to same period an year ago. The average spend is on a consistent upward trend since Oct ‘14.

Copy
right
©20
14 T
he N
iels
en C
ompa
ny. C
onfid
entia
l and
pro
prie
tary
.
11Source: Nielsen Homescan
4 W
/E 2
3/03
/201
3
4 W
/E 2
0/04
/201
3
4 W
/E 1
8/05
/201
3
4 W
/E 1
5/06
/201
3
4 W
/E 1
3/07
/201
3
4 W
/E 1
0/08
/201
3
4 W
/E 0
7/09
/201
3
4 W
/E 0
5/10
/201
3
4 W
/E 0
2/11
/201
3
4 W
/E 3
0/11
/201
3
4 W
/E 2
8/12
/201
3
4 W
/E 2
5/01
/201
4
4 W
/E 2
2/02
/201
4
4 W
/E 2
2/03
/201
4
4 W
/E 1
9/04
/201
4
4 W
/E 1
7/05
/201
4
4 W
/E 1
4/06
/201
4
4 W
/E 1
2/07
/201
4
4 W
/E 0
9/08
/201
4
4 W
/E 0
6/09
/201
4
4 W
/E 0
4/10
/201
4
4 W
/E 0
1/11
/201
4
4 W
/E 2
9/11
/201
4
4 W
/E 2
7/12
/201
4
4 W
/E 2
4/01
/201
5
4 W
/E 2
1/02
/201
5
3.4
4.23.8
3.12.9 2.8
3.1 3.0
3.7 3.6 3.8 3.8 3.94.3
3.5 3.5 3.53.3
5.0
3.5
2.93.2 3.3 3.2
3.5
4.5
2.13
2.552.25
1.851.69 1.66
1.83 1.85
2.26 2.262.53 2.41 2.43
2.66
2.09 2.14 2.11 2.02
3.04
2.021.76
1.94 2.07 2.15 2.25
2.82
1.6 1.6 1.7 1.7 1.7 1.7 1.7 1.6 1.6 1.6 1.5 1.6 1.6 1.6 1.7 1.7 1.7 1.6 1.7 1.7 1.6 1.6 1.6 1.5 1.6 1.6
Average $ spend per household every 4 weeks $ spend per purchase occasion Average purchase occasion every 4 weeks
The rise in average monthly spend on Broccoli is driven by the shoppers spending more in each trip compared to same time last year.

Copy
right
©20
14 T
he N
iels
en C
ompa
ny. C
onfid
entia
l and
pro
prie
tary
.
12
DemographicsBroccoli/Broccolini

Copy
right
©20
14 T
he N
iels
en C
ompa
ny. C
onfid
entia
l and
pro
prie
tary
.
14Source: Nielsen Homescan
Distribution of BuyersAustralia
Distribution of VolumeAustralia
Last Year This Year
7% 7%
11% 10%
15% 14%
9% 8%
18% 18%
23% 23%
18% 19%
Last Year This Year
7% 7%
12% 11%
16% 16%
7% 7%
15% 14%
22% 23%
20% 22%
Senior Couples are 19% of the buyers, yet disproportionately contribute 22% of Broccoli volume sales, further demonstrating growth from last year. Established Couples are also important consumer groups for Broccoli.

Copy
right
©20
14 T
he N
iels
en C
ompa
ny. C
onfid
entia
l and
pro
prie
tary
.
15
How many Households buy?
Note: The difference in the bar heights for same data labels is due to the difference in decimal points. The data has been rounded up to one decimal point. Source: Nielsen Homescan
How often do they buy?
How much (Kg) do they buy per occasion?
ALL SHOPPERS START UP FAM-ILIES
SMALL SCALE FAMILIES
BUSTLING FAMILIES
YOUNG TRANSITION-
ALS
INDEPENDENT SINGLES
ESTABLISHED COUPLES
SENIOR COUPLES
76.384.0 82.0 81.8
73.364.1
78.0 80.675.9 82.8 80.5 80.3 73.463.6
77.7 80.9
ALL SHOPPERS START UP FAM-ILIES
SMALL SCALE FAMILIES
BUSTLING FAM-ILIES
YOUNG TRANSITION-
ALS
INDEPENDENT SINGLES
ESTABLISHED COUPLES
SENIOR COUPLES
9.9 10.2 10.6 10.08.2 8.8
9.811.6
9.8 10.0 10.3 9.98.0 8.4
10.011.3
ALL SHOPPERS START UP FAM-ILIES
SMALL SCALE FAMILIES
BUSTLING FAM-ILIES
YOUNG TRANSITION-
ALS
INDEPENDENT SINGLES
ESTABLISHED COUPLES
SENIOR COUPLES
0.53 0.52 0.56 0.570.52 0.48 0.52 0.510.52 0.51 0.55 0.56 0.55
0.47 0.51 0.52
All lifestages except Senior Couples & Young Transitionals have lost Broccoli buyers this year. Established Couples are the only group to have increased their shopping frequency.
This YearLast year

Copy
right
©20
14 T
he N
iels
en C
ompa
ny. C
onfid
entia
l and
pro
prie
tary
.
16Source: Nielsen Homescan
Distribution of BuyersAustralia
Distribution of VolumeAustralia
Last Year This Year
55% 56%
17% 17%
17% 17%
11% 11%
Last Year This Year
49% 50%
19% 18%
19% 19%
13% 13%
Larger households (3 or more members) are the key buyers as they represent 44% of the buyers yet contribute to half of Broccoli volume sales.

Copy
right
©20
14 T
he N
iels
en C
ompa
ny. C
onfid
entia
l and
pro
prie
tary
.
17
How many Households buy?
How often do they buy?
How much (Kg) do they buy per occasion?
ALL SHOPPERS HH SIZE 1-2 MEMBERS HH SIZE 3 MEMBERS HH SIZE 4 MEMBERS HH SIZE 5+ MEMBERS
76.3 72.080.0 84.2 84.1
75.9 71.979.8 83.0 82.6
ALL SHOPPERS HH SIZE 1-2 MEMBERS HH SIZE 3 MEMBERS HH SIZE 4 MEMBERS HH SIZE 5+ MEMBERS
9.9 9.311.2 10.5 10.49.8 9.2
10.6 10.8 10.1
ALL SHOPPERS HH SIZE 1-2 MEMBERS HH SIZE 3 MEMBERS HH SIZE 4 MEMBERS HH SIZE 5+ MEMBERS
0.53 0.49 0.53 0.560.61
0.52 0.49 0.53 0.540.60
All household sizes have witnessed buyer leakage this year. 4-members households posted the biggest decline in their buyer base but are the only group to increase their purchase frequency.
This YearLast year
Note: The difference in the bar heights for same data labels is due to the difference in decimal points. The data has been rounded up to one decimal point. Source: Nielsen Homescan

Copy
right
©20
12 T
he N
iels
en C
ompa
ny. C
onfid
entia
l and
pro
prie
tary
.
18Copy
right
© 2
014
The
Nie
lsen
Com
pany
. Con
fiden
tial a
nd p
ropr
ieta
ry.
Retail HealthSituation by StateBroccoli/Broccolini

Copy
right
©20
14 T
he N
iels
en C
ompa
ny. C
onfid
entia
l and
pro
prie
tary
.
19
Share by RetailersThis Year Broccoli/Broccolini
Sales vs. Last YearThis year vs. Last yearBroccoli/Broccolini
Other Supermarkets
Non - Supermarkets
Volu
me
Valu
e
Broccoli has grown +5% in value but declined in terms of volume sales, mainly driven by corresponding performance in Woolworths, ALDI and Non Supermarkets.
Source: Nielsen Homescan
25%
4%
10%
8%29%
25%
-1%
0%
-1%
-11%
-7%
6%
-2%
4%
8%6%
-5%
7%
4%5%22%
4%
9%
8%32%
25%
Copy
right
©20
14 T
he N
iels
en C
ompa
ny. C
onfid
entia
l and
pro
prie
tary
.
21
Source: Nielsen Homescan Total Market: AUS Shared to: T. Fresh Frt Veg Dried Frt Nut Condition: Defined Market: AUS Defined Product: T. Fresh Frt Veg Dried Frt Nut Defined Fact: Purchase Value Defined Period: MAT TO 21/02/2015
Copyright © Page 1 of 1
Homescan isights v3.0 .Dictionary v1.5
Source: Nielsen Homescan
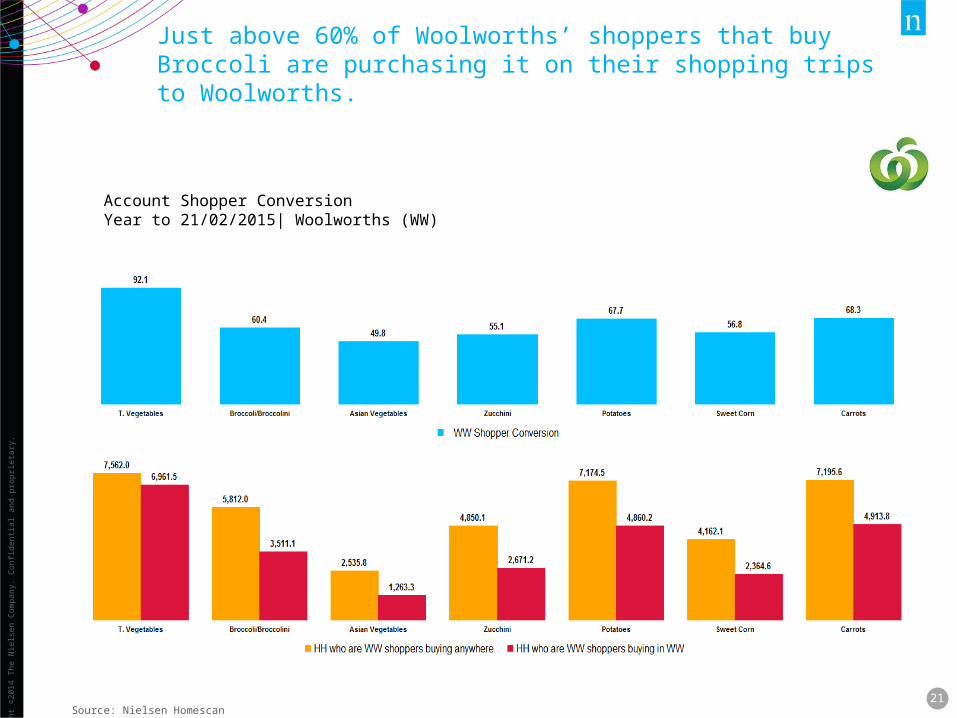
Just above 60% of Woolworths’ shoppers that buy Broccoli are purchasing it on their shopping trips to Woolworths.
Account Shopper ConversionYear to 21/02/2015| Woolworths (WW)

Copy
right
©20
14 T
he N
iels
en C
ompa
ny. C
onfid
entia
l and
pro
prie
tary
.
22
Source: Nielsen Homescan Total Market: AUS Shared to: T. Fresh Frt Veg Dried Frt Nut Condition: Defined Market: AUS Defined Product: T. Fresh Frt Veg Dried Frt Nut Defined Fact: Purchase Value Defined Period: MAT TO 21/02/2015
Copyright © Page 1 of 1
Homescan isights v3.0 .Dictionary v1.5
Source: Nielsen Homescan
The conversion rate for Coles is also similar to that of Woolworths.
Account Shopper ConversionYear to 21/02/2015| Coles

Copy
right
©20
14 T
he N
iels
en C
ompa
ny. C
onfid
entia
l and
pro
prie
tary
.
23
76.6 77.2
5.6 5.7
SA + NT (8%)
VIC (28%)
NSW (32%)
QLD (18%)
WA (11%)
Average KG per Buyer
Penetration this year vs. last year
( ) State share of Broccoli/Broccolini $ sales consumption
Is there a particular State driving the category performance?
Source: Nielsen Homescan
77.1 77.7
5.04.7
76.4 73.8
4.74.3
78.2 73.8
5.35.1
75.2 76.8
5.15.0
Consumption for Broccoli has declined across all the Australian states except VIC.
NSW, accounts for one-third of the total Broccoli sales and has added 40,266 buying households this year. However, this is offset by significant buyer leakage in QLD.

THANK YOU