“Broadband” Plasma Waves in the Boundary Layers - Radio and
102
1 “Broadband” Plasma Waves in the Boundary Layers G. S. Lakhina Indian Institute of Geomagnetism, Colaba, Mumbai - 400 005, India. B.T. Tsurutani Jet Propulsion Laboratory, Pasadena, California, USA H. Kojima, and H. Matsumoto Radio Atmospheric Science Center, Kyoto University, Kyoto, Japan. Short title: BOUNDARY LAYER PLASMA WAVES
Transcript of “Broadband” Plasma Waves in the Boundary Layers - Radio and

1
“Broadband” Plasma Waves in the Boundary Layers
G. S. Lakhina Indian Institute of Geomagnetism,
Colaba, Mumbai - 400 005, India.
B.T. Tsurutani Jet Propulsion Laboratory,
Pasadena, California, USA
H. Kojima, and H. Matsumoto Radio Atmospheric Science Center, Kyoto University, Kyoto, Japan.
Short title: BOUNDARY LAYER PLASMA WAVES

I ? f t
2
Abstract. Boundary layers are commonly encountered in space and astrophysical
plasmas. For example, interaction of solar wind plasma with the planets and comets
produces magnetopause and cometopause boundary layers, respectively. Generally, the
boundary layers are formed when plasmas with different characteristics interact with
each other. The plasma sheet boundary layer in the Earth’s magnetotail is formed due
to the interaction of hot, dense plasma in the plasma sheet region with the rarified
plasma of the lobe region. Boundary layers are the site where energy and momentum is
exchanged between two distinct plasmas. Boundary layers occurring in space plasmas
can support a wide spectrum of plasma waves spanning a frequency range of a few
mHz to 100 kHz and beyond. The purpose of the review is to describe the main
characteristics and the possible generation rnechanisms of the broadband plasma waves
(with frequencies > 1 Hz) observed in the Earth’s magnetopause boundary layer, the
Jovian magnetopause boundary layer, the plasma sheet boundary layer, and in the
Earth’s polar cap boundary layer. The rapid pitch angle scattering of energetic particles
via cyclotron resonant interactions with the waves can provide sufficient precipitated
energy flux to the ionosphere to create the dayside aurora at Earth, and a weak
high-latitude auroral ring at Jupiter. In general, the broadband plasma waves may play
an important part in the processes of local heating/acceleration of the boundary layer
plasma. Recent exciting high time resolution results on the broadband plasma waves
coming from Geotail, Polar and FAST will be discussed.

r 1 r r
3
1. Introduction
The boundary layers in space and astrophysical plasmas are generally formed
when plasmas with different characteristics interact with each other. For example,
interaction of solar wind plasma with the planets and comets produces magnetopause
and cometopause boundary layers, respectively. For the case of the Earth, the
magnetopause boundary is formed by the interaction of the shocked solar wind plasma
in the magnetosheath with the hot plasma in the magnetosphere. The magnetosheath
is a region of shocked solar wind plasma downstream 'of the bow-shock that is formed
ahead of the magnetopasue to deflect the oncoming super-Alfvhic and supersonic
solar wind plasma smoothly around the Earth, as the geomagnetic field forms an an
obstacle in its flow. At the bow shock, the solar wind gets heated and compressed.
Several plasma measurements have identified the existence of a boundary layer, inside
of and adjacent to the magnetopause, consisting of plasma with temperature and flow
properties intermediate between the magnetosheath and the magnetosphere proper
[Hones et al., 1972; Akasofu et ul., 1973; Eastman et al., 1976; Haerendel et al., 19781.
The plasma in this region is a mixture of solar wind/magnetosheath plasma ( H+,
He++) and magnetosphere/ionosphere ( H + , He+, O+). This boundary layer is referred
to as magnetospheric boundary layer [Eastman et al., 1976; Lundzn, 19871. The low
latitude portion of this boundary layer is known as the low latitude boundary layer
(LLBL) and the high latitude part as the high latitude boundary layer (HLBL) which
includes the plasma mantle (PM), entry layer (EL) and the polar cusp (PC) [Hones et
al., 1972; Rosenbauer et al., 1975; Eastman et al., 1976; Haerendel and Paschmann,
19821. On the other hand, the plasma sheet boundary layer is formed due to the
interaction of hot and dense plasma in the plasma sheet region with the rarified plasma
of the lobe region of the magnetotail[Haerendel and Paschmann, 19821. Figure 1 shows
various boundary layers in the Earth's magnetosphere.

4
The magnetopause boundary layer is the region where solar wind energy and
momentum is transferred into the magnetosphere. Two main processes by which the
solar wind plasma can cross the magnetopause are 1) direct entry involving magnetic
reconnection and 2) the cross-field transport due to the scattering of particles by the
waves across the closed magnetopause field lines. Several processes, like impulsive
penetration of the magnetosheath plasma elements with an excess momentum density
[Lemaire and Roth, 1978; Heikkila, 1982; Owen and Cowley, 19911, plasma entry due to
solar wind irregularities [Schindler, 19791, Kelvin-Helmholtz instability [Mzura, 19871,
and plasma percolation due to overlapping of a large number of tearing islands at the
magnetopause [Galeev et al., 19861, have been suggested for the plasma entry across the
magnetopause. We will devote this paper to the topic of diffusion of particles due to
boundary layer waves.
As mentioned above, solar wind plasma can cross the magnetopause and enter
the magnetosphere either by a direct entry due to flow along reconnected, open
field lines or by cross-field transport due to scattering across closed magnetopause
field lines [ Tsurutani and Thome, 1982; Baumjohann and Paschmann, 1987; Lee
et al., 19941. The first process is more likely to be important when IMF is directed
southward, in this case the solar wind and magnetospheric field lines are anti-parallel
and the magnetic reconnection can occur rather easily. Magnetic reconnection, due
to southwardly directed fields lead to 5 to 10 % solar wind ram energy input into the
Earth’s magnetosphere [ Weiss et al., 1992; Gonzalez et al., 19891 during substorms
and storms. However, during northward interplanetary magnetic field (IMF) intervals,
the energy injection due to magnetic reconnection is considerably reduced, and the
waveparticle cross-field transport may become dominant. Tsurutani and Gonzalez
[1995] have estimated that about 0.1 to 0.3 % of the ram energy gets transferred to the
magnetosphere during northward TMF.

5
The boundary layers (BLs) occurring in space plasmas can support a wide spectrum
of waves depending upon their plasma and field properties. In the magnetopause
boundary layer, plasma waves with frequencies less than 1 Hz to 100 kHz and higher
have been observed. These boundary layer waves can play an important role in the
cross-field transport processes. These waves can diffuse the magnetosheath plasma
across the closed magnetospheric field lines at a rate rapid enough to create the low
latitude boundary layer (LLBL) itself [ Tsurutani and Thorne, 1982; Gendm’n, 1979,
1983; Thonze and Tsurutani, 1991; Tsurutani et al., 19971. This would provide a specific
.mechanism for ”viscous interaction” [Axford and Hines, 1961, Eviatar and WoIf, 1968;
Tsurutani and Gonzalez, 19951 in which the solar wind flow enery is transferred to the
magnetosphere. These broadband waves may be important for the cross-scale coupling
[Ashour-Abdalla et al., 1995; Homitz et al., 19961. Tsurutani et al. (19811 have shown
that cyclotron resonant interaction of the LLBL waves with the energetic particles can
put protons and electrons on near-strong to strong pitch angle diffusion to create the
dayside aurora at the Earth, a phenomena that is ever present and is independent
of substorms. The broadband plasma waves have large enough power to explain the
boundary layer formation during non-reconnecting times [ 7keumann et ai., 19911. At the
same time, the magnetopause boundary layer waves may give rise to enough dissipation,
and, thus, act as a trigger for magnetic reconnection to occur [Cattell et al., 19951.
Similar waves have been detected at the Jovian LLBL by the Ulysses magnetometer
and plasma wave instrument [ Tsunltani et al., 19971. Although the Jovian waves are
many order of magnitude less intense than those at Earth, due to the lower boundary
layer field strengths near the Jovian magnetopause, the waves have sufficient intensities
to create the Jovian LLBL from crossfield diffusion of magnetosheath plasma. The
Jovian wave electric and magnetic fields have spectral shapes that are quite similar t o
those at the Earth. .

6
Earlier, broadband electrostatic noise (BEN) has been observed in the neutral sheet
by IMP-7 [Scarf et al., 19741, and in the plasma sheet boundary layer (PSBL) by IMP-8
[Gurnett et al., 19761. These broadband plasma waves have been suggested as the source
. of hot ions in the central plasma sheet (CPS) [Easttnan et al., 19841.
Recent Polar plasma wave observations indicated that similar waves are present on
magnetic field lines that penetrate the LLBL but are near the Polar apogee of 6-8 RE
and also near Polar perigee at - 2 RE [Pickett et al., 1997; Ho et al., 1997; Tsumtani et
al., 19981. The region of wave activity bounds the dayside (05 and 18 MLT, where MLT
is the magnetic local time) polar cap magnetic field lines, thus these waves are called
polar cap boundary layer (PCBL) waves.
Lakhina and Tsurutani [1999a] have sumnlarized the the properties of broadband
plasma waves in the magnetopause and polar cap boundary layers. Here we shall review
the characteristics of high-frequency (wave frequency, f > 1 Hz) broadband plasma
waves observed in the magnetopause boundary at Earth and Jupiter, the polar cap
boundary layer, and in the plasma sheet boundary layer. In all the above three regions,
the waves could play a crucial role in the heating, acceleration and cross-field diffusion
of the electrons and ions. Section 2 describes the broadband plasma waves observed
in the Earth’s magnetopause boundary layer, and their possible role in the cross-field
particle transport which sustains the Imundary layer itself and in the formation of
dayside aurora. Sections 3, 4 and 5 deal with the PCBL waves, the PSBL waves, and
Jovian boundary layer waves, respectively. Various possible generation mechanisms for
the boundary layer waves are discussed in Section 6. Section 7 summarizes the results,
and gives a brief description of the latest results on the high time resolution of the
broadband plasma waves.

7
2. Earth Magnetopause Boundary Layer
2.1. Broadband Plasma Wave Observations
The Earth’s magnetopause represents a complex variable boundary. The ultra-low
frequency (ULF) waves at the magnetopause have been studied by several workers
[ Holzer et al., 1966; Anderson et al., 1968; Curnmings and Coleman, 1968; Smith and
Davis, 1970; Aubry et al., 19711. Thedr long period waves are thought to be generated
either by the magnetopause boundary motions or by the Kelvin-Helmholtz instabilities,
tearing instabilities, or by drift wave type instabilities [Holzer et al., 1966; Miura, 1987;
Sckopke et al., 1981; Lakhina et al., 1993; Anderson, 1995; Lakhina and Schindler, 19961.
Neugebauer et al. [1974] reported whistler-mode waves at the magnetopause using wave
magnetic field measurements from OGO-5. Magnetic waves near the ion cyclotron
frequency ( f b = 1 Hz) were reported by Fairfeld [1976] from IMP 6 magnetic field
measurements. Bahsen [1978] analysed the HEOS-2 magnetic data and showed that the
wave amplitudes, in the frequency range 20 -235 Hz, peaked at the magnetopause, and
the power spectral density falls off with increasing frequency. Here we will focus mainly
on the high frequency plasma waves ( f > 1 Hz) BL waves.
The results on both the plasnla wave electric and magnetic fields in the vicinity of
magnetopar~se were first reported by Gurnett et al. [1979] by using measurements from
the TSEE 1 and 2 spacecrafts. They found that the maximum plasma wave intensities
usually occur at the magnetopause. An example is shown in Figure 2. They observed
magnetic waves in the frequency range of 5.6 to 1 kHz charcterized by a f - 3 . 3 power law
spectrum. The electric field turbulence occurred in the frequency range 5.6 to 100 kHz
and had a featureless spectrum obeying a f -2.2 power law. Typical electric and magnetic
field spectra of the magnetopause boundary layer waves are shown in Figure 3. In a few
cases, Gurnett et al. [1979] could determine the polarization of the wave electric field

8
from the spin modulation of the electric field intensity. In cases where spin modulation
was clearly present, the electric field had perpendicular polarization. Gumett et al.
[1979] suggested that the magnetic waves are whistler modes, and that the electric
component is a superposition of some electrostatic emissions and the electric component
of the whistler mode. From the analysis of 10 ISEE 1 and 2 magnetopause crossings,
Tsurutani et ai. [1981] reported an average magnetic wave spectrum to be 10 j-3.9
nT2 Hz-' for the frequency range of (10 - 1000) Hz. A typical electric waves spectrum
in the frequency range (10 - lo5) Hz was characterized by 3 x 10⁻⁵f-2.8 V2m-2H 2 . -' However, both the spectra varied by an order of magnitude in amplitude from case to
case. Anderson et al. [1982] studied the morphology of plasma waves associated with
the magnetopause, from the magnetosheath to the outer magnetosphere using high time
resolution measurements from ISEE 1 and 2. They found little difference in the plasma
wave characteristics at the magnetopause, in the boundary layer, and in flux transfer
events (FTEs) .
The boundary layer magnetic wave spectrum at frequencies below 11 Hz, during
an unusual event when the magnetopause penetrated to the geosynchronous orbit of
GEOS-2, was analyzed by Gendrin [1983]. The wave intensity was found to decrease
monotonically with increasing frequency which is consistent with the previous ISEE
results a t higher frequencies. Rezeau et al. [1986] extended the work of Gendrin [1983]
and made a comparison of magnetopuse Imundary waves and magnetosheath waves as
shown in Figure 4. The upper panel in Figure 4 is the magnetosheath spectrum for the
3 directional components whereas the lower panel is the same for the magnetopause
boundary layer. The average magnetosheath spectrum is indicated by the dashed line
in the lower panel for easy comparison. Figure 4 clearly indicates that the boundary
layer spectrum is enhanced above the magnetosheath spectrum ( above 1 Hz) and has
a similar frequency dependence. Recently, Rezeau et ai. [1999] have shown that the

9
magnetic fluctuations at the magentopause exhibit power law spectra up to the lower
hybrid frequency.
LaBeZZe and Treumann [1988] analyzed the AMPTE/IRM plasma wave data and
found that the spectrum of electric as well as magnetic fluctuations decreases with
frequency. Figure 5 shows an example of their AMPTE plasma wave data for an unusual
event when the magnetopause boundary layer was pushed into AMPTE distances. The
top panel shows the electric field in a frequency range of 30 Hz - 10 kHz, and the
next panel the 0-16 Hz magnetic fields. The other panels show plasma and ambient
field parameters. The vertical lines indicate the positions of the three magnetopauses.
.The dashed vertical line indicates the location of a diamgnetic structure or a magnetic
"hole" in the magnetosheath region. The plasma waves are clearly enhanced in the last
two crossings. A comparison of many spacecraft observations for the magnetopause
boundary layer waves as summarized by LaBeZZe and Treumann [1988] is shown in Figure
6. Although the figure contains t~~easure~nents from different instruments sampling
different latitudes, local times, and radial distances of the dayside magnetopause
Q for different tim iods, together all of the measurements generally fit power law "
spectra for both electric and magnetic components. The various measurements all agree
with one an other, within an order of magnitude in power, which is the typical variation
of the spectra from one event to another a. found by Tsurutani et aZ. [1981].
From a statistical study of the broadband plasma waves at the magnetopause using
TSEE 1 plasma wave data, Tsurutani et aI. [1989] reported enhanced wave intensities
at 85% of all magnetopause crossing. Although wave amplitudes were highly variable
from event to event, the wave spectra averaged over many passes are remarkably similar
at dawn, noon and dusk local horlrs as seen from Figures 7 and 8. They found that
the average wave intensity has a little or no dependence on latitude ( -2" to +25"),
magnetosheath field strength , or on magnetopause position. The wave were found to be

10
more intense during negative magnetosheath (interplanetary) B, than during positive
B,. Zhu et al. [1996] studied the ELF-VLF waves within the current layer of the dayside
magnetopause using ISEE 1 data. Their database consists of 272 crossings of the
dayside magnetopause from 1977 to 1979. They find a nearly linear relationship between
the local magnetic shear angle and the wave amplitudes (both electric and magnetic
components) as shown in Figure 9. The magnetic shear angle 8 is calculated from the
magnetic field vectors (BI, Bz) from the rnagnetorneter at the starting and ending
times for a given magnetopause crossing, using the formula cos 8 = B I - B2/(1B111B21).
They estimated the phase velocity uph = E(w) /B(w) for different frequency channels by
assutning that the electric perturhations are perpendicular to the propagation direction
(i.e., ambient magnetic field direction). Their dispersion relation for different shear
angles is shown in Figure 10. The dispersion relation has the characteristics of parallel
propagating whistler modes, namely a rising tone and a cutoff at the electron cyclotron
frequency. They, therefore, suggested that the waves are parallel propagating whistler
modes. However, it should he noted that quantitatively the estimated vpuph from the
observed amplitude ratio is 111ore than three times greater than that calculated from the
parallel propagating whistler nlode dispersion relation (cf. curve labelled vw2 in Figure
10). Recently, Song et al. [1998] have found that most of the wave power in the current
layer is in the magnetic fluctuations rather than the electric field fluctuations. Further,
they found a clear correlation hetween the broadband waves and the electron plasma
beta as shown in Figure l la, hut no clear correlation between the wave amplitudes
and the electron anisotropy as seen from Figure l lb . In a case study, Song et al.
[1998] found the wave electric field to be polarized nearly perpendicular to the ambient
magnetic field as found by Gumett et al. [1979].

,
2.2. Cross-Field Diffusion
The magnetopause boundary is more or less a collisionless plasma system. However,
the interaction of broadband plasma waves with the charged particles can cause
scattering of the particles thereby changing particles’ momenta and energies. Thus
wave-particle interactions in a collisionless plasma can play a role similar to direct
particleparticle collisions in a collisional plasma. If there is no particle scattering by
the waves, the magnetosheath ions are not expected to penetrate the boundary to
a distance larger than a Larrrlor radius or so. Since the magnetopause thickness is
generally much greater than an ion Larrnor radius, the particle cross-field transport
due to the waveparticle interaction has been invoked to explain the formation of the
boundary layer.
2.2.1. Resonant wave particle interactions. A particle can interact strongly
with the waves when it senses the wave Doppler-shifted to its cyclotron frequency (or
its harmonics). This process is known as cyclotron resonance. The condition for the
cyclotron resonance between the waves and the particles can t)e written as
where w and kll are the wave frequency and the parallel component of the wave vector
k, VI( is the parallel component of the particle velocity, R = qBo/mc is the cyclotron
frequency of the charged particle, Bo is the magnetic field, q and m are particle charge
and mass, respectively, c is the speed of light, and n is an integer equal 0, f 1, f 2,
- -. The klp~l, term is the Doppler shift effect due to the particle motion relative to the
wave. The case of n = 0 corresponds to the Landau resonance. When condition (1) is
satisfied, the waves and particles rernain in phase, leading t o energy and momentum
exchange between them.
I

.
12
Tsurutani and Thorne [1982] have given general expressions for cross-field diffusion
of electrons and ions via resonant interaction with either electromagnetic or electrostatic
waves. The cross-field diffusion rate due to the magnetic component of electromagnetic
waves can be written as [Tsurutani and Thorne, 1982; Thorne and Tsurutani, 1991;
Tsurutani and Lakhina, 19971
where B is the amplitude of the wave magnetic field at the resonant frequency given by
(l), is a a dimensionless scaling factor indicating what fraction of time the particles
stay in resonance with the waves, and
is the Bohm diffusion rate [Bohm, 19491. Here, denotes perpendicular velocity of the
charged particles relative to the ambient magnetic field Bo.
The cross-field diffusion rate due to the electrostatic waves is given by
where E is the amplitude of the wave electric field at the resonant frequency given by
(I) , and 71 is the magnitude of the particle velocity.
For the boundary layer parameters, Bo M 50 nT, N M 20 cmq3, protons of energies - 1 keV can be in cyclotron resonace with the wave at w/Rp w 1 (ap is the proton
cyclotron frequency), i.e., a t frequencies close to 1 Hz. At these frequencies, B M 5 nT
[Gendrin, 1983; Rezeau et al., 19861, then (2) gives D ~ , B = 260 km2 s” for 1.3 keV
protons. On the other hand, 1 keV electrons will be resonant with the waves at frequency
w - R,/3 (here Re is the electron cyclotron frequency). As there is much less power
at such high frequencies, therefore 1 keV electron diffusion due the cyclotron resonant

13
process will be negligible. The observations of Tsurvtani et al. [1981] indicate amplitude
of broadband electrostatic waves to be - 3 rnV/m near Qp and N 3 x mV/m near
Re. Then, from (4), the cross-field diffusion rates for the magnetosheath plasma ( - 1 keV protons and electrons) due to their cyclotron resonance with the electrostatic
waves are D 1 , E x 4 x lo2 km2 s-' for - 1 keV protons, and D1,E ==: 4 X km2 s-'
for "I keV electrons [Tsurutani and Thome, 19821. Once again the electron diffusion
is insignificant compared to the ion diffusion. It should be noted that theoretical
models of either a viscous momentum transfer [Asford, 19641 or mass diffusion across
the magnetopause [Sonnerup, 19801 require a kinematic viscosity or diffusion coefficient
comparable to lo3 km2 s-l to account for the observed magnetopause boundary layer
thickness. The cross-field diffusion rates for the magnetosheath ions due to resonant
interaction with the electromagnetic or electrostatic waves are comparable to the value
required to maintain the typical thickness of the boundary layer. Since the broadband
waves show significant variability in the power spectral densities for both magnetic and
electric cotnponents [Gurnett et ul., 1979; Tmn~tani et al., 1981; Gendrin, 1983; LaBelle
and Trevmmn, 1988; Tsurutani et d l 19891, this could lead to substantially different
rates of cross-field diffusion thereby explaining the observed variations in the thickness
of the magnetopause boundary layer.
The intense broadband wave in the magnetopause boundary layer can cause rapid
isotropization of both the electron and ion distributions. Tsurutani et al. [1981] found a
strong correlation between intense broadband waves and 1-6 keV electrons and protons.
The observed wave power was found to be sufficient to scatter the 1-6 keV electrons and
protons near the limit of strong pitch angle diffusion. On using the measured spectrum
of the ISEE 1 electrons and ions and integrating from 1 to 10 keV, the precipitated
energy flux into the atmosphere was estimated to be 0.15 erg cm-2 s-'. When the
presence of enhanced ion fluxes at energies from 300 to 500 eV is taken into account,

14
the precipitated energy flux is increased to X 1.0 erg cm”* s-l [ Tsurutani et al., 19891. ,
These numbers are comparable to the dayside auroral energy input. It appears that
resonant cyclotron interactions between the waves and particles in the boundary layer
can provide a reasonable explanation for the nearly continuous presence of dayside
aurora.
2.2.2. Anomalous diffusion from plasma instabilities. A process
complementary to the resonant wave-particle interactions described above, is the
stochastic scattering of particles by microscopic plasma turbulence. This process can
lead to anomalous collision frequency, v,,,, in a collisionless plasma. Current driven
plasma instabilities are found to be the best candidate for generating sufficiently high
anomalous collision frequencies in space plasmas. Two most important sources of free
energy for the excitation of plasma instabilities are the field-aligned currents and the
cross-field currents due to the presence of a plasma density gradient perpendicular
to the magnetic field [LaBeZZe and Treumann, 1988; Thorne and Tsurutani, 19911.
The anomalous collision frequency due to plasma instabilities driven essentially by
field-aligned currents, is typically a fraction of the ion cyclotron frequency, i.e., van N R,
[Dum and Dupree, 1970; Treumann et ul., 19911, whereas it can be substantially higher
for the case of perpendicular current driven instabilites [LaBelle and Treumann, 1988;
Thorne and Tw-utuni, 19911. Anornalorls collision frequencies can be used to estimate
the cross-field diffusion coefficient [Ichimaru, 19731,
where peis the electron gyroradius, and Tp, Te are the respective proton and electron
temperatures. Based on the quasi-linear theory, LaBeZZe and Reumann [1988] derived
a simple general approximate formula for anomalous collison frequencies due to various

15
perpendicular current driven instabilities,
where W = J Wkd3k is the average wave energy density, n. is the plasma density, Vo is
the perpendicular current drift velocity, ^ / n L is the maxinmrl growth rate, wm and IC,
are respectively wave frequency and the wave number corresponding to the maximum
growth. The wave spectral energy density is given by,
where ~ ( L J , k ) is the linear dielectric. constant of the plasma for the wave mode under
consideration, and 6 E k is the linear wave amplitude. The above expressions are quite
general, and applicable to a wider range of nonlinear waves if the dielectric constant and
the amplitude are replaced by their nonlinear counterparts.
Estimates for anomalous diffusion coefficients for four piasma instabilities, namely,
the modified two-stream instability (MTSI), the lower-hybrid drift instability (LHDI),
the ion-acoustic instability, and the electron cyclotron drift instability (ECDI), based
on their nonlinear saturation level as predicted by the quasi-linear theory, indicate
that none of these four instabilities could provide adequate diffusion to maintain the
boundary layer [LaBeZle and Treumann, 19881. G a y and Sgro [1990] and Thome and
Tsurutani [1991) pointed out an error in the estimation of the diffusion coefficient for
the lower-hybrid instability in LaBelle and Treumann [1988]. The corrected estimates
yield diffusion coefficients large enough to explain the thickness of the magnetopause
boundary layer [ Tkeurnann et a!., 1991, 19951. The correct expression for the anomalous
collision frequency for the lower-hybrid instability is reproduced below.
The dielectric constant, ~ ( u , k ) , for the lower hybrid waves is given by [Lakhina and

16
Sen, 1973; Davidson, 1978; Revathy and Lakhina, 19771,
~ ( w , k ) = 1 + W Z H w = 0, k2?& (W - kVD)
where P I t p is the ion (proton) therrnal speed and W L H = wp/(l + w ~ / O ~ ) ' / ~ is the
lower-hybrid frequency. Here we and wp are the electron and proton plasma frequencies,
respectively. Then, from (7) we get,
The solution of (8) yields the maximum growth rate 3;n M ( ~ / ~ ; ; / ~ ) ( V D / I I ~ ~ ) ' W L H and
corresponding w, M k,VD/2. On substituting these in (6), we obtain the following
expression for the anomalous collision frequency for the lower-hybrid instability,
Variation of the theoretical diffusion coefficients versus electric field power for four
electrostatic modes considered b y LaBe22e and Treumann 119881 is shown in Figure
12 (this is a corrected version of their Figure 6 ). An average magnetic field strength
of 50 nT, density n = 10 ternperatrlres T, = 25 eV, Tp = 1 keV have been
nssumed. The dots on each curve show the theoretically derived saturation levels
of the respective instabilities. The vertical line is the upper limit of measured wave
electric field intensity as deduced from the available satellite measurements of ISEE
and AMPTE/IRM spacecraft. The horizontal dashed line gives the required Sonnerup
diffusion limit. It is clear that the diffusion coefficient caused by the LHDI comes
marginally close to Sonnerup diffusion limit. However, the diffusion coefficients from
the rest of the instabilities are too low to be significant for the maintenance of the
low latitude boundary layer. Hence, the LHDI could, in principle, provide sufficiently
high diffusion rates, based on observed wave power, to account for the existence of

17
the LLBL under the conditions when reconnection in the vicinity of the subsolar
stagnation point does not occur. It is interesting to note that all the four electrostatic
instabilities shown in Figure 12, and LHDI in particular, may provide the dissipation
necessary to initiate reconnection at the magnetopause under southward, or inclined
IMF conditions. Observations from ISEE 1 and Geotail also indicate that the amplitudes
of the magnetopause boundary layer waves are large enough to provide the dissipation
required for reconnection to occur [Cattell et al., 19951. Recently, llFeumann [1997]
has suggested that in the region of strong plasma wave activity, particles undergo
Levy flight interactions caused by scale invariant turbulence. Plasmas containing LBvy
flight intractions may possess super- diffusivity which is enahnced over the anomalous.
Therefore, the strong broadband plasma wave activity at the magnetopause may lead
to super-diffusive ( of the order of or even greater than the Bohm diffusion) particle
transport across the magnetopause to populate the inner LLBL.
The lower hybrid drift instability a t the magnetopause has been studied, using a
2D hybrid computer simulation (particle ions, fluid electron with nonzero mass) code,
by Gary and Sgro [1990]. The nlagnetopause wave generation (at low-frequencies, i.e.,
w << OP , as well as a t lower hybrid wave frequencies) and particle transport using a
2D hybrid code with particle ions and massless fluid electrons as been investigated by
Winake and Ornidi [1995] and Wztuke et al. (19951. The free energy source in all the
above computer simulation studies was the density gradient. It is found that lower
hybrid waves could give rise to diffusion comparable to the Bohm rate as required by
Sonnerup [1980] to populate the low latitude boundary layer. However, the diffusion
remained quite localized, meaning that diffusion per se leads only to some local
relaxation of the gradients, and not to the formation of an extended boundary layer.

18
3. Polar Cap Boundary Layer
3.1. Wave Observations
Plasma wave data from the Plasma Wave Instrument (PWT) [Gumett et al.,
1995) on the POLAR spacecraft indicate the presence intense broadband plasma waves
on the polar cap magnetic field lines which map to LLBL. These waves are spiky,
and their frequency dependence and intensities are quite similar to those of the low
latitude boundary layer (LLBL) waves detected at and inside the low latitude dayside
magnetopause (cf. section 2). These waves, therefore, are called polar cap boundary
layer (PCBL) waves [ Tszlrzltani et al., 19971.
Figure 13 shows the POLAR orbit, which has an inclination of 86" with an apogee
of 9 RE and perigee of - 1.8 RE and covers the noon-midnight sector. Under ordinary
circumstances the POLAR spacecraft does not intercept the magnetopause [Pickett et
al., 19971, but as shown in the figure, the spacecraft does cross field lines that map into
the LLBL.
Plate 1 is a frequency-time color spectrogram of the data obtained on April 7, 1996
from the POLAR Plasma Wave Multichannel Analyzer (MCA). This plot covers 24
hours as shown along the horizontal axis, and a frequency range of 5 Hz to 311 kHz,
as shown along the vertical axis. The electric field power spectral density is plotted
according to the color bar to the right of the spectrogram. The Universal Time (UT),
radial distance from the center of the earth (RE) , magnetic latitude (X"), magnetic
local time (MLT), and approximate Lshell value, are indicated at the bottom of the
plot. The wave intervals of interest are indicated by two sets of arrows along the time
axis, and are designated as "Dayside PCBL" and "Nightside PCBL," within Plate 1.
These intervals of intense waves bound magnetic fields that map into the polar cap
region. Both wave events occur in the northern hemisphere near apogee. The dayside

19
PCBL event occurs near 13.0 MLT and the other near 0.3 MLT, as the spacecraft orbit
is in a near noon-midnight orientation. The PCBL waves are characterized by bursts of
"turbulence" covering a broad frequency range extending from f < 10' to 2 X lo4 Hz as
shown in the MCA electric field spectrum of Plate 1 . The magnetic field spectrum for
these waves shows similar bursts (not shown). The region between the dayside PCBL
and the nightside PCBL (about 0555 to 1450 UT) is identified as the northern polar
cap. In this region there is typically a lack of strong signals although a few bursts
of electrostatic noise are seen, as well as auroral hiss (3 kHz) and auroral kilometric
radiation (100 kHz).
Figure 14 shows the fractional amount of time that the waves are present from
March 13 to August 31, 1996 on the dayside (05 to 18 GMT) near POLAR apogee.
During this period the spacecraft apogee was in the northern hemisphere. For this
statistical study, the total number of "crossings" was 254. For each hourly bin, the
number -of passes are indicated, as well as the number of times PCBL waves were
detected. The plot shows that enhanced waves were present 100 % of the time near local
noon with a slightly lower occurrence rate a t dawn and dusk. The overall percentage of
wave occurrence during this tirrle interval was 96 %.
The region of PCBL wave activity is located in a relatively narrow band of latitudes
from 70" to 85" as seen from Figure 15a. The wave location is slightly lower than cusp
field lines. There is a trend for the PCBL waves to extend to. slightly lower latitudes
in both the dawn and dusk sides relative to the noon sector. The PCBL waves occur
predominantly in the region with L - 10 or larger as seen from Figure 15b.
The spectral density plots for both electric and magnetic field are found to have
rough power-law shapes, even though the intensities and spectral shapes vary from
event-to-event. The electric component has on average a f-2*2 frequency dependence,
and th,e wave frequency extends from - 10' Hz to - 2 x lo4 Hz, whereas the wave

20
magnetic component has on average a f - 2 * 7 frequency dependence and appears to have
an upper frequency cutoff at the electron cyclotron frequency. The electric and magnetic
spectra of a typical event occurring near the apogee in the northern hemisphere on day
.98, 1996 at 1302 MLT at 78.8" N invariant rnagnetic latitude is shown in Figures 16.
For this event, the wave frequency of the electric component extends to - 2 x lo4 Hz
(Fig. 16a), and that of the wave magnetic component extends to - 3 x lo3 Hz (Fig.
16b). Note that the electric component of the waves extends to frequencies above the
electron cyclotron frequency. Although it appears that the wave magnetic component
cuts off at the electron cyclotron frequency, fee, this is too close to the noise floor of the
receiver to make any definite determination.
The PCBL waves are found to 11e very bursty when seen in high time resolution
wideband receiver (WBR) data. They last from a few milliseconds to tenths of
seconds, with the latter probably composed of several bursts occurring in succession
or simultaneously [ Tsumtani et ai., 1998~~1. Further, the average power spectra and
the wave intensities for the electric and magnetic components for the events near the
POLAR perigee in the southern hemisphere were found to be similar to those of.the
apogee events in the northern hemisphere.
Figure 17 shows the B / E ratios for two events occurring on Day 98 and 114, 1996.
Two representative curves for the whistler refractive index for parallel propagation ($
= 0") and for oblique propagation (at 1L, = 60") are added for comparison. These curves
a x e calculated from the following expression for the refractive index,r], for the obliquely
propagating whistler waves in a cold uniform plasma:
I
where f = w/27r, and f p = w,/27r are, respectively, the wave frequency and the electron
plasma frequency expressed in Hz, and 1cI is the angle of propagation with respect to the

21
magnetic field direction. The cold plasma density values fluctuated considerably during
the wave events. For example, I?, values varied from 0.7 to 3.8 for day 98, and 0.9
to 6 cm-3 for day 114. The maximum value of Ne has been used while computing the
whistler refractive indices.
It is seen from Figure 17 that the B / E amplitude ratio generally fits the parallel
propagating (@ = 0') whistler wave curve at the lowest frequencies (f < 100 Hz). A t
mid (lo2 Hz < f < lo3 Hz) and high ( f > IO3 Hz) frequencies, the B / E ratio shows
considerable departure from the $J =O" curve and a somewhat better fit with the @ = 60" curve. This clearly indicates that there could be considerable (off-axis) refraction
associated with the higher frequency components. The B / E ratios lie in the range of 10
to 100. Thus, the wave phase velocities range from 3 x lo3 to 3 x IO4 km s-*. These
velocities are much higher than plasma convection speeds meamred in this region of
space, so Doppler shift effects on the phase velocities or on the B / E ratios should be
negligible.
The broadband plasma waves are found to be well correlated with enhanced ion
fluxes ( H s , O+, He+ and H e + + ) , whenever these ions are presents on the PCBL field
lines, as detected by the toroidal inmging mass-angle spectrograph (TIMAS) [Shelley e,!
al., 19951 experiment on POLAR. An example is shown in Plate 2 for April 7 (day 98),
1996. Prior to 0500 UT, the energy and angular distributions of ions reveal primarily
hot quasi-isotropic ion populations characteristic of the dayside magnetosphere. The
energy-latitude(time) dispersion in the H+ and He.++ populations beginning about 0505
and 0530 UT, are characteristic of the entry of rnagnetosheath plasma into the cusp
or boundary layer. The regions of rnost intense wave activity (0500 to 0515 UT ) is
associated with significant changes in the angular distributions in the upflowing O+ ions.
Specifically, in these regions, the upflowing, relatively low energy O+ ions have angular
distributions that are peaked at 50 to 70 degrees relative to the magnetic field direction.

22
They have energies of a few hundred eV. The most probable mechanism for which the
O+ ions can gain significant energy transverse to the local magnetic field is through
interactions with waves. Assuming that heating occurs primarily in the perpendicular
direction, we can estimate the location of the region below the spacecraft. Because
the magnetic field strength falls off roughly as T - ~ and the first adiabatic invariant
mn1/2B is conserved, we can estirnate the 1naxi11111m distance below the spacecraft
where the transverse energy was possibly acquired. For conic angles of 50, 60, and 70
degrees at an altitude typical for these observations (5.5 RE) , the maximum distances
helow the spacecraft where the transverse energy could be acquired are 0.9, 0.5, and 0.2
Earth R a d i i ( R E ) , respectively. These locations are quite close to the spacecraft, so the
energization process is essentially a local one.
3.1.1. Characteristics of PCBL waves. The PCBL waves occur on field lines
that map into or close to the LLBL field lines, and the wave characteristics (cf. Figure
14-17) are quite similar to those of the LLBL waves. An inter-comparison between the
POLAR wave power spectra and the LLBL waves as measured by ISEE-1 and 2 and
GEOS is given in Table 1. The GEOS event, which is much more intense than either
ISEE-1 and -2 or POLAR wave intensities, is somewhat anomalous as it occurred during
a magnetic storm when the magnetopause was pushed in to the spacecraft orbit (6.6
R E ) . It is possible that the extraordinarily high solar wind ram pressure and intense
southward interplanetary magnetic field B,q may have led to unusually high wave power
during this event. Such LLBL wave intensity dependences on interplanetary parameters
have been discussed at Earth and Jupiter by Tsurutani et al. (19891 and Tsurutani et
al. [1997], respectively. Table 1 also lists a spectrum for day 103, 1996 for POLAR when
it was near the southern hemisphere dayside perigee at - 2 RE. We note that the wave
intensities are of the same order a. the high altitude northern hemispherical events.
Table 1 also lists a typical spectrum for the Jovian wave event recorded by Ulysses for

23
comparison.
The main charactersitics of the PCBL waves are summarized below:
1. The PCBL wave regions are located at 70" to 80" invariant magnetic latitude. This
location is just below the cusp fields (75" to 85" latitude) and thus corresponds to
LLBL field lines. The PCBL waves detected at low - 2 RE altitudes are similar
to those detected at high altitudes (6 to 8 RE).
2. The emissions are bursty, but when averaged over longer time intervals, they fit a
rough power law with a f - 2 . 2 dependence for E and f - 2 . 7 dependence for B waves,
on average. The electric component extends from - 10' Hz to - 2 x lo4 Hz and
the magnetic component from - 10' to - 5 x lo3 Hz.
3. The waves have very similar intensities, spectral shapes and E and B dependences
as the LLBL waves. The PCBL waves are similar to the broadband noise on
auroral field lines [Gurnett and Frank, 1977; Gurnett et al., 19841, but unlike the
latter, the PCBL waves do not have any clear peaks at any frequency.
4. The B / E ratio is consistent with the parallel propagating whistler mode waves
for the low frequency (10' - lo2 Hz) component. However, the B / E ratio is often
higher a t mid- (lo2 - lo3 Hz) and high- (lo3 - lo4 Hz) frequencies, consistent with
off-axis propagating waves.
5. The intense noon sector wave events are well correlated with enhanced fluxes of 10
to 200 eV H + , He++ and O+ ions.
A schematic of the magnetic field lines, the PCBL wave locations and the LLBL
wave locations is shown in Figure 18. Although to date such waves have been identified
at only three regions along the field lines (PCBL, LLBL and POLAR near-perigee),
one can argue that the waves most likely exist along the entire length of the field lines

24
provided that the field lines are ”closed” and extend from one hemispherical ionosphere
to the other. The PCBL wave field lines must be configured as indicated in Figure 18,
where they map into the earth’s ionosphere over a broad region of local times. The
three-point intensity (LLBL, POLAR near-apogee, POLAR near-perigee) measurements
put strong constraints on the wave source location. An ionospheric source can be ruled
out because if wave generation occurs in the ionosphere, upward wave propagation
would lead to wave intensity decreases (from POLAR perigee to LLBL location) by
orders of magnitude due to flux tube expansion alone. Wave damping and scattering
would decrease intensities further. Some other possibilities are the magnetosheath
magnetosonic waves couple into LLBL Alfv6n waves [Johnson and Cheng, 19971 and
rnagnetosheath waves that are anlplified at the magnetopause and propagate down the
magnetic field lines [Belmont et al., 19951. However, these wave-coupling mechanisms
would work only for ultra-low-frequency (ULF) waves which are much below the PCBL
broadband plasma wave frequencies. The most likely scenario appears to be the wave
generation by a local source of free energy existing along field lines. Two possible
sources are field-aligned currents and density gradients [Drake et al., 1994a,b; Lakhina
et al., 1997; Lakhina and Tsurutani, 1999111.
4
4. Plasma Sheet Boundary Layer (PSBL)
4.1. Broadband Electrostatic Noise (BEN)
The broadband electrostatic emissions near the neutral sheet were observed during
the substorms, for the first time, by Scurf et al. [1974] using the IMP 7 spacecraft .
Gurnett et al. [1976] showed that such broadband electrostatic emissions are commonly
observed around the plasma sheet. They referred to these emissions as “broadband
electrostatic noise (BEN).” Gumett et al. [1976] reported BEN’S detailed features using

25
the plasma wave data observed by IMP-8, which passes through the magnetotail at
radial distances ranging from about 23 RE to 46 R E . Figure 19 shows a typical spectrum
of BEN reported by Gurnett et al. (19761. BEN usually occurs over a broad range of
frequencies extending from about 10 Hz to a few kHz with intensities ranging from
about 50 pV/m to 5 mV/m. An interesting feature shown in Figure 19 is a quasi-upper
cutoff around a few hundred Hz. Gumett et al. [1976] pointed out that this quasi-upper
cutoff frequency is almost equal to the local electron cyclotron frequency (fcp). They
also noted that the BEN spectra have a lower cutoff at the local lower hybrid resonance
frequency.
The wave features of BEN reported hy Gllrrtett et al. [1976] are summarized as
follows:
1. The noise usually occurs over a broad range of frequencies from very low values up
to the local electron plasma frequency.
2. BEN consists of many discrete hursts lasting from a few seconds to several
minutes.
3. The spectrum shows a marked decrease in intensity at the electron cyclotron
frequency.
4. BEN has a low frequency cutoff c.orresponding to the local lower hybrid resonance
frequency.
5. The electric field is oriented within f 2 0 " from perpendicular to the magnetic field.
6. BEN is commonly observed in the plasma sheet boundary layer with a strong
correlation with high energy ion flows.
Gurnett et al. [1976] found a good correlation between BEN and ion streams
observed in the plasma sheet boundary layer (PSBL). This correlation has lead to many

26
possible theoretical mechanisms for BEN generation. Proposed mechanisms include ion
beam instabilities such as ion-ion two stream instability [e.g., Akimoto and Omidi, 1986;
Schriver et al., 1990; Grabbe, 19871, the ion beam acoustic instability [e.g., Dusenbery
and Lyons, 1985; Omidi, 1985; Akimoto and Omidi, 1986; Ashour-Abdalla and Okuda,
1986a, b; Dusenbery, 1986; Grabbe and Eastman, 1984; Grabbe, 1987; Bun'nskaya
and Meister, 1989, 19901, the Buneman instability [Grabbe, 1985, 19891, and their
combinations [Schriver and Ashour-Abdalla, 1987; Schriver and Ashour-Abdalla, 19901.
Tsutsui et al. [1991] considered ion flow as the plasma bulk flow to provide the Doppler
shift, and they attempted to explain the broad frequency characteristics of BEN by the
Doppler shifted ion acoustic potential bubbles convecting with the plasma bulk flow.
On the other hand, Parks et al. [1984] demonstrated the relation of the BEN
and electron beams based on the observations by ISEEl spacecraft. Further detailed
analyses on the relation of BEN and electron distributions were conducted by Onsager
et al. [1993]. They showed that BEN can be observed in the electron layer of the outer
PSBL without energetic ions. They pointed out that the ion streaming is not essential
for the excitation of BEN, and stressed that BEN ha.. a close relationship to the electron
dynamics.
The above proposed generation rnechanisrns address the destabilization of normal
modes due to ion and/or electron beams. On the other hand, Nishida el al. [1985] have
argued that the high frequency part (f > f c e ) of BEN is not a normal mode. They
suggested the possibility that this high frequency component corresponds to potential
structures picked up very closed to electric field antennas.
In spite of the above observational and theoretical efforts, the clear answers to the
generation mechanism of BEN have not been obtained. The main difficulty in explaining
BEN excitation comes from the broadness of its spectrum. In order to explain this wide
frequency band, scientists had resorted to assuming that several different instabilities

27
were responsible.
4.2. Electrostatic solitary waves
Most of the above observation results and data analyses of BEN were discussed in
the frequency doniain. However, rlsing waveform observations by GEOTAIL, Matsurnoto
et al. [1994] and Kojima et ai. [1994] revealed that BEN involves a series of solitary
bipolar waveforms.
Plate 3(a) shows the frequency-time spectrogram of BEN observed in the PSBL
at (-118 RE, 4.3 RE, 0.7 R E ) on April I , 1993. The coordinate system is GSM. One
can clearly see intense BEN spectra extending all the way to the electron plasma
frequency (fpe - 2 kHz) during the intervals from 13:30 to 13:36 (UT), from 13:41 to
13:53 (UT), from 13:54 to 14:OO (UT) and from 14:12 to 14:22 (UT). Plate 3(b) shows
waveforms observed by the Wave-Form Capture (WFC) receiver a t 13:55:43.241 (UT).
The observed waveforms are completely different from that of incoherent random noise.
The pulse width shown here is about 2 Insec. One of the interesting points shown in
Plate 3(b) is that observed solitary waves detected by the two orthogonally crossed set
of electric field antennas, El, and E“, have coherent structures.
Because the most frequently observed BEN emissions have isolated pulse waveforms
and no obvious corresponding magnetic component, Matsumoto et al. [1994] termed
them “PSBL Electrostatic Solitary Waves (PSBL ESW)” after their waveforms.
However, note that the PSBL ESW mainly contributes to the high frequency portion of
the BEN spectra. Wave amplitudes of the ESW a t lower frequencies as shown in Plate
3, are too small to explain the low frequency component.
Based on the results of detailed analyses Mutsumoto et al. [1994] and Kojzma et
ul. [1997] concluded that ESW correspond to isolated electrostatic potentials traveling
along the ambient magnetic field. The nature of the PSBL ESW are summarized as

. 28
follows:
1. Typical pulse widths are a few milliseconds.
2. The orientation of the electric field is parallel to the ambient magnetic field.
3. The PSBL ESW waveform corresponds to an isolated potential structure flowing
along the ambient magnetic field.
4. The PSBL ESW appear very h r s t y and intermittently. The bursty nature of the
BEN’S high frequency range is due to the bursty nature of the PSBL ESW.
Computer simulations using a one-dirnensionai full particle code succeeded in
reproducing ESW waveforms [Mataurnoto et al., 1994; Ornura el ai., 19941. They
showed that the nonlinear evolution of electron beam instabilities lead to the formation
of isolated electrostatic potentials traveling along the ambient magnetic field. The
re!produced potential structrrres are very stable, and are equivalent to the Bernstein-
Greene-Kruskal (BGK) solution [Bentstein et al., 19571. Omura et al. [1996] extensively
examined several different types of electron bear11 instabilities and found that the most
plausible and realistic generation rrlechanisrr~ of the ESW is the electron bump-on-tail
instability.
Figure 20 shows the time evolrrtion of the l)rrmp-on-tail instability obtained by the
one-dimensional cornputer simulations. The right- and left-panels display the time series
of electron phase diagrams and reduced electron velocity distributions. The vortices
shown in the bottom left panel are electron holes formed by trapped electrons due
to isolated electrostatic potentials, which are generated by the nonlinear evolution of
the bump-on-tail instability. As shown in Figure 20, the energies of trapped electrons
are much smaller than those of background electrons. This means that the isolated
potentials formed do not play a n important role in thermalizing the electrons. This

29
result can he confirmed in the velocity distribution shown in the bottom right panel of
Figure 20.
The ESW explain the high frequency part of the BEN spectra and computer
simulation results strongly suggest that the ESW are the results of the nonlinear
evolution of the electron bump-on-tail instability. However, the ESW do not explain all
of the features of the BEN reported by Guntett et al. [1976]. For example, Gurnett et
al. [1976] reported that the electric field is oriented within f20" from perpendicular to
the ambient magnetic field. This feature cannot he explained by the ESW, because the
electric field orientation of the ESW is alrnost parallel to the ambient magnetic field.
On the other hand, Onsager et al. [1993] reported that the intense high frequency part
of. BEN are oscillating in the parallel direction to the ambient magnetic field. Using
these results, we can conclude that while the high frequency portion of the BEN spectra
correspond to the ESW, the low frequency part of the BEN are different mode waves
from the ESW. The exact mode of the low frequency part is still unclear.
4.3. Scattering of electrons/ions due to the BEN
East7nan et al. [1984] suggested that the source of hot ions in the central plasma
sheet (CPS) are warm ions from the PSBL. The best candidate which is responsible
for scattering ions in the PSBL are the plasma waves. Further, since the most intense
waves in the PSBL is BEN, one can arrive at the speculation that the BEN scatters
the warm ions in the PSBL and the scattered warm ions are convected into the central
plasma sheet (CPS).
As we discussed in the previous section, the high frequency portion of the BEN
consist of the ESW. Further, Omura et al. [1996] demonstrated that the most plausible
generation mechanism of the ESW is the electron-hump-on tail instability. As we can
see in Figure 20, significant scatter of electrons or ions does not take place in the

30
bump-on-tail instability, because the generated potential energies are relatively small to
the background plasma thermal energies. This model predicted by computer simulation
is supported by Geotail observation results. Kojima et al. [I9991 statistically examined
the ESW potential energies using Geotail waveform and plasma measurements and
concluded that potential energies of the ESW are mostly less than 10 eV. The value
of 10 eV is much less than the background ion and electron thermal energies of 1 keV
and 300 eV, respectively. Thus, we can conclude that the ESW, as the high frequency
portion of the BEN, do not have a significant role of scattering PSBL ions/electrons.
There exists the possibility that the low frequency part of the BEN, which carry
most of the wave energy, causes the diffusion of warm PSBL ions. Grabbe and Eastman
[I 9841 and Dusenbery and L p n s [1985] argued that BEN can be generated due to ion
beam instabilities and that the excited electrostatic waves possibly scatter warm ions
in the PSBL. Dusenbery and Lyons [1989] evalllated the ion diffusion coefficients due
to the ion beam instabilities. They solved the unmagnetized dielectric function with
ion beams and showed that ion-sound waves can’be generated under the coexistence of
cold and hot ion beam components. They also examined the parametric dependence of
diffusion rate of ions due to the resonance with excited ion-sound waves, and concluded
that significant diffusion should occur resulting in isotropization of the warm ions in the
PSBL.
The wave mode of the low frequency part of BEN still remains to be explained.
The above discussion on scattering the PSBL ions strongly depend on the wave mode
or the generation mechanism of the BEN’S low frequency component. However, Kojirna
(19981 reported that the waveforms corresponding to the BEN low frequency component
are continuous and that their electric field orientation is almost perpendicular to the
ambient magnetic field. Further, their peak frequencies are almost equal to the local
lower hybrid resonance frequency. These results obtained from Geotail waveform

31
observations are consistent with the BEN characteristics reported by Gurnett et al.
[1976]. These facts are very suggestive to the generation of whistler mode-type waves.
The results from the detailed waveform analyses on the BEN low frequency component
are expected in the near future.
5. Jovian Magnetopause Boundary Layer
The presence of the magnetopause h o n d a r y layer in the Jovian magnetotail has
been inferred from the Voyager measurements [Lunzerotti et al., 1979; Gurnett et al.,
19801. Sonnerup et al. [1981] reported the existence of a boundary layer near the dayside
Jovian magnetopause by analyzing Pioneer 10 and 11 plasma and magnetic field data.
Recently, Bame et al. [1992] have reported the detection of magnetopause boundary
layer using the plasma measurements during Ulysses flyby. Because of solar wind ram
pressure variations, the magnetopause boundary layer wits crossed several times on both
the inbound and outbound portion of the Ulysses flyby trajectory [Phillips et al., 19931,
and this provided a wealth of information on the boundary layer waves.
5.1. Wave Observations
Low-frequency (LF) eiectrornagnetic waves in and near the Jovian magnetosphere
have been reported by several authors [Smith et al., 1976, 1983; Smith and Tsurutani,
1983; Goldstein et al., 1983; Smith and Lee, 1986; Glassrneier et al., 19891. Tsurutani
et al. [1993] were the first to report the enhanced broadband noise in LF frequencies in
a Jovian boundary layer (JBL) using Ulysses magnetometer data [Balogh et al., 1992).
They reported the detection of enhanced electromagnetic waves at the proton cyclotron
frequency, a feature similar to that found by G'endrin [1983] for the Earth's LLBL
waves. The local peak power in the magnetic wave spectrum was found to be - 1 nT2
Hz" occurring at - 2 x lo-' Hz, and a total power of - 10" nT2 was determined

32
assuming a bandwidth of 10" Hz.
Recently, Tsurutani et al. [1997] have reported the plasma wave spectra from
to lo2 Hz for the 14 time intervals of the Ulysses Jovian magnetopause BL crossings
identified'by Phillips et al. [1993]. They cornlined the dc magnetometer (MAG) [ Balogh
et al., 19921 and ac search coil data from Ulysses radio and plasma wave (URAP)
instrument [Stone et al., 19921 to cover the frequency range from essentially dc to ELF
frequencies for the magnetic ( B ) component of the wave. Data from the URAP electric
field sensors were used for the electric ( E ) component of the wave spectra.
Figure 21 shows both the E and B wave for all 14 JBL events. The top 4 panels
show the E spin average 9.3-, 14-, 19-, and 28-HZ channel wave intensities, the next 4
panels show the B spin average wave intensities for the same frequency channels, the
next 2 panels show B 1-min and IO-min variance (taken from dc magnetometer), and the
bottom two panels show the spacecraft location relative to Jupiter. The shaded events
are the BL intervals, the vertical dashed lines indicate the bow shock crossings, and
magnetosheath/BL intervals are shown by horizontal bars in the top panel. Enhanced
wave intensities are sometimes present in frequency channels ranging from 9.3 Hz
(displayed) up to electron cyclotron frequency, - 140 Hz. The signals are more intense
in the lowest frequency channels shown. The nlagnetosheath signals are generally less
intense than those in the boundary layer, a situation similar to that for the Earth's
BL/magnetosheath waves [Gurnett et ai., 1979; Anderson et al., 19821. The waves are
more intense on the outbound pass than the inbound pass. This has been speculated to
be due to the unusually low solar wind ram pressure during the inbound pass.
Power spectra for the B and E waves for the event 10, which was one of the
intense intervals that occurred around 1820 - 1910 UT on day 043, 1992, are shown in
Figure 22. The electric wave spectra is shown in the left-hand panels, and the combined
MAG and URAP magnetic spectra are shown in the right-hand panels. The instrument

33
background noise and the best-fit power law curves for E as well as B waves are also
shown. The E spectrum has a 4.1 x 10⁻⁹f-2.4 V2 1 1 1 - ~ Hz" fit, and is broadbanded
with no obvious peaks within the frequency range shown here, the later property is
typical of all the 14 events shown in Figure 21. The overall combined B spectra for this
event have,a 1.8 x 10⁻⁴f-2.4 V2 r n - * Hz-' fit, and the wave intensities are greatest a t
low-frequencies.
Figure 23 shows the B / E ratio for the event 10 shown in Figure 22. At 1 Hz,
B / E - 200, and the ratio decreases with increasing frequency but increases from 10'
Hz to above lo2 Hz. Overall, the ratio remains relatively constant near the value - 100.
For purely electromagnetic, parallel propagating waves, B / E = 7 = c/V&, where
77 is the refractive index, c is the velocity of light, and V p h is the phase velocity of the
wave. At low-frequencies, Vph - V , , the A l f v h velocity, and 7 decreases with a f -1 /2
dependence as long as f << fce(cf. equation (11)). A typical measured value of the
Alfv6n velocity in JBL is VA = 2.4 x lo7 cm s-I, and this would give 77 = 870. The
measured values of B / E ratio is reasonably close to the theoretical value, given the
errors in the measurements of B and E. The B / E ratio curve in Figure 23 shows a
f - l I 2 dependence for the frequency range of 10' - 10' Hz. However, for 10'- to lo2- Hz
range, the B / E ratio has a positive slope. Since clear E wave signals were not detected
at frequencies above the electron cyclotron frequency (-J 140 Hz), there is a possibility
that the JBL waves might be purely electromagnetic in nature.
A comparison of Jovian waves and the Earth's BL waves is given in Table 1.
The wave power at Jupiter is lower by several orders of magnitude than the Earth's
BL waves. There are, however, several similarities of the waves for the two different
magnetospheres. Both the JBL and the Earth's BL waves have power law type spectra
without any obvious spectral peaks, and the slopes of the electric field spectra are quite
similar. In addition, the measurements of Jovian magnetic field spectral slopes fall
34
within the range of the terrestrial spectral slopes. Further, the Jovian BL waves have
been detected at approximately noon and also at approximately dusk, two different
local time regions. It is quite likely that the waves are present at all locations on the
dayside magnetopause. If this happens to be true, the situation would be the same as
that for the Earth's BL waves [ Ts7~77~tani et al., 19891.
5.2. Cross-field Diffusion and Boundary Layer Formation
Although the intensity of the JBL waves is much smaller than that of LLBL, the
magnitude of the ambient magnetic field is also low at the Jupiter magnetopause BL.
This could lead to appreciable cross-field diffusion of magnetosheath plasma across the
.Jovian magnetopause due to resonant wave-particle interactions. At the JBL, Bo 2 5
nT, and assuming a proton kinetic energy of 1 keV, we get from (3), the maximum
diffusion rate, Dm, = lo5 km2 s". Then, taking the magnetic wave power of - 10"
nT2 at resonance, the cross-field diffusion as calculated from (2), is D l , B M lo3 km2
s-'. Now, for the time scale of cross-field diffusion, Tsurutani et al. [1997] used
the convection time of rnagnetosheath plasrna from the magnetopause nose to the
tlawn/dusk flank. Considering rnagnetosheath flow velocity of 100 km s" and a distance
of 150 RJ (where RJ is the radius of the Jupiter), they obtained a JBL thickness of
10,700 km or N 0.1 RJ thick. This value agrees very well with the measured value of
JBL thickness of 9,100 to 13,000 krn as deterrrlined by Sonnerup et al. [1981] from the
analysis of a Pioneer 10 triple crossing of the Jovian magnetopause/plasma boundary
layer. Assuming a reasonable contraction factor of magnetic fields of N 60 ( I , N SO), the
corresponding latitudinal width at ionosI)here/atrnosphere altitudes would be of - 180
km. This is quite similar to the width of Jovian auroral high-latitude ring measured by
Hubble.

35
5.2.1. Particle precipitation rates. Tsurutani et aI. [1997] considered the
effects of both E and B component of the waves in terms of effectiveness for pitch
angle scattering rates via resonant wave-particle interactions. From the analyses of
the pitch angle diffusion rates due to both the magnetic component and the electric
component of the waves, they found that the JBL waves were intense enough to scatter
1-to 5-keV electrons and I-keV to I-MeV protons onto the :qtrong diffusion limits.
The 10-keV electrons could be scattered to near-strong to weak diffusion limits, while
the higher-energy electrons only to weak diffusion limits. On the other hand, the
lower-energy, < 1-keV plasma could be scattered to strong diffusion limit by the JBL
waves. The energy precipitation rate from the resonant JBL wave-particle interactions
have been calculated by Tsun~tani et al. [1997]. It was found that the total energy of
precipitating ions from 1-keV to 1-MeV is 0.11 erg C I I I - ~ s-l, whereas for electrons in
the same energy range it is 0.02 erg cm-2 s". Thus, a total energy flux of 0.013 erg
cm-2 s-* is associated with the precipitating particles. This energy flux is only sufficient
for a weak high-latitude auroral ring, and not for the main auroral ring which requires
energy deposition rate of - 100- 200 erg C ~ I I - ~ s-l.
6. Generation Mechanisms
The plasma waves observed in the Earth's BL, the Jovian BL, the PSBL, or in the
PCBL are broadbanded with no obvious spectral peaks which could be used to identify
the plasma instabilities exciting these modes. As the boundary layers are the site of
many free energy sources existing simultaneously, it is not an easy t a s k to identify which
free energy source could be dominant for a given event. The changing interplanetary
conditions can further complicate the identification of the free energy source and
relevant plasma instability driven hy it. The gradients in density, temperature, velocity
and magnetic field, sometimes all together, are present at the boundary layers. These

36
gradients could act as sources of free energy for wave generation. In addition, the
boundary layers can support strong currents, particle beams, and anisotropic velocity
space distributions, which again can drive many plasma instabilities.
A number of possible wave modes have been put forth in the literature for the BL
waves. We will mention only some of the important modes briefly here.
6.1. Lower Hybrid Drift Instability
The lower hybrid drift instability (LHDI) is driven essentially by the density
gradients present in the boundary layer [Gary and Eastman, 1979; Huba et ai., 1981;
Revathy and Lakhina, 19771. Gary and Sgro [ 19901, Winske and Omidi [1995] and
Winske et al. [1995] studied the lower hybrid drift instability at the magnetopause
using a 2D hybrid computer simulation (particle ions, fluid electron) code. The LHDI is
basically an electrostatic instability, and the waves are generated near the lower hybrid
wave frequencies. These short wavelength waves could be Doppler-shifted to form a
broadband spectrum. This instability is a plausible candidate that can give rise to
cross-field plasma transport.
6.2. Modified Two Stream and Alfvkn Wave Instabilities
The modified two-stream instability (MTSI) is very similar to the LHDI and is
driven by the presence of both density gradient and the currents [Krall and Liewer, 1971;
McBride et al., 1972; Lakhina and Sen, 1973; Revathy and Lakhina, 1977; Papadopoulos,
19791. Like the lower hybrid drift instability, this instability also leads to anomalous
resistivity and cross-field particle diffusion. The density gradients, whether weak or
strong, are always present in the boundary layers. In addition to exciting MTSI, these
density gradients can also drive low-frequency electromagnetic drift Alfvh wave or drift
kinetic A l f v h wave instabilities in the boundary layers [Chmyrev et al., 1988; Lakhina et

37
al., 1993; Johnson and Cheng, 19971.
in the range of ULF frequencies, and
The frequencies generated by this mechanism fall
therefore the mechanism is suitable for explaining
the lowest frequencies of the broadband wave spectrum.
6.3. Ion-Acoustic Instability
This is the current-driven electrostatic instability. The instability is excited when
the field-aligned drift velocity exceeds the ion-acoustic speed [Kindel and KenneI, 19711.
This instability has been suggested to explain the generation of broadband electrostatic
noise (BEN) in the magnetotail [Gurnett et al., 1976; Akirnato and Omidi, 19861.
However, this instability requires T, >> Ti, a condition which is not met in the boundary
layers. This makes the ion-acoustic instability an unlikely mechanism for the BL waves.
6.4. Ion Cyclotron Instability
This is an electrostatic instability propagating nearly perpendicular t o Bo, and
is driven by the field-aligned currents [Ashour-Abdalla and Thorne, 1977, 1978; Swift,
19771. The instability can occur even when T, - T,. Since sufficiently strong field-aligned
currents are expected to be present in the Earth’s and the Jovian magnetopause BLs as
well as in PCBL, this instability is a good candidate for the generation of BL waves.
The main problem with this instability is that it requires very high harmonics to explain
the observed broadband spectrunl.
6.5. Ion Beam Instabilities
The presence of ion beams in the bohdary layer can give rise to.various type of
electromagnetic and electrostatic instabilities. The electromagnetic instabilities generate
long-wavelength, low-frequency waves, which can be either resonant or nonresonant
with the beam ions [Gary et al., 1984; Verheest and Lakhina, 1991, 19931. On the

38
other hand, the electrostatic modes generate modes at some what higher frequencies
and shorter wavelengths as compared to the electromagnetic modes [Lakhina, 19931.
Various kinds of ion beam-driven modes have been studied to explain the generation of
BEN in the plasma sheet boundary layer [Grabbc: and Eastrr~an, 1984; Dwenbury and
Lyons, 1985; Aki so to and Omidi, 1986; Ashour-Abdalla and Okuda, 1986a, b; Schriver
and Ashour-Abdalla, 19871. In most of these mechanism, the wave power is generally
concentrated towards the lowest frequencies. To explain the wave power at higher
frequencies, one has to invoke strong Doppler shifts as well as some cascade mechanism.
6.6. Electron Beam Instabilities
Field-aligned electron beams have been observed in the plasmasheet boundary
layers (PSBL). The electron beams can excite high frequency electrostatic modes.
From TSEE 1 and 2 particle and wave data, Parks et al. [1984] and Onsager et al.
[1993] have shown that broadband electrostatic noise is closely associated with electron
beams rather than with ion beams. Schriver and Ashour-Abdalla [1989] have studied
electrostatic instabilities driven by a colt1 electron beam streaming relative to a hot
background plasma analytically and also by computer simulation. They found that the
low-frequency waves are excited by the electron-beam driven ion acoustic instability
whereas the high frequency waves are generated by the electron-beam driven electron
acoustic modes. Baumjoharm el al. [1989, 19901 have also discussed the possibility of
high-frequency wave generation by electron beams. Matsumoto et al. [1994] and Ornura
et al. [1996] studied nonlinear evolution of several kinds of electron beam instabilities
by 1D full particle codes. They found that electron beam instabilities evolved into
isolated electrostatic potential structures similar to BGK modes. These structures travel
along the magnetic field and would be observed as electrostatic solitary waves by the
spacecraft.

39
6.7. Loss Cone Instabilities
6.7.1. Whistler Instability. Electrotnagnetic waves of whistler-type can
be generated by the electron loss cone instability which is driven by velocity space
gradients [Kennel and Petschek, 1966). However, the required anisotropy in the electron
distribution function has not been observed for the case of LLBL waves [Gurnett et al.,
19791. Another difficulty with this mechanisrn is to explain the broadband nature of the
BL waves.
6.7.2. Electrostatic Electron Cyclotron Instability. This instability excites
electrostatic emissions with frequencies above the electron cyclotron frequency, e.g.,
(n + i ) f c e ( n being the harmonic number) emission. The instability requires the
presence of a t least two electron populations, narnely, a hot, weak loss-cone component,
and a cold dense component. The hot electron cornponent, which contains regions of
velocity space where Bf /B?l l > 0, provides the free energy for the instability, while
the cold electron component helps destabilization and controls the dispersion of the
waves. The instability is strongest in the vicinity of the cold plasma upper-hybrid
frequency, fuhc [Young et al., 1973; Ashour-AAdalla and Kennel, 1978; Ronmark et al.,
1978; Kennel and Ashour-Abdalla, 19821. The 1)roadband nature of the waves can be
explained by assuming excitation of rnany harrrlonics and strong Doppler shifts. The
main difficulty with this mechanism is that it is difficult t o explain the strongest wave
power at low-frequencies (i.e., f - f c i or smaller).
6.8. Velocity Shear Instabilities
The presence of velocity shear in the boundary layer can excite the Kelvin-Helmholtz
(KH) instability [Chandrasekhar, 19611. The KH instability generates low-frequency (
f << f c i ) , long-wavelength (i.e., A >> p i , where A and pi are, respectively, the wavelength
of the mode and the ion Larmor radius) waves, and it can produce high anomalous

40
viscosity at the magnetopause BL (D’AngeZo, 1973; Mizlra, 1987; Lakhina, 1994; Ganguli
et d., 19941. However, in the presence of field-aligned ion beams with sufficiently
strong velocity shear, a short wavelength kinetic KH instability having frequencies near
ion cyclotron harmonics (f x n f c i , where n is the harmonic number), can be excited
[ Lakhina, 19871.
Similarly, the gradient of the field-aligned current can excite an electrostatic current
convective instability [Drake e2 al., 1994a] and a whistler instability [Drake et al.,
1994b; Drake , 1995; Zhu et a]., 19961. The mechanism of current convective instability
demands thickness of the magnetopalm current layer, L, to be very Barrow such that
L < 6,, where 6, = c/wpe (c and wpr are the speed of light and the electron plasma
frequency, respectively) is the electron skin depth. The whistler instability on the
other hand requires that L < 6i, where 6i = c/w,,, is the ion skin depth. The observed
thickness of the magnetopause is typically several times the ion skin depth. Although all
these mechanisms can explain the strongest wave power at the lowest frequencies, they
suffer from a common drawback as to how to cascade the power upto VLF frequencies.
6.9. Coupled Velocity Shear-Lower Hybrid Instabilities Model
All the models described above consider only one free energy source at a time.
As mentioned above, several free energy sources could simultaneously be present in
the boundary layers. This co~lld couple various modes excited by different free energy
sources, or even lead to some new ruodes altogether. Lakhina and Tmrutani [1999b] have
presented a linear theory for the generation of broadband PCBL plasma waves. The
theory is based on two-fluid equations, is fully electromagnetic and takes into account
the free energy available due to the presence of field-aligned currents, and gradients
in the currents, the plasma densities and the magnetic fields. The dispersion relation
generalizes the dispersion relations for several plasma modes, including the lower hybrid

41
[Gary and Eastman, 19791, the modified-two stream instability [Lakhina and Sen, 19731,
beam modes [Dum, 1989; Lakhina, 19931, current convective and whistler instabilities
[Drake et al., 1994a; Drake, 19951. In general, the beam driven modes, the current
convective and the lower hybrid drift modes are coupled, and the dispersion relation has
to be solved numerically. It is found that density gradients tend to stabilize both the
current convective and the whistler instal>ilities, at the same time these modes develop
real frequencies. On the other hand, sharp density gradients can lead to the excitation
of a lower hybrid drift instability when the hot ions are present in the boundary layer.
Figure 24 shows the dispersion relation for the coupled lower hybrid and current
convective modes in a hot plasma. Here, the equilibrium magnetic field varies along
x-direction, the direction of inhomogeneity, and is directed along the z axis, i.e.,
Bo = & ( x ) z . There is a finite field-aligned current carried by electrons streaming with
a nonuniform velocity V,(z) relative to ions. The waves are propagating obliquely to
the ambient magnetic field in the y-z plane, i.e., the wave vector, k, can be written as
k = k , z + IC, y. The velocity shear is defined as S = (dV,/dx)w;*, pi = 87rnoT,/B,2,
is the ratio of ion pressure to the magnetic field pressure, and a = k,&i/w,, is the
perpendicular wave number normalized by the ion gyroradius p , = V,,/w,. Further,
' IE, = dln no/dx is the inverse of equi1iI)riurrl density gradient, and r ~ g = dln Bo/dz is
the inverse of the ambient magnetic field gradient.
The coupled lower hybrid -current convective modes tend to be stabilized by an
increase in the value of pi (cf. curves 1, 5 and 6). The velocity shear S can have
either a destabilizing or a stabilizing effect on these modes depending on the sign of the
parameter k , / k , (cf. curves 1, 2, 3 and 4).
6.9.1. Physical mechanism of the instability. In the model by Lakhina and
Tssurutani [1998], the density gradients tend to reduce the growth rate of the current
convective and whistler instabilities Since the density gradients provide a free energy

42
source, normally one would expect the density gradients to increase the growth rate of
the instabilities, for example, the modified two-stream and lower hybrid instabilities
discussed above. However, in general, the effect of the,density gradients, or any other
free energy source, could be destaldizing for sorne modes and stabilizing for the others,
depending upon the nature of the excited modes. I t has been shown that density
gradients tend to stabilize the Kelvin-Helmholtz instability which is driven by a velocity
shear [D’AngeZo, 1965; Rome and Briggs, 1972; Catto et al., 1973; H u h , 19811. Both
the current convective and whistler rnodes, like the Kelvin-Helmholtz modes, are driven
by a parallel velocity shear, and therefore their basic nature is expected to be similar to
the latter. Physical mechanism of the velocity shear instability is explained in Figure
25. In a uniform plasma, a perturbation electric field causes the electrons to E x B
drift along z. In the presence of velocity gradients, the convection of the electron flow
71, brings regions of different parallel flow to the sarne magnetic field line [Drake et al.,
1994al. The resultant bunching of electrons along this magnetic field line produces an
electric field which reinforces the initial perturbation, thereby producing an instability .
The presence of a local density gradient would alter the nature of the bunching process.
It introduces perturbations in the electron density, which in turn produce perturbations
in the parallel electron velocity which are in the opposite direction to the perturbations
in uz produced by the velocity gradients. Thus, the presence of density gradients tend
to debunch the electrons along B and reduce growth of the velocity shear modes.
6.9.2. Generation of PCBL waves. The typical real frequencies generated
by the Lakhina and Tsurutuni [1999h] rnodel are in the range of 10 to 400 with the
parameter n lying in the range of 5 5 n 5 50. The plasma density at the Polar apogee
is highly variable. The density can vary from 0.05 to 10 particles ~ m - ~ , or even more
Similarly, the currents can vary considerably during a given pass, and from one pass
to the next. There are indications of vary sharp current gradients ( as narrow as 3 p e ,

43
where pe is the electron gyroradius) in the cusp region. For the PCBL region, typically
wci is N 4 -5 Hz [Russell et al., 1995,. Tsunrtani et ai., 19981, T, - 200 eV, and /?, 5
0.05. The typical ion gyroradius would he pi M 5.0 km. A range of parameters need
to be considered to reflect the variability in the observed plasma and field quantities
near Polar apogee. For example, the values of ",,/kg = (0.01 - 0.2) corresponds to
density gradient scale lengths of L, z (0.5 to 100) km, S = (0.01 - 0.3) translate to
velocity gradients of L, z ( 0.5 - 20) krn on assuming typical energies of 10 eV for the
field-aligned electron l>earns. In view of the above parameters, the plasma rest frame
frequencies of the excited modes would be of the order of 40 to 2000 Hz. In the satellite
frame of reference, this frequency range would be broadened due to Doppler shifts and
this could explain the observed frequency range of the broadband waves. The typical
perpendicular wavelengths associated with the unstable modes would be A I = 2 x / k , = (0.6 - 6.0) km. Since the model describes coupled electrostatic and electromagnetic
modes, the waves excited by the instabilities would have a mixture of electrostatic and
electromagnetic modes, thus, natr~rally explaining an important characteristic of the
PCBL waves.
6.9.3. Generation of Jovian BL waves. Lakhina and Tsurutani [1999b]
model can be applied to explain the Jovian I)orlndary layer waves. Taking typical
parameters for the Jovian boundary layer as Bo = 5 nT, no = 0.1 ~ m - ~ , 7'' = 3 x lo5"
K, and Ti = 5 x lo5" K (although there can be considerable variability in all of these
parameters) [Phillips et al., 1993; Tszlndani et al., 19971, one gets wd = 76 mHz, p , x
133 km, - 0.06, T'/T, = 0.6 and w ~ ~ / w , M 20. Unfortunately, reliable estimates of
the gradients in density and field-aligned currents a t t h e Jovian magnetopause boundary
layer are not available. Assuming that sufficiently strong density, magnetic fields or
current gradients, such that ~ , , / k , = (0.01 - 0.2) and/or S = (0.01 - 0.3), exist in the
JBL, the model would predict excitation of modes with frequencies of about 0.5 Hz to

44
30 Hz in the plasma rest frame with perpendicular wavelengths of 15 to 150 km. This
agrees fairly well with the observed frequency hand ( - to lo2 Hz) of the JBL
waves. Once again the Doppler shifts could broaden the frequency range, thus further
improving the agreement between the prediction of the theory and the observation.
7. Conclusion
We have described the main characteristics of the broadband plasma waves observed
in the Earth's magnetopause BL, Jovian BL, plasma sheet BL, and in the PCBL.
The waves are spiky signals spanning a broad frequency range from less than the ion
cyclotron frequency to probably greater than electron cyclotron frequency. As of now,
the PSBL BEN appears to be electrostatic (i.e., no associated magnetic component has
been' identified unambiguously). On the other hand, the broadband waves observed in
the LLBL, PCBL, and in Jovian LB have both the electric and magnetic components
that on the average follow a rough power law spectral shape. The frequency dependence
and the amplitude ratio B / E suggest that the waves are most likely a mixture of
electrostatic and electromagnetic rnodes.
It appears that the broadband plasma waves discussed here are ubiquitous to the
plasma flow boundary layers. It is interesting to point out that broadband electrostatic
noise (BEN), with frequencies extending from the local lower hybrid frequency up to
the local electron plasma frequency (or even above), has been observed in other regions
of the Earth's magnetospherci not discussed in this review. For example, BEN has been
observed in the magnetotail [ Cattell et al., 1986; Gurnett and Frank, 1977; Matsvmoto
et al., 1994; Kojima et al., 19971, on cusp and auroral field lines [Scarf et ai., 1972;
Gurnett and Frank, 1977; 1978; Pottelette et al., 1990; Dubouloz et al., 1991; Ergun
et aI., 1998a), and in the magnetosheath [Anderson et al., 19821. The magnetotail
BEN emissions are correlated with ion and electron beams, whereas auroral region

45
BEN emissions are usually associated with ion conics and field-aligned electron beams.
Duboulot et al. [1991] have proposed a generation mechanism for auroral field line
BEN in terms of electron acoustic solitons. The waveform observations by the plasma
wave instrument on board the Geotail spacecraft have shown that BEN consists of
a series of bipolar solitary pulses [Matsutnoto et al., 19941. As discussed earlier, the
hroadness of the BEN frequency spectra arises from the solitary waveforms. A likely
generation mechanism for BEN is based on the nonlinear evolution of the electron beam
instabilities leading to the formation of the isolated Bernstein-Greene-Kruskal (BGK)
potential structures which reproduce well the observed electrostatic solitary waveforms
[ Omura et al., 1996; Kojzrna et al., 1997).
The high time resolution meassrlrements of the broadband plasma waves in the
PCBL region by Polar and in the auroral ionosphere by FAST have just started to
come out, and they have given very useful information on the fine structure of the BL
waves. Recent results on the PCBL wave using the high time resolution of the POLAR
shown in Figure 26 indicate the presence of large anlplitude bipolar pulses (bpp) in the
parallel electric component of the wave, similar to PSBL BEN, a t high altitudes (- 6
RE) [Franz et ai., 1998; Tsvrutani et al., 1998bl as well as low altitudes (W 1-2 R E )
[Mozer et al., 19971. There are magnetic signatures associated with these electric pulses.
Offset bipolar pulses (obpp), where the positive pulse does not follow immediately after
the negative pulse, but are delayed somewhat, are also seen in this figure. Further,
the monopolar pulses (mpp) in the parallel electric field component are seen in the
right-hand inset of Figure 26. The monopolar pulses are found to alternate between
one polarity and the opposite polarity, and to occur in pairs. These three types of
parallel electric field (bipolar, offset bipolar and monopolar) structures can be explained
by a 1-D model of the spatial distribution of charges involving an electron hole and
neutralizing charge as sketched in Figure 27. The spacecraft flying through the center

46
of this spatial distribution of charge would see the electric field signatures detected by
Polar. The charge distribution of the left panels, i.e., an electron hole plus surrounding
neutralizing charge, would result in the observed bipolar structure [Franz et al., 1998;
Tsurutani et al., 1998bl. The middle panels show a n offset bipolar structure and a
possible charge distribution, essentially a broadened electron hole due to dispersion,
that could give rise to the observed obpp electric fields. The right panels show a pair
of monopolar pulses (mpp) that can result from the charge distribution consisting of a
split electron hole and the neutralizing charges [Tsurutani et al., 1998b]. It has been
shown theoretically that hole splitting can occur due to the interaction of holes with
density gradients [Mohan and Buti, 19791.
Similarly, recent measurements from FAST [Ergun et al., 1998a, b] have revealed
the presence of intense localized electrostatic wave structures at altitudes of 2000 to 4000
k m on the auroral field lines. Muschietti e2 al. [1999] have interpreted these solitary
structures [Ergun et al., 1998a, 1998bI in terms of BGK phase-space electron holes
drifting along the magnetic field lines. Goldrnar~ et al. [1999] have given an explanation
for these bipolar structures in terms of nonlinear two-stream instabilities, a mechanism
similar to that of PSBL BEN proposed by [Omura et al., 1996; Kojima et al., 19971.
We would like to point out that the mechanism discussed by Dubouloz et al. [1991]
predict negatively charged structures whereas the Geotail [Matsumoto et al., '19941,
the POLAR [Franz et al., 19981 as well as FAST [Ergun et al., 1998a,b] observations
indicate positively charged flowing potential structures. It is important to note that
a potential structure, whether positive or negative, must inherently be a part of some
nonlinear wave where the charges are trapped, otherwise it would rapidly disrupt due
to the repulsive forces of the charges. Depending on the free energy available, some of
the instabilities discussed in the previous section could evolve nonlinearly into solitary
waves, for example, whistler-type solitons. If this happens it would naturally explain the

47
recent observations on the waveforrn of the coherent structures (including the associated
magnetic component ,if any) as reported by POLAR [Mozer et al., 1997; Franz et
al., 1998; Tsurutani et al., 1998b] and FAST [Ergun et al., 1998a, b] teams. Further
analyses of the high time resolution plasma and wave data from Polar, FAST and
Geotail would advance our knowledge about the generation and saturation mechanisms
of the BL waves as well as about their fine structures. This would lead to better
understanding about the BL waves and their. role in cross-field particle diffusion leading
to the formation of the boundary itself, and in the process of heating/acceleration and
precipitation of the BL plasma causing the dayside aurora.
Acknowledgments. A part of this research effort was performed at the Jet Propulsion
Laboratory, California Institute of Tecllnology, Pasadena, under contract with the National
Aeronautics and Space Administration. The research in Kyoto University was supported by
Grant-in-Aid 10044081 from the Japanese Ministry of Education, Science, and Culture. The
research at Indian Institute of Geornagnetisln, Mutnbai was supported by the Department of
Science and Technology, Government of India.

48
References
Akasofu, S.-I., E. W., Hones, Jr., S. J. Bame, J. R. Asbridge, A. T. Y . Lui, Magnetotail and
boundary layer plasma at geocentric distance of 18 RE: Vela 5 and 6 observations, J .
Geophys. Res., 78, 7257, 1973.
Akitnoto, K. and N. Omidi, The generation of broadband electrostatic noise by an ion beam
in the magnetotail, Geophys. Res. Lett., 13, 97, 1986.
Anderson, K.A., Binsack, J.H., and Fairfield, D.H., Hydromagnetic disturbances of 3 to 15
minute period on the magnetopause and their relation to Bow Shock Spikes, J. Geophys.
Res., 73, 2371, 1968.
Anderson, R.R., C.C. Harvey, M.M. Hoppe, B.T. Tsurutani, T.E. Eastman, and J. Etcheto,
Plasma waves near the magnetopause, J, Geophys. Res., 87, 2087, 1982.
Anderson, B.J., ULF signals observed near the magnetopause in Physics of the magnetopause,
AGU Monograph 90, edited by P. Song, B.U.O. Sonnerup, and M.F. Thomsen, AGU,
Washington, D.C., p. 269, 1995.
Ashour-Abdalla, M. and C. F. Kennel, No~lconvective and convective electron cyclotron
harmonic instabilities, J . Geophys. Res., 83, 1531, 1978.
Ashour-Abdalla, M. and R. M. Thorne, The itnportance of electrostatic ion cyclotron
instability for quiet-time proton auroral precipitation, Geophys. Res. Lett., 4 , 45, 1977.
Ashour-Abdalla, M. and R. M. Thorne, Towards a unified view of diffuse auroral precipitation,
J. Geophys. Res., 83, 4775, 1978.
Ashour-Abdalla, M., and H. Okuda, Electron acoustic instabilities in the geomagnetic tail,
Geophys. Res. Lett., it 13, 366-369, 1986a.
Ashour-Abdalla, M. and H. Okuda, Theory and simulations of broadband electrostatic noise
in the geomagnetic tail, J. Geophys. Res., 91, 6833-6844, 1986b.
Ashour-Abdalla, M., T. Chang, and P. Dusenbury, eds., Space Plasmas: Coupling Between
Small and Medium Scale Processes, Geophys. Mono., Vol. 86, 1995.
Aubry, M.P., M.G. Kivelson, and C. T. Russell, Motion and structure of the magnetopause, J.

49
Geophys. Res. 76, 1673, 1971.
Axford, W. I. and C. 0. Hines, A unifying theory of high-latitude geophysical phenomena and
geomagnetic storms, Can. J . Phys., 39, 1433, 1961.
Axford, W. I., Viscous interaction between the solar wind and the earth's magnetosphere,
Planet. Space Sci., 13, 45, 1964.
Bahnsen, A., Recent techniques of observations and results from the magnetopause regions, J.
Atmospheric Terrest. Phys. 40, 235, 1978.
Balogh, A. T., J. Beek, R. J .Forsyth, P. C. Hedgecock, R.J.Marquedant, E.j.Smith,
D.J.Southwood and B.T.Tsurutani, The magnetic field investigation on the Ulysses
mission : Instrumentation and preliminary scientific results, Astmn, Astmphys. Suppl.
Ser., 92, 221, 1992.
Bame, S. J., B. L. Barraclough, W. D. Feldtnan, G.R.Gisler, J.T. Gosling, D.J.McComas,
J.L.Phillips, and M.F.Thotnset1, Jupiter's magnetosphere : Plasma description from the
ulysses flyby, Science, 257, 1539, 1992.
Baumjohann, W., and G. Pasclln~ann, Solar wind n~agnetosphere coupling, Processes and
Observations, Phys. Scripta, 7'18, 61, 1987.
Baumjohann, W., R. A. Treumann, J. LaBelle, and R. R. Anderson, Average electric wave
spectra across the plasma sheet and their relation to ion bulk speed, J. Geophys. Res.,
94, 15221, 1989.
Baumjohann, W., R. A. Treumann,
plasma sheet: dependence on
1990.
and J. LaBelle, Average electric wave spectra in the
ion density and ion beta, J. Geophys. Res., 95, 3811,
Belmont, G. F. bbeac , and L. Rezeau, Resonant amplification of magnetosheath MHD
fluctuations at the magnetopause, Geophys. Res. Let., 22, 295, 1995.
Bernstein, I. B., J. M. Greene, and M. D. Kruskal, Exact nonlinear plasma pscillations, Phys.
Rev., 108, 546-550, 1957.
Bohm, D., Quantitative description of the arc plasma in the magnetic field, in Characteristics

50
of Electrical Discharges an Magnetic fields, edited by A. Gutllrie and R. Walkerling,
. . p.1, McGraw Hill, New York, 1949.
Burinskaya, T. M. and C. -V. Meister, Contribution of the ion-beam acoustic instability to the
generation of broadband electrostatic noise in the earth’s magnetotail, Planet. Space
Sci., 37, 145-150, 1989.
Burinskaya, T. M. and C. -V. Meister, Contribution of the ion-beam acoustic instability to the
generation of broadband electrostatic noise -Three dimensional quasilinear approach-,
Planet. Space Sci., 38, 695-700, 1990.
Catto, P. J., M. N. Rosenbluth, and C. S. Liu, Parallel velocity shear instabilities in an
inhomogeneous plasma with a sheared magnetic field, Phys. Fluids, 16, 1719, 1973.
Cattel, C. A., F. S. Mozer, R. R. Anderson, E. W. Hones, Jr., and R. D. Sharp, ISEE
observations of the plasma sheet boundary, plasma sheet, and neutral sheet, 2, Waves,
J. Geophys. Res., 91, 5681, 1986.
Cattell, C. J. Wygant, F. S. Mozer, T. Okada, K. Tsuruda, S. Kokubun, and T. Yamamoto,
ISEE 1 and Geotail observations of low-frequency waves at the magnetopause, J.
Geophys. Res., 100, 11823, 1995.
Chandrasekhar, S., Hydrodynamic and Hgdromagnetic Stability, Clarendon, Oxford, 1961.
Chmyrev, V. M., S. V. Bilichenko, 0 . A. Pokhotelov, V. A. Marchenko, V. I. Lazarev, A. V.
Streltsov, and L. Stenflo, Alfvkn vortices and related phenomena in the ionosphere and
the magnetosphere, Phys. Scr., 38, 841, 1988.
Cummings, W.D. and Coleman, P.J., Jr. Magnetic fields in the magnetopause and vicinity at
synchronous altitude, J. Geophys. Res. 73, 5699, 1968.
D’Angelo, N., Kelvin-Helmholtz instability in a fully ionized plasma in a magnetic field, Phys.
Fluids, 8, 1748, 1965.
D’Angelo, N., Ultra low-frequency fluctuations At the polar cusp: A review, Rev. Gwphys.,
15, 299, 1973.
Davidson, R. C., Quasilinear stabilization of Lower-hybrid drift instability, Phys. Fluids, 21,

51
1375, 1978.
Drake, J. F., J. Gerber, and R. G. Kleva, Turbulence and transport in the magnetopause
current layer, J. Geophys. Res., 99, 1121 1, 1994a.
Drake, J. F., R. G. Kleva, and M. E. Mandt, Structure of thin current layers: Implications for
magnetic reconnection, Phys. Rev. Lett., 73, 1251, 1994b.
Drake, J. F., Magnetic reconnection, a kinetic treatment, in Physics of the Magnetopause,
Geophys. Mon. 90, Amer. Geophys. Union, Washington, DC, 155, 1995.
Dubouloz, N., R.Pottelette, M. Malingre, G.Hollngren, and P.A.Lindqvist, Detailed analysis
of broadband electrostatic noise i n the dayside auroral zone, J.Geophys. Res., 96, 3565,
1991.
Dum, C. T., and T. H. Dupree, Nonlinear stabilization of high-frequency instabilities, Phys.
Fluids., 13, 2064, 1970.
Dum, C. T., Transition in the dispersive properties of beam-plasma and two-stream
instabilities, J. Geophys. Res., 94, 2429, 1989.
Dusenbery, P. B. and L. R. Lyons, The generation of electrostatic noise in the plasma sheet
boundary,layer, J. Geophys. Res., 90, 10935-10943, 1985.
Dusenhery, P. B. and L. R. Lyons, Ion diffusion coefficients from resonant interactions with
broadband turbulence in the magnetotail, J. Geophys. Res., 94, 2484-2496, 1989.
Dusenbery, P. B., Generation of broadband noise in the magnetotail by the beam acoustic
instability, J. Geophys. Res., 91, 12005-12016, 1986.
Eastman, T. E., E. W. Hones, Jr., S. J . Bame, and J. R. Asbridge, The magnetospheric
boundary layer: Site of plasma, mot~lentu~n and energy transfer, from the magnetosheath
into magnetosphere, Gwphys. Res. Lett, 3, 685, 1976.
Eastman, T. E., L. A. Frank, W. K. Peterson,a dn W. Lennartsson, The plasma sheet
boundary layer, J. Geophys. Res., 89, 1553-1572, 1984.
Ergun, R. E. et al., FAST satellite observations of large-amplitude solitary structures, Gwphys.
Res. Lett., 25, 2041, 1998a.

52
Ergun, R. E., C. W. Carlson, J. P. Fadden, 'F. S. Mozer, L. Muschietti, I. Roth, and R.
Strangeway, Debye-scale plasma structures associated with magnetic-field-aligned
electric fields, Phys. Rev. Lett., 81, 826, 1998b.
Eviatar, A. and R. A. Wolf, Transfer processes i n the magnetopause, J. Geophys. Res., 73,
5561, 1968.
Fairfield, D.H., Magnetic fields of the magnetosheatll, Rev. Geophys. Space qhys., 14, 117,
1976.
Franz, J. R., Kintner, P. M., Pickett, J. S., Polar observations of coherent electric field
structures, Geophys. Res. Lett., 25, 1277, 1998.
Galeev, A. A., M. M. Kuznetsova, and L. M. Zelenyi, Magnetopause stability threshold for
patchy reconnection, Space Sci. Reo., 44, 1 , 1986.
Ganguli, G., M. J. Keskinen, H. Romero, R. Heelis, T. Moore, and C. Pollock, Coupling
of microprocesses and macroprocesses due to velocity shear: An application to the
low-altitude ionosphere, J. Geophys. Res., 99, 8873, 1994.
Gary, S.P. and T.E. Eastman, Tho lower hylxid drift instability at the magnetopause, J.
Geophys. Res., 84, 7378, 1979.
Gary, S.P., C. W. Smith, M. A . Lee, M. L. Goldstein, and D. W. Forslund, Electromagnetic
ion beam instabilities, Phys. Fluids, 27, 1852, 1984. (Erratum, Phys. Fluids, 28, 438,
1985).
Gary, S. P. and A. G. Sgro, The lower hybrid drift instability at the magnetopause, J. Geophys.
Res., 17, 909, 1990.
Gendrin, R., Magnetic turbulence and diffusion processes in the
magnetopause boundary layer, J. Geophys. Res., 84, 7043, 1979.
Gendrin, R., Magnetic turbulence and diffusion processes in the magnetopause boundary layer,
Geophys. Res. Lett., 10, 769, 1983.
Goldman, M. V., M. M. Oppenheim, and D. L. Newtnan, Nonlinear two-stream instabilites as
an explanation for the auroral bipolar wave structures, Gwphys. Res. Lett., 26, 1821,

53
1999.
Glassmeier, K. H., N. F. Ness, M. H. Acrlna and F.M.Neubauer, Studying hydromagnetic
waves in the Io plasma torus : Voyager 1 observations, J.Geophys. Res., 94, 15, 063,
1989.
Goldstein, M.L., C.W.Smith and W.H.Mattaeus, large amplitude MHD waves upstream of the
Jovian bow shock, J.Geophys. Res., 88, 9989, 1983.
Grabbe, C. L., New results on the generation of broadband electrostatic waves in the
magnetotail, Geophys. Res. Lett., 22, 483-486, 1985. .
Grabbe, C. L., Numerical study of the spectnm of broadband electrostatic noise in the
magnetotail, J. Geophys. Res., 92, 1185-1192, 1987.
Grabbe, C. L., Wave propagation effects of broadband electrostatic noise in the magnetotail,
J. Geophys. Res., 94, 17299-17304, 1989.
Grabbe, C. L., and T. E. Eastman, Generation of broadband electrostatic noise by ion beam
instabilities in the magnetotail, J . Geophys. Res., 89, 3865-3872, 1984.
Gurnett, D.A., L.A. Frank, and R.P. Lepping, Plnsma waves in the distant magnetotail, J.
Geophys. Res., 81, 6059, 1976.
Gurnett, D.A., and L.A. Rank, A region of intense plasma wave turbulence on auroral field
lines, J. Geophys. Res., 82, 1031, 1977.
Gurnett, D.A., and L.A. Rank, Plastna waves in the polar cusp: Observations from Hawkeye
1 , J. Geophys. Res., 82, 1447, 1978.
Gurnett, D.A., R.R. Anderson, B.T. Tsurutani, E.J. Smith, G. Paschmann, G. Haerendel, S.J.
Bame, and C.T. Russell, Plasma wave instabilities at the magnetopause: Observations
from TSEE 1 and 2, J . Geophys. Res., 84, 7043, 1979.
Gurnett, D.A., WSKurth, and F.L.Scarf, The structure of the Jovian magnetotail for plasma
waves observation, Geophys. Res. Lett., I , 53, 1980.
Gurnett, D.A., R.L. Huff, J.D. Menietti, J.L. Burch, J.D. Winningham, and S.D. Shawhan,
Correlated low-frequency electric and magnetic noise along the auroral field lines, J.

54
Geophys. Res., 89, 8971, 1984.
Gurnett, D.A., The Polar plasma wave instrument, Space Sci. Rev., 71, 597, 1995.
Gonzalez, W. D., B. T. Tsurutani, A. L..C. Gonzalez, E. J. Smith, F. Tang, and S.-I. Akasofu,
Solar wind magnetosphere coupling during intense magnetic storms (1978-1979), J.
Geophys. Res., 94, 8835, 1989.
Haerendel, G., G. Paschmann, N, Sckopke, H. hsenbauer, and P. C. Hedgecock, The frontside
boundary layer of the magnetopause and the Problem of reconnection, J. Geophys.
Res., 83, 3195, 1978.
Haerendel, G., and G. Paschmann, Interaction of the solar wind with the dayside
magnetosphere, in Magnetospheric Plasma Physics, edited by A. Nishida, Center for
Academic Publications Japan, Tokyo, 1982.
Heikkila, W. J., Impulsive plasma transport through the magnetopause, Geophys. Res. Lett.,
9, 159, 1982.
Ho, C. M., B.T.tsurutani, D.A.Gurnett, J.S.Pickett, Wideband plasma waves in the polar
cap boundary layer: Polar observations, Proceedings of Third SOLTIP Symposium, in
Beijing, in press, 1997.
Holzer, R.E., M.G. Mcleod, and E.J. Smith, Prelinlinary results from the Ogo 1 search coil
magnetometer: Boundary positions and magnetic noise spectra, J. Geophys. Res., 71,
1481, 1966.
Hones, E. W., Jr., J. R. Asbridge, S. J. Bame, M. D. Montgomery, S. Singer, and S.-I. Akasofu,
Measurements of the magnetotail plasma flow made by VELA-4B, J. Geophys. Res.,
77, 5503, 1972.
Huba, J. D., The Kelvin-Helmholtz instability i n inhomogeneous plasma, J. Geophys. Res.,
86, 3653, 1981.
Huba, J.D., N.T. Gladd, and J.F. Drake, On the role of the lower hybrid drift instability in
substorm dynamics, J. Geophys. Res., 86, 5881, 1981.
Horwitz, J. L., N. Singh, and J. L. Burch, eds., Cross-Scale Coupling in Space Plasmas,

55
Geophys. Mono., Vol. 93, 1996.
Ichimaru, S., Basic Principles of Plasma Physics, W. A. Benjamin, Inc., Reading, Mass., 1973.
Johnson, J. R. and C. Z. Cheng, Global structure of tnirror tnodes in the magnetosheath, J.
Geophys. Res., 20& 7179, 1997.
Kennel, C.F., and H.E. Petschek, Limit on stably trapped particle fluxes, J. Geophys. Res.,
71, 1, 1966.
Kennel, C.F. and M. Ashour-Abdalla, Electrostatic waves and the strong diffusion of
magnetospheric electrons, i n Magnetospheric Plasma Physics, ed. A. Nishida, Center
for Academic Publications Japan, Tokyo, 11.245, 1982.
Kindel and C. F. Kennel, Topside current instabilities, J. Geophys. Res., 76, 3055, 1971.
Kojima, H., H. Matsumoto, T. Miyatake, I. Nagano, A. Fujita, L. A. Frank, T. Mukai,
W. R. Paterson, Y. Saito, S. Machida, and R. R. Anderson, Relation between
electrostatic solitary waves and hot plasma flow in the plasma sheet boundary layer:
GEOTAIL Observations, Geophys. Res. Lett., 22, 2919-2922, 1994.
Kojima, H., H. Matsumoto, S. Chikuba, S. Horiyama, M. Ashour-Abdalla, and R. R.
Anderson, Geotail waveform observations of broadband/narrowband electrostatic noise
in the distant tail, J. Geophys. Res., 102, 14439, 1997.
Kojima, H., Study on plasma waves i n the geomagnetic tail region via spacecraft observations,
PhD. thesis in Kyoto university, Japan, 1998.
Kojima, H., Y. Omura, H. Matsumoto, K. Miyaguti, and T. Mukai, Characteristics of
electrostatic solitary waves: Statistical analyses, submitted to Nonlinear Processes in
Geophyhsics, 1999.
Krall, N. A. and P. C. Liewer, Low-frequency instabilities in magnetic pulses, Phys. Rev. A 4 , 2094, 1971.
LaBelle, J., and R.A. Treumann, Plasma Waves at, the dayside
magnetopause, Space Sci. Revs., 47, 175, 1988.
Lakhina, G. S. and A. Sen, Electromagnetic and V B effects on the modified two stream

56
instability, Nucl. Fusion, 13, 913, 1973.
Lakhina, G.S., Low-frequency electrostatic noise due to 'velocity shear instabilities in the
regions of magnetospheric flow boundaries, J. Geophys. Res., 92, 12161, 1987.
Lakhina, G.S., Generation of low-frequency electric field fluctuations on auroral field lines,
Annales Geophysicae, 64, 660, 1993.
Lakhina, G.S., P. K. Shukla, and L. Stenflo, Ultra-low-frequency fluctuations at the
magnetopause, Geophys. Res. Lett., 20, 2419, 1993.
Lakhina, G.S., Linear macroscopic instabilities in space plasmas, Phys. Scripta, T50, 114,
1994.
Lakhina, G. S. and K. Schindler, Tearing modes at the magnetopause, J. Geophys. Res., 101,
2707, 1996.
Lakhina, G. S., B. T. Tsurutani, J. K. Arballo, C. M. Ho, and A. Boonsiriseth, Generation of
broadband plasma waves in the polar cap boundary layer, EOS, 78, S297, 1997.
Lakhina, G. S., B. T. Tsurutani, Broadband plasma waves in the magnetopause and polar cap
boundary layers, Surveys Geophys., in press, 1999a.
Lakhina, G. S., B. T. Tsurutani, A generation mechanism for the polar cap boundary layer
broadband plasma waves, J. Geophys. Res., 104, 279, 1999b.
Lanzerotti, L.J., S.M.Krimigis, C.O.Bostron1, W.I.Axford, R.P.Lepping and N.F.Ness,
Measurements of plasma flow at the dawn magnetopause by Voyager 1, J . Geophys.
Res., 84, 6483, 1979.
Lee, L. C., J. R. Johnson, and Z. W. Ma, Kinetic Alfvh waves as a source of plasma transport
at the dayside magnetopause, J. Geophys. Res., 99, 17405, 1994.
Lemaire, J., and M. Roth, Penetration of solar wind plasma elements into the magentosphere,
J. Atmos. Terr. Phys., 40, 331, 1978.
Lundin, R., Processes in the magnetospheric boundary layer, Physica Scripta, 18, 85, 1987.
Matsumoto, H., H. Kojima, T.Miyatake, Y . Omura, M.Okada, and M.Tsutsui, Electrostatic
solitary waves (ESW) in the magnetotail- BEN wave forms observed by GEOTAIL,

57
Geophys. Res. Lett., 22, 2915, 1994.
McBride, J. B., E. Ott, J. P. Boris, and J. H. Orens, Theory and simulation of turbulent
heating by the modified two-stream instability, Phys. Fluids, 25, 2367, 1972.
Miura, A., Simulation of the Kelvin-Helmholtz instability at the magnetospheric boundary, J.
Geophys. Res., 92, 3195, 1987.
Mohan, M. and B. Buti, Modulated ion acoustic waves i n inhomogeneous plasmas, Plasma
Phys., 22, 713, 1979.
Mozer, F. S., R. Ergun, M. Temerin, C. Cattell, J. Dombeck, and J. Wygant, New features
of time domain electric-field structures in the auroral acceleration region, Phys. Rev.
Lett., 79, 1281, 1997.
Muschietti, L., R. E.Ergun, 1. Roth, and C. W. Carlson, Phase-space electron holes along
magnetic field lines, Geophys. Res. Lett., 26, 1093, 1999.
Neugehauer, M., C.T. Russell, and E.J. Smith, Observations of the internal structure of the
magnetopause, J. Geophys. Res., 79, 499, 1974.
Nishida, A., T. Hada, K. A. Anderson, R. R. Anderson, S. J. Bame, and E. W. Hones, Jr.,
Broadband electrostatic noise in the rnagnetotail: Its relation to plasma sheet dynamics,
J. Geophys. Res., 90, 4453-4460, 1985.
Omidi, N., Broadband electrostatic noise prodnced by ion beams in the Earth's magnetotail,
J. Geophys. Res., 90, 12330-12334, 1985.
Omura, Y. , H. Kojima, and H. Matsumoto, Cornputer simulation of Electrostatic Solitary
Waves: A nonlinear model of broadband electrostatic noise, Geophys. Res. Lett., 21,
2923-2926, 1994.
Omura, Y. , H. Matsumoto, T.Miyake, and H. Kojima, Electron beam instabilities as generation
mechanism of electrostatic solitary waves in the magnetotail, J. Geophys. Res., 202,
2685, 1996.
Onsager, T. G., M. F. Thomsen, R. C. Elphic, J. T. Gosling, R. R. Anderson, and
G. Kettmann, Electron generation of electrostatic waves in the plasma sheet boundary

58
layer, J. Gwphys. Res., 98, 15509-15519, 1993.
Owen, C. J., and S. W. H. Cowley, Heikkila’s mechanism for impulsive plasma transport
through the magnetopause: a re-examination, J. Geophys. Res., 96, 273, 1991.
Papadopoulos, K., The role of microturbulence on collisionless reconnection, in Dynamics an
the Magnetosphere, ed. S. 1. Akasofu, D. Reidel Pnbl. Co., Dordrecht, Holland, 289,
1979.
Parks, G. K., M. McCarthy, R. J. Fitzenreiter, J. Etcheto, K. A. Anderson, R. R. Anderson,
T. E. Eastman, L. A. Frank, D. A. Gunett, C. Huang, R. P. Lin, A. T. Y . h i ,
K. W. Oglivie, A. Pedersen, H. Reme, and D. J. Williams, Particle and field
characteristics of the high-latitude plasma sheet boundary layer, J. Geophys. Res., 89,
8885-8906, 1984.
Pllillips, J.L., S.J. Bame, M.F.Thotnsen, B,.E.Goldstein, and E.J.Smith Ulysses plasma
observations in the Jovian rnagnetoslleatll, J. Geophys. Res., 98, 21, 189, 1993.
Pickett, J.S., R.R. Anderson, L.A. Frank, D.A. Gurnett, W.R. Paterson, J.D. Scudder, J.B.
Sigworth, B.T. Tsurutani, C.M. Ho, G.S. Lakhina, W.K. Peterson, E. G. Shelley, C.T.
Russell, G. K. Parks, M.J. Brittnacller, H. Matsnmoto, K. Hashimoto, 1. Nagano, S.
Kokubun, and T. Yamamoto, TI. Correlative nlagnetopause boundary layer observations,
EOS, 78, S291, 1997.
Pottelette, R., M. Malingre, N. Dulmuloz, B. Aparicio, R. Lundin, G. Holmgren, and G.
Marklund, High-frequency waves in the cusp/cleft regions, J. Geophys. Res., 95, 5957,
1990.
Revathy, P. and G. S. Lakhina, Ton and electron heating in the Earth’s bow shock, J. Plasma
Phys., 17, 133, 1977.
Rezeau, L., S. Perraut, and A. Roux, Electron~agnetic fluctuations in the vicinity of the
magnetopause, Geophys. Res. Lett., 13, 1093, 1986.
Rezeau, L., A. Morane, S. Perraut, X. Roux, and R. Schmidt, Characterization of AlfvCnic
fluctuations in the magnetopause boundary layer, J. Geophys. Res., 94, 101, 1989.

59
Rezeau, L., G . Belmont, N. Cornilleau-Wehrlin, F. Reberac, and C. Briand, Spectral law and
polarization properties of the iow-frequency waves at the magentopause, Geophys. Res.
Lett., 26, 651, 1999.
Rome, J. A. and R. Briggs, Stability of sheared electron flow, Phys. Fluids, 25, 796, 1972.
Ronnmark, K., H. Borg, P. J. Cllristiansen, M. P. Gough, and D. Jones, Banded electron
cyclotron harmonic instability - A first comparison of theory and experiment, Space
Sci. Rev., 22, 401, 1978.
bsenbauer, H., Grunwaldt, H., Montgomery, M.D., Paschmann, G. and Sckopke, N., HEOS
2 plasma observations it1 the distant polar ~~~agtletospheret: The Plasma Mantle, J.
Geophys. Res., 80, 2723, 1975.
Russell, C.T., R.C. Snare, J.D. Means, D. Pierce, D. Dearborn, M. Larson, G. Barr and G. Le,
The GGS/POLAR magnetic fields investigation, Space Sci. Reus., 72, 563, 1995.
Scarf, F.L., R.W. Fredricks, T.M. Green, and C.T. Russell, Plasma waves in the dayside polar
cusp, J. Geophys. Res., 77, 2274, 1972.
Scarf, F. L., L. A. Frank, K. L. Ackerson, and R. P. Lepping, Plasma wave turbulence at
distant crossings of the plasma sheet boundaries and the neutral sheet, Geophys. Res.
Lett., 2, 189-192, 1974.
Schindler, K., On the role of irregularities i n plasma entry into the magnetosphere, J . Geophys.
Res., 84, 7257, 1979.
Schriver, D., and M. Ashour-Abdalla, Generation of high-frequency broadband electrostatic
noise: The role of cold electrons, J . Geophys. Res., 92, 5807-5819, 1987.
Schriver, D., and M. Ashour-Abdalla, Broadband electrostatic noise due to field-aligned
currents, Gwphys. Res. .Letts., 26, 899, 1989.
Schriver, D., M. Ashour-Ahdalla, R. Trenmann, M. Nakamura, and L. M. Kistler, The lobe to
plasma sheet boundary layer transition: t lmry and observations, Geophys. Res. Lett.,
17, 2027-2030, 1990.
Sckopke, N.G., Paschmann, G. Harendel, B.U.O. Sonnerup, S.J. Bame, T.G. Forbes, E.W.

60
Hones, Jr., and C.T. Russell, Structure of the low-latitude boundary layer, J. Geophys.
Res., 86, 2099, 1981.
Shelley, E. G., et al.,The toroidal imaging Mass-angle spectrograph (TTMAS) for the Polar
Mission, Space Sci. Rev., 71, 497, 1995.
Smith, E.J. and Davis, L., Magnetic measurements in the Earth’s magnetopause and
magnetosheath: Mariner 5, J . Geophys. Res., 75, 1233, 1970.
Smith, E. J., and B. T. Tsurutani, D. L. Chenette, T. F. Conlon, and 3. A. Simpson, Jovian
electron bursts: Correlation with the interplanetary field directions and hydromagnetic
waves, J. Gwphys. Res., 81, 65, 1976.
Smith, C. W., M. L., Goldstein and W. H. Mathaeus, Turbulence analysis of the Jovian
upstream wave phenomenon, J . Geophys. Res., 88, 5581, 1983.
Smith, C. W., and M. C. Lee, Coupled hydrorrlagnetic wave excitation and ion acceleration
upstream of Jovian bow shock, J . Geophys. Res., 91, 81, 1986.
Smith, E. J., and B. T. Tsurutani, Saturn’s magnetosphere : Observations of ion cyclotron
waves near the Dione L shell, J.Geophys, Res., 88, 7831, 1983.
Song, P., J. Zhu, C. T. Russell, R. R. Anderson, D. A. Gurnett, K. W. Ogilvie, R. J .
Strangeway, Properties of ELF emission i t 1 the dayside magnetopause, J. Geophys.
Res., 103, 26495, 1998.
Sonnerup, B. U, Theory of the low latitude 1,oundary layer, J. Geophys. Res., 85, 2017, 1980.
Sonnerup, B.U.O., E. J. Smith, B. T. Tsurutani and J. H. Wolfe, Structure of Jupiter’s
magnetopause : Pioneer 10 and 11 observations, J. Geophys. Res. 86, 3321, 1981.
Stone, R. G., et al., The unified radio and plasma wave (URAP) instrument, Astron,
Astrophys. Suppl. Ser., 92, 291, 1992.
Swift, D. F., Turbulent generation of electrostatic fields in the magnetosphere, J. Geophys.
Res., 82, 5143, 1977.
Thorne, R. M. and B. T. Tsurutani, Wave-particle interactions in the magnetopause boundary
layer, in Physics of Space Plasmas (1990), ed. T. Chang, et al.,, Sci. Publ. Inc.,

Cambridge, MA, 10, 119, 1991.
Treumann, R.A., J. LaBelle, and R. Pottelette, Plasma diffusion at the magnetopause, The
case of lower hybrid draft waves, J. Geophys. Res., 96, 16009, 1991.
Treumann, R. A., J. LaBelle, and T. M. Bauer, Diffusion processes: An observational
perspective, in Physics of the Magnetopause, Geophys. Mon. 90, Amer. Geophys.
Union, Washington, DC, 331, 1995.
Treumann, R. A., Theory of super-diffusion for the magnetopause, Geophys. Res. Lett, 24,
1727, 1997.
Tsurutani, B. T., A. L. Brinca, E. J. Smith, R. T. Okida, R. R. Anderson and T. E. Eastman,
A statistical study of ELF-VLF plasma waves at the magnetopause, J. Geophys. Res.,
94, 1270, 1989.
Tsurutani, B. T., D. J. Southwood, E. J. Smith and A. Balogh, A survey of low-frequency
waves at Jupiter : The Ulysses encounter, J. Geophys. Res., 98, 21, 203, 1993.
Tsurutani, B. T., G. S. Lakhina, C. M. Ho, J. K. Arballo, C. Galvan, A. Boonsiriseth, J. S.
Pickett, D. A. Gurnett, W. K. Peterson, and R. M. Thorne, Broadband plasma waves
observed i n the polar cap boundary layer: Polar, J. Geophys. Res., 103, 17,351, 1998.
Tsurutani, B.T., E.J. Smith, R.M. Thorne, R.R. Anderson, D.A. Gurnett, G.K. Parks, C.S.
Lin, and C.T. Russell, Wave-particle interaction at the magnetopause: Contribution to
the dayside aurora, Geophys. Res. Lett., 8, 183, 1981.
Tsurutani, B.T., and R.M. Thorne, Diffusion processes i n the magnetopause boundary layer,
Geophys. Res. Lett., 22, 663, 1982.
Tsurutani, B. T. and W. D. Gonzalez, The efficiency of "viscous interaction" between the
solar wind and the magnetosphere during intense northward IMF events, Geophys. Res.
Lett., 22, 663, 1995.
Tsurutani, B. T., J. K. Arballo, B. E. Goldstein, C. M. Ho, G. S. Lakhina, E. J. Smith, N.
Cornilleau-Wehrlin, R. Prang6, N. Lin, P. Kellogg, J. L. Phillips, A. Balogh, N. Krupp,
and M. Kane, Plasma wave characteristics of the Jovian magnetopause boundary layer:

62
Relationship to the Jovian aurora, J. Geophys. Res., 102, 4751, 1997.
Tsurutani, B.T., and G. S. Lakhina, Some basic Concepts of wave-particle interaction in
collisionless plasmas, Rev. Geophys., 35, 491, 1997.
Tsurutani, B.T., G. S. Lakhina, C.M. Ho, J. K. krballo, C. Galvan, A. Boonsiriseth, J. S.
Pickett, D. A. Gurnett, W. K. Peterson, and R. M. Thorne, Broadband plasma waves
observed in the polar cap boundary layer (PCBL): Polar, J. Geophys. Res., 103, 17351,
1998a.
Tsurutani, B.T., J. K. Arballo, G. S. Lakhina, C.M. Ho, B. Buti, J. S. Pickett, and D. A.
Gurnett, Plasma waves in the dayside polar cap boundary layer: Bipolar and monopolar
electric pulses and whistler mode waves, Geophys. Res. Lett., 25, 4117, 1998b.
Tsutsui, M., R. J. Strangeway, B. T. Tsurutani, H. Matsumoto, J. L. Phillips, and M. Ashonr-
Abdalla, Wave mode identification of electrostatic noise observed with ISEE 3 in the
deep tail boundary layer, J. Geophys. Res., 96, 14065-14073, 1991.
Verheest, F. and G . S . Lakhina, Nonresonant low-frequericy instabilities in multibeam
plasmas : applications to cometary environments and plasma sheet boundary layers, J .
Geophys. Res., 96, 7905, 1991.
Verheest, F. and G . S . Lakhina, Resonant electromagnetic ion-ion beam turbulence at comet
P/Grigg-Skjellerup, J. Geophys. Res., 98, 21,017, 1993.
Weiss, L. A., P. H. Reiff, J. J. Moses, and B. D. Moore, Energy dissipation in substorms, Eur.
Space Agency Spec. Publ., ESA-SP-335, 309, 1992.
Winske, D. and N. Omidi, Diffusion at the magnetopause: hybrid simulations, J. Geophys.
Res., 100, 11923, 1995.
Winske, D., V. A. Thomas, and N. Omidi, Diffusion at the magnetopause: A theoretical
perspective, in Physics of the Magnetopause, Geophys. Mon. 90, Amer. Geophys.
Union, Washington, DC, 321, 1995.
Winske, D. and N. Omidi, Diffusion at the magnetopause: Hybrid simulations, J. Geophys.
Res., 100, 11923, 1995.

63
Young, T. S. T., J. D. Callen, and J. E. McCune, High frequency electrostatic waves in the
magnetosphere, J. Geophys. Res., 78, 1082, 1973.
Zhu, Z., P. Song, J.F. Drake, C.T. Russell, R.R. Anderson, D.A. Gurnett, K.W. Ogilvie, and
R.J. Fitzenreiter, The relationship between ELF-VLF waves and magnetic shear at the
dayside magnetopause, Geophys. Res., Lett., 23, 773, 1996.
G. S. Lakhina, Indian Institute of Geomagnetism, Colaba, Bombay 400005, India.
(e-mail: [email protected])
B.T. Tsnrutani, Jet Propulsion Laboratory, California Institute of Technology, 4800
Oak Grove Drive, Pasadena, California 91109. (e-mail:[email protected])
H. Kojima, and H. Matsurnoto, M i 0 Atmospheric Science Center, Kyoto University,
Uji, Kyoto 61 1, Japan. (e-mail:kojima(~kur~c.kyoto-u.ac.jp; m a t s ~ l r n o t ( ~ k ~ l r ~ ~ . k y o t ~
u.ac.jp)
Received
Submitted to Journal of Geophysical Research, 1999.

64
Spacecraft Location Date B E
(nT)2 Hz” V 2 m-2 Hz”
POLAR’
ULYSSES~
ISEE3 1
ISEE4 1, 2
ISEE5 1, 2
G E O S ~ 2
ISEE7 1
- 7-8 RE altitude - 2 RE altitude
Jovian LLBL
Earth’s LLBL
Earth’s LLBL
Earth’s LLBL
Earth’s LLBL
Earth’s LLBL
day 098, 1996 . 1.17 X 10⁻²f-2.6
day 103, 1996 1.34 X 10-2*5f-2.5
day 043, 1992 2.0 X f-2-4
day 314, 1977 - f -3.3
1977 1.0 x 10’ f-3.9
1977 7.90 x 10⁻²f-2-9
day 240, 1978 3.60 X 10’ f - 2 ’ 6
- f -2.2
3.0 X f - 2 . 8
6.3 x 10⁻⁶f-2.2
6.0 X 1 0 - ~ f - 2 . ’ 1977-1978 3.0 x 10” f - 3 * 3
’ Tsurutani et al. [1998a]; * Tsurutani et al. [1997]
Gurnett et al. [1979] ; Tsurutani et al. [1981]
‘ Anderson et al. (19821 ; Rezeau et al. [1989]
’ Tsurutani et al. [ 19891
Table 1. Comparison of broadband plasma wave properties in various boundary
layers.

65
Figure 1. Schematics of the Earth’s Magnetosphere with various boundary layers. The
plasma mantle, the exterior cusp, the entry layer, the low-latitude boundary layer, and
the plasma sheet boundary layers are indicated.
Figure 2. The plasma wave electric and magnetic field data from ISEE 1 for a rep-
resentative pass through the magnetospere. The enhanced electric and magnetic field
intensities at the inbound and outbound magnetopause crossings are clearly indicated.
From Gurnett et al. [1979, Figure 11.
Figure 3. Shows the typical electric and rnagnetic field spectra of the enhanced plasma
wave turbulence obseved near the magnetopause. From Gurnett et al. [1979, Figure 10).
Figure 4. A comparison between the GEOS 2 Magnetopause BL magnetic wave spec-
trum (bottom) and and the rnagnetosheath magnetic wave spectrum (top). The average
magnetosheath spectrum is shown by the dahed line in the bottom panel. The BL wave
spectrum is enhanced above the magnetosheath spectrum (except below 10 Hz). From
Rezeau et al. [1986, Figure 31.
Figure 5. Shows the AMPTE/IRM wave, particle and field data from three magne-
topause crossing on October 9, 1984. The top panel shows electric field fluctuations from
30 Hz to 10 kHz, the next panel shows the magnetic field fluctuations (0 - 16 Hz), next
three panels show ion density, ion temperature, and ion flow velocity, respectively, the
last four panels show the magnetic field nmgnitude, and magnetic field component ex-
pressed in LMN coordinates [Pa.~ch7na7m et al., 19861. Vertical lines indicate the position
of the three magnetopauses. A dashed vertical line indicate the location of the magnetic
‘hole’. From LaBelle and Treumann 11988, Figure 11.

66
Figure 6. a) The spectrum of magnetic fluctuations observed at the magnetopause
from various different satellite. b) The spectrum of electric fluctuations observed at the
magnetopause from TSEE and from AMPTE/TRM. The TRM data comes from a single
day; the maximum value at the magnetopause is shown, along with the spectrum averaged
over the magnetopause region. The TRM data from below 30 Hz are only upper limits on
the wave amplitude. Also shown is the typical value of electric field fluctuations below
0.1 Hz corresponding to the velocity fluctuations reported from the HEOS satellite. From
LaBelle and Treumann [1988, Figures 2 and 31.
Figure 7. Average wave three-point electric field spectra (at lo', IO3, and lo5 Hz) for
three different local times (dawn, noon, and dusk). The average spectra are remarkallly
similar to each other in hoth shape and intensity. From Tsurutani et al. [1989, Figure
61 *
Figure 8. Same as Figure 7 except for the wave magnetic component. From Tsurutani
et al. [1989, Figure 71.
Figure 9. The amplitude of the norrnalized wave magnetic field (asterisks) and wave
electric field (closed squares) as function of local magnetic shear angle. Vertical bars
indicate the deviations of the means. Solid and dashed lines are the linear fits to the
wave magnetic and electric data respectively. From Zhu et al. [1996, Figure 21.
Figure 10. Dispersion relation of ELF-'JLF waves under different shear levels. The
two dotted lines (vW1 and vw2) show the theoretical dispersion curves of whistler mode
with a magnetic field strength of 50 nT and electron density of 1 cm-3 and 10 cm-3
respectively. 0, and 0 l h are the electron cyclotron frequency and the lower-hybrid
frequency respectively. From Zhu et al. [ 1996, Figure 31.

67
Figure 11. The correlation of the normalized magnetic (closed squares and solid lines)
and electric (open triangles and dashed lines) amplitudes with the electron plasma beta
(upper panel) and the electron ternperatrlre anisotropy (lower panel). From Song et al.
[1998, Figure 131.
Figure 12. Different microscopic diffusion coefficients and their dependencies on the
total electric wave intensity. The shaded region marks the range of the observed electric
wave field strengths. The horizontal dashed line a t D = 109m2s" is the diffusion required
to maintain LLBL according to the theory of Sonnerup (1980). The dots indicate the
diffusion coefficients according to theoretical saturation levels of the various instabilities.
The double shaded regions rnark the uncertainties in measured wave intensity and in the
estimate of the diffusion coefficient. From Treumann et al. [1995, Figure 51.
Figure 13. The POLAR orbit and the region of wave detection (solid bar) in the
magnetosphere. POLAR has a perigee a t 1.8 RE and apogee at 9 RE. Waves on the field
lines that map into the low latitude boundary layer (LLBL) are the topic of this study.
From Tsurutani et al. [1998a, Figure 11.
Figure 14. Occurrence frequency of northern dayside PCBL waves as a function of local
time. The polar cap boundary layer waves are present on the dayside 96% of the time
(05-18 LT). The statistics are listed at the top. From Tsurutani et al. [1998a, Figure 31.
Figure 15. a) The geomagnetic latitude of the footpoint of the B field line passing
through the spacecraft versus local time (GMT). Regions of wave activity are primarily
located on the field lines whose footpoint geomagnetic latitudes lie between 70" - 80". b)
Lvalue distribution of the PCBL waves versus GMT. The wave region is located for L
= 10. From Tsurzltani et al. [1998a, Figure 41.

68
Figure 16. The electric field a) and magnetic field b) spectra for the events occurring
on Day 098, 1996. The background noise is indicated. The electric component of the
waves extend beyond the electron cyclotron frequency (- G x lo3 Hz). From Tsurutani
et d. [1998a, Figure 51.
Figure 17. The B / E wave amplitude ratio for two events, one on day 98 (panel a)
and the other on day 114 (panel I)). Two curves corresponding to propagation angles
of $ = 0" and .Jt = GO" for the whistler wave refractive index, 7, are also shown. These
ratios are highly variable but lie between the values 10 to 100. For parallel propagating
whistler modes, the ratio B / E should lie along the $ = 0" curve. From Tsurutani et al.
[1998a, Figure 71.
Figure 18. A northern polar view of the mapping of polar cap boundary layer (PCBL)
waves to the low latitude boundary layer (LLBL). From Tsumtani et al. (1998a, Figure
81 *
Figure 19. A typical frequency spectrrm of the broadband electrostatic noise observed
by the IMP 8 spacecraft [Figure 5 in Gurnett et al., 19761.
Figure 20. Time evolution of the bump-on-tail instability. Right and left four panels
show the time series of electron phase diagrams and electron velocity distribution [Figure
7 in Omura et a]., 19961

Figure 21. An overview of the low-frequency E and B wave amplidtudes for all 14
Jovian BL events encountered by Ulysses The inbound pass is shown on the left and
the outbound on the right. The top 4 panels show the spin average E from 9.3-, 14-,
19-, and 28-HZ channel wave intensities, the next 4 panels show the spin average B wave
intensities for the same frequency channels, the next 2 panels show the dc magnetometer
I-min and 10-min variances, and the bottom two panels show the spacecraft location
relative to Jupiter. The BL events are shaded and numbered at the top. The vertical
dashed lines indicate the bow shock crossings, and magnetosheath/BL interval are shown
by horizontal bars in the top panel. From Tsurutani et al. [1997, Figure 11.
Figure 22. The electric (left) and magnetic field (right) wave spectra for the Jovian
BL.event 10. The spectra are I)roadhand with no obvious peaks. From Tsurutani et al.
[1997, Figures 5 and 61.
Figure 23. Ratio of B / E as a function of frequency for the JBL event 10 shown in
Figure 21. Since the f " / 2 frequency depence is not seen throughout the interval, it is
speculated that the waves may be propagating off-axis to the ambient magnetic field.
From Tsurutani et al. [1997, Figure 71.
Figure 24. Variation of norrnalized growth rate, y/wCi, (upper panel) and normalized
real frequency, wr/wci,(lower panel) versus normalized wavenumber number a = k,&,/wci
for the coupled lower hybrid drift and current convective instability for the case of hot
plasma with wpe/w, = 10.0, V,=O, and Kn/k, = 0.1. The curves 1, 2, and 3 are for pi = 0.0, k,/k, = -0.1 and S = = 0.0, 0.05, and 0.1, respectively. The curv 4 is for p, = 0.0, S = 0.1, and k,/k, = 0.1. The curves 4 and 5 are for S = 0.1, k,/k, = -0.1 and
= 0.05 and 0.2, respectively. From Lakhina and Tsurutani et al. [1999b, Figure 61.
urr &

70
Figure 25. Schematics of the physical mechanism of the velocity shear instability. The
equilibrium magnetic field Bo is taken along the z axis. The equilibrium electrons flow
VO is parallel to the magnetic field Bo. The parallel electron velocity gradients VLb,
which derives the instability, and the density gradient Vno are in the x direction. The
assumed form of the perturl~ing field E = E, z + Ev y is shown in the y - z plane.
The convection of the electron flow 17, brings regions of different parallel flow to the
same magnetic field line The resultant bunching of electrons along this magnetic field
line (shown in the x - z plane ) p rod~~ces an electric field which reinforces the initial
perturbation, thereby producing an instahility . The presence of density gradients tends
to debunch the electrons along B (i.e., the particles shown as shaded in the x - z plane
are removed ), thereby reducing growth of the velocity shear modes. From Lakhina and
Tszlrzltani et al. [1999b, Figure 71.
Figure 26. Bipolar (bpp), offset bipolar (obpp), and monopolar (mpp) wave structures
in parallel electric field component. From Tmrutani et al. [1998b, Figure 31.
Figure 27. A schematic showing a bipolar electric field structure (left), an offset bipolar
structure (middle), and a pair of oppositely polarized monopolar structures (right). The
bipolar pulse is modeled by an electron hole plus surrounding neutralizing charge. The
offset bipolar pulse is modeled I)y a Imadened electron hole. The two monopolar pulses
are modeled by an electron hole that h a s split into two into two. From Tsurutani et al.
[1998b, Figure 4).

71
Plate 1. Color spectrogram of wave electric field from - 10’ to lo4 Hz and above. The
boundary layer waves are indicated. In between the two boundary layer (dayside and
nightside) crossings is the polar cap (quiet wave region). From Tsurutani et al. [1998a,
Plate I].
Plate 2. Color spectrograrn of the H+, O+, He+ and He++ ion fluxes observed by
the TIMAS experiment (top 4 panels) and the electric component of the PWI broadband
plasma wave event (lower panel) on day 98, 1996. The values of eccentric dipole magnetic
local time (EDMLT), magnetic latitude (MAGLAT), invariant latitude (INVLAT) and
local time (LT) are also shown at the bottom of the Plate. From Tsurutani et al. [1998a,
Plate 31.
Plate 3. Typical frequency-time spectrogram of the BEN and corresponding ESW
waveforms.


BOW MAGNETOPAUSE MAGNETOPAUSE SHOCK (INBOUND) (OUTBOUND)
I I I I I
R ( R , ) 20.5 10.5 15.6 11.6 5.4 3 6.0 3 12.0 LT ( H R ) 10.0 I Q6 11.3 11.7 12.7 6.22 7.70
ISEE I , DAY 314, Nov. IO. 1977


GEOS-2 AUG.28,1978 5 3 0 0
CL
N I \ I- C
I-
N
F-
5i z 0 W
J a a
FREQUENCY (Hz1
I

' I


MAGNETOPAUSE CROSSNGS
-6-
-8 -
-10 - z
cy < -12 - w > (3 0
Y
-14
-16
-18 -
1
1 I I I
loo to1 12 1 0' 1 0' 12 lo6
I I I

MAGNETOPAUSE CROSS HGS
x - O3 t
n
<y
-7

0
0
0
0
0
0
0
A
0
0
0
n 8 8
m 5
t8
= t*
-I 8 8 * 8 8 8 8
c-i
-4
1
I I
I I
I I
1
tn I
m
I

'.
,
vp&
n s-
1 Xlo
oo)
. .-
<-&
W

A

c,
0 I 4
c1
0 I cn
0 I w
c,
0
rm
-.
4

n ..-

No.
of
Cou
nts/
No.
of
Orb
its rl

9.
. c I .'
P 1
a-
00- z-
c.r N'
m
a-
m
a-
L
00- 1

Iu
0
Iu
Iu
d
OO
L- V
a I u
e

7 n
P n
n
3
Y
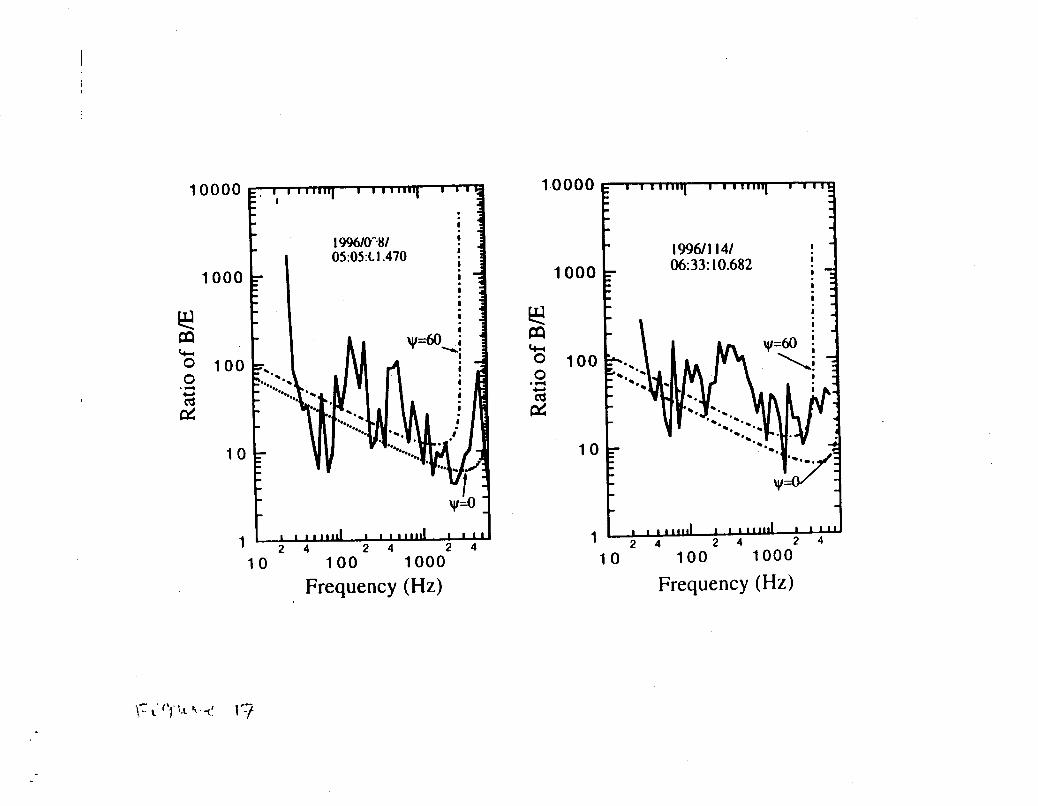
-0
N
' 0

.

I I I I 1 1 1 1 I I I I l I l l I 1 1 1 r r l r ~ I I I I I I
IMP 8 Day 108, April 18, 1974
1056 to 1059 UT -
- Broad band Eicctrostatic
-
-
I n s t rument Noise Level
,$9L J IO 102 lo3 105
frequency, H Z

40
0
-40 512 1024
8.00
4 .OO
0.00

.
.
e t
- 4 -5
- 7 -6
-8
- 3 -6 -7 -8 -9

e
o_ L
9 - U
Spec
tral
Den
sity
(nTf
/Hz)
9 v
e
0,

A
X
v
N
L
L
0-
L
0,
8 w
0
c
0
w
L
e QI X
0
9
Y
0
X
P
5) X
4
X
0
9
L

50
40
30
20
10
300
.I
x 3 3v 200
100
v
""""- ""-
\
\
I
I
I
I
I
I
I
I
10 20 30 40 50
a
1 2 3 4 5 6
""""- ""- -""" ""
.""".".""....
1
a

X
. . .
Y / / /
/ /
/
Z
0 0

17 350 1 7 W 17575 17." 17 385 t7.390

Offset Bipolar Structure
Broadened Ekctron Hole
Paired Monopolar Structures

Freq
uenc
y (H
z)
(Vol
ts/m
)2 H
t.1
I I
I I
I I
I

Polar - TlMA
S / PWI:
04/07/96 (9
60
98
)
1 o5
1 04
1 o3
102
UT 0450
05:oo 05:lO
0520
05:30 05:m
R
6.019 6.202
6.378 6.547
6.709 6.864
L 22.02
25.38 29.24
33.70 38.85
44.85 EDM
LT 1255
12:59 13:04
13:09 13:15
13:22 M
AGLAT
58.65 60.52
62.29 6
3.9
6
65 -55 67.06
INV
lAT
T1.70
78.55 79.34
80.08 80.R
81.41
LT 1500
15:08 15:17
15:25 1
53
3
15:42

I