Broadband for Networked Society - ITU · PDF fileBroadband for Networked Society ......
60
Broadband for Networked Society Rizwan Ahmed Hydri DG(Licensing),PTA 20 July 2016
Transcript of Broadband for Networked Society - ITU · PDF fileBroadband for Networked Society ......

Broadband for Networked Society
Rizwan Ahmed HydriDG(Licensing),PTA
20 July 2016
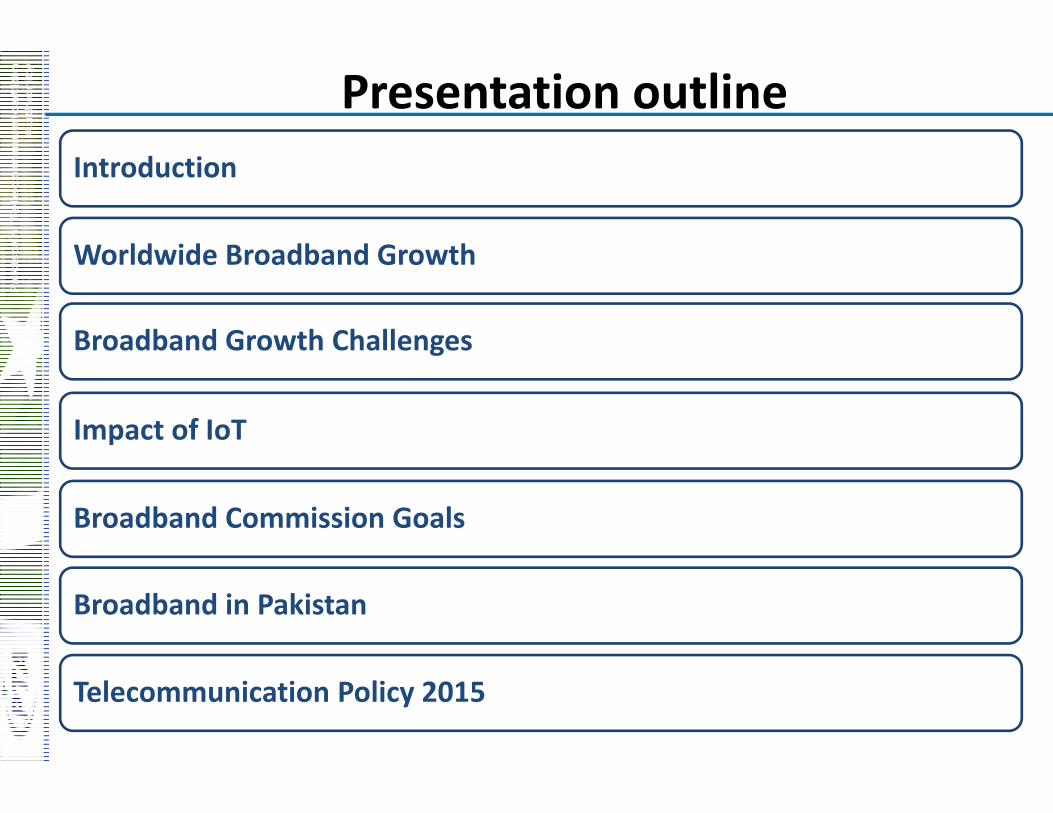
Introduction
Worldwide Broadband Growth
Broadband Growth Challenges
Impact of IoT
Broadband Commission Goals
Broadband in Pakistan
Telecommunication Policy 2015
Presentation outline

Introduction
3
ICT – Sustainable Development
Affordable BB• Economic Growth• Social Inclusion• Environmental Protection
Digital Divide Persistent• Access to BB Internet• Access to Remote Areas
Gender Digital Divide
Local Content and Services
Local Languages
Need for Effective Policies
Worldwide Broadband Growth

World Wide BB GrowthMobile BB Growth
125 Years
13 Years
11 Years
8 Years
5 Years
0 20 40 60 80 100 120
Fixed Lines
Google Users
MobileSubcriptions
Facebook Users
Mobile BBSubscriptions
Years to Achieve 1 Billion Users From Launch
Source : ITU
7.7 Billion MBB Subscriptions by 2021, as Compared to 3.5 Billion in 2015

Fixed BB Growth
6–920 Million Subscribers by 2019–Sustained Growth Expected in Fixed BB
The Americas177 m23%
Africa4 m0%
Arab States14m2%
Asia & Pacific365m46%
CIS39 m5%
Europe186 m24%
Status of Fixed BB Subscriptions ‐ 2015
Source : ITU
Broadband Growth Challenges
7
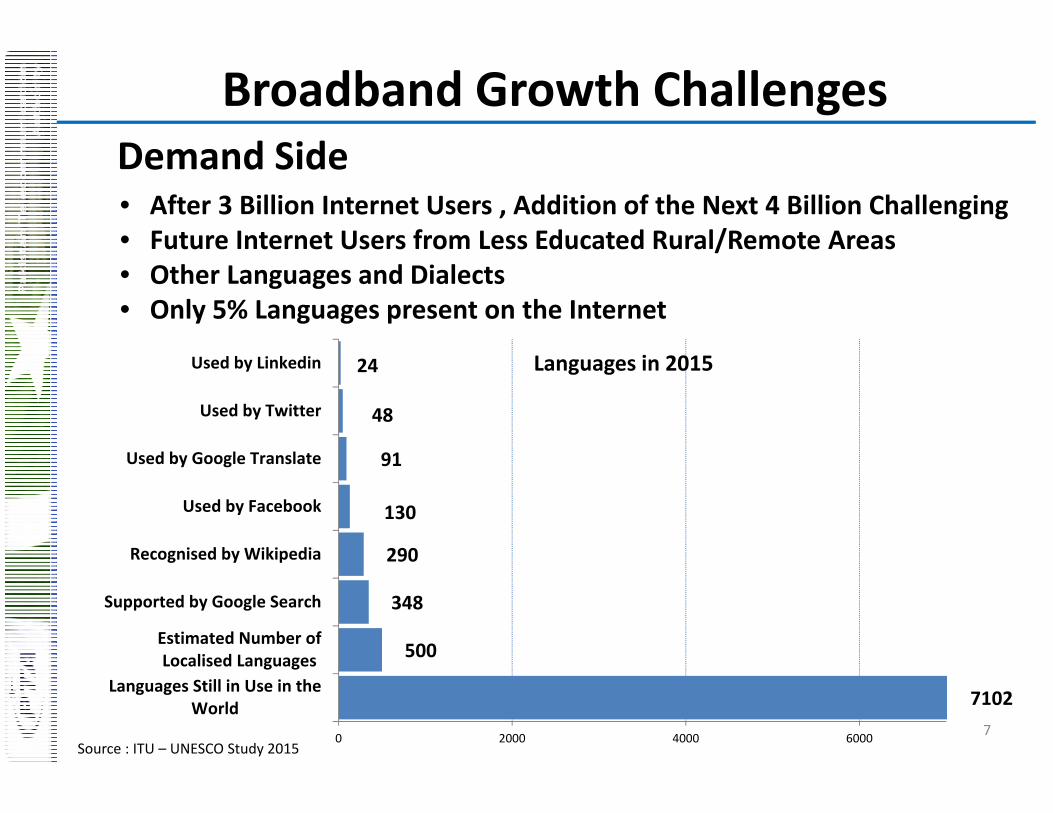
Demand Side• After 3 Billion Internet Users , Addition of the Next 4 Billion Challenging• Future Internet Users from Less Educated Rural/Remote Areas• Other Languages and Dialects• Only 5% Languages present on the Internet
7102
500
348
290
130
91
48
24
0 2000 4000 6000
Languages Still in Use in theWorld
Estimated Number ofLocalised Languages
Supported by Google Search
Recognised by Wikipedia
Used by Facebook
Used by Google Translate
Used by Twitter
Used by Linkedin
Source : ITU – UNESCO Study 2015
Languages in 2015
Broadband Growth Challenges
8
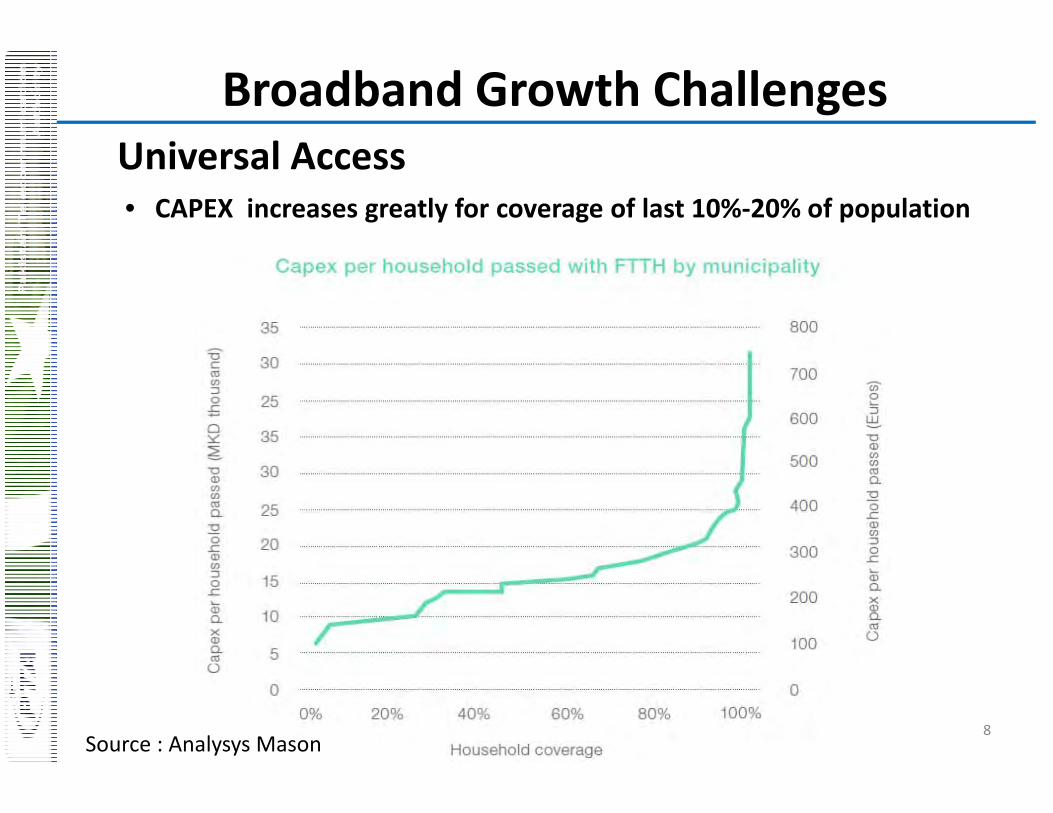
Universal Access
Source : Analysys Mason
• CAPEX increases greatly for coverage of last 10%‐20% of population
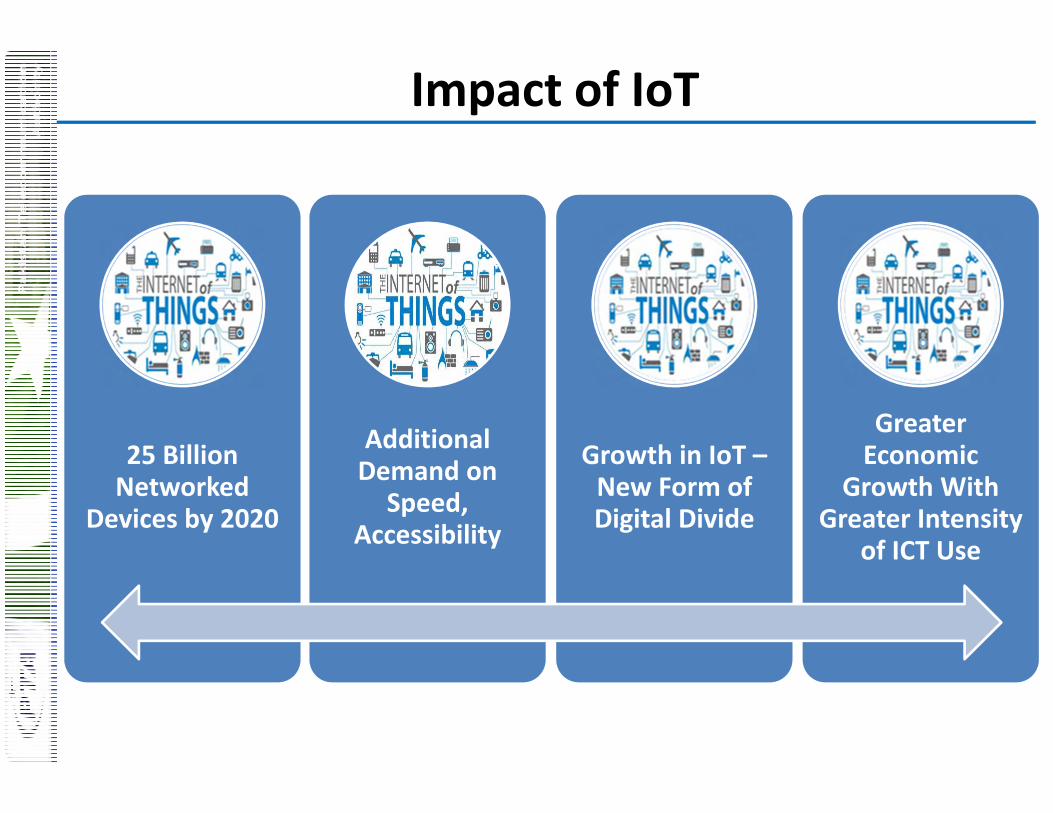
Impact of IoT
Additional Demand on Speed,
Accessibility
25 Billion Networked
Devices by 2020
Growth in IoT –New Form of Digital Divide
Greater Economic
Growth With Greater Intensity
of ICT Use

Impact of IOT
Source : Cisco VNI Global IP Traffic Forecast, 2014‐2019
0
2
4
6
8
10
12
6.1
4.4
2.4 21
1.6
11.6
8.2
4.3
2.9
1.42.5
20142019
Broadband Commission Goals ‐ 2015• BB Commission for Digital Development ‐ 2010
• Set Targets to Promote Digital Inclusion
– National Broadband Plan
– Affordability
– Connecting Homes to BB
– Getting People Online
– Gender Equality
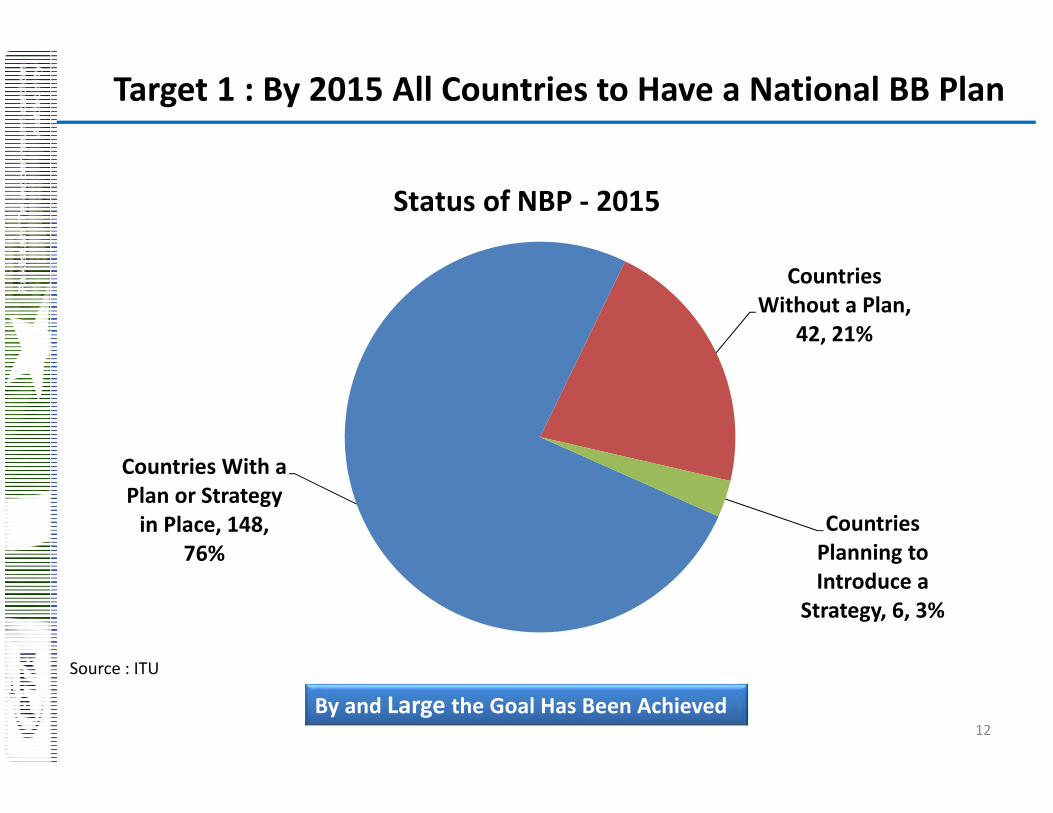
Target 1 : By 2015 All Countries to Have a National BB Plan
12
Countries With a Plan or Strategy in Place, 148,
76%
Countries Without a Plan,
42, 21%
Countries Planning to Introduce a
Strategy, 6, 3%
Status of NBP ‐ 2015
Source : ITU
By and Large the Goal Has Been Achieved
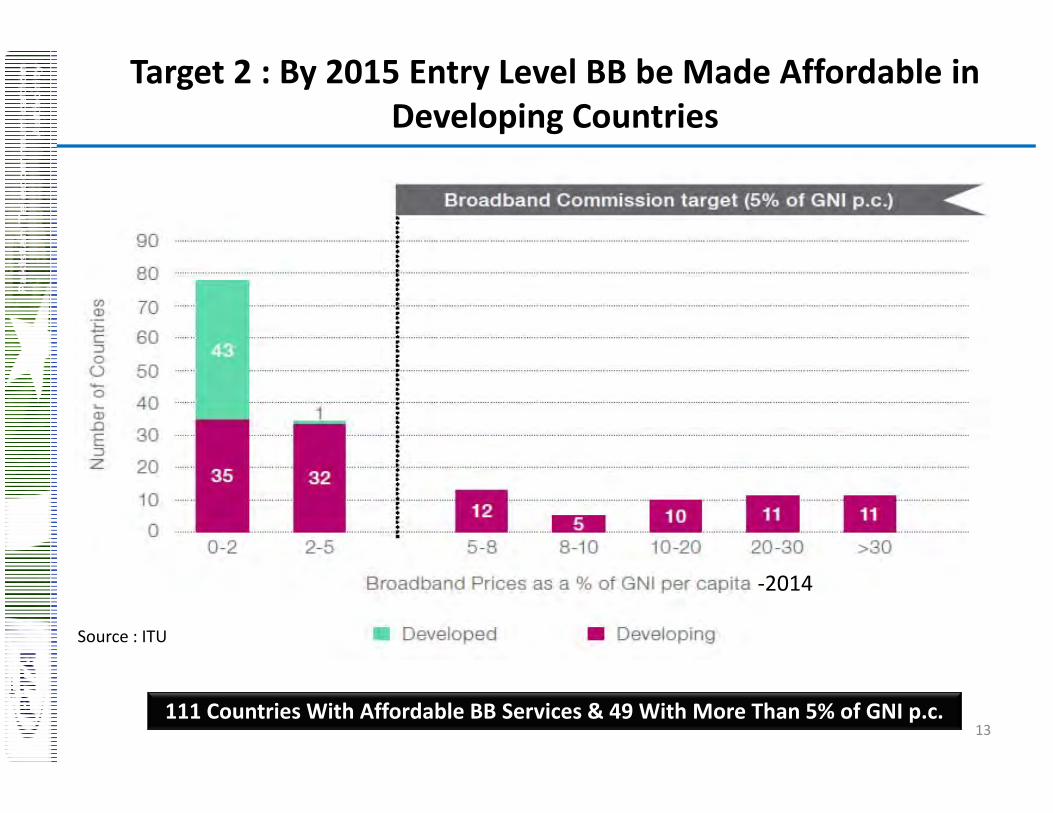
Target 2 : By 2015 Entry Level BB be Made Affordable in Developing Countries
13
Source : ITU
111 Countries With Affordable BB Services & 49 With More Than 5% of GNI p.c.
‐2014
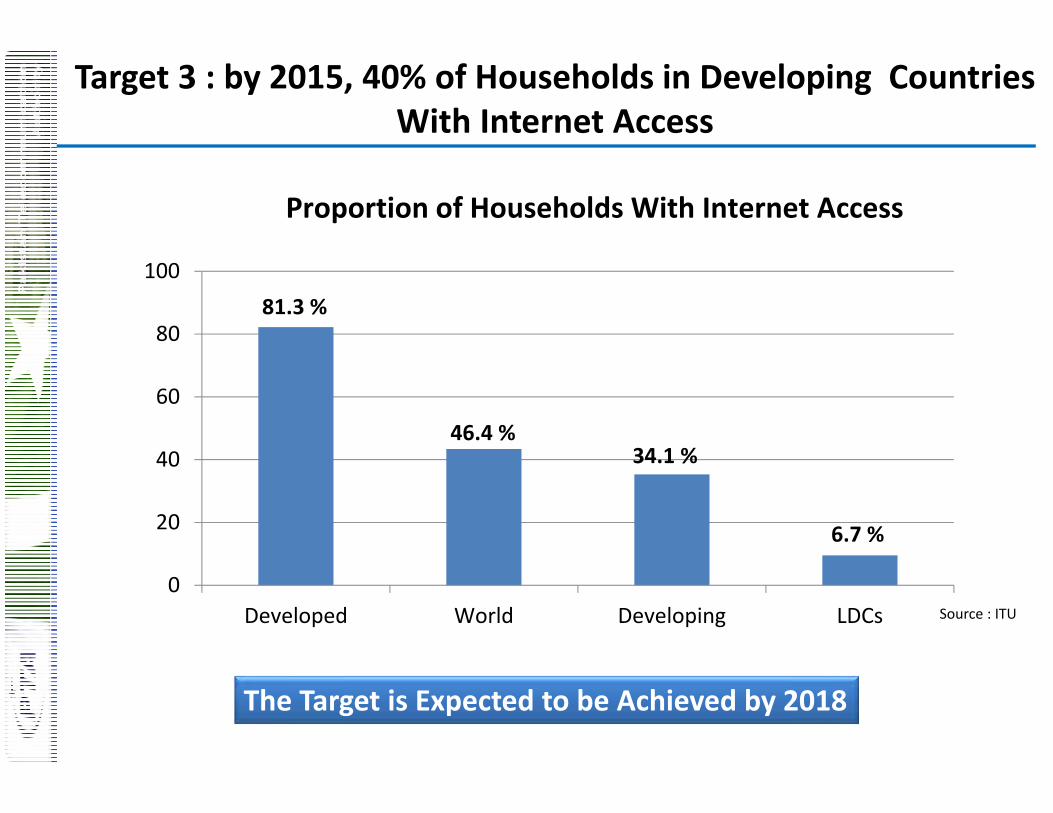
Target 3 : by 2015, 40% of Households in Developing Countries With Internet Access
Source : ITU
The Target is Expected to be Achieved by 2018
81.3 %
46.4 %34.1 %
6.7 %
0
20
40
60
80
100
Developed World Developing LDCs
Proportion of Households With Internet Access

Target 4 : By 2015, Internet Penetration Should Reach 60% Worldwide, 50% in Developing Countries and 15% in LDCs
15
0
20
40
60
80
DevelopedWorld
DevelopingLDCs
82.2%
43.4%
35.3%
9.5%
Internet User Penetration ‐ 2015
Source : ITU
The Target Failed by a Wide Margin. Unlikely to Be Achieved Until 2021

Target 5 : Achieve Gender Equality in Access to BB by 2020
16
Source : ITU
Gap represents difference between Internet user penetration rate for male‐female relative to Internet user penetration rate for males, expressed as a percentage. The gender Internet user gap in LDCs is twice as high as in developing countries
0
5
10
15
20
25
30
Developed Developing World LDCs
6.3
15.6
11.1
29.9
5.4
15.4
11
28.9
Percen
tage %
Gender Gap
Gap 2013(%)Gap 2015 (%)

Broadband in Pakistan

History of MBB in Pakistan
18
Sector G
rowth
2004
2014
2016
1st Cellular Spectrum Auction: Telenor & Warid acquired licenses for 2G
• Next Generation Mobile Service (NGMS) Spectrum Auctioned.
• 40 MHz in 1800 MHz and 2100 MHz Bands
10 MHz in 850 MHz Band for NGMS
SOURCE: PTA Data

Fiber Deployment Nation wide 4 Operators have laid long haul fiber N/Ws acrossthe country covering most of the cities
Link Direct ‐ 5000 KM
Wateen ‐ 5700 KM
Multinet ‐ 5000 KM
PTCL ‐ 10,400Km
Total ‐ 26,100Km
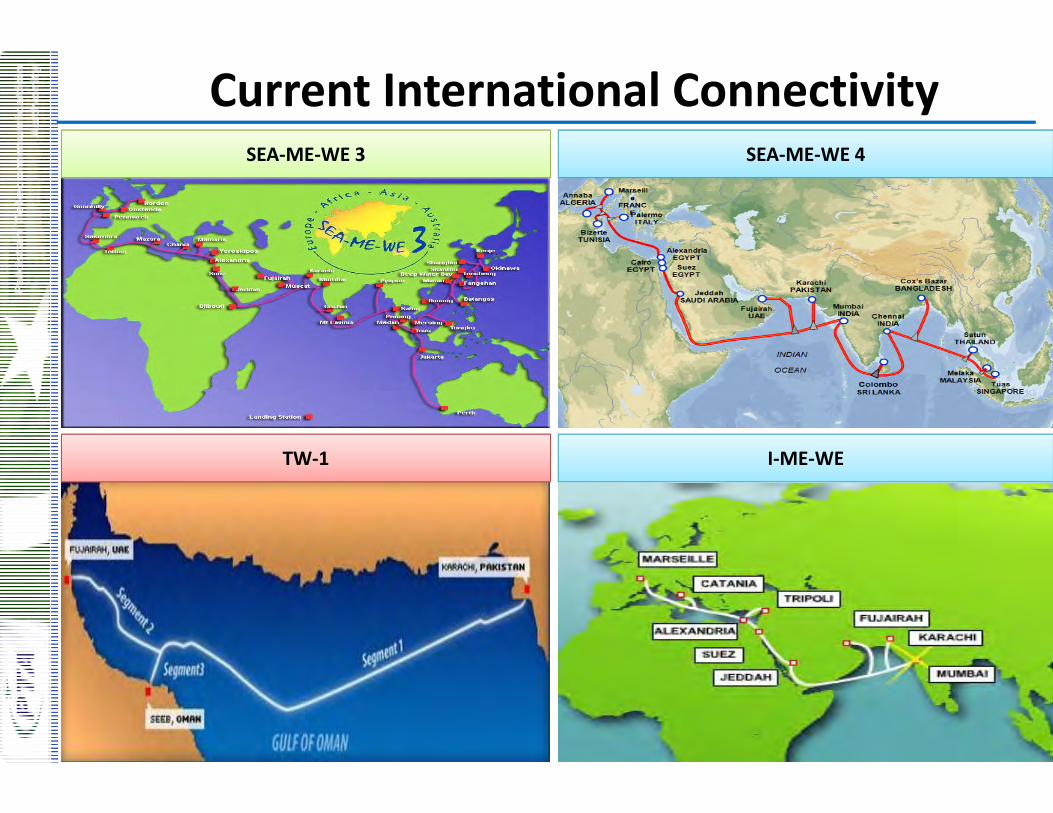
SEA‐ME‐WE 3 SEA‐ME‐WE 4
TW‐1 I‐ME‐WE
International ConnectivityCurrent International Connectivity

SEA‐ME‐WE 5 AAE ‐1
International ConnectivityFuture International ConnectivityThis image cannot currently be displayed. This image cannot currently be displayed.
This image cannot currently be displayed.
SRG‐1

International ConnectivityFuture International ConnectivityThis image cannot currently be displayed.

International ConnectivityCellular Coverage(2G)This image cannot currently be displayed.
• Coverage in all populated areas• Most people in Pakistan have access to
basic voice telephony, mostly using mobile phones
International ConnectivityCellular Coverage(3G & 4G)This image cannot currently be displayed.
• Out of 4 phases for n/w roll out ,2 phases have been completed.
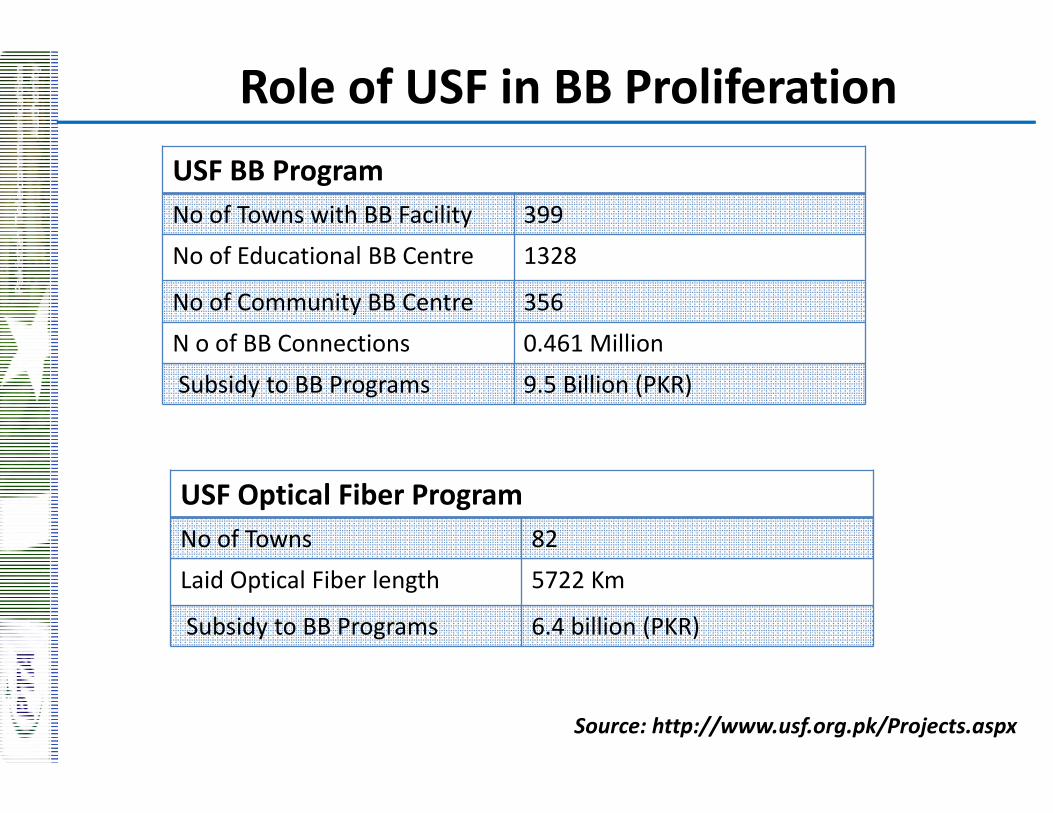
Role of USF in BB Proliferation
Source: http://www.usf.org.pk/Projects.aspx
USF BB ProgramNo of Towns with BB Facility 399No of Educational BB Centre 1328
No of Community BB Centre 356N o of BB Connections 0.461 Million
Subsidy to BB Programs 9.5 Billion (PKR)
USF Optical Fiber ProgramNo of Towns 82Laid Optical Fiber length 5722 Km
Subsidy to BB Programs 6.4 billion (PKR)

Broadband Penetration in Pakistan
0.11 0.25 0.55 0.89 1.20 1.52 2.07
8.97
-
1.00
2.00
3.00
4.00
5.00
6.00
7.00
8.00
9.00
10.00
2008 2009 2010 2011 2012 2013 2014 2015
Perc
enta
ge
NGMS Auction in Pakistan
Pakistan Ranked in Top 5 Mobile SubscriptionThis image cannot currently be displayed.
This image cannot currently be displayed.
Source‐ Ericsson Mobility Report June 2016
Telecommunication Policy 2015
ContextExpectations
Policy Goals
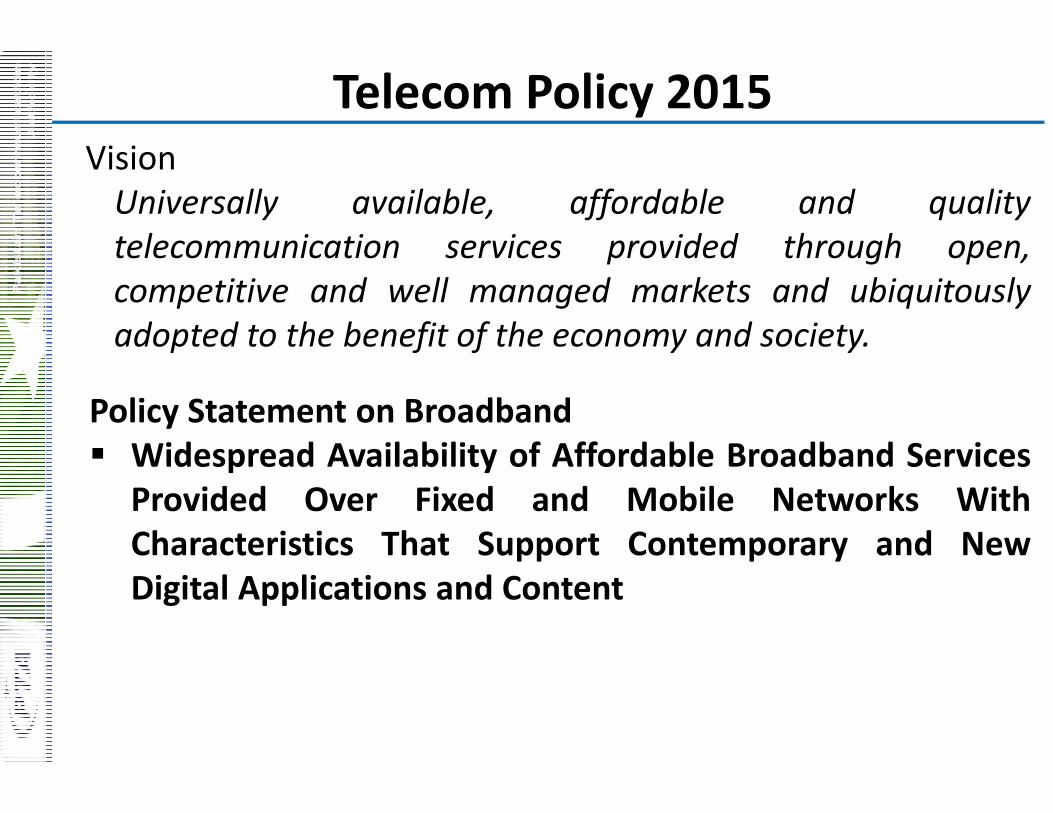
Telecom Policy 2015VisionUniversally available, affordable and qualitytelecommunication services provided through open,competitive and well managed markets and ubiquitouslyadopted to the benefit of the economy and society.
Policy Statement on Broadband Widespread Availability of Affordable Broadband Services
Provided Over Fixed and Mobile Networks WithCharacteristics That Support Contemporary and NewDigital Applications and Content
Expectations
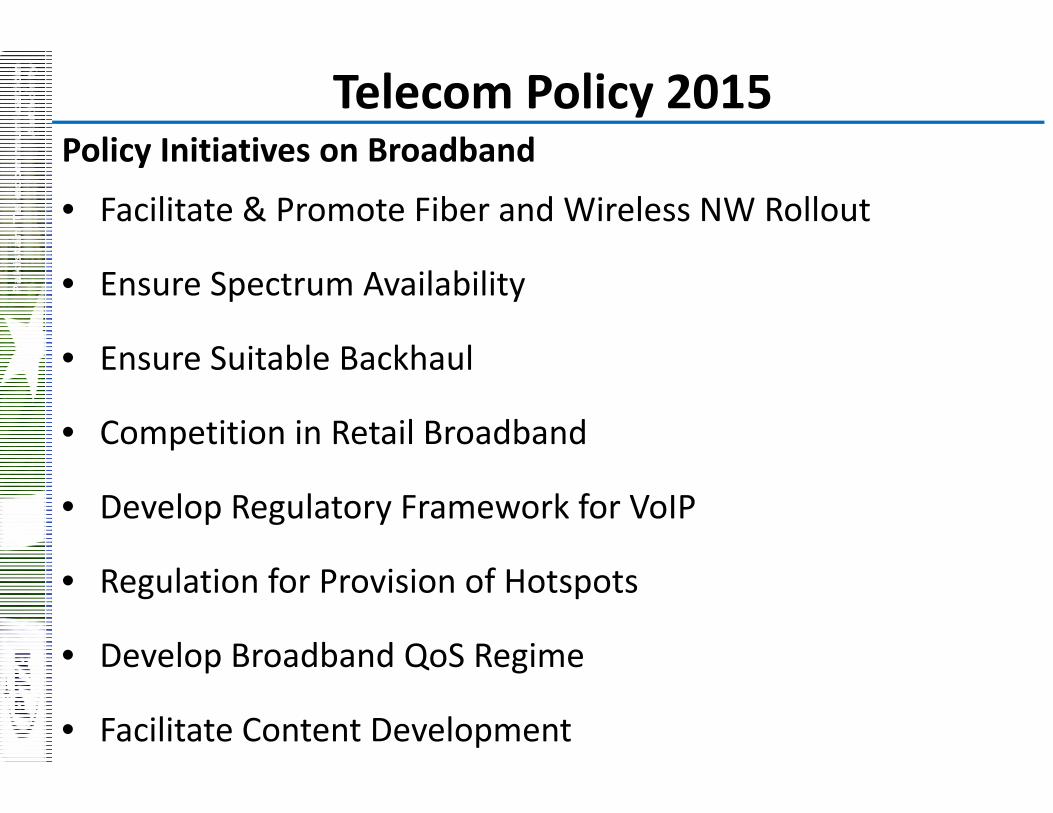
Telecom Policy 2015Policy Initiatives on Broadband
• Facilitate & Promote Fiber and Wireless NW Rollout
• Ensure Spectrum Availability
• Ensure Suitable Backhaul
• Competition in Retail Broadband
• Develop Regulatory Framework for VoIP
• Regulation for Provision of Hotspots
• Develop Broadband QoS Regime
• Facilitate Content Development

ContextExpectations
Policy Goals
Facilitation of Fiber & Wireless NWs Rollout
Fiber & Wireless NWs
Rollout
Fast Track RoW
Processing Spectrum Refarming, Sharing & Trading
Infrastructure Sharing
Sharing Utility Infrastructure
Develop Wholesale
Fiber Services
Include BB in USF
BB QoSRegime
Prefer Fiber Over Copper
ContextExpectations
Policy Goals
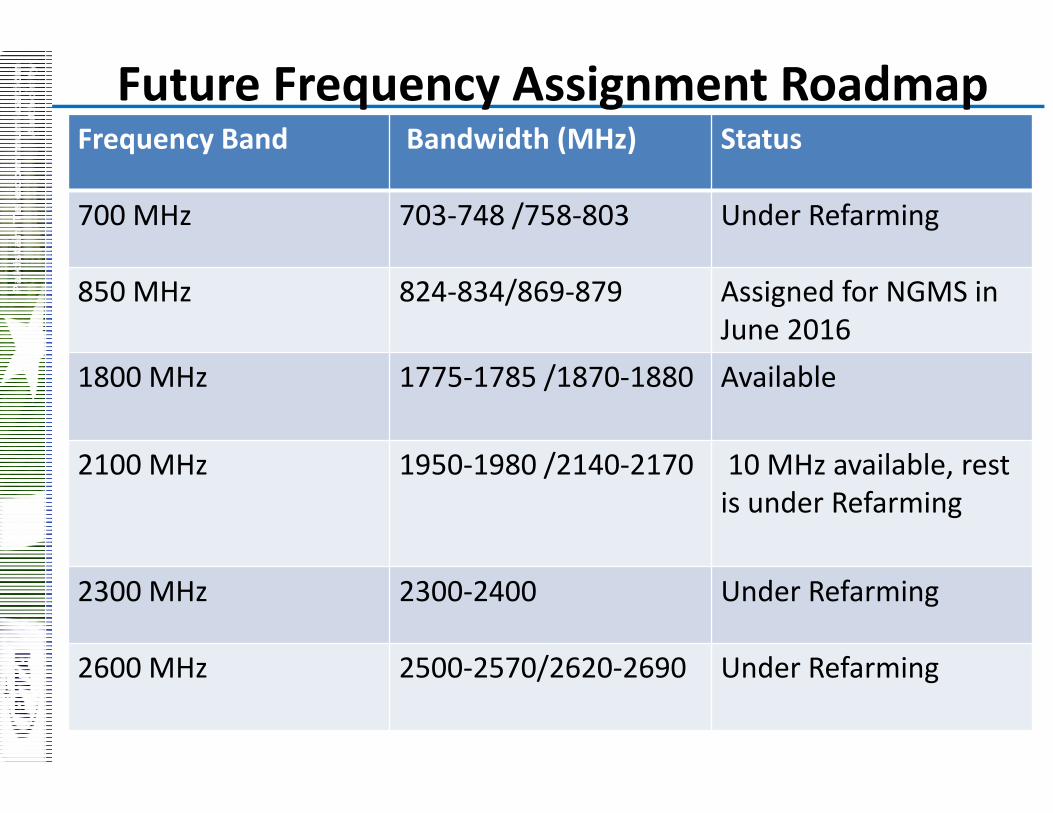
Future Frequency Assignment RoadmapFrequency Band Bandwidth (MHz) Status
700 MHz 703‐748 /758‐803 Under Refarming
850 MHz 824‐834/869‐879 Assigned for NGMS in June 2016
1800 MHz 1775‐1785 /1870‐1880 Available
2100 MHz 1950‐1980 /2140‐2170 10 MHz available, rest is under Refarming
2300 MHz 2300‐2400 Under Refarming
2600 MHz 2500‐2570/2620‐2690 Under Refarming

THANKS

Deployed Broadband Technology Trends
9.3
10.8
79.9
June 2015
Fixed (DSL, HFC, FTTH)Wireless (WiMAX, EvDO, Others)Mobile Broadband

Internet Usage Trend in PakistanSocial
Networking
Main Languages
English
Urdu
Web Portals
Windows Live
Yahoo
Gaming
Playstation
Xbox Live
Ecommerce
Olx
rozee.pk
pakwheels.com
zameen.com
Online Videos
Daily motion
Tune.pk
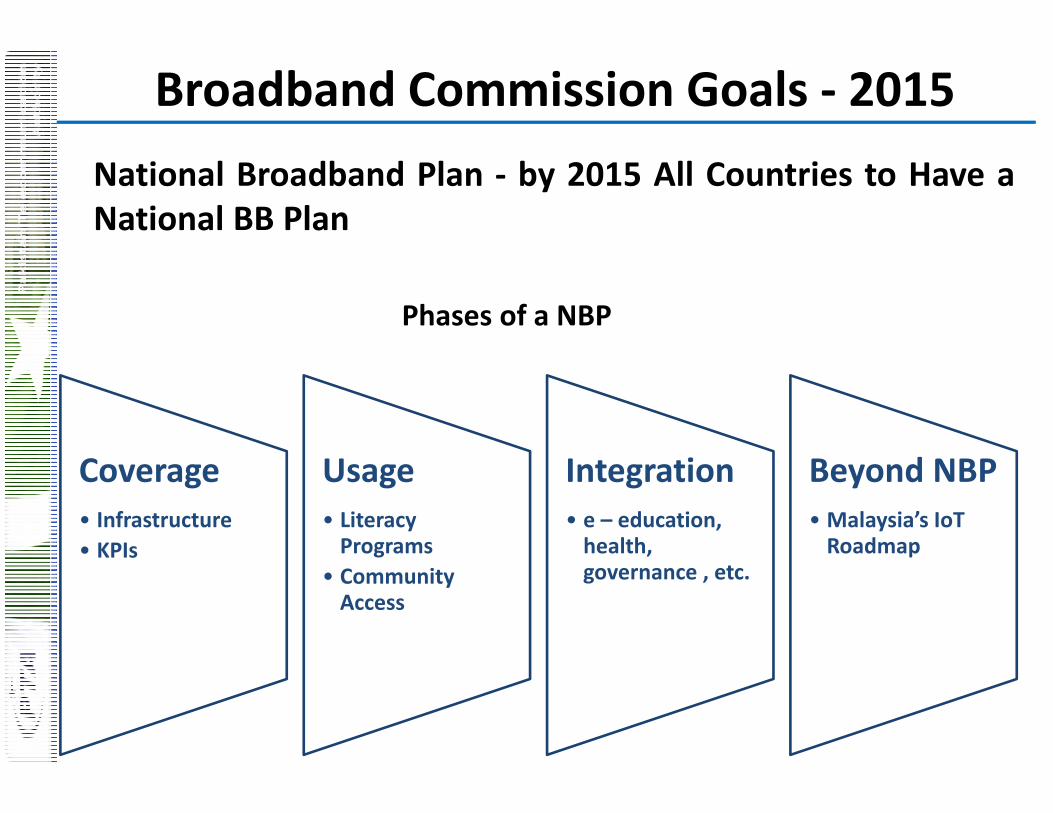
Broadband Commission Goals ‐ 2015National Broadband Plan ‐ by 2015 All Countries to Have aNational BB Plan
Coverage• Infrastructure• KPIs
Usage• Literacy Programs
• Community Access
Integration• e – education, health, governance , etc.
Beyond NBP •Malaysia’s IoT Roadmap
Phases of a NBP

Broadband Growth Challenges
37
Universal Access• Universal Service Funds
This image cannot currently be displayed.
Source : ITU – UNESCO Report 2015
USF Funds With Funding Options for BB ‐ 2013
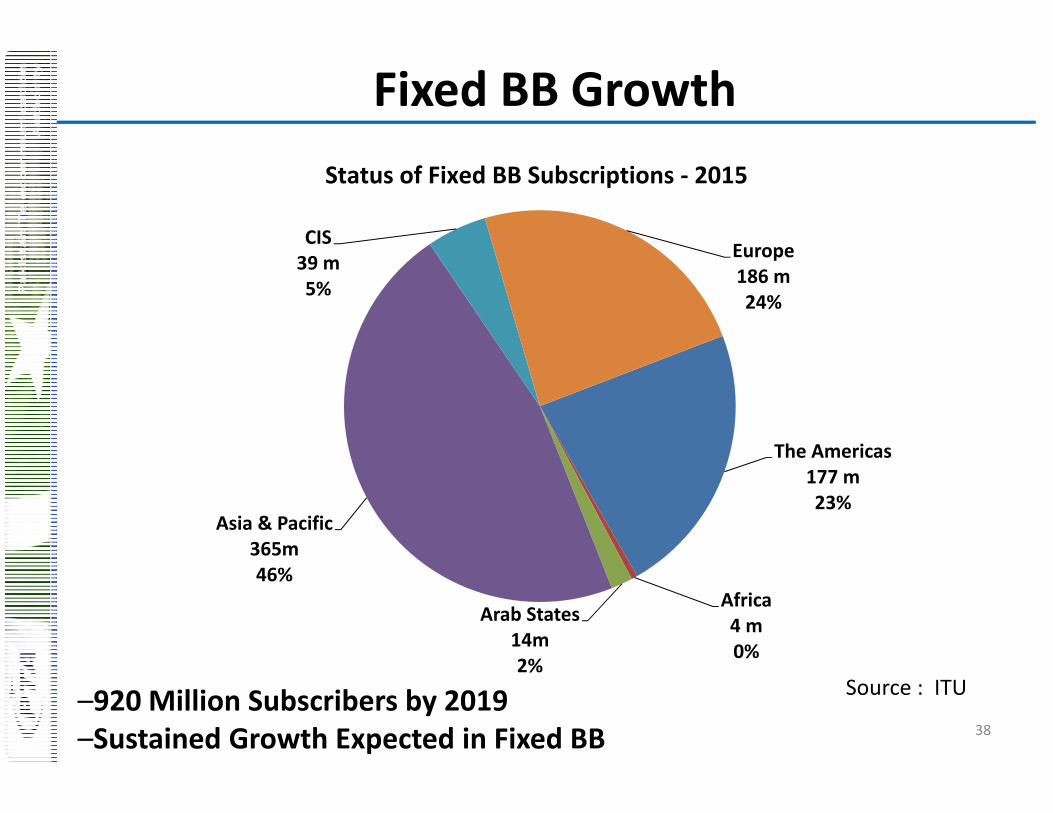
Fixed BB Growth
38–920 Million Subscribers by 2019 –Sustained Growth Expected in Fixed BB
The Americas177 m23%
Africa4 m0%
Arab States14m2%
Asia & Pacific365m46%
CIS39 m5%
Europe186 m24%
Status of Fixed BB Subscriptions ‐ 2015
Source : ITU
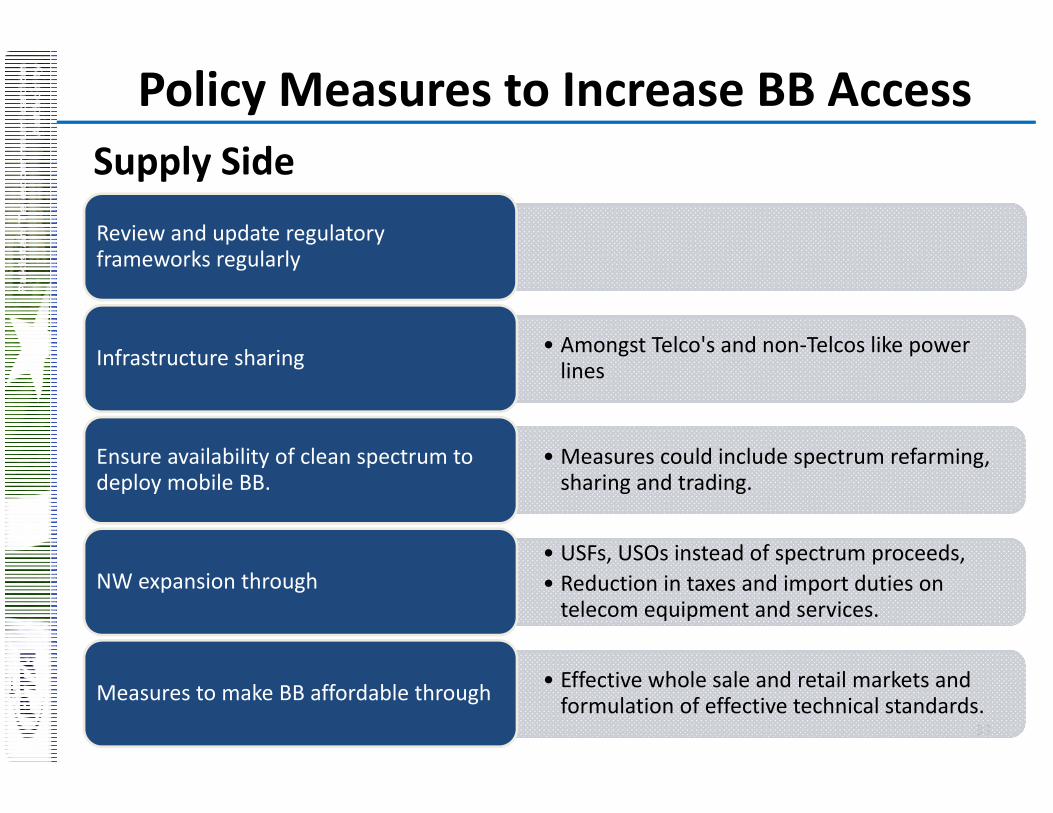
Policy Measures to Increase BB Access
39
Supply Side
Review and update regulatory frameworks regularly
• Amongst Telco's and non‐Telcos like powerlinesInfrastructure sharing
• Measures could include spectrum refarming, sharing and trading.
Ensure availability of clean spectrum to deploy mobile BB.
• USFs, USOs instead of spectrum proceeds, • Reduction in taxes and import duties on telecom equipment and services.
NW expansion through
• Effective whole sale and retail markets and formulation of effective technical standards.Measures to make BB affordable through
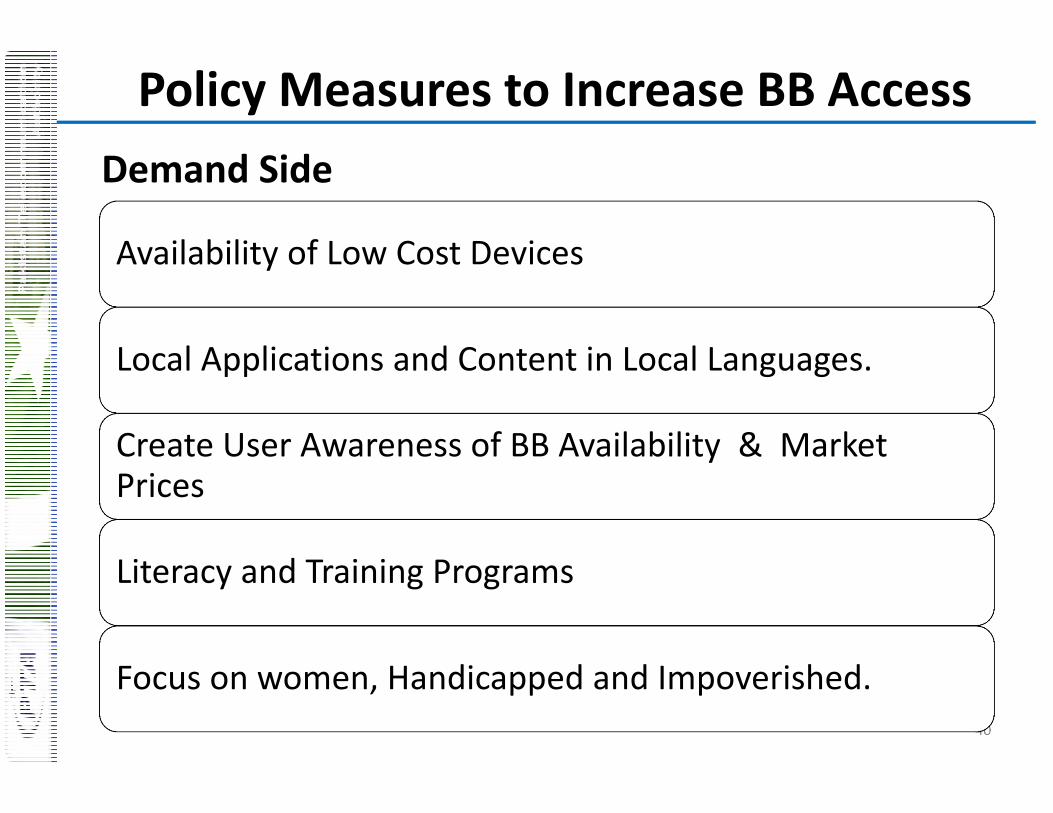
Policy Measures to Increase BB Access
40
Demand Side
Availability of Low Cost Devices
Local Applications and Content in Local Languages.
Create User Awareness of BB Availability & Market Prices
Literacy and Training Programs
Focus on women, Handicapped and Impoverished.

Telecom Data Revenue
42.6 50.3
64.7 72.2 90.0 115
12.4 13.7
15.8 16.4
19.3
25.6
0
5
10
15
20
25
30
0
20
40
60
80
100
120
140
2009‐10 2010‐11 2011‐12 2012‐13 2013‐14 2014‐15
Percen
tage
Rs. B
illion
Revenue from Data Services by telecom OperatorsShare of Data Revenue in Total Telecom Revenues
Fixed Wired BB Subscription/100 Inhabitants
http://www.itu.int/net4/itu‐d/icteye/
This image cannot currently be displayed.

Extensive Data Usage on 3G Networks3G shares % 2G shares %
Voice 3% 87%
Data 97% 13%
1,243 1,322
1,601
1,887 2,392 2,837 2,583 3,021 2,954 3,070 2,892 3,503 3,005
2,908 3,133 2,824
2,888
363 691
4,448
8,634 9,594
13,689 14,841
15,934 16,282 17,942 18,294
20,737 21,932 22,194
24,061
63 143 266 616 996 1,600 1,815 2,536 3,040
3,526 4,701 5,130
6,051
1243 13221964 2578
6903
1161412443
1732518,790
20,604 20,989
23,980 24,339
27,171
29,765 30,149
33,000
‐
5,000
10,000
15,000
20,000
25,000
30,000
35,000
Jan‐14 Mar‐14 Jun‐14 Sep‐14 Dec‐14 Mar‐15 Jun‐15 Aug‐15 Sep‐15 Oct‐15 Nov‐15 Dec‐15 Jan‐16 Feb‐16 Mar‐16 Apr‐16 May‐16
In Terra Bytes (T
Bs)
2G 3G 4G Total
3G Launch
4G Launch
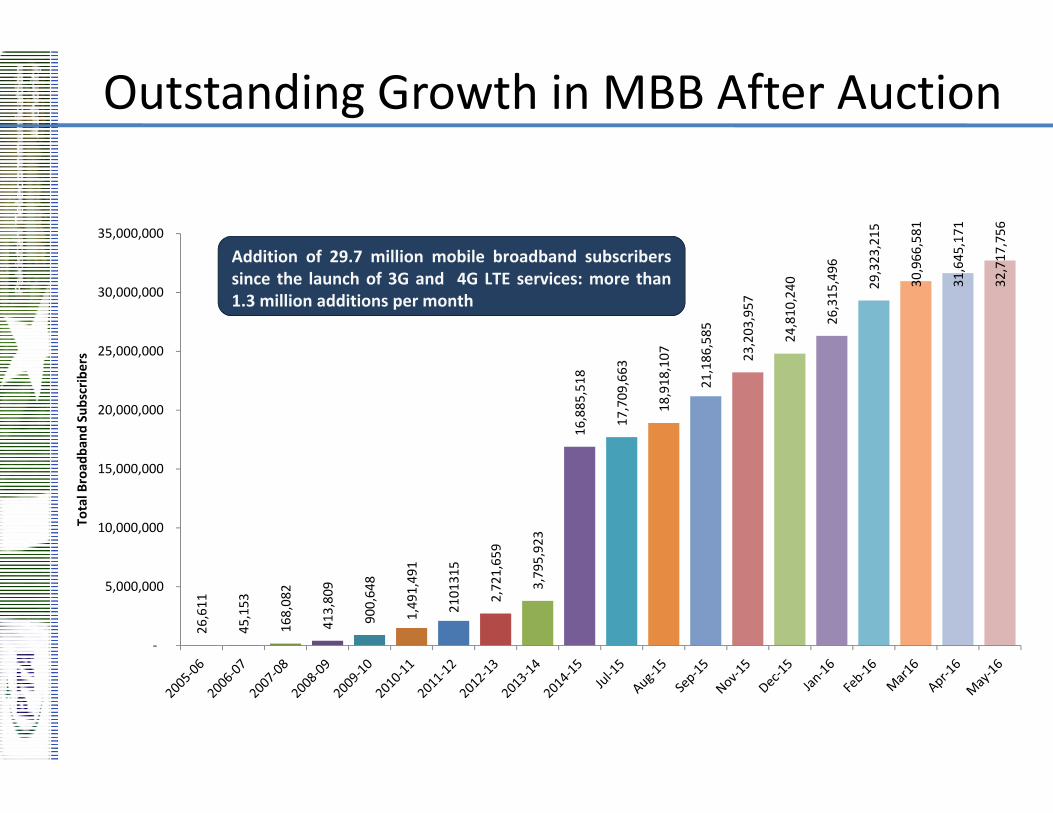
Outstanding Growth in MBB After Auction
26,611
45,153
168,082
413,809
900,648
1,491,491
2101315
2,721,659
3,795,923
16,885,518
17,709,663
18,918,107
21,186,585
23,203,957
24,810,240
26,315,496
29,323,215
30,966,581
31,645,171
32,717,756
‐
5,000,000
10,000,000
15,000,000
20,000,000
25,000,000
30,000,000
35,000,000
Total B
road
band
Sub
scrib
ers
Addition of 29.7 million mobile broadband subscriberssince the launch of 3G and 4G LTE services: more than1.3 million additions per month

National Broadband Plan
45Source‐ The Status of Broadband 2015‐ ITU
Phase 1‐Deployment 2‐Adoption 3‐Integration
Focus BB network availability
BB Access & Capacity Building for effective use
BB integration in economy and society
Examples Optical Fiber Cable & Wireless BB Access networks
Digital literacy programmes,Community access projects
e‐healthE‐governanceE‐educationE‐commerce
Indicators Telecom Indicators Performance Indicators
Outcome/Impact measure

Broadband Focal Issues
46
88% 86% 82% 81%75%
66% 65% 64%
45%37%
31% 29%
14%
0%10%20%30%40%50%60%70%80%90%
100%
Source‐.Planning for Progress‐Why National BB Matters by ITU‐Cisco July 2013
ContextExpectations
Policy Goals
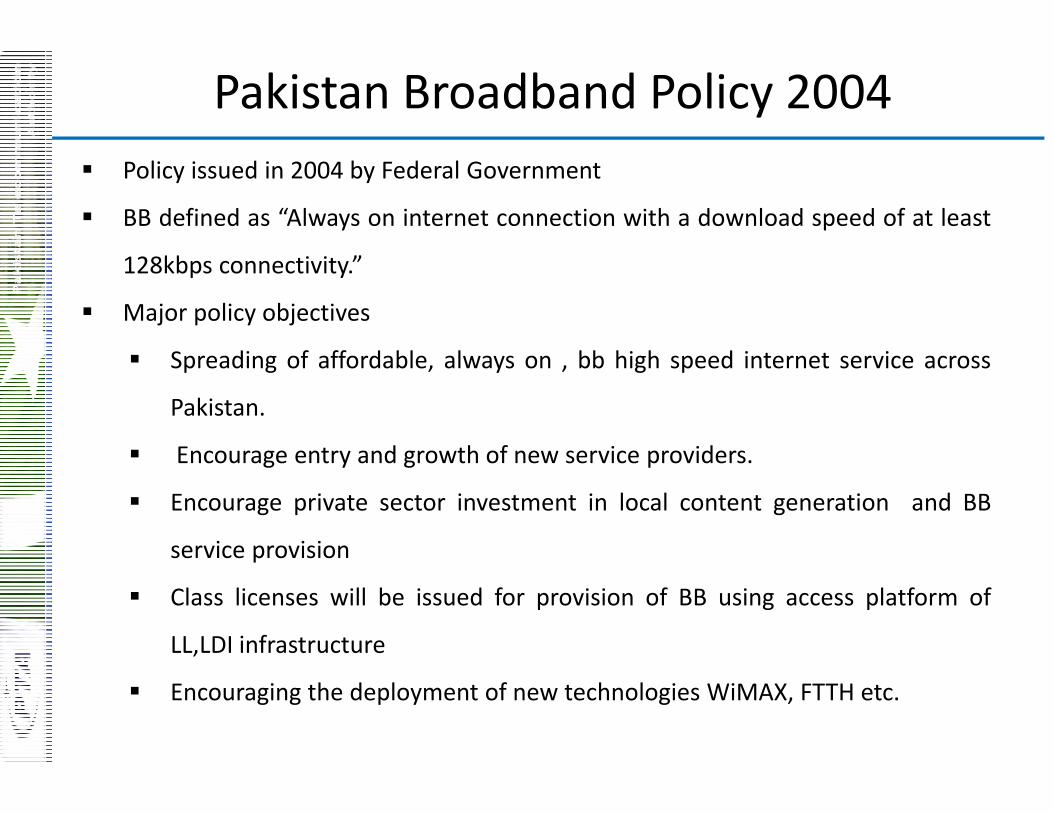
Pakistan Broadband Policy 2004 Policy issued in 2004 by Federal Government
BB defined as “Always on internet connection with a download speed of at least
128kbps connectivity.”
Major policy objectives
Spreading of affordable, always on , bb high speed internet service across
Pakistan.
Encourage entry and growth of new service providers.
Encourage private sector investment in local content generation and BB
service provision
Class licenses will be issued for provision of BB using access platform of
LL,LDI infrastructure
Encouraging the deployment of new technologies WiMAX, FTTH etc.
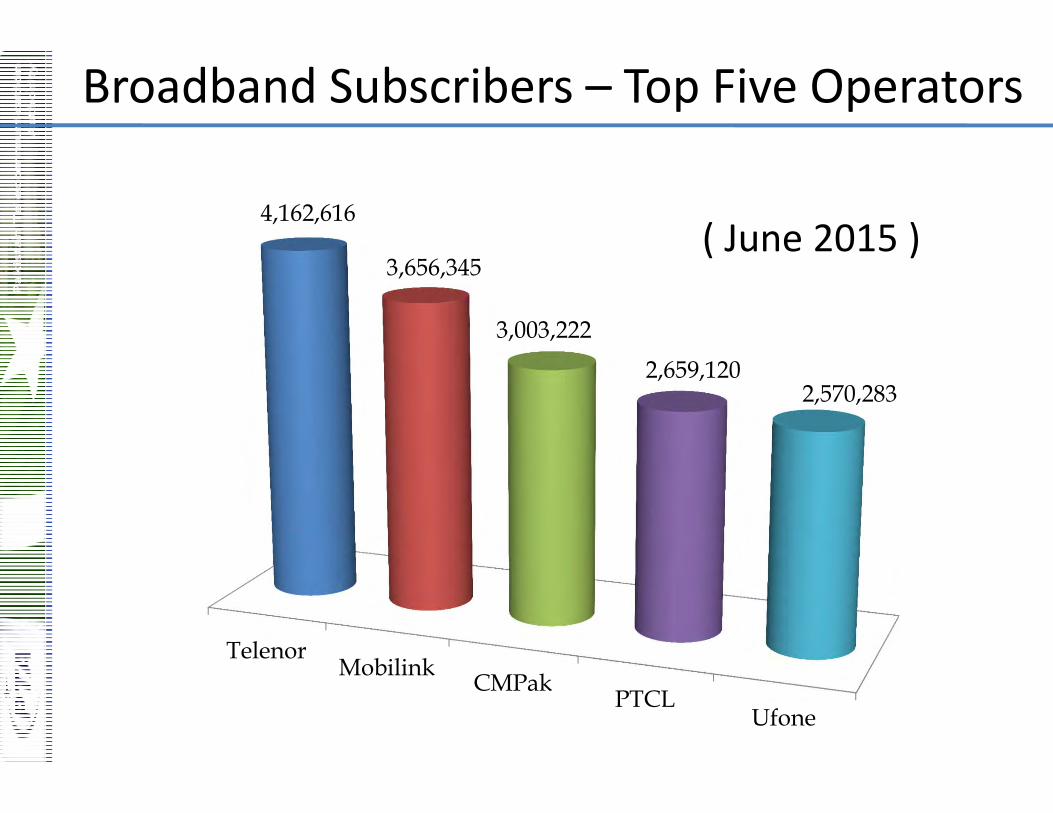
Broadband Subscribers – Top Five Operators
TelenorMobilink CMPak
PTCLUfone
4,162,616
3,656,345
3,003,222
2,659,120 2,570,283
( June 2015 )
ContextExpectations
Policy Goals
Pakistan Telecom Policy 2015Vision Universally available, affordable and quality telecommunication services
Open Competitive and Well managed markets
Used by all
Benefit to economy and Society
Guiding Principles
Market Driven
Appropriate Regulation
Forward looking
Accelerated Digitalization
Universal Access
Government Intervention Only When necessary

ContextExpectations
Promote competition
Ensure consumer welfare
Encourage Innovation
Promote Private sector investment
Efficient allocation and management of
Spectrum, Infrastructure and Right of ways
Affordable broadband services for every
Pakistani
Maximize the use of Broadband in public sector
especially Health Care, Education and Utilities
Policy Goals
Licensing Framework
VoIP and OTT
Net Neutrality
Satellite based
broadband
Wi‐Fi off‐loading and convergence
Spectrum Re‐farming
Spectrum Trading
Areas of Focus
Policy Goals
Telecom Policy 2015

BB Growth Driver‐IOT This image cannot currently be displayed.
Source‐ Ericsson Mobility Report June 2016

Fixed Vs Mobile Broadband Subscription growth
52
This image cannot currently be displayed.
Source‐ Ericsson Mobility Report June 2016
Source‐ ITU
Driver of BB Data DemandThis image cannot currently be displayed.

Fixed Broadband Subscriptions
54
This image cannot currently be displayed.
This image cannot currently be displayed.

Tremendous growth in Mobile Broadband
55
The rapid expansion of Asia‐Pacific is squeezing other regions in terms of regional market shares. For example, Europe and the Americas both saw declining proportional shares of mobile broadband subscribers from 2014 to 2015 despite absolute increases in the number of subscribers. Source‐ The Status of Broadband 2015‐ ITU
This image cannot currently be displayed.

Fixed Vs Mobile Broadband Subscription
56
This image cannot currently be displayed.
This image cannot currently be displayed.
What is Broadband
57
• Traditionally, broadband has often been defined in terms of data transmissionspeed (i.e., the amount of data that can be transmitted across a networkconnection in a given period of time, typically one second, also known as the datatransfer rate or throughput).
• To address these limitations, some countries and international organizations(e.g., OECD) have decided not to categorize broadband in terms of speed, but areinstead looking at broadband in terms of functionality—focusing on what can andcannot be done with a certain type of connection.
• In general
Broadband means a fixed‐line and /or wireless connection that enables the delivery of voice, video, and data at high speed to any node with a similar connection, whether around the corner or
around the world
Source‐ ITU‐ http://broadbandtoolkit.org/1.2

Broadband Technologies
58
• Fixed BroadBand (FBB)• Digital Subscriber Line (DSL) ‐ Wireline transmission technology that transmits
data faster over traditional copper telephone lines already installed to homes andbusinesses.
• Asymmetric DSL‐ Provides faster speed in the downstream direction than theupstream direction for home users.
• Symmetric DSL‐ typically provides significant bandwidth for both upstreamand downstream e.g. video Conference.
• Cable Modem‐ Provides broadband using the coaxial cables• Fiber ‐ transmits data at speeds far exceeding current DSL or cable modem speeds,
typically by tens or even hundreds of Mbps.• Mobile BroadBand (MBB)
• Wireless LAN‐ provide wireless broadband access over shorter distances to extendthe reach of a "last‐mile" Wireline or fixed wireless broadband connection withina home, building, or campus environment.
• Mobile Broadband‐ Provide wireless broadband services using HSPA,CDMA,LTE,LTE‐A
• Satellite‐ provide wireless broadband in remote or sparsely populated areas usingsatellite. Source‐ https://www.fcc.gov/general/types‐broadband‐connections
MBB – Wireless TechnologiesThis image cannot currently be displayed.
Source‐ 3GPP Alliance, UMTS Forum, InformaTelecoms & Media, Motorola, ZTE, Huawei, internal analysis

THANKS
60