Broadband (BB) Access and Its Impact on Sales Tax (ST) Collections
36
Broadband (BB) Access and Its Impact on Sales Tax (ST) Collections Mohan Menon & Semoon Chang University of South Alabama ASSA Annual Meeting, Chicago, Illinois January 5-8, 2012
Transcript of Broadband (BB) Access and Its Impact on Sales Tax (ST) Collections
Broadband (BB) Access and Its Impact
on Sales Tax (ST) Collections
Mohan Menon & Semoon Chang
University of South Alabama
ASSA Annual Meeting, Chicago, Illinois
January 5-8, 2012

Agenda
Genesis of the issue
The situation today
Literature review
• General
• BB access helping local economies
• BB access hurting local economies
Recent events
• Main Street Fairness Act
• The Amazon law
• Legal actions
The case of Alabama

Genesis of the Issue Prior to 1992, states recognized potential ST losses from out-
of-state MOTO transactions.
States such as North Dakota tried to impose mandatory ST
collections on MOTO transactions.
1992 SC landmark ruling makes collection & remittance of ST
on MOTO transactions unconstitutional if businesses have
not physical presence in the state. (Quill v. ND)
1992 ruling did not address the concept of “use tax.”
Few consumers actually remit use taxes (Brunori, 2001).
The Internet Tax Freedom Act (1998) prohibits federal, state,
and local taxes on „Net access and commerce . . . extended
through 2014.
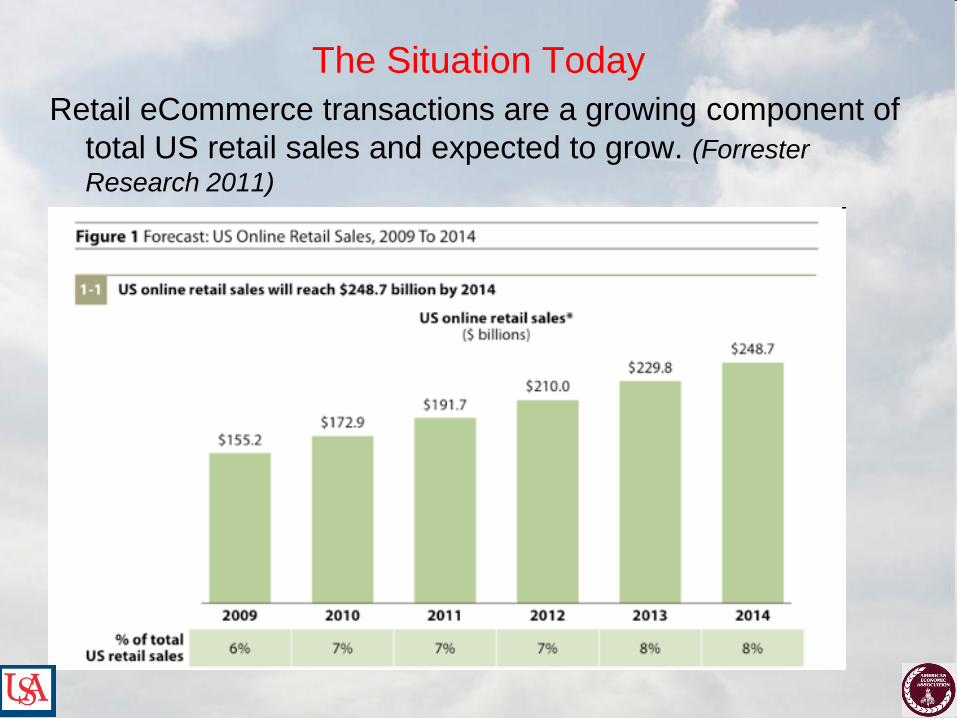
The Situation Today
Retail eCommerce transactions are a growing component of
total US retail sales and expected to grow. (Forrester
Research 2011)
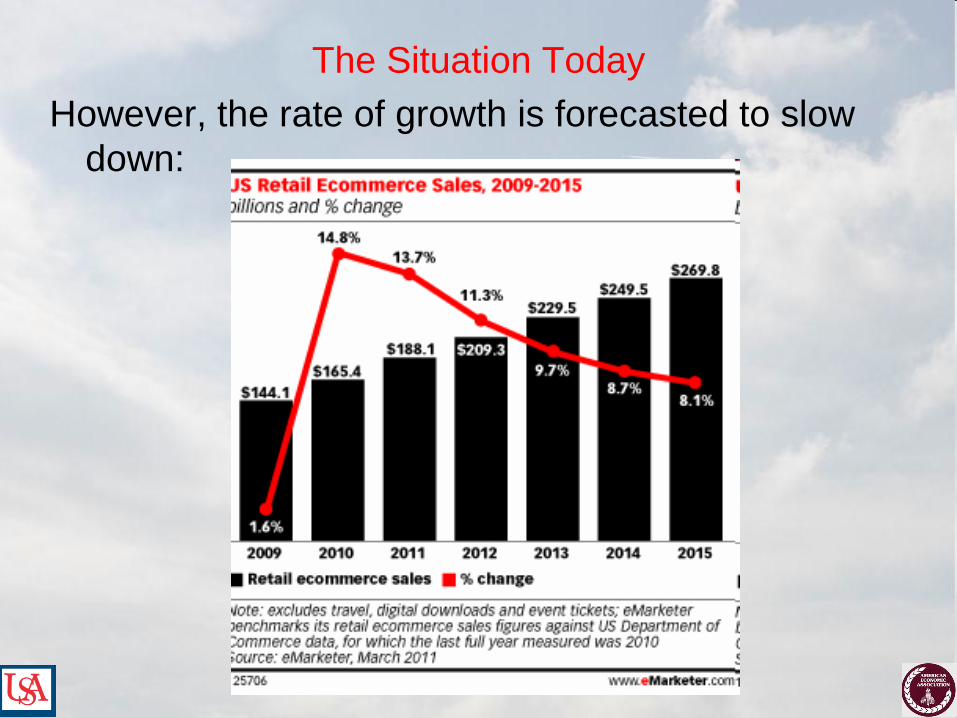
The Situation Today
However, the rate of growth is forecasted to slow
down:

The Situation Today
78.3 of the total pop in the US has „Net access. (Internet
World Stats, 2011)
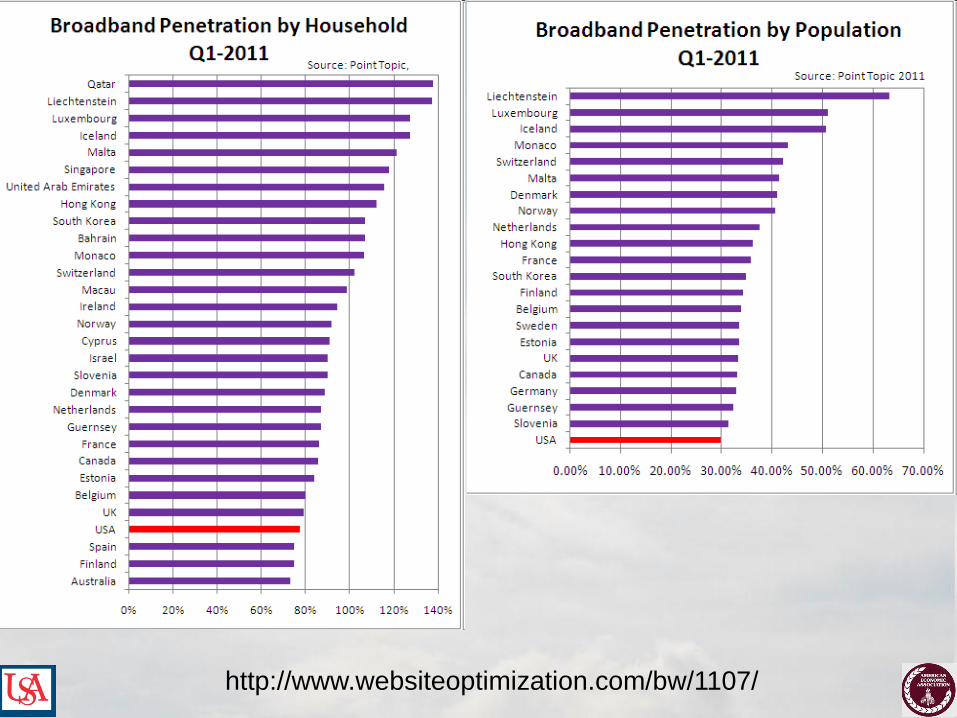
US BB penetration by household was 77.5% in Q1 2011.
(websiteoptimization.com/bw/1107/)
Biggest increase in „Net access is in the BB space which
accounts for 66% of all connections (Smith, 2010)
eMarketer estimates 87.5% of US „Net users aged 14 and
older or 178.5m people will browse or research products
online in 2011. 83% of this group (148.1m) will purchase
online.
Online retailers potentially face 45 state-wide ST
jurisdictions and over 8,000 local tax jurisdictions.

eCommerce as a Percentage of Total U.S. Retail Sales
Source: U.S. Census e-Stats
Retail Sales>> Total($B) eCommerce($B) % of Total
2000 2,989 28 0.9
2001 3,068 34 1.1
2002 3,134 45 1.4
2003 3,268 58 1.8
2004 3,480 74 2.1
2005 3,698 92 2.5
2006 3,882 114 2.9
2007 4,005 137 3.4
2008 3,959 142 3.6
2009 3,638 145 4.3
2010 3,888 166 4.3
2011 (1Q+2Q) 2,071 93 4.5
Latest Online Buying Wave
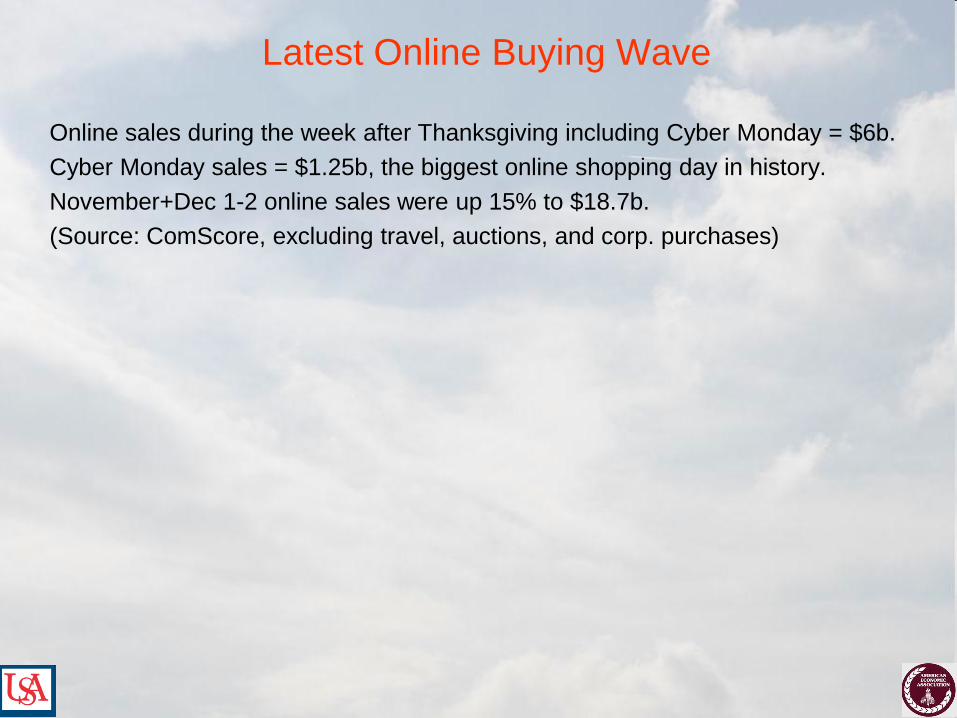
Online sales during the week after Thanksgiving including Cyber Monday = $6b.
Cyber Monday sales = $1.25b, the biggest online shopping day in history.
November+Dec 1-2 online sales were up 15% to $18.7b.
(Source: ComScore, excluding travel, auctions, and corp. purchases)
State Sales Tax Situation
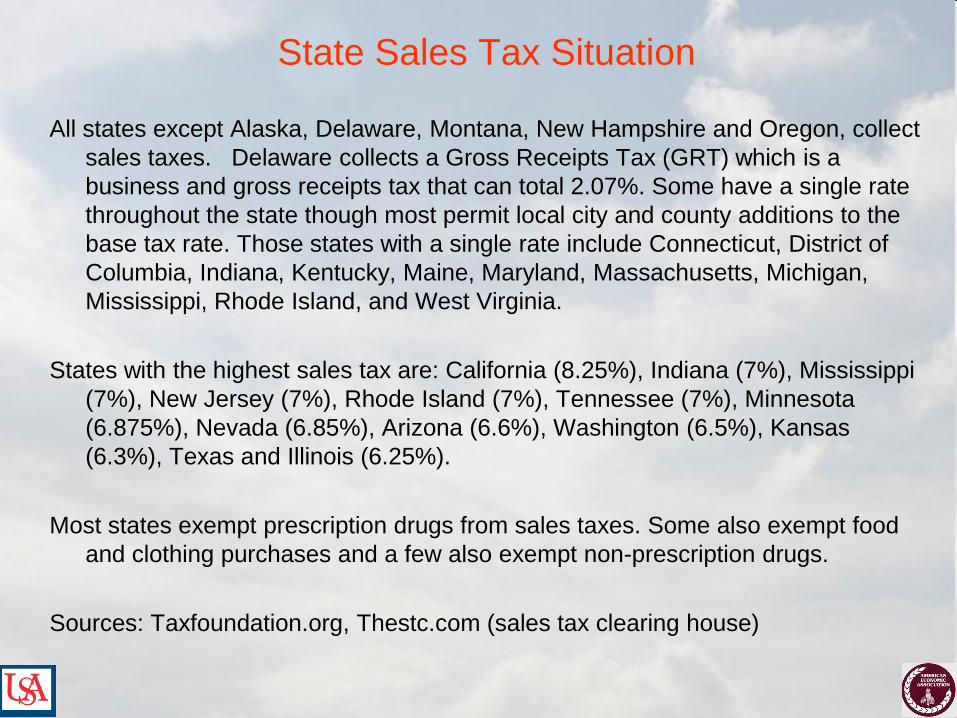
All states except Alaska, Delaware, Montana, New Hampshire and Oregon, collect
sales taxes. Delaware collects a Gross Receipts Tax (GRT) which is a
business and gross receipts tax that can total 2.07%. Some have a single rate
throughout the state though most permit local city and county additions to the
base tax rate. Those states with a single rate include Connecticut, District of
Columbia, Indiana, Kentucky, Maine, Maryland, Massachusetts, Michigan,
Mississippi, Rhode Island, and West Virginia.
States with the highest sales tax are: California (8.25%), Indiana (7%), Mississippi
(7%), New Jersey (7%), Rhode Island (7%), Tennessee (7%), Minnesota
(6.875%), Nevada (6.85%), Arizona (6.6%), Washington (6.5%), Kansas
(6.3%), Texas and Illinois (6.25%).
Most states exempt prescription drugs from sales taxes. Some also exempt food
and clothing purchases and a few also exempt non-prescription drugs.
Sources: Taxfoundation.org, Thestc.com (sales tax clearing house)

State Sales Tax Situation
States with the highest sales tax are:
California 8.25%
Indiana 7%
Mississippi 7%
New Jersey 7%
Rhode Island 7%
Tennessee 7%
Minnesota 6.875%
Nevada 6.85%
Arizona 6.6%
Washington 6.5%
Kansas 6.3%
Texas and Illinois 6.25%
Most states exempt prescription drugs from sales taxes. Some also exempt food
and clothing purchases and a few also exempt non-prescription drugs.
Sources: Taxfoundation.org, Thestc.com (sales tax clearing house)

Literature Review
Consumers in high tax areas are more likely to buy online.
(Goolsbee, 2000)
Given the small % of eCommerce sales to the total retail, the loss
of ST collection is estimated to be small. (Goolsbee, 2001,
Bruce, Fox, & Luna, 2009)
BB access does enhance economic growth and performance incl.
growth in employment, number of businesses overall and IT
related businesses. (US Dept. of Commerce, 2006)
BB expansion does not have direct, positive impact on state
income (GDP) but there is some evidence of employment
expansion in certain industries (Thompson & Garbacz, 2008)
Literature Review
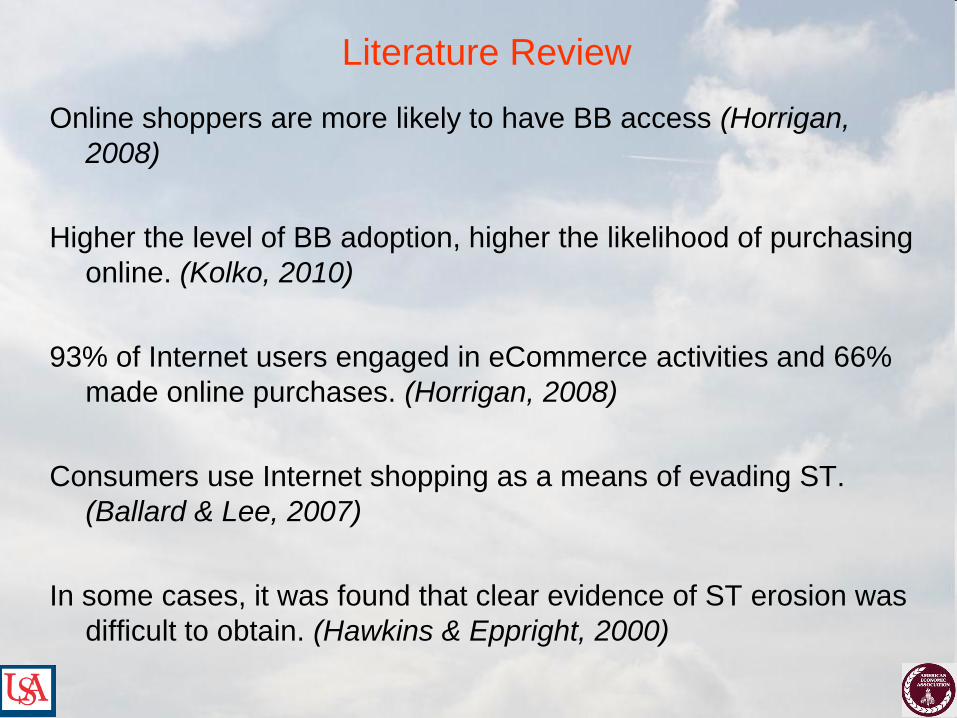
Online shoppers are more likely to have BB access (Horrigan,
2008)
Higher the level of BB adoption, higher the likelihood of purchasing
online. (Kolko, 2010)
93% of Internet users engaged in eCommerce activities and 66%
made online purchases. (Horrigan, 2008)
Consumers use Internet shopping as a means of evading ST.
(Ballard & Lee, 2007)
In some cases, it was found that clear evidence of ST erosion was
difficult to obtain. (Hawkins & Eppright, 2000)

Research divided amongst two schools of thought:
Broadband (BB) helping local retailers & governments:
Research Online, Buy Offline (ROBO) helps local retailers. 75-87%
RO and buy locally; after RO, 39% contacted local businesses by
phone and 32% visited in person. (BIGResearch, 2006; Forrester,
2007; comScore, 2008)
No significant relationship between BB adoption rates and changes in
retail sales tax collections. (Whitacre & Brooks, 2010)
Consumers move away from online shopping when a store opens
locally and they pay less attention to online discounts in such
instances. (Forman, Ghose, & Goldfarb, 2009)
USDA‟s pilot BB program had a positive impact on local retail
establishments. (Kandilov and Renkow, 2010)
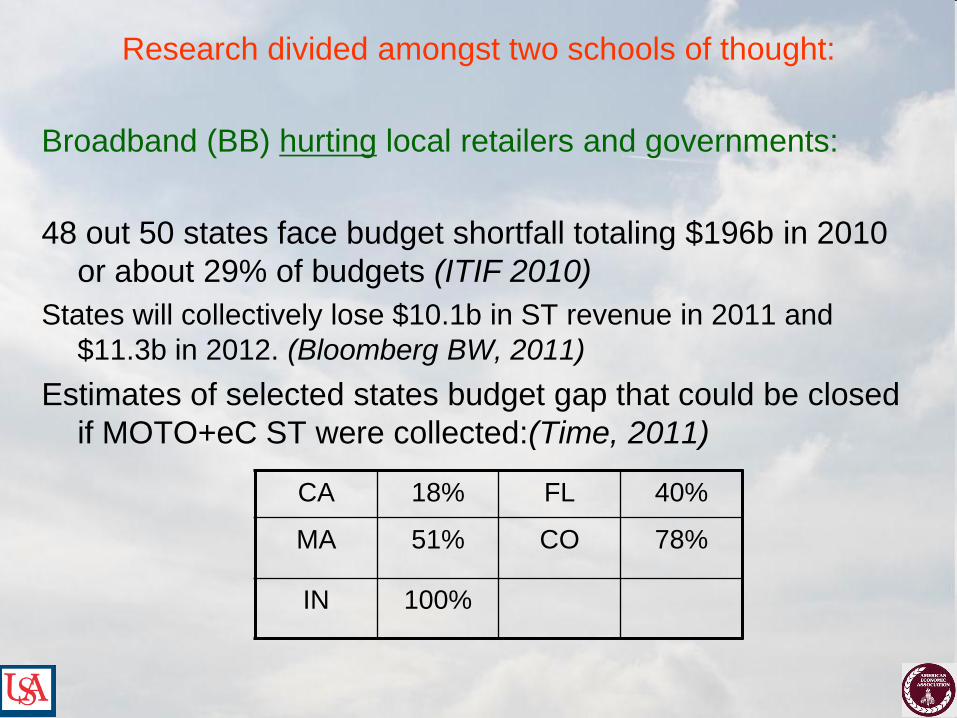
Research divided amongst two schools of thought:
Broadband (BB) hurting local retailers and governments:
48 out 50 states face budget shortfall totaling $196b in 2010
or about 29% of budgets (ITIF 2010)
States will collectively lose $10.1b in ST revenue in 2011 and
$11.3b in 2012. (Bloomberg BW, 2011)
Estimates of selected states budget gap that could be closed
if MOTO+eC ST were collected:(Time, 2011)
CA 18% FL 40%
MA 51% CO 78%
IN 100%
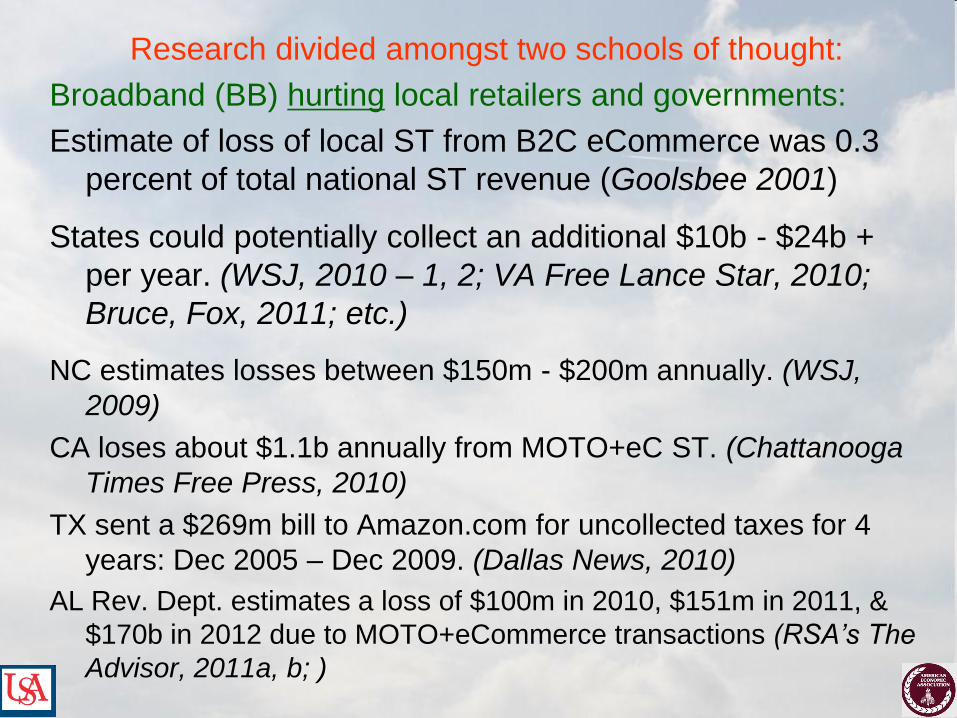
Research divided amongst two schools of thought:
Broadband (BB) hurting local retailers and governments:
Estimate of loss of local ST from B2C eCommerce was 0.3
percent of total national ST revenue (Goolsbee 2001)
States could potentially collect an additional $10b - $24b +
per year. (WSJ, 2010 – 1, 2; VA Free Lance Star, 2010;
Bruce, Fox, 2011; etc.)
NC estimates losses between $150m - $200m annually. (WSJ,
2009)
CA loses about $1.1b annually from MOTO+eC ST. (Chattanooga
Times Free Press, 2010)
TX sent a $269m bill to Amazon.com for uncollected taxes for 4
years: Dec 2005 – Dec 2009. (Dallas News, 2010)
AL Rev. Dept. estimates a loss of $100m in 2010, $151m in 2011, &
$170b in 2012 due to MOTO+eCommerce transactions (RSA’s The
Advisor, 2011a, b; )

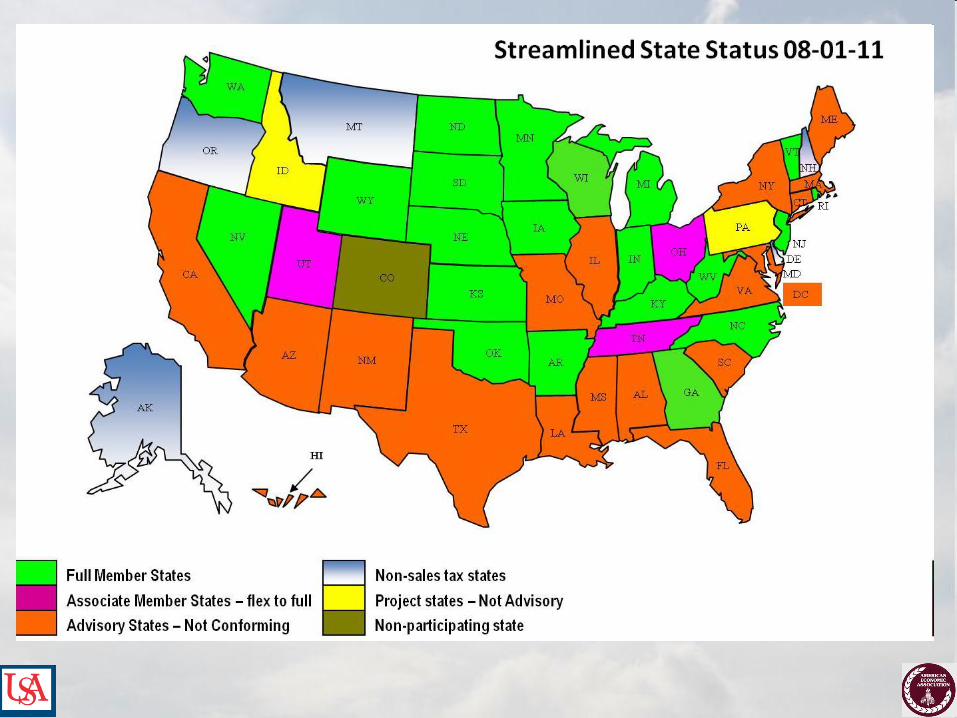
Main Street Fairness Act (2011) requiring states to adopt the
Streamlined Sales and Use Tax Agreement (SSUTA). 24
states have adopted the SSUTA.
This agreement requires states to, among other things,
• adhere to uniform product definitions,
• adopt uniform requirements for filing sales tax returns,
• administer both state and local sales tax collection through a
single state office, and
• allow retailers to register through a centralized, one-stop multi-
state registration system.

The Amazon Law
Some of the signatories to the Streamlined Sales Tax Project
(SSTP) adopted the common language of an Amazon law:
A person with no physical presence in the state is presumed to be
engaging in business in the state if:
1. That person enters into an agreement with an in-state resident under
which the resident, for a commission or other consideration, directly or
indirectly refers potential customers, whether by link or an Internet
website, to that person;
2. The cumulative gross receipts from sales by that person attributable
to referred customers by all residents with such an arrangement are
greater than $10,000 during the preceding 12-month period. The
nexus presumption would be rebuttable by proof that the resident
made no solicitation in the state that would satisfy U.S. constitutional
nexus requirements on behalf of the person presumed to be engaging
in business in the state.
(Tax Foundation, 2010)
Latest cases and actions:
IL vs. Performance MKT Assn. (2011 – )
TX vs. Amazon.com (2011) – Amazon appealing order.
CA vs. Amazon.com (2010 – )
CO vs. DMA (2010 - 2011) – State lost.
NC vs. Amazon.com (2010) - State lost.
NY vs. Amazon.com (2008 - )
RI confirmed it raised no money from its efforts. (2010)
Many states backed off from their efforts, incl. MS.
Bills pending in AZ, CA, FL, HI, MA, MN, & PA.

Latest cases and actions: Affiliates and their role:
Amazon.com & Overstock.com threatened or dropped affiliates.
HI and CA backed down in 2010.
There are 200,000 affiliate marketers in the U.S. tied to about
$14b in total revenues. (PMA 2010)
Affiliates drive between 8% - 20% of the sales for eCommerce
sites. (Forrester Research 2010)
The Case of Alabama

Alabama Estimated and Actual ST+ Use Tax Collections on
eCommerce Sales ($m)
(Bruce, Fox, & Luna, 2009)
Year ST and Use
Taxes Due
ST and Use
Taxes Collected
Variance
2007 429.7 321.4 108.3
2008 459.4 343.5 115.8
2009 445.0 332.8 112.2
2010 588.3 440.0 148.3
2011 671.5 502.2 169.3
2012 750.2 561.0 189.2
Total 3,344.1 2,500.9 843.1
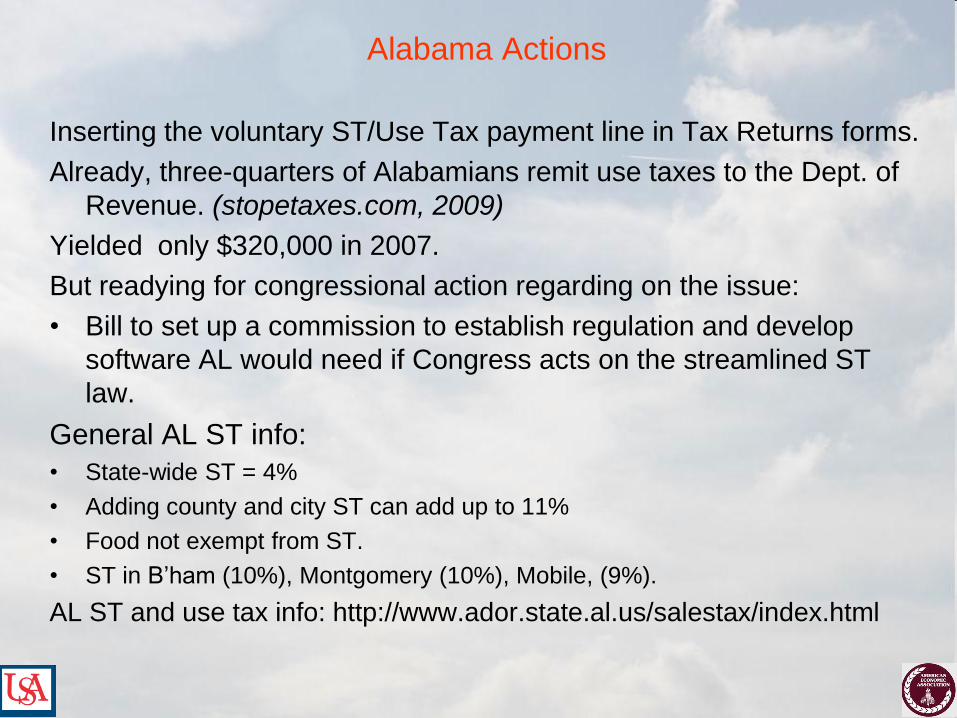
Alabama Actions
Inserting the voluntary ST/Use Tax payment line in Tax Returns forms.
Already, three-quarters of Alabamians remit use taxes to the Dept. of
Revenue. (stopetaxes.com, 2009)
Yielded only $320,000 in 2007.
But readying for congressional action regarding on the issue:
• Bill to set up a commission to establish regulation and develop
software AL would need if Congress acts on the streamlined ST
law.
General AL ST info:
• State-wide ST = 4%
• Adding county and city ST can add up to 11%
• Food not exempt from ST.
• ST in B‟ham (10%), Montgomery (10%), Mobile, (9%).
AL ST and use tax info: http://www.ador.state.al.us/salestax/index.html
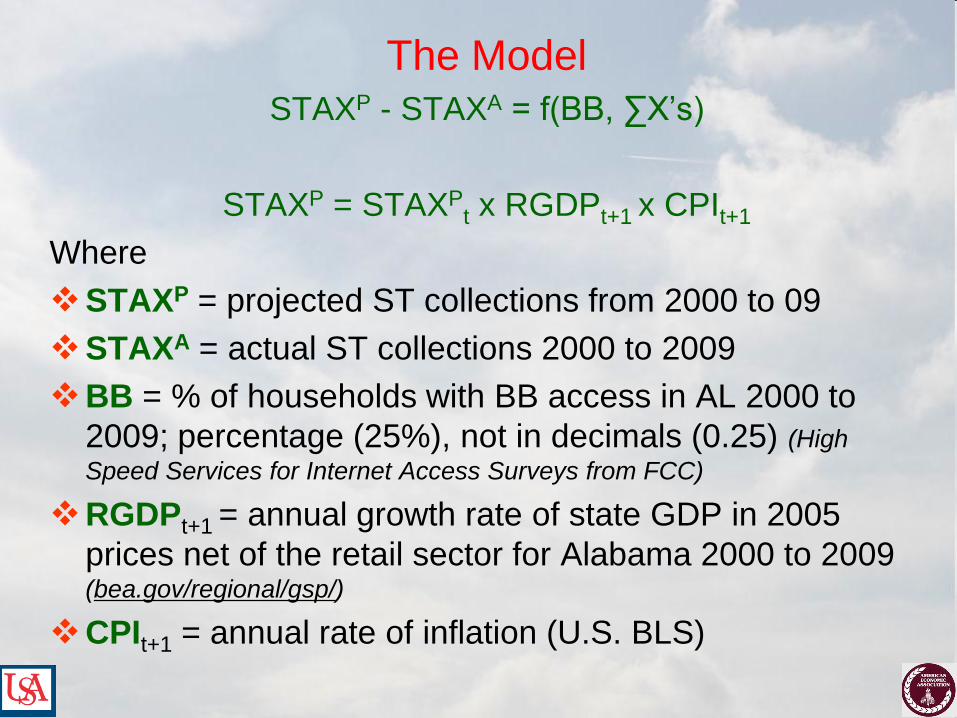
The Model
STAXP - STAXA = f(BB, ∑X‟s)
STAXP = STAXPt x RGDPt+1 x CPIt+1
Where
STAXP = projected ST collections from 2000 to 09
STAXA = actual ST collections 2000 to 2009
BB = % of households with BB access in AL 2000 to
2009; percentage (25%), not in decimals (0.25) (High
Speed Services for Internet Access Surveys from FCC)
RGDPt+1 = annual growth rate of state GDP in 2005
prices net of the retail sector for Alabama 2000 to 2009 (bea.gov/regional/gsp/)
CPIt+1 = annual rate of inflation (U.S. BLS)

Alabama ST Loss Calculation
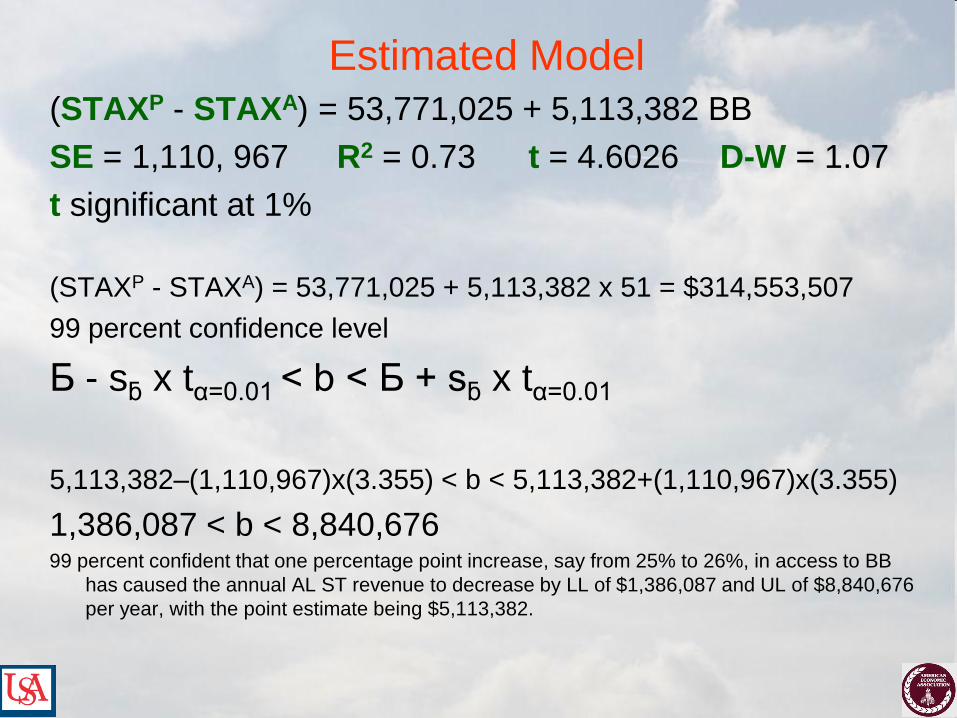
Estimated Model
(STAXP - STAXA) = 53,771,025 + 5,113,382 BB
SE = 1,110, 967 R2 = 0.73 t = 4.6026 D-W = 1.07
t significant at 1%
(STAXP - STAXA) = 53,771,025 + 5,113,382 x 51 = $314,553,507
99 percent confidence level
Ƃ - sƃ x tα=0.01 < b < Ƃ + sƃ x tα=0.01
5,113,382–(1,110,967)x(3.355) < b < 5,113,382+(1,110,967)x(3.355)
1,386,087 < b < 8,840,676 99 percent confident that one percentage point increase, say from 25% to 26%, in access to BB
has caused the annual AL ST revenue to decrease by LL of $1,386,087 and UL of $8,840,676
per year, with the point estimate being $5,113,382.

Estimated Model
(STAXP - STAXA) = 53,771,025 + 5,113,382 BB
SE = 1,110, 967 R2 = 0.73 t = 4.6026 D-W = 1.07
t significant at 1%
(STAXP - STAXA) = 53,771,025 + 5,113,382 x 51 = $314,553,507
90 percent confidence level
Ƃ - sƃ x tα=0.10 < b < Ƃ + sƃ x tα=0.10
5,113,382 – (1,110,967) x (1.860) < b < 5,113,382 + (1,110,967) x (1.860)
5,113,382 – 2,066,399 < b < 5,113,382 + 2,066,399
3,046,983 < b < 7,179,781
We are 90 percent confident that one percentage point increase, say from
25% to 26%, in access to broad band has caused the annual Alabama
sales tax revenue to decrease by the lower limit of $3,046,983 and the
upper limit of $7,179,781 per year, with the point estimate being
$5,113,382.
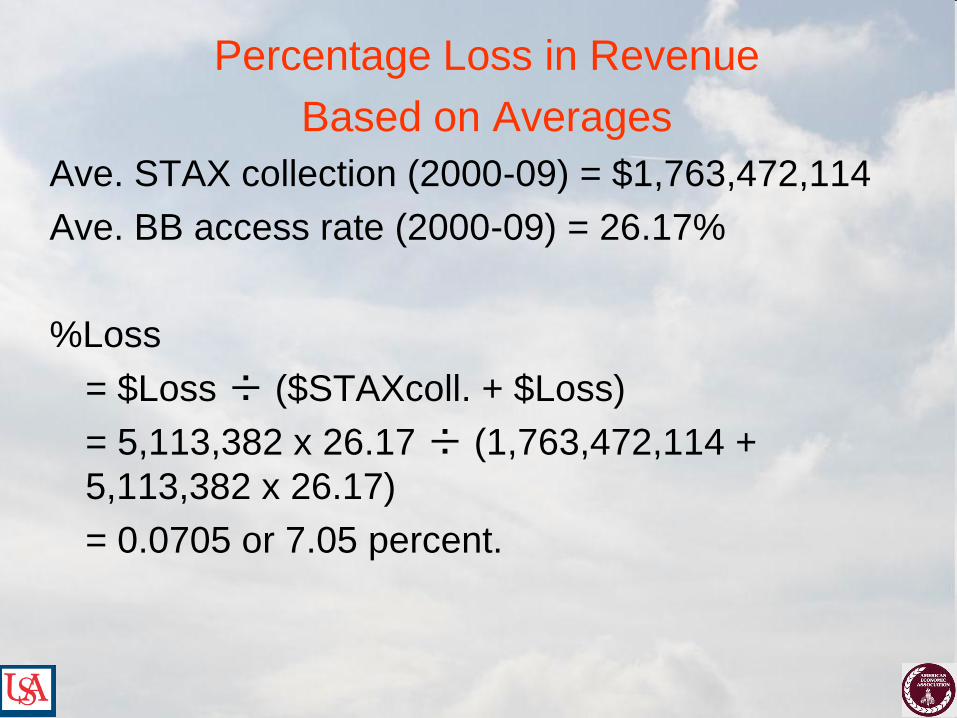
Percentage Loss in Revenue
Based on Averages
Ave. STAX collection (2000-09) = $1,763,472,114
Ave. BB access rate (2000-09) = 26.17%
%Loss
= $Loss ÷ ($STAXcoll. + $Loss)
= 5,113,382 x 26.17 ÷ (1,763,472,114 +
5,113,382 x 26.17)
= 0.0705 or 7.05 percent.
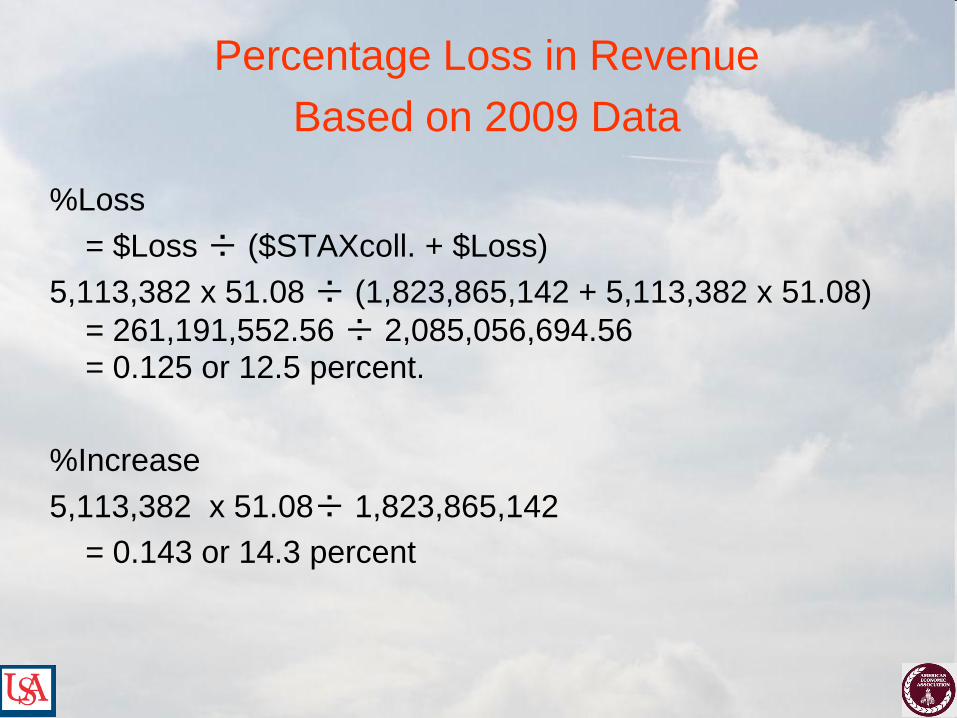
Percentage Loss in Revenue
Based on 2009 Data
%Loss
= $Loss ÷ ($STAXcoll. + $Loss)
5,113,382 x 51.08 ÷ (1,823,865,142 + 5,113,382 x 51.08)
= 261,191,552.56 ÷ 2,085,056,694.56 = 0.125 or 12.5 percent.
%Increase
5,113,382 x 51.08÷ 1,823,865,142
= 0.143 or 14.3 percent
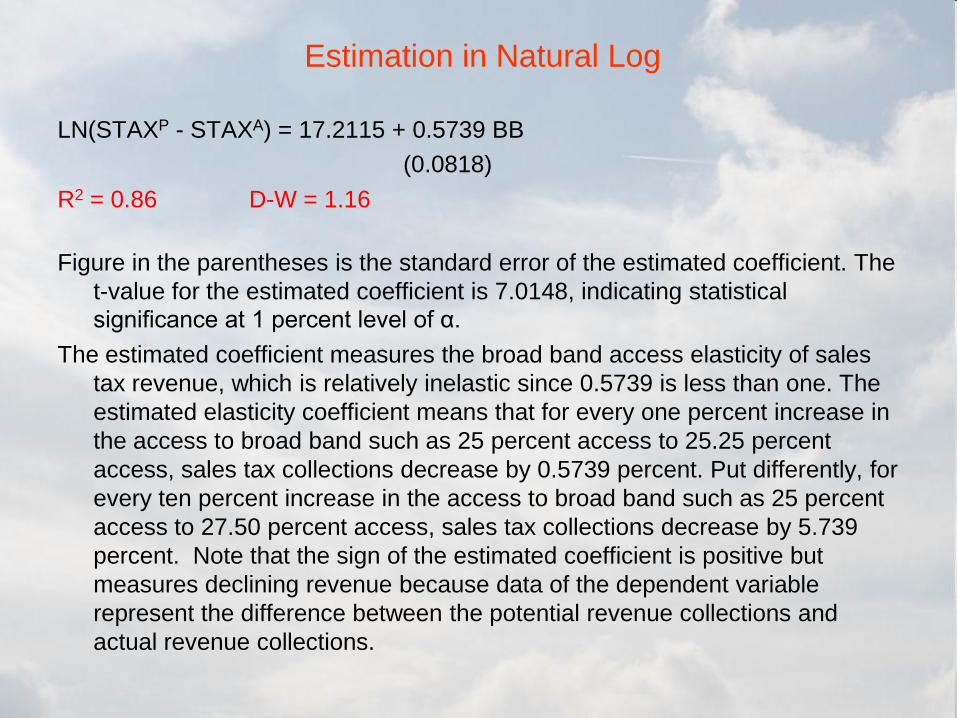
Estimation in Natural Log
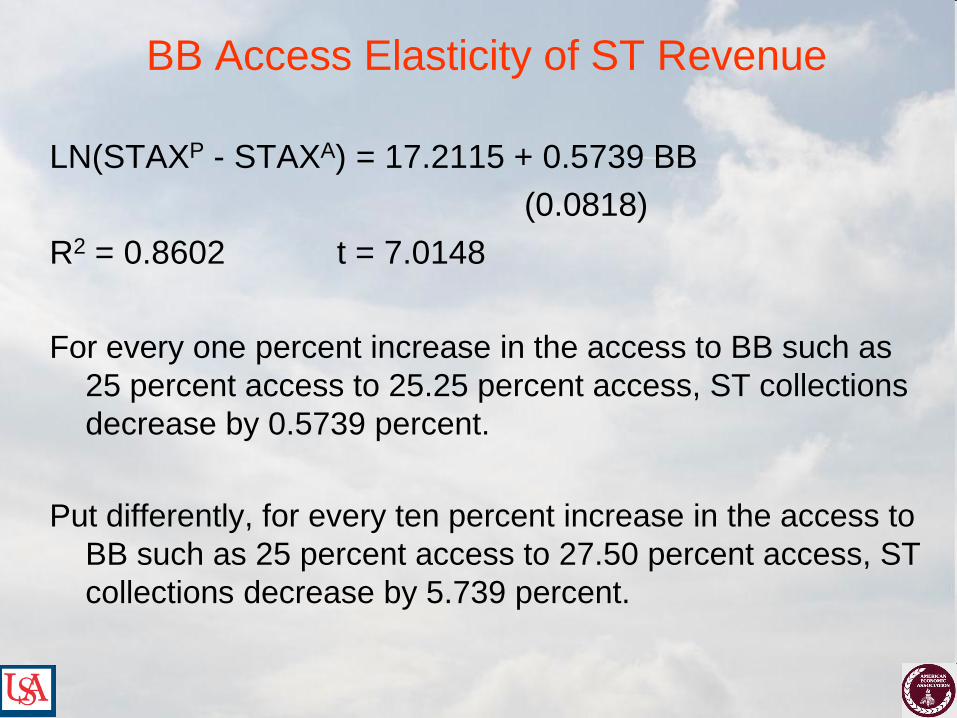
LN(STAXP - STAXA) = 17.2115 + 0.5739 BB
(0.0818)
R2 = 0.86 D-W = 1.16
Figure in the parentheses is the standard error of the estimated coefficient. The
t-value for the estimated coefficient is 7.0148, indicating statistical
significance at 1 percent level of α.
The estimated coefficient measures the broad band access elasticity of sales
tax revenue, which is relatively inelastic since 0.5739 is less than one. The
estimated elasticity coefficient means that for every one percent increase in
the access to broad band such as 25 percent access to 25.25 percent
access, sales tax collections decrease by 0.5739 percent. Put differently, for
every ten percent increase in the access to broad band such as 25 percent
access to 27.50 percent access, sales tax collections decrease by 5.739
percent. Note that the sign of the estimated coefficient is positive but
measures declining revenue because data of the dependent variable
represent the difference between the potential revenue collections and
actual revenue collections.
Thank you.
Questions?
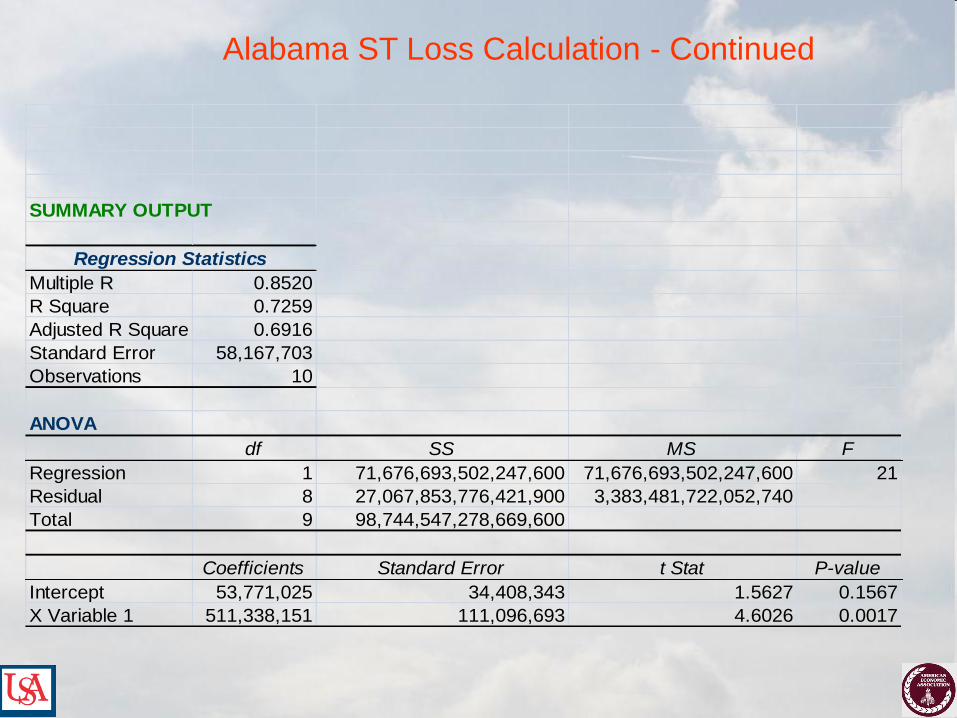
SUMMARY OUTPUT
Regression Statistics
Multiple R 0.8520
R Square 0.7259
Adjusted R Square 0.6916
Standard Error 58,167,703
Observations 10
ANOVA
df SS MS F
Regression 1 71,676,693,502,247,600 71,676,693,502,247,600 21
Residual 8 27,067,853,776,421,900 3,383,481,722,052,740
Total 9 98,744,547,278,669,600
Coefficients Standard Error t Stat P-value
Intercept 53,771,025 34,408,343 1.5627 0.1567
X Variable 1 511,338,151 111,096,693 4.6026 0.0017
Alabama ST Loss Calculation - Continued
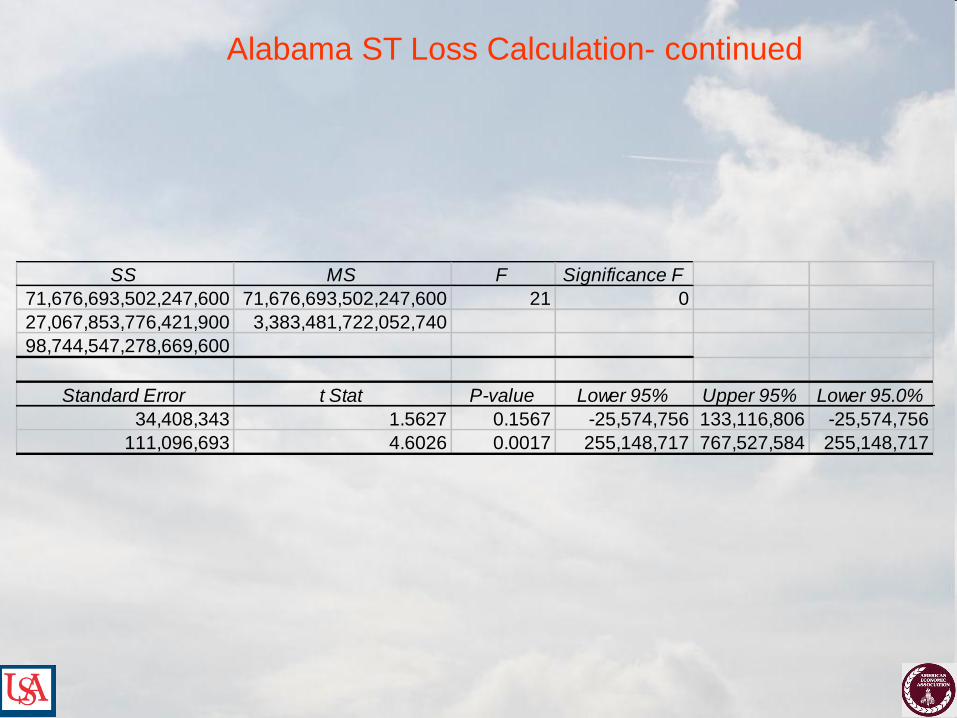
SS MS F Significance F
71,676,693,502,247,600 71,676,693,502,247,600 21 0
27,067,853,776,421,900 3,383,481,722,052,740
98,744,547,278,669,600
Standard Error t Stat P-value Lower 95% Upper 95% Lower 95.0%
34,408,343 1.5627 0.1567 -25,574,756 133,116,806 -25,574,756
111,096,693 4.6026 0.0017 255,148,717 767,527,584 255,148,717
Alabama ST Loss Calculation- continued
http://www.websiteoptimization.com/bw/1107/

http://www.websiteoptimization.com/bw/1109/
BB Access Elasticity of ST Revenue
LN(STAXP - STAXA) = 17.2115 + 0.5739 BB
(0.0818)
R2 = 0.8602 t = 7.0148
For every one percent increase in the access to BB such as
25 percent access to 25.25 percent access, ST collections
decrease by 0.5739 percent.
Put differently, for every ten percent increase in the access to
BB such as 25 percent access to 27.50 percent access, ST
collections decrease by 5.739 percent.