Broad-scale Volcano Monitoring in Papua New Guinea using ...Record Rowan P. Romeyn & Matthew C....
50
Rowan P. Romeyn & Matthew C. Garthwaite Record 2012/49 Broad-scale Volcano Monitoring in Papua New Guinea using Satellite Interferometric Synthetic Aperture Radar GeoCat # 74141 APPLYING GEOSCIENCE TO AUSTRALIA’S MOST IMPORTANT CHALLENGES G E O S C I E N C E A U S T R A L I A © 2012 Google
Transcript of Broad-scale Volcano Monitoring in Papua New Guinea using ...Record Rowan P. Romeyn & Matthew C....

Rowan P. Romeyn & Matthew C. GarthwaiteRecord
2012/49
Broad-scale Volcano Monitoring in Papua New Guinea using Satellite Interferometric Synthetic Aperture Radar
GeoCat # 74141
APPLYING GEOSCIENCE TO AUSTRALIA’S MOST IMPORTANT CHALLENGES
G E O S C I E N C E A U S T R A L I A
© 2
012
Goo
gle


Broad-scale Volcano Monitoring inPapua New Guinea using Satellite Interferometric Synthetic Aperture Radar
GEOSCIENCE AUSTRALIA RECORD 2012/49 by Rowan P. Romeyn & Matthew C. Garthwaite

Department of Resources, Energy and Tourism Minister for Resources and Energy: The Hon. Martin Ferguson, AM MP Secretary: Mr Drew Clarke Geoscience Australia Chief Executive Officer: Dr Chris Pigram This paper is published with the permission of the CEO, Geoscience Australia
© Commonwealth of Australia (Geoscience Australia) 2012 With the exception of the Commonwealth Coat of Arms and where otherwise noted, all material in this publication is provided under a Creative Commons Attribution 3.0 Australia Licence (http://www.creativecommons.org/licenses/by/3.0/au/) Geoscience Australia has tried to make the information in this product as accurate as possible. However, it does not guarantee that the information is totally accurate or complete. Therefore, you should not solely rely on this information when making a commercial decision. ISSN 1448-2177 ISBN 978-1-922103-50-5 GeoCat # 74141 Bibliographic reference: Romeyn, R.P. & Garthwaite, M.C., 2012. Broad-scale volcano monitoring in Papua New Guinea using satellite interferometric synthetic aperture radar. Record 2012/49. Geoscience Australia: Canberra.

Broad-scale Volcano Monitoring in Papua New Guinea using InSAR
Contents
Executive Summary .................................................................................................................... 1
1. Introduction.............................................................................................................................. 3 1.1 Overview of the InSAR Technique ...........................................................................................3 1.2 InSAR as a Volcano Monitoring Tool.......................................................................................4 1.3 Papua New Guinea Volcano Specifics ......................................................................................5
2. Satellite Data Availability for PNG Volcanoes...................................................................... 9 2.1 Data Coverage .........................................................................................................................10 2.2 Data Availability .....................................................................................................................13 2.3 Data Cost .................................................................................................................................15 2.4 Data Volume............................................................................................................................15
3. Development of an InSAR processing platform................................................................. 16 3.1 Why Develop a New Platform.................................................................................................16 3.2 Description of the Workflow...................................................................................................16 3.3 The Interferogram Stacking Algorithm ...................................................................................21 3.4 Required System Resources ....................................................................................................22
4. Application of the GMTSAR processing workflow: Rabaul Caldera case study............ 24 4.1 Introduction .............................................................................................................................24 4.2 Method.....................................................................................................................................26
Interferogram Processing .........................................................................................................26 Interferogram Stacking.............................................................................................................27
4.3 Results and Discussion ............................................................................................................28
5. Assessment of broad-scale InSAR monitoring feasibility ................................................ 33 5.1 Recommendations ...................................................................................................................34
References ................................................................................................................................. 35
Appendices ................................................................................................................................ 37 Appendix 1 – Processed Interferograms from Rabaul Caldera Case Study ..................................37 Appendix 2 – Example Configuration File (batch.config) for InSAR Processing with Modified GMTSAR................................................................................................................41
iii

Broad-scale Volcano Monitoring in Papua New Guinea using InSAR
iv

Broad-scale Volcano Monitoring in Papua New Guinea using InSAR
Executive Summary The use of Interferometric Synthetic Aperture Radar (InSAR) to monitor volcano hazards by detecting ground deformation has been demonstrated in numerous cases around the world. This report presents an investigation of the feasibility of using InSAR as a broad scale volcano-monitoring tool in Papua New Guinea (PNG). This type of ongoing broad-scale monitoring would be a significant leap forward compared to the majority of past applications of InSAR for volcano monitoring, which have been sporadic and often conducted in hindsight. A major focus of this study was the development of open-source InSAR analysis software that makes it easier to implement in developing countries where resources may be limited. The environmental conditions of PNG, such as steep topography, dense vegetation and the moist, turbulent atmosphere pose significant challenges to volcano monitoring using InSAR. On the other hand, the remoteness of many of the volcanoes and the limited geophysical resources currently employed to monitor them, makes a broad-scale InSAR monitoring system an attractive proposition. The viability of InSAR as an ongoing tool for broad-scale volcano monitoring in PNG is constrained by the future availability of L-band Synthetic Aperture Radar (SAR) satellite imagery. The ALOS-2 mission should meet the data requirements of a broad-scale volcano monitoring programme. However, the present cost of ALOS data is prohibitive to ongoing monitoring, given the large volume of data required. The planned ALOS-2 mission will acquire SAR data with even higher temporal resolution, but this will be of little use to InSAR monitoring unless it is available at a cost conducive to regular access. At present, the greatest single barrier to a broad-scale InSAR monitoring system is the prohibitive cost of obtaining the required SAR imagery. To improve the accessibility of InSAR processing software to those in developing countries, the InSAR processing workflow that has been developed in this study is open source, being based on the GMTSAR package. In addition the interface has been simplified and a greater level of automation has been implemented to reduce the training required to become operational. The system has been designed to deal with the large volume of data processing required in a broad-scale volcano monitoring operation by parallelising the most computationally intensive parts of the workflow. A case study of the Rabaul Caldera demonstrates that L-band SAR interferometry can overcome many of the challenges of applying InSAR in PNG. However, continued development is required to enable time-series InSAR analysis. This would help to resolve the nonlinear nature of volcano deformation events and reduce the impact of spurious atmospheric delay signals. Commercial software is available to meet this requirement but the development of an open source alternative would be desirable to make the platform inclusive of developing countries. Several key requirements were identified to progress the development of a broad-scale InSAR volcano monitoring capability for PNG into the future:
Negotiation of a new data licensing agreement that recognises the substantial data requirements of a broad-scale InSAR monitoring system. In addition, it should recognise that such a system will be used to aid people in developing countries and help them deal with volcano hazards. It should be recognised that the standard commercial cost of SAR data is prohibitive to broad-scale InSAR volcano monitoring. A possible solution would be to negotiate a reduced rate for data that is to be used exclusively for the purpose of natural hazard monitoring.
Development of an open source InSAR time-series code for integration into the existing
open source GMTSAR processing framework.
1

Broad-scale Volcano Monitoring in Papua New Guinea using InSAR
Implementation of a program to train a PNG Department of Mineral Policy and Geohazards Management staff member to operate the InSAR processing system to a self-sufficient and sustainable level. A suitable training program would involve a period of direct tutoring and supervision (~1 month), followed by an extended period of supported operation (~12 months) where an experienced operator would be available to assist with problems as they arise. The training could be carried out at Geoscience Australia in Canberra.
Acquisition of a computer sufficient to run the InSAR processing e.g. 8 cores, 16 Gb RAM,
Unix operating system. The operator could be trained on the machine at Geoscience Australia, which could then be transported to PNG to smooth the transition to a PNG-based monitoring system.
We estimate that approximately 3.3 Tb of disk storage would be required per year to run the
operational monitoring system, assuming that the future JAXA ALOS-2 SAR mission acquires data in 10 scenes covering the main volcanoes of interest with an orbital revisit of 14 days.
2

Broad-scale Volcano Monitoring in Papua New Guinea using InSAR
1. Introduction The PNG-Australia Volcanological Service Support (VSS) Project is an AusAID funded Project that was initiated by AusAID and Geoscience Australia to provide support to the Rabaul Volcanological Observatory (RVO) following the disastrous 1994 eruption of the Rabaul Volcano. Geoscience Australia’s commitment to this activity is ongoing (with AusAID’s support) and extends to a number of Papua New Guinea (PNG) volcanoes, including: Rabaul, Ulawun, Manam, Lamington, Pago and Karkar. Emergency response investigations have also been conducted at Sulu Range, Garbuna and Bagana. Recently, in collaboration with RVO, Geoscience Australia has begun demonstrating how satellite Interferometric Synthetic Aperture Radar (InSAR) might be used to support eruption warning systems by making remote measurements of precursory volcano deformation. The early identification of precursory activity can enable deployment of additional geophysical sensors to the region of interest and would greatly improve warning capability. The remote location of many PNG volcanoes, combined with the limited capacity to deploy geophysical resources, means that the resources that are deployed need to be well targeted to give adequate warning capability. InSAR provides a potential means of achieving the required level of targeting to increase the effectiveness of the deployment of additional geophysical sensors. 1.1 OVERVIEW OF THE INSAR TECHNIQUE The InSAR technique, as applied in this report, relies on the acquisition of repeat-pass satellite-derived Synthetic Aperture Radar (SAR) images. SAR is a type of radar imaging that uses radio signals at microwave frequencies to illuminate a target. Upon hitting a target on the ground surface, the signal is reflected and received back at the satellite. All SAR satellites to date have been right-looking, perpendicular to the direction of travel. The phase component of the received signal is used to deduce the targets position in range (perpendicular to the satellites travel direction) and azimuth (position along-track, parallel to the satellites travel direction; Rosen et. al., 2000). The ‘synthetic aperture’ referred to in SAR allows improved resolution without increasing the physical size of the antenna (Curlander & McDonough, 1991). Using signal processing to synthesise an extremely long antenna aperture allows the SAR system to achieve resolution that is independent of the sensor altitude (Curlander & McDonough, 1991). InSAR uses pairs of SAR images to produce radar interferograms. An interferogram is a spatial map of the distance between the satellite and the ground target between two acquisitions (Burgmann et. al., 2000). The pixel size depends on the satellite, but for the Japanese ALOS-PALSAR sensor it is approximately 4.7 m in range and 4 m in azimuth. Once aligned to a fraction of a pixel width, the phase shift of the two radar signals can be used to map out relative range changes between the two acquisitions in the satellites line of sight (LOS) at millimetre to centimetre accuracy. The phase difference between SAR images is a summation of ground deformation, un-modelled errors in the satellite orbits, spatially varying atmospheric water vapour (that introduces a delay in the recorded phase) and topography. In the repeat-pass InSAR methodology, the topographic phase is removed using a digital elevation model (DEM). Therefore the pixel size of the final interferogram corrected for topography is controlled by the pixel size of the DEM used. This is typically 90 m square if the globally available 3-arcsecond Shuttle Radar Topography Mission DEM is used. Established techniques are used to isolate the ground deformation signal from the other competing factors (Rosen et. al., 2000). The geometry of the InSAR technique is illustrated in Figure 1.1.1.
3

Broad-scale Volcano Monitoring in Papua New Guinea using InSAR
Figure 1.1.1: Schematic diagram of InSAR geometry (adapted from Dawson, 2008). A1 and A2 are the positions of the satellites at the time of acquisition (recall that the acquisitions are taken during different orbits of the same satellite), ρ1 and ρ2 represent the range from the satellite to the ground area being imaged. The baseline vector B represents the separation between the satellite positions and B┴ represents the baseline separation in the direction perpendicular to the look vector. The perpendicular baseline B┴ is an important parameter that affects resolution of topographic features and the decorrelation between images. The success of InSAR relies on the two SAR images being well correlated. The SAR images will generally be well correlated when the properties of the ground surface, specifically the radar reflectivity, remain constant. However, changes to the ground surface, like the growth of vegetation, can cause the SAR images to become de-correlated. There are several ways to combat decorrelation:
Use SAR image pairs acquired a short time after one another. This is referred to as having a short temporal baseline. The surface is less likely to change over shorter time periods e.g. vegetation growth will be negligible over a sufficiently short period.
If the spatial baseline (B┴ illustrated in Figure 1.1.1) is too large the images will become decorrelated. The cut-off depends on the satellite e.g. a practical threshold of 1-1.5km applies for the ALOS mission, that is interferograms with spatial baselines less than the 1-1.5km threshold tend to be useful.
The wavelength of the radar signal affects its ability to penetrate vegetation cover e.g. L-band (λ = 236mm) radar signals penetrate vegetation more effectively than C-band (λ = 56mm). However, when decorrelation is not a factor C-band can resolver smaller ground movements due to its shorter wavelength.
1.2 INSAR AS A VOLCANO MONITORING TOOL
The intrusion of sufficient volumes of magma beneath volcanoes causes surface deformation at a scale that is measurable with InSAR (Dzurisin, 2000). By studying the surface deformation caused by a magma body, its location, volume and shape can be inferred by modelling. This approach can be used to anticipate volcanic eruptions, when the surface deformation is measured with sufficiently high spatial and temporal resolution. The spatial and temporal resolution that is required depends on the type of volcano: basaltic shields and silicic calderas typically being easier to monitor than
4

Broad-scale Volcano Monitoring in Papua New Guinea using InSAR
intermediate-composition strato-volcanoes (Dzurisin, 2000). Because the InSAR technique has the potential to measure volcanic deformation over timescales spanning days to decades its popularity as a tool for monitoring a broad range of volcanoes is increasing (Parks et. al., 2011). InSAR has been widely used around the world to measure surface deformation directly associated with volcanic eruptions (see Table 1.2.1). InSAR can be used more broadly to monitor surface deformation associated with the movement of magmatic fluids, even when an eruption does not occur. For example, Wicks et. al. (1998) used InSAR derived surface deformation patterns to infer the movement of magmatic or hydrothermal fluids beneath the Yellowstone Caldera.
Table 1.2.1: Examples of published studies where InSAR has been used to monitor surface deformation directly associated with volcanic eruptions
VOLCANO ERUPTION NOTES SOURCE
Galeras (Columbia)
January 2008 Co-eruptive subsidence with modelled magma chamber volume change of ~6.5x10⁵m3 at ~2km depth
Parks et. al., (2011)
Llaima (Chile) 4 explosive eruptions 2000-2010, monitored syn- & post-eruptive phases 2003-2008
Basaltic to andesitic stratovolcano. Subsidence up to 10cm during post-eruptive period. Uplift up to 8cm during syn-eruptive period.
Bathke et. al., (2011)
Mt. Etna (Sicily) aftermath of 1993 eruption - 1995 eruption
Deflation with modelled source depth of 9km during post eruptive period. Inflation from 1993-1995 that increased in rate immediately prior to 1995 eruption (modelled source depth of 11-14km)
Lanari et. al., (1998)
Okmok (Alaska)
1997 Basaltic complex. Inflation was observed preceding eruption. Following the eruption subsidence of lava flows due to thermal contraction and mechanical loading were observed.
Lu et. al., (2005)
Mt. Hossho (Japan)
11/10/1995 Post-eruptive subsidence was observed Tomiyama et. al., (2004)
Soufriere Hills (Montserrat)
1998-2000 InSAR results were validated with GPS measurements. The use of C-band radar signals was constrained by lack of non-vegetated surface and atmospheric water vapour variability.
Wadge et. al., (2006)
Sierra Negra (Galápagos)
22-30/10/2005 Caldera subsidence of 5.4m observed. Large deformation can make standard InSAR co-registration techniques break down.
Yun et. al., (2007)
1.3 PAPUA NEW GUINEA VOLCANO SPECIFICS The high level of volcanic activity observed in Papua New Guinea (PNG) is a result of the tectonic regime specific to the region, which is dominated by the convergence of the Pacific Plate relative to the Australian Plate (see Figure 1.3.1). More specifically, the active subduction along the New Britain Trench has led to the formation of a volcanic arc off the north coast. This volcanic arc is home to some of the most active volcanoes in the world, many of which pose a direct threat to local inhabitants in the event of a significant eruption. The distribution of the major active volcanoes in the Papua New Guinea region is illustrated in Figure 1.3.2. The eruptive activity of these volcanoes
5

Broad-scale Volcano Monitoring in Papua New Guinea using InSAR
is detailed in Table 1.3.1 with an emphasis on major eruptions occurring in the late 19th-20th century, as well as any activity occurring over the lifespan (2007-2011) of the Advanced Land Observation Satellite (ALOS) mission. The ALOS mission included the routine acquisition of L-band SAR imagery, which has a greater ability to penetrate vegetation than shorter radar wavelengths (discussed in Section 2.2). Since many of the volcanoes in PNG are heavily vegetated, the ALOS mission was selected as the focus of the present study.
Figure 1.3.1: Tectonic setting of Papua New Guinea from Wallace et. al., (2004).
Elevation (m)
Figure 1.3.2: Distribution of the major active-volcanoes of Papua New Guinea. The volcanoes in red have shown volcanic activity in between 2000 and 2011. The yellow volcanoes have historical records of eruptions in the late 19th to 20th Century.
6

Broad-scale Volcano Monitoring in Papua New Guinea using InSAR
Table 1.3.1: Selected recent eruptive history of major active volcanoes in Papua New Guinea. Records were sourced from RVO weekly and monthly reports available at
http://www.volcano.si.edu/world/ VOLCANO DATE OF
ERUPTION
BRIEF DESCRIPTION OF EVENT
23/07/2010 – 25/07/2010
Ash cloud to 1km, ashfall & H2S odour. Discrete explosions from 1730. Eruption was preceded by increased seismicity. GPS deflation was reported following the eruption. Inflatory ground deformation had been observed from Jan-April 2010 with total uplift of 4cm.
19/06/2007 – 20/06/2007
Four explosions from the Tavurvur cone produced shockwaves that rattled windows in Rabaul Town and showered the flanks of the volcano with lava fragments while ash rose to > 2.7km
07/10/2006 – 08/10/2006
Vulcanian eruption with ash column > 5km high. Windows broken 12km away by shockwaves. Some residents affected by heavier ashfall self evacuated. Followed by strombolian eruption, explosions and roaring sounds & lava flows on W and N flanks.
Rabaul
19/09/1994 Major eruption of Tavurvur and Vulcan that destroyed Rabaul Airport and covered the town with heavy ashfall. Most residents were evacuated given 19hrs warning, though tragically 5 people were killed.
26/11/2010 Ash plume rose to 3.7km and drifted 55km NE. Large regional earthquakes occurred earlier in the year, June-July with magnitudes up to 7.3.
13/06/2008 – 14/06/2008
Summit glow that was preceded by a seismic swarm.
29/09/2000 – 1/11/2000
Large ash cloud to 10.7km height and ~110km wide in an arc shape. Timely evacuation of 3750 residents, recommended by Rabaul Volcano Observatory, prevented any loss of life. Post analysis showed deformation (tiltmeter) preceded the eruption.
Ulawun
25/12/2010 – 30/12/2010
Rising ash plumes and ejection of lava fragments from South Crater. Tilt measurements showed inflation during 24-26 Dec. Three pyroclastic flows occurred on 30 Dec and a dense ash plume rose to 3km above the summit.
12/12/2009 Eruption produced an ash plume that rose to 3km and drifted 75km N. Intermittent ash plumes and summit glow were observed throughout 2009.
27/01/2005 Severe and damaging eruption that caused 1 death and 14 injuries, though the majority of the population had been evacuated following the late-2004 eruptions. The ash cloud extended into the stratosphere to over 20km altitude. Lava flows and pyroclastic flows reached the seas at various times.
24/10/2004 – 6/12/2004
Several periods of vigorous eruption that caused 5 deaths through respiratory complications from inhaling volcanic material. Large scale evacuations were ordered for the ~12,000 residents. They were evacuated to a care centre where many still live today. Crops, water supplies and houses were damaged by ash-fall.
Manam
3/12/1996 Fatal eruption that caused 13 deaths. The major eruption was preceded by a series of large eruptions during Oct-Nov, which produced both pyroclastic and lava flows. Major eruption caused large pyroclastic flows that reached the sea and in one case overran a village. No preceding deformation was observed but a significant
7

Broad-scale Volcano Monitoring in Papua New Guinea using InSAR
VOLCANO DATE OF
ERUPTION
BRIEF DESCRIPTION OF EVENT
deflation was recorded during the major eruption.
Lamington 21/01/1951 Major explosive eruption that killed ~3000 people (highest recorded death toll for any natural hazard in PNG). The pyroclastic flow destroyed ~200km2 around the volcano.
28/08/2007 Small eruption with lava fragments ejected from upper vents. Pago
3/08/2002 – 27/09/2002
Large ash clouds up to 9.1km altitude and 18km wide. ~10,000 people evacuated. Lava formed cones initially then followed by lava flows. Surface deformation was measured during August.
26/02/2010 – 27/02/2010
Steam rising from caldera, low roaring noises, ash plume to 2.4km height and travelled up to 74km.
Karkar
8/03/1979 Two volcanologists were killed by a directed explosive blast. Heavy ash and scoria falls also occurred.
01/04/2007 Non-eruptive geysers & indication of shallow dike intrusion Sulu Range
07/07/2006 Seismicity & emissions from volcano with no historical eruptions, including loud booming and rumbling accompanied by strong tremors. Nearby villages evacuated.
11/03/2008 – 18/03/2008
Gray ash clouds < 1km high and fine ash-fall. Monitoring equipment was not active.
Garbuna
16/10/2005 – 19/10/2005
First historically witnessed eruption. Ash column to 3-4km altitude and vapour plumes on following days.
15/05/2008 – 16/12/2008
Lava flows and ash emissions.
12/06/2007 – 1/3/2008
Lava flows, pyroclastic flows, loud noises and repeated forceful emissions occurred during this period. Pyroclastic flow on 14/07/2007
Bagana
1978-2011 Frequently erupting, characterised by non-explosive effusion of viscous lava.
20/09/2009 – 24/09/2009
Strong ash explosion Langila
1973 - 2010 Frequently active including mild to moderate explosive eruptions accompanied by lava flows & ash clouds. Langila is one of the most active volcanoes in New Britain.
Ritter Island 1888 Volcano collapsed into sea and caused devastating tsunamis that caused fatalities in coastal villages. The island was 780m high before the eruption and only 140m high following.
8

Broad-scale Volcano Monitoring in Papua New Guinea using InSAR
2. Satellite Data Availability for PNG Volcanoes
A broad-scale InSAR volcano monitoring project inherently has substantial requirements for applicable satellite data. For instance, the major volcanoes of PNG are widely distributed so that each volcano tends to require data from different satellite tracks and scenes. Monitoring a large number of volcanoes will require acquisition of data from many scenes. However, the most pertinent issue is that the temporal resolution of the satellite data should be sufficient to resolve the precursive phase of major volcanic eruptions that tend to occur over timescales on the order of months (Lu et. al., 2005). From a monitoring perspective, higher temporal data resolution will almost always be desirable because it increases the chance of resolving deformation preceding an eruption. For this reason, it seems appropriate to design a monitoring system using the highest available temporal resolution. Because of the ability of L-band SAR signals to penetrate the vegetation associated with many volcanoes in PNG, it is the most appropriate type of data to build a PNG InSAR volcano monitoring system upon. At present, the main data archive of L-band SAR is from the ALOS-PALSAR sensor operated by the Japanese Space Agency (JAXA), though future satellite missions are planned that will increase the availability of this data. However, because it is currently the major data source, the current study investigates the potential of implementing an operational broad-scale PNG volcano monitoring system by using the present archive of ALOS-PALSAR data.
9

Broad-scale Volcano Monitoring in Papua New Guinea using InSAR
2.1 DATA COVERAGE
The spatial coverage of relevant scenes of ALOS-PALSAR data for PNG volcanoes is illustrated in Figures 2.1.1-2.1.5. The extent of each data scene was determined directly from the official data catalogue (through the online JAXA-AUIG tool). It is worth noting that the coverage of purchased data can sometimes exceed the coverage indicated in the catalogue. For example, ascending track 352, frame 7090 is a scene that does not appear to fully cover the Rabaul Caldera (see Figure 2.1.1). However, nearly the entire caldera was covered when the data was purchased.
Figure 2.1.1: ALOS-PALSAR coverage of East New Britain volcanoes. The coverage of individual SAR image scenes, denoted with relevant track and frame numbers, is illustrated by the red overlays.
10

Broad-scale Volcano Monitoring in Papua New Guinea using InSAR
Figure 2.1.2: ALOS-PALSAR coverage of West New Britain. The coverage of individual SAR image scenes is illustrated by the red overlays.
Figure 2.1.3: ALOS-PALSAR coverage of volcanic islands off the north coast of Papua New Guinea. The coverage of individual SAR image scenes is illustrated by the red overlays.
11

Broad-scale Volcano Monitoring in Papua New Guinea using InSAR
Figure 2.1.4: ALOS-PALSAR coverage of volcanoes in northern Papua New Guinea. The coverage of individual SAR image scenes is illustrated by the red overlays.
Figure 2.1.5: ALOS-PALSAR coverage of volcanoes on Bougainville Island. The coverage of individual SAR image scenes is illustrated by the red overlays.
12

Broad-scale Volcano Monitoring in Papua New Guinea using InSAR
13
2.2 DATA AVAILABILITY An assessment of data availability was conducted for each scene identified in section 2.1, to investigate whether data availability would present a barrier to the development of a broad-scale InSAR monitoring system. The viewing mode of ALOS-PALSAR changed at the end of 2006. Consequently, interferograms that span the time of this change cannot be formed due to a difference in viewing geometry. To avoid any confusion the assessment of data availability has been restricted to the post-2006 period i.e. availability describes a set of data where interferograms can be formed between any two acquisitions. The availability of ALOS-PALSAR data relevant to PNG volcanoes is summarised in Figure 2.2.1. It is important to recall that the ALOS mission ended in early 2011, and is therefore of no direct use to an ongoing monitoring program that would require continual updates via new SAR acquisitions. However, several missions are planned to begin in the near future that could fill this data gap (see Table 2.2.1). The ALOS-2 mission will continue the acquisition of L-band SAR, with higher temporal resolution than the original ALOS mission. The Sentinel-1 mission will potentially make acquisitions with even greater temporal resolution; though it will record C-band SAR which might have limited application in PNG owing to the dense vegetation (see Figure 2.2.2). Table 2.2.1: Comparison of ALOS with other satellite missions planned to begin in the near future
ALOS ALOS-2 SENTINEL-1
SPACE AGENCY JAXA# JAXA# ESA##
PERIOD OF
OPERATION 01/2006 – 04/2011
Planned for 2013
Planned for 2013 to continue C-band SAR from ERS-1 & ERS-2
LIFETIME (YEARS) ~5 5 (7 target) 7.25 GROUND POINT
REPEAT CYCLE (DAYS) 46 14 6 days using a two satellite
constellation, 12 days per satellite ALTITUDE (KM) 697 628 693 NUMBER OF SENSORS 3 1* 1* SAR WAVELENGTH L-band L-band C-band
# Japan Aerospace Exploration Agency, ## European Space Agency *Because ALOS-2 and Sentinel-1 are dedicated to collecting SAR data they can potentially collect more acquisitions per orbit. ALOS, ERS and Envisat shared power resources between different sensors, thereby limiting the number of acquisitions each sensor could collect per cycle.

Bro
ad
-sc
ale
Vo
lca
no
Mo
nito
ring
in P
ap
ua
Ne
w G
uin
ea
us
ing
InS
AR
Rabaul, Track 352, Frame7090
Karkar, Track 364, Frame7090
Langila & Ritter Is., Track359 & 360, Frame 7070
Ulawun & Bamus, Track354, Frame 7080
Garbuna & Pago, Track356, Frame 7070
Sulu Range & Pago,Track 355, Frame 7070
ALOS Data Availability for PNG Volcanoes
10/2006
04/2007
10/2007
03/2008
09/2008
04/2009
09/2009
04/2010
10/2010
SAR Acquisition Date
Manam, Track 365,Frame 7100
Lamington, Track 361,Frame 7000
Bagana & Billy Mitchell,Track 347, Frame 7060
Figure 2.2.1: Summary of the availability of ALOS-PALSAR scenes relevant to PNG volcano monitoring.
14

Broad-scale Volcano Monitoring in Papua New Guinea using InSAR
Figure 2.2.2: Expected regions of coherence from C-band SAR (Red) and L-band SAR (Red+Blue) for interferograms with temporal baseline of ~1 month. The locations of major PNG volcanoes are shown in yellow. The expected coherence determination was based on the coherence expected for 24 distinct land-cover classifications in a global database at 0.2×0.2 degree resolution (Loveland et. al., 2000) using interferometric examples from the literature. 2.3 DATA COST Due to a recent change in JAXA’s data licensing agreement ALOS-PALSAR is only available at commercial rates (~$800 USD per scene). In the past, Geoscience Australia was acting as a data node for the ALOS mission and was entitled to data access at significantly reduced rates (~$100 USD per scene). Due to the substantial data requirements of a broad-scale InSAR monitoring system that have been described in this section the cost of satellite data currently represents the greatest single barrier to the operation of the system. Furthermore, in the future such a monitoring system would be administered directly by PNG authorities who are also likely to find the commercial rates prohibitive. Clearly, there is a need to negotiate a new arrangement so that data intended to monitor natural hazards in developing countries, with the potential to deliver significant aid benefits, is available for an achievable cost. 2.4 DATA VOLUME For an operational monitoring system, it is important to consider the volume of data that will be generated and therefore the disk storage that would be needed. Assuming that ALOS-2 will acquire data for all 10 frames identified in Section 2.1 and on every orbital repeat of 14 days, this will amount to (365/14) * 10 ≈ 260 scenes of raw data being acquired per year. For ALOS-PALSAR, each raw data file and associated header files totals ~725 Mb. Using GMTSAR to process the raw data, the corresponding Single Look Complex (SLC) images and associated files total ~2 Gb, and a fully processed interferogram with associated files totals about 5 Gb. Assuming similar file sizes for ALOS-2 data, approximately (2 + 0.725) * 260 ≈ 708.5 Gb of storage space is required for raw and SLC data per year. The number of interferograms generated from such a raw dataset is typically more than the number of scenes. If twice the number of scenes is generated, this amounts to ~2600 Gb. The total volume of data generated would therefore be in the region of ~3.3 Tb per year. It should be noted that following processing, it is possible to delete many intermediary files in order to save disk space and therefore the estimate here is an upper-bound on the storage requirements for the operational monitoring system.
15
Broad-scale Volcano Monitoring in Papua New Guinea using InSAR
3. Development of an InSAR processing platform 3.1 WHY DEVELOP A NEW PLATFORM A key requirement of a broad-scale InSAR volcano monitoring system for PNG (and developing countries in general) is that the system can be operated directly by the relevant authorities. This implies that the system should be operable self-sufficiently with minimal training and must be viable with limited resources. To meet this need, free and open source software is desirable. We developed an InSAR processing workflow based on GMTSAR (Sandwell et. al. 2011). GMTSAR is an open source (GNU General Public License) InSAR processing system designed around the Generic Mapping Tools (GMT) framework. The open-source nature of GMTSAR was seen as a crucial characteristic to avoid the resource drain of commercial software licensing. In the current project the GMTSAR software package was modified to simplify, automate and extend functionality. The primary function of the updated GMTSAR workflow was to create a stack of interferograms from a single ALOS frame, producing an average deformation map over the observation period. The useability of the GMTSAR platform has been improved such that a new operator could be trained to operate the system in a relatively short period of time. However, extended training would be required to achieve sustainable and self-sufficient operation of the system, as the operator would gain a greater understanding of the processing methods and an ability to troubleshoot the software. A suitable training regime could include a period of direct tutoring and supervision (~1 month), followed by an extended period of supported operation (~12 months) during which the new operator would be assisted with problems as they arise by an experienced operator. 3.2 DESCRIPTION OF THE WORKFLOW This section is designed to provide a conceptual description of the GMTSAR based InSAR processing workflow that has been developed, rather than a comprehensive user manual. A series of c-shell scripts provide the interface to the new processing workflow. An overview of these scripts is provided in Table 3.2.1, while the relationship between them is illustrated in Figure 3.2.1 As a prologue to the main InSAR processing workflow, the acquisition metadata for each epoch (available through JAXA’s AUIG online catalogue search tool) are used to construct a baseline vs. time plot (e.g. see Figure 4.2.1). By specifying different spatial and temporal baseline thresholds, different sets of interferometric image pairs are derived and these are used to generate input files (intf.in, align.in and ifm_info.txt) that are used within the processing workflow. The workflow broadly consists of 10 linked stages. These processing stages are controlled by the script ‘run_stack.csh’ and are fed parameters by ‘batch.config’. The user is able to control which stage a particular processing run will start at and where it will end, giving a high degree of control while automating the workflow as much as possible. The computationally intensive stages have been parallelised to take advantage of multiple computer processors where available, allowing timely processing of large numbers of interferograms. Parts of the workflow that can be run in parallel have been indicated in the following description:
16

Broad-scale Volcano Monitoring in Papua New Guinea using InSAR
Link raw data - the raw data is linked from the data repository into the InSAR processing directory.
Individual .prm optimisation (parallel) – each SAR acquisition is individually focussed
by optimising parameters like the Doppler centroid, earth radius, and near range. Median prm calculation – the individually optimised parameters are collated and the
median values are calculated. Pre-process batch with median parameters (parallel) – each SAR acquisition is re-
focussed using the median parameters. The acquisitions must be focussed to a common standard for batch processing and it is assumed the median parameters of the batch are an acceptable compromise.
Align images to common master (parallel) – The SAR acquisitions are aligned to a
common master image by sub-pixel co-registration of the amplitude images. The master image was selected automatically during the prologue to this workflow, by finding the median in the distribution of relative spatial baselines.
Align topography with SAR images – A DEM is used to calculate the topographic
phase contribution, which is then aligned with the common master. A landmask is generated using the GMT coastline file, though there is also the capability to substitute a custom landmask derived from some other source e.g. if the default GMT coastline file is not accurate enough, is too old, or too imprecise (low resolution) for the given application.
Form interferograms, filter & unwrap (parallel) – The orbital and topographic phase
contributions are subtracted and a series of complex interferograms are formed (based on the image pairs specified in intf.in). A Gaussian filter is then applied to smooth the phase before it is unwrapped. Pixels that fall below a specified correlation threshold are excluded before unwrapping.
Remove regional trend (parallel) – The unwrapped phase is processed to remove low
frequency trends caused by residual orbital phase contributions, atmospheric delays etc. Either a polynomial trend (e.g. bilinear) can be calculated or high-pass filtering can be employed. However, high-pass filtering was found to be more effective for stacking.
Plot interferograms – The unwrapped interferograms are incorporated into a large
composite plot to allow convenient inter-comparison.
17

Broad-scale Volcano Monitoring in Papua New Guinea using InSAR
Table 3.2.1: Details of Scripts used in modified GMTSAR workflow NAME FUNCTION INPUTS OUTPUTS
run_stack.csh Controls the processing workflow. Processing can run in stages defined by the user e.g. from focussing to alignment, or from raw data to stacking
User must specify where processing will begin and end
None (calls other scripts)
batch.config Input file that specifies the parameters to be used during InSAR processing e.g. number of processes to run simultaneously during parallel processing stages.
User sets parameters to desired values
None
alos_baseline_time.csh Baseline vs. Time plot Determines which image will be chosen as the master for alignment of the stack. Determines which interferograms will be formed
CSV file listing radar images from JAXA/AUIG
align.in intf.in
link.csh Links the raw data from the data repository to the processing directory
batch.config
n/a
preprocess_parallel.csh ALOS_pre_process
Focuses each raw radar image. Runs in parallel
batch.config
.prm parameter files
collect_dat.csh Collects info from the .prm files, calculates median values to be used in batch processing and edits batch.config file
batch.config
data.in batch.config
pre_proc_batch_parallel.csh prep_loop.csh
Focuses all of the images to the median parameters of the stack Runs in parallel
data.in batch.config
RAW & .prm parameter files
align_batch_parallel.csh align_loop.csh
Aligns all of the images to a single master image. Runs in parallel
align.in batch.config
SLC files
topo_align.csh Aligns the digital elevation model of topography to the master radar image
batch.config
topo phase files & landmask
intf_batch_parallel.csh intf_loop.csh
Generates interferograms, filters and then unwraps the phase. Runs in parallel
intf.in batch.config
INTF files
remove_trend_parallel.csh trend_loop.csh
Removes a bilinear ramp or uses high pass filtering to
batch.config
INTF files
18

Broad-scale Volcano Monitoring in Papua New Guinea using InSAR
NAME FUNCTION INPUTS OUTPUTS
remove orbital errors and long wavelength signals from interferograms Runs in parallel
matrix_plot_script.gmt Generates a composite plot composed of subplots of each interferogram allowing cross-comparison. Each interferograms is plotted with its individual colour scale
batch.config path to interferogram directory
subplots in INTF dir
pixel_select_stack.csh Stacks interferograms to generate an average deformation map.
Satellite Track Frame ifm_info.txt batch.config
stacked ifm files in STACK dir
19
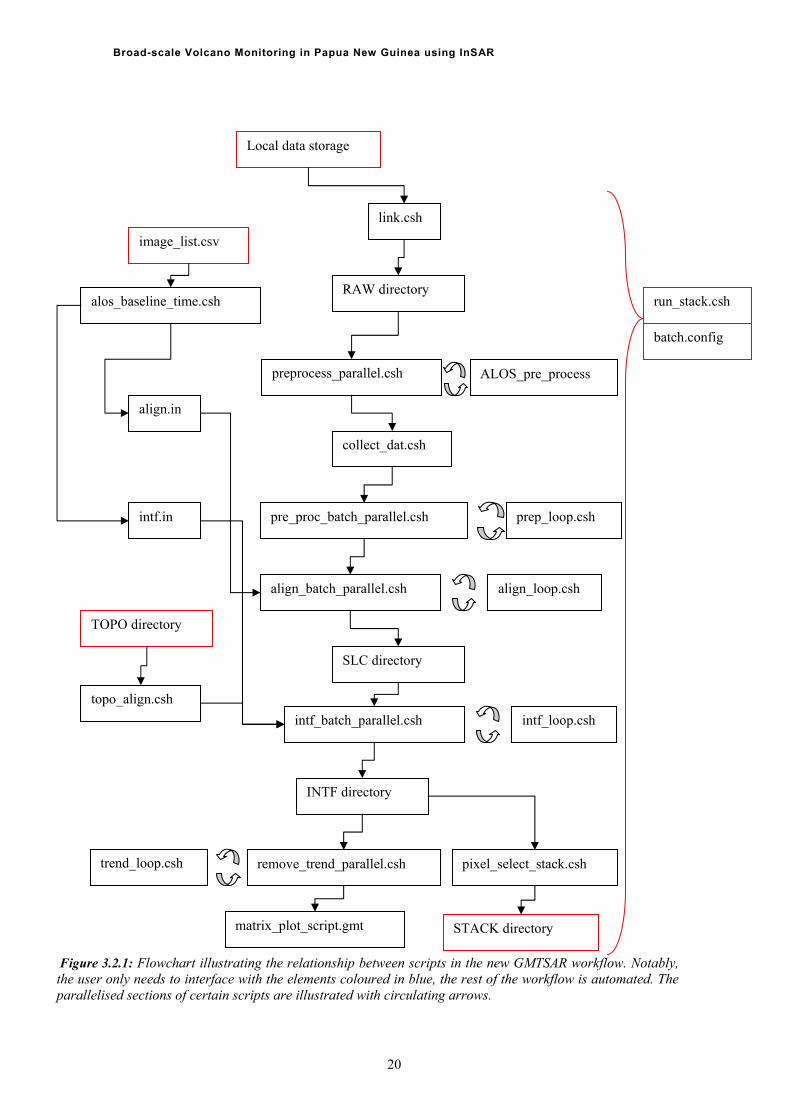
Broad-scale Volcano Monitoring in Papua New Guinea using InSAR
Local data storage
link.csh
Figure 3.2.1: Flowchart illustrating the relationship between scripts in the new GMTSAR workflow. Notably, the user only needs to interface with the elements coloured in blue, the rest of the workflow is automated. The parallelised sections of certain scripts are illustrated with circulating arrows.
RAW directory run_stack.csh
batch.config
preprocess_parallel.csh ALOS_pre_process
pre_proc_batch_parallel.csh prep_loop.csh
align_batch_parallel.csh align_loop.csh
intf_batch_parallel.csh intf_loop.csh
collect_dat.csh
image_list.csv
align.in
intf.in
topo_align.csh
SLC directory
INTF directory
TOPO directory
remove_trend_parallel.csh
matrix_plot_script.gmt
pixel_select_stack.csh
alos_baseline_time.csh
STACK directory
trend_loop.csh
20

Broad-scale Volcano Monitoring in Papua New Guinea using InSAR
3.3 THE INTERFEROGRAM STACKING ALGORITHM
The final stage of the processing workflow is to stack the interferograms. The purpose of stacking is to average out noise due to spurious atmospheric signals that may be present in individual interferograms by summing numerous interferograms and dividing by the total time span (e.g. Wright et. al. 2001, Peltzer et. al. 2001). The result of the stacking process is a map of the average LOS displacement over the period of time spanned by the interferograms. It is important to note that the interferograms included in the stack can be a subset of the interferograms that were processed in the preceding stages of the workflow. This provides a convenient shortcut to generate different stacks, assuming a sufficiently large set of interferograms has already been generated. In practice, the interferograms to be included in the stack is controlled by re-running the baseline vs. time plotting script with different spatial and temporal baseline thresholds. The following description provides an outline of the stacking methodology that has been used:
1. Selection of interferograms to be included in the stack based on the output of the baseline vs. time script. A new composite plot is produced based on the interferograms that will be included in the stack.
2. Each interferogram measures range change over different time periods and the total time span represented when the interferograms are stacked together must be calculated. For each interferogram, the coherent pixels are assigned the number of days spanned by that interferogram. By summing over all of the interferograms, a map of the total time span represented in the stack for each pixel is generated.
3. The unwrapped phase is summed for all interferograms in the stack. There is an option to subtract the median value from a ‘reference window’ where no surface deformation is assumed i.e. to level the data to a common reference point before the sum is calculated.
4. The summed phase is divided by the time span represented by each pixel to produce an average deformation map. A conversion is applied to convert the average phase units (radians) to a rate of mm/yr in the line of sight (LOS) direction.
5. The average correlation of the stack is calculated by averaging over the correlation maps for each interferogram in the stack. The average correlation is used to mask pixels that fall below a specified threshold. A landmask, using either the GMT built-in coastline or a custom landmask file if available, is applied to mask any water pixels that were missed by the correlation mask.
6. The results are geocoded (projected to geographic coordinates) and output files (e.g. .png, .kml) are created.
21

Broad-scale Volcano Monitoring in Papua New Guinea using InSAR
22
3.4 REQUIRED SYSTEM RESOURCES The computational resources required to operate this processing workflow depends on the number of SAR data acquisitions to be analysed and the desired processing time. In the present study, the workflow was tested on a virtual UNIX system running the CentOS 6.2 Linux distribution with 8 processors at 2GHz and 16GB RAM. The workflow should also run on lower specified systems, though processing times will be proportionately longer. The variation of processing time required to produce, filter and unwrap interferograms for batches containing different numbers of interferograms is a linear function shown in Figure 3.4.1. The processing times for the entire workflow, when applied to 21 SAR acquisitions and producing 79 interferograms is shown in Figure 3.4.2. It is important to note that while an operator could be trained to establish operation of an InSAR monitoring system relatively quickly, it would take significantly longer to develop an ability to interpret the results of the monitoring and to troubleshoot problems or bugs in the workflow. For example, as an operator becomes more experienced they are better able to differentiate between spurious signals like atmospheric delays and signals produced by ground deformation. For this reason, a transitional period where an experienced operator would continue to guide interpretation of the monitoring data is suggested.
Batch Interferogram Generation, Unwrapping and Phase Filtering run in parallel with 8 processors
05
101520253035404550
0 20 40 60 80 100 12
Number of Interferograms generated in batch
Pro
ce
ss
ing
Tim
e (
hrs
)
0
Figure 3.4.1: The processing time required to produce interferograms, filter and unwrap the resulting phase for batch runs containing different numbers of interferograms.

Bro
ad
-sc
ale
Vo
lca
no
Mo
nito
ring
in P
ap
ua
Ne
w G
uin
ea
us
ing
InS
AR
Max process time
Min process time
Figure 3.4.2: Processing times associated with InSAR processing. The parallel sections of the processing were run on an 8 core system. ** processing time reflects the average time required to process each interferogram in a batch, the total time being directly dependent on the number of interferograms in the batch
InSAR Batch Processing Workflow
0.01
0.1
1
10
100
1000
Link
raw d
ata
Indiv
idual
.prm
optim
izatio
n (par
alle
l)
Med
ian p
rm c
alcu
latio
n
Prepro
cess
bat
ch w
ith m
edia
n par
amet
ers
(par
alle
l)
Align im
ages
to c
omm
on mas
ter (
paral
lel)
Align to
pography
with S
AR imag
es
**Form
inte
rfero
gram
s, fi
lter &
unwra
p (par
alle
l)
Remove
regio
nal tr
end: p
oly o
r hig
h-pas
s (p
aral
lel)
Plot i
nterfe
rogra
ms
Stack
inte
rfero
gram
s
Pro
ces
sin
g t
ime
(min
)
23

Broad-scale Volcano Monitoring in Papua New Guinea using InSAR
4. Application of the GMTSAR processing workflow: Rabaul Caldera case study 4.1 INTRODUCTION The high cost of ALOS-PALSAR data (see section 2.3) at the present time makes a comprehensive investigation of a PNG volcano monitoring system prohibitive. Instead, a case study of the Rabaul Caldera is presented in place of a larger scale survey. The purpose of this case study is to demonstrate the workflow and methodology when applied to an active volcanic system. As discussed in Section 2.3, extending this methodology to produce a complete survey of PNG volcanoes would likely require a renegotiation of the data licensing agreement with JAXA. Rabaul Caldera has had numerous periods of activity during the 20th century and has continued to be active into the 21st century. The volcanic activity of the caldera poses a significant threat to the residents and infrastructure of Rabaul town. An eruption in 1937 cost 500 lives and more recently a major eruption in 1994 destroyed much of Rabaul town and its infrastructure. Since New Britain is in the vicinity of major flight paths (e.g. Sydney to Tokyo), volcanic ash clouds that are hazardous to aircraft can have a significant economic impact through diversions, delays and cancellations of flights (e.g. Tupper et. al., 2007). Ash-fall can also lead to disruptions at local airports (e.g. Guffanti et. al., 2009). The caldera contains two active volcanoes and several dormant ones (see Figure 4.1.1). For the purposes of this study Matupit Island also behaves like an active volcano in that its vertical displacement has been directly linked to eruptive activity (e.g. its rapid uplift preceding the significant 1994 Tavurvur eruption; Johnson et. al., 2010). More recently, over the 2004 to 2006 period, a time-varying deformation episode was recorded at a GPS station located on Matupit Island (see Figure 4.1.2). While GPS measurements can provide high temporal resolution of time-varying deformation, InSAR can better constrain the spatial extent of the deformation without the need to routinely visit the location. If an extensive network of GPS stations is available in an area, combining InSAR with GPS measurements enables placement of high spatial resolution deformation maps in an externally-defined reference frame (e.g. Gourmelen et. al, 2010; Wang and Wright, 2012).
24

Broad-scale Volcano Monitoring in Papua New Guinea using InSAR
Elevation (m)
Figure 4.1.1: The Rabaul Caldera and surroundings. The active volcanoes are shown in red while inactive volcanoes are shown in yellow. Matupit Island is not strictly a volcano, but its vertical oscillations have been linked with major eruptions in the past e.g. rapid uplift of Matupit Island was detected in the hours before the major eruption at Tavurvur in 1994 (Johnson et. al., 2010).
Ellipsoid Height change in metres at SDA Church at Matupitsince Aug 2003
96.65096.66096.67096.68096.69096.70096.71096.72096.73096.74096.75096.76096.77096.78096.79096.80096.81096.82096.83096.84096.85096.86096.87096.88096.89096.90096.91096.92096.93096.94096.95096.96096.97096.98096.99097.000
1-Aug-03
1-Sep-03
1-Oct-03
1-Nov-03
1-Dec-03
31-Dec-03
31-Jan-04
1-Mar-04
1-Apr-04
1-May-04
1-Jun-04
1-Jul-04
1-Aug-04
31-Aug-04
30-Sep-04
31-Oct-04
30-Nov-04
31-Dec-04
30-Jan-05
2-Mar-05
1-Apr-05
1-May-05
1-Jun-05
1-Jul-05
1-Aug-05
31-Aug-05
1-Oct-05
31-Oct-05
1-Dec-05
31-Dec-05
30-Jan-06
2-Mar-06
1-Apr-06
2-May-06
1-Jun-06
2-Jul-06
1-Aug-06
31-Aug-06
1-Oct-06
Start of05Eruption
System dow n
'Billow ing'Eruption.2nd w eekAug. 06End of
05Eruption
07/10/06Eruption30 cm
deflation
9 cmuplift
5 cm
NOW
Figure 4.1.2: Time varying deformation of Matupit Island measured by GPS. Nine centimetres of inflation was observed during an eruption in 2005 over a period of ~7 months. This was followed by a rapid deflation of 30 centimetres in a period of less than one month. Reproduced with the permission of Steve Saunders, RVO.
25

Broad-scale Volcano Monitoring in Papua New Guinea using InSAR
4.2 METHOD Interferogram Processing The workflow described in Section 3 was applied to a dataset covering the Rabaul Caldera (ALOS Track 352, Frame 7090). The dataset consisted of 21 ALOS-PALSAR images that were acquired from 2007-2011. From this dataset a series of 79 interferograms were generated. The network of acquisitions and interferograms is illustrated in Figure 4.2.1 and further details are given in Appendix 1. For each interferogram, the ‘Master’ image was chosen as the first acquisition of the pair and the ‘Slave’ the second. The interferogram processing was run on a virtual UNIX machine with 8 processors running at 2 GHz and 16 GB RAM. The topographic contribution to the phase was calculated and subtracted using a digital elevation model (DEM) based on SRTM data with resolution of 3 arc-seconds (~90m). The domain that was processed was limited to a subregion of the SAR frame around the Rabaul Caldera. Prior to unwrapping the interfered phase was smoothed with a Gaussian filter using a window size of 300m. The interfered phase with coherence greater than 0.02 was unwrapped using the algorithm snaphu (Chen & Zebker, 2000). Following unwrapping, a custom landmask was applied to remove pixels in sea regions. The custom landmask was manually constructed and refined from an average coherence of all 79 interferograms. The resulting landmask had significantly better coastline definition than the default, which relies on the GMT built-in ‘high’ resolution coastline file. In particular, Matupit Island, which has recently become connected to the rest of the peninsula by a land bridge due to volcanic activity, was represented more accurately using the custom landmask. To remove regional signals (i.e. those with wavelengths much longer than the expected volcano deformation) resulting from residual orbital or atmospheric phase contributions, high-pass filtering was applied to the unwrapped interferograms. In practice, for computational efficiency, a low-pass filter was applied and subtracted from the phase leaving a high-pass residual phase. The cut-off wavelength of the filter was 8km, which was sufficient to remove the dominant regional signals in the interferograms but was substantially longer than expected deformation signals. Trend removal using a bilinear-ramp (or higher order polynomial) was also considered. However, it was found that the polynomial approximations did not adequately represent the data, resulting in residual errors (particularly around the edges of the scene).
26

Broad-scale Volcano Monitoring in Papua New Guinea using InSAR
Figure 4.2.1: Baseline vs. time plot for SAR acquisitions covering Rabaul Caldera (ALOS track 352, frame 7090). The acquisitions were aligned to the master shown in blue and the red lines connecting pairs of acquisitions represent the interferograms with spatial baseline < 1000m and temporal baseline < 1 year. Interferogram Stacking The unwrapped and high-pass filtered interferograms were stacked using the algorithm described in Section 3. Pixels with an average correlation of less than 0.04 were masked. Two additional stacks were produced using subsets of interferograms that met the following criteria: spatial baseline < 100m (see Figure 4.2.2) or temporal baseline ≤ 96 days i.e. 2 repeat cycles (see Figure 4.2.3) High-pass filtering was found to remove regional trends in the interferograms more effectively than bilinear-ramp trend removal. Stacks where bilinear-ramp trend removal had been applied led to propagation of residual errors due to inadequate polynomial fitting that tended to produce a spurious signal, similar to a residual orbital contribution but in an arbitrary direction. In addition, stacking the raw unwrapped phase that had not undergone regional trend removal produced a strong regional trend due to orbital errors i.e. it appears there was a systematic bias in orbits as random orbital errors would have cancelled one another.
27

Broad-scale Volcano Monitoring in Papua New Guinea using InSAR
Figure 4.2.2: Baseline vs. time plot illustrating the subset of interferograms with spatial baseline < 100m.
Figure 4.2.3: Baseline vs. time plot illustrating the subset of interferograms with temporal baseline ≤ 96 days (2 satellite repeat cycles). 4.3 RESULTS AND DISCUSSION In general, interferograms formed with larger spatial or temporal baselines will contain more decorrelated pixels than those formed with smaller baselines. The difference between interferograms with long and short temporal baselines is illustrated in Figure 4.3.1 and the difference between large and small spatial baselines is shown in Figure 4.3.2. The loss of correlation with increasing temporal baseline is due to changes in the radar reflecting properties of the ground, through vegetation growth, landslides etc. In addition to the loss of correlation with increasing temporal baseline, the interferograms formed over 6-7 satellite repeat cycle periods were more prone to unwrapping errors. These unwrapping errors appear as blotchy patterns of discontinuous phase. For example, the 6 & 7 repeat cycle interferograms (Figure 4.3.1) both show large unwrapping errors along the left-hand boundary of the images.
28

Broad-scale Volcano Monitoring in Papua New Guinea using InSAR
15/01/2008 – 01/03/2008 1 repeat cycle
15/01/2008 – 16/04/2008 2 repeat cycle
27/02/2007 – 15/07/2007 3 repeat cycle
22/04/2010 – 23/10/2010 4 repeat cycle
05/12/2009 – 07/09/2010 6 repeat cycle
04/03/2009 – 20/01/2010 7 repeat cycle
Figure 4.3.1: Illustration of the loss of coherence with increasing temporal baseline. Pixels with coherence below 0.08 have been masked. These interferograms shared similar spatial baselines with a mean of 46m and standard deviation of 12m.
23/07/2010 – 07/09/2010 B┴ = 1 m
15/07/2007 – 30/08/2007 B┴ = 154 m
17/01/2009 – 04/03/2009 B┴ = 390 m
Figure 4.3.2: The effect of differing spatial baseline on coherence. These interferograms were all formed from image pairs separated by a period of 1 satellite repeat cycle (46 days). Pixels with coherence below 0.08 have been masked.
29

Broad-scale Volcano Monitoring in Papua New Guinea using InSAR
A modest loss of correlation was observed over the range of spatial baselines within the set of interferograms (see Figure 4.3.2). The loss of correlation tends to occur in regions of steep topography. The difference in viewing angles between the two images and the high terrain gradients can cause the phase to change by more than one wavelength over the width of a pixel. However, because the regions affected by the loss of correlation lay outside the immediate vicinity of the volcanoes the impact is likely to be insignificant. In fact, it appears that useful interferograms could be formed over greater spatial baselines if required. However, in this case the network of SAR acquisitions was dense enough that interferograms with small temporal baselines could be formed in most cases. The result of stacking all of the interferograms that were processed is shown in Figure 4.3.3a, which has been geocoded and overlaid on Google Earth satellite imagery and topography. To assess the phase contribution of interferograms with either, short temporal or small spatial baselines the interferograms fitting these criteria were processed into two additional stacks (Figure 4.3.3b-c). Stacking with subsets of interferograms generally reduced the number of pixels falling below the correlation threshold, but also highlighted different signals. For example, the small spatial baseline subset (Figure 4.3.3b) shows a deflation around Matupit Island and Tavurvur. The small temporal baseline subset (Figure 4.3.3c) tends to show higher frequency signals, though there also appears to be a significant contribution from atmospheric phase delay effects (e.g. over Turangunan). The overlay of the stacked interferograms with Google Earth satellite imagery and topography was used to visualise the relationship between the phase signals and the topography (Figure 4.3.4). There was a strong association between areas of high topography with positive range change signals. The velocity of the radar waves through the atmosphere depends on conditions like temperature, pressure and the presence of water vapour. Due to the vertical stratification of the atmosphere, localised regions of high topography, such as volcanic cones, affect the path length that radar waves must travel through the atmosphere. Often an increase in travel time is seen over high topographic features since atmospheric water vapour (in the form of clouds) tends to congregate around mountainous terrain, delaying the radar wave propagation. In an ideal case, the phase delay on the interferogram depends only on the altitude of the corresponding pixel (Beauducel & Briole, 2000). Therefore, it is likely that the high altitude of Tavurvur, Vulcan, Turangunan, Kabiu and Tovanumbatir peaks was responsible for atmospheric delays that produced positive range change anomalies at these locations (Figure 4.3.4). Caution should be exercised when interpreting perceived deformation signals in the presence of topographically correlated atmospheric delay signals. It is recommended that explicit treatment of these delay signals should be addressed in any further development of the GMTSAR InSAR processing system. Figure 4.3.4 highlights that the signal observed at Matupit Island does not appear to be related to topography. In this case, the positive LOS range change is the result of an average ground deflation at Matupit Island over the period 2007-2011. The average rate of subsidence of 40-80mm/yr, varying spatially across Matupit Island, is similar to the GPS derived deformation rate of ~80mm/yr at the SDA Church station (John Dawson, pers. comm.). Additionally, the overall subsidence of Matupit Island over this period is in agreement with the GPS & InSAR results of Hutchinson & Dawson (2009).
30

Broad-scale Volcano Monitoring in Papua New Guinea using InSAR
Figure 4.3.3: Overlay of apparent LOS range change on Google Earth satellite imagery and topography for geocoded stacked interferograms containing (a) all processed interferograms, (b) subset of interferograms with spatial baseline < 100m and (c) subset of interferograms with temporal baseline ≤ 96 days (2 repeat cycles). Since the master was chosen as the first acquisition the positive range changes correspond to an increase in radar travel time e.g. subsidence of the ground surface or an increased atmospheric delay.
(b) (a)
(c)
31

Broad-scale Volcano Monitoring in Papua New Guinea using InSAR
D C
B
A
E
Ground deformation (other signals caused by phase-elevation relation)
F
Figure 4.3.4: Visualisation of 79 interferogram stack (see Figure 4.3.3a) draped over Google Earth topography, which has been vertically exaggerated by a factor of 2. The range change signals at Tavurvur (A), Vulcan (F), Turangunan (B), Kabiu (C) and Tovanumbatir (D) are strongly associated with areas of high elevation. These misleading signals are due to the relationship between phase and elevation caused by variation in radar propagation through the vertically stratified troposphere (Beauducel & Briole 2000). On the other hand, Matupit Island (E) is very low elevation and the positive LOS range change appears to be indicative of ground deflation.
32

Broad-scale Volcano Monitoring in Papua New Guinea using InSAR
5. Assessment of broad-scale InSAR monitoring feasibility
Previous studies have demonstrated a clear application for InSAR to identify ground deformation associated with the eruptions of a wide range of volcanoes. The conditions of PNG, such as steep topography, dense vegetation and its moist, turbulent atmosphere create specific challenges in applying the technique to monitor the active volcanoes of PNG. On the other hand, the remoteness of many of the volcanoes and the very limited geophysical resources currently employed to monitor them, makes a broad-scale InSAR monitoring system an attractive proposition. A case study of the Rabaul Caldera demonstrates that L-band SAR interferometry can overcome many of the challenges of InSAR application in PNG, though several major challenges remain.
Firstly, the applicability of InSAR as an ongoing tool for broad-scale volcano monitoring in PNG hinges on the future availability of SAR satellite imagery. The dense vegetation associated with many PNG volcanoes means that L-band SAR is likely to be more effective than C-band SAR because of its greater ability to penetrate vegetation. Unfortunately, no L-band SAR data has been acquired since the termination of the ALOS mission. The current scarcity of data will be alleviated by future satellite missions, particularly ALOS-2. However, the current cost of ALOS data is prohibitive to ongoing broad-scale volcano monitoring, given the volume of data required to achieve the required spatial and temporal resolution. Future satellite missions, like ALOS-2, will acquire SAR data with even higher temporal resolution, but this will be of little use to InSAR monitoring unless it is available at a cost conducive to regular access. At present, the greatest barrier to a broad-scale InSAR monitoring system is the prohibitive cost of obtaining the required SAR imagery.
The InSAR processing workflow that has been developed in this study has several major strengths, applicable to use in a broad-scale volcano monitoring system. It is open source, being based on the GMTSAR package, has a simple interface and a greater level of automation has been implemented. All of these attributes make the system more usable in developing countries and reduces the resources and training required to become operational. By parallelising the most computationally intensive parts of the workflow it is also quicker and more scalable than the standard GMTSAR package, which may help to deal with the large volume of data processing required in a broad-scale volcano monitoring operation.
However, the current processing workflow is not without its limitations and additional development could continue to improve the system. While it is encouraging that the average deflation of Matupit Island over 2007-2011 was resolved, it would be more useful to be able to track the time-series progression of the deformation (as it is likely to be non-linear). Algorithms to produce time-series from stacks of interferograms are available e.g. StaMPS (e.g. Hooper, 2008) and π-RATE (e.g. Wang et. al., 2009), but require commercial Matlab software licenses that would substantially and undesirably increase the resources required to fund the system. However, time-series analysis may also help to overcome another limitation of the current system, i.e. that spurious signals from atmospheric-topographic interactions are not corrected and can potentially be misinterpreted.
33

Broad-scale Volcano Monitoring in Papua New Guinea using InSAR
5.1 RECOMMENDATIONS Negotiation of a new data licensing agreement that recognises the substantial data requirements of
a broad-scale InSAR monitoring system and that such a system will be used to aid people in developing countries. The commercial cost of SAR data is prohibitive to broad-scale InSAR volcano monitoring. A possible solution would be the negotiation of a reduced cost for data that is to be used directly for the purpose of natural hazard monitoring.
Development of an open source InSAR time-series code for integration into the existing open
source GMTSAR processing framework. Implementation of a training program to train a PNG Department of Mineral Policy and
Geohazards Management staff member to operate the InSAR processing system to a self-sufficient and sustainable level. A suitable training program would involve a period of direct tutoring and supervision (~1 month), followed by an extended period of supported operation (~12 months) during which an experienced operator would be available to assist with problems as they arise. The training could be carried out at Geoscience Australia in Canberra.
Acquisition of a computer sufficient to run the InSAR processing e.g. 8 cores, 16 Gb RAM,
Unix operating system. The operator could be trained on the machine at Geoscience Australia, and could then transport it to PNG to smooth the transition to a PNG-based monitoring system.
We estimate that approximately 3.3 Tb of disk storage would be required per year to run the
operational monitoring system, assuming that the future JAXA ALOS-2 SAR mission acquires data in 10 scenes covering the main volcanoes of interest with an orbital revisit of 14 days.
34

Broad-scale Volcano Monitoring in Papua New Guinea using InSAR
References Bathke, H., Shirzaei, M. and Walter, T. R., 2011. Inflation and deflation at the steep-sided Llaima stratovolcano (Chile) detected by using InSAR. Geophys. Res. Lett, v38, L10304. Beauducel, F. and Briole, P., 2000. Volcano-wide fringes in ERS synthetic aperture radar interferograms of Etna (1992-1998): Deformation or tropospheric effect?. J. Geophys. Res., v105, no. B7, p16,391-16,402. Burgmann, R., Rosen, P. A. and Fielding E. J., 2000. Synthetic Aperture Radar Interferometry to Measure Earth’s Surface Topography and its Deformation. Ann. Rev. Earth Planet. Sci., v28, p169-209. Chen C. W., and Zebker, H. A., 2000. Network approaches to two-dimensional phase unwrapping: intractability and two new algorithms. J. Opt. Soc. Am. A, v17, p 401-414. Curlander, J. C., McDonough, R.N., 1991. Synthetic Aperture Radar: System and Signal Processing. Wiley-Interscience, 672pp. Dawson, J. H., 2008. Satellite Radar Interferometry with Application to the Observation of Surface Deformation in Australia. PhD Thesis, Australian National University, Canberra. Dzurisin, D., 2000. Volcano geodesy: challenges and opportunities for the 21st century. Phil. Trans. R. Soc. Lond., v358, p1547-1566. Gourmelen, N., Amelung, F., and Lanari, R., 2010. Interferometric synthetic aperture radar-GPS integration: Interseismic strain accumulation across the Hunter Mountain fault in the eastern California shear zone. J. Geophys. Res., v115, B09408. Guffanti, M., Mayberry, G. C., Casadevall, T. J. and Wunderman, R., 2009. Volcanic hazards to airports. Nat. Haz., v51, p287-302. Hooper, A., 2008. A multi-temporal InSAR method incorporating both persistent scatterer and small baseline approaches. Geophys. Res. Lett., v35, L16302. Hutchinson, D. K. and Dawson, J. H., 2009. Satellite Radar Interferometry: Application to Rabaul Caldera. Geoscience Australia Record, 2009/39, 19pp. Johnson, R. W., Itikarai, I., Patia, H. and McKee, C. O., 2010. Volcanic systems of the Northeastern Gazelle Peninsula, Papua New Guinea: synopsis, evaluation, and a model for Rabaul Volcano. Papua New Guinea. Rabaul Volcano Workshop Report, Papua New Guinea Department of Mineral Policy and Geohazards Management, and Australian Agency for International Development, Port Moresby, 84pp. Lanari, R., Lundgren, P. and Sansosti, E., 1998, Dynamic deformation of Etna volcano observed by satellite radar interferometry. Geophys. Res. Lett, v25 (10), p1541-1544. Loveland, T. R., Reed, B. C., Brown, J. F., Ohlen, D. O., Zhu, Z., Yang, L. and Merchant, J. W., 2000. Development of a global land cover characteristics database and IGBP DISCover from 1 km AVHRR data. Int. J. Remote Sens., v21 (6-7), p1303-1330.
35

Broad-scale Volcano Monitoring in Papua New Guinea using InSAR
36
Lu, Z., Masterlark, T. and Dzurisin, D., 2005. Interferometric synthetic aperture radar study of Okmok volcano, Alaska,1992–2003: Magma supply dynamics and postemplacement lava flow deformation. J. Geophys. Res., v110, B02403. Parks, M. M., Briggs, J., Mather, T. A., Pyle, D. M., Amelung, F., Monsalve, M. L. and Medina, L. N., 2011. Co-eruptive subsidence at Galeras identified during an InSAR survey of Columbian volcanoes (2006-2009). J. Vol. Geotherm. Res., v202, p228-240. Peltzer, G., Crampe, F., Hensley, S. and Rosen, P., 2001. Transient strain accumulation and fault interaction in the Eastern California shear zone. Geology, v29, (11), p975-978. Rosen P. A., Hensley, S., Joughin, I. R., Li, F. K., Madsen, S. N., Rodriguez, E. and Goldstein, R. M., 2000. Synthetic Aperture Radar Interferometry. Proc. IEEE, v88 (3), p333-382. Sandwell, D., Mellors, R., Tong, X. and Wessel, P., 2011. GMTSAR: An InSAR processing system based on Generic Mapping Tools. Technical Report, Scripps Inst. of Oceanography, San Diego, La Jolla. http://escholarship.org/uc/item/8zq2c02m. Tomiyama, N., Koike, K. and Omura, M., 2004. Detection of topographic changes associated with volcanic activities of Mt. Hossho using D-InSAR. Adv. Space Res., v33, p279-283. Tupper, A., Itikarai, I., Richards, M., Prata, F., Carn, S. and Rosenfield, D., 2007. Facing the Challenges of the International Airways Volcano Watch: The 2004/05 Eruptions of Manam, Papua New Guinea. Weather and Forecasting, v22, p175-191. Wadge, G., Mattioli, G. S. and Herd, R. A., 2006. Ground deformation at Soufrière Hills Volcano, Montserrat during 1998-2000 measured by radar interferometry and GPS, J. Vol. Geotherm. Res., v152, p157-173. Wallace, L. M., Stevens, C., Silver, E., McCaffrey, R., Loratung, W., Hasiata, S., Stanaway, R., Curley, R., Rosa, R. and Taugaloidi, J., 2004. GPS and seismological constraints on active tectonics and arc-continent collision in Papua New Guinea: Implications for mechanics of microplate rotations in a plate boundary zone. J. Geophys. Res., v109, B05404. Wang, H., Wright, T. J., and Biggs, J., 2009. Interseismic slip rate of the northwestern Xianshuihe fault from InSAR data. Geophys. Res. Lett., v36, L03302. Wang, H. and Wright, T. J., 2012. Satellite geodetic imaging reveals internal deformation of western Tibet. Geophys. Res. Lett., v39, L07303. Wicks, C., Thatcher, W. and Dzurisin, D., 1998. Migration of fluids beneath Yellowstone Caldera inferred from satellite radar interferometry. Science, v282, p458-462. Wright, T. J., Parsons, B. and Fielding, E. J., 2001. Measurement of interseismic strain accumulation across the North Anatolian Fault by satellite radar interferometry. Geophys. Res. Lett., v28 (10), p2117-2120. Yun, S. -H., Zebker, H., Segall, P., Hooper, A. and Poland, M., 2007. Interferogram formation in the presence of complex and large deformation. Geophys. Res. Lett., v34, L12305.

Broad-scale Volcano Monitoring in Papua New Guinea using InSAR
Appendices APPENDIX 1 – PROCESSED INTERFEROGRAMS FROM RABAUL CALDERA CASE STUDY Table i: Interferogram metadata
MASTER, SLAVE
ACQUISITION
DATES
B ┴
METER
B T
DAYS
1 070227, 070715 62 138
2 070227, 070830 92 184
3 070227, 071015 10 230
4 070227, 080115 192 322
5 070715, 070830 154 46
6 070715, 071015 52 92
7 070715, 080115 130 184
8 070715, 080301 179 230
9 070715, 080416 177 276
10 070830, 071015 102 46
11 070830, 080115 284 138
12 070830, 080301 333 184
13 070830, 080416 331 230
14 071015, 080115 182 92
15 071015, 080301 231 138
16 071015, 080416 229 184
17 080115, 080301 49 46
18 080115, 080416 47 92
19 080115, 081017 733 276
20 080301, 080416 2 46
21 080301, 081017 782 230
22 080301, 090117 661 322
23 080416, 081017 780 184
24 080416, 090117 659 276
25 080416, 090304 269 322
26 081017, 090117 121 92
27 081017, 090304 511 138
28 081017, 090720 542 276
29 081017, 090904 341 322
30 090117, 090304 390 46
31 090117, 090720 421 184
32 090117, 090904 220 230
33 090117, 091205 499 322
34 090304, 090720 31 138
35 090304, 090904 170 184
36 090304, 091205 109 276
37 090304, 100120 48 322
38 090720, 090904 201 46
39 090720, 091205 78 138
40 090720, 100120 17 184
41 090720, 100307 116 230
42 090720, 100422 366 276
43 090904, 091205 279 92
44 090904, 100120 218 138
45 090904, 100307 317 184
46 090904, 100422 567 230
47 090904, 100723 326 322
48 091205, 100120 61 46
49 091205, 100307 38 92
50 091205, 100422 288 138
51 091205, 100723 47 230
52 091205, 100907 48 276
53 091205, 101023 269 322
54 100120, 100307 99 46
55 100120, 100422 349 92
56 100120, 100723 108 184
57 100120, 100907 109 230
58 100120, 101023 330 276
59 100120, 101208 508 322
60 100307, 100422 250 46
61 100307, 100723 9 138
62 100307, 100907 10 184
63 100307, 101023 231 230
64 100307, 101208 409 276
65 100422, 100723 241 92
66 100422, 100907 240 138
67 100422, 101023 19 184
68 100422, 101208 159 230
69 100422, 110310 273 322
70 100723, 100907 1 46
71 100723, 101023 222 92
72 100723, 101208 400 138
73 100723, 110310 514 230
74 100907, 101023 221 46
75 100907, 101208 399 92
76 100907, 110310 513 184
77 101023, 101208 178 46
78 101023, 110310 292 138
79 101208, 110310 114 92
37

Broad-scale Volcano Monitoring in Papua New Guinea using InSAR
Figure i: Part 1, Unwrapped interferograms from Rabaul Caldera case study
38

Broad-scale Volcano Monitoring in Papua New Guinea using InSAR
Figure ii: Part 2, Unwrapped interferograms from Rabaul Caldera case study
39

Broad-scale Volcano Monitoring in Papua New Guinea using InSAR
Figure iii: Part 3, Unwrapped interferograms from Rabaul Caldera case study
40

Broad-scale Volcano Monitoring in Papua New Guinea using InSAR
APPENDIX 2 – EXAMPLE CONFIGURATION FILE (BATCH.CONFIG) FOR INSAR PROCESSING WITH MODIFIED GMTSAR #
# This is an example configuration file for batch and stack processing
#
# all the comments or explanations are marked by "#"
# The parameters in this configuration file is distinguished by their first word so
# user should follow the naming of each parameter.
# the parameter name, = sign, parameter value should be separated by space " ".
#
######################
# GMTSAR Path variable #
#####################
# define the location of the gmtsar_config file which
# sets up the GMTSAR environment variables
GMTSAR_dir = /usr/local/GMTSAR/gmtsar_config
################
# Project directory #
################
# define the subdirectory that will be created for the batch run
# intf, raw, SLC folders will be created automatically in the project directory
project_dir = stack_test
home_dir = /nas/gemd/geodesy_data/sar/INSAR_ANALYSIS/RABAUL_ROWAN/T352A/GMTSAR
#set the directory that the satellite images are stored in. The data will be linked to the project directory
data_dir = /nas/gemd/geodesy_data/sar/RAW_SAR/ALOS/RABAUL/FRAME_7090
sar_frame = 7090
# the namestem of the master image
master_image = IMG-HH-ALPSRP205887090-H1.0__A
#################################
# System Resources #
#################################
# set the maximum number of parallel processes that will run in
# intf_batch_parallel.csh and align_batch_parallel.csh
max_processes = 8
###########################
# parameters for preprocess #
# - pre_proc_batch.csh #
##########################
# num of patches
num_patches = 3
41

Broad-scale Volcano Monitoring in Papua New Guinea using InSAR
# earth radius
earth_radius = 6377943.175593
# near_range
near_range = 847766
# Doppler centroid
fd1 = 51.777008
##############################
# parameters for make topo_ra #
# - dem2topo_ra.csh #
###########################
# subtract topo_ra from the phase
# (1 -- yes; 0 -- no)
topo_phase = 1
# if above parameter = 1 then one should have put DEM.grd in topo/
# topo_ra shift (1 -- yes; 0 -- no)
shift_topo = 1
#########################################
# parameters for make and filter interferograms #
# - intf.csh #
# - filter.csh #
#######################################
# name the folder based on id (1) or date (0)
switch_folder = 0
# filters
# look at the filter/ folder to choose other filters
filter1 = gauss_alos_300m
# decimation of images
# decimation control the size of the amplitude and phase images. It is either 1 or 2.
# Set the decimation to be 1 if you want higher resolution images.
# Set the decimation to be 2 if you want images with smaller file size.
#
dec_factor = 1
# region of interest in radar coordinates
region_cut = 3000/7500/16648/27648
###########################################
# remove regional trend fringes from interferograms #
##########################################
# set to 1 to remove the regional trend
# set to 2 to use high-pass filtering to remove regional trend
# set to 0 if removal of regional trend is not required
region_trend = 2
42

Broad-scale Volcano Monitoring in Papua New Guinea using InSAR
#specify colour scale to use once regional trend is removed
colour_palette = rainbow
#specify maximum value for plotted colour scale (minimum is -1*maximum)
max_plot_val = 5
# set the order of the polynomial used to approximate regional trend
#e.g. 3 for planar trend i.e. f(x) + f(y) + c
# 6 for quadratic i.e. f(x^2) + f(xy) + f(y^2) + f(x) + f(y) + c
trend_param = 3
wavelength = 8000
# Optional - set an area that will be ignored when the regional trend is evaluated
# i.e. set to a region where a deformation signal is expected
# region to exclude from trend evaluation in radar coordinates
exclude_region = 5750/7000/22500/24500
# set flag to 1 to use this option or 0 if not required
hide_trend_region = 1
##############################
# parameters for unwrap phase #
# - snaphu.csh #
############################
# correlation threshold for snaphu.csh (0~1)
# set it to be 0 to skip unwrapping.
threshold_snaphu = .02
# use landmask (1 -- yes; else -- no)
switch_land = 1
# use custom landmask file (1 -- yes; else -- no), default is to use GMT coast file to make a landmask
use_custom_land = 1
#if using a custom landmask the file must be placed in the topo/ subdirectory
# and the filename of the mask specified below
# the landmask must be a GMT grid file with appropriate dimensions
custom_mask_file = rabaul_landmask_less_islands.grd
############################
# parameters for geocode #
# - geocode.csh #
##########################
# correlation threshold for geocode.csh (0~1)
threshold_geocode = .08
###########################
# parameters for stacking #
# - stack_ALOS.csh #
# or stack_ERS.csh #
# or stack_ENVI.csh #
########################
43

Broad-scale Volcano Monitoring in Papua New Guinea using InSAR
44
track = T352A
frame = 7090
# apply filtering (1 -- yes; else -- no)
switch_filter = 0
# set the maximum temporal baseline (in days) of interferograms will be stacked
# i.e. use where many interferograms are generated and large temporal baselines
# cause decorrelation resulting in a poor stacking result
max_t_baseline = 365
# set the fraction accumulated time that will be masked from stacking
# effectively equivalent to correlation threshold
threshold_time = 0
# set the location of a reference pixel window size (in radar coordinates) which will be used to level each interferogram
in the stack to a consistent reference. The reference pixel should be located in a region where no deformation is
expected. set flag to 1 if required or 0 to ignore
use_ref_pix = 0
ref_pix_window = 6100/6300/26000/26400
corr_mask = 0.04
std_mask = 6
regra = 3000/7500/16648/27648