BRITISH SOCIETY FOR HEART FAILURE · e. Extending the specialist care to more patients admitted...
71
Title 1 National Heart Failure Audit April 2015-March 2016 NATIONAL HEART FAILURE AUDIT APRIL 2015 - MARCH 2016 BRITISH SOCIETY FOR HEART FAILURE
Transcript of BRITISH SOCIETY FOR HEART FAILURE · e. Extending the specialist care to more patients admitted...
Title
1 National Heart Failure Audit April 2015-March 2016
NATIONAL HEART
FAILURE AUDIT
APRIL 2015 - MARCH 2016
BRITISH SOCIETY FOR HEART FAILURE
2 National Heart Failure Audit April 2015-March 2016
AcknowledgementsThe National Heart Failure Audit is managed by NICOR, which is part of NCAPOP, based at UCL. The National Heart Failure Audit is commissioned by HQIP as part of the NCAPOP.
Specialist clinical knowledge and leadership is provided by the British Society for Heart Failure (BSH) and the audit’s clinical lead, Professor Theresa McDonagh. The strategic direction and development of the audit is determined by the audit Project Board. This includes representatives of major stakeholders in the audit including cardiologists, the BSH, Heart Failure specialist nurses, Clinical Audit and Effectiveness Managers, patients, NICOR and HQIP. See Appendix A for the 2015/16 Project Board membership.
NICOR would especially like to thank the contribution of all NHS Trusts, Welsh Heath Boards and the individual nurses, clinicians and audit teams who collect data and participate in the audit. Without this input the audit could not continue to produce credible analysis, or to effectively monitor and assess the standard of heart failure care in England and Wales.
Published on 10th August 2017. The contents of this report may not be published or used commercially without permission.
This report is available online at http://www.ucl.ac.uk/nicor/audits/heartfailure/additionalfiles. Hospital level tables will be available on http://data.gov.uk. Participation analysis is published at http://www.hqip.org.uk/parcar/.
National Heart Failure AuditNational Institute for Cardiovascular Outcomes Research (NICOR) UCL Institute of Cardiovascular Science1 St Martin’s Le Grand, 2nd Floor, London EC1A 4NP
NICOR (National Institute for Cardiovascular Outcomes Research) is a partnership of clinicians, IT experts, statisticians, academics and managers which manages six cardiovascular clinical audits and two clinical registers. NICOR analyses and disseminates information about clinical practice in order to drive up the quality of care and outcomes for patients.
The British Society for Heart Failure (BSH) is a national organisation of healthcare professionals which aims to improve care and outcomes for patients with heart failure by increasing knowledge and promoting research about its diagnosis, causes and management.
The Healthcare Quality Improvement Partnership (HQIP) is led by a consortium of the Academy of Medical Royal Colleges, the Royal College of Nursing and National Voices. Its aim is to promote quality improvement, and in particular to increase the impact that clinical audit has on healthcare quality in England and Wales. HQIP holds the contract to manage and develop the National Clinical Audit Programme, comprising more than 30 clinical audits that cover care provided to people with a wide range of medical, surgical and mental health conditions. The programme is funded by NHS England, the Welsh Government and, with some individual audits, also funded by the Health Department of the Scottish Government, DHSSPS Northern Ireland and the Channel Islands.
Founded in 1826, UCL (University College London) was the first English university established after Oxford and Cambridge, the first to admit students regardless of race, class, religion or gender, and the first to provide systematic teaching of law, architecture and medicine. It is among the world’s top universities, as reflected by performance in a range of international rankings and tables. UCL currently has 24,000 students from almost 140 countries, and more than 9,500 employees. Its annual income is over £800 million.
This report was written and compiled by Akosua Donkor, Theresa McDonagh and Suzanna Hardman, with input from the National Heart Failure Audit Steering Group Committee (see Appendix 5 for the 2015/16 membership list).
Data extraction was carried out by Marion Standing. Data linkage, cleaning and analysis was performed by Jiaqiu Wang.
Authors
3National Heart Failure Audit April 2015-March 2016
National Heart Failure Audit Annual Report
April 2015 - March 2016
The ninth annual report for the National Heart Failure Audit presents findings and recommendations for patients with an unscheduled admission to hospital, who were discharged or died with a primary diagnosis of heart failure between 1 April 2015 and 31 March 2016. The report covers all NHS Trusts in England and Health Boards in Wales that admit patients with acute heart failure.
The report is aimed at all those interested in improving the standard of heart failure care, including those involved in collecting data for the National Heart Failure Audit, alongside the clinicians involved in delivering that care and the patients receiving it, the hospital chief executives, managers, clinical governance leads and those commissioning heart failure services, patient groups and many others. The report includes clinical findings at national and local levels, and patient outcomes.
4 National Heart Failure Audit April 2015-March 2016
Contents
Executive Summary 5
1. Introduction 7 1.1 What is Heart Failure 7
1.2 Management of Patients with Heart Failure 7
1.3 Guidelines and Quality Standards 7
1.4 National Heart Failure Audit 9 1.4.1 The role of the audit 9
1.4.2 Methodology 9
1.4.3 Data quality, data completeness & 9 case ascertainment
1.4.4 Data cleaning and data quality 9
1.4.5 Minimum data standard 10
1.4.6 How we analysed the data 10
2. The National Heart Failure Audit 11 2015/16 Results 2.1 Symptomatic Patient and Admission 11 2.1.1 Patients admitted with heart failure 11
2.1.2 Demographics 11
2.1.3 Trends in symptoms 11
2.1.4 Causes and co-morbidities of heart failure 12
2.2 Assessment and Diagnosis 12 2.2.1 ECG and echo diagnostic tests 12
2.2.2 Access to diagnostic test based on place of care 13
2.2.3 Echo diagnosis 13
2.2.4 Trends in place of care 13
2.2.5 Trends in input by HF specialist 13
2.2.6 Trends in length of stay 14
2.3 Treatment 15 2.3.1 Treatment at discharge for HF-REF 15
2.3.2 Trends in prescribing for HF-REF 15
2.3.3 Trends in treatment by place of care 16
2.3.4 Trends in treatment and specialist input 16
2.4 Discharge and Follow up 16
2.5 Patient Outcomes 17 2.5.1 Trends in In-hospital mortality 17
2.5.2 30 day mortality: Aggregate analysis 18
2.6 Audit achievements – driving patient outcomes 21 2.6.1 Key Performance Indicators (KPIs) 21
3. Use of Audit Data 22 3.1 National reporting 22
3.2 Local reporting and activity 22
4. HF Audit for the Future 23
Recommendations 24
5. Appendices 25
6. Glossary 66
7. References 69
5National Heart Failure Audit April 2015-March 2016
Title
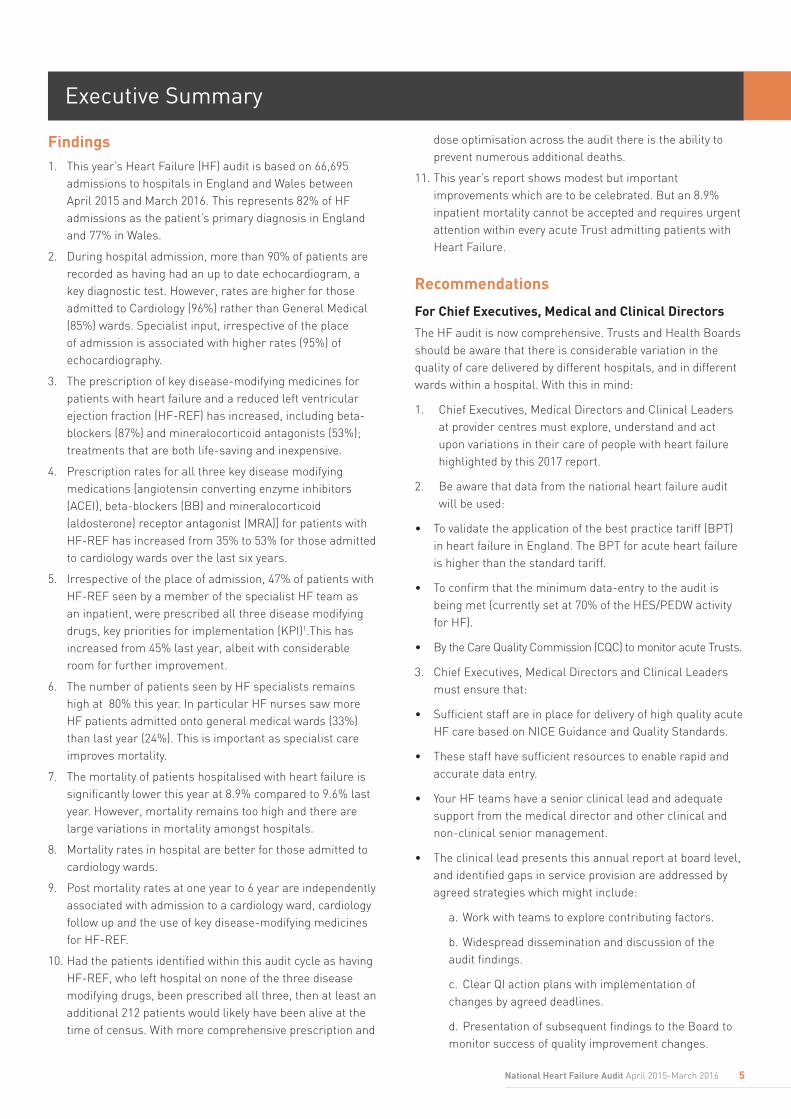
Findings1. This year’s Heart Failure (HF) audit is based on 66,695
admissions to hospitals in England and Wales between April 2015 and March 2016. This represents 82% of HF admissions as the patient’s primary diagnosis in England and 77% in Wales.
2. During hospital admission, more than 90% of patients are recorded as having had an up to date echocardiogram, a key diagnostic test. However, rates are higher for those admitted to Cardiology (96%) rather than General Medical (85%) wards. Specialist input, irrespective of the place of admission is associated with higher rates (95%) of echocardiography.
3. The prescription of key disease-modifying medicines for patients with heart failure and a reduced left ventricular ejection fraction (HF-REF) has increased, including beta- blockers (87%) and mineralocorticoid antagonists (53%); treatments that are both life-saving and inexpensive.
4. Prescription rates for all three key disease modifying medications [angiotensin converting enzyme inhibitors (ACEI), beta-blockers (BB) and mineralocorticoid (aldosterone) receptor antagonist (MRA)] for patients with HF-REF has increased from 35% to 53% for those admitted to cardiology wards over the last six years.
5. Irrespective of the place of admission, 47% of patients with HF-REF seen by a member of the specialist HF team as an inpatient, were prescribed all three disease modifying drugs, key priorities for implementation (KPI)1.This has increased from 45% last year, albeit with considerable room for further improvement.
6. The number of patients seen by HF specialists remains high at 80% this year. In particular HF nurses saw more HF patients admitted onto general medical wards (33%) than last year (24%). This is important as specialist care improves mortality.
7. The mortality of patients hospitalised with heart failure is significantly lower this year at 8.9% compared to 9.6% last year. However, mortality remains too high and there are large variations in mortality amongst hospitals.
8. Mortality rates in hospital are better for those admitted to cardiology wards.
9. Post mortality rates at one year to 6 year are independently associated with admission to a cardiology ward, cardiology follow up and the use of key disease-modifying medicines for HF-REF.
10. Had the patients identified within this audit cycle as having HF-REF, who left hospital on none of the three disease modifying drugs, been prescribed all three, then at least an additional 212 patients would likely have been alive at the time of census. With more comprehensive prescription and
dose optimisation across the audit there is the ability to prevent numerous additional deaths.
11. This year’s report shows modest but important improvements which are to be celebrated. But an 8.9% inpatient mortality cannot be accepted and requires urgent attention within every acute Trust admitting patients with Heart Failure.
Recommendations
For Chief Executives, Medical and Clinical Directors
The HF audit is now comprehensive. Trusts and Health Boards should be aware that there is considerable variation in the quality of care delivered by different hospitals, and in different wards within a hospital. With this in mind:
1. Chief Executives, Medical Directors and Clinical Leaders at provider centres must explore, understand and act upon variations in their care of people with heart failure highlighted by this 2017 report.
2. Be aware that data from the national heart failure audit will be used:
• To validate the application of the best practice tariff (BPT) in heart failure in England. The BPT for acute heart failure is higher than the standard tariff.
• To confirm that the minimum data-entry to the audit is being met (currently set at 70% of the HES/PEDW activity for HF).
• By the Care Quality Commission (CQC) to monitor acute Trusts.
3. Chief Executives, Medical Directors and Clinical Leaders must ensure that:
• Sufficient staff are in place for delivery of high quality acute HF care based on NICE Guidance and Quality Standards.
• These staff have sufficient resources to enable rapid and accurate data entry.
• Your HF teams have a senior clinical lead and adequate support from the medical director and other clinical and non-clinical senior management.
• The clinical lead presents this annual report at board level, and identified gaps in service provision are addressed by agreed strategies which might include:
a. Work with teams to explore contributing factors.
b. Widespread dissemination and discussion of the audit findings.
c. Clear QI action plans with implementation of changes by agreed deadlines.
d. Presentation of subsequent findings to the Board to monitor success of quality improvement changes.
Executive Summary

e. Extending the specialist care to more patients admitted with heart failure.
For Multidisciplinary HF Teams and HF leads and Networks
This audit is a measure of the quality of your service, which however good, can always be improved.
4. Ensure the data are accurate and reliably entered in a timely fashion and interrogate the data on a regular basis.
5. Share data across your acute Trust/Board, and networks and work together to find solutions. Your managers and commissioners may appreciate help understanding the data. Use the data to drive improved care. Be aware that hospital specific data will increasingly be in the public domain in future years. For this to be a correct representation of local practice, your data-entry needs to be accurate and comprehensive.
6. Use the national heart failure audit report (2017) data as a central component of business plans and in support of staff and other resources that are required when developing and delivering an evidence-based heart failure service.
7. Encourage and support quality improvement work targeted at improving any limitations in your care of people with acute heart failure as demonstrated by this heart failure audit report. For example you might need to develop your service to ensure it has:
• A named Trust HF clinic lead.
• Adequate specialist care including heart failure cardiologists and nurses and others.
• Adequate specialist team outreach services are available in all ward areas.
• All patients admitted with HF due to HFREF are offered disease modifying treatments (for example ACE/ARB, BB and MRA), prior to leaving hospital.
• A referral for cardiac rehabilitation, and an appointment to see a member of the HF team within 2 weeks, is made before patients leave hospital.
8. Share this HF Audit data with non HF Clinical teams and ensure they:
• Work with the appointed Trust HF clinical lead to explore and address known limitations demonstrated by heart failure audit report (2017) findings.
• Agree and implement QI initiatives aimed at targeting audit report identified limitations in the care provision of people with acute heart failure.
• Widely share successful QI initiatives resulting from acute heart failure audit report work for example through:
I. RCP ‘Tell us your story’: https://www.rcplondon.ac.uk/projects/future-hospital-tell-us-your-story.
II. HQIP case studies: http://www.hqip.org.uk/resources/.
For Commissioners
• It is essential that you understand your local HF team and that it is properly constituted and fully commissioned.
• Use the audit report to understand how the HF care that your commissioned team delivers, compares with other Trusts.
• Understand any service gaps and limitations in local HF care and work with your Trust HF lead, and their multidisciplinary team, to address any identified gaps in service.
• Discussing the annual HF report with local providers, and developing local targets for improvement, will be a highly effective tool for improving the HF care for your population – all services have room for improvement.
For Patients and Patient Groups
• This report provides a national picture of care for people with HF in 2015/16 in England & Wales, and also contains important information about your local hospital services, which can be compared against other hospitals and the national averages.
• Please pay close attention to the section on the NICE Key Priorities for Implementation and Quality Standards.
• This information should create opportunities to open local discussions about the quality of care and local services for people with HF. We hope that you find your local health care teams welcome your input into improving services.
6 National Heart Failure Audit April 2015-March 2016
1.1 What is Heart FailureHF means a defect in heart function (either emptying or filling) leading to a rise in atrial pressures (congestion) and, eventually, symptoms such as breathlessness and ankle swelling. It is common. Approximately 900,000 people in the United Kingdom have HF, it causes or complicates about 5% of all emergency hospital admissions in adults and consumes up to 2% of total NHS expenditure6. It is the final common pathway of most forms of cardiovascular disease, usually as a consequence of myocardial (heart muscle) dysfunction. In the UK, the most common type of HF is due to left ventricular systolic dysfunction, where there is impaired contraction of the left ventricle (HF-REF, HF with Reduced Ejection Fraction). HF can also be attributed to impaired filling of the left ventricle when the heart muscle is thickened, often as a result of long standing high blood pressure (HF-PEF, HF with preserved ejection fraction). HF is often described as chronic (CHF) when patients have relatively stable symptoms of breathlessness, fatigue and ankle swelling and acute (AHF), when the symptoms become severe and the patient usually requires admission to hospital. However, in many cases deterioration occurs gradually over several weeks before hospital admission and might be prevented if detected and managed earlier. The typical course of CHF is punctuated by periods of acute or sub- acute decompensation into AHF, although good management and monitoring will make these less frequent.
HF is often associated with marked reductions in quality of life and high levels of debility, morbidity and mortality. This imposes a heavy burden not only on patients but also those who care for them. Repeated hospitalisations are a measure of the adverse effects of HF on quality of life, the failure to control symptoms and disease progression, the high levels of co-morbidity and ultimately of an adverse prognosis; they also make a large contribution to the huge fiscal cost of HF to the NHS. Survival rates for HF patients are variable, dependent on the age and severity of disease of the patient, and the quality of care they receive. Outcomes are consistently poor for patients who receive suboptimal care, but input from the HF specialists and prescription of evidence-based HF therapies have a substantial prognostic benefit.
While there have been huge advances in the treatment of chronic HF with reduced systolic function (HF-REF) over the last twenty years (with 1 year mortality rates of 5-10% for those in clinical trials receiving optimal medical and device therapy), there has been little progress made in therapy for HF-PEF or those admitted with AHF regardless of left ventricular ejection fraction. The in-hospital mortality rate for those admitted with acute HF in the UK is approximately 10%, with more than one third of those discharged dying in the following year. However, age-related mortality rates are beginning to fall, reflecting more consistent implementation
of guideline recommendations. This audit has consistently shown that specialist cardiology care during the admission and initiation of optimal medical therapy for those with HF-REF is associated with better outcomes in hospital and at one year.
This audit deals with a specific and crucial phase in the patient journey. It reports on the characteristics of patients admitted with acute or sub-acute HF, the in-hospital investigation and care, the treatment given and the discharge planning and follow up which is offered.
The audit is now well established, reporting key metrics on over 70% of admissions with a primary diagnosis of HF and trends on KPIs and outcomes compared to previous years.
1.2 Management of Patients with Heart FailureThe treatment of HF is determined by the mode of presentation, that is acute or chronic, and the underlying type of cardiac dysfunction (HF-REF or HF-PEF).
There has been little progress in the treatment of AHF over the last forty years. Oxygen and intravenous diuretics rapidly relieve (usually within 30-90 minutes) symptoms of pulmonary congestion (breathlessness). Diuretics are also the mainstay of treatment for peripheral congestion although this may require several days of intensive treatment before it is controlled. Sometimes intravenous vasodilator or inotropic agents are required. Once patients are euvolaemic after intravenous therapy, they are converted to oral diuretics to ensure that they remain free from symptoms and signs of congestion (breathlessness and peripheral oedema). For those who have HF-REF as the underlying cause of their HF, key disease modifying medicines need to be given. These are ACE inhibitors (ACEI), beta-blockers (BB) and mineralocorticoid receptor antagonists (MRA). Data from numerous clinical trials in HF show that these medicines improve or reduce recurrent worsening of symptoms and reduce hospitalisations for HF and mortality. Previous audit reports show that patients discharged on all three medicines have better survival rates from discharge out to 6 years of follow-up compared to those discharged on fewer or none. The prescription of these medicines for HF-REF is a KPI in this audit.
1.3 Guidelines and Quality StandardsThe National HF audit dataset is evolving to ensure it remains an effective representation of current evidence based HF guidance. This 9th report reflects practice for the year April 2015-April 2016 and therefore should be assessed in the context of the 2010 NICE CHF guidelines and related 2011 CHF quality standards and the 2012 European Society of Cardiology (ESC) AHF and CHF guidance 2,3,4. The most recent European Guidelines were published in May 2016 so will not
1 Introduction
7National Heart Failure Audit April 2015-March 2016
have influenced the management during this cycle. The first NICE guidelines for AHF were published in late 2014 and the related AHF quality standards in December 2015 and arguably the improved outcomes in this audit report may reflect the new guidance1,5. These NICE guidelines are based on evidence from many randomised controlled trials that enrolled many thousands of patients and economic modelling of the cost-effectiveness of implementing the findings of these trials using data from the National HF Audit. Thus, an ideal cycle is established whereby this audit data from routine practice is used to identify real patient outcomes, which then inform emerging HF guidance. However patients will only derive benefit if the guidance is implemented as outlined below.
Considerable emphasis has been placed on the role of the HF specialist, defined in the 2010 guidance, and the multidisciplinary specialist team which they lead. The term ‘specialist’ denotes a physician with a special interest in HF (often a consultant cardiologist) who leads a specialist multidisciplinary HF team of professionals with appropriate competencies from primary and secondary care. The team will involve, where necessary, other services (such as rehabilitation, tertiary care and palliative care) in the care of individual patients. The specialist team is central to the care of patients with AHF, which for the purposes of this audit means any patient admitted to hospital because of HF.
For patients hospitalised with AHF, which will include both those with a new or pre-existing diagnosis, early and continued involvement of the specialist team is emphasised in the guidance and related quality standards. Further important themes include clinical stabilisation and pre-discharge implementation of disease modifying medicines, which are most cost effectively delivered by a specialist cardiac care or HF unit, adequate discharge planning including a specialist follow-up appointment within two weeks of leaving hospital, and rehabilitation. The key guidance applicable to the current audit and current best practice can be seen in in Table 1.
Table 1: Some of the Key Priorities for Implementation from the NICE Acute HF Guideline5 and the recently published NICE Acute HF Quality Standards1
Quality Detail
Acute HF Guideline (KPI) Organisation of care
All hospitals admitting people with suspected acute HF should provide a specialist HF team that is based on a cardiology ward and provides outreach services.
Acute HF Guideline (KPI) Organisation of care
Ensure that all people being admitted to hospital with suspected acute heart failure have early and continuing input from a dedicated specialist heart failure team.
Acute HF Guideline (KPI) Treatment After Stabilisation
In a person presenting with acute HF who is already taking beta-blockers continue the beta-blocker treatment unless they have a heart rate less than 50 beats per minute, second or third degree atrioventricular block, or shock.
Acute HF Guideline (KPI) Treatment After Stabilisation
Start or restart beta-blocker treatment during hospital admission in people with acute heart failure due to left ventricular systolic dysfunction, once their condition has been stabilised - for example when intravenous diuretics are no longer needed.
Acute HF Guideline (KPI) Treatment After Stabilisation
Ensure that the person’s condition is stable for typically 48 hours after starting or re-starting beta-blockers and before discharging from hospital.
Acute HF Guideline (KPI) Treatment After Stabilisation
Offer an angiotensin-converting enzyme inhibitor (or angiotensin receptor blocker if there are intolerable side effects) and an aldosterone antagonist during hospital admission to people with acute heart failure and reduced left ventricular ejection fraction. If the angiotensin-converting enzyme inhibitor (or angiotensin receptor blocker) is not tolerated an aldosterone antagonist should still be offered.
Acute HF Quality Standard 1
Adults presenting to hospital with new suspected acute HF have a single measurement of natriuretic peptide.
Acute HF Quality Standard 2
Adults admitted to hospital with new suspected acute HF and raised natriuretic peptide levels have a transthoracic doppler 2D echocardiogram within 48 hours of admission.
Acute HF Quality Standard 3
Adults admitted to hospital with acute HF have input within 24 hours of admission from a dedicated specialist HF team.
Acute HF Quality Standard 4
Adults with acute HF due to left ventricular systolic dysfunction are started on, or continue with, beta-blocker treatment during their hospital admission.
Acute HF Quality Standard 5
Adults admitted to hospital with acute HF andreduced left ventricular ejection fraction are offered an angiotensin- converting enzyme (ACE) inhibitor and an aldosterone antagonist.
Acute HF Quality Standard 6
Adults with acute HF have a follow- up clinical assessment by a member of the community- or hospital-based specialist HF team within 2 weeks of hospital discharge.
8 National Heart Failure Audit April 2015-March 2016

1.4 National Heart Failure Audit
1.4.1 The role of the audit
The National HF Audit was established in 2007 to understand contemporary practice with the aim of helping clinicians improve the quality of HF services and to achieve better outcomes for patients. The purpose of this audit is to drive up standards of care during the acute admission phase to achieve better patient outcomes. This can be accomplished by capturing data on clinical indicators that have a proven link to improved outcomes, encouraging the increased use of clinically recommended diagnostic tools, implementing use of disease-modifying treatments, and by robust referral pathways.
The National HF Audit aims to collect data on all hospital deaths and discharges primarily due to HF, in England and Wales. Events submitted to the audit are compared with HF episodes coded in the first diagnostic position by Hospital Episode Statistics (HES) in England or Patient Episode Database of Wales (PEDW). This report covers all records submitted to the audit where the date of discharge is between 1 April 2015 and 31 March 2016.
1.4.2 Methodology
The National HF Audit collects data on all patients with an unscheduled AHF admission to hospital in England and Wales who have a death or discharge with a coded primary diagnosis of HF. This is designated by the following ICD-10 codes:
• I11.0 Hypertensive heart disease with (congestive) heart failure
• I25.5 Ischaemic cardiomyopathy
• I42.0 Dilated cardiomyopathy
• I42.9 Cardiomyopathy, unspecified
• I50.0 Congestive heart failure
• I50.1 Left ventricular failure
• I50.9 Heart failure, unspecified
Patients admitted for elective procedures, for example elective pacemaker implantation or angiography, are not included. Patients must be over 18 years old to be eligible for inclusion in the audit.
Participation in the audit is mandated by NHS England’s NHS Standard Contracts for 2013/14 and 2014/156, and by the NHS Wales National Clinical Audit and Outcome Review Plan 2013/147. Trusts are expected to include all patients with a primary death or discharge diagnosis of HF in the audit; a target of at least 70% of all such episodes (using HES/PEDW as the denominator) is the minimum requirement. Although most patients with HF are managed mostly in the community, this audit currently only covers unscheduled AHF admissions to hospital. Extension of the audit to primary care is under consideration and a pilot project underway.
Data can be input manually or imported from locally developed systems and third party commercial databases such as TOMCAT, PATS and DATACAM. Cardiology units may enter their data into the central audit database in three ways:
• Direct data entry using the online data-entry form using the web portal.
• Direct data entry using the online data-entry form using Lotus Notes.
• Uploading of electronic data (in CSV file format) from existing local IT systems, currently via Lotus Notes only.
The role of the HF audit database users varies between hospitals but the personnel involved in collecting and inputting data tend to be HF specialist nurses, clinical audit leads and clinical effectiveness managers. The time taken to manually input the core data fields for an individual patient is upward of 20 minutes depending on the complexity of the case, the quality of the clinical notes and whether the patient is known to the HF team or not.
1.4.3 Data quality, data completeness & case ascertainment
Trusts and Health Boards are expected to include all episodes for all patients in the audit with a primary death or discharge diagnosis of HF subsequent to an unscheduled hospital admission. The minimum requirement for case ascertainment is 70% of HES/PEDW activity. In 2015/16, 205 hospitals from 137 NHS Trusts in England and six Local Health Boards in Wales reported deaths or discharges coded as HF according to HES and PEDW. In England 82% of Hospital Trusts met the above minimum participation requirement and 77% of Welsh Health Boards.
1.4.4 Data cleaning and data quality
The National Heart Failure Audit collected 66,695 records of heart failure admissions with a discharge date between 1 April 2015 and 31 March 2016.
Table 2. Number of records excluded from analysis in this report
Records excluded 2015/16 (n)
Records excluded 2006-16 (n)
Dataset Reason
11 80 Admission Missing or invalid hospital identifier
1 11 Readmission Missing or invalid hospital identifier
1337 5204 Admission/Readmission
Non-identical rows with identical NHS number and identical admission/discharge dates
3 4122 Admission/Readmission
Time to discharge <0
9National Heart Failure Audit April 2015-March 2016
10 National Heart Failure Audit April 2015-March 2016
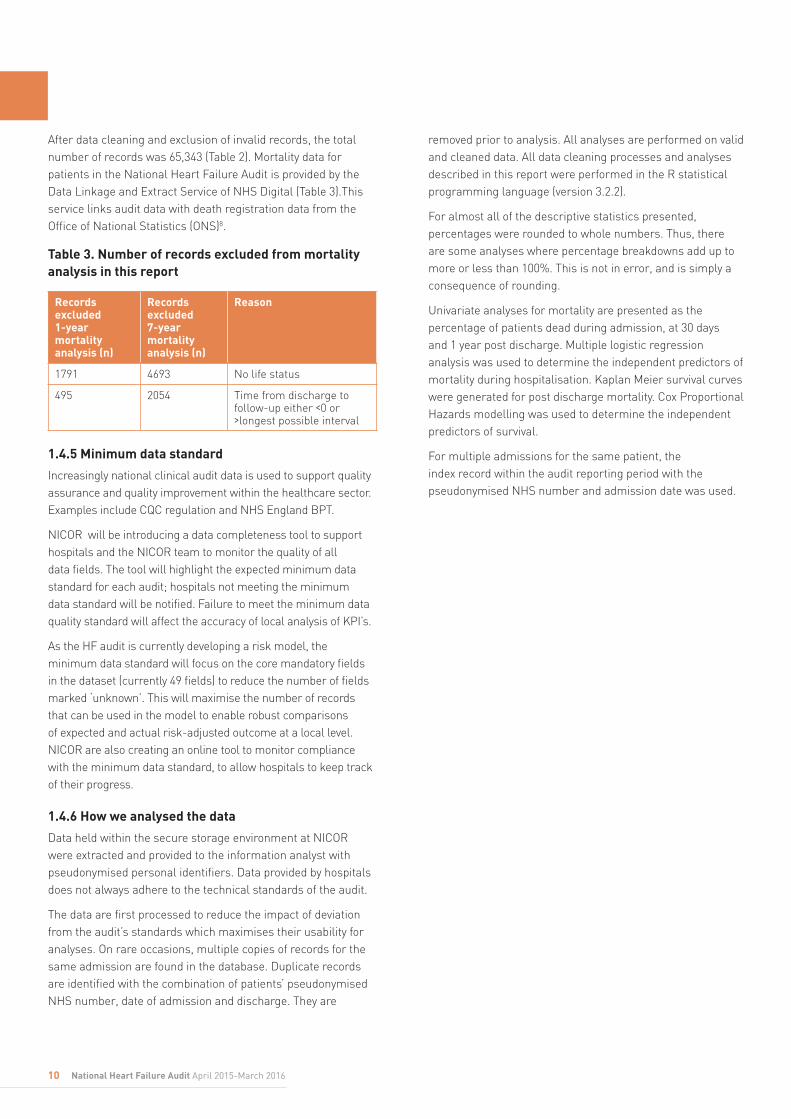
After data cleaning and exclusion of invalid records, the total number of records was 65,343 (Table 2). Mortality data for patients in the National Heart Failure Audit is provided by the Data Linkage and Extract Service of NHS Digital (Table 3).This service links audit data with death registration data from the Office of National Statistics (ONS)8.
Table 3. Number of records excluded from mortality analysis in this report
Records excluded 1-year mortality analysis (n)
Records excluded 7-year mortality analysis (n)
Reason
1791 4693 No life status
495 2054 Time from discharge to follow-up either <0 or >longest possible interval
1.4.5 Minimum data standard
Increasingly national clinical audit data is used to support quality assurance and quality improvement within the healthcare sector. Examples include CQC regulation and NHS England BPT.
NICOR will be introducing a data completeness tool to support hospitals and the NICOR team to monitor the quality of all data fields. The tool will highlight the expected minimum data standard for each audit; hospitals not meeting the minimum data standard will be notified. Failure to meet the minimum data quality standard will affect the accuracy of local analysis of KPI’s.
As the HF audit is currently developing a risk model, the minimum data standard will focus on the core mandatory fields in the dataset (currently 49 fields) to reduce the number of fields marked ‘unknown’. This will maximise the number of records that can be used in the model to enable robust comparisons of expected and actual risk-adjusted outcome at a local level. NICOR are also creating an online tool to monitor compliance with the minimum data standard, to allow hospitals to keep track of their progress.
1.4.6 How we analysed the data
Data held within the secure storage environment at NICOR were extracted and provided to the information analyst with pseudonymised personal identifiers. Data provided by hospitals does not always adhere to the technical standards of the audit.
The data are first processed to reduce the impact of deviation from the audit’s standards which maximises their usability for analyses. On rare occasions, multiple copies of records for the same admission are found in the database. Duplicate records are identified with the combination of patients’ pseudonymised NHS number, date of admission and discharge. They are
removed prior to analysis. All analyses are performed on valid and cleaned data. All data cleaning processes and analyses described in this report were performed in the R statistical programming language (version 3.2.2).
For almost all of the descriptive statistics presented, percentages were rounded to whole numbers. Thus, there are some analyses where percentage breakdowns add up to more or less than 100%. This is not in error, and is simply a consequence of rounding.
Univariate analyses for mortality are presented as the percentage of patients dead during admission, at 30 days and 1 year post discharge. Multiple logistic regression analysis was used to determine the independent predictors of mortality during hospitalisation. Kaplan Meier survival curves were generated for post discharge mortality. Cox Proportional Hazards modelling was used to determine the independent predictors of survival.
For multiple admissions for the same patient, the index record within the audit reporting period with the pseudonymised NHS number and admission date was used.
11National Heart Failure Audit April 2015-March 2016
Title
2.1 Symptomatic Patient Admission
2.1.1 Patients admitted with heart failure
Data were provided on 66,695 deaths and discharges from April 2015 to March 2016. This is a significant increase of approximately 17% when compared to 56,915 such events in the previous annual report.
Table 4: Records submitted and case ascertainment in 2015/16
Region Records submitted
HES/PEDW total HF discharges 2015-16
Case ascertainment (%)
Overall 66695 81449 82
England 63235 76936 82
Wales 3460 4513 77
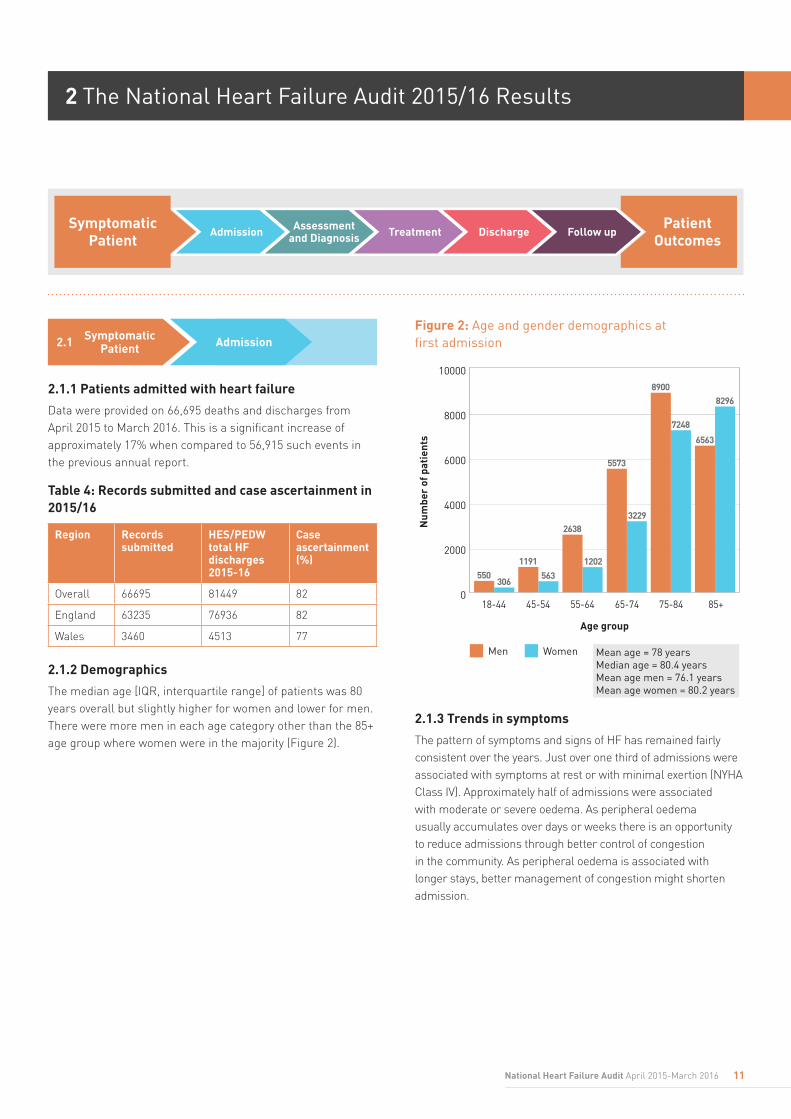
2.1.2 Demographics
The median age [IQR, interquartile range] of patients was 80 years overall but slightly higher for women and lower for men. There were more men in each age category other than the 85+ age group where women were in the majority (Figure 2).
Figure 2: Age and gender demographics at first admission
Age group
Num
ber
of p
atie
nts
10000
8000
6000
4000
2000
0 18-44 45-54 55-64 65-74 75-84 85+
Men Women Mean age = 78 yearsMedian age = 80.4 yearsMean age men = 76.1 yearsMean age women = 80.2 years
8900
7248
3229
5573
1202
2638
563
1191
306550
8296
6563
2.1.3 Trends in symptoms
The pattern of symptoms and signs of HF has remained fairly consistent over the years. Just over one third of admissions were associated with symptoms at rest or with minimal exertion (NYHA Class IV). Approximately half of admissions were associated with moderate or severe oedema. As peripheral oedema usually accumulates over days or weeks there is an opportunity to reduce admissions through better control of congestion in the community. As peripheral oedema is associated with longer stays, better management of congestion might shorten admission.
2 The National Heart Failure Audit 2015/16 Results
Admission Assessment and Diagnosis Treatment Discharge Follow up
Symptomatic Patient
Patient Outcomes
12 National Heart Failure Audit April 2015-March 2016
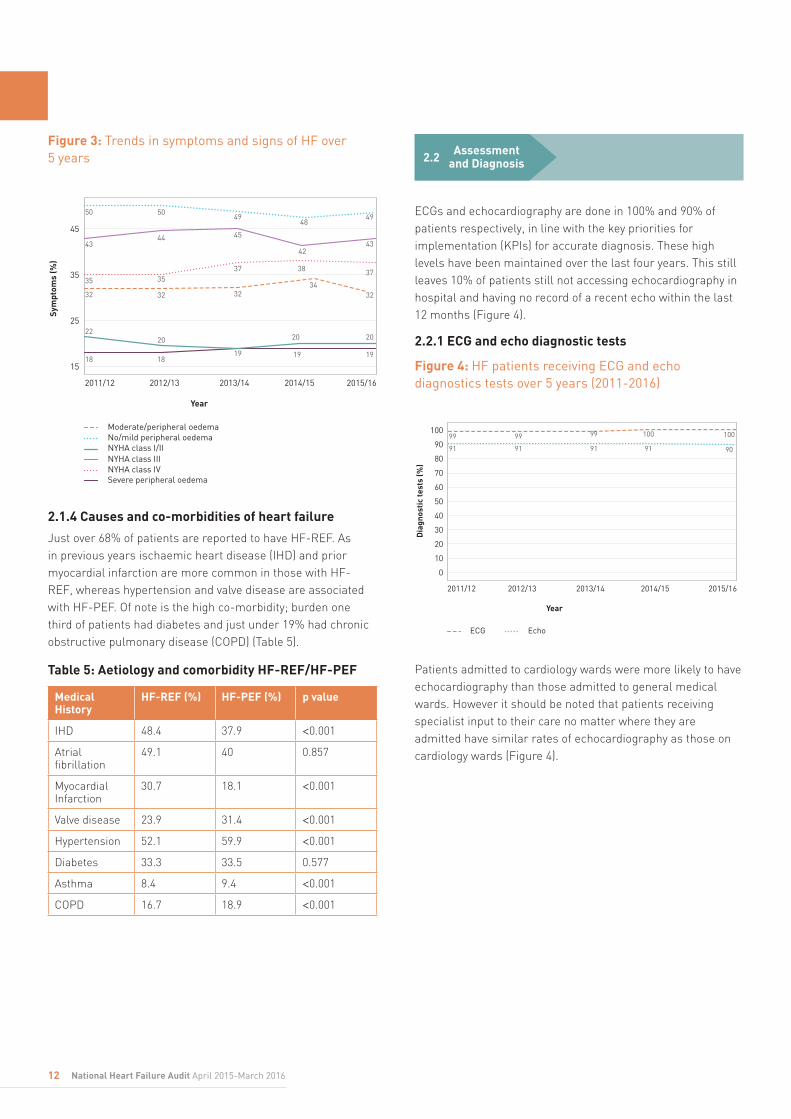
Figure 3: Trends in symptoms and signs of HF over 5 years
No/mild peripheral oedemaModerate/peripheral oedema
NYHA class I/IINYHA class IIINYHA class IVSevere peripheral oedema
Year
Sym
ptom
s (%
)
15
25
35
45
2011/12 2012/13 2013/14 2014/15 2015/16
50
43
35
32
22
18 18
50
44
35
32
20
4948
45
42
37 38
3234
2020
19
49
43
37
32
1919
2.1.4 Causes and co-morbidities of heart failure
Just over 68% of patients are reported to have HF-REF. As in previous years ischaemic heart disease (IHD) and prior myocardial infarction are more common in those with HF-REF, whereas hypertension and valve disease are associated with HF-PEF. Of note is the high co-morbidity; burden one third of patients had diabetes and just under 19% had chronic obstructive pulmonary disease (COPD) (Table 5).
Table 5: Aetiology and comorbidity HF-REF/HF-PEF
Medical History
HF-REF (%) HF-PEF (%) p value
IHD 48.4 37.9 <0.001
Atrial fibrillation
49.1 40 0.857
Myocardial Infarction
30.7 18.1 <0.001
Valve disease 23.9 31.4 <0.001
Hypertension 52.1 59.9 <0.001
Diabetes 33.3 33.5 0.577
Asthma 8.4 9.4 <0.001
COPD 16.7 18.9 <0.001
Assessment and Diagnosis2.2
ECGs and echocardiography are done in 100% and 90% of patients respectively, in line with the key priorities for implementation (KPIs) for accurate diagnosis. These high levels have been maintained over the last four years. This still leaves 10% of patients still not accessing echocardiography in hospital and having no record of a recent echo within the last 12 months (Figure 4).
2.2.1 ECG and echo diagnostic tests
Figure 4: HF patients receiving ECG and echo diagnostics tests over 5 years (2011-2016)
Dia
gnos
tic
test
s (%
)100
90
80
70
60
50
40
30
20
10
0
ECG Echo
Year
2011/12 2012/13 2013/14 2014/15 2015/16
99
91
99
91
100
91
99
91
100
90
Patients admitted to cardiology wards were more likely to have echocardiography than those admitted to general medical wards. However it should be noted that patients receiving specialist input to their care no matter where they are admitted have similar rates of echocardiography as those on cardiology wards (Figure 4).

13National Heart Failure Audit April 2015-March 2016
2.2.2 Access to diagnostic test based on place of care
Figure 5: Percentage of patients receiving echo by place of care (or with specialist input regardless of the place of care) from 2011-2016
General medicineCardiology
No specialist care
OtherSpecialist care
Rec
eive
d ec
ho (%
)
100
90
80
70
60
50
40
30
20
10
0
Year
2011/12 2012/13 2013/14 2014/15 2015/16
2.2.3 Echo diagnosis
Echocardiography provides important information on the underlying aetiology of HF. In this audit, most patients have HF-REF as in previous years. There has been an increase in reports of left ventricular hypertrophy (LVH), valve disease, diastolic dysfunction and other diagnoses. This may be an early indicator of a rise in the proportion of HF-PEF or could reflect more awareness of echo measures of diastolic dysfunction (Table 6).
Table 6: Overall echo diagnosis breakdown
Total (%)
Normal Echo 2.7
Left ventricular systolic dysfunction (LVSD) 68.3
Left ventricular hypertrophy (LVH) 7.1
Valve disease 34.8
Diastolic dysfunction 11.1
Other diagnosis 12.6
2.2.4 Trends in place of care
Place of care is a key quality metric for HF. In this audit cycle, as in the preceding three, just under half of patients were admitted to cardiology wards. An apparent fall in patients admitted to general medical wards has been observed this year which is due to the addition of an option to record admissions to Care of the Elderly wards, which applied to 9% of admissions (see Figure 6).
Figure 6: Trends in place of care over 5 years (2012-16)
General medicineOther
Cardiology
Year
Pla
ce o
f car
e (%
)
20
30
10
40
50
2011/12 2012/13 2013/14 2014/15 2014/15
4850 49
47 46
42 41 40
34 33
11 10 11 10 11
2.2.5 Trends in input by HF specialists
79% of patients are seen by a HF specialist during the admission. This can either be a consultant cardiologist, another consultant with specialist HF interest (usually a geriatrician) or a HF specialist nurse. Over a quarter of patients now see a HF specialist nurse during their admission (Figure 7).
14 National Heart Failure Audit April 2015-March 2016
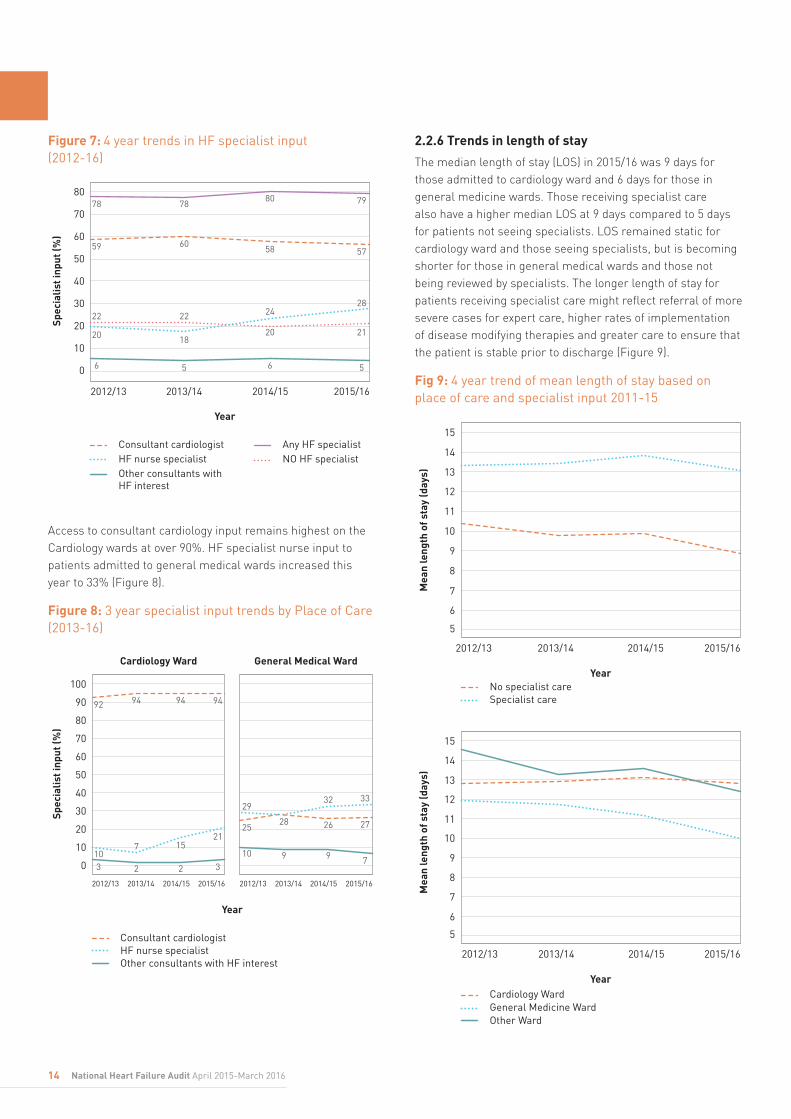
Figure 7: 4 year trends in HF specialist input (2012-16)
HF nurse specialistConsultant cardiologist
Other consultants with HF interest
Any HF specialistNO HF specialist
Spec
ialis
t inp
ut (%
)
80
70
60
50
40
30
20
10
0
Year
2012/13 2013/14 2014/15 2015/16
78 7880 79
59 6058 57
22 22 2428
20 1820 21
6 5 6 5
Access to consultant cardiology input remains highest on the Cardiology wards at over 90%. HF specialist nurse input to patients admitted to general medical wards increased this year to 33% (Figure 8).
Figure 8: 3 year specialist input trends by Place of Care (2013-16)
Spec
ialis
t inp
ut (%
)
0
10
20
30
40
50
60
70
80
90
100
Year
Cardiology Ward General Medical Ward
2012/13 2014/15 2015/162013/14
HF nurse specialistConsultant cardiologist
Other consultants with HF interest
92 94 94
7
2
94
1521
32
103
9
2825
29
10 9
26
32 33
27
7
2012/13 2014/15 2015/162013/14
2.2.6 Trends in length of stay
The median length of stay (LOS) in 2015/16 was 9 days for those admitted to cardiology ward and 6 days for those in general medicine wards. Those receiving specialist care also have a higher median LOS at 9 days compared to 5 days for patients not seeing specialists. LOS remained static for cardiology ward and those seeing specialists, but is becoming shorter for those in general medical wards and those not being reviewed by specialists. The longer length of stay for patients receiving specialist care might reflect referral of more severe cases for expert care, higher rates of implementation of disease modifying therapies and greater care to ensure that the patient is stable prior to discharge (Figure 9).
Fig 9: 4 year trend of mean length of stay based on place of care and specialist input 2011-15
Specialist careNo specialist care
Year
Mea
n le
ngth
of s
tay
(day
s)
5
6
7
8
9
10
11
12
13
14
15
2012/13 2013/14 2014/15 2015/16
General Medicine WardCardiology Ward
Year
Mea
n le
ngth
of s
tay
(day
s)
5
6
7
8
9
10
11
12
13
14
15
2012/13 2013/14 2014/15 2015/16
Other Ward

15National Heart Failure Audit April 2015-March 2016
In the past 4 years, the median length of stay also remains unchanged in cardiology ward (9 days), and general medicine ward (6 days) and amongst patients that received specialist input during admission (9 days). However, there has been a decrease in the length of stay of patients not seen by during the admission.
2.3 Treatment
Prescription of ACEI, BB and MRAs are key performance indicators for patients with HF-REF. This year high standards were again achieved with 83% being discharged on ACEI or angiotensin receptor blockers (ARBs), 87% on BB and 53% on MRA. However, arguably a more relevant and challenging target is the number discharged on all three medicines which has increased to 44% (Table 7).
2.3.1 Treatment at discharge for HF-REF
Table 7: Treatment on discharge for LVSD in 2015/16
Medication Total prescribed (%)
ACE inhibitor 72
ARB 21
ACE or ARB 83
Beta blocker 87
MRA 53
ACE and ARB 0.5
*ACEI or ARB, beta blocker and MRA 44
Loop diuretic 92
Thiazide diuretic 6
Digoxin 23
*ACEI (angiotensin converting enzyme inhibitor); ARB (angiotensin receptor blocker); MRA [mineralocorticoid (aldosterone) receptor antagonist].
2.3.2 Trends in prescribing for HF-REF
The differential prescribing of disease modifying treatment with ACE/ARB, BB and MRA with age was also seen again this year (Figure 10). The inflexion point for reduction in these drugs is in the 55-64 age group. This is an area for targeting better practice in the next few years.
The trends in prescribing of the three key medicines over the last 6 years are favourable, in particular the prescription of BB has improved markedly with 86% of patients with HF-REF now being discharged on these. MRA are now prescribed to 53% of patients but should probably be substantially greater (see Figure 11). Achieving higher prescription rates for MRA should be a goal for many Trusts.
Figure 10: Treatment on discharge for HF-REF by age in 2015/16
ACEI Beta
ACEI and/or ARB Loop
ARBMRA
Age
Pre
scri
bed
at d
isch
arge
(%)
100
90
80
70
60
50
40
30
20
10
0
18-44 45-54 55-64 65-74 75-84 85+
Figure 11: 6 year trends in prescription of disease modifying therapies for HF-REF
Year
Pre
scri
bed
at d
isch
arge
(%)
100
90
80
70
60
50
40
30
20
10
0
ACEI and/or ARB MRABeta blocker
2010/11 2011/12 2012/13 2013/14 2014/15 2015/16
16 National Heart Failure Audit April 2015-March 2016
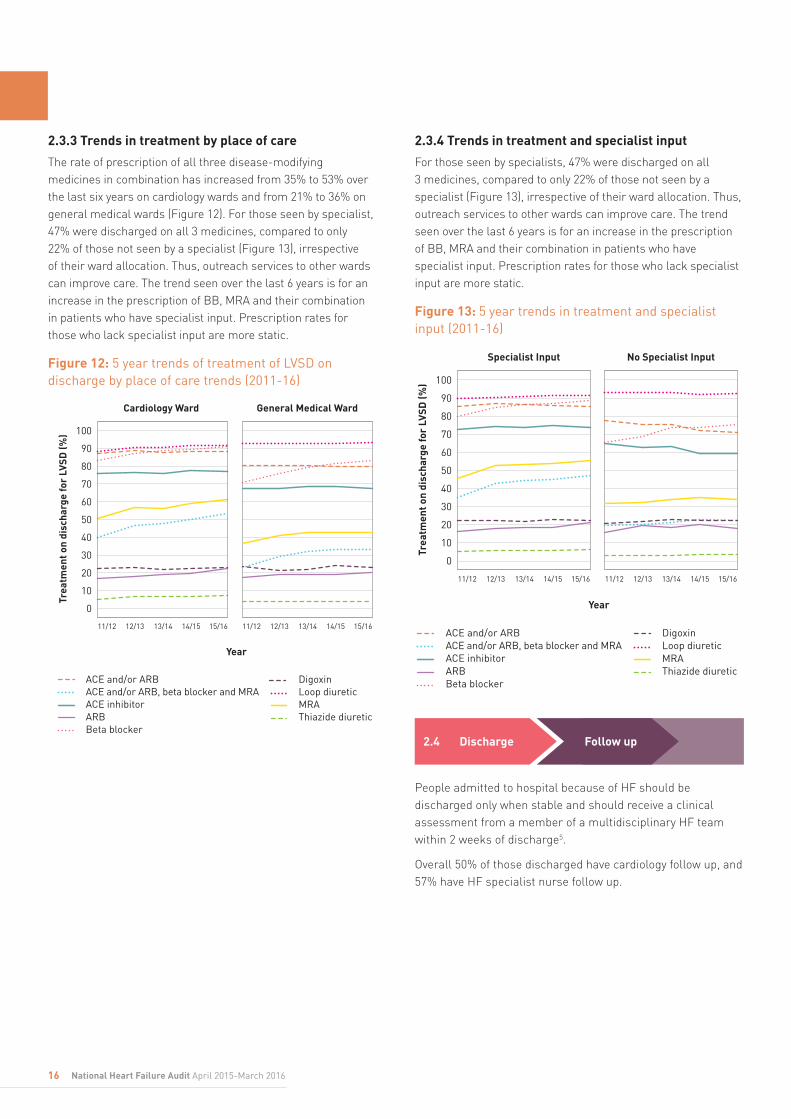
2.3.3 Trends in treatment by place of care
The rate of prescription of all three disease-modifying medicines in combination has increased from 35% to 53% over the last six years on cardiology wards and from 21% to 36% on general medical wards (Figure 12). For those seen by specialist, 47% were discharged on all 3 medicines, compared to only 22% of those not seen by a specialist (Figure 13), irrespective of their ward allocation. Thus, outreach services to other wards can improve care. The trend seen over the last 6 years is for an increase in the prescription of BB, MRA and their combination in patients who have specialist input. Prescription rates for those who lack specialist input are more static.
Figure 12: 5 year trends of treatment of LVSD on discharge by place of care trends (2011-16)
Trea
tmen
t on
disc
harg
e fo
r LV
SD (%
)
0
10
20
30
40
50
60
70
80
90
100
Year
Cardiology Ward General Medical Ward
11/12 12/13 13/14 14/15 15/16
ACE and/or ARB, beta blocker and MRAACE and/or ARB
ACE inhibitorARBBeta blocker
DigoxinLoop diureticMRAThiazide diuretic
11/12 12/13 13/14 14/15 15/16
2.3.4 Trends in treatment and specialist input
For those seen by specialists, 47% were discharged on all 3 medicines, compared to only 22% of those not seen by a specialist (Figure 13), irrespective of their ward allocation. Thus, outreach services to other wards can improve care. The trend seen over the last 6 years is for an increase in the prescription of BB, MRA and their combination in patients who have specialist input. Prescription rates for those who lack specialist input are more static.
Figure 13: 5 year trends in treatment and specialist input (2011-16)
Trea
tmen
t on
disc
harg
e fo
r LV
SD (%
)
0
10
20
30
40
50
60
70
80
90
100
Year
Specialist Input No Specialist Input
11/12 12/13 13/14 14/15 15/16
ACE and/or ARB, beta blocker and MRAACE and/or ARB
ACE inhibitorARBBeta blocker
DigoxinLoop diureticMRAThiazide diuretic
11/12 12/13 13/14 14/15 15/16
2.4 Discharge Follow up
People admitted to hospital because of HF should be discharged only when stable and should receive a clinical assessment from a member of a multidisciplinary HF team within 2 weeks of discharge5.
Overall 50% of those discharged have cardiology follow up, and 57% have HF specialist nurse follow up.
17National Heart Failure Audit April 2015-March 2016
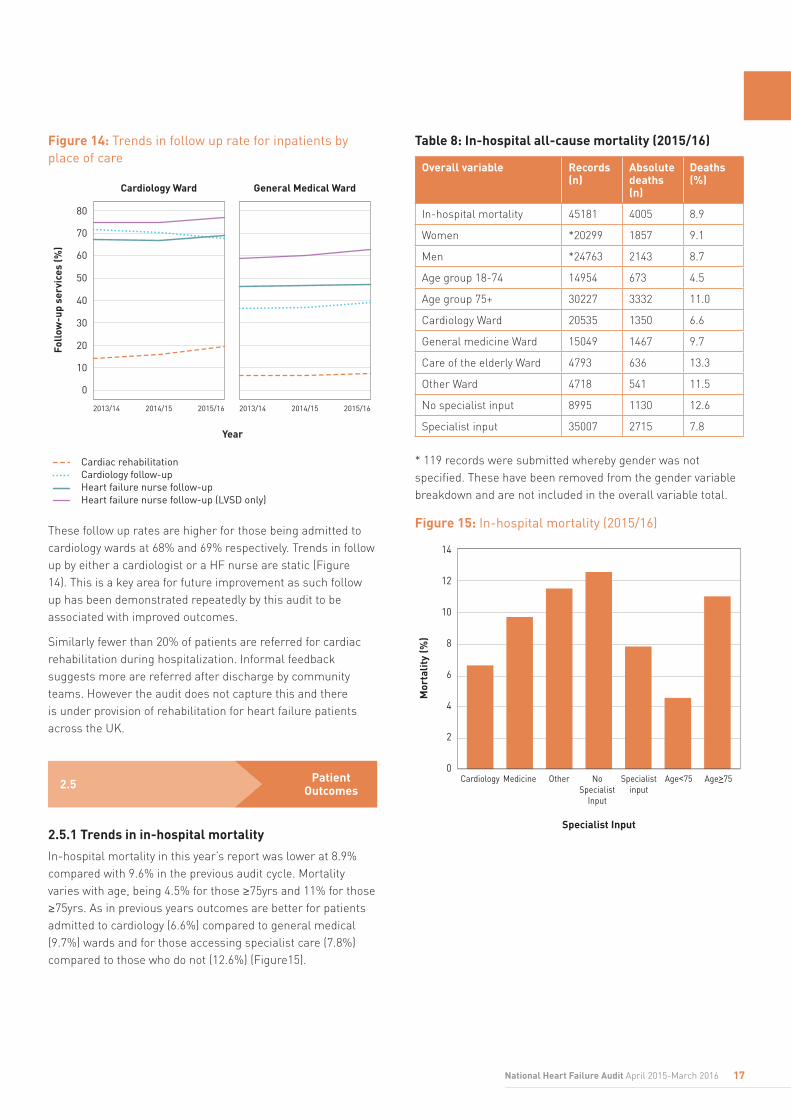
Figure 14: Trends in follow up rate for inpatients by place of care
Foll
ow-u
p se
rvic
es (%
)
0
10
20
30
40
50
60
70
80
Year
Cardiology Ward General Medical Ward
2013/14 2014/15 2015/16 2013/14 2014/15 2015/16
Cardiology follow-upCardiac rehabilitation
Heart failure nurse follow-upHeart failure nurse follow-up (LVSD only)
These follow up rates are higher for those being admitted to cardiology wards at 68% and 69% respectively. Trends in follow up by either a cardiologist or a HF nurse are static (Figure 14). This is a key area for future improvement as such follow up has been demonstrated repeatedly by this audit to be associated with improved outcomes.
Similarly fewer than 20% of patients are referred for cardiac rehabilitation during hospitalization. Informal feedback suggests more are referred after discharge by community teams. However the audit does not capture this and there is under provision of rehabilitation for heart failure patients across the UK.
Patient Outcomes2.5
2.5.1 Trends in in-hospital mortality
In-hospital mortality in this year’s report was lower at 8.9% compared with 9.6% in the previous audit cycle. Mortality varies with age, being 4.5% for those ≥75yrs and 11% for those ≥75yrs. As in previous years outcomes are better for patients admitted to cardiology (6.6%) compared to general medical (9.7%) wards and for those accessing specialist care (7.8%) compared to those who do not (12.6%) (Figure15).
Table 8: In-hospital all-cause mortality (2015/16)
Overall variable Records (n)
Absolute deaths (n)
Deaths (%)
In-hospital mortality 45181 4005 8.9
Women *20299 1857 9.1
Men *24763 2143 8.7
Age group 18-74 14954 673 4.5
Age group 75+ 30227 3332 11.0
Cardiology Ward 20535 1350 6.6
General medicine Ward 15049 1467 9.7
Care of the elderly Ward 4793 636 13.3
Other Ward 4718 541 11.5
No specialist input 8995 1130 12.6
Specialist input 35007 2715 7.8
* 119 records were submitted whereby gender was not specified. These have been removed from the gender variable breakdown and are not included in the overall variable total.
Figure 15: In-hospital mortality (2015/16)
Specialist Input
Mor
talit
y (%
)
14
12
10
8
6
4
2
0Cardiology Medicine Other No
Specialist Input
Specialistinput
Age<75 Age>75
18 National Heart Failure Audit April 2015-March 2016
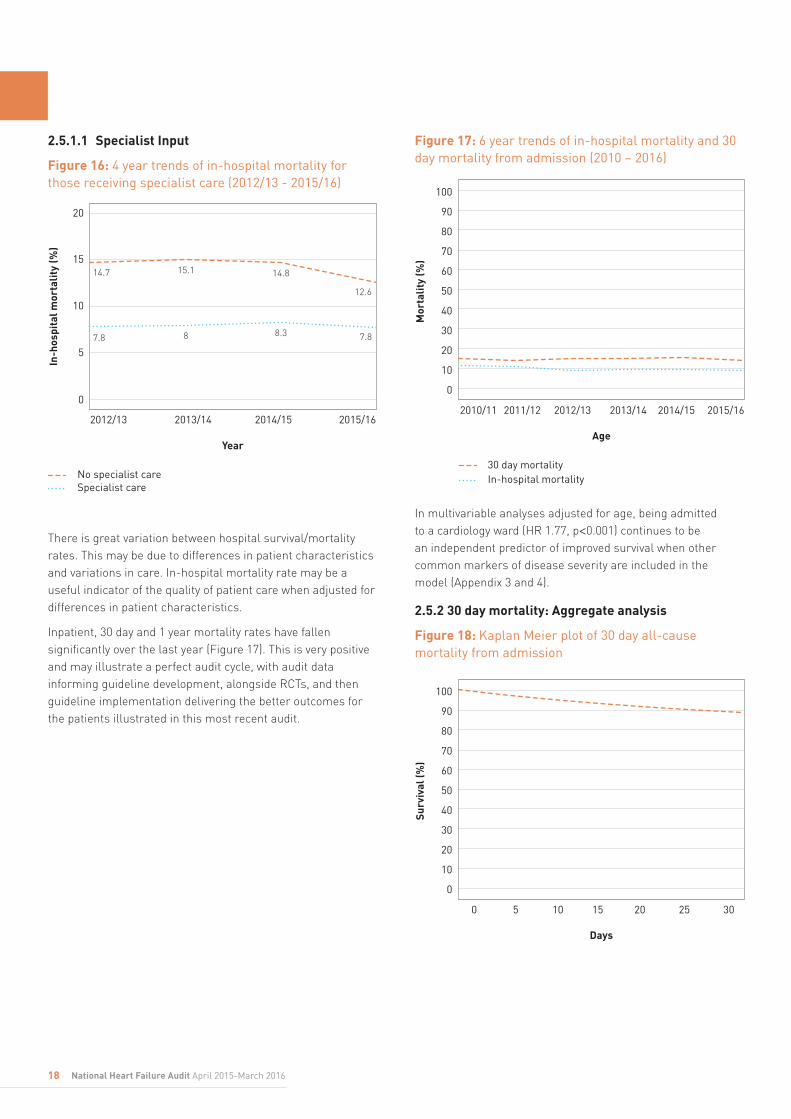
2.5.1.1 Specialist Input
Figure 16: 4 year trends of in-hospital mortality for those receiving specialist care (2012/13 - 2015/16)
In-h
ospi
tal m
orta
lity
(%)
0
5
10
15
20
Year
2012/13 2013/14 2014/15 2015/16
Specialist careNo specialist care
14.814.7
8.37.8
15.1
8 7.8
12.6
There is great variation between hospital survival/mortality rates. This may be due to differences in patient characteristics and variations in care. In-hospital mortality rate may be a useful indicator of the quality of patient care when adjusted for differences in patient characteristics.
Inpatient, 30 day and 1 year mortality rates have fallen significantly over the last year (Figure 17). This is very positive and may illustrate a perfect audit cycle, with audit data informing guideline development, alongside RCTs, and then guideline implementation delivering the better outcomes for the patients illustrated in this most recent audit.
Figure 17: 6 year trends of in-hospital mortality and 30 day mortality from admission (2010 – 2016)
30 day mortalityIn-hospital mortality
Age
Mor
talit
y (%
)
100
90
80
70
60
50
40
30
20
10
0
2010/11 2011/12 2012/13 2013/14 2014/15 2015/16
In multivariable analyses adjusted for age, being admitted to a cardiology ward (HR 1.77, p<0.001) continues to be an independent predictor of improved survival when other common markers of disease severity are included in the model (Appendix 3 and 4).
2.5.2 30 day mortality: Aggregate analysis
Figure 18: Kaplan Meier plot of 30 day all-cause mortality from admission
Days
Surv
ival
(%)
100
90
80
70
60
50
40
30
20
10
0
0 5 10 15 20 25 30
19National Heart Failure Audit April 2015-March 2016
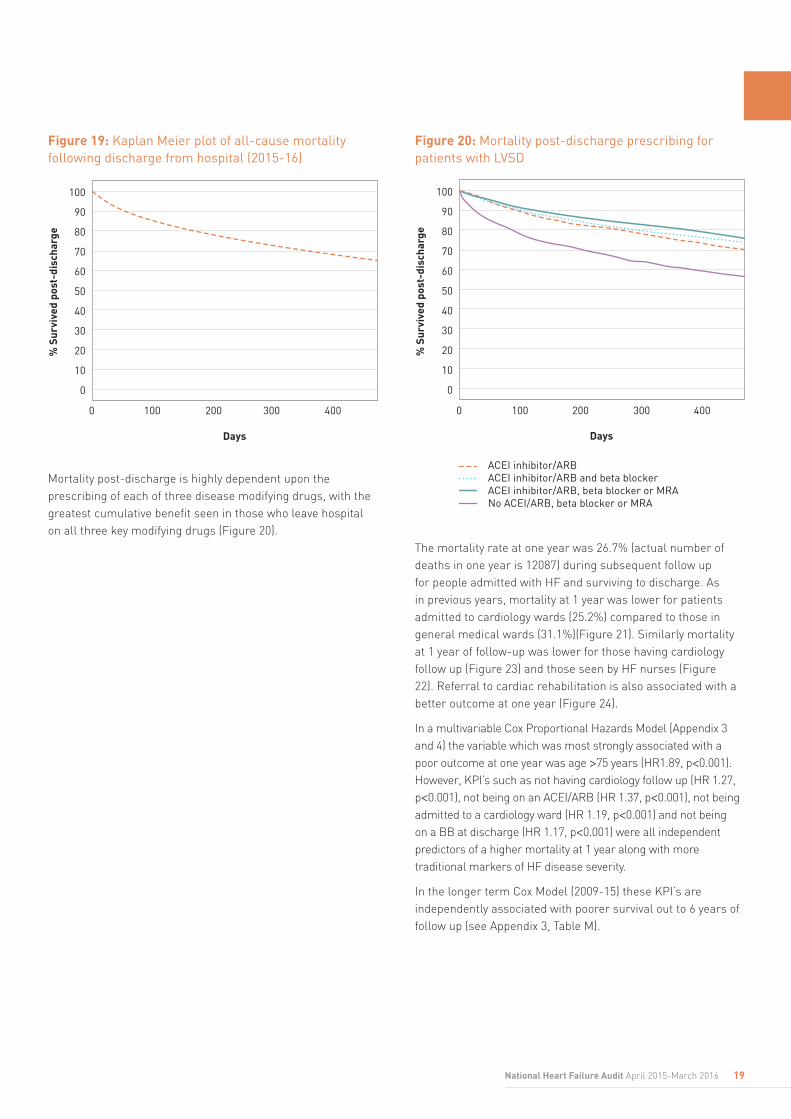
Figure 19: Kaplan Meier plot of all-cause mortality following discharge from hospital (2015-16)
Days
% S
urvi
ved
post
-dis
char
ge
100
90
80
70
60
50
40
30
20
10
0
0 100 200 300 400
Mortality post-discharge is highly dependent upon the prescribing of each of three disease modifying drugs, with the greatest cumulative benefit seen in those who leave hospital on all three key modifying drugs (Figure 20).
Figure 20: Mortality post-discharge prescribing for patients with LVSD
Days
% S
urvi
ved
post
-dis
char
ge
100
90
80
70
60
50
40
30
20
10
0
0 100 200 300 400
ACEI inhibitor/ARBACEI inhibitor/ARB and beta blockerACEI inhibitor/ARB, beta blocker or MRANo ACEI/ARB, beta blocker or MRA
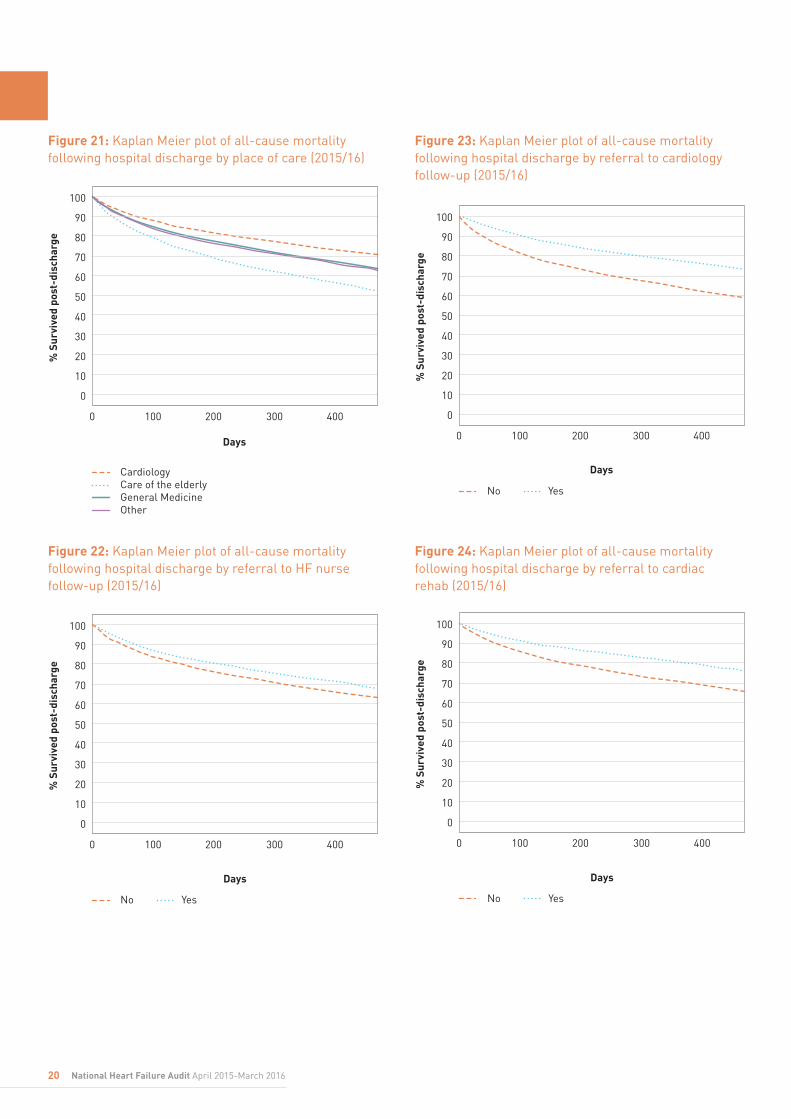
The mortality rate at one year was 26.7% (actual number of deaths in one year is 12087) during subsequent follow up for people admitted with HF and surviving to discharge. As in previous years, mortality at 1 year was lower for patients admitted to cardiology wards (25.2%) compared to those in general medical wards (31.1%)(Figure 21). Similarly mortality at 1 year of follow-up was lower for those having cardiology follow up (Figure 23) and those seen by HF nurses (Figure 22). Referral to cardiac rehabilitation is also associated with a better outcome at one year (Figure 24).
In a multivariable Cox Proportional Hazards Model (Appendix 3 and 4) the variable which was most strongly associated with a poor outcome at one year was age >75 years (HR1.89, p<0.001). However, KPI’s such as not having cardiology follow up (HR 1.27, p<0.001), not being on an ACEI/ARB (HR 1.37, p<0.001), not being admitted to a cardiology ward (HR 1.19, p<0.001) and not being on a BB at discharge (HR 1.17, p<0.001) were all independent predictors of a higher mortality at 1 year along with more traditional markers of HF disease severity.
In the longer term Cox Model (2009-15) these KPI’s are independently associated with poorer survival out to 6 years of follow up (see Appendix 3, Table M).
20 National Heart Failure Audit April 2015-March 2016
Figure 21: Kaplan Meier plot of all-cause mortality following hospital discharge by place of care (2015/16)
CardiologyCare of the elderlyGeneral MedicineOther
Days
% S
urvi
ved
post
-dis
char
ge
100
90
80
70
60
50
40
30
20
10
0
0 100 200 300 400
Figure 22: Kaplan Meier plot of all-cause mortality following hospital discharge by referral to HF nurse follow-up (2015/16)
% S
urvi
ved
post
-dis
char
ge
100
90
80
70
60
50
40
30
20
10
0
0 100 200 300 400
No Yes
Days
Figure 23: Kaplan Meier plot of all-cause mortality following hospital discharge by referral to cardiology follow-up (2015/16)
% S
urvi
ved
post
-dis
char
ge
100
90
80
70
60
50
40
30
20
10
0
0 100 200 300 400
No Yes
Days
Figure 24: Kaplan Meier plot of all-cause mortality following hospital discharge by referral to cardiac rehab (2015/16)
% S
urvi
ved
post
-dis
char
ge
100
90
80
70
60
50
40
30
20
10
0
0 100 200 300 400
No Yes
Days
21National Heart Failure Audit April 2015-March 2016
2.6 Audit achievements – driving patient outcomes
The NICE guidance for AHF was published in late 2014 and the related NICE Quality Standards for AHF in 2015. Audit data from earlier cycles informed the guideline development. This audit cycle is the first which might reflect their implementation showing a reduction in all cause inpatient mortality for patients admitted for heart failure, and a lower mortality at both 30 days and one year, than in previous audit cycles.
Mortality is lowest when the care advocated in the guidance is followed. The audit can continue to be used to drive further improvements anticipated as a result of the Guidance and Quality Standards (Table 1). The emphasis is on earlier diagnosis, earlier and more comprehensive specialist input, prescription of disease modifying medicines and early follow up by the specialist team following discharge from hospital. These priorities have translated into the improved outcomes in the recent audit cycle, and contributed to the reported reduction in mortality.
The NICE health economic modelling5 highlighted that most cost-effective method of care was provided by wards offering specialist care; either a cardiology ward or dedicated HF units. Although the medical needs of some patients may mean that care is best offered by another specialty ward but with outreach services provided by the heart failure team, there are many patients who would be optimally cared for within the cardiology ward or HF unit who do not receive this care.
Although the percentage of patients being looked after on the cardiology wards is static at 50%, given the absolute rise in HF admissions over the duration of the audit, this does
represent a modest increase in numbers receiving such care. But it remains an inadequate response to a life threatening condition. Those leading HF services should explore how to extend specialist care to more patients.
2.6.1 Key Performance Indicators (KPIs)
In summary regarding the KPIs in this audit cycle:
• Mortality rates have fallen significantly.
• Application of diagnostic tests remains high.
• Prescribing rates of key disease modifying medicines for those with HF-REF have increased.
• The proportion of patients admitted to cardiology wards is static at <50% but the proportion of patients who have input from a HF specialist has increased to >80% and more patients have HF specialist nurse input.
22 National Heart Failure Audit April 2015-March 2016
3 Use of Audit Data
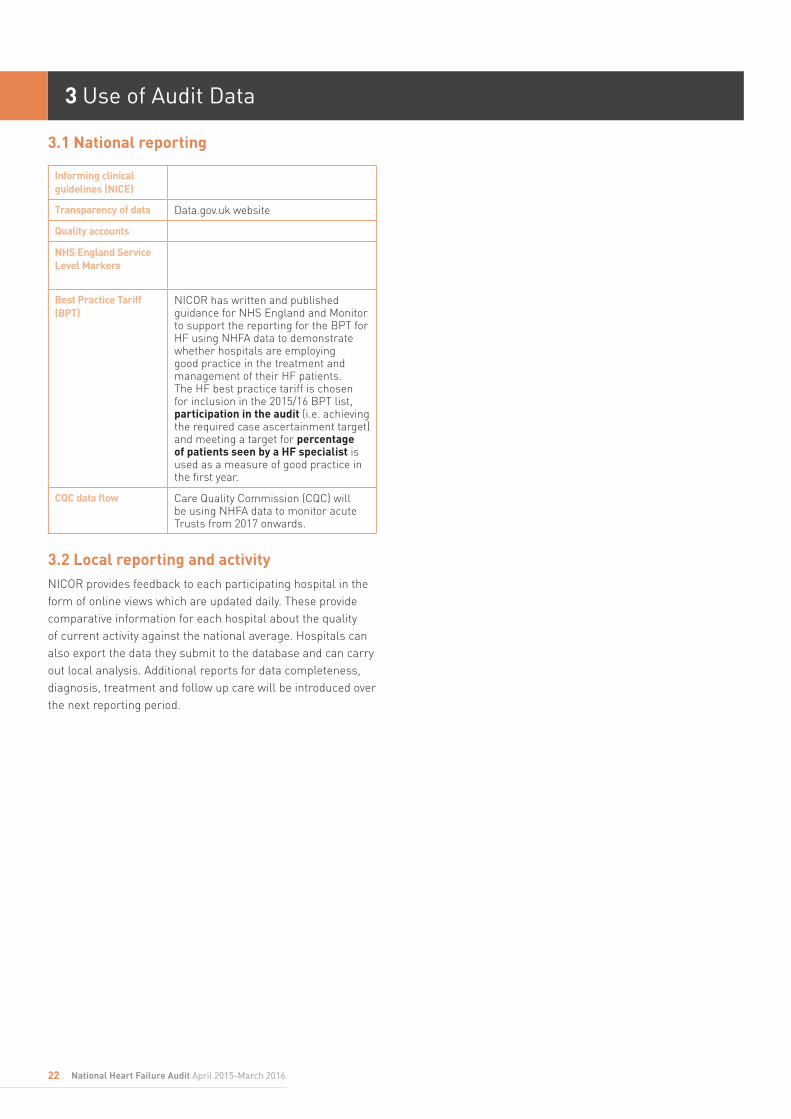
3.1 National reporting
Informing clinical guidelines (NICE)
Transparency of data Data.gov.uk website
Quality accounts
NHS England Service Level Markers
Best Practice Tariff (BPT)
NICOR has written and published guidance for NHS England and Monitor to support the reporting for the BPT for HF using NHFA data to demonstrate whether hospitals are employing good practice in the treatment and management of their HF patients. The HF best practice tariff is chosen for inclusion in the 2015/16 BPT list, participation in the audit (i.e. achieving the required case ascertainment target) and meeting a target for percentage of patients seen by a HF specialist is used as a measure of good practice in the first year.
CQC data flow Care Quality Commission (CQC) will be using NHFA data to monitor acute Trusts from 2017 onwards.
3.2 Local reporting and activityNICOR provides feedback to each participating hospital in the form of online views which are updated daily. These provide comparative information for each hospital about the quality of current activity against the national average. Hospitals can also export the data they submit to the database and can carry out local analysis. Additional reports for data completeness, diagnosis, treatment and follow up care will be introduced over the next reporting period.
Title
23National Heart Failure Audit April 2015-March 2016
4 HF Audit for the Future
The consistent message that arises from the 9th National Heart Failure Audit Report is that outcomes for those admitted to hospital are better for those with access to Specialist Heart Failure Care. We need to continue our efforts to treat more of these patients on Cardiology Wards, make sure that those admitted to General Medical Wards are seen by Heart Failure Specialists (both nurses and doctors) during the admission, so that they have optimum access to appropriate diagnostic tests, receive the correct disease modifying treatments during the admission and have robust specialist follow up in place at discharge.
The audit data fields are being modified to ensure they reflect the additional data-capture needed to monitor the latest guidance and related standards. This will ensure the audit remains fit for purpose and can continue to drive up the of quality care of all patients with heart failure, and in doing so prevent deaths and improve the quality of life for this vulnerable group.

Title
24 National Heart Failure Audit April 2015-March 2016
Change to a new web based
data entry form with an updated data set
Improve data quality by encouraging the use of
consistent definitions and support hospitals’ internal audits to assess
accuracy. This data cannot be validated by NICOR but NICOR can
support the process
Continue to encourage compliance with the minimum
data standard set out by NICOR in collaboration with BSH. More detail on the data standard can be found on the NICOR
website: http://www.ucl.ac.uk/nicor
Focus on which key quality indicators track best with risk adjusted mortality and provide
feedback to sites to concentrate their efforts on the most important
process indicators.
Validate the risk adjustment model for
mortality. This will then enable hospitals to benchmark their risk
adjusted mortality and compare it to other hospitals to further
improve best practice
Make available an import function to allow participating hospitals to import their data
via a web portal
In 2016/17 the plan is to:
Trus
t nam
eN
HS
Trus
t co
deTr
ust
reco
rds
subm
itted
HES
pr
imar
y H
F di
scha
rges
% H
ES
subm
itted
Pa
rtic
ipat
ion
stat
usN
ICO
R
hosp
ital
code
Hos
pita
l nam
eH
ospi
tal
reco
rds
subm
itted
Engl
and
and
Wal
es66
695
8144
982
%
Engl
and
6316
076
936
82%
Ain
tree
Uni
vers
ity H
ospi
tal N
HS
Foun
datio
n Tr
ust
REM
647
568
114%
Yes
FAZ
Uni
vers
ity H
ospi
tal A
intr
ee64
7
Air
edal
e N
HS
Foun
datio
n Tr
ust
RC
F31
439
579
%Ye
sA
IRA
ired
ale
Gen
eral
Hos
pita
l31
4
Ash
ford
and
St P
eter
's H
ospi
tals
NH
S Tr
ust
RTK
545
454
120%
Yes
SPH
St P
eter
's H
ospi
tal
545
Bar
king
, Hav
erin
g an
d R
edbr
idge
Uni
vers
ity H
ospi
tals
N
HS
Trus
tR
F463
291
369
%N
oK
GG
Kin
g G
eorg
e H
ospi
tal
173
OLD
Que
en's
Hos
pita
l Rom
ford
459
Bar
nsle
y H
ospi
tal N
HS
Foun
datio
n Tr
ust
RFF
234
445
53%
No
BA
RB
arns
ley
Hos
pita
l NH
S Fo
unda
tion
Trus
t23
4
Bar
ts H
ealt
h N
HS
Trus
tR
1H11
6943
227
1%Ye
s
NW
GN
ewha
m U
nive
rsity
Hos
pita
l40
6
SBH
St B
arth
olom
ews
Hos
pita
l12
0
LCH
The
Lond
on C
hest
Hos
pita
l20
LON
The
Roy
al H
ospi
tal L
ondo
n25
1
WH
CW
hipp
s C
ross
Uni
vers
ity H
ospi
tal
372
Bas
ildon
and
Thu
rroc
k U
nive
rsity
Hos
pita
ls N
HS
Foun
datio
n Tr
ust
RD
D54
755
599
%Ye
sB
AS
Bas
ildon
Uni
vers
ity H
ospi
tal
547
Bed
ford
Hos
pita
l NH
S Tr
ust
RC
124
739
762
%N
oB
EDB
edfo
rd H
ospi
tal
247
Bla
ckpo
ol T
each
ing
Hos
pita
ls N
HS
Foun
datio
n Tr
ust
RXL
132
631
21%
No
VIC
Bla
ckpo
ol V
icto
ria
Hos
pita
l13
2
Bol
ton
NH
S Fo
unda
tion
Trus
tR
MC
185
473
39%
No
BO
LR
oyal
Bol
ton
Hos
pita
l18
5
Bra
dfor
d Te
achi
ng H
ospi
tals
NH
S Fo
unda
tion
Trus
tR
AE
306
557
55%
No
BR
DB
radf
ord
Roy
al In
firm
ary
306
5 A
ppen
dice
s
App
endi
x 1:
Hos
pita
l lev
el a
naly
sis
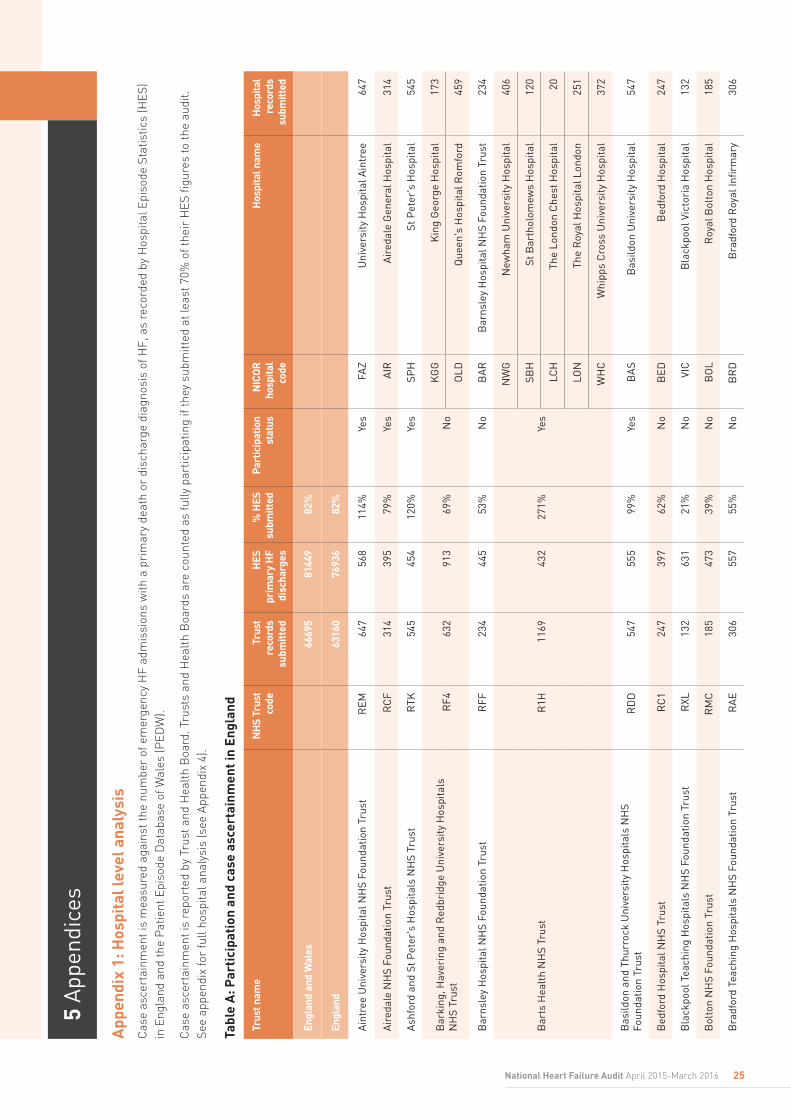
Cas
e as
cert
ainm
ent i
s m
easu
red
agai
nst t
he n
umbe
r of
em
erge
ncy
HF
adm
issi
ons
with
a p
rim
ary
deat
h or
dis
char
ge d
iagn
osis
of H
F, a
s re
cord
ed b
y H
ospi
tal E
piso
de S
tatis
tics
(HES
) in
Eng
land
and
the
Pat
ient
Epi
sode
Dat
abas
e of
Wal
es (P
EDW
).
Cas
e as
cert
ainm
ent i
s re
port
ed b
y Tr
ust a
nd H
ealt
h B
oard
. Tru
sts
and
Hea
lth
Boa
rds
are
coun
ted
as fu
lly p
artic
ipat
ing
if th
ey s
ubm
itted
at l
east
70%
of t
heir
HES
figu
res
to th
e au
dit.
See
appe
ndix
for
full
hosp
ital a
naly
sis
(see
App
endi
x 4)
.
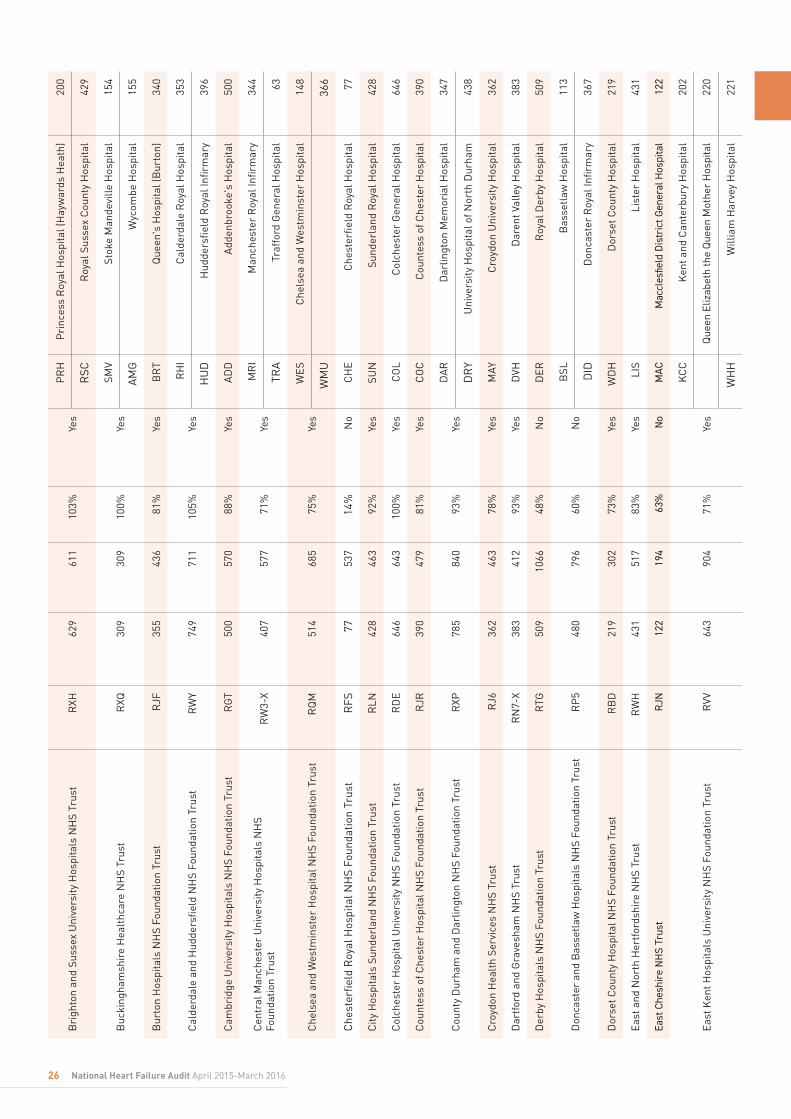
Tabl
e A
: Par
tici
pati
on a
nd c
ase
asce
rtai
nmen
t in
Engl
and
25National Heart Failure Audit April 2015-March 2016
Bri
ghto
n an
d Su
ssex
Uni
vers
ity H
ospi
tals
NH
S Tr
ust
RXH
629
611
103%
Yes
PR
HP
rinc
ess
Roy
al H
ospi
tal (
Hay
war
ds H
eath
)20
0
RSC
Roy
al S
usse
x C
ount
y H
ospi
tal
429
Buc
king
ham
shir
e H
ealt
hcar
e N
HS
Trus
tR
XQ30
930
910
0%Ye
sSM
VSt
oke
Man
devi
lle H
ospi
tal
154
AM
GW
ycom
be H
ospi
tal
155
Bur
ton
Hos
pita
ls N
HS
Foun
datio
n Tr
ust
RJF
355
436
81%
Yes
BR
TQ
ueen
's H
ospi
tal (
Bur
ton)
340
Cal
derd
ale
and
Hud
ders
field
NH
S Fo
unda
tion
Trus
tR
WY
749
711
105%
Yes
RH
IC
alde
rdal
e R
oyal
Hos
pita
l35
3
HU
DH
udde
rsfie
ld R
oyal
Infir
mar
y39
6
Cam
brid
ge U
nive
rsity
Hos
pita
ls N
HS
Foun
datio
n Tr
ust
RG
T50
057
088
%Ye
sA
DD
Add
enbr
ooke
's H
ospi
tal
500
Cen
tral
Man
ches
ter
Uni
vers
ity H
ospi
tals
NH
S
Foun
datio
n Tr
ust
RW
3-X
407
577
71%
Yes
MR
IM
anch
este
r R
oyal
Infir
mar
y34
4
TRA
Traf
ford
Gen
eral
Hos
pita
l63
Che
lsea
and
Wes
tmin
ster
Hos
pita
l NH
S Fo
unda
tion
Trus
tR
QM
514
685
75%
Yes
WES
Che
lsea
and
Wes
tmin
ster
Hos
pita
l14
8
WM
U36
6
Che
ster
field
Roy
al H
ospi
tal N
HS
Foun
datio
n Tr
ust
RFS
7753
714
%N
oC
HE
Che
ster
field
Roy
al H
ospi
tal
77
City
Hos
pita
ls S
unde
rlan
d N
HS
Foun
datio
n Tr
ust
RLN
428
463
92%
Yes
SUN
Sund
erla
nd R
oyal
Hos
pita
l42
8
Col
ches
ter
Hos
pita
l Uni
vers
ity N
HS
Foun
datio
n Tr
ust
RD
E64
664
310
0%Ye
sC
OL
Col
ches
ter
Gen
eral
Hos
pita
l64
6
Cou
ntes
s of
Che
ster
Hos
pita
l NH
S Fo
unda
tion
Trus
tR
JR39
047
981
%Ye
sC
OC
Cou
ntes
s of
Che
ster
Hos
pita
l39
0
Cou
nty
Dur
ham
and
Dar
lingt
on N
HS
Foun
datio
n Tr
ust
RXP
785
840
93%
Yes
DA
RD
arlin
gton
Mem
oria
l Hos
pita
l34
7
DR
YU
nive
rsity
Hos
pita
l of N
orth
Dur
ham
438
Cro
ydon
Hea
lth
Serv
ices
NH
S Tr
ust
RJ6
362
463
78%
Yes
MAY
Cro
ydon
Uni
vers
ity H
ospi
tal
362
Dar
tfor
d an
d G
rave
sham
NH
S Tr
ust
RN
7-X
383
412
93%
Yes
DVH
Dar
ent V
alle
y H
ospi
tal
383
Der
by H
ospi
tals
NH
S Fo
unda
tion
Trus
tR
TG50
910
6648
%N
oD
ERR
oyal
Der
by H
ospi
tal
509
Don
cast
er a
nd B
asse
tlaw
Hos
pita
ls N
HS
Foun
datio
n Tr
ust
RP
548
079
660
%N
oB
SLB
asse
tlaw
Hos
pita
l11
3
DID
Don
cast
er R
oyal
Infir
mar
y36
7
Dor
set C
ount
y H
ospi
tal N
HS
Foun
datio
n Tr
ust
RB
D21
930
273
%Ye
sW
DH
Dor
set C
ount
y H
ospi
tal
219
East
and
Nor
th H
ertf
ords
hire
NH
S Tr
ust
RW
H43
151
783
%Ye
sLI
SLi
ster
Hos
pita
l43
1
East
Che
shir
e N
HS
Trus
tRJ
N12
219
463
%N
oM
ACM
accl
esfie
ld D
istr
ict G
ener
al H
ospi
tal
122
East
Ken
t Hos
pita
ls U
nive
rsity
NH
S Fo
unda
tion
Trus
tR
VV64
390
471
%Ye
s
KC
CK
ent a
nd C
ante
rbur
y H
ospi
tal
202
Que
en E
lizab
eth
the
Que
en M
othe
r H
ospi
tal
220
WH
HW
illia
m H
arve
y H
ospi
tal
221
26 National Heart Failure Audit April 2015-March 2016

East
Lan
cash
ire
Hos
pita
ls N
HS
Trus
tR
XR40
052
277
%Ye
sB
LAR
oyal
Bla
ckbu
rn H
ospi
tal
400
East
Sus
sex
Hea
lthc
are
NH
S Tr
ust
RXC
520
720
72%
Yes
CG
HC
onqu
est H
ospi
tal
266
DG
EEa
stbo
urne
Dis
tric
t Gen
eral
Hos
pita
l25
4
Epso
m a
nd S
t Hel
ier
Uni
vers
ity H
ospi
tals
NH
S Tr
ust
RVR
-X30
147
164
%N
oEP
SEp
som
Hos
pita
l13
8
SHC
St H
elie
r H
ospi
tal
163
Frim
ley
Par
k H
ospi
tal N
HS
Foun
datio
n Tr
ust
RD
U11
4313
0987
%Ye
sFR
MFr
imle
y P
ark
Hos
pita
l54
0
WEX
Wex
ham
Par
k H
ospi
tal
603
Gat
eshe
ad H
ealt
h N
HS
Foun
datio
n Tr
ust
RR
7-X
281
342
82%
Yes
QEG
Que
en E
lizab
eth
Hos
pita
l (G
ates
head
)28
1
Geo
rge
Elio
t Hos
pita
l NH
S Tr
ust
RLT
112
299
37%
No
NU
NG
eorg
e El
iot H
ospi
tal
112
Glo
uces
ters
hire
Hos
pita
ls N
HS
Foun
datio
n Tr
ust
RTE
393
755
52%
No
CH
GC
helt
enha
m G
ener
al H
ospi
tal
142
GLO
Glo
uces
ters
hire
Roy
al H
ospi
tal
251
Gre
at W
este
rn H
ospi
tals
NH
S Fo
unda
tion
Trus
tR
N3
455
569
80%
Yes
PM
SG
reat
Wes
tern
Hos
pita
l45
5
Guy
's a
nd S
t Tho
mas
' NH
S Fo
unda
tion
Trus
tR
J1-X
504
395
128%
Yes
STH
St T
hom
as' H
ospi
tal
504
Ham
pshi
re H
ospi
tals
NH
S Fo
unda
tion
Trus
tR
N5-
X35
844
081
%Ye
sN
HH
Bas
ings
toke
and
Nor
th H
amps
hire
Hos
pita
l18
9
RH
CR
oyal
Ham
pshi
re C
ount
y H
ospi
tal
169
Har
roga
te a
nd D
istr
ict N
HS
Foun
datio
n Tr
ust
RC
D25
927
395
%Ye
sH
AR
Har
roga
te D
istr
ict H
ospi
tal
259
Hea
rt o
f Eng
land
NH
S Fo
unda
tion
Trus
tR
R1-
X62
234
518
0%Ye
s
EBH
Bir
min
gham
Hea
rtla
nds
Hos
pita
l32
9
SOL
Solih
ull H
ospi
tal
217
GH
SG
ood
Hop
e H
ospi
tal
76
Hin
chin
gbro
oke
Hea
lth
Car
e N
HS
Trus
tR
-X83
242
34%
No
HIN
Hin
chin
gbro
oke
Hos
pita
l83
Hom
erto
n U
nive
rsity
Hos
pita
l NH
S Fo
unda
tion
Trus
tR
QX
310
361
86%
Yes
HO
MH
omer
ton
Uni
vers
ity H
ospi
tal
310
Hul
l and
Eas
t Yor
kshi
re H
ospi
tals
NH
S Tr
ust
RW
A66
877
986
%Ye
sC
HH
Cas
tle H
ill H
ospi
tal
368
HR
IH
ull R
oyal
Infir
mar
y30
0
Trus
t nam
eN
HS
Trus
t co
deTr
ust
reco
rds
subm
itted
HES
pr
imar
y H
F di
scha
rges
% H
ES
subm
itted
Part
icip
atio
n st
atus
NIC
OR
ho
spita
l co
de
Hos
pita
l nam
eH
ospi
tal
reco
rds
subm
itted
Engl
and
and
Wal
es66
695
8144
982
%
Engl
and
6316
076
936
82%
27National Heart Failure Audit April 2015-March 2016
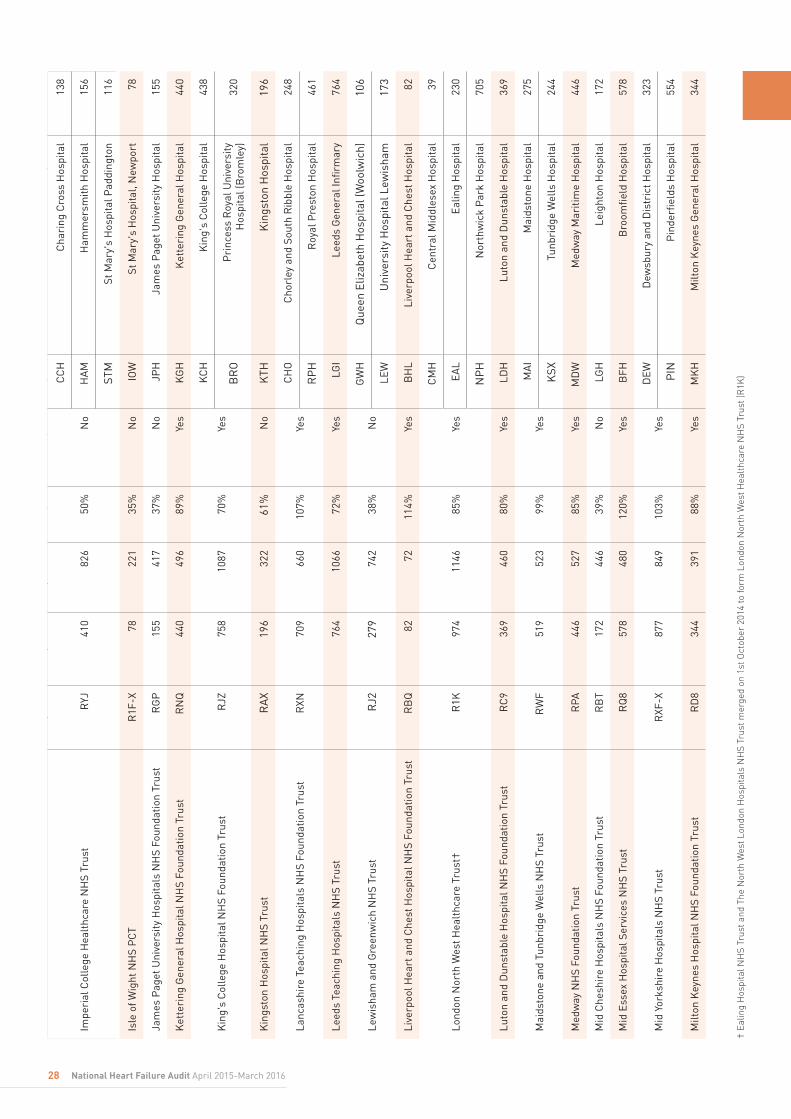
Trus
t nam
eTr
ust
reco
rds
subm
itte
d
% H
ES
subm
itte
dPa
rtic
ipat
ion
stat
usP
rim
ary
HES
hea
rt
failu
re
disc
harg
es
NIC
OR
ho
spit
al
code
Hos
pita
l nam
eH
ospi
tal r
ecor
ds
subm
itte
dIm
peri
al C
olle
ge H
ealt
hcar
e N
HS
Trus
tR
YJ41
082
650
%N
o
CC
HC
hari
ng C
ross
Hos
pita
l13
8
HA
MH
amm
ersm
ith H
ospi
tal
156
STM
St M
ary'
s H
ospi
tal P
addi
ngto
n11
6
Isle
of W
ight
NH
S P
CT
R1F
-X78
221
35%
No
IOW
St M
ary'
s H
ospi
tal,
New
port
78
Jam
es P
aget
Uni
vers
ity H
ospi
tals
NH
S Fo
unda
tion
Trus
tR
GP
155
417
37%
No
JPH
Jam
es P
aget
Uni
vers
ity H
ospi
tal
155
Ket
teri
ng G
ener
al H
ospi
tal N
HS
Foun
datio
n Tr
ust
RN
Q44
049
689
%Ye
sK
GH
Ket
teri
ng G
ener
al H
ospi
tal
440
Kin
g's
Col
lege
Hos
pita
l NH
S Fo
unda
tion
Trus
tR
JZ75
810
8770
%Ye
s
KC
HK
ing'
s C
olle
ge H
ospi
tal
438
BR
OP
rinc
ess
Roy
al U
nive
rsity
H
ospi
tal (
Bro
mle
y)32
0
Kin
gsto
n H
ospi
tal N
HS
Trus
tR
AX
196
322
61%
No
KTH
Kin
gsto
n H
ospi
tal
196
Lanc
ashi
re T
each
ing
Hos
pita
ls N
HS
Foun
datio
n Tr
ust
RXN
709
660
107%
Yes
CH
OC
horl
ey a
nd S
outh
Rib
ble
Hos
pita
l24
8
RP
HR
oyal
Pre
ston
Hos
pita
l46
1
Leed
s Te
achi
ng H
ospi
tals
NH
S Tr
ust
764
1066
72%
Yes
LGI
Leed
s G
ener
al In
firm
ary
764
Lew
isha
m a
nd G
reen
wic
h N
HS
Trus
tR
J227
974
238
%N
oG
WH
Que
en E
lizab
eth
Hos
pita
l (W
oolw
ich)
106
LEW
Uni
vers
ity H
ospi
tal L
ewis
ham
173
Live
rpoo
l Hea
rt a
nd C
hest
Hos
pita
l NH
S Fo
unda
tion
Trus
tR
BQ
8272
114%
Yes
BH
LLi
verp
ool H
eart
and
Che
st H
ospi
tal
82
Lond
on N
orth
Wes
t Hea
lthc
are
Trus
t†
R1K
974
1146
85%
Yes
CM
HC
entr
al M
iddl
esex
Hos
pita
l39
EAL
Ealin
g H
ospi
tal
230
NP
HN
orth
wic
k P
ark
Hos
pita
l70
5
Luto
n an
d D
unst
able
Hos
pita
l NH
S Fo
unda
tion
Trus
tR
C9
369
460
80%
Yes
LDH
Luto
n an
d D
unst
able
Hos
pita
l36
9
Mai
dsto
ne a
nd T
unbr
idge
Wel
ls N
HS
Trus
tR
WF
519
523
99%
Yes
MA
IM
aids
tone
Hos
pita
l27
5
KSX
Tunb
ridg
e W
ells
Hos
pita
l24
4
Med
way
NH
S Fo
unda
tion
Trus
tR
PA44
652
785
%Ye
sM
DW
Med
way
Mar
itim
e H
ospi
tal
446
Mid
Che
shir
e H
ospi
tals
NH
S Fo
unda
tion
Trus
tR
BT
172
446
39%
No
LGH
Leig
hton
Hos
pita
l17
2
Mid
Ess
ex H
ospi
tal S
ervi
ces
NH
S Tr
ust
RQ
857
848
012
0%Ye
sB
FHB
room
field
Hos
pita
l57
8
Mid
Yor
kshi
re H
ospi
tals
NH
S Tr
ust
RXF
-X87
784
910
3%Ye
sD
EWD
ewsb
ury
and
Dis
tric
t Hos
pita
l32
3
PIN
Pin
derfi
elds
Hos
pita
l55
4
Milt
on K
eyne
s H
ospi
tal N
HS
Foun
datio
n Tr
ust
RD
834
439
188
%Ye
sM
KH
Milt
on K
eyne
s G
ener
al H
ospi
tal
344
† E
alin
g H
ospi
tal N
HS
Trus
t and
The
Nor
th W
est L
ondo
n H
ospi
tals
NH
S Tr
ust m
erge
d on
1st
Oct
ober
201
4 to
form
Lon
don
Nor
th W
est H
ealt
hcar
e N
HS
Trus
t (R
1K)
28 National Heart Failure Audit April 2015-March 2016

Nor
folk
and
Nor
wic
h U
nive
rsity
Hos
pita
ls N
HS
Fo
unda
tion
Trus
tR
M1
270
1011
27%
No
NO
RN
orfo
lk a
nd N
orw
ich
Uni
vers
ity H
ospi
tal
270
Nor
th B
rist
ol N
HS
Trus
tR
VJ-X
485
611
79%
Yes
BSM
Sout
hmea
d H
ospi
tal
485
Nor
th M
iddl
esex
Uni
vers
ity H
ospi
tal N
HS
Trus
tR
AP
169
600
28%
No
NM
HN
orth
Mid
dles
ex U
nive
rsity
Hos
pita
l16
9
Nor
th T
ees
and
Har
tlepo
ol N
HS
Foun
datio
n Tr
ust
RVW
267
485
55%
No
NTG
Uni
vers
ity H
ospi
tal o
f Nor
th T
ees
267
Nor
tham
pton
Gen
eral
Hos
pita
l NH
S Tr
ust
RN
S19
046
141
%N
oN
THN
orth
ampt
on G
ener
al H
ospi
tal
190
Nor
ther
n D
evon
Hea
lthc
are
NH
S Tr
ust
RB
Z25
930
585
%Ye
sN
DD
Nor
th D
evon
Dis
tric
t Hos
pita
l25
9
Nor
ther
n Li
ncol
nshi
re a
nd G
oole
Hos
pita
ls N
HS
Foun
datio
n Tr
ust
RJL
-X57
762
393
%Ye
sG
GH
Dia
na P
rinc
ess
of W
ales
Hos
pita
l26
3
SCU
Scun
thor
pe G
ener
al H
ospi
tal
314
Nor
thum
bria
Hea
lthc
are
NH
S Fo
unda
tion
Trus
tR
TF19
883
224
%N
o
HEX
Hex
ham
Gen
eral
Hos
pita
l22
NTY
Nor
th T
ynes
ide
Hos
pita
l83
ASH
Wan
sbec
k G
ener
al H
ospi
tal
93
Not
tingh
am U
nive
rsity
Tru
stR
X155
422
824
3%C
HN
Not
tingh
am C
ity H
ospi
tal
2
UH
NQ
ueen
's M
edic
al C
entr
e55
2
Oxf
ord
Rad
cliff
e H
ospi
tals
NH
S Tr
ust
RTH
760
663
115%
Yes
HO
RH
orto
n G
ener
al H
ospi
tal
202
RA
DJo
hn R
adcl
iffe
Hos
pita
l55
8
Pen
nine
Acu
te H
ospi
tals
NH
S Tr
ust
RW
698
899
799
%Ye
s
BR
YFa
irfie
ld G
ener
al H
ospi
tal
325
NM
GN
orth
Man
ches
ter
Gen
eral
Hos
pita
l29
3
BH
HR
ochd
ale
Infir
mar
y46
OH
MR
oyal
Old
ham
Hos
pita
l32
4
Pet
erbo
roug
h an
d St
amfo
rd H
ospi
tals
NH
S
Foun
datio
n Tr
ust
RG
N47
245
110
5%Ye
sP
ETP
eter
boro
ugh
City
Hos
pita
l47
2
Ply
mou
th H
ospi
tals
NH
S Tr
ust
RK
974
072
310
2%Ye
sP
LYD
erri
ford
Hos
pita
l74
0
Poo
le H
ospi
tal N
HS
Foun
datio
n Tr
ust
RD
336
733
710
9%Ye
sP
GH
Poo
le G
ener
al H
ospi
tal
367
Por
tsm
outh
Hos
pita
ls N
HS
Trus
tR
HU
457
664
69%
No
QA
PQ
ueen
Ale
xand
ra H
ospi
tal
457
Trus
t nam
eN
HS
Trus
t co
deTr
ust
reco
rds
subm
itted
HES
pr
imar
y H
F di
scha
rges
% H
ES
subm
itted
Part
icip
atio
n st
atus
NIC
OR
ho
spita
l co
de
Hos
pita
l nam
eH
ospi
tal
reco
rds
subm
itted
Engl
and
and
Wal
es66
695
8144
982
%
Engl
and
6316
076
936
82%
29National Heart Failure Audit April 2015-March 2016

Rot
herh
am N
HS
Foun
datio
n Tr
ust
RFR
267
313
85%
Yes
RO
TR
othe
rham
Hos
pita
l26
7
Roy
al B
erks
hire
NH
S Fo
unda
tion
Trus
tR
HW
413
266
155%
Yes
BH
RR
oyal
Ber
kshi
re H
ospi
tal
413
Roy
al B
rom
pton
and
Har
efiel
d N
HS
Foun
datio
n Tr
ust
RT3
370
259
143%
Yes
HH
Har
efiel
d H
ospi
tal
194
NH
BR
oyal
Bro
mpt
on H
ospi
tal
176
Roy
al C
ornw
all H
ospi
tals
NH
S Tr
ust
REF
-X67
371
494
%Ye
sR
CH
Roy
al C
ornw
all H
ospi
tal
673
Roy
al D
evon
and
Exe
ter
NH
S Fo
unda
tion
Trus
tR
H8
454
461
98%
Yes
RD
ER
oyal
Dev
on &
Exe
ter
Hos
pita
l45
4
Roy
al F
ree
Lond
on N
HS
Trus
tR
AL
787
1041
76%
Yes
RFH
Roy
al F
ree
Hos
pita
l31
4
BN
TB
arne
t Gen
eral
Hos
pita
l47
3
Roy
al L
iver
pool
and
Bro
adgr
een
Uni
vers
ity H
ospi
tals
N
HS
Trus
tR
Q6
386
466
83%
Yes
RLU
Roy
al L
iver
pool
Uni
vers
ity H
ospi
tal
386
Roy
al S
urre
y C
ount
y H
ospi
tal N
HS
Foun
datio
n Tr
ust
RA
225
633
477
%Ye
sR
SUR
oyal
Sur
rey
Cou
nty
Hos
pita
l25
6
Roy
al U
nite
d H
ospi
tal B
ath
NH
S Tr
ust
RD
144
560
174
%Ye
sB
ATR
oyal
Uni
ted
Hos
pita
l Bat
h44
5
Salfo
rd R
oyal
NH
S Fo
unda
tion
Trus
tR
M3
424
396
107%
Yes
SLF
Salfo
rd R
oyal
42
4
Salis
bury
NH
S Fo
unda
tion
Trus
tR
NZ
183
187
98%
Yes
SAL
Salis
bury
Dis
tric
t Hos
pita
l18
3
Sand
wel
l and
Wes
t Bir
min
gham
Hos
pita
ls N
HS
Trus
tR
XK-X
666
870
77%
Yes
DU
DB
irm
ingh
am C
ity H
ospi
tal
470
SAN
Sand
wel
l Gen
eral
Hos
pita
l19
6
Shef
field
Tea
chin
g H
ospi
tals
NH
S Fo
unda
tion
Trus
tR
HQ
1003
1022
98%
Yes
NG
SN
orth
ern
Gen
eral
Hos
pita
l10
03
Sher
woo
d Fo
rest
Hos
pita
ls N
HS
Foun
datio
n Tr
ust
RK
547
855
386
%Ye
sK
MH
Kin
g's
Mill
Hos
pita
l47
8
Shre
wsb
ury
and
Telfo
rd H
ospi
tals
NH
S Tr
ust
RXW
409
713
57%
No
TLF
Pri
nces
s R
oyal
Hos
pita
l (Te
lford
)28
0
RSS
Roy
al S
hrew
sbur
y H
ospi
tal
129
Sout
h D
evon
Hea
lthc
are
NH
S Fo
unda
tion
Trus
tR
A9
569
536
106%
Yes
TOR
Torb
ay H
ospi
tal
569
Sout
h Te
es H
ospi
tals
NH
S Fo
unda
tion
Trus
tR
TR43
760
872
%Ye
sFR
HFr
iara
ge H
ospi
tal
64
SCM
Jam
es C
ook
Uni
vers
ity H
ospi
tal
373
Sout
h Ty
nesi
de N
HS
Foun
datio
n Tr
ust
RE9
337
263
128%
Yes
STD
Sout
h Ty
nesi
de D
istr
ict H
ospi
tal
337
Sout
h W
arw
icks
hire
NH
S Fo
unda
tion
Trus
t R
JC25
637
169
%Ye
sW
AR
War
wic
k H
ospi
tal
256
Sout
hend
Uni
vers
ity H
ospi
tal N
HS
Foun
datio
n Tr
ust
RA
J66
358
011
4%Ye
sSE
HSo
uthe
nd H
ospi
tal
663
Sout
hpor
t and
Orm
skir
k H
ospi
tal N
HS
Trus
tR
VY30
128
810
5%Ye
sSO
USo
uthp
ort a
nd F
orm
by D
istr
ict G
ener
al
Hos
pita
l30
1
St G
eorg
e's
Hea
lthc
are
NH
S Tr
ust
RJ7
512
714
72%
Yes
GEO
St G
eorg
e's
Hos
pita
l51
2
St H
elen
s an
d K
now
sley
Tea
chin
g H
ospi
tals
NH
S Tr
ust
RB
N35
247
374
%Ye
sW
HI
Whi
ston
Hos
pita
l35
2
30 National Heart Failure Audit April 2015-March 2016

31National Heart Failure Audit April 2015-March 2016
Stoc
kpor
t NH
S Fo
unda
tion
Trus
tR
WJ
491
528
93%
Yes
SHH
Step
ping
Hill
Hos
pita
l49
1
Surr
ey a
nd S
usse
x H
ealt
hcar
e N
HS
Trus
tR
TP34
259
058
%N
oES
UEa
st S
urre
y H
ospi
tal
342
Tam
esid
e H
ospi
tal N
HS
Foun
datio
n Tr
ust
RM
P21
340
053
%N
oTG
ATa
mes
ide
Gen
eral
Hos
pita
l21
3
Taun
ton
and
Som
erse
t NH
S Fo
unda
tion
Trus
tR
BA
304
534
57%
No
MP
HM
usgr
ove
Par
k H
ospi
tal
304
The
Dud
ley
Gro
up N
HS
Foun
datio
n Tr
ust
RN
A66
368
098
%Ye
sR
US
Rus
sells
Hal
l Hos
pita
l66
3
The
Hill
ingd
on H
ospi
tals
NH
S Fo
unda
tion
Trus
tR
AS
240
301
80%
Yes
HIL
Hill
ingd
on H
ospi
tal
240
The
Ipsw
ich
Hos
pita
l NH
S Tr
ust
RG
Q63
378
381
%Ye
sIP
SIp
swic
h H
ospi
tal
633
The
New
cast
le U
pon
Tyne
Hos
pita
ls N
HS
Foun
datio
n Tr
ust
RTD
531
598
89%
Yes
FRE
Free
man
Hos
pita
l and
Roy
al V
icto
ria
Infir
mar
y53
1
The
Pri
nces
s A
lexa
ndra
Hos
pita
l NH
S Tr
ust
RQ
W96
403
24%
No
PAH
Pri
nces
s A
lexa
ndra
Hos
pita
l96
The
Que
en E
lizab
eth
Hos
pita
l Kin
g's
Lynn
NH
S
Foun
datio
n Tr
ust
RC
X61
253
011
5%Ye
sQ
KL
Que
en E
lizab
eth
Hos
pita
l (K
ing'
s Ly
nn)
612
The
Roy
al B
ourn
emou
th a
nd C
hris
tchu
rch
Hos
pita
ls N
HS
Foun
datio
n Tr
ust
RD
Z41
366
862
%N
oB
OU
Roy
al B
ourn
emou
th G
ener
al H
ospi
tal
413
The
Roy
al W
olve
rham
pton
Hos
pita
ls N
HS
Trus
tR
L470
872
398
%Ye
sN
CR
New
Cro
ss H
ospi
tal
708
The
Whi
ttin
gton
Hos
pita
l NH
S Tr
ust
RK
E18
726
870
%Ye
sW
HT
Whi
ttin
gton
Hos
pita
l18
7
Uni
ted
Linc
olns
hire
Hos
pita
ls N
HS
Trus
tR
WD
679
999
68%
No
GR
AG
rant
ham
and
Dis
tric
t Hos
pita
l12
3
LIN
Linc
oln
Cou
nty
Hos
pita
l29
7
PIL
Pilg
rim
Hos
pita
l25
9
Uni
vers
ity C
olle
ge L
ondo
n H
ospi
tals
NH
S Fo
unda
tion
Trus
tR
RV
240
207
116%
Yes
UC
LU
nive
rsity
Col
lege
Hos
pita
l24
0
Uni
vers
ity H
ospi
tal N
orth
Mid
land
s N
HS
trus
t¥R
JD-X
1212
1341
90%
Yes
STO
Roy
al S
toke
Uni
vers
ity H
ospi
tal
1065
SDG
Cou
nty
Hos
pita
l 14
7
Uni
vers
ity H
ospi
tal o
f Sou
th M
anch
este
r N
HS
Foun
datio
n Tr
ust
RM
225
955
946
%N
oW
YTW
ythe
nsha
we
Hos
pita
l25
9
Uni
vers
ity H
ospi
tal S
outh
ampt
on N
HS
Trus
tR
HM
733
534
137%
Yes
SGH
Sout
ham
pton
Gen
eral
Hos
pita
l73
3
Trus
t nam
eN
HS
Trus
t co
deTr
ust
reco
rds
subm
itted
HES
pr
imar
y H
F di
scha
rges
% H
ES
subm
itted
Part
icip
atio
n st
atus
NIC
OR
ho
spita
l co
de
Hos
pita
l nam
eH
ospi
tal
reco
rds
subm
itted
Engl
and
and
Wal
es66
695
8144
982
%
Engl
and
6316
076
936
82%
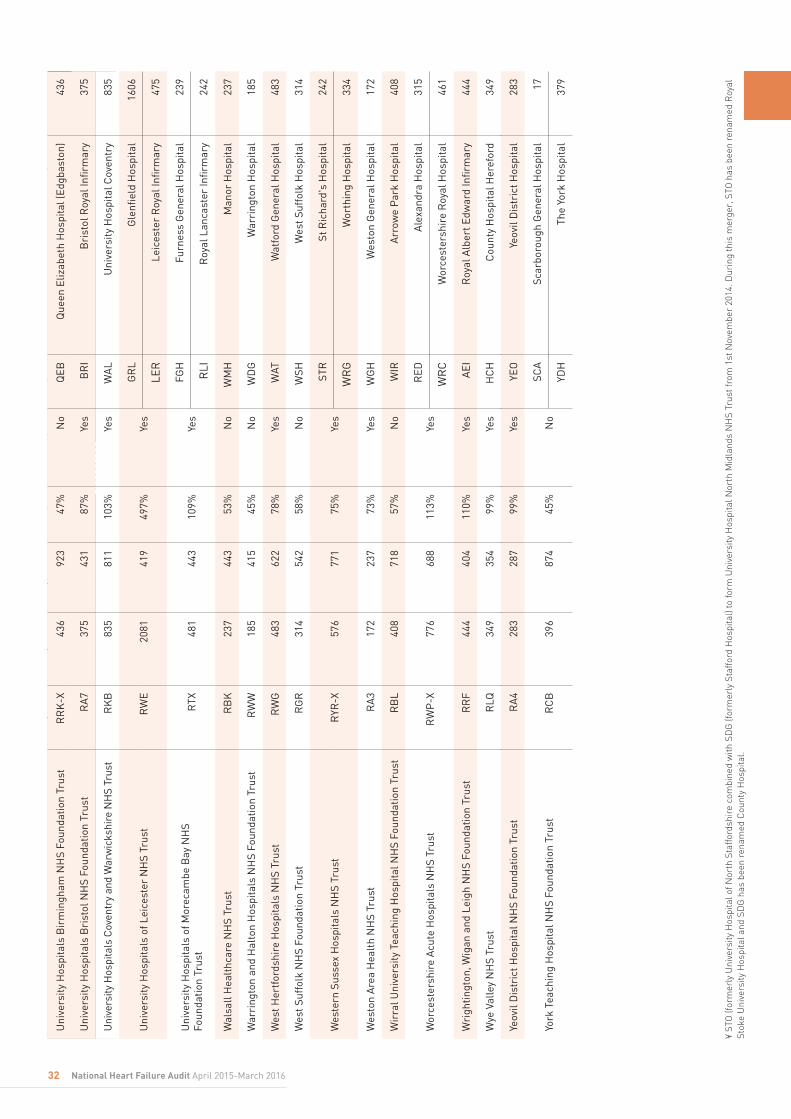
Trus
t nam
eTr
ust
reco
rds
subm
itte
d
% H
ES
subm
itte
dPa
rtic
ipat
ion
stat
usP
rim
ary
HES
hea
rt
failu
re
disc
harg
es
NIC
OR
ho
spit
al
code
Hos
pita
l nam
eH
ospi
tal r
ecor
ds
subm
itte
d
32 National Heart Failure Audit April 2015-March 2016
Uni
vers
ity H
ospi
tals
Bir
min
gham
NH
S Fo
unda
tion
Trus
tR
RK
-X43
692
347
%N
oQ
EBQ
ueen
Eliz
abet
h H
ospi
tal (
Edgb
asto
n)43
6
Uni
vers
ity H
ospi
tals
Bri
stol
NH
S Fo
unda
tion
Trus
tR
A7
375
431
87%
Yes
BR
IB
rist
ol R
oyal
Infir
mar
y37
5
Uni
vers
ity H
ospi
tals
Cov
entr
y an
d W
arw
icks
hire
NH
S Tr
ust
RK
B83
581
110
3%Ye
sW
AL
Uni
vers
ity H
ospi
tal C
oven
try
835
Uni
vers
ity H
ospi
tals
of L
eice
ster
NH
S Tr
ust
RW
E20
8141
949
7%Ye
sG
RL
Gle
nfiel
d H
ospi
tal
1606
LER
Leic
este
r R
oyal
Infir
mar
y47
5
Uni
vers
ity H
ospi
tals
of M
orec
ambe
Bay
NH
S
Foun
datio
n Tr
ust
RTX
481
443
109%
Yes
FGH
Furn
ess
Gen
eral
Hos
pita
l23
9
RLI
Roy
al L
anca
ster
Infir
mar
y24
2
Wal
sall
Hea
lthc
are
NH
S Tr
ust
RB
K23
744
353
%N
oW
MH
Man
or H
ospi
tal
237
War
ring
ton
and
Hal
ton
Hos
pita
ls N
HS
Foun
datio
n Tr
ust
RW
W18
541
545
%N
oW
DG
War
ring
ton
Hos
pita
l18
5
Wes
t Her
tfor
dshi
re H
ospi
tals
NH
S Tr
ust
RW
G48
362
278
%Ye
sW
ATW
atfo
rd G
ener
al H
ospi
tal
483
Wes
t Suf
folk
NH
S Fo
unda
tion
Trus
tR
GR
314
542
58%
No
WSH
Wes
t Suf
folk
Hos
pita
l31
4
Wes
tern
Sus
sex
Hos
pita
ls N
HS
Trus
tR
YR-X
576
771
75%
Yes
STR
St R
icha
rd's
Hos
pita
l24
2
WR
GW
orth
ing
Hos
pita
l33
4
Wes
ton
Are
a H
ealt
h N
HS
Trus
tR
A3
172
237
73%
Yes
WG
HW
esto
n G
ener
al H
ospi
tal
172
Wir
ral U
nive
rsity
Tea
chin
g H
ospi
tal N
HS
Foun
datio
n Tr
ust
RB
L40
871
857
%N
oW
IRA
rrow
e P
ark
Hos
pita
l40
8
Wor
cest
ersh
ire
Acu
te H
ospi
tals
NH
S Tr
ust
RW
P-X
776
688
113%
Yes
RED
Ale
xand
ra H
ospi
tal
315
WR
CW
orce
ster
shir
e R
oyal
Hos
pita
l46
1
Wri
ghtin
gton
, Wig
an a
nd L
eigh
NH
S Fo
unda
tion
Trus
tR
RF
444
404
110%
Yes
AEI
Roy
al A
lber
t Edw
ard
Infir
mar
y44
4
Wye
Val
ley
NH
S Tr
ust
RLQ
349
354
99%
Yes
HC
HC
ount
y H
ospi
tal H
eref
ord
349
Yeov
il D
istr
ict H
ospi
tal N
HS
Foun
datio
n Tr
ust
RA
428
328
799
%Ye
sYE
OYe
ovil
Dis
tric
t Hos
pita
l28
3
York
Tea
chin
g H
ospi
tal N
HS
Foun
datio
n Tr
ust
RC
B39
687
445
%N
oSC
ASc
arbo
roug
h G
ener
al H
ospi
tal
17
YDH
The
York
Hos
pita
l37
9
¥ ST
O (f
orm
erly
Uni
vers
ity H
ospi
tal o
f Nor
th S
taffo
rdsh
ire
com
bine
d w
ith S
DG
(for
mer
ly S
taffo
rd H
ospi
tal)
to fo
rm U
nive
rsity
Hos
pita
l Nor
th M
idla
nds
NH
S Tr
ust f
rom
1st
Nov
embe
r 20
14. D
urin
g th
is m
erge
r, S
TO h
as b
een
rena
med
Roy
al
Stok
e U
nive
rsity
Hos
pita
l and
SD
G h
as b
een
rena
med
Cou
nty
Hos
pita
l.
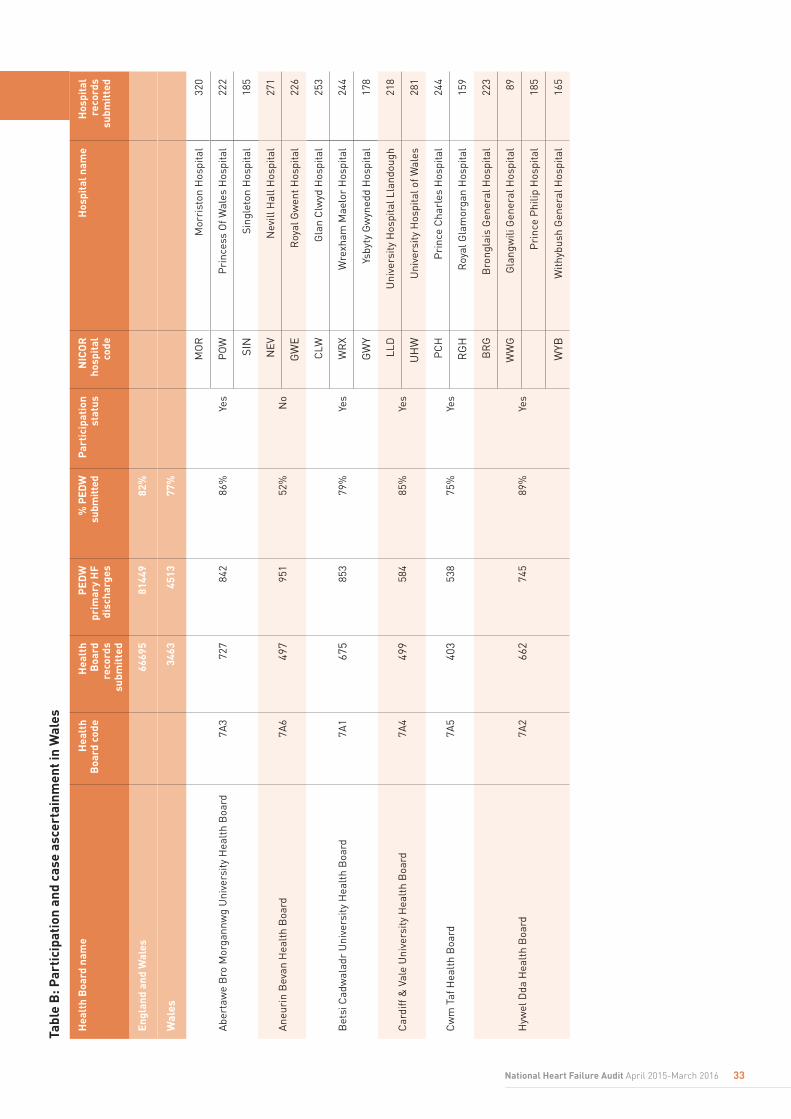
33National Heart Failure Audit April 2015-March 2016
Tabl
e B
: Par
tici
pati
on a
nd c
ase
asce
rtai
nmen
t in
Wal
es
Hea
lth
Boa
rd n
ame
Hea
lth
Boa
rd c
ode
Hea
lth
Boa
rd
reco
rds
subm
itte
d
PED
W
prim
ary
HF
disc
harg
es
% P
EDW
su
bmitt
edP
arti
cipa
tion
st
atus
NIC
OR
ho
spit
al
code
Hos
pita
l nam
eH
ospi
tal
reco
rds
subm
itte
d
Engl
and
and
Wal
es66
695
8144
982
%
Wal
es34
6345
1377
%
Abe
rtaw
e B
ro M
orga
nnw
g U
nive
rsity
Hea
lth
Boa
rd7A
372
784
286
%Ye
s
MO
RM
orri
ston
Hos
pita
l32
0
PO
WP
rinc
ess
Of W
ales
Hos
pita
l22
2
SIN
Sing
leto
n H
ospi
tal
185
Ane
urin
Bev
an H
ealt
h B
oard
7A6
497
951
52%
No
NEV
Nev
ill H
all H
ospi
tal
271
GW
ER
oyal
Gw
ent H
ospi
tal
226
Bet
si C
adw
alad
r U
nive
rsity
Hea
lth
Boa
rd7A
167
585
379
%Ye
s
CLW
Gla
n C
lwyd
Hos
pita
l25
3
WR
XW
rexh
am M
aelo
r H
ospi
tal
244
GW
YYs
byty
Gw
yned
d H
ospi
tal
178
Car
diff
& V
ale
Uni
vers
ity H
ealt
h B
oard
7A4
499
584
85%
Yes
LLD
Uni
vers
ity H
ospi
tal L
land
ough
218
UH
WU
nive
rsity
Hos
pita
l of W
ales
281
Cw
m T
af H
ealt
h B
oard
7A5
403
538
75%
Yes
PC
HP
rinc
e C
harl
es H
ospi
tal
244
RG
HR
oyal
Gla
mor
gan
Hos
pita
l15
9
Hyw
el D
da H
ealt
h B
oard
7A2
662
745
89%
Yes
BR
GB
rong
lais
Gen
eral
Hos
pita
l22
3
WW
GG
lang
wili
Gen
eral
Hos
pita
l89
Pri
nce
Phi
lip H
ospi
tal
185
WYB
With
ybus
h G
ener
al H
ospi
tal
165
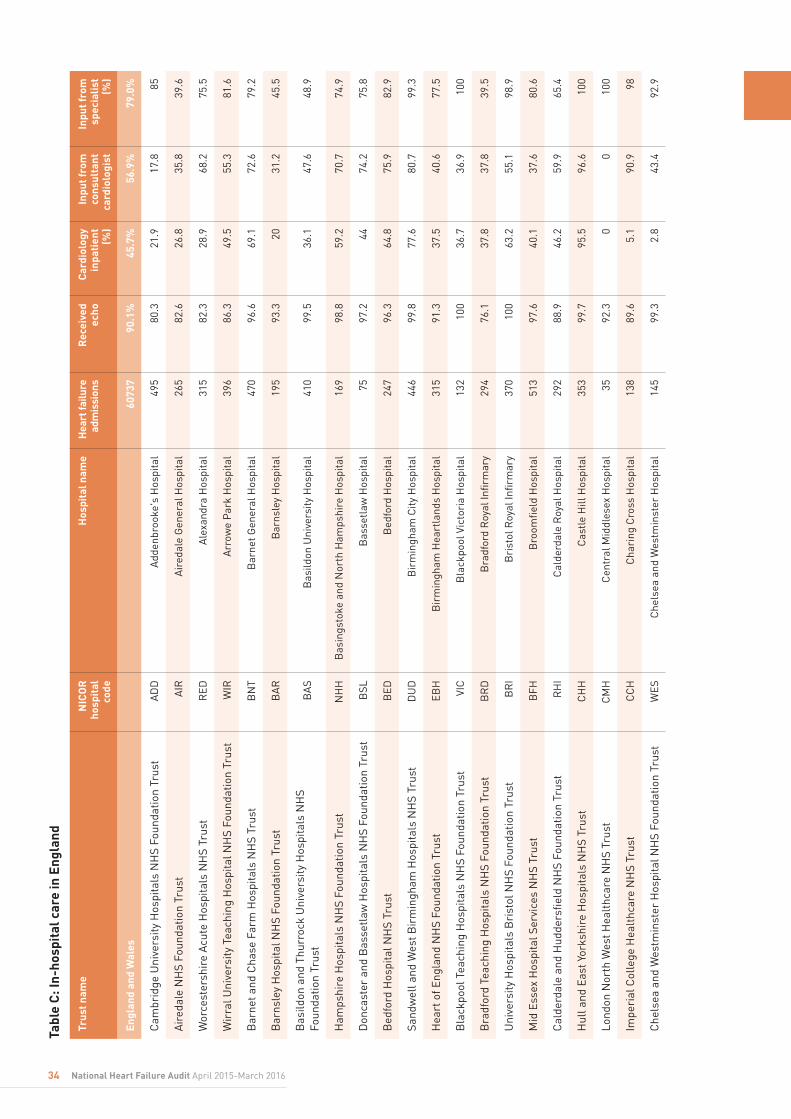
34 National Heart Failure Audit April 2015-March 2016
Tabl
e C
: In-
hosp
ital
car
e in
Eng
land
Trus
t nam
eN
ICO
R
hosp
ital
co
de
Hos
pita
l nam
eH
eart
failu
re
adm
issi
ons
Rec
eive
d ec
hoC
ardi
olog
y in
pati
ent
(%)
Inpu
t fro
m
cons
ulta
nt
card
iolo
gist
Inpu
t fro
m
spec
ialis
t (%
)
Engl
and
and
Wal
es
6073
790
.1%
45.7
%56
.9%
79.0
%
Cam
brid
ge U
nive
rsity
Hos
pita
ls N
HS
Foun
datio
n Tr
ust
AD
DA
dden
broo
ke's
Hos
pita
l49
580
.321
.917
.885
Air
edal
e N
HS
Foun
datio
n Tr
ust
AIR
Air
edal
e G
ener
al H
ospi
tal
265
82.6
26.8
35.8
39.6
Wor
cest
ersh
ire
Acu
te H
ospi
tals
NH
S Tr
ust
RED
Ale
xand
ra H
ospi
tal
315
82.3
28.9
68.2
75.5
Wir
ral U
nive
rsity
Tea
chin
g H
ospi
tal N
HS
Foun
datio
n Tr
ust
WIR
Arr
owe
Par
k H
ospi
tal
396
86.3
49.5
55.3
81.6
Bar
net a
nd C
hase
Far
m H
ospi
tals
NH
S Tr
ust
BN
TB
arne
t Gen
eral
Hos
pita
l47
096
.669
.172
.679
.2
Bar
nsle
y H
ospi
tal N
HS
Foun
datio
n Tr
ust
BA
RB
arns
ley
Hos
pita
l19
593
.320
31.2
45.5
Bas
ildon
and
Thu
rroc
k U
nive
rsity
Hos
pita
ls N
HS
Foun
datio
n Tr
ust
BA
SB
asild
on U
nive
rsity
Hos
pita
l41
099
.536
.147
.648
.9
Ham
pshi
re H
ospi
tals
NH
S Fo
unda
tion
Trus
tN
HH
Bas
ings
toke
and
Nor
th H
amps
hire
Hos
pita
l16
998
.859
.270
.774
.9
Don
cast
er a
nd B
asse
tlaw
Hos
pita
ls N
HS
Foun
datio
n Tr
ust
BSL
Bas
setl
aw H
ospi
tal
7597
.244
74.2
75.8
Bed
ford
Hos
pita
l NH
S Tr
ust
BED
Bed
ford
Hos
pita
l24
796
.364
.875
.982
.9
Sand
wel
l and
Wes
t Bir
min
gham
Hos
pita
ls N
HS
Trus
tD
UD
Bir
min
gham
City
Hos
pita
l44
699
.877
.680
.799
.3
Hea
rt o
f Eng
land
NH
S Fo
unda
tion
Trus
tEB
HB
irm
ingh
am H
eart
land
s H
ospi
tal
315
91.3
37.5
40.6
77.5
Bla
ckpo
ol T
each
ing
Hos
pita
ls N
HS
Foun
datio
n Tr
ust
VIC
Bla
ckpo
ol V
icto
ria
Hos
pita
l13
210
036
.736
.910
0
Bra
dfor
d Te
achi
ng H
ospi
tals
NH
S Fo
unda
tion
Trus
tB
RD
Bra
dfor
d R
oyal
Infir
mar
y29
476
.137
.837
.839
.5
Uni
vers
ity H
ospi
tals
Bri
stol
NH
S Fo
unda
tion
Trus
tB
RI
Bri
stol
Roy
al In
firm
ary
370
100
63.2
55.1
98.9
Mid
Ess
ex H
ospi
tal S
ervi
ces
NH
S Tr
ust
BFH
Bro
omfie
ld H
ospi
tal
513
97.6
40.1
37.6
80.6
Cal
derd
ale
and
Hud
ders
field
NH
S Fo
unda
tion
Trus
tR
HI
Cal
derd
ale
Roy
al H
ospi
tal
292
88.9
46.2
59.9
65.4
Hul
l and
Eas
t Yor
kshi
re H
ospi
tals
NH
S Tr
ust
CH
HC
astle
Hill
Hos
pita
l35
399
.795
.596
.610
0
Lond
on N
orth
Wes
t Hea
lthc
are
NH
S Tr
ust
CM
HC
entr
al M
iddl
esex
Hos
pita
l35
92.3
00
100
Impe
rial
Col
lege
Hea
lthc
are
NH
S Tr
ust
CC
HC
hari
ng C
ross
Hos
pita
l13
889
.65.
190
.998
Che
lsea
and
Wes
tmin
ster
Hos
pita
l NH
S Fo
unda
tion
Trus
tW
ESC
hels
ea a
nd W
estm
inst
er H
ospi
tal
145
99.3
2.8
43.4
92.9

35National Heart Failure Audit April 2015-March 2016
Trus
t nam
eN
ICO
R
hosp
ital
co
de
Hos
pita
l nam
eH
eart
failu
re
adm
issi
ons
Rec
eive
d ec
hoC
ardi
olog
y in
pati
ent
(%)
Inpu
t fro
m
cons
ulta
nt
card
iolo
gist
Inpu
t fro
m
spec
ialis
t (%
)
Engl
and
and
Wal
es
6073
790
.1%
45.7
%56
.9%
79.0
%
Glo
uces
ters
hire
Hos
pita
ls N
HS
Foun
datio
n Tr
ust
CH
GC
helt
enha
m G
ener
al H
ospi
tal
140
55.4
22.1
24.3
25.7
Che
ster
field
Roy
al H
ospi
tal N
HS
Foun
datio
n Tr
ust
CH
EC
hest
erfie
ld R
oyal
Hos
pita
l77
57.1
35.1
35.1
58.4
Lanc
ashi
re T
each
ing
Hos
pita
ls N
HS
Foun
datio
n Tr
ust
CH
OC
horl
ey a
nd S
outh
Rib
ble
Hos
pita
l24
410
038
.526
.610
0
Col
ches
ter
Hos
pita
l Uni
vers
ity N
HS
Foun
datio
n Tr
ust
CO
LC
olch
este
r G
ener
al H
ospi
tal
636
100
50.9
58.3
94.2
East
Sus
sex
Hea
lthc
are
NH
S Tr
ust
CG
HC
onqu
est H
ospi
tal
260
94.4
40.4
56.2
99.6
Cou
ntes
s of
Che
ster
Hos
pita
l NH
S Fo
unda
tion
Trus
tC
OC
Cou
ntes
s of
Che
ster
Hos
pita
l38
497
.160
.277
.498
.9
Uni
vers
ity H
ospi
tal N
orth
Mid
land
s N
HS
trus
tSD
GC
ount
y H
ospi
tal
930
77.5
22.2
35.5
99.3
Wye
Val
ley
NH
S Tr
ust
HC
HC
ount
y H
ospi
tal H
eref
ord
249
99.6
52.6
54.6
60.6
Cro
ydon
Hea
lth
Serv
ices
NH
S Tr
ust
MAY
Cro
ydon
Uni
vers
ity H
ospi
tal
307
9751
.557
.282
Dar
tfor
d an
d G
rave
sham
NH
S Tr
ust
DVH
Dar
ent V
alle
y H
ospi
tal
338
94.9
51.5
72.8
94.9
Cou
nty
Dur
ham
and
Dar
lingt
on N
HS
Foun
datio
n Tr
ust
DA
RD
arlin
gton
Mem
oria
l Hos
pita
l29
191
.762
.377
90.4
Ply
mou
th H
ospi
tals
NH
S Tr
ust
PLY
Der
rifo
rd H
ospi
tal
694
99.7
35.6
44.4
99.7
Mid
Yor
kshi
re H
ospi
tals
NH
S Tr
ust
DEW
Dew
sbur
y an
d D
istr
ict H
ospi
tal
292
84.8
7.9
3667
.5
Nor
ther
n Li
ncol
nshi
re a
nd G
oole
Hos
pita
ls N
HS
Foun
datio
n Tr
ust
GG
HD
iana
Pri
nces
s of
Wal
es H
ospi
tal
212
96.2
51.4
55.2
66.5
Don
cast
er a
nd B
asse
tlaw
Hos
pita
ls N
HS
Foun
datio
n Tr
ust
DID
Don
cast
er R
oyal
Infir
mar
y25
498
.420
.952
.775
.4
Dor
set C
ount
y H
ospi
tal N
HS
Foun
datio
n Tr
ust
WD
HD
orse
t Cou
nty
Hos
pita
l21
287
.342
.960
.571
.9
Lond
on N
orth
Wes
t Hea
lthc
are
NH
S Tr
ust
EAL
Ealin
g H
ospi
tal
230
91.8
38.7
41.7
69.1
Surr
ey a
nd S
usse
x H
ealt
hcar
e N
HS
Trus
tES
UEa
st S
urre
y H
ospi
tal
338
82.1
64.4
69.1
73.9
East
Sus
sex
Hea
lthc
are
NH
S Tr
ust
DG
EEa
stbo
urne
Dis
tric
t Gen
eral
Hos
pita
l25
089
57.2
78.8
90.4
Epso
m a
nd S
t Hel
ier
Uni
vers
ity H
ospi
tals
NH
S Tr
ust
EPS
Epso
m H
ospi
tal
135
79.7
39.6
5278
Pen
nine
Acu
te H
ospi
tals
NH
S Tr
ust
BR
YFa
irfie
ld G
ener
al H
ospi
tal
303
64.4
33.7
43.6
71.3

36 National Heart Failure Audit April 2015-March 2016
The
New
cast
le U
pon
Tyne
Hos
pita
ls N
HS
Foun
datio
n Tr
ust
FRE
Free
man
Hos
pita
l and
Roy
al V
icto
ria
Infir
mar
y48
684
.866
.373
.379
.8
Sout
h Te
es H
ospi
tals
NH
S Fo
unda
tion
Trus
tFR
HFr
iara
ge H
ospi
tal
6410
00
100
100
Frim
ley
Par
k H
ospi
tal N
HS
Foun
datio
n Tr
ust
FRM
Frim
ley
Par
k H
ospi
tal
387
83.3
57.9
72.1
85.8
Uni
vers
ity H
ospi
tals
of M
orec
ambe
Bay
NH
S
Foun
datio
n Tr
ust
FGH
Furn
ess
Gen
eral
Hos
pita
l23
699
.641
.579
.295
.8
Geo
rge
Elio
t Hos
pita
l NH
S Tr
ust
NU
NG
eorg
e El
iot H
ospi
tal
5694
.242
.958
.364
.6
Uni
vers
ity H
ospi
tals
of L
eice
ster
NH
S Tr
ust
GR
LG
lenfi
eld
Hos
pita
l15
7797
87.6
89.2
99.5
Glo
uces
ters
hire
Hos
pita
ls N
HS
Foun
datio
n Tr
ust
GLO
Glo
uces
ters
hire
Roy
al H
ospi
tal
244
6137
.740
.242
.2
Hea
rt o
f Eng
land
NH
S Fo
unda
tion
Trus
tG
HS
Goo
d H
ope
Hos
pita
l68
77.9
48.5
58.8
61.8
Uni
ted
Linc
olns
hire
Hos
pita
ls N
HS
Trus
tG
RA
Gra
ntha
m a
nd D
istr
ict H
ospi
tal
114
76.8
8.8
48.2
54.5
Gre
at W
este
rn H
ospi
tals
NH
S Fo
unda
tion
Trus
tP
MS
Gre
at W
este
rn H
ospi
tal
454
89.2
40.1
50.3
72.5
Impe
rial
Col
lege
Hea
lthc
are
NH
S Tr
ust
HA
MH
amm
ersm
ith H
ospi
tal
156
87.9
44.9
60.2
98.4
Roy
al B
rom
pton
and
Har
efiel
d N
HS
Foun
datio
n Tr
ust
HH
Har
efiel
d H
ospi
tal
189
96.8
98.4
98.9
100
Har
roga
te a
nd D
istr
ict N
HS
Foun
datio
n Tr
ust
HA
RH
arro
gate
Dis
tric
t Hos
pita
l25
862
.653
.944
.670
.9
Nor
thum
bria
Hea
lthc
are
NH
S Fo
unda
tion
Trus
tH
EXH
exha
m G
ener
al H
ospi
tal
710
028
.628
.628
.6
The
Hill
ingd
on H
ospi
tals
NH
S Fo
unda
tion
Trus
tH
ILH
illin
gdon
Hos
pita
l21
096
.646
.964
82.8
Hin
chin
gbro
oke
Hea
lth
Car
e N
HS
Trus
tH
INH
inch
ingb
rook
e H
ospi
tal
6595
.27.
761
.580
Hom
erto
n U
nive
rsity
Hos
pita
l NH
S Fo
unda
tion
Trus
tH
OM
Hom
erto
n U
nive
rsity
Hos
pita
l30
696
.336
.646
.964
.6
Oxf
ord
Rad
cliff
e H
ospi
tals
NH
S Tr
ust
HO
RH
orto
n G
ener
al H
ospi
tal
177
96.6
2550
.376
.8
Cal
derd
ale
and
Hud
ders
field
NH
S Fo
unda
tion
Trus
tH
UD
Hud
ders
field
Roy
al In
firm
ary
311
82.8
34.7
45.7
59.5
Hul
l and
Eas
t Yor
kshi
re H
ospi
tals
NH
S Tr
ust
HR
IH
ull R
oyal
Infir
mar
y19
797
112
.281
.7
The
Ipsw
ich
Hos
pita
l NH
S Tr
ust
IPS
Ipsw
ich
Hos
pita
l63
074
.219
29.2
53.7
Sout
h Te
es H
ospi
tals
NH
S Fo
unda
tion
Trus
tSC
MJa
mes
Coo
k U
nive
rsity
Hos
pita
l37
299
.482
.284
97.6
Jam
es P
aget
Uni
vers
ity H
ospi
tals
NH
S Fo
unda
tion
Trus
tJP
HJa
mes
Pag
et U
nive
rsity
Hos
pita
l14
698
.670
.579
.797
.2
Oxf
ord
Rad
cliff
e H
ospi
tals
NH
S Tr
ust
RA
DJo
hn R
adcl
iffe
Hos
pita
l49
495
.720
.758
.483
.5
East
Ken
t Hos
pita
ls U
nive
rsity
NH
S Fo
unda
tion
Trus
tK
CC
Ken
t and
Can
terb
ury
Hos
pita
l18
093
.616
.730
.696
.1
Ket
teri
ng G
ener
al H
ospi
tal N
HS
Foun
datio
n Tr
ust
KG
HK
ette
ring
Gen
eral
Hos
pita
l39
294
.268
.375
.295
.3
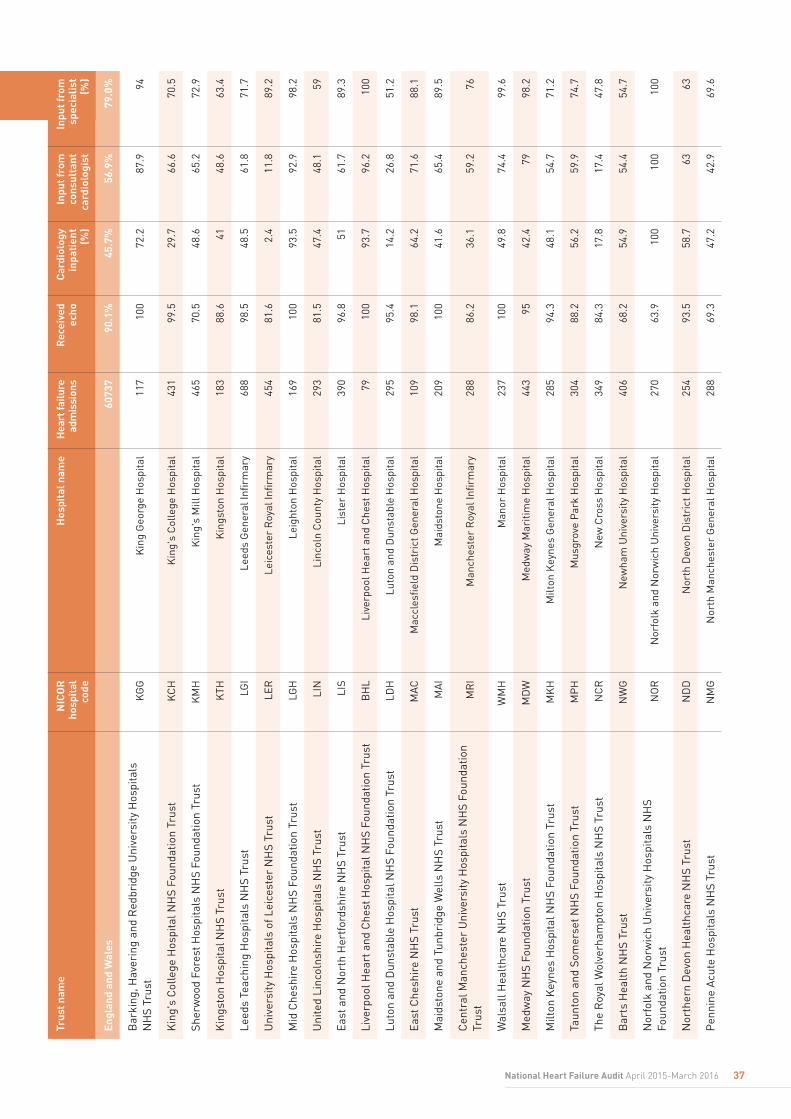
37National Heart Failure Audit April 2015-March 2016
Bar
king
, Hav
erin
g an
d R
edbr
idge
Uni
vers
ity H
ospi
tals
N
HS
Trus
tK
GG
Kin
g G
eorg
e H
ospi
tal
117
100
72.2
87.9
94
Kin
g's
Col
lege
Hos
pita
l NH
S Fo
unda
tion
Trus
tK
CH
Kin
g's
Col
lege
Hos
pita
l43
199
.529
.766
.670
.5
Sher
woo
d Fo
rest
Hos
pita
ls N
HS
Foun
datio
n Tr
ust
KM
HK
ing'
s M
ill H
ospi
tal
465
70.5
48.6
65.2
72.9
Kin
gsto
n H
ospi
tal N
HS
Trus
tK
THK
ings
ton
Hos
pita
l18
388
.641
48.6
63.4
Leed
s Te
achi
ng H
ospi
tals
NH
S Tr
ust
LGI
Leed
s G
ener
al In
firm
ary
688
98.5
48.5
61.8
71.7
Uni
vers
ity H
ospi
tals
of L
eice
ster
NH
S Tr
ust
LER
Leic
este
r R
oyal
Infir
mar
y45
481
.62.
411
.889
.2
Mid
Che
shir
e H
ospi
tals
NH
S Fo
unda
tion
Trus
tLG
HLe
ight
on H
ospi
tal
169
100
93.5
92.9
98.2
Uni
ted
Linc
olns
hire
Hos
pita
ls N
HS
Trus
tLI
NLi
ncol
n C
ount
y H
ospi
tal
293
81.5
47.4
48.1
59
East
and
Nor
th H
ertf
ords
hire
NH
S Tr
ust
LIS
List
er H
ospi
tal
390
96.8
5161
.789
.3
Live
rpoo
l Hea
rt a
nd C
hest
Hos
pita
l NH
S Fo
unda
tion
Trus
tB
HL
Live
rpoo
l Hea
rt a
nd C
hest
Hos
pita
l79
100
93.7
96.2
100
Luto
n an
d D
unst
able
Hos
pita
l NH
S Fo
unda
tion
Trus
tLD
HLu
ton
and
Dun
stab
le H
ospi
tal
295
95.4
14.2
26.8
51.2
East
Che
shir
e N
HS
Trus
tM
ACM
accl
esfie
ld D
istr
ict G
ener
al H
ospi
tal
109
98.1
64.2
71.6
88.1
Mai
dsto
ne a
nd T
unbr
idge
Wel
ls N
HS
Trus
tM
AI
Mai
dsto
ne H
ospi
tal
209
100
41.6
65.4
89.5
Cen
tral
Man
ches
ter
Uni
vers
ity H
ospi
tals
NH
S Fo
unda
tion
Trus
tM
RI
Man
ches
ter
Roy
al In
firm
ary
288
86.2
36.1
59.2
76
Wal
sall
Hea
lthc
are
NH
S Tr
ust
WM
HM
anor
Hos
pita
l23
710
049
.874
.499
.6
Med
way
NH
S Fo
unda
tion
Trus
tM
DW
Med
way
Mar
itim
e H
ospi
tal
443
9542
.479
98.2
Milt
on K
eyne
s H
ospi
tal N
HS
Foun
datio
n Tr
ust
MK
HM
ilton
Key
nes
Gen
eral
Hos
pita
l28
594
.348
.154
.771
.2
Taun
ton
and
Som
erse
t NH
S Fo
unda
tion
Trus
tM
PH
Mus
grov
e P
ark
Hos
pita
l30
488
.256
.259
.974
.7
The
Roy
al W
olve
rham
pton
Hos
pita
ls N
HS
Trus
tN
CR
New
Cro
ss H
ospi
tal
349
84.3
17.8
17.4
47.8
Bar
ts H
ealt
h N
HS
Trus
tN
WG
New
ham
Uni
vers
ity H
ospi
tal
406
68.2
54.9
54.4
54.7
Nor
folk
and
Nor
wic
h U
nive
rsity
Hos
pita
ls N
HS
Fo
unda
tion
Trus
tN
OR
Nor
folk
and
Nor
wic
h U
nive
rsity
Hos
pita
l27
063
.910
010
010
0
Nor
ther
n D
evon
Hea
lthc
are
NH
S Tr
ust
ND
DN
orth
Dev
on D
istr
ict H
ospi
tal
254
93.5
58.7
6363
Pen
nine
Acu
te H
ospi
tals
NH
S Tr
ust
NM
GN
orth
Man
ches
ter
Gen
eral
Hos
pita
l28
869
.347
.242
.969
.6
Trus
t nam
eN
ICO
R
hosp
ital
co
de
Hos
pita
l nam
eH
eart
failu
re
adm
issi
ons
Rec
eive
d ec
hoC
ardi
olog
y in
pati
ent
(%)
Inpu
t fro
m
cons
ulta
nt
card
iolo
gist
Inpu
t fro
m
spec
ialis
t (%
)
Engl
and
and
Wal
es
6073
790
.1%
45.7
%56
.9%
79.0
%
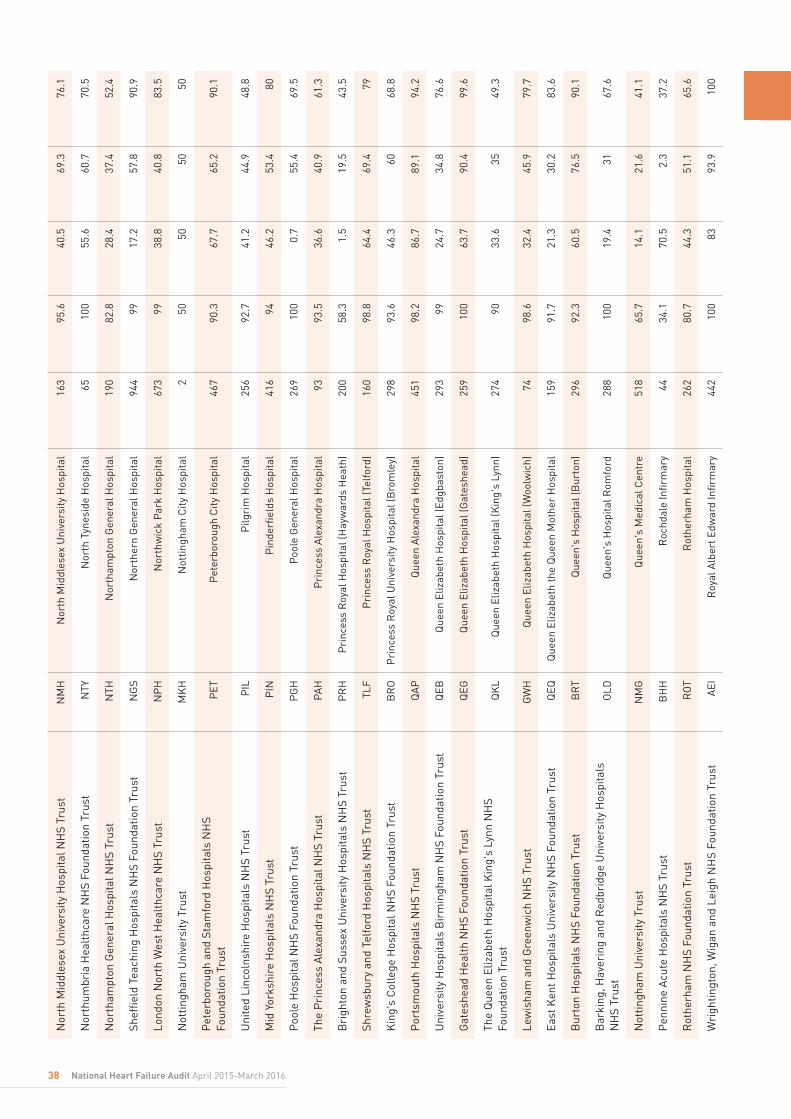
38 National Heart Failure Audit April 2015-March 2016
Nor
th M
iddl
esex
Uni
vers
ity H
ospi
tal N
HS
Trus
tN
MH
Nor
th M
iddl
esex
Uni
vers
ity H
ospi
tal
163
95.6
40.5
69.3
76.1
Nor
thum
bria
Hea
lthc
are
NH
S Fo
unda
tion
Trus
tN
TYN
orth
Tyn
esid
e H
ospi
tal
6510
055
.660
.770
.5
Nor
tham
pton
Gen
eral
Hos
pita
l NH
S Tr
ust
NTH
Nor
tham
pton
Gen
eral
Hos
pita
l19
082
.828
.437
.452
.4
Shef
field
Tea
chin
g H
ospi
tals
NH
S Fo
unda
tion
Trus
tN
GS
Nor
ther
n G
ener
al H
ospi
tal
944
9917
.257
.890
.9
Lond
on N
orth
Wes
t Hea
lthc
are
NH
S Tr
ust
NP
HN
orth
wic
k P
ark
Hos
pita
l67
399
38.8
40.8
83.5
Not
tingh
am U
nive
rsity
Tru
stM
KH
Not
tingh
am C
ity H
ospi
tal
250
5050
50
Pet
erbo
roug
h an
d St
amfo
rd H
ospi
tals
NH
S
Foun
datio
n Tr
ust
PET
Pet
erbo
roug
h C
ity H
ospi
tal
467
90.3
67.7
65.2
90.1
Uni
ted
Linc
olns
hire
Hos
pita
ls N
HS
Trus
tP
ILP
ilgri
m H
ospi
tal
256
92.7
41.2
44.9
48.8
Mid
Yor
kshi
re H
ospi
tals
NH
S Tr
ust
PIN
Pin
derfi
elds
Hos
pita
l41
694
46.2
53.4
80
Poo
le H
ospi
tal N
HS
Foun
datio
n Tr
ust
PG
HP
oole
Gen
eral
Hos
pita
l26
910
00.
755
.469
.5
The
Pri
nces
s A
lexa
ndra
Hos
pita
l NH
S Tr
ust
PAH
Pri
nces
s A
lexa
ndra
Hos
pita
l93
93.5
36.6
40.9
61.3
Bri
ghto
n an
d Su
ssex
Uni
vers
ity H
ospi
tals
NH
S Tr
ust
PR
HP
rinc
ess
Roy
al H
ospi
tal (
Hay
war
ds H
eath
)20
058
.31.
519
.543
.5
Shre
wsb
ury
and
Telfo
rd H
ospi
tals
NH
S Tr
ust
TLF
Pri
nces
s R
oyal
Hos
pita
l (Te
lford
)16
098
.864
.469
.479
Kin
g's
Col
lege
Hos
pita
l NH
S Fo
unda
tion
Trus
tB
RO
Pri
nces
s R
oyal
Uni
vers
ity H
ospi
tal (
Bro
mle
y)29
893
.646
.360
68.8
Por
tsm
outh
Hos
pita
ls N
HS
Trus
tQ
AP
Que
en A
lexa
ndra
Hos
pita
l45
198
.286
.789
.194
.2
Uni
vers
ity H
ospi
tals
Bir
min
gham
NH
S Fo
unda
tion
Trus
tQ
EBQ
ueen
Eliz
abet
h H
ospi
tal (
Edgb
asto
n)29
399
24.7
34.8
76.6
Gat
eshe
ad H
ealt
h N
HS
Foun
datio
n Tr
ust
QEG
Que
en E
lizab
eth
Hos
pita
l (G
ates
head
)25
910
063
.790
.499
.6
The
Que
en E
lizab
eth
Hos
pita
l Kin
g's
Lynn
NH
S
Foun
datio
n Tr
ust
QK
LQ
ueen
Eliz
abet
h H
ospi
tal (
Kin
g's
Lynn
)27
490
33.6
3549
.3
Lew
isha
m a
nd G
reen
wic
h N
HS
Trus
tG
WH
Que
en E
lizab
eth
Hos
pita
l (W
oolw
ich)
7498
.632
.445
.979
.7
East
Ken
t Hos
pita
ls U
nive
rsity
NH
S Fo
unda
tion
Trus
tQ
EQQ
ueen
Eliz
abet
h th
e Q
ueen
Mot
her
Hos
pita
l15
991
.721
.330
.283
.6
Bur
ton
Hos
pita
ls N
HS
Foun
datio
n Tr
ust
BR
TQ
ueen
's H
ospi
tal (
Bur
ton)
296
92.3
60.5
76.5
90.1
Bar
king
, Hav
erin
g an
d R
edbr
idge
Uni
vers
ity H
ospi
tals
N
HS
Trus
tO
LDQ
ueen
's H
ospi
tal R
omfo
rd28
810
019
.431
67.6
Not
tingh
am U
nive
rsity
Tru
stN
MG
Que
en's
Med
ical
Cen
tre
518
65.7
14.1
21.6
41.1
Pen
nine
Acu
te H
ospi
tals
NH
S Tr
ust
BH
HR
ochd
ale
Infir
mar
y44
34.1
70.5
2.3
37.2
Rot
herh
am N
HS
Foun
datio
n Tr
ust
RO
TR
othe
rham
Hos
pita
l26
280
.744
.351
.165
.6
Wri
ghtin
gton
, Wig
an a
nd L
eigh
NH
S Fo
unda
tion
Trus
tA
EIR
oyal
Alb
ert E
dwar
d In
firm
ary
442
100
8393
.910
0
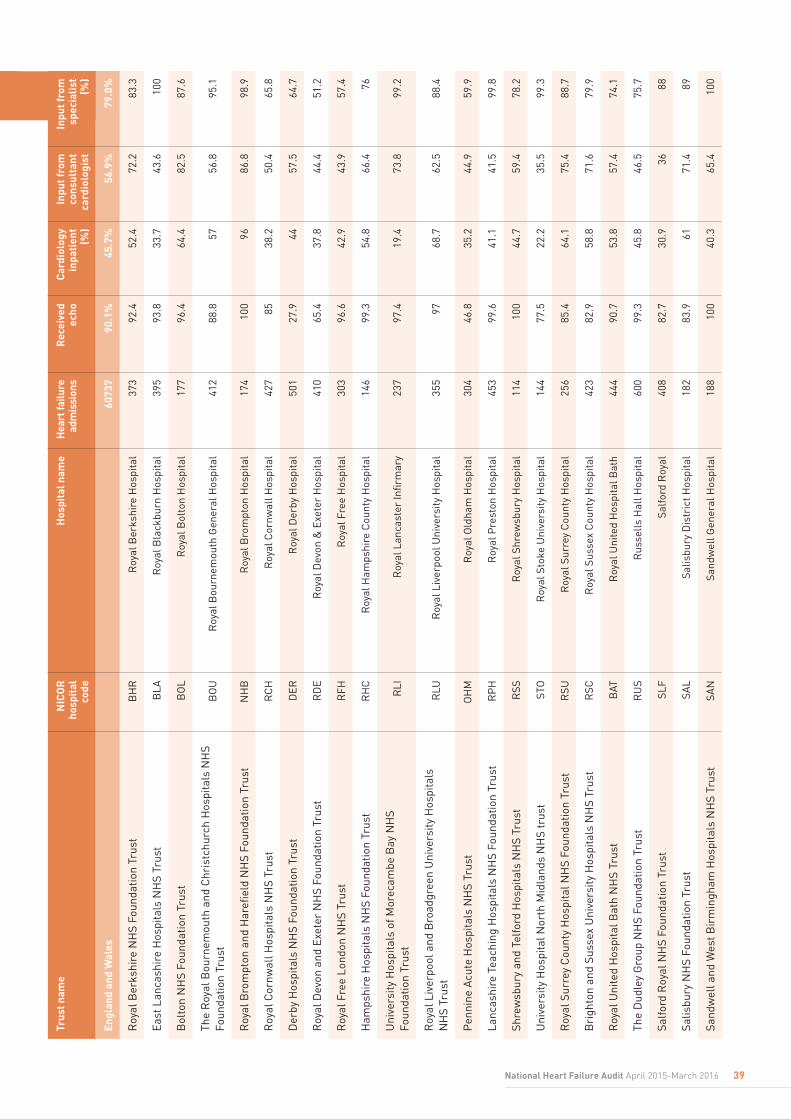
Roy
al B
erks
hire
NH
S Fo
unda
tion
Trus
tB
HR
Roy
al B
erks
hire
Hos
pita
l37
392
.452
.472
.283
.3
East
Lan
cash
ire
Hos
pita
ls N
HS
Trus
tB
LAR
oyal
Bla
ckbu
rn H
ospi
tal
395
93.8
33.7
43.6
100
Bol
ton
NH
S Fo
unda
tion
Trus
tB
OL
Roy
al B
olto
n H
ospi
tal
177
96.4
64.4
82.5
87.6
The
Roy
al B
ourn
emou
th a
nd C
hris
tchu
rch
Hos
pita
ls N
HS
Foun
datio
n Tr
ust
BO
UR
oyal
Bou
rnem
outh
Gen
eral
Hos
pita
l41
288
.857
56.8
95.1
Roy
al B
rom
pton
and
Har
efiel
d N
HS
Foun
datio
n Tr
ust
NH
BR
oyal
Bro
mpt
on H
ospi
tal
174
100
9686
.898
.9
Roy
al C
ornw
all H
ospi
tals
NH
S Tr
ust
RC
HR
oyal
Cor
nwal
l Hos
pita
l42
785
38.2
50.4
65.8
Der
by H
ospi
tals
NH
S Fo
unda
tion
Trus
tD
ERR
oyal
Der
by H
ospi
tal
501
27.9
4457
.564
.7
Roy
al D
evon
and
Exe
ter
NH
S Fo
unda
tion
Trus
tR
DE
Roy
al D
evon
& E
xete
r H
ospi
tal
410
65.4
37.8
44.4
51.2
Roy
al F
ree
Lond
on N
HS
Trus
tR
FHR
oyal
Fre
e H
ospi
tal
303
96.6
42.9
43.9
57.4
Ham
pshi
re H
ospi
tals
NH
S Fo
unda
tion
Trus
tR
HC
Roy
al H
amps
hire
Cou
nty
Hos
pita
l14
699
.354
.866
.476
Uni
vers
ity H
ospi
tals
of M
orec
ambe
Bay
NH
S
Foun
datio
n Tr
ust
RLI
Roy
al L
anca
ster
Infir
mar
y23
797
.419
.473
.899
.2
Roy
al L
iver
pool
and
Bro
adgr
een
Uni
vers
ity H
ospi
tals
N
HS
Trus
tR
LUR
oyal
Liv
erpo
ol U
nive
rsity
Hos
pita
l35
597
68.7
62.5
88.4
Pen
nine
Acu
te H
ospi
tals
NH
S Tr
ust
OH
MR
oyal
Old
ham
Hos
pita
l30
446
.835
.244
.959
.9
Lanc
ashi
re T
each
ing
Hos
pita
ls N
HS
Foun
datio
n Tr
ust
RP
HR
oyal
Pre
ston
Hos
pita
l45
399
.641
.141
.599
.8
Shre
wsb
ury
and
Telfo
rd H
ospi
tals
NH
S Tr
ust
RSS
Roy
al S
hrew
sbur
y H
ospi
tal
114
100
44.7
59.4
78.2
Uni
vers
ity H
ospi
tal N
orth
Mid
land
s N
HS
trus
tST
OR
oyal
Sto
ke U
nive
rsity
Hos
pita
l14
477
.522
.235
.599
.3
Roy
al S
urre
y C
ount
y H
ospi
tal N
HS
Foun
datio
n Tr
ust
RSU
Roy
al S
urre
y C
ount
y H
ospi
tal
256
85.4
64.1
75.4
88.7
Bri
ghto
n an
d Su
ssex
Uni
vers
ity H
ospi
tals
NH
S Tr
ust
RSC
Roy
al S
usse
x C
ount
y H
ospi
tal
423
82.9
58.8
71.6
79.9
Roy
al U
nite
d H
ospi
tal B
ath
NH
S Tr
ust
BAT
Roy
al U
nite
d H
ospi
tal B
ath
444
90.7
53.8
57.4
74.1
The
Dud
ley
Gro
up N
HS
Foun
datio
n Tr
ust
RU
SR
usse
lls H
all H
ospi
tal
600
99.3
45.8
46.5
75.7
Salfo
rd R
oyal
NH
S Fo
unda
tion
Trus
tSL
FSa
lford
Roy
al
408
82.7
30.9
3688
Salis
bury
NH
S Fo
unda
tion
Trus
tSA
LSa
lisbu
ry D
istr
ict H
ospi
tal
182
83.9
6171
.489
Sand
wel
l and
Wes
t Bir
min
gham
Hos
pita
ls N
HS
Trus
tSA
NSa
ndw
ell G
ener
al H
ospi
tal
188
100
40.3
65.4
100
Trus
t nam
eN
ICO
R
hosp
ital
co
de
Hos
pita
l nam
eH
eart
failu
re
adm
issi
ons
Rec
eive
d ec
hoC
ardi
olog
y in
pati
ent
(%)
Inpu
t fro
m
cons
ulta
nt
card
iolo
gist
Inpu
t fro
m
spec
ialis
t (%
)
Engl
and
and
Wal
es
6073
790
.1%
45.7
%56
.9%
79.0
%
39National Heart Failure Audit April 2015-March 2016

40 National Heart Failure Audit April 2015-March 2016
York
Tea
chin
g H
ospi
tal N
HS
Foun
datio
n Tr
ust
SCA
Scar
boro
ugh
Gen
eral
Hos
pita
l13
87.5
38.5
69.2
92.3
Nor
ther
n Li
ncol
nshi
re a
nd G
oole
Hos
pita
ls N
HS
Foun
datio
n Tr
ust
SCU
Scun
thor
pe G
ener
al H
ospi
tal
294
90.5
3241
.253
.7
Hea
rt o
f Eng
land
NH
S Fo
unda
tion
Trus
tSO
LSo
lihul
l Hos
pita
l21
396
.765
.765
.793
Sout
h Ty
nesi
de N
HS
Foun
datio
n Tr
ust
STD
Sout
h Ty
nesi
de D
istr
ict H
ospi
tal
307
99.3
5958
.176
.6
Uni
vers
ity H
ospi
tal S
outh
ampt
on N
HS
Trus
tSG
HSo
utha
mpt
on G
ener
al H
ospi
tal
726
9233
.741
.885
.1
Sout
hend
Uni
vers
ity H
ospi
tal N
HS
Foun
datio
n Tr
ust
SEH
Sout
hend
Hos
pita
l62
785
.444
.846
.354
.9
Nor
th B
rist
ol N
HS
Trus
tB
SMSo
uthm
ead
Hos
pita
l48
274
.540
.549
58.4
Sout
hpor
t and
Orm
skir
k H
ospi
tal N
HS
Trus
tSO
USo
uthp
ort a
nd F
orm
by D
istr
ict
Gen
eral
Hos
pita
l28
181
.924
.249
.172
.2
Bar
ts H
ealt
h N
HS
Trus
tSB
HSt
Bar
thol
omew
’s H
ospi
tal
120
100
98.3
99.2
100
St G
eorg
e's
Hea
lthc
are
NH
S Tr
ust
GEO
St G
eorg
e's
Hos
pita
l42
397
.635
.844
.276
.1
Epso
m a
nd S
t Hel
ier
Uni
vers
ity H
ospi
tals
NH
S Tr
ust
SHC
St H
elie
r H
ospi
tal
163
80.4
27.8
35.8
78.6
Impe
rial
Col
lege
Hea
lthc
are
NH
S Tr
ust
STM
St M
ary'
s H
ospi
tal P
addi
ngto
n11
510
03.
56.
199
.1
Isle
of W
ight
NH
S P
CT
IOW
St M
ary'
s H
ospi
tal,
New
port
6789
.642
.456
.461
.8
Ash
ford
and
St P
eter
's H
ospi
tals
NH
S Tr
ust
SPH
St P
eter
's H
ospi
tal
539
95.8
4353
.671
.8
Wes
tern
Sus
sex
Hos
pita
ls N
HS
Trus
tST
RSt
Ric
hard
's H
ospi
tal
228
94.7
64.5
76.3
94.3
Guy
's a
nd S
t Tho
mas
' NH
S Fo
unda
tion
Trus
tST
HSt
Tho
mas
' Hos
pita
l50
299
.845
.461
.892
.4
Stoc
kpor
t NH
S Fo
unda
tion
Trus
tSH
HSt
eppi
ng H
ill H
ospi
tal
488
86.6
31.8
61.6
76
Buc
king
ham
shir
e H
ealt
hcar
e N
HS
Trus
tSM
VSt
oke
Man
devi
lle H
ospi
tal
9998
14.3
20.9
82.4
City
Hos
pita
ls S
unde
rlan
d N
HS
Foun
datio
n Tr
ust
SUN
Sund
erla
nd R
oyal
Hos
pita
l38
799
.744
.247
.994
.5
Tam
esid
e H
ospi
tal N
HS
Foun
datio
n Tr
ust
TGA
Tam
esid
e G
ener
al H
ospi
tal
198
83.9
46.6
63.5
77.6
Bar
ts H
ealt
h N
HS
Trus
tLC
HTh
e Lo
ndon
Che
st H
ospi
tal
2010
010
010
010
0
Bar
ts H
ealt
h N
HS
Trus
tLO
NTh
e R
oyal
Hos
pita
l Lon
don
239
93.7
48.7
73.1
76.9
York
Tea
chin
g H
ospi
tal N
HS
Foun
datio
n Tr
ust
YDH
The
York
Hos
pita
l34
397
.721
.341
.156
Sout
h D
evon
Hea
lthc
are
NH
S Fo
unda
tion
Trus
tTO
RTo
rbay
Hos
pita
l56
881
.142
.543
.785
.4
Cen
tral
Man
ches
ter
Uni
vers
ity H
ospi
tals
NH
S
Foun
datio
n Tr
ust
TRA
Traf
ford
Gen
eral
Hos
pita
l58
83.9
047
.447
.4
Mai
dsto
ne a
nd T
unbr
idge
Wel
ls N
HS
Trus
tK
SXTu
nbri
dge
Wel
ls H
ospi
tal
223
100
63.2
85.9
100
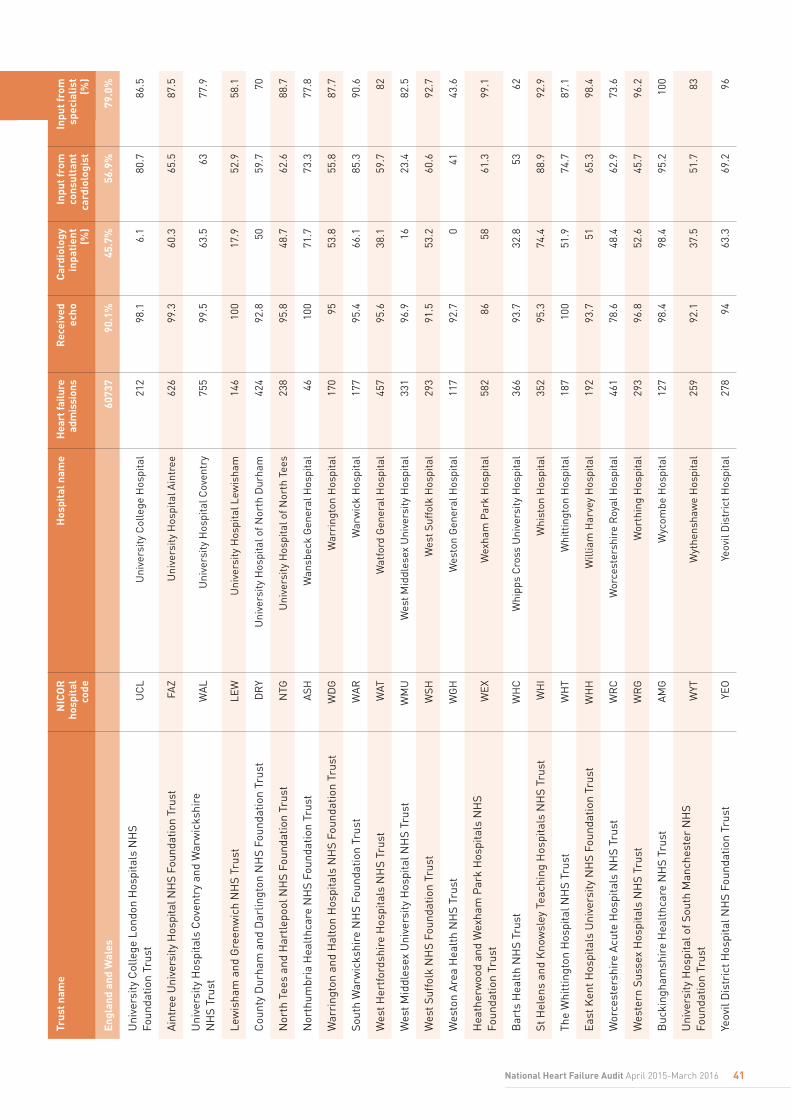
Uni
vers
ity C
olle
ge L
ondo
n H
ospi
tals
NH
S
Foun
datio
n Tr
ust
UC
LU
nive
rsity
Col
lege
Hos
pita
l21
298
.16.
180
.786
.5
Aint
ree
Uni
vers
ity H
ospi
tal N
HS
Foun
datio
n Tr
ust
FAZ
Uni
vers
ity H
ospi
tal A
intr
ee62
699
.360
.365
.587
.5
Uni
vers
ity H
ospi
tals
Cov
entr
y an
d W
arw
icks
hire
N
HS
Trus
tW
AL
Uni
vers
ity H
ospi
tal C
oven
try
755
99.5
63.5
6377
.9
Lew
isha
m a
nd G
reen
wic
h N
HS
Trus
tLE
WU
nive
rsity
Hos
pita
l Lew
isha
m14
610
017
.952
.958
.1
Cou
nty
Dur
ham
and
Dar
lingt
on N
HS
Foun
datio
n Tr
ust
DR
YU
nive
rsity
Hos
pita
l of N
orth
Dur
ham
424
92.8
5059
.770
Nor
th T
ees
and
Har
tlepo
ol N
HS
Foun
datio
n Tr
ust
NTG
Uni
vers
ity H
ospi
tal o
f Nor
th T
ees
238
95.8
48.7
62.6
88.7
Nor
thum
bria
Hea
lthc
are
NH
S Fo
unda
tion
Trus
tA
SHW
ansb
eck
Gen
eral
Hos
pita
l46
100
71.7
73.3
77.8
War
ring
ton
and
Hal
ton
Hos
pita
ls N
HS
Foun
datio
n Tr
ust
WD
GW
arri
ngto
n H
ospi
tal
170
9553
.855
.887
.7
Sout
h W
arw
icks
hire
NH
S Fo
unda
tion
Trus
t W
AR
War
wic
k H
ospi
tal
177
95.4
66.1
85.3
90.6
Wes
t Her
tfor
dshi
re H
ospi
tals
NH
S Tr
ust
WAT
Wat
ford
Gen
eral
Hos
pita
l45
795
.638
.159
.782
Wes
t Mid
dles
ex U
nive
rsity
Hos
pita
l NH
S Tr
ust
WM
UW
est M
iddl
esex
Uni
vers
ity H
ospi
tal
331
96.9
1623
.482
.5
Wes
t Suf
folk
NH
S Fo
unda
tion
Trus
tW
SHW
est S
uffo
lk H
ospi
tal
293
91.5
53.2
60.6
92.7
Wes
ton
Are
a H
ealt
h N
HS
Trus
tW
GH
Wes
ton
Gen
eral
Hos
pita
l11
792
.70
4143
.6
Hea
ther
woo
d an
d W
exha
m P
ark
Hos
pita
ls N
HS
Foun
datio
n Tr
ust
WEX
Wex
ham
Par
k H
ospi
tal
582
8658
61.3
99.1
Bar
ts H
ealt
h N
HS
Trus
tW
HC
Whi
pps
Cro
ss U
nive
rsity
Hos
pita
l36
693
.732
.853
62
St H
elen
s an
d K
now
sley
Tea
chin
g H
ospi
tals
NH
S Tr
ust
WH
IW
hist
on H
ospi
tal
352
95.3
74.4
88.9
92.9
The
Whi
ttin
gton
Hos
pita
l NH
S Tr
ust
WH
TW
hitt
ingt
on H
ospi
tal
187
100
51.9
74.7
87.1
East
Ken
t Hos
pita
ls U
nive
rsity
NH
S Fo
unda
tion
Trus
tW
HH
Will
iam
Har
vey
Hos
pita
l19
293
.751
65.3
98.4
Wor
cest
ersh
ire
Acu
te H
ospi
tals
NH
S Tr
ust
WR
CW
orce
ster
shir
e R
oyal
Hos
pita
l46
178
.648
.462
.973
.6
Wes
tern
Sus
sex
Hos
pita
ls N
HS
Trus
tW
RG
Wor
thin
g H
ospi
tal
293
96.8
52.6
45.7
96.2
Buc
king
ham
shir
e H
ealt
hcar
e N
HS
Trus
tA
MG
Wyc
ombe
Hos
pita
l12
798
.498
.495
.210
0
Uni
vers
ity H
ospi
tal o
f Sou
th M
anch
este
r N
HS
Fo
unda
tion
Trus
tW
YTW
ythe
nsha
we
Hos
pita
l25
992
.137
.551
.783
Yeov
il D
istr
ict H
ospi
tal N
HS
Foun
datio
n Tr
ust
YEO
Yeov
il D
istr
ict H
ospi
tal
278
9463
.369
.296
Trus
t nam
eN
ICO
R
hosp
ital
co
de
Hos
pita
l nam
eH
eart
failu
re
adm
issi
ons
Rec
eive
d ec
hoC
ardi
olog
y in
pati
ent
(%)
Inpu
t fro
m
cons
ulta
nt
card
iolo
gist
Inpu
t fro
m
spec
ialis
t (%
)
Engl
and
and
Wal
es
6073
790
.1%
45.7
%56
.9%
79.0
%
41National Heart Failure Audit April 2015-March 2016

42 National Heart Failure Audit April 2015-March 2016
NH
S Tr
ust
NIC
OR
Hos
pita
l co
de
Hos
pita
l nam
eH
eart
Fai
lure
ad
mis
sion
s AC
EI o
n di
scha
rge
(%)
ACEI
/AR
B o
n di
scha
rge
(%)
Bet
a bl
ocke
r on
di
scha
rge
(%)
MR
A on
di
scha
rge
(%)
Rec
eive
d di
scha
rge
plan
ning
(%
)
Ref
erra
l to
HF
nurs
e fo
llow
up
(%)
Ref
erra
l to
HF
nurs
e fo
llow
up
(LVS
D o
nly)
(%)
Ref
erra
l to
card
iolo
gy
follo
w-u
p
Ref
erra
l to
car
diac
re
habi
litat
ion
(%)
Engl
and
and
Wal
es60
737
61.1
%73
.7%
80.4
%45
.4%
87.3
0%54
.80%
70.8
0%47
.20%
12.1
0%
Cam
brid
ge U
nive
rsity
H
ospi
tals
NH
S
Foun
datio
n Tr
ust
AD
DA
dden
broo
ke's
H
ospi
tal
495
84.4
93.5
96.1
92.1
85.8
63.6
72.2
29.6
34.6
Air
edal
e N
HS
Fo
unda
tion
Trus
tA
IRA
ired
ale
Gen
eral
H
ospi
tal
265
69.1
87.1
86.8
46.7
52.5
28.7
48.5
29.5
7
Wor
cest
ersh
ire
Acu
te
Hos
pita
ls N
HS
Trus
tR
EDA
lexa
ndra
Hos
pita
l31
560
.783
.678
53.6
99.7
43.8
67.3
56.7
2.8
Wir
ral U
nive
rsity
Te
achi
ng H
ospi
tal N
HS
Foun
datio
n Tr
ust
WIR
Arr
owe
Par
k H
ospi
tal
396
78.4
90.3
91.2
68.3
100
82.5
89.9
50.3
21
Bar
net a
nd C
hase
Far
m
Hos
pita
ls N
HS
Trus
tB
NT
Bar
net G
ener
al
Hos
pita
l47
058
.384
.389
.958
.395
.135
.140
.471
.54.
6
Bar
nsle
y H
ospi
tal N
HS
Foun
datio
n Tr
ust
BA
RB
arns
ley
Hos
pita
l19
546
60.2
85.2
39.1
65.3
27.6
32.9
61.1
1.4
Bas
ildon
and
Thu
rroc
k U
nive
rsity
Hos
pita
ls N
HS
Foun
datio
n Tr
ust
BA
SB
asild
on U
nive
rsity
H
ospi
tal
410
63.9
74.3
85.5
4097
.446
.451
.746
.24
Ham
pshi
re H
ospi
tals
NH
S Fo
unda
tion
Trus
tN
HH
Bas
ings
toke
and
N
orth
Ham
pshi
re
Hos
pita
l16
978
.383
.679
.253
.777
.439
43.8
14.7
2.5
Don
cast
er a
nd
Bas
setl
aw H
ospi
tals
NH
S Fo
unda
tion
Trus
tB
SLB
asse
tlaw
Hos
pita
l75
63.8
79.2
84.9
55.8
92.2
65.6
72.5
77.3
23.6
Bed
ford
Hos
pita
l N
HS
Trus
tB
EDB
edfo
rd H
ospi
tal
247
82.8
93.1
93.4
59.4
99.5
29.2
33.1
72.6
9.3
Sand
wel
l and
Wes
t B
irm
ingh
am H
ospi
tals
N
HS
Trus
tD
UD
Bir
min
gham
City
H
ospi
tal
446
96.1
9796
.787
93.6
54.7
59.2
75.9
28.6
Hea
rt o
f Eng
land
NH
S Fo
unda
tion
Trus
tEB
HB
irm
ingh
am
Hea
rtla
nds
Hos
pita
l31
558
.575
.377
.145
.299
.371
.787
.541
.51.
1
Tabl
e D
: Tre
atm
ent a
nd m
anag
emen
t on
disc
harg
e in
Eng
land

Bla
ckpo
ol T
each
ing
Hos
pita
ls N
HS
Fo
unda
tion
Trus
tVI
CB
lack
pool
Vic
tori
a H
ospi
tal
132
69.4
87.5
93.4
32.5
100
93.4
93.4
94.7
20
Bra
dfor
d Te
achi
ng
Hos
pita
ls N
HS
Fo
unda
tion
Trus
tB
RD
Bra
dfor
d R
oyal
In
firm
ary
294
51.4
67.3
71.4
50.4
83.8
24.5
38.5
40.4
2.4
Uni
vers
ity H
ospi
tals
B
rist
ol N
HS
Fo
unda
tion
Trus
tB
RI
Bri
stol
Roy
al
Infir
mar
y37
081
.790
.788
.760
97.6
58.3
52.5
49.1
24
Mid
Ess
ex H
ospi
tal
Serv
ices
NH
S Tr
ust
BFH
Bro
omfie
ld H
ospi
tal
513
75.3
95.1
96.2
42.6
90.8
85.9
95.5
43.3
21.4
Cal
derd
ale
and
Hud
ders
field
NH
S Fo
unda
tion
Trus
tR
HI
Cal
derd
ale
Roy
al
Hos
pita
l29
264
.679
.886
.462
.197
.340
.857
.860
.826
.1
Hul
l and
Eas
t Yor
kshi
re
Hos
pita
ls N
HS
Trus
tC
HH
Cas
tle H
ill H
ospi
tal
353
75.7
80.1
83.1
56.7
91.7
51.8
61.1
91.5
15.9
Lond
on N
orth
Wes
t H
ealt
hcar
e N
HS
Trus
tC
MH
Cen
tral
Mid
dles
ex
Hos
pita
l35
4050
81.8
45.5
94.3
16.7
27.3
19.4
0
Impe
rial
Col
lege
H
ealt
hcar
e N
HS
Trus
tC
CH
Cha
ring
Cro
ss
Hos
pita
l13
896
.697
.693
.360
.510
034
.654
.959
.411
.2
Che
lsea
and
Wes
tmin
ster
H
ospi
tal N
HS
Fo
unda
tion
Trus
tW
ESC
hels
ea a
nd
Wes
tmin
ster
H
ospi
tal
145
58.3
83.1
75.9
34.5
63.2
49.6
59.8
73.8
2.5
Glo
uces
ters
hire
Hos
pita
ls
NH
S Fo
unda
tion
Trus
tC
HG
Che
lten
ham
G
ener
al H
ospi
tal
140
94.4
95.7
100
9084
.313
.735
.318
.80
Che
ster
field
Roy
al
Hos
pita
l NH
S
Foun
datio
n Tr
ust
CH
EC
hest
erfie
ld R
oyal
H
ospi
tal
7772
76.9
83.3
62.1
98.5
52.2
64.5
20.9
0
Lanc
ashi
re T
each
ing
Hos
pita
ls N
HS
Fo
unda
tion
Trus
tC
HO
Cho
rley
and
Sou
th
Rib
ble
Hos
pita
l24
472
.290
.496
.153
.210
096
97.4
68.3
11.4
NH
S Tr
ust
NIC
OR
Hos
pita
l co
de
Hos
pita
l nam
eH
eart
Fai
lure
ad
mis
sion
s (n
)
ACEI
on
disc
harg
e (%
)
ACEI
/AR
B o
n di
scha
rge
(%)
Bet
a bl
ocke
r on
di
scha
rge
(%)
MR
A on
di
scha
rge
(%)
Rec
eive
d di
scha
rge
plan
ning
(%
)
Ref
erra
l to
HF
nurs
e fo
llow
up
(%)
Ref
erra
l to
HF
nurs
e fo
llow
up
(LVS
D o
nly)
(%)
Ref
erra
l to
card
iolo
gy
follo
w-u
p
Ref
erra
l to
car
diac
re
habi
litat
ion
(%)
Engl
and
and
Wal
es60
737
61.1
%73
.7%
80.4
%45
.4%
87.3
0%54
.80%
70.8
0%47
.20%
12.1
0%
43National Heart Failure Audit April 2015-March 2016

44 National Heart Failure Audit April 2015-March 2016
Col
ches
ter
Hos
pita
l U
nive
rsity
NH
S Fo
unda
tion
Trus
tC
OL
Col
ches
ter
Gen
eral
H
ospi
tal
636
71.6
82.2
89.5
27.6
95.3
94.9
94.7
24.5
51.9
East
Sus
sex
Hea
lthc
are
NH
S Tr
ust
CG
HC
onqu
est H
ospi
tal
260
74.3
9895
.948
95.8
93.4
98.4
56.4
9.7
Cou
ntes
s of
Che
ster
H
ospi
tal N
HS
Fo
unda
tion
Trus
tC
OC
Cou
ntes
s of
C
hest
er H
ospi
tal
384
100
100
100
50.6
89.8
58.4
91.5
42.2
26.8
Uni
vers
ity H
ospi
tal N
orth
M
idla
nds
NH
S tr
ust
SDG
Cou
nty
Hos
pita
l 14
462
.877
.486
.633
.884
.762
.780
.453
.28.
4
Wye
Val
ley
NH
S Tr
ust
HC
HC
ount
y H
ospi
tal
Her
efor
d24
976
86.5
94.5
48.8
90.5
51.3
76.4
35.9
60.4
Cro
ydon
Hea
lth
Serv
ices
N
HS
Trus
tM
AYC
royd
on U
nive
rsity
H
ospi
tal
307
55.6
71.1
86.1
33.9
91.2
58.7
71.2
5247
.1
Dar
tfor
d an
d G
rave
sham
N
HS
Trus
tD
VHD
aren
t Val
ley
Hos
pita
l33
852
.882
.188
.548
.588
.342
.670
.567
.54.
2
Cou
nty
Dur
ham
and
D
arlin
gton
NH
S Fo
unda
tion
Trus
tD
AR
Dar
lingt
on
Mem
oria
l Hos
pita
l29
169
.578
.188
.572
.783
83.4
90.7
7265
.4
Ply
mou
th H
ospi
tals
N
HS
Trus
tP
LYD
erri
ford
Hos
pita
l69
457
66.7
79.2
67.5
100
100
NA
NA
NA
Mid
Yor
kshi
re H
ospi
tals
N
HS
Trus
tD
EWD
ewsb
ury
and
Dis
tric
t Hos
pita
l29
285
.692
.587
.755
.184
.561
74.8
42.7
66
Nor
ther
n Li
ncol
nshi
re
and
Goo
le H
ospi
tals
NH
S Fo
unda
tion
Trus
tG
GH
Dia
na P
rinc
ess
of
Wal
es H
ospi
tal
212
79.2
98.6
87.8
52.8
62.2
32.8
5065
.32.
1
Don
cast
er a
nd B
asse
tlaw
H
ospi
tals
NH
S
Foun
datio
n Tr
ust
DID
Don
cast
er R
oyal
In
firm
ary
254
68.4
87.8
78.8
42.2
96.2
81.1
85.8
84.5
24.7
Dor
set C
ount
y H
ospi
tal
NH
S Fo
unda
tion
Trus
tW
DH
Dor
set C
ount
y H
ospi
tal
212
82.6
91.8
95.4
72.5
99.5
60.1
73.5
43.5
0.7
Lond
on N
orth
Wes
t H
ealt
hcar
e N
HS
Trus
tEA
LEa
ling
Hos
pita
l23
060
.874
.787
.553
.890
.414
.615
.756
.34.
6
Surr
ey a
nd S
usse
x H
ealt
hcar
e N
HS
Trus
tES
UEa
st S
urre
y H
ospi
tal
338
98.1
98.6
98.8
98.6
91.5
70.4
79.2
63.4
1.1
East
Sus
sex
Hea
lthc
are
NH
S Tr
ust
DG
EEa
stbo
urne
Dis
tric
t G
ener
al H
ospi
tal
250
68.1
90.3
90.8
44.1
82.8
80.8
93.1
60.3
8.3

45National Heart Failure Audit April 2015-March 2016
Epso
m a
nd S
t Hel
ier
Uni
vers
ity H
ospi
tals
N
HS
Trus
tEP
SEp
som
Hos
pita
l13
544
.150
94.6
64.7
89.3
4092
.151
.14.
2
Pen
nine
Acu
te H
ospi
tals
N
HS
Trus
tB
RY
Fair
field
Gen
eral
H
ospi
tal
303
50.7
61.1
83.3
25.3
89.7
36.7
48.8
22.5
0.8
The
New
cast
le U
pon
Tyne
H
ospi
tals
NH
S
Foun
datio
n Tr
ust
FRE
Free
man
Hos
pita
l an
d R
oyal
Vi
ctor
ia In
firm
ary
486
75.6
89.6
92.9
53.3
88.2
4450
.864
.81.
6
Sout
h Te
es H
ospi
tals
NH
S Fo
unda
tion
Trus
tFR
HFr
iara
ge H
ospi
tal
6472
.484
.791
.726
.798
.475
.874
.668
.334
Frim
ley
Par
k H
ospi
tal
NH
S Fo
unda
tion
Trus
tFR
MFr
imle
y P
ark
Hos
pita
l38
757
.571
.781
.662
.3N
A34
.843
.729
.91.
4
Uni
vers
ity H
ospi
tals
of
Mor
ecam
be B
ay N
HS
Foun
datio
n Tr
ust
FGH
Furn
ess
Gen
eral
H
ospi
tal
236
66.7
86.9
85.7
37.7
99.5
6784
.238
.64.
4
Geo
rge
Elio
t Hos
pita
l N
HS
Trus
tN
UN
Geo
rge
Elio
t H
ospi
tal
5675
91.3
95.8
250
2.6
064
.90
Uni
vers
ity H
ospi
tals
of
Leic
este
r N
HS
Trus
tG
RL
Gle
nfiel
d H
ospi
tal
1577
61.3
7277
.940
91.4
82.7
91.7
88.7
75.7
Glo
uces
ters
hire
Hos
pita
ls
NH
S Fo
unda
tion
Trus
tG
LOG
louc
este
rshi
re
Roy
al H
ospi
tal
244
96.2
96.7
98.5
100
8726
.354
.228
.70
Hea
rt o
f Eng
land
NH
S Fo
unda
tion
Trus
tG
HS
Goo
d H
ope
Hos
pita
l68
6381
.580
2564
.956
.170
57.9
0
Uni
ted
Linc
olns
hire
H
ospi
tals
NH
S Tr
ust
GR
AG
rant
ham
and
D
istr
ict H
ospi
tal
114
48.1
59.3
75.9
17.2
57.8
2.4
6.9
67.4
0
Gre
at W
este
rn H
ospi
tals
N
HS
Foun
datio
n Tr
ust
PM
SG
reat
Wes
tern
H
ospi
tal
454
7596
.189
74.6
96.9
34.3
5820
.31.
4
Impe
rial
Col
lege
H
ealt
hcar
e N
HS
Trus
tH
AM
Ham
mer
smith
H
ospi
tal
156
89.1
9493
.262
.710
040
.954
.371
.220
.6
Roy
al B
rom
pton
and
H
arefi
eld
NH
S
Foun
datio
n Tr
ust
HH
Har
efiel
d H
ospi
tal
189
6481
.686
.776
.691
.787
91.1
92.3
40.7
NH
S Tr
ust
NIC
OR
Hos
pita
l co
de
Hos
pita
l nam
eH
eart
Fai
lure
ad
mis
sion
s (n
)
ACEI
on
disc
harg
e (%
)
ACEI
/AR
B o
n di
scha
rge
(%)
Bet
a bl
ocke
r on
di
scha
rge
(%)
MR
A on
di
scha
rge
(%)
Rec
eive
d di
scha
rge
plan
ning
(%
)
Ref
erra
l to
HF
nurs
e fo
llow
up
(%)
Ref
erra
l to
HF
nurs
e fo
llow
up
(LVS
D o
nly)
(%)
Ref
erra
l to
card
iolo
gy
follo
w-u
p
Ref
erra
l to
car
diac
re
habi
litat
ion
(%)
Engl
and
and
Wal
es60
737
61.1
%73
.7%
80.4
%45
.4%
87.3
0%54
.80%
70.8
0%47
.20%
12.1
0%
45National Heart Failure Audit April 2015-March 2016

46 National Heart Failure Audit April 2015-March 2016
Trus
t nam
eN
ICO
R
Hos
pita
l co
de
Hos
pita
l nam
eH
ospi
tal r
ecor
ds
subm
itted
with
he
art f
ailu
re
%
AC
EI o
n di
scha
rge
%
AC
EI/
AR
B o
n di
scha
rge
% B
eta
bloc
ker
on
disc
harg
e
%
Rec
eive
d di
scha
rge
plan
ning
%
Ref
erra
l to
HF
liais
on
serv
ice
%
Ref
erra
l to
HF
liais
on
serv
ice
(LVS
D
only
)
%
Ref
erra
l to
card
iolo
gy
foll
ow-u
p
Har
roga
te a
nd D
istr
ict
NH
S Fo
unda
tion
Trus
tH
AR
Har
roga
te D
istr
ict
Hos
pita
l25
810
010
098
.510
097
.838
.260
.221
.817
.6
Nor
thum
bria
Hea
lthc
are
NH
S Fo
unda
tion
Trus
tH
EXH
exha
m G
ener
al
Hos
pita
l7
100
100
100
33.3
6033
.350
66.7
0
The
Hill
ingd
on H
ospi
tals
N
HS
Foun
datio
n Tr
ust
HIL
Hill
ingd
on H
ospi
tal
210
9698
.591
.946
.590
.554
.161
.964
.70
Hin
chin
gbro
oke
Hea
lth
Car
e N
HS
Trus
tH
INH
inch
ingb
rook
e H
ospi
tal
6593
.994
.797
.250
95.2
6077
.863
.35.
3
Hom
erto
n U
nive
rsity
H
ospi
tal N
HS
Fo
unda
tion
Trus
tH
OM
Hom
erto
n U
nive
rsity
Hos
pita
l30
651
.770
.482
.840
.772
.160
.573
.954
.934
.1
Oxf
ord
Rad
cliff
e H
ospi
tals
N
HS
Trus
tH
OR
Hor
ton
Gen
eral
H
ospi
tal
177
92.3
100
85.9
61.4
85.5
74.8
9235
.725
Cal
derd
ale
and
Hud
ders
field
NH
S Fo
unda
tion
Trus
tH
UD
Hud
ders
field
Roy
al
Infir
mar
y31
171
.689
.585
.459
.498
.245
67.2
50.3
27.3
Hul
l and
Eas
t Yor
kshi
re
Hos
pita
ls N
HS
Trus
tH
RI
Hul
l Roy
al In
firm
ary
197
52.8
61.6
79.8
27.8
95.6
4256
.664
.64.
4
The
Ipsw
ich
Hos
pita
l N
HS
Trus
tIP
SIp
swic
h H
ospi
tal
630
54.3
63.2
79.1
48.1
85.9
50.4
75.6
34.2
0.4
Sout
h Te
es H
ospi
tals
NH
S Fo
unda
tion
Trus
tSC
MJa
mes
Coo
k U
nive
rsity
Hos
pita
l37
271
84.9
91.2
3190
.289
.891
.679
.810
.5
Jam
es P
aget
Uni
vers
ity
Hos
pita
ls N
HS
Fo
unda
tion
Trus
tJP
HJa
mes
Pag
et
Uni
vers
ity H
ospi
tal
146
57.8
7582
.553
94.4
89.5
90.5
55.3
1.5
Oxf
ord
Rad
cliff
e H
ospi
tals
N
HS
Trus
tR
AD
John
Rad
cliff
e H
ospi
tal
494
91.7
99.4
88.8
79.1
8771
.786
.747
.329
.3
East
Ken
t Hos
pita
ls
Uni
vers
ity N
HS
Foun
datio
n Tr
ust
KC
CK
ent a
nd
Can
terb
ury
Hos
pita
l18
084
.992
.592
.531
.494
.969
.595
.561
.880
.2
Ket
teri
ng G
ener
al
Hos
pita
l NH
S
Foun
datio
n Tr
ust
KG
HK
ette
ring
Gen
eral
H
ospi
tal
392
73.2
78.7
90.5
6091
.368
.987
75.3
3.3
Bar
king
, Hav
erin
g an
d R
edbr
idge
Uni
vers
ity
Hos
pita
ls N
HS
Trus
tK
GG
Kin
g G
eorg
e H
ospi
tal
117
52.7
75.3
81.9
47.8
89.5
64.4
70.5
92.6
0

Trus
t nam
eN
ICO
R
Hos
pita
l co
de
Hos
pita
l nam
eH
ospi
tal r
ecor
ds
subm
itted
with
he
art f
ailu
re
%
AC
EI o
n di
scha
rge
%
AC
EI/
AR
B o
n di
scha
rge
% B
eta
bloc
ker
on
disc
harg
e
%
Rec
eive
d di
scha
rge
plan
ning
%
Ref
erra
l to
HF
liais
on
serv
ice
%
Ref
erra
l to
HF
liais
on
serv
ice
(LVS
D
only
)
%
Ref
erra
l to
card
iolo
gy
foll
ow-u
p
Kin
g's
Col
lege
Hos
pita
l N
HS
Foun
datio
n Tr
ust
KC
HK
ing'
s C
olle
ge
Hos
pita
l43
170
.785
.989
.948
.491
45.9
62.8
76.6
13.7
Sher
woo
d Fo
rest
H
ospi
tals
NH
S
Foun
datio
n Tr
ust
KM
HK
ing'
s M
ill H
ospi
tal
465
62.7
75.8
7743
.187
71.4
80.6
63.2
89.7
Kin
gsto
n H
ospi
tal
NH
S Tr
ust
KTH
Kin
gsto
n H
ospi
tal
183
100
100
100
100
87.2
42.5
60.5
67.2
24.1
Leed
s Te
achi
ng H
ospi
tals
N
HS
Trus
tLG
ILe
eds
Gen
eral
In
firm
ary
688
43.7
52.9
81.8
67.4
81.8
71.6
7551
6.1
Uni
vers
ity H
ospi
tals
of
Leic
este
r N
HS
Trus
tLE
RLe
ices
ter
Roy
al
Infir
mar
y45
433
42.1
66.5
14.8
69.1
46.8
59.4
3629
.8
Mid
Che
shir
e H
ospi
tals
N
HS
Foun
datio
n Tr
ust
LGH
Leig
hton
Hos
pita
l16
975
93.3
92.2
65.1
100
5057
.130
1.9
Uni
ted
Linc
olns
hire
H
ospi
tals
NH
S Tr
ust
LIN
Linc
oln
Cou
nty
Hos
pita
l29
353
.465
.567
38.2
97.9
30.5
47.3
39.7
2.7
East
and
Nor
th
Her
tfor
dshi
re N
HS
Trus
tLI
SLi
ster
Hos
pita
l39
067
.985
.295
.136
.899
.758
.369
.960
.138
.9
Live
rpoo
l Hea
rt a
nd
Che
st H
ospi
tal N
HS
Foun
datio
n Tr
ust
BH
LLi
verp
ool H
eart
and
C
hest
Hos
pita
l79
100
100
100
58.9
91.1
64.6
67.8
89.7
69.2
Luto
n an
d D
unst
able
H
ospi
tal N
HS
Fo
unda
tion
Trus
tLD
HLu
ton
and
Dun
stab
le H
ospi
tal
295
79.3
85.6
79.7
6698
40.4
5451
.921
.4
East
Che
shir
e N
HS
Trus
tM
ACM
accl
esfie
ld
Dis
tric
t Gen
eral
H
ospi
tal
109
61.8
73.5
86.4
28.3
76.7
5455
.467
.50
Mai
dsto
ne a
nd T
unbr
idge
W
ells
NH
S Tr
ust
MA
IM
aids
tone
Hos
pita
l20
988
.196
.893
.838
.597
.369
93.8
77.6
5.2
Cen
tral
Man
ches
ter
Uni
vers
ity H
ospi
tals
NH
S Fo
unda
tion
Trus
tM
RI
Man
ches
ter
Roy
al
Infir
mar
y28
869
.280
.488
.452
.368
.175
.287
.337
.25.
3
NH
S Tr
ust
NIC
OR
Hos
pita
l co
de
Hos
pita
l nam
eH
eart
Fai
lure
ad
mis
sion
s (n
)
ACEI
on
disc
harg
e (%
)
ACEI
/AR
B o
n di
scha
rge
(%)
Bet
a bl
ocke
r on
di
scha
rge
(%)
MR
A on
di
scha
rge
(%)
Rec
eive
d di
scha
rge
plan
ning
(%
)
Ref
erra
l to
HF
nurs
e fo
llow
up
(%)
Ref
erra
l to
HF
nurs
e fo
llow
up
(LVS
D o
nly)
(%)
Ref
erra
l to
card
iolo
gy
follo
w-u
p
Ref
erra
l to
car
diac
re
habi
litat
ion
(%)
Engl
and
and
Wal
es60
737
61.1
%73
.7%
80.4
%45
.4%
87.3
0%54
.80%
70.8
0%47
.20%
12.1
0%
47National Heart Failure Audit April 2015-March 2016
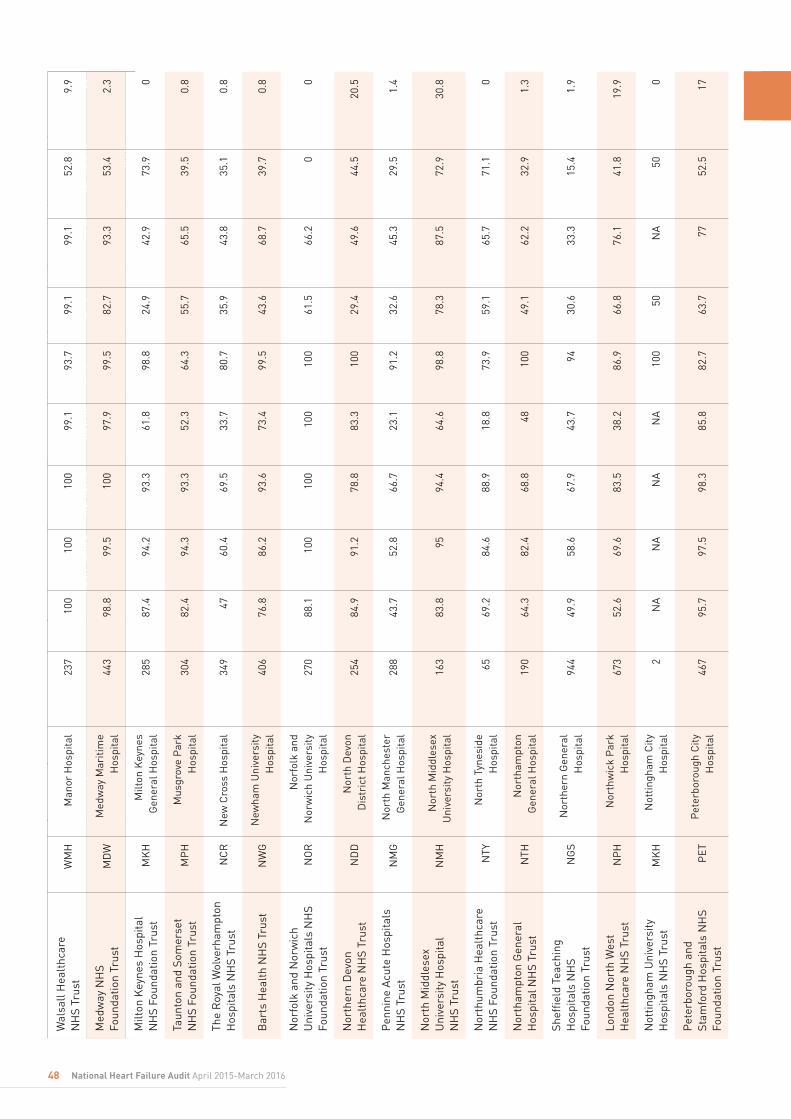
48 National Heart Failure Audit April 2015-March 2016
Trus
t nam
eN
ICO
R
Hos
pita
l co
de
Hos
pita
l nam
eH
ospi
tal r
ecor
ds
subm
itted
with
he
art f
ailu
re
%
AC
EI o
n di
scha
rge
%
AC
EI/
AR
B o
n di
scha
rge
% B
eta
bloc
ker
on
disc
harg
e
%
Rec
eive
d di
scha
rge
plan
ning
%
Ref
erra
l to
HF
liais
on
serv
ice
%
Ref
erra
l to
HF
liais
on
serv
ice
(LVS
D
only
)
%
Ref
erra
l to
card
iolo
gy
foll
ow-u
p
Wal
sall
Hea
lthc
are
N
HS
Trus
tW
MH
Man
or H
ospi
tal
237
100
100
100
99.1
93.7
99.1
99.1
52.8
9.9
Med
way
NH
S
Foun
datio
n Tr
ust
MD
WM
edw
ay M
ariti
me
Hos
pita
l44
398
.899
.510
097
.999
.582
.793
.353
.42.
3
Milt
on K
eyne
s H
ospi
tal
NH
S Fo
unda
tion
Trus
tM
KH
Milt
on K
eyne
s G
ener
al H
ospi
tal
285
87.4
94.2
93.3
61.8
98.8
24.9
42.9
73.9
0
Taun
ton
and
Som
erse
t N
HS
Foun
datio
n Tr
ust
MP
HM
usgr
ove
Par
k H
ospi
tal
304
82.4
94.3
93.3
52.3
64.3
55.7
65.5
39.5
0.8
The
Roy
al W
olve
rham
pton
H
ospi
tals
NH
S Tr
ust
NC
RN
ew C
ross
Hos
pita
l34
947
60.4
69.5
33.7
80.7
35.9
43.8
35.1
0.8
Bar
ts H
ealt
h N
HS
Trus
tN
WG
New
ham
Uni
vers
ity
Hos
pita
l40
676
.886
.293
.673
.499
.543
.668
.739
.70.
8
Nor
folk
and
Nor
wic
h U
nive
rsity
Hos
pita
ls N
HS
Foun
datio
n Tr
ust
NO
RN
orfo
lk a
nd
Nor
wic
h U
nive
rsity
H
ospi
tal
270
88.1
100
100
100
100
61.5
66.2
00
Nor
ther
n D
evon
H
ealt
hcar
e N
HS
Trus
tN
DD
Nor
th D
evon
D
istr
ict H
ospi
tal
254
84.9
91.2
78.8
83.3
100
29.4
49.6
44.5
20.5
Pen
nine
Acu
te H
ospi
tals
N
HS
Trus
tN
MG
Nor
th M
anch
este
r G
ener
al H
ospi
tal
288
43.7
52.8
66.7
23.1
91.2
32.6
45.3
29.5
1.4
Nor
th M
iddl
esex
U
nive
rsity
Hos
pita
l N
HS
Trus
tN
MH
Nor
th M
iddl
esex
U
nive
rsity
Hos
pita
l16
383
.895
94.4
64.6
98.8
78.3
87.5
72.9
30.8
Nor
thum
bria
Hea
lthc
are
NH
S Fo
unda
tion
Trus
tN
TYN
orth
Tyn
esid
e H
ospi
tal
6569
.284
.688
.918
.873
.959
.165
.771
.10
Nor
tham
pton
Gen
eral
H
ospi
tal N
HS
Trus
tN
THN
orth
ampt
on
Gen
eral
Hos
pita
l19
064
.382
.468
.848
100
49.1
62.2
32.9
1.3
Shef
field
Tea
chin
g H
ospi
tals
NH
S
Foun
datio
n Tr
ust
NG
SN
orth
ern
Gen
eral
H
ospi
tal
944
49.9
58.6
67.9
43.7
9430
.633
.315
.41.
9
Lond
on N
orth
Wes
t H
ealt
hcar
e N
HS
Trus
tN
PH
Nor
thw
ick
Par
k H
ospi
tal
673
52.6
69.6
83.5
38.2
86.9
66.8
76.1
41.8
19.9
Not
tingh
am U
nive
rsity
H
ospi
tals
NH
S Tr
ust
MK
HN
ottin
gham
City
H
ospi
tal
2N
AN
AN
AN
A10
050
NA
500
Pet
erbo
roug
h an
d St
amfo
rd H
ospi
tals
NH
S Fo
unda
tion
Trus
tP
ETP
eter
boro
ugh
City
H
ospi
tal
467
95.7
97.5
98.3
85.8
82.7
63.7
7752
.517
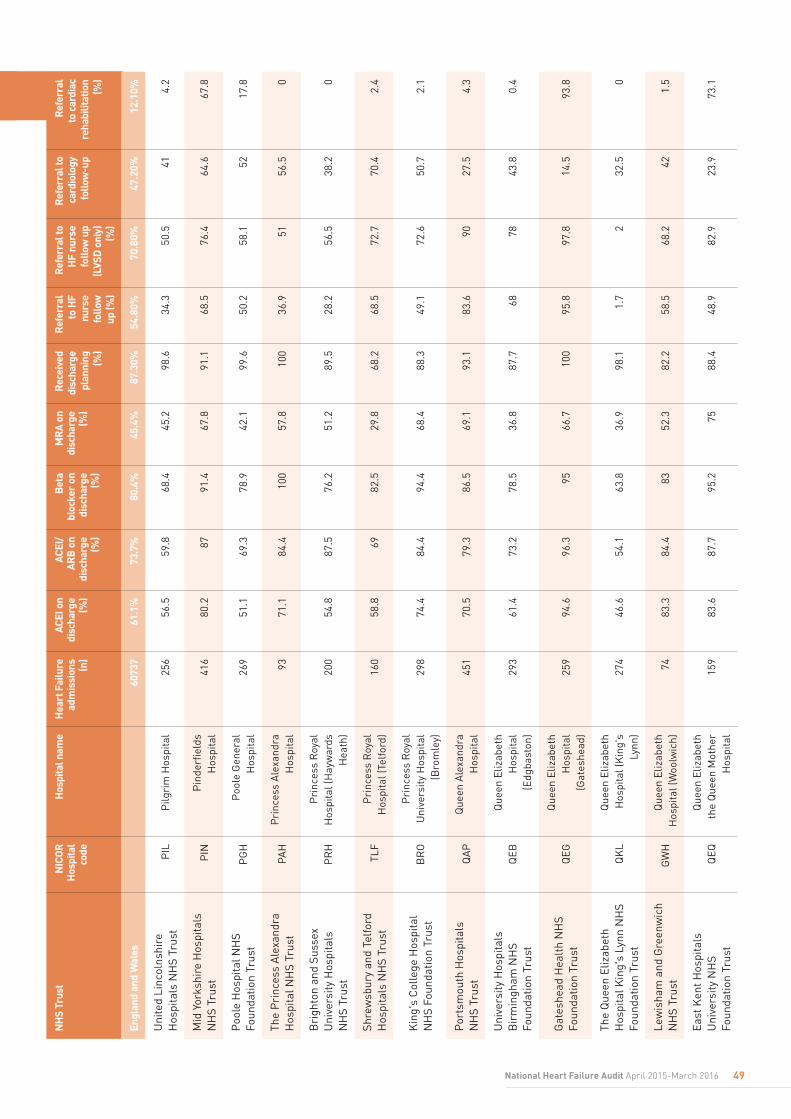
Uni
ted
Linc
olns
hire
H
ospi
tals
NH
S Tr
ust
PIL
Pilg
rim
Hos
pita
l25
656
.559
.868
.445
.298
.634
.350
.541
4.2
Mid
Yor
kshi
re H
ospi
tals
N
HS
Trus
tP
INP
inde
rfiel
ds
Hos
pita
l41
680
.287
91.4
67.8
91.1
68.5
76.4
64.6
67.8
Poo
le H
ospi
tal N
HS
Foun
datio
n Tr
ust
PG
HP
oole
Gen
eral
H
ospi
tal
269
51.1
69.3
78.9
42.1
99.6
50.2
58.1
5217
.8
The
Pri
nces
s A
lexa
ndra
H
ospi
tal N
HS
Trus
tPA
HP
rinc
ess
Ale
xand
ra
Hos
pita
l93
71.1
84.4
100
57.8
100
36.9
5156
.50
Bri
ghto
n an
d Su
ssex
U
nive
rsity
Hos
pita
ls
NH
S Tr
ust
PR
HP
rinc
ess
Roy
al
Hos
pita
l (H
ayw
ards
H
eath
)20
054
.887
.576
.251
.289
.528
.256
.538
.20
Shre
wsb
ury
and
Telfo
rd
Hos
pita
ls N
HS
Trus
tTL
FP
rinc
ess
Roy
al
Hos
pita
l (Te
lford
)16
058
.869
82.5
29.8
68.2
68.5
72.7
70.4
2.4
Kin
g's
Col
lege
Hos
pita
l N
HS
Foun
datio
n Tr
ust
BR
OP
rinc
ess
Roy
al
Uni
vers
ity H
ospi
tal
(Bro
mle
y)29
874
.484
.494
.468
.488
.349
.172
.650
.72.
1
Por
tsm
outh
Hos
pita
ls
NH
S Tr
ust
QA
PQ
ueen
Ale
xand
ra
Hos
pita
l45
170
.579
.386
.569
.193
.183
.690
27.5
4.3
Uni
vers
ity H
ospi
tals
B
irm
ingh
am N
HS
Foun
datio
n Tr
ust
QEB
Que
en E
lizab
eth
Hos
pita
l (E
dgba
ston
)29
361
.473
.278
.536
.887
.768
7843
.80.
4
Gat
eshe
ad H
ealt
h N
HS
Foun
datio
n Tr
ust
QEG
Que
en E
lizab
eth
Hos
pita
l (G
ates
head
)25
994
.696
.395
66.7
100
95.8
97.8
14.5
93.8
The
Que
en E
lizab
eth
Hos
pita
l Kin
g's
Lynn
NH
S Fo
unda
tion
Trus
tQ
KL
Que
en E
lizab
eth
Hos
pita
l (K
ing'
s Ly
nn)
274
46.6
54.1
63.8
36.9
98.1
1.7
232
.50
Lew
isha
m a
nd G
reen
wic
h N
HS
Trus
tG
WH
Que
en E
lizab
eth
Hos
pita
l (W
oolw
ich)
7483
.384
.483
52.3
82.2
58.5
68.2
421.
5
East
Ken
t Hos
pita
ls
Uni
vers
ity N
HS
Foun
datio
n Tr
ust
QEQ
Que
en E
lizab
eth
the
Que
en M
othe
r H
ospi
tal
159
83.6
87.7
95.2
7588
.448
.982
.923
.973
.1
NH
S Tr
ust
NIC
OR
Hos
pita
l co
de
Hos
pita
l nam
eH
eart
Fai
lure
ad
mis
sion
s (n
)
ACEI
on
disc
harg
e (%
)
ACEI
/AR
B o
n di
scha
rge
(%)
Bet
a bl
ocke
r on
di
scha
rge
(%)
MR
A on
di
scha
rge
(%)
Rec
eive
d di
scha
rge
plan
ning
(%
)
Ref
erra
l to
HF
nurs
e fo
llow
up
(%)
Ref
erra
l to
HF
nurs
e fo
llow
up
(LVS
D o
nly)
(%)
Ref
erra
l to
card
iolo
gy
follo
w-u
p
Ref
erra
l to
car
diac
re
habi
litat
ion
(%)
Engl
and
and
Wal
es60
737
61.1
%73
.7%
80.4
%45
.4%
87.3
0%54
.80%
70.8
0%47
.20%
12.1
0%
49National Heart Failure Audit April 2015-March 2016

50 National Heart Failure Audit April 2015-March 2016
Trus
t nam
eN
ICO
R
Hos
pita
l co
de
Hos
pita
l nam
eH
ospi
tal r
ecor
ds
subm
itted
with
he
art f
ailu
re
%
AC
EI o
n di
scha
rge
%
AC
EI/
AR
B o
n di
scha
rge
% B
eta
bloc
ker
on
disc
harg
e
%
Rec
eive
d di
scha
rge
plan
ning
%
Ref
erra
l to
HF
liais
on
serv
ice
%
Ref
erra
l to
HF
liais
on
serv
ice
(LVS
D
only
)
%
Ref
erra
l to
card
iolo
gy
foll
ow-u
p
Bur
ton
Hos
pita
ls N
HS
Foun
datio
n Tr
ust
BR
TQ
ueen
's H
ospi
tal
(Bur
ton)
296
79.1
83.2
90.7
7886
.457
.667
.250
.917
.5
Bar
king
, Hav
erin
g an
d R
edbr
idge
Uni
vers
ity
Hos
pita
ls N
HS
Trus
tO
LDQ
ueen
's H
ospi
tal
Rom
ford
288
61.3
75.6
85.2
62.9
76.9
7380
.459
.710
.5
Not
tingh
am U
nive
rsity
H
ospi
tals
NH
S Tr
ust
NM
GQ
ueen
's M
edic
al
Cen
tre
518
100
100
100
96.3
77.1
24.3
30.5
15.4
0
Pen
nine
Acu
te H
ospi
tals
N
HS
Trus
tB
HH
Roc
hdal
e In
firm
ary
4410
010
075
7595
.156
.171
.417
.10
Rot
herh
am N
HS
Foun
datio
n Tr
ust
RO
TR
othe
rham
Hos
pita
l26
248
.659
.377
.540
.899
53.6
5922
.70.
5
Wri
ghtin
gton
, Wig
an
and
Leig
h N
HS
Foun
datio
n Tr
ust
AEI
Roy
al A
lber
t Ed
war
d In
firm
ary
442
94.2
99.3
99.7
65.2
97.1
80.2
86.7
75.6
29.4
Roy
al B
erks
hire
NH
S Fo
unda
tion
Trus
tB
HR
Roy
al B
erks
hire
H
ospi
tal
373
74.4
81.8
91.7
58.8
86.3
76.6
8750
.92.
5
East
Lan
cash
ire
Hos
pita
ls
NH
S Tr
ust
BLA
Roy
al B
lack
burn
H
ospi
tal
395
77.5
94.7
95.6
53.3
72.9
57.3
6569
.92.
1
Bol
ton
NH
S
Foun
datio
n Tr
ust
BO
LR
oyal
Bol
ton
Hos
pita
l17
792
.594
.998
.676
.497
.138
.855
.169
.94.
2
The
Roy
al B
ourn
emou
th
and
Chr
istc
hurc
h H
ospi
tals
NH
S
Foun
datio
n Tr
ust
BO
UR
oyal
Bou
rnem
outh
G
ener
al H
ospi
tal
412
95.4
97.9
94.1
85.6
98.6
5668
5217
.2
Roy
al B
rom
pton
and
H
arefi
eld
NH
S
Foun
datio
n Tr
ust
NH
BR
oyal
Bro
mpt
on
Hos
pita
l17
460
.988
.290
.973
.596
.353
.573
.893
.83.
3
Roy
al C
ornw
all H
ospi
tals
N
HS
Trus
tR
CH
Roy
al C
ornw
all
Hos
pita
l42
742
.458
.380
.134
.155
.551
.759
.653
.149
.3
Der
by H
ospi
tals
NH
S Fo
unda
tion
Trus
tD
ERR
oyal
Der
by
Hos
pita
l50
156
.461
.577
.213
.686
.935
.950
.625
.93.
6
Roy
al D
evon
and
Exe
ter
NH
S Fo
unda
tion
Trus
tR
DE
Roy
al D
evon
&
Exet
er H
ospi
tal
410
85.8
90.7
79.6
46.6
63.9
16.2
25.2
30.8
4.1
Roy
al F
ree
Lond
on
NH
S Tr
ust
RFH
Roy
al F
ree
Hos
pita
l30
363
.886
.888
.650
.480
.216
.927
37.8
2.6
Ham
pshi
re H
ospi
tals
NH
S Fo
unda
tion
Trus
tR
HC
Roy
al H
amps
hire
C
ount
y H
ospi
tal
146
73.3
77.8
80.4
44.4
74.3
46.8
58.1
31.2
1
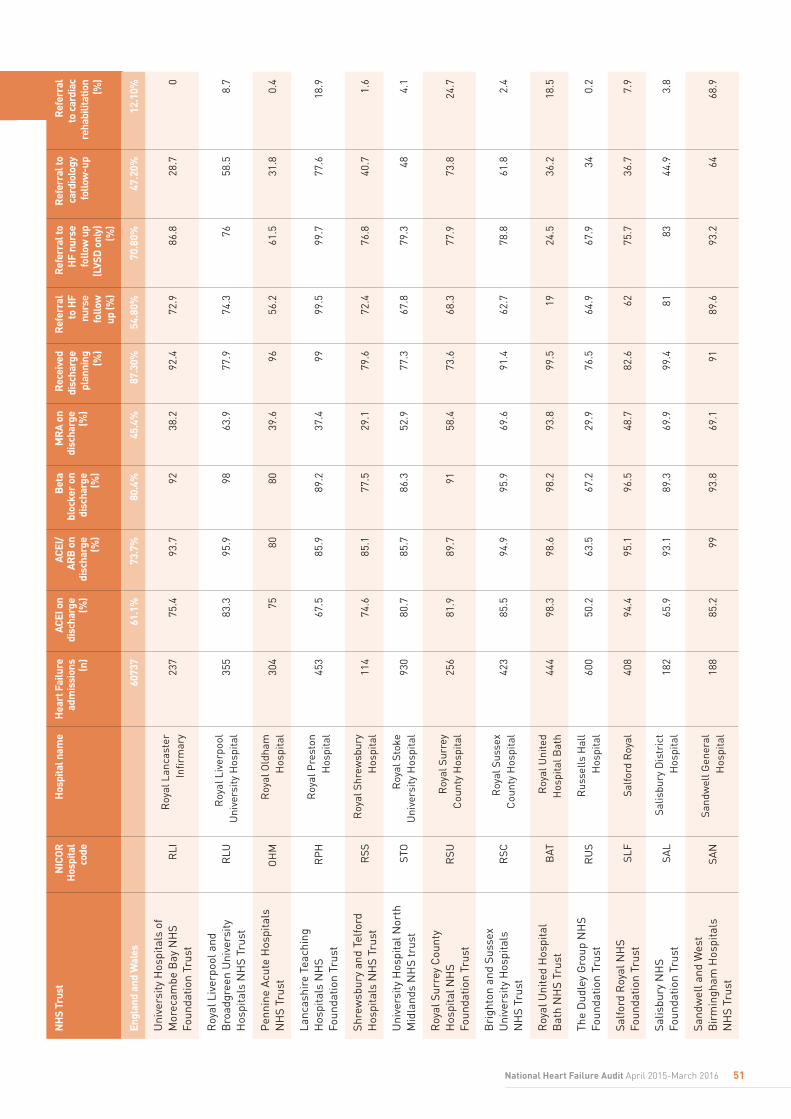
Uni
vers
ity H
ospi
tals
of
Mor
ecam
be B
ay N
HS
Foun
datio
n Tr
ust
RLI
Roy
al L
anca
ster
In
firm
ary
237
75.4
93.7
9238
.292
.472
.986
.828
.70
Roy
al L
iver
pool
and
B
road
gree
n U
nive
rsity
H
ospi
tals
NH
S Tr
ust
RLU
Roy
al L
iver
pool
U
nive
rsity
Hos
pita
l35
583
.395
.998
63.9
77.9
74.3
7658
.58.
7
Pen
nine
Acu
te H
ospi
tals
N
HS
Trus
tO
HM
Roy
al O
ldha
m
Hos
pita
l30
475
8080
39.6
9656
.261
.531
.80.
4
Lanc
ashi
re T
each
ing
Hos
pita
ls N
HS
Fo
unda
tion
Trus
tR
PH
Roy
al P
rest
on
Hos
pita
l45
367
.585
.989
.237
.499
99.5
99.7
77.6
18.9
Shre
wsb
ury
and
Telfo
rd
Hos
pita
ls N
HS
Trus
tR
SSR
oyal
Shr
ewsb
ury
Hos
pita
l11
474
.685
.177
.529
.179
.672
.476
.840
.71.
6
Uni
vers
ity H
ospi
tal N
orth
M
idla
nds
NH
S tr
ust
STO
Roy
al S
toke
U
nive
rsity
Hos
pita
l93
080
.785
.786
.352
.977
.367
.879
.348
4.1
Roy
al S
urre
y C
ount
y H
ospi
tal N
HS
Fo
unda
tion
Trus
tR
SUR
oyal
Sur
rey
Cou
nty
Hos
pita
l25
681
.989
.791
58.4
73.6
68.3
77.9
73.8
24.7
Bri
ghto
n an
d Su
ssex
U
nive
rsity
Hos
pita
ls
NH
S Tr
ust
RSC
Roy
al S
usse
x C
ount
y H
ospi
tal
423
85.5
94.9
95.9
69.6
91.4
62.7
78.8
61.8
2.4
Roy
al U
nite
d H
ospi
tal
Bat
h N
HS
Trus
tB
ATR
oyal
Uni
ted
Hos
pita
l Bat
h44
498
.398
.698
.293
.899
.519
24.5
36.2
18.5
The
Dud
ley
Gro
up N
HS
Foun
datio
n Tr
ust
RU
SR
usse
lls H
all
Hos
pita
l60
050
.263
.567
.229
.976
.564
.967
.934
0.2
Salfo
rd R
oyal
NH
S Fo
unda
tion
Trus
tSL
FSa
lford
Roy
al
408
94.4
95.1
96.5
48.7
82.6
6275
.736
.77.
9
Salis
bury
NH
S
Foun
datio
n Tr
ust
SAL
Salis
bury
Dis
tric
t H
ospi
tal
182
65.9
93.1
89.3
69.9
99.4
8183
44.9
3.8
Sand
wel
l and
Wes
t B
irm
ingh
am H
ospi
tals
N
HS
Trus
tSA
NSa
ndw
ell G
ener
al
Hos
pita
l18
885
.299
93.8
69.1
9189
.693
.264
68.9
NH
S Tr
ust
NIC
OR
Hos
pita
l co
de
Hos
pita
l nam
eH
eart
Fai
lure
ad
mis
sion
s (n
)
ACEI
on
disc
harg
e (%
)
ACEI
/AR
B o
n di
scha
rge
(%)
Bet
a bl
ocke
r on
di
scha
rge
(%)
MR
A on
di
scha
rge
(%)
Rec
eive
d di
scha
rge
plan
ning
(%
)
Ref
erra
l to
HF
nurs
e fo
llow
up
(%)
Ref
erra
l to
HF
nurs
e fo
llow
up
(LVS
D o
nly)
(%)
Ref
erra
l to
card
iolo
gy
follo
w-u
p
Ref
erra
l to
car
diac
re
habi
litat
ion
(%)
Engl
and
and
Wal
es60
737
61.1
%73
.7%
80.4
%45
.4%
87.3
0%54
.80%
70.8
0%47
.20%
12.1
0%
51National Heart Failure Audit April 2015-March 2016
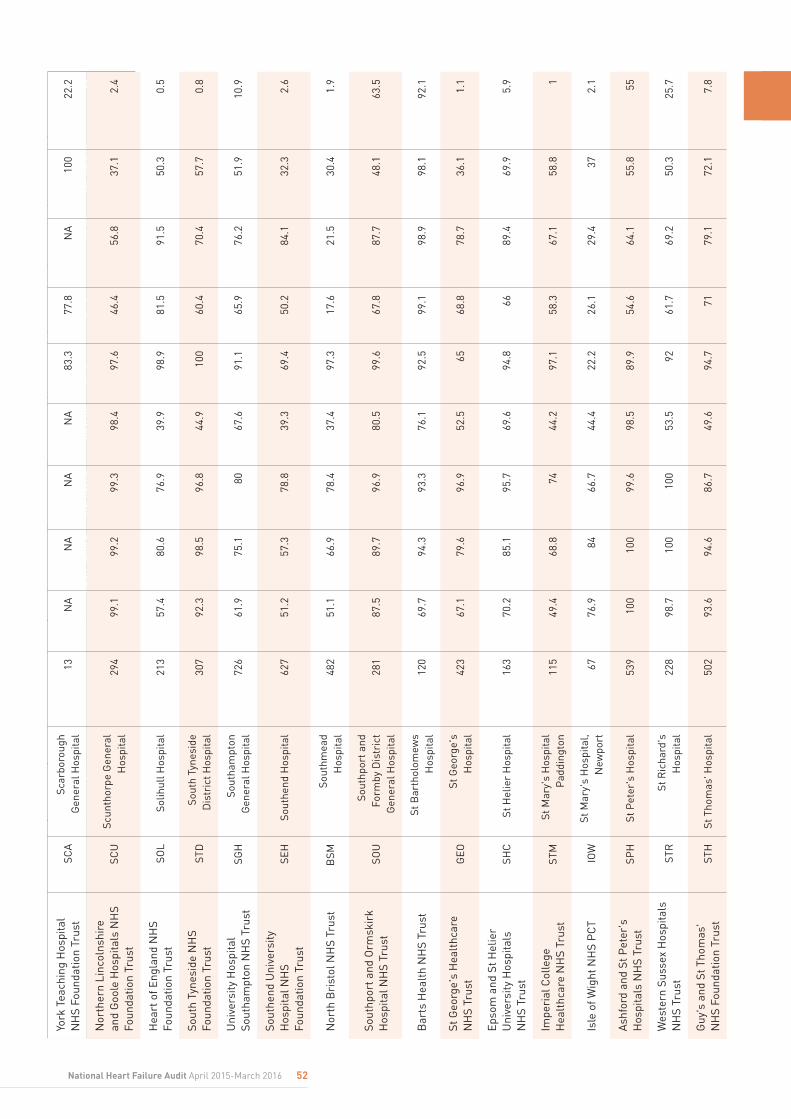
Trus
t nam
eN
ICO
R
Hos
pita
l co
de
Hos
pita
l nam
eH
ospi
tal r
ecor
ds
subm
itted
with
he
art f
ailu
re
%
AC
EI o
n di
scha
rge
%
AC
EI/
AR
B o
n di
scha
rge
% B
eta
bloc
ker
on
disc
harg
e
%
Rec
eive
d di
scha
rge
plan
ning
%
Ref
erra
l to
HF
liais
on
serv
ice
%
Ref
erra
l to
HF
liais
on
serv
ice
(LVS
D
only
)
%
Ref
erra
l to
card
iolo
gy
foll
ow-u
p
York
Tea
chin
g H
ospi
tal
NH
S Fo
unda
tion
Trus
tSC
ASc
arbo
roug
h G
ener
al H
ospi
tal
13N
AN
AN
AN
A83
.377
.8N
A10
022
.2
Nor
ther
n Li
ncol
nshi
re
and
Goo
le H
ospi
tals
NH
S Fo
unda
tion
Trus
tSC
USc
unth
orpe
Gen
eral
H
ospi
tal
294
99.1
99.2
99.3
98.4
97.6
46.4
56.8
37.1
2.4
Hea
rt o
f Eng
land
NH
S Fo
unda
tion
Trus
tSO
LSo
lihul
l Hos
pita
l21
357
.480
.676
.939
.998
.981
.591
.550
.30.
5
Sout
h Ty
nesi
de N
HS
Foun
datio
n Tr
ust
STD
Sout
h Ty
nesi
de
Dis
tric
t Hos
pita
l30
792
.398
.596
.844
.910
060
.470
.457
.70.
8
Uni
vers
ity H
ospi
tal
Sout
ham
pton
NH
S Tr
ust
SGH
Sout
ham
pton
G
ener
al H
ospi
tal
726
61.9
75.1
8067
.691
.165
.976
.251
.910
.9
Sout
hend
Uni
vers
ity
Hos
pita
l NH
S
Foun
datio
n Tr
ust
SEH
Sout
hend
Hos
pita
l62
751
.257
.378
.839
.369
.450
.284
.132
.32.
6
Nor
th B
rist
ol N
HS
Trus
tB
SMSo
uthm
ead
Hos
pita
l48
251
.166
.978
.437
.497
.317
.621
.530
.41.
9
Sout
hpor
t and
Orm
skir
k H
ospi
tal N
HS
Trus
tSO
USo
uthp
ort a
nd
Form
by D
istr
ict
Gen
eral
Hos
pita
l28
187
.589
.796
.980
.599
.667
.887
.748
.163
.5
Bar
ts H
ealt
h N
HS
Trus
tSt
Bar
thol
omew
s H
ospi
tal
120
69.7
94.3
93.3
76.1
92.5
99.1
98.9
98.1
92.1
St G
eorg
e's
Hea
lthc
are
NH
S Tr
ust
GEO
St G
eorg
e's
Hos
pita
l42
367
.179
.696
.952
.565
68.8
78.7
36.1
1.1
Epso
m a
nd S
t Hel
ier
Uni
vers
ity H
ospi
tals
N
HS
Trus
tSH
CSt
Hel
ier
Hos
pita
l16
370
.285
.195
.769
.694
.866
89.4
69.9
5.9
Impe
rial
Col
lege
H
ealt
hcar
e N
HS
Trus
tST
MSt
Mar
y's
Hos
pita
l P
addi
ngto
n11
549
.468
.874
44.2
97.1
58.3
67.1
58.8
1
Isle
of W
ight
NH
S P
CT
IOW
St M
ary'
s H
ospi
tal,
New
port
6776
.984
66.7
44.4
22.2
26.1
29.4
372.
1
Ash
ford
and
St P
eter
's
Hos
pita
ls N
HS
Trus
tSP
HSt
Pet
er's
Hos
pita
l53
910
010
099
.698
.589
.954
.664
.155
.855
Wes
tern
Sus
sex
Hos
pita
ls
NH
S Tr
ust
STR
St R
icha
rd's
H
ospi
tal
228
98.7
100
100
53.5
9261
.769
.250
.325
.7
Guy
's a
nd S
t Tho
mas
' N
HS
Foun
datio
n Tr
ust
STH
St T
hom
as' H
ospi
tal
502
93.6
94.6
86.7
49.6
94.7
7179
.172
.17.
8
52National Heart Failure Audit April 2015-March 2016

Stoc
kpor
t NH
S Fo
unda
tion
Trus
tSH
HSt
eppi
ng H
ill
Hos
pita
l48
871
.890
.892
.151
.183
.440
.565
.557
.35.
2
Buc
king
ham
shir
e H
ealt
hcar
e N
HS
Trus
tSM
VSt
oke
Man
devi
lle
Hos
pita
l99
27.3
51.5
77.8
41.2
73.4
56.2
86.1
48.6
35.8
City
Hos
pita
ls S
unde
rlan
d N
HS
Foun
datio
n Tr
ust
SUN
Sund
erla
nd R
oyal
H
ospi
tal
387
74.6
93.2
95.3
51.3
84.8
74.5
80.3
68.9
53.7
Tam
esid
e H
ospi
tal N
HS
Foun
datio
n Tr
ust
TGA
Tam
esid
e G
ener
al
Hos
pita
l19
860
.487
.286
7284
.264
76.5
6917
.6
Bar
ts H
ealt
h N
HS
Trus
tLC
HTh
e Lo
ndon
Che
st
Hos
pita
l20
6010
010
072
.790
61.5
72.7
92.3
100
Bar
ts H
ealt
h N
HS
Trus
tLO
NTh
e R
oyal
Hos
pita
l Lo
ndon
239
74.1
9291
6291
.349
.558
.660
.513
.2
York
Tea
chin
g H
ospi
tal
NH
S Fo
unda
tion
Trus
tYD
HTh
e Yo
rk H
ospi
tal
343
58.3
70.5
69.6
50.3
77.3
46.6
58.3
54.7
3.8
Sout
h D
evon
Hea
lthc
are
NH
S Fo
unda
tion
Trus
tTO
RTo
rbay
Hos
pita
l56
810
010
010
098
.792
.940
.958
.947
.82.
9
Cen
tral
Man
ches
ter
Uni
vers
ity H
ospi
tals
NH
S Fo
unda
tion
Trus
tTR
ATr
affo
rd G
ener
al
Hos
pita
l58
6377
.888
.946
.40
13.6
2573
.50
Mai
dsto
ne a
nd T
unbr
idge
W
ells
NH
S Tr
ust
KSX
Tunb
ridg
e W
ells
H
ospi
tal
223
78.5
96.9
91.8
73.8
98.9
73.7
85.7
62.8
6.7
Uni
vers
ity C
olle
ge
Lond
on H
ospi
tals
NH
S Fo
unda
tion
Trus
tU
CL
Uni
vers
ity C
olle
ge
Hos
pita
l21
275
.391
.290
.971
100
75.5
92.7
8426
.2
Ain
tree
Uni
vers
ity
Hos
pita
l NH
S
Foun
datio
n Tr
ust
FAZ
Uni
vers
ity H
ospi
tal
Ain
tree
626
90.8
95.1
9734
.477
.680
.685
.353
.65.
1
Uni
vers
ity H
ospi
tals
C
oven
try
and
War
wic
kshi
re N
HS
Trus
tW
AL
Uni
vers
ity H
ospi
tal
Cov
entr
y75
553
.764
80.5
37.3
92.8
52.7
76.4
7.1
0.2
NH
S Tr
ust
NIC
OR
Hos
pita
l co
de
Hos
pita
l nam
eH
eart
Fai
lure
ad
mis
sion
s (n
)
ACEI
on
disc
harg
e (%
)
ACEI
/AR
B o
n di
scha
rge
(%)
Bet
a bl
ocke
r on
di
scha
rge
(%)
MR
A on
di
scha
rge
(%)
Rec
eive
d di
scha
rge
plan
ning
(%
)
Ref
erra
l to
HF
nurs
e fo
llow
up
(%)
Ref
erra
l to
HF
nurs
e fo
llow
up
(LVS
D o
nly)
(%)
Ref
erra
l to
card
iolo
gy
follo
w-u
p
Ref
erra
l to
car
diac
re
habi
litat
ion
(%)
Engl
and
and
Wal
es60
737
61.1
%73
.7%
80.4
%45
.4%
87.3
0%54
.80%
70.8
0%47
.20%
12.1
0%
53National Heart Failure Audit April 2015-March 2016

Trus
t nam
eN
ICO
R
Hos
pita
l co
de
Hos
pita
l nam
eH
ospi
tal r
ecor
ds
subm
itted
with
he
art f
ailu
re
%
AC
EI o
n di
scha
rge
%
AC
EI/
AR
B o
n di
scha
rge
% B
eta
bloc
ker
on
disc
harg
e
%
Rec
eive
d di
scha
rge
plan
ning
%
Ref
erra
l to
HF
liais
on
serv
ice
%
Ref
erra
l to
HF
liais
on
serv
ice
(LVS
D
only
)
%
Ref
erra
l to
card
iolo
gy
foll
ow-u
p
54National Heart Failure Audit April 2015-March 2016
Lew
isha
m a
nd G
reen
wic
h N
HS
Trus
tLE
WU
nive
rsity
Hos
pita
l Le
wis
ham
146
62.5
81.2
90.8
50.8
78.9
30.8
49.3
65.9
1.8
Cou
nty
Dur
ham
and
D
arlin
gton
NH
S Fo
unda
tion
Trus
tD
RY
Uni
vers
ity H
ospi
tal
of N
orth
Dur
ham
424
63.2
70.7
77.2
32.9
45.9
53.4
63.1
70.9
44
Nor
th T
ees
and
Har
tlepo
ol
NH
S Fo
unda
tion
Trus
tN
TGU
nive
rsity
Hos
pita
l of
Nor
th T
ees
238
9999
.299
.310
086
.675
.685
.540
.772
.6
Nor
thum
bria
Hea
lthc
are
NH
S Fo
unda
tion
Trus
tA
SHW
ansb
eck
Gen
eral
H
ospi
tal
4666
.710
010
056
71.4
76.5
84.6
82.4
0
War
ring
ton
and
Hal
ton
Hos
pita
ls N
HS
Fo
unda
tion
Trus
tW
DG
War
ring
ton
Hos
pita
l17
098
98.5
98.8
8191
.476
.581
.161
.116
.9
Sout
h W
arw
icks
hire
NH
S Fo
unda
tion
Trus
t W
AR
War
wic
k H
ospi
tal
177
70.8
79.1
77.6
42.9
50.6
35.1
47.3
54.7
25
Wes
t Her
tfor
dshi
re
Hos
pita
ls N
HS
Trus
tW
ATW
atfo
rd G
ener
al
Hos
pita
l45
760
.270
.483
.358
.698
.560
.874
.751
.113
.8
Wes
t Mid
dles
ex U
nive
rsity
H
ospi
tal N
HS
Trus
tW
MU
Wes
t Mid
dles
ex
Uni
vers
ity H
ospi
tal
331
95.5
96.4
96.7
88.3
92.1
69.5
71.1
34.7
3.5
Wes
t Suf
folk
NH
S Fo
unda
tion
Trus
tW
SHW
est S
uffo
lk
Hos
pita
l29
362
.576
.586
.534
.897
.262
.171
.259
.914
Wes
ton
Are
a H
ealt
h
NH
S Tr
ust
WG
HW
esto
n G
ener
al
Hos
pita
l11
754
.464
.983
.141
.735
.39.
413
.338
.51
Hea
ther
woo
d an
d W
exha
m P
ark
Hos
pita
ls
NH
S Fo
unda
tion
Trus
tW
EXW
exha
m P
ark
Hos
pita
l58
256
.271
.174
.951
.799
.695
.797
27.1
2
Bar
ts H
ealt
h N
HS
Trus
tW
HC
Whi
pps
Cro
ss
Uni
vers
ity H
ospi
tal
366
64.6
92.1
90.6
54.5
82.7
59.6
71.9
63.7
18.9
St H
elen
s an
d K
now
sley
Te
achi
ng H
ospi
tals
N
HS
Trus
tW
HI
Whi
ston
Hos
pita
l35
296
.598
.498
.890
.599
.787
.191
.554
.70
The
Whi
ttin
gton
Hos
pita
l N
HS
Trus
tW
HT
Whi
ttin
gton
H
ospi
tal
187
86.4
90.6
93.8
7389
.964
.882
.963
.211
East
Ken
t Hos
pita
ls
Uni
vers
ity N
HS
Foun
datio
n Tr
ust
WH
HW
illia
m H
arve
y H
ospi
tal
192
8794
.692
.868
.988
.468
.995
.866
.281
.1
Wor
cest
ersh
ire
Acu
te
Hos
pita
ls N
HS
Trus
tW
RC
Wor
cest
ersh
ire
Roy
al H
ospi
tal
461
70.9
84.8
80.9
41.7
99.8
6887
.949
.43
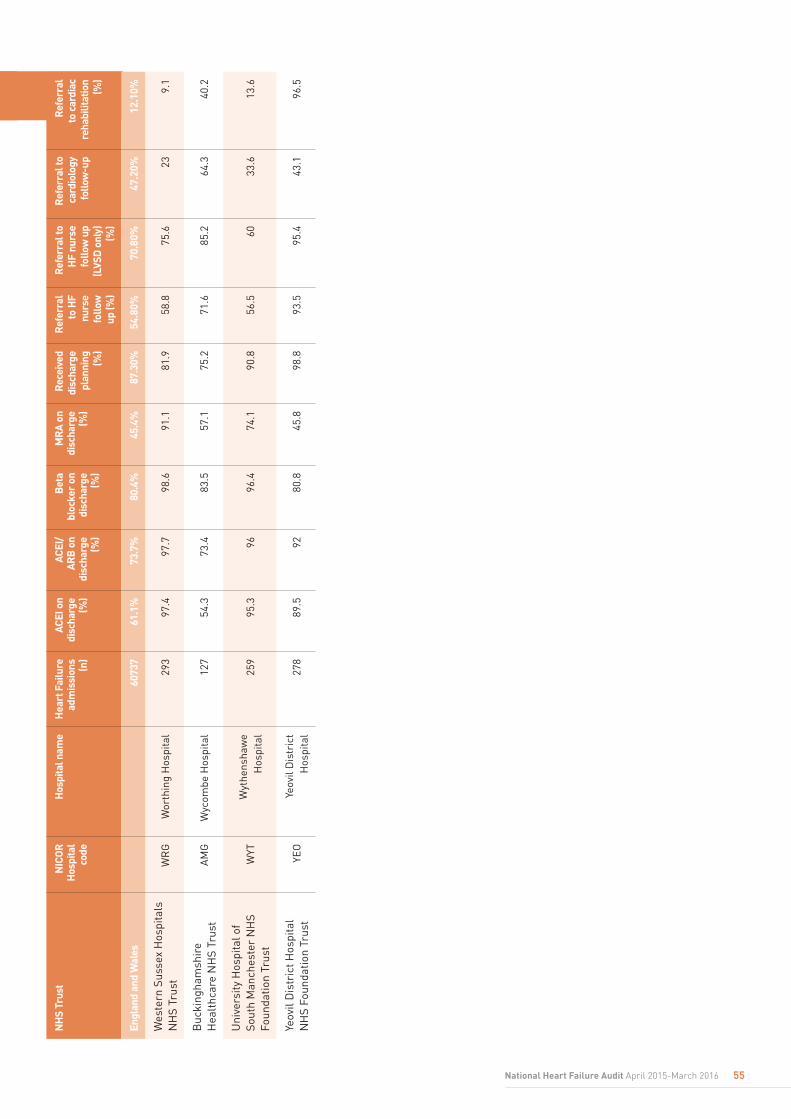
Wes
tern
Sus
sex
Hos
pita
ls
NH
S Tr
ust
WR
GW
orth
ing
Hos
pita
l29
397
.497
.798
.691
.181
.958
.875
.623
9.1
Buc
king
ham
shir
e H
ealt
hcar
e N
HS
Trus
tA
MG
Wyc
ombe
Hos
pita
l12
754
.373
.483
.557
.175
.271
.685
.264
.340
.2
Uni
vers
ity H
ospi
tal o
f So
uth
Man
ches
ter
NH
S Fo
unda
tion
Trus
tW
YTW
ythe
nsha
we
Hos
pita
l25
995
.396
96.4
74.1
90.8
56.5
6033
.613
.6
Yeov
il D
istr
ict H
ospi
tal
NH
S Fo
unda
tion
Trus
tYE
OYe
ovil
Dis
tric
t H
ospi
tal
278
89.5
9280
.845
.898
.893
.595
.443
.196
.5
NH
S Tr
ust
NIC
OR
Hos
pita
l co
de
Hos
pita
l nam
eH
eart
Fai
lure
ad
mis
sion
s (n
)
ACEI
on
disc
harg
e (%
)
ACEI
/AR
B o
n di
scha
rge
(%)
Bet
a bl
ocke
r on
di
scha
rge
(%)
MR
A on
di
scha
rge
(%)
Rec
eive
d di
scha
rge
plan
ning
(%
)
Ref
erra
l to
HF
nurs
e fo
llow
up
(%)
Ref
erra
l to
HF
nurs
e fo
llow
up
(LVS
D o
nly)
(%)
Ref
erra
l to
card
iolo
gy
follo
w-u
p
Ref
erra
l to
car
diac
re
habi
litat
ion
(%)
Engl
and
and
Wal
es60
737
61.1
%73
.7%
80.4
%45
.4%
87.3
0%54
.80%
70.8
0%47
.20%
12.1
0%
55National Heart Failure Audit April 2015-March 2016
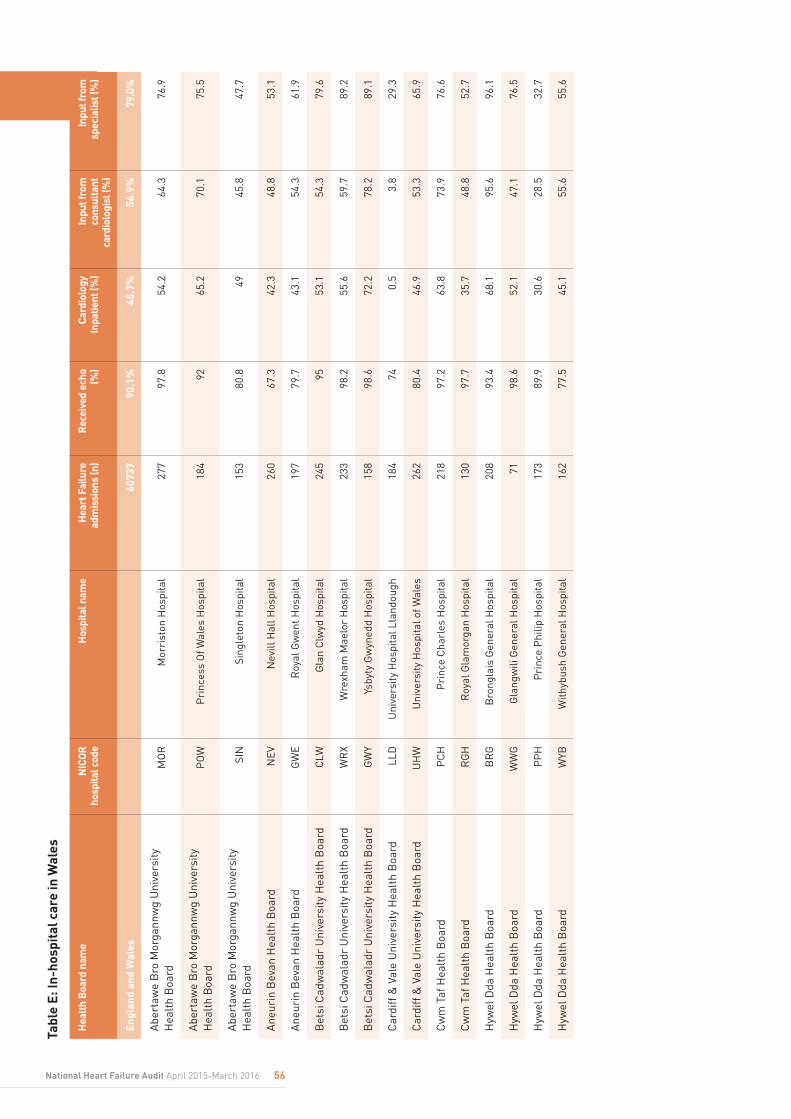
Hea
lth B
oard
nam
eN
ICOR
ho
spita
l cod
eH
ospi
tal n
ame
Hea
rt F
ailu
re
adm
issi
ons
(n)
Rec
eive
d ec
ho
(%)
Card
iolo
gy
Inpa
tient
(%)
Inpu
t fro
m
cons
ulta
nt
card
iolo
gist
(%)
Inpu
t fro
m
spec
ialis
t (%
)
Engl
and
and
Wal
es60
737
90.1
%45
.7%
56.9
%79
.0%
Abe
rtaw
e B
ro M
orga
nnw
g U
nive
rsity
H
ealt
h B
oard
MO
RM
orri
ston
Hos
pita
l27
797
.854
.264
.376
.9
Abe
rtaw
e B
ro M
orga
nnw
g U
nive
rsity
H
ealt
h B
oard
PO
WP
rinc
ess
Of W
ales
Hos
pita
l18
492
65.2
70.1
75.5
Abe
rtaw
e B
ro M
orga
nnw
g U
nive
rsity
H
ealt
h B
oard
SIN
Sing
leto
n H
ospi
tal
153
80.8
4945
.847
.7
Ane
urin
Bev
an H
ealt
h B
oard
NEV
Nev
ill H
all H
ospi
tal
260
67.3
42.3
48.8
53.1
Ane
urin
Bev
an H
ealt
h B
oard
GW
ER
oyal
Gw
ent H
ospi
tal
197
79.7
43.1
54.3
61.9
Bet
si C
adw
alad
r U
nive
rsity
Hea
lth
Boa
rdC
LWG
lan
Clw
yd H
ospi
tal
245
9553
.154
.379
.6
Bet
si C
adw
alad
r U
nive
rsity
Hea
lth
Boa
rdW
RX
Wre
xham
Mae
lor
Hos
pita
l23
398
.255
.659
.789
.2
Bet
si C
adw
alad
r U
nive
rsity
Hea
lth
Boa
rdG
WY
Ysby
ty G
wyn
edd
Hos
pita
l15
898
.672
.278
.289
.1
Car
diff
& V
ale
Uni
vers
ity H
ealt
h B
oard
LLD
Uni
vers
ity H
ospi
tal L
land
ough
184
740.
53.
829
.3
Car
diff
& V
ale
Uni
vers
ity H
ealt
h B
oard
UH
WU
nive
rsity
Hos
pita
l of W
ales
262
80.4
46.9
53.3
65.9
Cw
m T
af H
ealt
h B
oard
PC
HP
rinc
e C
harl
es H
ospi
tal
218
97.2
63.8
73.9
76.6
Cw
m T
af H
ealt
h B
oard
RG
HR
oyal
Gla
mor
gan
Hos
pita
l13
097
.735
.748
.852
.7
Hyw
el D
da H
ealt
h B
oard
BR
GB
rong
lais
Gen
eral
Hos
pita
l20
893
.468
.195
.696
.1
Hyw
el D
da H
ealt
h B
oard
WW
GG
lang
wili
Gen
eral
Hos
pita
l71
98.6
52.1
47.1
76.5
Hyw
el D
da H
ealt
h B
oard
PP
HP
rinc
e P
hilip
Hos
pita
l17
389
.930
.628
.532
.7
Hyw
el D
da H
ealt
h B
oard
WYB
With
ybus
h G
ener
al H
ospi
tal
162
77.5
45.1
55.6
55.6
56National Heart Failure Audit April 2015-March 2016
Tabl
e E:
In-h
ospi
tal c
are
in W
ales
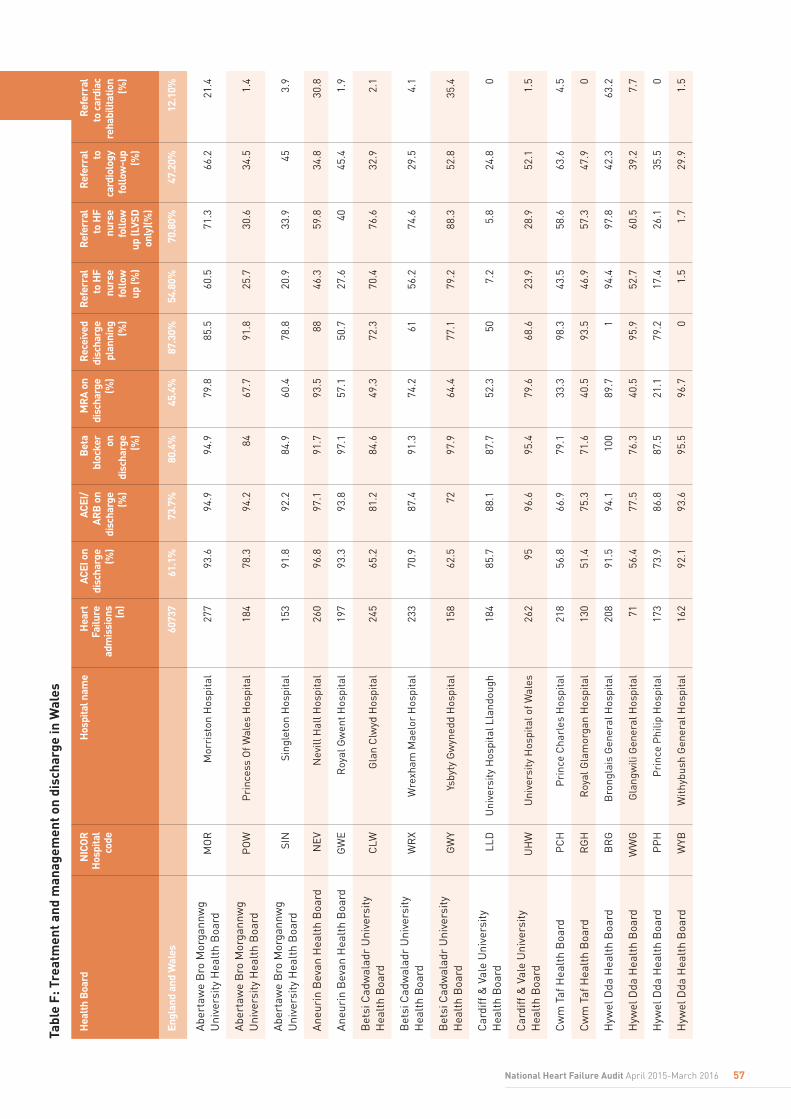
Tabl
e F:
Tre
atm
ent a
nd m
anag
emen
t on
disc
harg
e in
Wal
es
Hea
lth B
oard
NIC
OR
Hos
pita
l co
de
Hos
pita
l nam
eH
eart
Fa
ilure
ad
mis
sion
s (n
)
ACEI
on
disc
harg
e (%
)
ACEI
/AR
B o
n di
scha
rge
(%)
Bet
a bl
ocke
r on
di
scha
rge
(%)
MR
A on
di
scha
rge
(%)
Rec
eive
d di
scha
rge
plan
ning
(%
)
Ref
erra
l to
HF
nurs
e fo
llow
up
(%)
Ref
erra
l to
HF
nurs
e fo
llow
up
(LVS
D
only
)(%)
Ref
erra
l to
card
iolo
gy
follo
w-u
p (%
)
Ref
erra
l to
car
diac
re
habi
litat
ion
(%)
Engl
and
and
Wal
es
6073
761
.1%
73.7
%80
.4%
45.4
%87
.30%
54.8
0%70
.80%
47.2
0%12
.10%
Abe
rtaw
e B
ro M
orga
nnw
g U
nive
rsity
Hea
lth
Boa
rdM
OR
Mor
rist
on H
ospi
tal
277
93.6
94.9
94.9
79.8
85.5
60.5
71.3
66.2
21.4
Abe
rtaw
e B
ro M
orga
nnw
g U
nive
rsity
Hea
lth
Boa
rdP
OW
Pri
nces
s O
f Wal
es H
ospi
tal
184
78.3
94.2
8467
.791
.825
.730
.634
.51.
4
Abe
rtaw
e B
ro M
orga
nnw
g U
nive
rsity
Hea
lth
Boa
rdSI
NSi
ngle
ton
Hos
pita
l15
391
.892
.284
.960
.478
.820
.933
.945
3.9
Ane
urin
Bev
an H
ealt
h B
oard
NEV
Nev
ill H
all H
ospi
tal
260
96.8
97.1
91.7
93.5
8846
.359
.834
.830
.8
Ane
urin
Bev
an H
ealt
h B
oard
GW
ER
oyal
Gw
ent H
ospi
tal
197
93.3
93.8
97.1
57.1
50.7
27.6
4045
.41.
9
Bet
si C
adw
alad
r U
nive
rsity
H
ealt
h B
oard
CLW
Gla
n C
lwyd
Hos
pita
l24
565
.281
.284
.649
.372
.370
.476
.632
.92.
1
Bet
si C
adw
alad
r U
nive
rsity
H
ealt
h B
oard
WR
XW
rexh
am M
aelo
r H
ospi
tal
233
70.9
87.4
91.3
74.2
6156
.274
.629
.54.
1
Bet
si C
adw
alad
r U
nive
rsity
H
ealt
h B
oard
GW
YYs
byty
Gw
yned
d H
ospi
tal
158
62.5
7297
.964
.477
.179
.288
.352
.835
.4
Car
diff
& V
ale
Uni
vers
ity
Hea
lth
Boa
rdLL
DU
nive
rsity
Hos
pita
l Lla
ndou
gh18
485
.788
.187
.752
.350
7.2
5.8
24.8
0
Car
diff
& V
ale
Uni
vers
ity
Hea
lth
Boa
rdU
HW
Uni
vers
ity H
ospi
tal o
f Wal
es26
295
96.6
95.4
79.6
68.6
23.9
28.9
52.1
1.5
Cw
m T
af H
ealt
h B
oard
PC
HP
rinc
e C
harl
es H
ospi
tal
218
56.8
66.9
79.1
33.3
98.3
43.5
58.6
63.6
4.5
Cw
m T
af H
ealt
h B
oard
RG
HR
oyal
Gla
mor
gan
Hos
pita
l13
051
.475
.371
.640
.593
.546
.957
.347
.90
Hyw
el D
da H
ealt
h B
oard
BR
GB
rong
lais
Gen
eral
Hos
pita
l20
891
.594
.110
089
.71
94.4
97.8
42.3
63.2
Hyw
el D
da H
ealt
h B
oard
WW
GG
lang
wili
Gen
eral
Hos
pita
l71
56.4
77.5
76.3
40.5
95.9
52.7
60.5
39.2
7.7
Hyw
el D
da H
ealt
h B
oard
PP
HP
rinc
e P
hilip
Hos
pita
l17
373
.986
.887
.521
.179
.217
.426
.135
.50
Hyw
el D
da H
ealt
h B
oard
WYB
With
ybus
h G
ener
al H
ospi
tal
162
92.1
93.6
95.5
96.7
01.
51.
729
.91.
5
57National Heart Failure Audit April 2015-March 2016
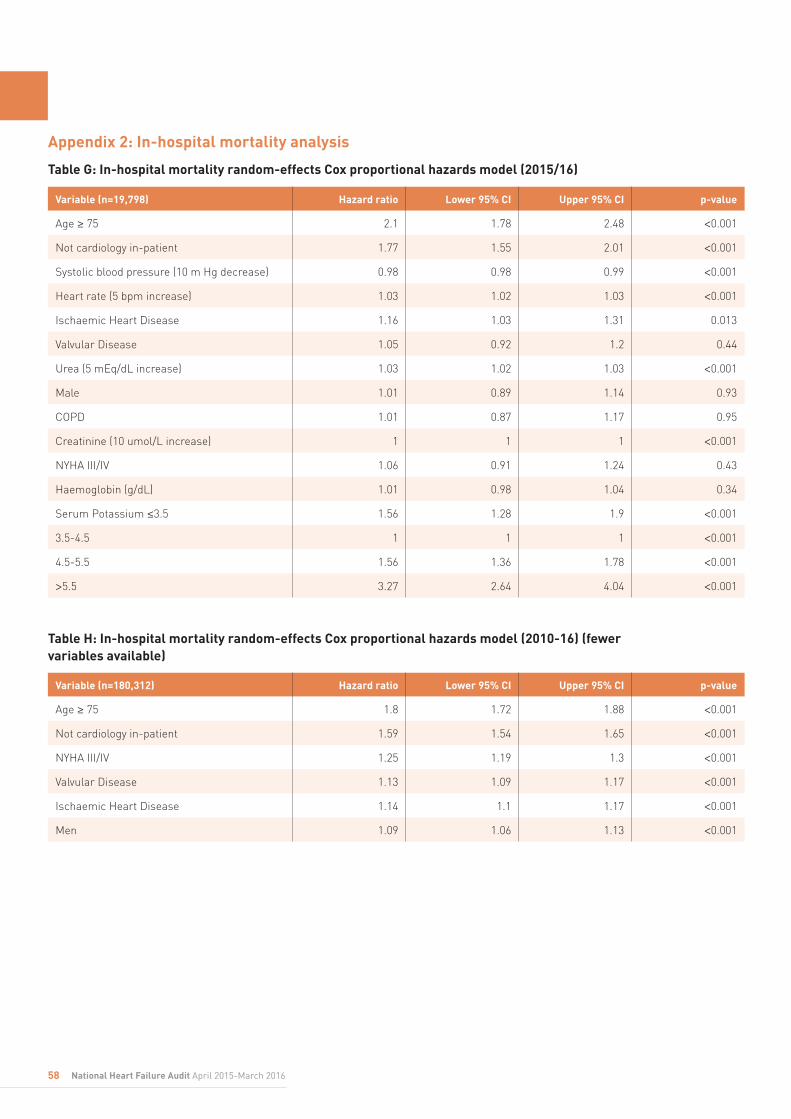
58 National Heart Failure Audit April 2015-March 2016
Variable (n=19,798) Hazard ratio Lower 95% CI Upper 95% CI p-value
Age ≥ 75 2.1 1.78 2.48 <0.001
Not cardiology in-patient 1.77 1.55 2.01 <0.001
Systolic blood pressure (10 m Hg decrease) 0.98 0.98 0.99 <0.001
Heart rate (5 bpm increase) 1.03 1.02 1.03 <0.001
Ischaemic Heart Disease 1.16 1.03 1.31 0.013
Valvular Disease 1.05 0.92 1.2 0.44
Urea (5 mEq/dL increase) 1.03 1.02 1.03 <0.001
Male 1.01 0.89 1.14 0.93
COPD 1.01 0.87 1.17 0.95
Creatinine (10 umol/L increase) 1 1 1 <0.001
NYHA III/IV 1.06 0.91 1.24 0.43
Haemoglobin (g/dL) 1.01 0.98 1.04 0.34
Serum Potassium ≤3.5 1.56 1.28 1.9 <0.001
3.5-4.5 1 1 1 <0.001
4.5-5.5 1.56 1.36 1.78 <0.001
>5.5 3.27 2.64 4.04 <0.001
Variable (n=180,312) Hazard ratio Lower 95% CI Upper 95% CI p-value
Age ≥ 75 1.8 1.72 1.88 <0.001
Not cardiology in-patient 1.59 1.54 1.65 <0.001
NYHA III/IV 1.25 1.19 1.3 <0.001
Valvular Disease 1.13 1.09 1.17 <0.001
Ischaemic Heart Disease 1.14 1.1 1.17 <0.001
Men 1.09 1.06 1.13 <0.001
Appendix 2: In-hospital mortality analysis
Table G: In-hospital mortality random-effects Cox proportional hazards model (2015/16)
Table H: In-hospital mortality random-effects Cox proportional hazards model (2010-16) (fewer variables available)
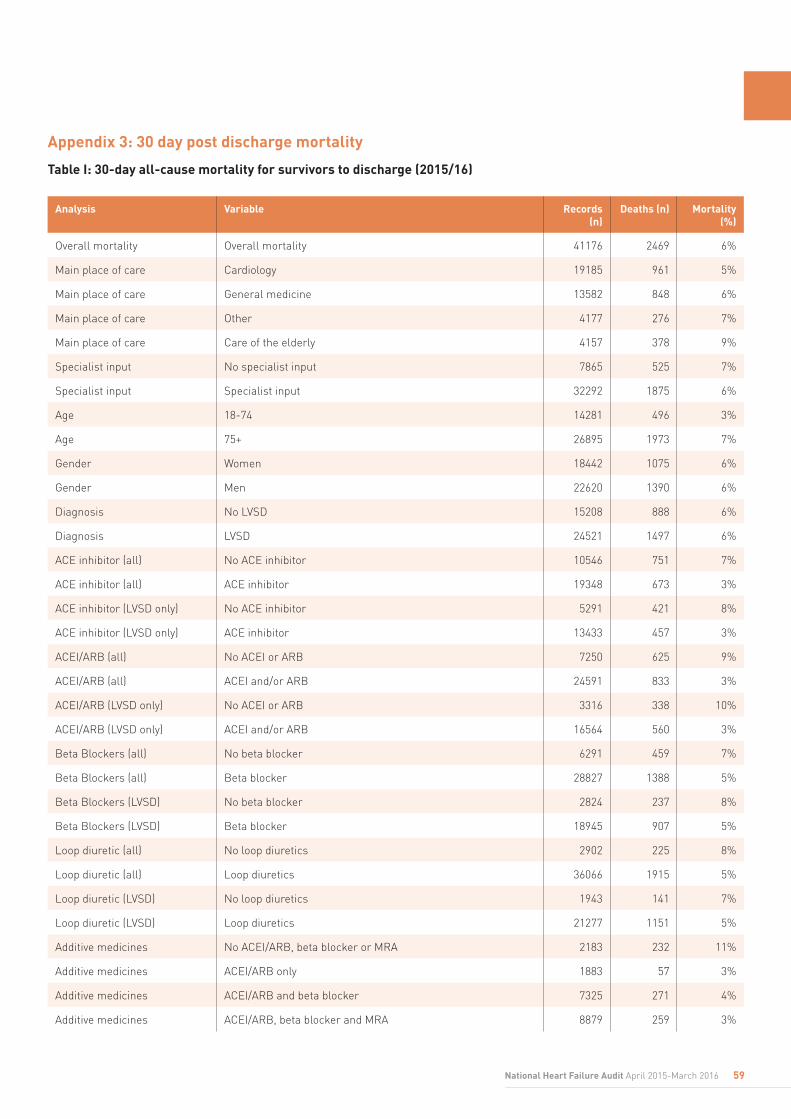
59National Heart Failure Audit April 2015-March 2016
Analysis Variable Records (n)
Deaths (n) Mortality (%)
Overall mortality Overall mortality 41176 2469 6%
Main place of care Cardiology 19185 961 5%
Main place of care General medicine 13582 848 6%
Main place of care Other 4177 276 7%
Main place of care Care of the elderly 4157 378 9%
Specialist input No specialist input 7865 525 7%
Specialist input Specialist input 32292 1875 6%
Age 18-74 14281 496 3%
Age 75+ 26895 1973 7%
Gender Women 18442 1075 6%
Gender Men 22620 1390 6%
Diagnosis No LVSD 15208 888 6%
Diagnosis LVSD 24521 1497 6%
ACE inhibitor (all) No ACE inhibitor 10546 751 7%
ACE inhibitor (all) ACE inhibitor 19348 673 3%
ACE inhibitor (LVSD only) No ACE inhibitor 5291 421 8%
ACE inhibitor (LVSD only) ACE inhibitor 13433 457 3%
ACEI/ARB (all) No ACEI or ARB 7250 625 9%
ACEI/ARB (all) ACEI and/or ARB 24591 833 3%
ACEI/ARB (LVSD only) No ACEI or ARB 3316 338 10%
ACEI/ARB (LVSD only) ACEI and/or ARB 16564 560 3%
Beta Blockers (all) No beta blocker 6291 459 7%
Beta Blockers (all) Beta blocker 28827 1388 5%
Beta Blockers (LVSD) No beta blocker 2824 237 8%
Beta Blockers (LVSD) Beta blocker 18945 907 5%
Loop diuretic (all) No loop diuretics 2902 225 8%
Loop diuretic (all) Loop diuretics 36066 1915 5%
Loop diuretic (LVSD) No loop diuretics 1943 141 7%
Loop diuretic (LVSD) Loop diuretics 21277 1151 5%
Additive medicines No ACEI/ARB, beta blocker or MRA 2183 232 11%
Additive medicines ACEI/ARB only 1883 57 3%
Additive medicines ACEI/ARB and beta blocker 7325 271 4%
Additive medicines ACEI/ARB, beta blocker and MRA 8879 259 3%
Appendix 3: 30 day post discharge mortality
Table I: 30-day all-cause mortality for survivors to discharge (2015/16)
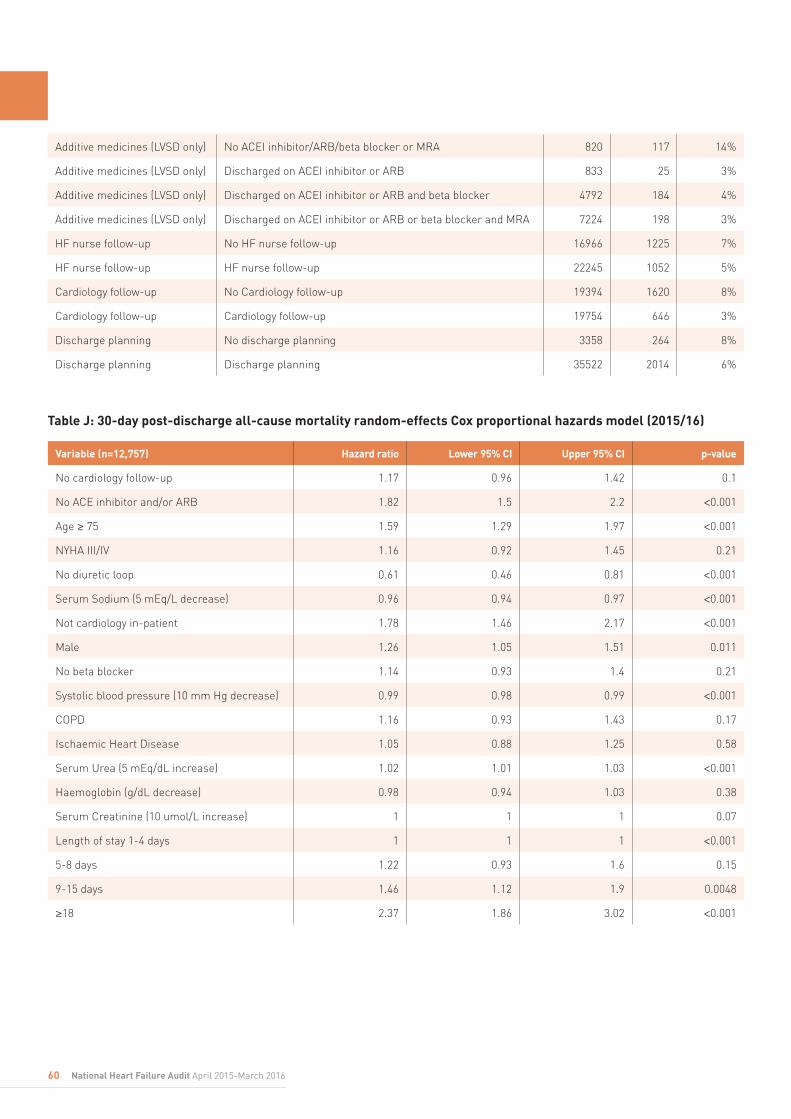
60 National Heart Failure Audit April 2015-March 2016
Variable (n=12,757) Hazard ratio Lower 95% CI Upper 95% CI p-value
No cardiology follow-up 1.17 0.96 1.42 0.1
No ACE inhibitor and/or ARB 1.82 1.5 2.2 <0.001
Age ≥ 75 1.59 1.29 1.97 <0.001
NYHA III/IV 1.16 0.92 1.45 0.21
No diuretic loop 0.61 0.46 0.81 <0.001
Serum Sodium (5 mEq/L decrease) 0.96 0.94 0.97 <0.001
Not cardiology in-patient 1.78 1.46 2.17 <0.001
Male 1.26 1.05 1.51 0.011
No beta blocker 1.14 0.93 1.4 0.21
Systolic blood pressure (10 mm Hg decrease) 0.99 0.98 0.99 <0.001
COPD 1.16 0.93 1.43 0.17
Ischaemic Heart Disease 1.05 0.88 1.25 0.58
Serum Urea (5 mEq/dL increase) 1.02 1.01 1.03 <0.001
Haemoglobin (g/dL decrease) 0.98 0.94 1.03 0.38
Serum Creatinine (10 umol/L increase) 1 1 1 0.07
Length of stay 1-4 days 1 1 1 <0.001
5-8 days 1.22 0.93 1.6 0.15
9-15 days 1.46 1.12 1.9 0.0048
≥18 2.37 1.86 3.02 <0.001
Additive medicines (LVSD only) No ACEI inhibitor/ARB/beta blocker or MRA 820 117 14%
Additive medicines (LVSD only) Discharged on ACEI inhibitor or ARB 833 25 3%
Additive medicines (LVSD only) Discharged on ACEI inhibitor or ARB and beta blocker 4792 184 4%
Additive medicines (LVSD only) Discharged on ACEI inhibitor or ARB or beta blocker and MRA 7224 198 3%
HF nurse follow-up No HF nurse follow-up 16966 1225 7%
HF nurse follow-up HF nurse follow-up 22245 1052 5%
Cardiology follow-up No Cardiology follow-up 19394 1620 8%
Cardiology follow-up Cardiology follow-up 19754 646 3%
Discharge planning No discharge planning 3358 264 8%
Discharge planning Discharge planning 35522 2014 6%
Table J: 30-day post-discharge all-cause mortality random-effects Cox proportional hazards model (2015/16)

61National Heart Failure Audit April 2015-March 2016
Analysis Variable Records (n)
Deaths (n)
Mortality (%)
Median follow-
up (days)
Overall mortality Overall mortality 41176 14549 35.3 400
Main place of care Cardiology 19185 5844 30.5 415
Main place of care General medicine 13582 5100 37.5 395
Main place of care Other 4177 1562 37.4 390
Main place of care Care of the elderly 4157 2012 48.4 350
Specialist input No specialist input 7865 3139 39.9 391
Specialist input Specialist input 32292 11008 34.1 404
Age 18-74 14821 3136 21.2 443
Age 75+ 26895 11413 42.4 375
Gender Women 18442 6565 35.6 405
Gender Men 22620 7941 35.1 398
Diagnosis No LVSD 15208 5626 37.0 391
Diagnosis LVSD 24541 8413 34.3 406
ACE inhibitor (all) No ACE inhibitor 10456 4222 40.4 385
ACE inhibitor (all) ACE inhibitor 19348 5411 28.0 428
ACE inhibitor (LVSD only) No ACE inhibitor 5291 2158 40.8 382
ACE inhibitor (LVSD only) ACE inhibitor 13433 3645 27.1 431
ACEI/ARB (all) No ACEI or ARB 7250 3253 44.9 361
ACEI/ARB (all) ACEI and/or ARB 24591 6857 27.9 429
ACEI/ARB (LVSD only) No ACEI or ARB 3316 1544 46.6 348
ACEI/ARB (LVSD only) ACEI and/or ARB 16564 4526 27.3 432
Beta Blockers (all) No beta blocker 6291 2564 40.8 384
Beta Blockers (all) Beta blocker 28827 9450 32.8 411
Beta Blockers (LVSD) No beta blocker 2824 1202 42.6 370
Beta Blockers (LVSD) Beta blocker 18945 5995 31.6 416
Loop diuretic (all) No loop diuretics 2092 844 40.3 412
Loop diuretic (all) Loop diuretics 12887 672 5.2 404
Loop diuretic (LVSD) No loop diuretics 1943 526 27.1% 420
Loop diuretic (LVSD) Loop diuretics 21277 7421 34.9% 407
Additive medicines No ACEI/ARB, beta blocker or MRA 2183 979 44.8% 356
Additive medicines ACEI/ARB only 1883 606 32.2% 422
Additive medicines ACEI/ARB and beta blocker 7325 2018 27.5% 434
Appendix 4: 1 Year post-discharge mortality
Table K: 1 year all-cause mortality for survivors to discharge (2015/16)
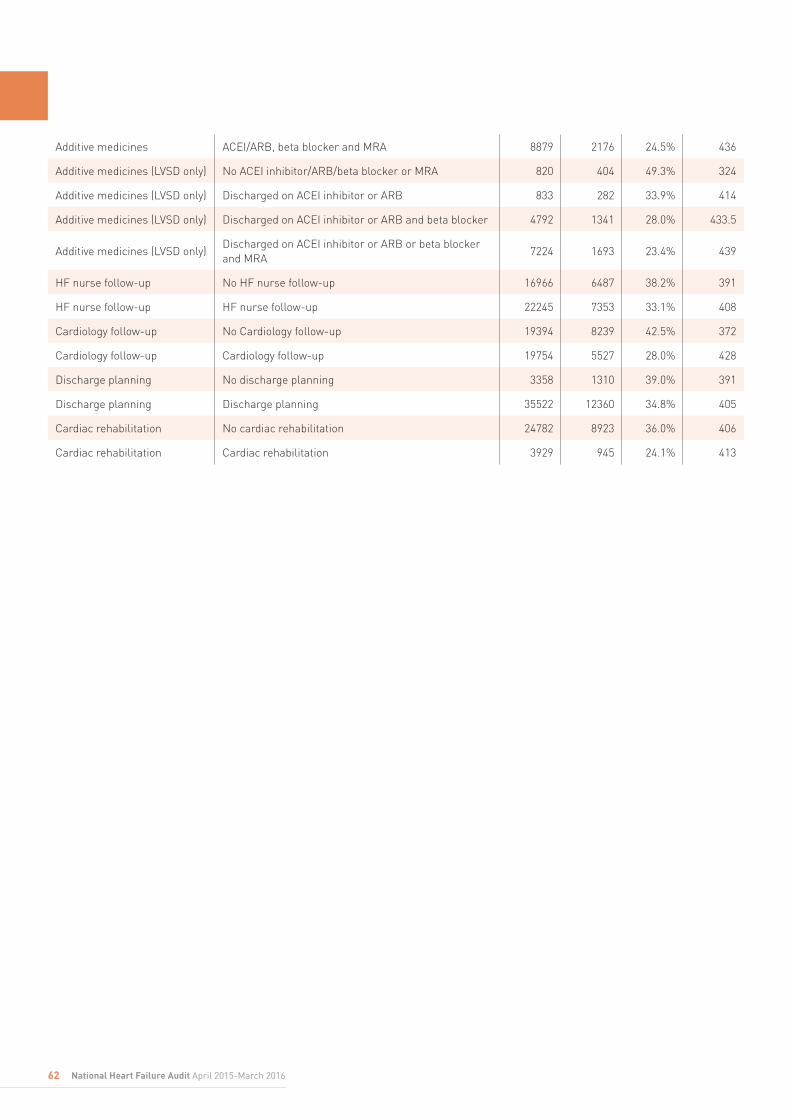
62 National Heart Failure Audit April 2015-March 2016
Additive medicines ACEI/ARB, beta blocker and MRA 8879 2176 24.5% 436
Additive medicines (LVSD only) No ACEI inhibitor/ARB/beta blocker or MRA 820 404 49.3% 324
Additive medicines (LVSD only) Discharged on ACEI inhibitor or ARB 833 282 33.9% 414
Additive medicines (LVSD only) Discharged on ACEI inhibitor or ARB and beta blocker 4792 1341 28.0% 433.5
Additive medicines (LVSD only)Discharged on ACEI inhibitor or ARB or beta blocker and MRA
7224 1693 23.4% 439
HF nurse follow-up No HF nurse follow-up 16966 6487 38.2% 391
HF nurse follow-up HF nurse follow-up 22245 7353 33.1% 408
Cardiology follow-up No Cardiology follow-up 19394 8239 42.5% 372
Cardiology follow-up Cardiology follow-up 19754 5527 28.0% 428
Discharge planning No discharge planning 3358 1310 39.0% 391
Discharge planning Discharge planning 35522 12360 34.8% 405
Cardiac rehabilitation No cardiac rehabilitation 24782 8923 36.0% 406
Cardiac rehabilitation Cardiac rehabilitation 3929 945 24.1% 413
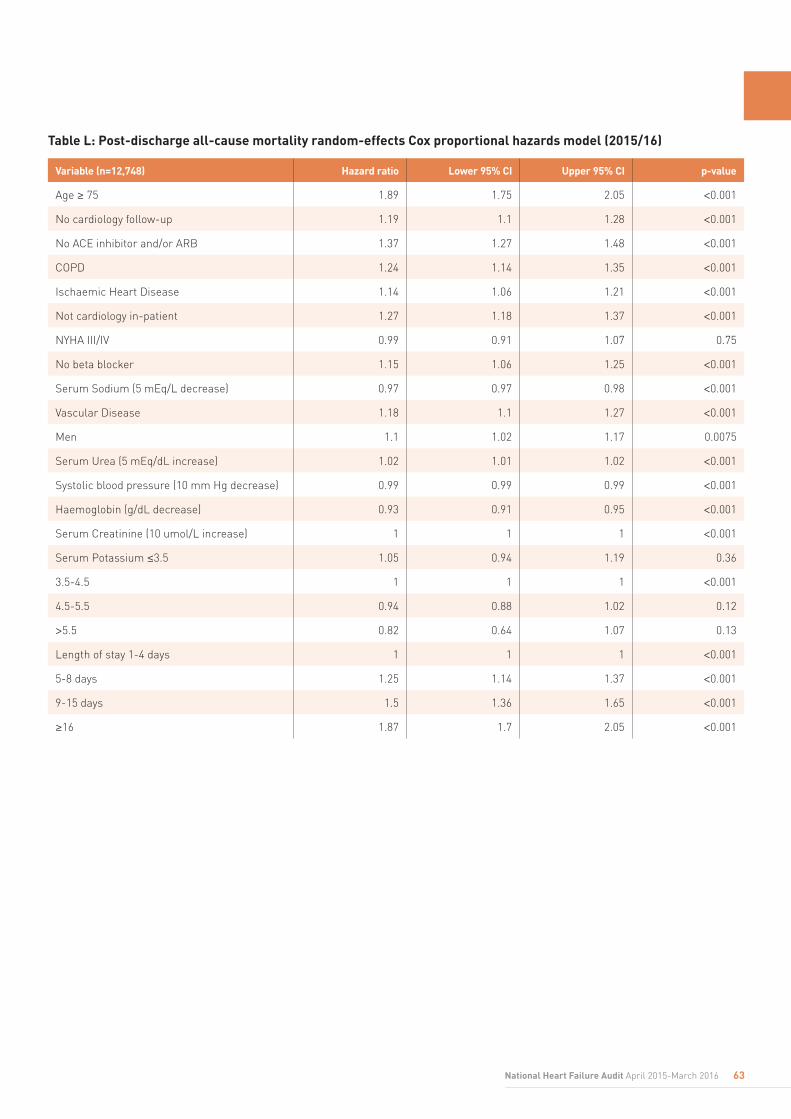
63National Heart Failure Audit April 2015-March 2016
Table L: Post-discharge all-cause mortality random-effects Cox proportional hazards model (2015/16)
Variable (n=12,748) Hazard ratio Lower 95% CI Upper 95% CI p-value
Age ≥ 75 1.89 1.75 2.05 <0.001
No cardiology follow-up 1.19 1.1 1.28 <0.001
No ACE inhibitor and/or ARB 1.37 1.27 1.48 <0.001
COPD 1.24 1.14 1.35 <0.001
Ischaemic Heart Disease 1.14 1.06 1.21 <0.001
Not cardiology in-patient 1.27 1.18 1.37 <0.001
NYHA III/IV 0.99 0.91 1.07 0.75
No beta blocker 1.15 1.06 1.25 <0.001
Serum Sodium (5 mEq/L decrease) 0.97 0.97 0.98 <0.001
Vascular Disease 1.18 1.1 1.27 <0.001
Men 1.1 1.02 1.17 0.0075
Serum Urea (5 mEq/dL increase) 1.02 1.01 1.02 <0.001
Systolic blood pressure (10 mm Hg decrease) 0.99 0.99 0.99 <0.001
Haemoglobin (g/dL decrease) 0.93 0.91 0.95 <0.001
Serum Creatinine (10 umol/L increase) 1 1 1 <0.001
Serum Potassium ≤3.5 1.05 0.94 1.19 0.36
3.5-4.5 1 1 1 <0.001
4.5-5.5 0.94 0.88 1.02 0.12
>5.5 0.82 0.64 1.07 0.13
Length of stay 1-4 days 1 1 1 <0.001
5-8 days 1.25 1.14 1.37 <0.001
9-15 days 1.5 1.36 1.65 <0.001
≥16 1.87 1.7 2.05 <0.001
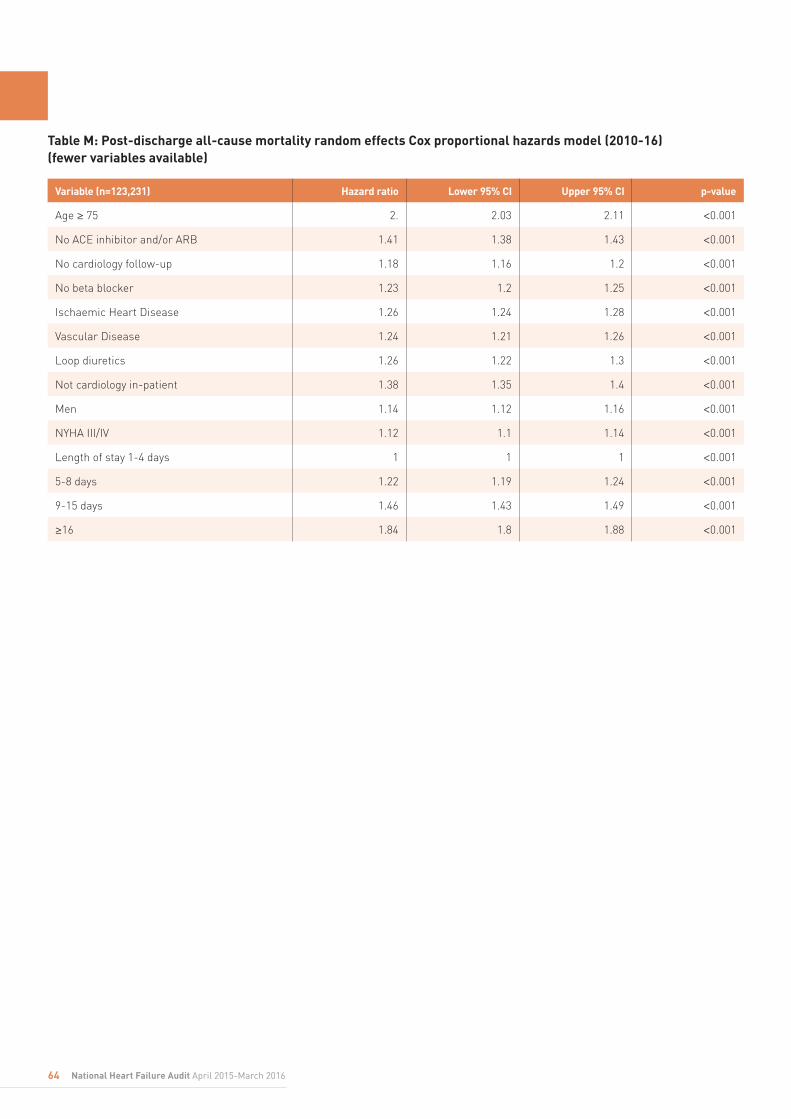
64 National Heart Failure Audit April 2015-March 2016
Table M: Post-discharge all-cause mortality random effects Cox proportional hazards model (2010-16) (fewer variables available)
Variable (n=123,231) Hazard ratio Lower 95% CI Upper 95% CI p-value
Age ≥ 75 2. 2.03 2.11 <0.001
No ACE inhibitor and/or ARB 1.41 1.38 1.43 <0.001
No cardiology follow-up 1.18 1.16 1.2 <0.001
No beta blocker 1.23 1.2 1.25 <0.001
Ischaemic Heart Disease 1.26 1.24 1.28 <0.001
Vascular Disease 1.24 1.21 1.26 <0.001
Loop diuretics 1.26 1.22 1.3 <0.001
Not cardiology in-patient 1.38 1.35 1.4 <0.001
Men 1.14 1.12 1.16 <0.001
NYHA III/IV 1.12 1.1 1.14 <0.001
Length of stay 1-4 days 1 1 1 <0.001
5-8 days 1.22 1.19 1.24 <0.001
9-15 days 1.46 1.43 1.49 <0.001
≥16 1.84 1.8 1.88 <0.001
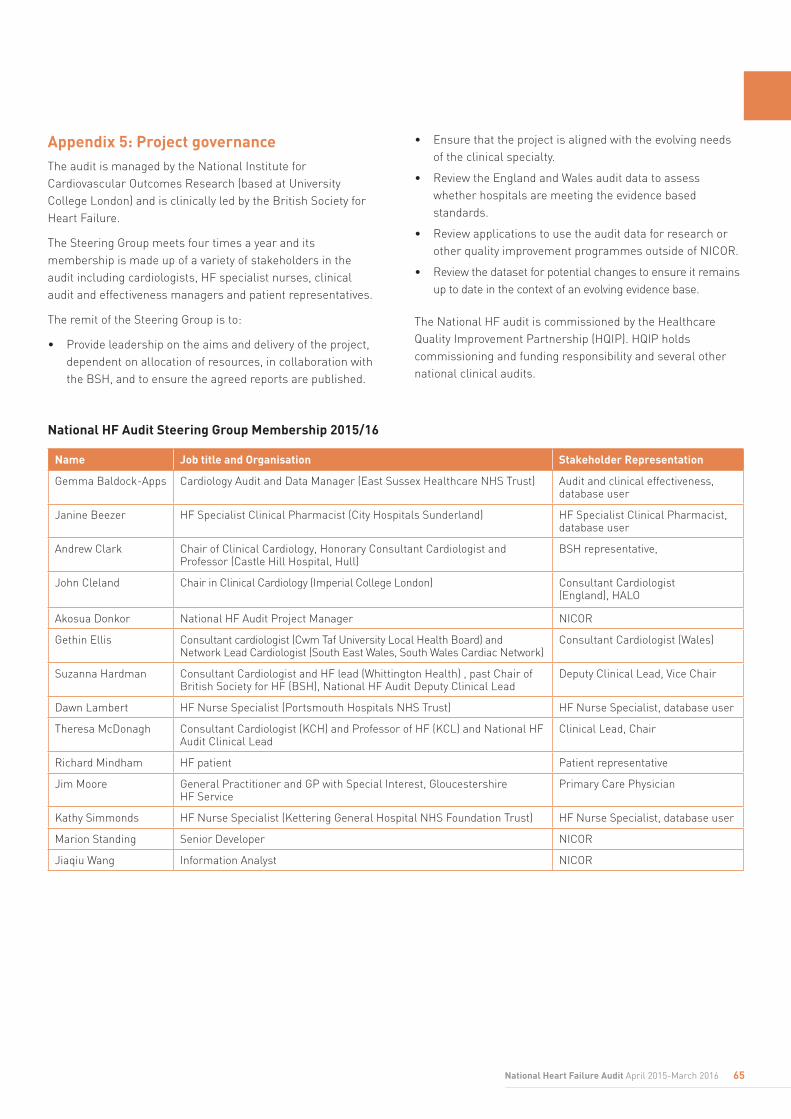
65National Heart Failure Audit April 2015-March 2016
Appendix 5: Project governanceThe audit is managed by the National Institute for Cardiovascular Outcomes Research (based at University College London) and is clinically led by the British Society for Heart Failure.
The Steering Group meets four times a year and its membership is made up of a variety of stakeholders in the audit including cardiologists, HF specialist nurses, clinical audit and effectiveness managers and patient representatives.
The remit of the Steering Group is to:
• Provide leadership on the aims and delivery of the project, dependent on allocation of resources, in collaboration with the BSH, and to ensure the agreed reports are published.
• Ensure that the project is aligned with the evolving needs of the clinical specialty.
• Review the England and Wales audit data to assess whether hospitals are meeting the evidence based standards.
• Review applications to use the audit data for research or other quality improvement programmes outside of NICOR.
• Review the dataset for potential changes to ensure it remains up to date in the context of an evolving evidence base.
The National HF audit is commissioned by the Healthcare Quality Improvement Partnership (HQIP). HQIP holds commissioning and funding responsibility and several other national clinical audits.
National HF Audit Steering Group Membership 2015/16
Name Job title and Organisation Stakeholder Representation
Gemma Baldock-Apps Cardiology Audit and Data Manager (East Sussex Healthcare NHS Trust) Audit and clinical effectiveness, database user
Janine Beezer HF Specialist Clinical Pharmacist (City Hospitals Sunderland) HF Specialist Clinical Pharmacist, database user
Andrew Clark Chair of Clinical Cardiology, Honorary Consultant Cardiologist and Professor (Castle Hill Hospital, Hull)
BSH representative,
John Cleland Chair in Clinical Cardiology (Imperial College London) Consultant Cardiologist (England), HALO
Akosua Donkor National HF Audit Project Manager NICOR
Gethin Ellis Consultant cardiologist (Cwm Taf University Local Health Board) and Network Lead Cardiologist (South East Wales, South Wales Cardiac Network)
Consultant Cardiologist (Wales)
Suzanna Hardman Consultant Cardiologist and HF lead (Whittington Health) , past Chair of British Society for HF (BSH), National HF Audit Deputy Clinical Lead
Deputy Clinical Lead, Vice Chair
Dawn Lambert HF Nurse Specialist (Portsmouth Hospitals NHS Trust) HF Nurse Specialist, database user
Theresa McDonagh Consultant Cardiologist (KCH) and Professor of HF (KCL) and National HF Audit Clinical Lead
Clinical Lead, Chair
Richard Mindham HF patient Patient representative
Jim Moore General Practitioner and GP with Special Interest, Gloucestershire HF Service
Primary Care Physician
Kathy Simmonds HF Nurse Specialist (Kettering General Hospital NHS Foundation Trust) HF Nurse Specialist, database user
Marion Standing Senior Developer NICOR
Jiaqiu Wang Information Analyst NICOR

7 Case Studies6 Glossary
Word Acronym or abbreviation
Definition
(Acute) Myocardial Infarction
(A)MI Commonly known as a heart attack, a myocardial infarction results from the interruption of blood supply to part of the heart, which causes heart muscle cells to die. The damage to the heart muscle carries a risk of sudden death, but those who survive often go on to suffer from heart failure.
Angiotensin II receptor antagonist/angiotensin receptor blocker
ARB A group of medicines usually prescribed for those patients who are intolerant of ACE inhibitors. Rather than lowering levels of angiotensin II, they instead prevent the chemical from having any effect on blood vessels.
Angiotensin-converting enzyme inhibitor
ACE inhibitor/ACEI
A group of medicines used primarily for the treatment of high blood pressure and heart failure. They stop the body’s ability to produce angiotensin II, a hormone which causes blood vessels to contract, thus dilating blood vessels and increasing the supply of blood and oxygen to the heart.
Best Practice Tariff BPT The best practice is defined as care that is both clinical and cost effective. The Department of Health introduced the Best Practice Tariff (BPT) as an incentive to deliver best clinical practice through adequate reimbursement of high quality care.
Beta blocker BB A group of medicines which slow the heart rate, decrease cardiac output and lessen the force of heart muscle and blood vessel contractions. Used to treat abnormal or irregular heart rhythms, and abnormally fast heart rates.
British Society of Heart Failure
BSH The professional society for healthcare professionals involved in the care of heart failure patients. The BSH aims to improve care and outcomes for heart failure patients by increasing knowledge and promoting research about the diagnosis, causes and management of heart failure.
Cardiac resynchronisation therapy
CRT CRT, also known as biventricular pacing, aims to improve the heart’s pumping efficiency by making the chambers of the heart pump together. 25-50% of all heart failure patients have hearts whose walls do not contract simultaneously. CRT involves implanting a CRT pacemaker or ICD (implantable cardioverter-defibrillator) that has a lead positioned in each ventricle. Most devices also include a third lead which is positioned in the right atrium to ensure that the atria and ventricles contract together.
Care Quality Commission
CQC Care Quality Commission are an independent regulator of health and adult social care in England.
Chronic obstructive pulmonary disease
COPD The co-occurrence of chronic bronchitis and emphysema, a pair of commonly co-existing lung diseases in which the airways become narrowed. This leads to a limitation of the flow of air to and from the lungs, causing shortness of breath (dyspnoea). In contrast to asthma, this limitation is poorly reversible and usually gets progressively worse over time.
Contraindication A factor serving as a reason to withhold medical treatment, due to its unsuitability
Diuretic A group of medicines which help to remove extra fluid from the body by increasing the amount of water passed through the kidneys. Loop diuretics are often used in heart failure patients to ease symptoms of oedema and breathlessness.
Echocardiography Echo A diagnostic test which uses ultrasound to create two dimensional images of the heart. This allows clinicians to examine the size of the chambers of the heart and its pumping function in detail, as well as examine valves and the myocardium (heart muscle).
66 National Heart Failure Audit April 2015-March 2016
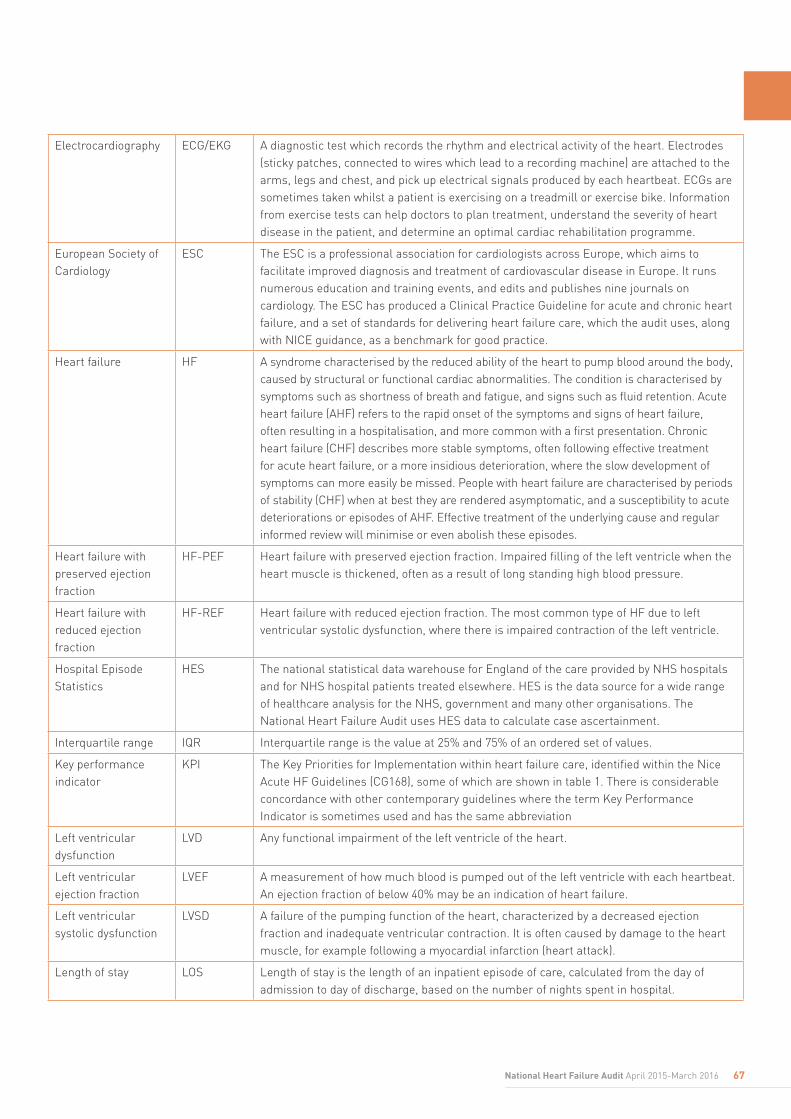
Electrocardiography ECG/EKG A diagnostic test which records the rhythm and electrical activity of the heart. Electrodes (sticky patches, connected to wires which lead to a recording machine) are attached to the arms, legs and chest, and pick up electrical signals produced by each heartbeat. ECGs are sometimes taken whilst a patient is exercising on a treadmill or exercise bike. Information from exercise tests can help doctors to plan treatment, understand the severity of heart disease in the patient, and determine an optimal cardiac rehabilitation programme.
European Society of Cardiology
ESC The ESC is a professional association for cardiologists across Europe, which aims to facilitate improved diagnosis and treatment of cardiovascular disease in Europe. It runs numerous education and training events, and edits and publishes nine journals on cardiology. The ESC has produced a Clinical Practice Guideline for acute and chronic heart failure, and a set of standards for delivering heart failure care, which the audit uses, along with NICE guidance, as a benchmark for good practice.
Heart failure HF A syndrome characterised by the reduced ability of the heart to pump blood around the body, caused by structural or functional cardiac abnormalities. The condition is characterised by symptoms such as shortness of breath and fatigue, and signs such as fluid retention. Acute heart failure (AHF) refers to the rapid onset of the symptoms and signs of heart failure, often resulting in a hospitalisation, and more common with a first presentation. Chronic heart failure (CHF) describes more stable symptoms, often following effective treatment for acute heart failure, or a more insidious deterioration, where the slow development of symptoms can more easily be missed. People with heart failure are characterised by periods of stability (CHF) when at best they are rendered asymptomatic, and a susceptibility to acute deteriorations or episodes of AHF. Effective treatment of the underlying cause and regular informed review will minimise or even abolish these episodes.
Heart failure with preserved ejection fraction
HF-PEF Heart failure with preserved ejection fraction. Impaired filling of the left ventricle when the heart muscle is thickened, often as a result of long standing high blood pressure.
Heart failure with reduced ejection fraction
HF-REF Heart failure with reduced ejection fraction. The most common type of HF due to left ventricular systolic dysfunction, where there is impaired contraction of the left ventricle.
Hospital Episode Statistics
HES The national statistical data warehouse for England of the care provided by NHS hospitals and for NHS hospital patients treated elsewhere. HES is the data source for a wide range of healthcare analysis for the NHS, government and many other organisations. The National Heart Failure Audit uses HES data to calculate case ascertainment.
Interquartile range IQR Interquartile range is the value at 25% and 75% of an ordered set of values.
Key performance indicator
KPI The Key Priorities for Implementation within heart failure care, identified within the Nice Acute HF Guidelines (CG168), some of which are shown in table 1. There is considerable concordance with other contemporary guidelines where the term Key Performance Indicator is sometimes used and has the same abbreviation
Left ventricular dysfunction
LVD Any functional impairment of the left ventricle of the heart.
Left ventricular ejection fraction
LVEF A measurement of how much blood is pumped out of the left ventricle with each heartbeat. An ejection fraction of below 40% may be an indication of heart failure.
Left ventricular systolic dysfunction
LVSD A failure of the pumping function of the heart, characterized by a decreased ejection fraction and inadequate ventricular contraction. It is often caused by damage to the heart muscle, for example following a myocardial infarction (heart attack).
Length of stay LOS Length of stay is the length of an inpatient episode of care, calculated from the day of admission to day of discharge, based on the number of nights spent in hospital.
67National Heart Failure Audit April 2015-March 2016
68 National Heart Failure Audit April 2015-March 2016
Medical Research Information Service
MRIS A Health and Social Care Information Centre service which links datasets at the level of individual patient records for medical research projects. NICOR uses MRIS to determine the life status of patients included in the audit, so as to calculate mortality rates. MRIS also provides the audit with HES data for this report.
Mineralocorticoid receptor antagonist
MRA A group of diuretic medicines, whose main action is to block the response to the hormone aldosterone, which promotes the retention of salt and the loss of potassium and magnesium. MRAs increase urination, reduce water and salt, and retain potassium. They help to lower blood pressure and increase the pumping ability of the heart.
National Clinical Audit and Patient Outcomes Programme
NCAPOP A group of 40 national clinical audit and clinical outcomes review programmes, funded by NHSE and overseen by the Healthcare Quality Improvement Partnership (HQIP). The programme collects data on the implementation of evidence based clinical standards in UK Trusts and reports on patient outcomes.
National Institute for Cardiovascular Outcomes Research
NICOR Part of the National Centre for Cardiovascular Prevention and Outcomes, based in the Institute of Cardiovascular Science at University College London. NICOR manages six national clinical audits, including the National Heart Failure Audit, and two technology registries.
New York Heart Association class
NYHA class NYHA classification is used to describe degrees of heart failure by placing patients in one of four categories based on how much they are limited during physical activity:
Class I (Mild): No limitation of physical activity. Ordinary physical activity does not cause undue fatigue, palpitation, or dyspnoea (shortness of breath).
Class II (Mild): Slight limitation of physical activity. Comfortable at rest, but ordinary physical activity results in fatigue, palpitation, or dyspnoea.
Class III (Moderate): Marked limitation of physical activity. Comfortable at rest, but less than ordinary activity causes fatigue, palpitation, or dyspnoea.
Class IV (Severe): Unable to carry out any physical activity without discomfort. Symptoms of cardiac insufficiency at rest. If any physical activity is undertaken, discomfort is increased.
Oedema An excess build-up of fluid in the body, causing tissue to become swollen. Heart failure patients often suffer from peripheral oedema, affecting the feet and ankles, and pulmonary oedema, in which fluid collects around the lungs.
Patient Episode Database of Wales
PEDW The national statistics database for Wales, collecting data on all inpatient and outpatient activity undertaken in NHS hospitals in Wales, and on Welsh patients treated in English NHS Trusts.
69National Heart Failure Audit April 2015-March 2016
7 References
1. NICE Acute Heart Failure Quality Standards
www.nice.org.uk/guidance/qs103
2. ‘Chronic HF: Management of chronic HF in adults in primary
and secondary care’ (CG108) 2010
https://www.nice.org.uk/guidance/cg108
3. ‘Chronic heart failure quality standards’ (QS9),
https://www.nice.org.uk/guidance/qs9
4. 2012 European Society of Cardiology (ESC) Acute and Chronic
HF Guidance
http://www.escardio.org/Guidelines-&-Education/Clinical-
Practice-Guidelines/ Acute-and-Chronic-Heart-Failure
5. NICE guideline on Acute Heart Failure (CG 187)
https://www.nice.org.uk/Guidance/CG187
6. NHS England’s NHS Standard Contracts 2013/14.
https:// www.england.nhs.uk/nhs-standard-
contract/13-14/
7. NHS England’s NHS Standard Contracts 2014/15
https:// www.england.nhs.uk/nhs-standard-
contract/14-15/
8. Mortality data from the Office for National Statistics
http://content.digital.nhs.uk/onsmortality

70 National Heart Failure Audit April 2015-March 2016
Designed and published by:
creative.co.uk

Designed and published by:
Copyright All rights reserved. © 2017 Healthcare Quality Improvement Partnership. No part of this publication may be reproduced, stored in a retrieval system, or transmitted in any form or by any other means, electronic, mechanical, photocopying, recording, or otherwise, without prior permission, in writing, of the copyright holders.


![1 Heart Failure [HF]. 2 Definition of HF Heart failure is a complex clinical syndrome that can result from any structural or functional cardiac disorder.](https://static.fdocuments.us/doc/165x107/56649d415503460f94a1bd01/1-heart-failure-hf-2-definition-of-hf-heart-failure-is-a-complex-clinical.jpg)