British Journal of Nutrition - Lund University · Knaze, Viktoria; Zamora-Ros, Raul; Lujan-Barroso,...
17
Intake estimation of total and individual flavan-3-ols, proanthocyanidins and theaflavins, their food sources and determinants in the European Prospective Investigation into Cancer and Nutrition (EPIC) study Knaze, Viktoria; Zamora-Ros, Raul; Lujan-Barroso, Leila; Romieu, Isabelle; Scalbert, Augustin; Slimani, Nadia; Riboli, Elio; van Rossum, Caroline T. M.; Bueno-de-Mesquita, H. Bas; Trichopoulou, Antonia; Dilis, Vardis; Tsiotas, Konstantinos; Skeie, Guri; Engeset, Dagrun; Ramon Quiros, J.; Molina, Esther; Maria Huerta, Jose; Crowe, Francesca; Wirfält, Elisabet; Ericson, Ulrika; Peeters, Petra H. M.; Kaaks, Rudolf; Teucher, Birgit; Johansson, Gerd; Johansson, Ingegerd; Tumino, Rosario; Boeing, Heiner; Drogan, Dagmar; Amiano, Pilar; Mattiello, Amalia; Khaw, Kay-Tee; Luben, Robert; Krogh, Vittorio; Ardanaz, Eva; Sacerdote, Carlotta; Salvini, Simonetta; Overvad, Kim; Tjonneland, Anne; Olsen, Anja; Boutron-Ruault, Marie-Christine; Fagherazzi, Guy; Perquier, Florence; Gonzalez, Carlos A. Published in: British Journal of Nutrition DOI: 10.1017/S0007114511006386 Published: 2012-01-01 Link to publication Citation for published version (APA): Knaze, V., Zamora-Ros, R., Lujan-Barroso, L., Romieu, I., Scalbert, A., Slimani, N., ... Gonzalez, C. A. (2012). Intake estimation of total and individual flavan-3-ols, proanthocyanidins and theaflavins, their food sources and determinants in the European Prospective Investigation into Cancer and Nutrition (EPIC) study. British Journal of Nutrition, 108(6), 1095-1108. DOI: 10.1017/S0007114511006386
Transcript of British Journal of Nutrition - Lund University · Knaze, Viktoria; Zamora-Ros, Raul; Lujan-Barroso,...

LUND UNIVERSITY
PO Box 117221 00 Lund+46 46-222 00 00
Intake estimation of total and individual flavan-3-ols, proanthocyanidins andtheaflavins, their food sources and determinants in the European ProspectiveInvestigation into Cancer and Nutrition (EPIC) study
Knaze, Viktoria; Zamora-Ros, Raul; Lujan-Barroso, Leila; Romieu, Isabelle; Scalbert,Augustin; Slimani, Nadia; Riboli, Elio; van Rossum, Caroline T. M.; Bueno-de-Mesquita, H.Bas; Trichopoulou, Antonia; Dilis, Vardis; Tsiotas, Konstantinos; Skeie, Guri; Engeset,Dagrun; Ramon Quiros, J.; Molina, Esther; Maria Huerta, Jose; Crowe, Francesca; Wirfält,Elisabet; Ericson, Ulrika; Peeters, Petra H. M.; Kaaks, Rudolf; Teucher, Birgit; Johansson,Gerd; Johansson, Ingegerd; Tumino, Rosario; Boeing, Heiner; Drogan, Dagmar; Amiano,Pilar; Mattiello, Amalia; Khaw, Kay-Tee; Luben, Robert; Krogh, Vittorio; Ardanaz, Eva;Sacerdote, Carlotta; Salvini, Simonetta; Overvad, Kim; Tjonneland, Anne; Olsen, Anja;Boutron-Ruault, Marie-Christine; Fagherazzi, Guy; Perquier, Florence; Gonzalez, Carlos A.Published in:British Journal of Nutrition
DOI:10.1017/S0007114511006386
Published: 2012-01-01
Link to publication
Citation for published version (APA):Knaze, V., Zamora-Ros, R., Lujan-Barroso, L., Romieu, I., Scalbert, A., Slimani, N., ... Gonzalez, C. A. (2012).Intake estimation of total and individual flavan-3-ols, proanthocyanidins and theaflavins, their food sources anddeterminants in the European Prospective Investigation into Cancer and Nutrition (EPIC) study. British Journal ofNutrition, 108(6), 1095-1108. DOI: 10.1017/S0007114511006386

General rightsCopyright and moral rights for the publications made accessible in the public portal are retained by the authorsand/or other copyright owners and it is a condition of accessing publications that users recognise and abide by thelegal requirements associated with these rights.
• Users may download and print one copy of any publication from the public portal for the purpose of privatestudy or research. • You may not further distribute the material or use it for any profit-making activity or commercial gain • You may freely distribute the URL identifying the publication in the public portalTake down policyIf you believe that this document breaches copyright please contact us providing details, and we will removeaccess to the work immediately and investigate your claim.
Download date: 11. Sep. 2018

British Journal of Nutritionhttp://journals.cambridge.org/BJN
Additional services for British Journal of Nutrition:
Email alerts: Click hereSubscriptions: Click hereCommercial reprints: Click hereTerms of use : Click here
Intake estimation of total and individual flavan3ols, proanthocyanidins and theaflavins, their food sources and determinants in the European Prospective Investigation into Cancer and Nutrition (EPIC) study
Viktoria Knaze, Raul ZamoraRos, Leila LujánBarroso, Isabelle Romieu, Augustin Scalbert, Nadia Slimani, Elio Riboli, Caroline T. M. van Rossum, H. Bas BuenodeMesquita, Antonia Trichopoulou, Vardis Dilis, Konstantinos Tsiotas, Guri Skeie, Dagrun Engeset, J. Ramón Quirós, Esther Molina, José María Huerta, Francesca Crowe, Elisabet Wirfäl, Ulrika Ericson, Petra H. M. Peeters, Rudolf Kaaks, Birgit Teucher, Gerd Johansson, Ingegerd Johansson, Rosario Tumino, Heiner Boeing, Dagmar Drogan, Pilar Amiano, Amalia Mattiello, KayTee Khaw, Robert Luben, Vittorio Krogh, Eva Ardanáz, Carlotta Sacerdote, Simonetta Salvini, Kim Overvad, Anne Tjønneland, Anja Olsen, MarieChristine BoutronRuault, Guy Fagherazzi, Florence Perquier and Carlos A. González
British Journal of Nutrition / Volume 108 / Issue 06 / September 2012, pp 1095 1108DOI: 10.1017/S0007114511006386, Published online: 20 December 2011
Link to this article: http://journals.cambridge.org/abstract_S0007114511006386
How to cite this article:Viktoria Knaze, Raul ZamoraRos, Leila LujánBarroso, Isabelle Romieu, Augustin Scalbert, Nadia Slimani, Elio Riboli, Caroline T. M. van Rossum, H. Bas BuenodeMesquita, Antonia Trichopoulou, Vardis Dilis, Konstantinos Tsiotas, Guri Skeie, Dagrun Engeset, J. Ramón Quirós, Esther Molina, José María Huerta, Francesca Crowe, Elisabet Wirfäl, Ulrika Ericson, Petra H. M. Peeters, Rudolf Kaaks, Birgit Teucher, Gerd Johansson, Ingegerd Johansson, Rosario Tumino, Heiner Boeing, Dagmar Drogan, Pilar Amiano, Amalia Mattiello, KayTee Khaw, Robert Luben, Vittorio Krogh, Eva Ardanáz, Carlotta Sacerdote, Simonetta Salvini, Kim Overvad, Anne Tjønneland, Anja Olsen, MarieChristine BoutronRuault, Guy Fagherazzi, Florence Perquier and Carlos A. González (2012). Intake estimation of total and individual flavan3ols, proanthocyanidins and theaflavins, their food sources and determinants in the European Prospective Investigation into Cancer and Nutrition (EPIC) study. British Journal of Nutrition, 108, pp 10951108 doi:10.1017/S0007114511006386
Request Permissions : Click here
Downloaded from http://journals.cambridge.org/BJN, IP address: 130.235.89.141 on 28 Nov 2012

Intake estimation of total and individual flavan-3-ols, proanthocyanidins andtheaflavins, their food sources and determinants in the European ProspectiveInvestigation into Cancer and Nutrition (EPIC) study
Viktoria Knaze1, Raul Zamora-Ros1*, Leila Lujan-Barroso1, Isabelle Romieu2, Augustin Scalbert2,Nadia Slimani2, Elio Riboli3, Caroline T. M. van Rossum4, H. Bas Bueno-de-Mesquita4,5,Antonia Trichopoulou6,7, Vardis Dilis6,7, Konstantinos Tsiotas6, Guri Skeie8, Dagrun Engeset8,J. Ramon Quiros9, Esther Molina10,11, Jose Marıa Huerta11,12, Francesca Crowe13, Elisabet Wirfal14,Ulrika Ericson14, Petra H. M. Peeters3,15, Rudolf Kaaks16, Birgit Teucher16, Gerd Johansson17,Ingegerd Johansson18, Rosario Tumino19, Heiner Boeing20, Dagmar Drogan20, Pilar Amiano11,21,Amalia Mattiello22, Kay-Tee Khaw23, Robert Luben23, Vittorio Krogh24, Eva Ardanaz11,25,Carlotta Sacerdote26, Simonetta Salvini27, Kim Overvad28, Anne Tjønneland29, Anja Olsen29,Marie-Christine Boutron-Ruault30,31, Guy Fagherazzi30,31, Florence Perquier30,31 and Carlos A. Gonzalez1
1Unit of Nutrition, Environment and Cancer, Cancer Epidemiology Research Programme, Catalan Institute of Oncology
(ICO-IDIBELL), Avda Gran Via 199-203 08907 L’Hospitalet de Llobregat, Barcelona, Spain2Dietary Exposure Assessment Group, International Agency for Research on Cancer (IARC), Lyon, France3Department of Epidemiology and Biostatistics, School of Public Health, Faculty of Medicine, Imperial College London,
London, UK4National Institute of Public Health and the Environment (RIVM), Bilthoven, The Netherlands5Department of Gastroenterology and Hepatology, University Medical Center Utrecht (UMCU), Utrecht, The Netherlands6WHO Collaborating Center for Food and Nutrition Policies, Department of Hygiene, Epidemiology and Medical Statistics,
University of Athens Medical School, Athens, Greece7Hellenic Health Foundation, Athens, Greece8Department of Community Medicine, University of Tromsø, Tromsø, Norway9Public Health and Health Planning Directorate, Asturias, Spain10Andalusian School of Public Health, Granada, Spain11CIBER Epidemiologıa y Salud Publica (CIBERESP), Barcelona, Spain12Department of Epidemiology, Murcia Regional Health Authority, Murcia, Spain13Cancer Epidemiology Unit, Nuffield Department of Clinical Medicine, University of Oxford, Oxford, UK14Department of Clinical Sciences in Malmo, Nutrition Epidemiology, Lund University, Malmo, Sweden15Julius Center, University Medical Center Utrecht, Utrecht, The Netherlands16Department of Cancer Epidemiology, German Cancer Research Center, Heidelberg, Germany17Department of Clinical Medicine and Public Health/Nutritional Research, Umea University, Umea, Sweden18Department of Odontology/Cariology, Umea University, Umea, Sweden19Cancer Registry and Histopathology Unit, “Civile M.P. Arezzo” Hospital, Ragusa, Italy20Department of Epidemiology, German Institute of Human Nutrition Potsdam-Rehbrucke, Nuthetal, Germany21Public Health Division of Gipuzkoa, Institute Investigation BioDonostia, Basque Government, San Sebastian, Spain22Department of Clinical and Experimental Medicine, Federico II University, Naples, Italy23School of Clinical Medicine, University of Cambridge, Cambridge, UK24Nutritional Epidemiology Unit, Fondazione IRCCS Istituto Nazionale dei Tumori, Milan, Italy25Navarre Public Health Institute, Pamplona, Spain26Center for Cancer Prevention (CPO-Piemonte), and Human Genetic Foundation (HuGeF), Torino, Italy27Molecular and Nutritional Epidemiology Unit, ISPO Cancer Prevention and Research Institute, Florence, Italy
Abbreviations: 24-HDR, 24 h dietary recall; EPIC, European Prospective Investigation into Cancer and Nutrition; FCDB, food composition database;
MED, Mediterranean; PA, proanthocyanidins; USDA, US Department of Agriculture.
*Corresponding author: R. Zamora-Ros, fax þ34 932607787, email [email protected]
British Journal of Nutrition (2012), 108, 1095–1108 doi:10.1017/S0007114511006386q The Authors 2011
British
Journal
ofNutrition

28Department of Epidemiology, School of Public Health, Aarhus University, Aarhus, Denmark29Institute of Cancer Epidemiology, Danish Cancer Society, Copenhagen, Denmark30INSERM, Centre for Research in Epidemiology and Population Health, U1018, Institut Gustave Roussy, F-94805
Villejuif, France31Paris South University, UMRS 1018, F-94805 Villejuif, France
(Submitted 27 July 2011 – Final revision received 13 October 2011 – Accepted 22 October 2011 – First published online 20 December 2011)
Abstract
Epidemiological studies suggest health-protective effects of flavan-3-ols and their derived compounds on chronic diseases. The present
study aimed to estimate dietary flavan-3-ol, proanthocyanidin (PA) and theaflavin intakes, their food sources and potential determinants
in the European Prospective Investigation into Cancer and Nutrition (EPIC) calibration cohort. Dietary data were collected using a standar-
dised 24 h dietary recall software administered to 36 037 subjects aged 35–74 years. Dietary data were linked with a flavanoid food
composition database compiled from the latest US Department of Agriculture and Phenol-Explorer databases and expanded to include
recipes, estimations and retention factors. Total flavan-3-ol intake was the highest in UK Health-conscious men (453·6 mg/d) and
women of UK General population (377·6 mg/d), while the intake was the lowest in Greece (men: 160·5 mg/d; women: 124·8 mg/d).
Monomer intake was the highest in UK General population (men: 213·5 mg/d; women: 178·6 mg/d) and the lowest in Greece
(men: 26·6 mg/d in men; women: 20·7 mg/d). Theaflavin intake was the highest in UK General population (men: 29·3 mg/d; women:
25·3 mg/d) and close to zero in Greece and Spain. PA intake was the highest in Asturias (men: 455·2 mg/d) and San Sebastian (women:
253 mg/d), while being the lowest in Greece (men: 134·6 mg/d; women: 101·0 mg/d). Except for the UK, non-citrus fruits (apples/
pears) were the highest contributors to the total flavan-3-ol intake. Tea was the main contributor of total flavan-3-ols in the UK.
Flavan-3-ol, PA and theaflavin intakes were significantly different among all assessed groups. This study showed heterogeneity in
flavan-3-ol, PA and theaflavin intake throughout the EPIC countries.
Key words: Flavan-3-ols: Proanthocyanidins: Theaflavins: Intake: European Prospective Investigation into Cancer and
Nutrition-Europe
Flavan-3-ols or flavanols, terms used interchangeably, are
compounds that belong to a polyphenol subclass called
flavonoids, which share a common C6–C3–C6 skeleton.
Flavan-3-ols are perhaps the most structurally complex in
the flavonoid subclass ranging from simple monomers (such
as catechin and its isomer epicatechin) to oligomers (from
dimers to decamers), polymers (.10mers) and other derived
compounds (e.g. theaflavins and thearubigins). The oligo
and polymers of flavan-3-ols are also referred to as condensed
tannins or proanthocyanidins (PA), named for their ability
to yield anthocyanidins when heated in acidic media(1).
Enzymatic and non-enzymatic oxidation of (gallo)catechins,
reactions characteristic of green tea fermentation, results in
flavanol-derived compounds: theaflavins and high-molecular-
weight thearubigins(1,2). Being much larger molecules, PA
and flavanol-derived compounds tend to be less bioavailable
and have different functional properties; therefore they are
often considered as separate groups of flavonoids(1,3).
Although their average degree of polymerisation can be esti-
mated, the structures of some high-molecular weight polymers
of PA and of most of the thearubigins have not been well
defined due to inadequate analytical methods(1).
Flavan-3-ol monomers are found ubiquitously in plants as
secondary metabolites(4). Flavan-3-ol monomers are most
abundant in fruits (e.g. berries, apples/pears, stone fruits),
barley, cocoa beans, nuts(5) and their derived products(6).
Gallocatechins are found, almost exclusively, in green tea
infusions(2,7) while flavanol-derived compounds, theaflavins
and thearubigins, are abundant in fermented black and
oolong teas(2). Common PA-rich foods are cocoa, berries,
nuts and some raw beans(5,8). Transformations and losses of
some flavonoid compounds during processing and cooking
are common and vary for different subclasses and even for
the individual compounds(9–11).
Total and individual compounds of flavan-3-ols have
been studied extensively in vitro for their antioxidant, anti-
inflammatory, immunomodulator and anti-carcinogenic
effects(12–14). A plethora of human intervention studies
currently available strongly suggests beneficial effects on
human health, particularly the effects of flavan-3-ol-rich
foods, such as tea, cocoa and chocolate(7,15,16). Intervention
studies involving various PA-rich sources such as red wine,
grape, pomegranate, chocolate and cranberry juice showed
numerous positive effects on antioxidant, CVD and endo-
thelial maintenance biomarkers(3). Given the limited reported
bioavailability of PA, particularly those having a high degree of
polymerisation (.3)(17), the observed action of PA-rich foods
in the body, with the exception of perhaps the intestinal
lumen, may be attributed to flavan-3-ol monomers, which
are systematically associated to PA and comprise 5–25 % in
these foods, or to other yet unidentified PA(3,18). Furthermore,
PA may also exert their action after their degradation by the
colonic microbiota and subsequent absorption(19). Indeed,
two Italian case–control studies suggested inverse associ-
ations between PA, but not flavan-3-ol monomer, intake and
gastric and colorectal cancers(20,21). Furthermore, the inverse
association augmented with increasing degrees of polymeris-
ation of PA in colorectal cancer cases(20) despite their observed
V. Knaze et al.1096
British
Journal
ofNutrition

decrease in absorption. Further research, particularly in pro-
spective studies, on individual flavan-3-ol and PA compounds
is clearly needed to clarify and confirm these potential effects.
Total intake of any nutrients is usually related to sex,
cultural, lifestyle and socio-economic factors that may affect
accessibility to and habitual consumption of health-promoting
foods. Studies in European Prospective Investigation into
Cancer and Nutrition (EPIC) Spain and the USA found signifi-
cant differences in total flavonoid intake between sexes
and among different age groups, socio-economic levels and
ethnic groups(22,23). Therefore, these factors need to be
taken into consideration when looking into associations of
these compounds and their dietary sources in disease preven-
tion. To our knowledge, there are few data on individual
flavan-3-ol intakes in the European population. The present
study aims to evaluate total, subclasses and individual dietary
intake of flavan-3-ols and their main food sources by EPIC
centre and geographical region, while taking into account
lifestyle, anthropometric and socio-demographic factors.
Materials and methods
Study population
EPIC is an ongoing prospective cohort study designed to
investigate the associations between diet, lifestyle and cancer
throughout ten Western European countries: Denmark,
France, Germany, Greece, Italy, Norway, Spain, Sweden,
The Netherlands and UK(24). The cohort includes approxi-
mately 366 000 women and 153 000 men, most of them aged
35–74 years, who were enrolled between 1992 and 2000 by
twenty-three centres. Some differences in methods of recruit-
ment exist between centres. Part of the Oxford (UK) cohort
was recruited from subjects who consumed a vegetarian-
type diet. This was designated a ‘Health-conscious’ group
and shall be distinguished from the UK General population
cohort which is a combined group of the UK Cambridge
and UK Oxford general population. The female part of the
cohort in Florence (Italy) and Utrecht (The Netherlands) is
composed of women who underwent breast cancer screening.
The French cohorts recruited women only, but from the mem-
bers of the health insurance scheme for the state-school
employees. The centres in Italy and Spain recruited mostly
blood donors. For the purpose of dietary consumption
patterns analysis, the initial twenty-three centres were later
redefined by geographical areas into twenty-seven centres(25).
The calibration subsample of the EPIC cohort study composed
of 36 994 subjects (8 % of the whole EPIC cohort), who were
recruited to be a random sample stratified by age, sex and
centre, and weighted for expected cancer cases in each
stratum of the main EPIC cohort study, was considered
herein. After exclusion of 945 subjects under 35 or over
74 years of age because of low participation in these age
categories, and sixteen subjects without baseline dietary
data, a total of 36 037 subjects were included. Approval for
the study was obtained from the ethical review boards of all
local recruiting research institutions. All participants provided
written informed consent.
Measurements of diet and other lifestyle factors
Dietary intake was measured with a standardised 24 h dietary
recall (24-HDR) administered via a computerised interview
programme (EPIC-SOFT) developed specifically for the EPIC
calibration study(25,26). The 24-HDR was administered in a
face-to-face interview, except in Norway where it was
obtained by telephone(27). A detailed description of the ration-
ale and methodology of the 24-HDR calibration study in the
EPIC cohort has been described elsewhere(24,28–30). Data on
socio-demographic and lifestyle factors, including educational
level, physical activity and smoking history were collected
at baseline through standardised questionnaires and clinical
examinations for the calibration sample(31–34). Age as well
as body weight and height were self-reported by the partici-
pants during the 24-HDR interview. The mean time interval
between these baseline questionnaire measures and the
24-HDR interview varied by country, from 1 d to 3 years(24).
Flavonoid Food Composition Database
The US Department of Agriculture (USDA) released a PA
database in 2004 and an updated flavonoid database in 2007,
with more analytical values for raw, cooked, canned and
commercially processed foods(35,36). In the process of combin-
ing the two USDA databases, we observed data duplicity of
the monomers. Since flavan-3-ols monomers (USDA database
on flavonoids)(35) and PA monomers (USDA database on
PA)(36) are the same molecules, the PA monomer data was
removed. We expanded these databases with analytical
values from the Phenol-Explorer database released in
2009(37). Approximately, 6·5 and 0·6 % of our database came
from USDA and Phenol-Explorer, respectively. Thus far,
these databases are the most complete and updated databases
on flavonoids/polyphenols and they evaluate and compile the
most worldwide food composition data published. We further
expanded our EPIC-specific food composition database
(FCDB) by estimating values for foods not present in either
of the two databases, but that had occurred in the 24-HDR.
Therefore, for our FCDB, we calculated estimated values
(92·9 %) including logical zeros (25·3 %), estimations based
on similar food items (22·5 %), application of retention factors
(27·7 %) and recipes (17·3 %). When there were no analytical
data provided for cooked foods by either USDA or Phenol-
Explorer, retention factors were applied. The retention factors
reported in various foods were between 42 and 74 % for cate-
chins and 0 and 95 % for tannins(38). Therefore, to simplify and
homogenise the calculations, we used the same retention
factors for all flavonoids, as in our previous studies(23,39,40).
They were 70, 35 and 25 % after frying, cooking in a micro-
wave oven and boiling, respectively(41). The final FCDB
created contained a total of 1877 food items. The unknown
composition values, without any analytical or estimated data,
were calculated as a zero by default and ranged from 2 %
(theaflavin gallates) to 16 % (epicatechin-3-gallates). Finally,
the 24-HDR food items were linked with the expanded
flavonoid FCDB using an ad hoc SQL (Structured Query
Language) application.
Dietary flavanols in EPIC 1097
British
Journal
ofNutrition

Statistical methods
General linear modelling was used for the calculation of
the adjusted daily mean (least squared) intake and standard
error using SPSS (version 17.0.0, SPSS, Inc.) for total flavan-
3-ols, their individual compounds and subgroups. The mean
intake was adjusted for age, weighted by season and day of
24-HDR and stratified by EPIC centre and age. Flavan-3-ol
monomers as aglycones included: catechin, epigallocatechin,
epicatechin, epicatechin-3-gallate, epigallocatechin-3-gallate,
gallocatechin and catechin-3-gallate. PA were divided into
the following subgroups: dimers, trimers, 4–6mers,
7–10mers and .10mers (polymers). Theaflavins included
compounds: theaflavin, theaflavin-3,30-digallate, theaflavin-30-
gallate and theaflavin-3-gallate. Although present in the USDA
database, due to the extensive limitations in analytical methods
currently employed to identify and quantify thearubigins,
we did not include them in our analysis of total flavan-3-
ols(1,41). Epigallocatechin, epicatechin-3-gallate, epigallocate-
chin-3-gallate, gallocatechin and catechin-3-gallate were later
combined into a single group called ‘(epi)gallocatechins’ due
to the resemblance among the chemical structures. Flavan-3-
ol monomer, PA and theaflavin intakes are calculated as the
sum of the individual compounds or subgroups and expressed
in mg/100 g of fresh weight. During the analysis of the related
factors and of the main food sources, EPIC centres were com-
bined by geographical regions into a Mediterranean (MED)
region (Greece, Italy, Spain and South of France) and
non-MED (non-MED) region (France other than the South
centre, Germany, The Netherlands, Norway, Denmark and
Sweden). The UK General population cohort and the
Health-conscious cohort presented similar intakes for flavan-
3-ols and their food sources but markedly different from all
others; therefore, in the socio-demographic analysis they
were kept as a separate UK region. The contribution of each
food and food group to the total and individual intake of
flavan-3-ols was calculated as a percentage. The general
linear modelling was also used in the comparison of the
mean intakes by socio-demographic, anthropometric and
lifestyle factors, adjusting for age, region, energy intake and
BMI, and weighted for season and day of 24-HDR. P values
,0·05 indicated significance.
Results
A south-to-north gradient in the daily mean intake of total and
monomers of flavan-3-ols and of theaflavins was observed
among EPIC centres in both men and women (Table 1). The
highest total flavan-3-ol intake was observed in the UK
Health-conscious men (453·6 mg/d) and in women of the
UK General population cohort (377·6 mg/d). The lowest total
intake was observed in Greek men (160·5 mg/d) and women
(124·8 mg/d). Flavan-3-ol monomer intake was the highest in
the UK General population (213·5 mg/d in men, 178·6 mg/d
in women) and the lowest in Greece (26·6 mg/d in men,
20·7 mg/d in women). Theaflavin intake was the highest in
the UK General population for both men (29·3 mg/d) and
women (25·3 mg/d). Daily theaflavin intake was close to
0 mg in Greece and in Spanish and southern Italian centres
(Ragusa, Naples and Florence). In contrast, daily intake of
total PA was the highest in Spanish centres (455·2 mg in men
from Asturias and 237·9 mg in women from San Sebastian),
followed by men in Turin (Italy) and women in Asturias
(Spain), respectively. However, PA intake was the lowest in
Greece (134·6 mg/d in men and 101·0 mg/d in women).
Intake amounts of the individual flavan-3-ols, theaflavins
and of PA subgroups are presented in Annexes 1 and 2. PA
subclass, particularly the group of polymers (.10mers), was
the highest contributor to the total flavan-3-ol intake
(Table 2). Flavan-3-ol monomers were the second highest
contributors to the total intake, providing contribution of
between 18·6 % in the MED region and 44·9 % in the UK.
Catechins and epicatechins, equally, were the main single-
compound contributors in the MED region, while in the
non-MED and UK regions it was the epigallocatechin-3-gallate
monomers. Theaflavins were the lowest contributors to the
total flavan-3-ol intake. The four theaflavin compounds
contributed almost equally to the total theaflavins in all three
regions.
Non-citrus fruit, particularly apples/pears, was the most
important food source of total flavan-3-ols in the MED
(56·2 %) and non-MED (34·1 %) regions (Table 3). Wine and
then tea were the other two major sources of flavan-3-ols in
these two regions. On the other hand, tea (51·3 %) was the
most prominent source of total flavan-3-ols in the UK,
followed by non-citrus fruit (19·9 %) and wine (6·1 %). The
major food sources of catechins and epicatechins in all
three regions were tea, non-citrus fruits and wine; however,
chocolate candy/bars were also noteworthy dietary contribu-
tors. Tea was the lone source of theaflavins and a major
source of (epi)gallocatechins in all three regions (77·7 % in
the MED, 90·5 % in the non-MED and 95·1 % in the UK
region). The principal dietary source of total PA in the MED
region was non-citrus fruit (62·3 %) followed by wine
(17·3 %) and chocolate candy/bars (4·6 %). Non-citrus fruits
were also the main source of PA in the non-MED and UK
regions, but their contributions were smaller (48·0 and
37·2 %, respectively). In the non-MED region, wine was the
second most important source (12·6 %), followed by choco-
late/candy (6·6 %) and tea (5·0 %). Whereas in the UK region,
the secondary sources of PA were tea (15·0 %), wine (10·0 %),
cakes/pies/pastries/puddings (7·6 %) and pulses (7·1 %).
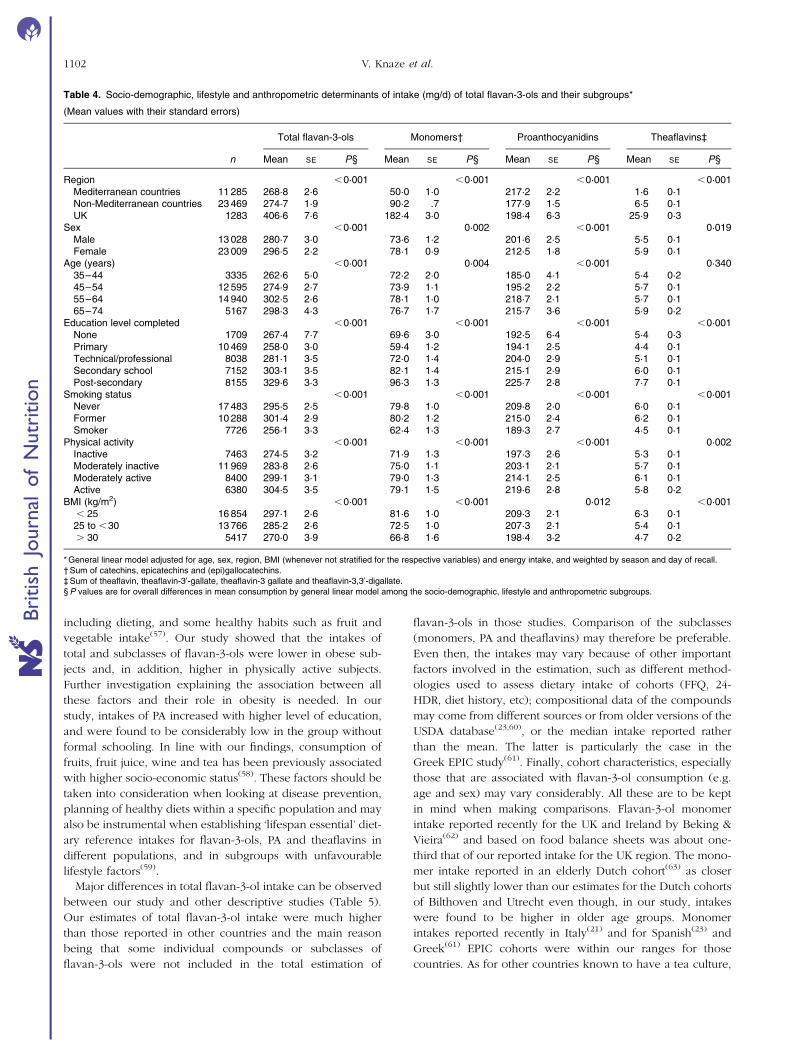
Sex-stratified analysis of the related factors showed similar
results; therefore the data are presented for men and women
combined (Table 4). Total flavan-3-ol intake and also the
intake stratified by monomers, PA and theaflavins were shown
to significantly vary between the geographical regions. The
intake of flavan-3-ol monomers and theaflavins in the UK
region was almost 4-fold and over 16-fold that of the MED
region, respectively. Conversely, PA intake was significantly
higher in the MED region (217·2 mg/d) compared to the
non-MED (177·9 mg/d) and the UK (198·4 mg/d) regions.
After adjusting for BMI and energy, women had significantly
higher intakes of total flavan-3-ols and their subclasses. The
intake of total flavan-3-ols and their subclasses was signifi-
cantly different between the age groups, being the highest
V. Knaze et al.1098
British
Journal
ofNutrition

Table 1. Adjusted* daily mean intakes (mg/d) of total and subgroups of flavan-3-ols in men and women by European Prospective Investigation into Cancer and Nutrition centre ordered fromsouth to north
(Mean values with their standard errors)
Men Women
Totalflavan-3-ols Monomers† PA Theaflavins‡
Totalflavan-3-ols Monomers† PA Theaflavins‡
Country and centre n Mean SE Mean SE Mean SE Mean SE n Mean SE Mean SE Mean SE Mean SE
Greece 1314 160·5 7·6 26·6 3·0 134·6 6·9 0·3 0·3 1373 124·8 7·4 20·7 2·9 101·0 6·5 0·6 0·3Spain
Granada 214 279·4 18·7 41·7 7·3 221·8 22·7 0·6 1·1 300 151·7 15·8 20·5 6·2 132·3 15·4 0·1 0·8Murcia 243 279·9 17·5 43·3 6·9 235·8 18·9 0·3 0·9 304 184·2 15·7 24·6 6·2 159·3 18·1 0·2 0·9Navarra 444 286·2 13·0 40·1 5·1 235·2 15·5 0·0 0·8 271 180·6 16·6 21·1 6·5 164·1 18·2 0·0 0·9San Sebastian 490 422·9 12·4 49·1 4·9 357·3 15·5 0·0 0·8 244 267·8 17·5 30·6 6·9 237·9 18·9 0·5 0·9Asturias 386 498·3 13·9 54·7 5·5 455·2 14·9 0·1 0·7 324 286·3 15·2 33·6 6·0 236·8 15·6 0·3 0·8
ItalyRagusa 168 317·5 21·1 53·9 8·3 239·6 28·8 0·4 1·4 138 235·4 23·3 37·3 9·2 193·7 27·1 0·4 1·4Naples 403 217·4 13·6 36·9 5·4 204·6 14·4 0·4 0·7Florence 271 382·7 16·6 61·1 6·5 325·5 18·4 0·7 0·9 784 264·3 9·8 54·5 3·8 209·5 11·3 1·0 0·6Turin 676 435·3 10·5 73·6 4·1 370·8 11·9 0·6 0·6 392 303·6 13·8 66·6 5·4 228·2 19·4 1·5 1·0Varese 327 379·9 77·2 5·9 258·7 23·5 1·4 1·2 794 276·4 9·7 70·4 3·8 192·4 9·9 1·7 0·5
FranceSouth coast 620 251·5 11·0 66·1 4·3 181·6 9·3 5·2 0·5South 1425 290·7 7·2 82·6 2·8 201·5 6·3 8·0 0·3North-East 2059 290·2 6·0 78·6 2·4 210·0 5·3 7·3 0·3North-West 631 281·4 10·9 83·7 4·3 185·9 9·8 8·8 0·5
GermanyHeidelberg 1034 301·6 8·5 88·3 3·3 207·6 15·9 6·6 0·8 1087 321·9 8·4 107·5 3·3 175·9 21·7 4·1 1·1Potsdam 1233 277·1 7·8 72·0 3·1 209·7 8·7 4·3 0·4 1061 261·5 8·4 59·9 3·3 187·8 12·2 2·9 0·6
The NetherlandsBilthoven 1024 220·6 8·6 77·8 3·4 128·1 20·8 10·4 1·0 1086 233·8 8·4 85·9 3·3 118·2 20·5 11·4 1·0Utrecht 1870 286·8 6·3 114·6 2·5 159·0 5·4 16·0 0·3
UKGeneral population 403 439·6 13·6 213·5 5·4 217·1 12·8 29·3 0·6 571 377·6 11·4 178·6 4·5 172·9 10·5 25·3 0·5Health-conscious 113 453·6 25·7 156·1 10·1 277·6 25·9 27·4 1·3 196 368·9 19·5 148·8 7·7 201·4 19·2 21·1 1·0
DenmarkCopenhagen 1356 325·5 7·4 96·0 2·9 229·6 11·2 9·7 0·6 1484 319·4 7·1 102·1 2·8 205·4 10·2 11·0 0·5Aarhus 567 312·7 11·5 85·7 4·5 295·7 23·7 5·6 1·2 510 347·7 12·1 92·5 4·8 218·5 22·8 8·9 1·1
SwedenMalmo 1421 242·3 7·4 103·9 2·9 143·7 7·4 3·1 0·4 1711 235·3 6·7 98·9 2·6 140·7 5·6 3·1 0·3Umea 1344 287·4 7·5 113·9 2·9 171·8 7·8 3·7 0·4 1574 271·3 6·9 108·9 2·7 160·7 6·6 3·7 0·3
NorwaySouth and East 1004 298·9 8·7 85·2 3·4 218·2 8·7 6·6 0·4North and West 793 289·2 9·8 70·5 3·8 232·0 9·9 4·9 0·5
PA, proanthocyanidins.* Adjusted for age and weighted by season and day of recall.† Sum of catechin, epicatechin and epicatechin 3-gallate, epigallocatechin 3-gallate, gallocatechin and catechin-3-gallate.‡ Sum of theaflavin, theaflavin-30-gallate, theaflavin-3 gallate and theaflavin-3,30-digallate.
Die
taryflav
anols
inEPIC
1099
British Journal of Nutrition

in the 55- to 64-year-olds. It also increased with the level of
education completed and the level of physical activity. On
the other hand, current smokers and obese participants (BMI
$30 kg/m2) had the lowest intakes of total flavan-3-ols and
their subclasses.
Discussion
To our knowledge, this is the only study thus far assessing the
intake of total and flavan-3-ol monomers, PA and flavan-3-ol-
derived compounds as well as their food sources and associ-
ated factors in all twenty-seven EPIC centres of ten European
countries using a common expanded flavonoid FCDB and
dietary assessment method (24-HDR). Our results show a
wide range of total flavan-3-ol intakes following a south-to-
north geographical gradient. When stratified by regions, total
flavan-3-ol intake in the UK was about 2-fold that of the
MED region. This relatively steep gradient in flavan-3-ol
intake was mainly due to higher intakes of theaflavins and epi-
gallocatechins in northern EPIC cohorts; indeed the main
source of these subclasses of flavan-3-ols was found to be
tea. On the other hand, PA intake was found to be statistically
higher in the MED region, although large differences were
also noted among centres within the same region. The main
source of PA in the MED region was non-citrus fruit, chiefly
apples and pears, followed by wine, similar to what was pre-
viously reported for the EPIC Spanish cohort(23). Furthermore,
the almost-nil intake of theaflavins in Greece, Spain and
southern Italy indicates minimal consumption of tea in these
countries. Even so, the major sources identified for the total
and individual flavanols, PA and theaflavins were quite similar
except in the UK where pulses also formed a considerable
food source of PA.
A well-established inverse geographical gradient of CVD
mortality exists(42), which may seem paradoxical with the
north-to-south gradient for flavan-3-ol intake and the
observed beneficial effects of these compounds and flavo-
noid-rich foods against CVD(13,15,16). Though far-fetched at
this point to imply that flavan-3-ols have a significant role in
CVD, a few factors could be considered to help elucidate
this. Despite their higher observed antioxidant activity
in vitro (43,44), galloylated flavan-3-ol monomers (mainly
found in fermented/black teas) have lower bioavailability
than non-galloylated monomers(3,44) (found more commonly
in non-citrus fruit, green tea and cocoa). However, it is more
likely that other risk factors of CVD may be more prevalent
in the northern countries, such as high intake of SFA(45), low
intake of MUFA(46), low intake of fruits and vegetables(47),
low wine consumption(48), sedentary lifestyle(49,50) and social
class influences(51).
The present study also demonstrated that statistical differ-
ences exist in flavan-3-ol intakes among groups with different
socio-demographic, anthropometric and lifestyle character-
istics. Consumption of total flavan-3-ols, monomers and PA
increased with age up to about 64 years of age and then it
fell slightly. Similar results were seen in Spanish-EPIC(23),
US(8,22) and Australian(52) studies in adults. The intakes were
significantly higher in former and never smokers. Since the
major sources were tea and fruits, respectively, this suggests
possible interaction between the consumption of these food
sources and smoking habits(53,54). Additionally, two case–con-
trol studies suggested that a flavonoid-rich diet may protect
against pancreatic and lung cancer in smokers only(55,56).
Total flavan-3-ol intakes have been shown to be significantly
associated with a slower increase of BMI in women in
The Netherlands Cohort Study after adjusting for confounders
Table 2. Percentage contribution* of individual and subclasses of flavan-3-ols to subclass and total intake in theEuropean Prospective Investigation into Cancer and Nutrition cohort by European region
Region
MED countries Non-MED countries UK
Class and compound Class (%) Total (%) Class (%) Total (%) Class (%) Total (%)
Flavan-3-ol monomers 100·0 18·6 100·0 32·9 100·0 44·9(þ )-Catechin 30·0 5·6 17·6 5·8 12·4 5·6(2 )-Epigallocatechin 9·4 1·7 13·8 4·5 17·5 7·9(2 )-Epicatechin 30·1 5·6 17·8 5·8 12·6 5·7(2 )-Epicatechin 3-gallate 7·4 1·4 11·9 3·9 13·6 6·1(2 )-Epigallocatechin 3-gallate 17·0 3·2 26·8 8·8 21·2 9·5(þ )-Gallocatechin 1·7 0·3 3·0 1·0 4·7 2·1(þ )-Catechin 3-gallate 4·3 0·8 9·1 3·0 18·1 8·1
PA or condensed tannins 100·0 80·8 100·0 64·8 100·0 48·8PA dimers 19·1 15·4 20·7 13·4 28·9 14·1PA trimers 6·8 5·5 7·2 4·7 7·8 3·8PA 4–6mers 22·5 18·2 20·6 13·4 19·0 9·2PA 7–10mers 16·7 13·5 15·0 9·7 13·6 6·6PA polymers (.10mers) 34·9 28·2 36·4 23·6 30·7 15·0
Theaflavins 100·0 0·6 100·0 2·4 100·0 6·4Theaflavin 26·0 0·2 26·0 0·6 25·9 1·6Theaflavin-3,30-digallate 29·1 0·2 29·2 0·7 29·2 1·9Theaflavin-30-gallate 22·7 0·1 22·6 0·5 22·7 1·4Theaflavin-3-gallate 22·2 0·1 22·2 0·5 22·3 1·4
MED, Mediterranean; Non-MED, non-Mediterranean; PA, proanthocyanidins.* Values are percentages derived from models adjusted for sex, age and weighted by season and day of recall.
V. Knaze et al.1100
British
Journal
ofNutrition

Table 3. Major food sources of dietary flavan-3-ols, their monomers, proanthocyanidins (PA) and theaflavins in the Mediterranean (MED), non-Mediterranean (non-MED) and UK regions*
Total flavan-3-ols (%) Monomers (%) Catechins (%) Epicatechins (%) EGC (%)† PA (%) Theaflavins (%)‡
Food groups and foods MED
Non-
MED UK MED
Non-
MED UK MED
Non-
MED UK MED
Non-
MED UK MED
Non-
MED UK Med
Non-
MED UK MED
Non-
MED UK
Coffee, tea, herbal teas 8·2 28·8 51·8 36·5 69·2 83·7 5·8 19·4 47·7 7·7 26·1 41·8 81·9 93·7 96·4 1·2 5·0 15·0 100·0 100·0 100·0
Coffee 0·0 0·2 0·1 0·2 0·5 0·3 0·0 0·0 0·0 0·4 1·4 1·3 0·3 0·4 0·2 0·0 0·0 0·0 0·0 0·0 0·0
Tea 7·9 28·0 51·3 34·7 66·8 82·6 5·6 19·1 47·5 7·3 24·7 40·4 77·7 90·5 95·1 1·2 5·0 15·0 100·0 100·0 100·0
Herbal tea 0·3 0·6 0·4 1·6 1·9 0·8 0·1 0·3 0·2 0·0 0·1 0·0 4·0 2·8 1·1 0·0 0·0 0·0 0·0 0·0 0·0
Wine 17·4 10·2 6·1 18·1 6·3 2·8 41·0 24·5 15·8 18·6 11·4 7·7 0·8 0·2 0·1 17·3 12·6 10·0 0·0 0·0 0·0
Beer, cider 3·4 3·1 3·2 2·1 3·6 1·3 5·9 16·5 3·9 0·9 2·5 0·6 0·2 0·6 1·0 3·7 3·0 5·5 0·0 0·0 0·0
Milk beverages 0·0 0·1 2·4 0·0 0·0 2·3 0·0 0·1 4·2 0·0 0·1 12·4 0·0 0·0 0·3 0·0 0·1 2·9 0·0 0·0 0·0
Fruit and vegetable juices 0·5 2·3 0·9 0·3 1·4 0·4 0·3 2·0 0·7 0·6 6·0 2·5 0·0 0·0 0·1 0·5 2·8 1·5 0·0 0·0 0·0
Carbonated/soft/isotonic
drinks, diluted syrups
0·0 2·2 0·2 0·0 0·2 0·0 0·0 0·7 0·1 0·0 0·3 0·1 0·0 0·1 0·0 0·0 3·3 0·3 0·0 0·0 0·0
Fruit 56·2 34·1 19·9 31·8 10·2 4·8 38·1 24·2 18·9 54·9 29·1 17·9 9·0 1·6 0·5 62·3 48·0 37·2 0·0 0·0 0·0
Apple and pear 33·0 21·8 11·5 17·2 5·7 2·1 11·1 6·0 2·0 38·2 22·6 13·5 5·4 1·0 0·3 36·8 31·0 22·0 0·0 0·0 0·0
Stone fruits 13·9 4·7 2·7 8·8 1·4 0·6 15·1 4·0 2·4 11·3 3·4 1·7 2·2 0·2 0·1 15·2 6·6 5·1 0·0 0·0 0·0
Grape 5·0 2·3 2·0 3·5 0·9 0·5 5·8 2·6 2·3 4·4 1·9 1·7 1·0 0·2 0·1 5·4 3·1 3·7 0·0 0·0 0·0
Berries 3·1 3·4 2·0 0·7 0·6 0·3 1·6 2·6 1·5 0·3 0·7 0·4 0·3 0·1 0·1 3·7 4·9 3·9 0·0 0·0 0·0
Banana 0·3 0·7 0·8 1·2 1·4 1·2 3·9 8·3 10·0 0·0 0·0 0·0 0·0 0·0 0·0 0·1 0·4 0·6 0·0 0·0 0·0
Citrus fruit 0·0 0·0 0·0 0·0 0·0 0·0 0·0 0·0 0·0 0·0 0·0 0·0 0·0 0·0 0·0 0·0 0·0 0·0 0·0 0·0 0·0
Kiwi 0·2 0·1 0·1 0·1 0·0 0·0 0·0 0·0 0·0 0·2 0·1 0·1 0·0 0·0 0·0 0·3 0·2 0·1 0·0 0·0 0·0
Other fruits 0·7 1·1 0·8 0·3 0·2 0·1 0·6 0·6 0·7 0·5 0·4 0·4 0·1 0·0 0·0 0·7 1·7 1·7 0·0 0·0 0·0
Chocolate candy/bars,
paste, confetti
4·7 5·7 3·2 5·6 4·2 1·3 3·5 4·6 2·1 9·2 12·2 5·7 4·3 2·0 0·5 4·6 6·6 5·5 0·0 0·0 0·0
Cakes, sweet pies, pastries,
puddings
2·3 3·1 3·4 2·4 1·9 1·3 1·7 3·1 2·9 5·0 8·3 7·5 2·2 1·3 0·8 3·1 5·8 7·6 0·0 0·0 0·0
Pulses 1·8 0·5 3·5 0·2 0·0 0·1 0·5 0·2 0·7 0·1 0·0 0·1 0·0 0·0 0·0 2·2 0·7 7·1 0·0 0·0 0·0
Cereal and cereal products 0·1 0·6 1·1 0·1 0·1 0·2 0·1 0·4 0·7 0·1 0·3 0·5 0·0 0·0 0·0 2·1 3·8 3·5 0·0 0·0 0·0
Soups 0·0 2·8 0·0 0·0 0·3 0·0 0·0 1·1 0·0 0·0 0·4 0·0 0·0 0·0 0·0 0·0 4·3 0·0 0·0 0·0 0·0
Other foods and beverages 5·4 6·5 4·3 2·9 2·6 1·8 3·0 3·3 2·2 2·9 3·4 3·2 1·5 0·6 0·4 3·0 3·9 3·9 0·0 0·0 0·0
EGC, (epi)gallocatechins.* Values are percentages derived from models adjusted for centre, age and sex, and weighted by season and day of recall.† Sum of epigallocatechin, epicatechin 3-gallate, epigallocatechin 3-gallate, gallocatechin and catechin-3-gallate.‡ Sum of theaflavin, theaflavin-30-gallate, theaflavin-3 gallate and theaflavin-3,30-digallate.
Die
taryflav
anols
inEPIC
1101
British Journal of Nutrition
including dieting, and some healthy habits such as fruit and
vegetable intake(57). Our study showed that the intakes of
total and subclasses of flavan-3-ols were lower in obese sub-
jects and, in addition, higher in physically active subjects.
Further investigation explaining the association between all
these factors and their role in obesity is needed. In our
study, intakes of PA increased with higher level of education,
and were found to be considerably low in the group without
formal schooling. In line with our findings, consumption of
fruits, fruit juice, wine and tea has been previously associated
with higher socio-economic status(58). These factors should be
taken into consideration when looking at disease prevention,
planning of healthy diets within a specific population and may
also be instrumental when establishing ‘lifespan essential’ diet-
ary reference intakes for flavan-3-ols, PA and theaflavins in
different populations, and in subgroups with unfavourable
lifestyle factors(59).
Major differences in total flavan-3-ol intake can be observed
between our study and other descriptive studies (Table 5).
Our estimates of total flavan-3-ol intake were much higher
than those reported in other countries and the main reason
being that some individual compounds or subclasses of
flavan-3-ols were not included in the total estimation of
flavan-3-ols in those studies. Comparison of the subclasses
(monomers, PA and theaflavins) may therefore be preferable.
Even then, the intakes may vary because of other important
factors involved in the estimation, such as different method-
ologies used to assess dietary intake of cohorts (FFQ, 24-
HDR, diet history, etc); compositional data of the compounds
may come from different sources or from older versions of the
USDA database(23,60), or the median intake reported rather
than the mean. The latter is particularly the case in the
Greek EPIC study(61). Finally, cohort characteristics, especially
those that are associated with flavan-3-ol consumption (e.g.
age and sex) may vary considerably. All these are to be kept
in mind when making comparisons. Flavan-3-ol monomer
intake reported recently for the UK and Ireland by Beking &
Vieira(62) and based on food balance sheets was about one-
third that of our reported intake for the UK region. The mono-
mer intake reported in an elderly Dutch cohort(63) as closer
but still slightly lower than our estimates for the Dutch cohorts
of Bilthoven and Utrecht even though, in our study, intakes
were found to be higher in older age groups. Monomer
intakes reported recently in Italy(21) and for Spanish(23) and
Greek(61) EPIC cohorts were within our ranges for those
countries. As for other countries known to have a tea culture,
Table 4. Socio-demographic, lifestyle and anthropometric determinants of intake (mg/d) of total flavan-3-ols and their subgroups*
(Mean values with their standard errors)
Total flavan-3-ols Monomers† Proanthocyanidins Theaflavins‡
n Mean SE P§ Mean SE P§ Mean SE P§ Mean SE P§
Region ,0·001 ,0·001 ,0·001 ,0·001Mediterranean countries 11 285 268·8 2·6 50·0 1·0 217·2 2·2 1·6 0·1Non-Mediterranean countries 23 469 274·7 1·9 90·2 .7 177·9 1·5 6·5 0·1UK 1283 406·6 7·6 182·4 3·0 198·4 6·3 25·9 0·3
Sex ,0·001 0·002 ,0·001 0·019Male 13 028 280·7 3·0 73·6 1·2 201·6 2·5 5·5 0·1Female 23 009 296·5 2·2 78·1 0·9 212·5 1·8 5·9 0·1
Age (years) ,0·001 0·004 ,0·001 0·34035–44 3335 262·6 5·0 72·2 2·0 185·0 4·1 5·4 0·245–54 12 595 274·9 2·7 73·9 1·1 195·2 2·2 5·7 0·155–64 14 940 302·5 2·6 78·1 1·0 218·7 2·1 5·7 0·165–74 5167 298·3 4·3 76·7 1·7 215·7 3·6 5·9 0·2
Education level completed ,0·001 ,0·001 ,0·001 ,0·001None 1709 267·4 7·7 69·6 3·0 192·5 6·4 5·4 0·3Primary 10 469 258·0 3·0 59·4 1·2 194·1 2·5 4·4 0·1Technical/professional 8038 281·1 3·5 72·0 1·4 204·0 2·9 5·1 0·1Secondary school 7152 303·1 3·5 82·1 1·4 215·1 2·9 6·0 0·1Post-secondary 8155 329·6 3·3 96·3 1·3 225·7 2·8 7·7 0·1
Smoking status ,0·001 ,0·001 ,0·001 ,0·001Never 17 483 295·5 2·5 79·8 1·0 209·8 2·0 6·0 0·1Former 10 288 301·4 2·9 80·2 1·2 215·0 2·4 6·2 0·1Smoker 7726 256·1 3·3 62·4 1·3 189·3 2·7 4·5 0·1
Physical activity ,0·001 ,0·001 ,0·001 0·002Inactive 7463 274·5 3·2 71·9 1·3 197·3 2·6 5·3 0·1Moderately inactive 11 969 283·8 2·6 75·0 1·1 203·1 2·1 5·7 0·1Moderately active 8400 299·1 3·1 79·0 1·3 214·1 2·5 6·1 0·1Active 6380 304·5 3·5 79·1 1·5 219·6 2·8 5·8 0·2
BMI (kg/m2) ,0·001 ,0·001 0·012 ,0·001, 25 16 854 297·1 2·6 81·6 1·0 209·3 2·1 6·3 0·125 to ,30 13 766 285·2 2·6 72·5 1·0 207·3 2·1 5·4 0·1. 30 5417 270·0 3·9 66·8 1·6 198·4 3·2 4·7 0·2
* General linear model adjusted for age, sex, region, BMI (whenever not stratified for the respective variables) and energy intake, and weighted by season and day of recall.† Sum of catechins, epicatechins and (epi)gallocatechins.‡ Sum of theaflavin, theaflavin-30-gallate, theaflavin-3 gallate and theaflavin-3,30-digallate.§P values are for overall differences in mean consumption by general linear model among the socio-demographic, lifestyle and anthropometric subgroups.
V. Knaze et al.1102
British
Journal
ofNutrition

Table 5. Previously estimated daily flavan-3-ol intakes (mg) in adults in several countries*
CountryTotal flavan-3-
ols (mg/d)Compounds includedin the total flavan-3-ols
Flavan-3-olmonomers
(mg/d)C
(mg/d)EC
(mg/d)EGC
(mg/d)PA
(mg/d)Theaflavins
(mg/d)Source ofcompositional data
Study population(sample size/age(years)/sex)
Dietary assessmentmethod
Finland(66) 128 C, EC, PA 12 ns ns – 116 – National Finnishdatabase
2007/25–64/both 48DR
Ireland(62) 47 C, EC, EGC 47 ns ns ns – – USDA 2007 andvarious other
ns/ns/ns Food balance sheets
UK(62) 52 C, EC, EGC 52 ns ns ns – – USDA 2007 andvarious other
ns/ns/ns Food balance sheets
UK(64)† 154 C, EC, EGC, PA 119 7 25 88 34 – Various 404/32–88/both FFQDenmark(52) 148 C, EC, EGC, theaflavins,
thearubiginsns ns ns ns – ns USDA 2003 ns/ns/both Dietary history
The Netherlands(52) 145 C, EC, EGC, theaflavins,thearubigins
ns ns ns ns – ns USDA 2003 6200/1–92/both 2 d dietary record
The Netherlands(63) 72 C, EC, EGC 72 ns ns ns – – Own data 1266/65–84/men 1-month dietary historyFrance(65) 338 C, EC, EGC, PA 87 ns ns ns 227 9 Phenol-Explorer 13 017/35–60/both 24DRItaly(21) 343 C, EC, EGC, PA,
theaflavins, thearubigins53 ns ns ns 290 ns USDA 2003, 2004 547/22–80/both FFQ
Spain EPIC(23) 221 C, EC, EGC, theaflavins,thearubigins
30 13 11 6 189 0 USDA 2004, 2007 40 683/35–64/both FFQ
Greece EPIC(61)‡ 89 C, EC, ECG, PA 13 6 6 1 75 – USDA 2004, 2007 28 572/30–76/both FFQUSA(22,67) 251 (C, EC, theaflavins,
thearubigins), PAns ns ns ns 95 ns USDA 2004, 2007 8809/19 þ /both 24DR
Australia(52) 422 C, EC, EGC, theaflavins,thearubigins
188 9 17 162 – 22 USDA 2003 17 326/19 þ /both 24DR
Japan(60) 380 C, EC, EGC 380 ns ns ns – – National Japanesedatabase
514/40 þ /women 24 h dietary record
C, catechins; EC, epicatechins; EGC, (epi)gallocatechins; PA, proanthocyanidins; ns, not specified; –, value not provided by the original study; DR, dietary recall; USDA, US Department of Agriculture.* Where applicable and when not provided by the study, total flavan-3-ols were calculated as the sum of the subgroups.† Median values given instead of the mean.‡ Total flavan-3-ols were calculated as the sum of the values in Rossi et al.(21) for C, EC, theaflavins and thearubigins combined and in Wang et al. (67) for PA.
Die
taryflav
anols
inEPIC
1103
British Journal of Nutrition

Otaki et al.(60) have estimated monomer intake in Japanese
women to be around 380 mg/d, more than double the value
we reported for the UK region. This is probably because of
higher consumption of non-fermented tea, such as green
tea, in Japan. Green tea is a rich source of flavan-3-ol mono-
mers but not a source of theaflavins, which was found exclu-
sively in black tea, the tea more commonly consumed in
the UK. In contrast, monomer intake (188 mg/d) reported in
Australia was comparable to our value in the UK region. PA
intake for Spain in our study is slightly higher than previously
reported for the EPIC Spain cohort; however, the previous
study used dietary history questionnaires and only the USDA
food composition values in their estimation of flavan-3-ols(23).
A recent Italian case–control study assessed the mean PA
intake to be around 290 mg/d which is within the range
of the Italian values in our study(21). However, most PA
estimations have been done in case–control studies, which
assess small groups of controls and not always all the sub-
groups of PA were included(20,21,64). Surprisingly, Greece
being a MED country had the lowest intake of PA of all
EPIC centres. Among the other previously mentioned factors
for this difference, this finding is also supported by the
lower consumption of fruit in Greece compared to Italy and
Spain reported previously in EPIC studies(47). Perez-Jimenez
et al.(65) reported intakes of flavan-3-ol monomers (114 mg/d),
PA (191 mg/d) and theaflavins (16 mg/d) in French women
that are within the range of our values for the French EPIC
centres. A limited number of descriptive studies is available
on PA to facilitate a comparison with non-EPIC countries.
Using their own composition database, Ovaskainen et al.(66)
reported lower PA intakes for a Finnish population compared
to the northern EPIC countries such as Sweden and Norway.
The sources of PA in northern EPIC countries were found to
be similar to those in Finland, with the exception of berries,
which were not singled out in our study but were an import-
ant source of PA in Finland. These differences in intake and
food sources compared to our study are most probably due
to the varying study variables already exposed earlier. Finally,
Wang et al.(67) recently estimated PA intake for the US popu-
lation to be about 95 mg/d. This is still slightly lower than
the lowest intakes found in our study (Greek cohorts). Clearly,
more consistent methods of intake estimation between and
within countries are needed. Parallel to that, improved
methods for identification and quantification of some flavan-
3-ol compounds, such as thearubigins, are needed to allow
for more exhaustive flavonoid composition databases.
The use of a common expanded flavonoid database
provided us with greater coverage of foods representative of
the EPIC countries while allowing for comparisons of results
across the countries. Despite the fact that we applied retention
factors to foods prepared by cooking, we estimated higher
intakes than in the previous studies. Moreover, our values
are likely to be underreported due to spices and herbs often
not accounted for during diet assessment and because a
small proportion (2–16 %) of flavan-3-ol analytical values in
our study was still missing. The underestimation of intakes
is also probably due to the omission of dietetic supplements
in this analysis. However, few consumers of herb/plant
supplements participated in this study (the highest was 5 %
reported in Denmark)(68).
To our knowledge, this is the largest study to date describ-
ing flavan-3-ol and PA intake across several European
countries. Since not all the EPIC cohorts are representative
of the population, the observed level of intake cannot be
extrapolated to the general population of each region.
In summary, this study provides total and individual flavan-
3-ol, PA and theaflavin intakes for ten EPIC countries by sex
and EPIC centre. The major dietary contributors of these
flavonoid subclasses are described by the MED, non-MED
and UK regions. In addition, we show that socio-demo-
graphic, anthropometric and lifestyle factors associated with
differential consumption of flavan-3-ols, PA and theaflavins
exist. Combined with more elucidated information on the
bioavailability of these compounds, these descriptive data
will be valuable in future evaluations of total and individual
flavan-3-ols and their role in health and disease in the
European population.
Acknowledgements
The present work was carried out with the financial support
of the European Commission: Public Health and Consumer
Protection Directorate 1993–2004; Research Directorate-
General 2005; Ligue contre le Cancer, Institut Gustave
Roussy, Mutuelle Generale de l’Education Nationale, Institut
National de la Sante et de la Recherche Medicale (INSERM,
France); German Cancer Aid; German Cancer Research
Centre; German Federal Ministry of Education and Research;
Danish Cancer Society: Health Research Fund (FIS) of the
Spanish Ministry of Health (RTICC (DR06/0020); the participat-
ing regional governments and institutions of Spain; Cancer
Research UK; Medical Research Council, UK; the Stroke
Association, UK; British Heart Foundation; Department of
Health, UK; Food Standards Agency, UK; the Wellcome
Trust, UK; Hellenic Ministry of Health; the Stavros Niarchos
Foundation and the Hellenic Health Foundation; Italian
Association for Research on Cancer; Compagnia San Paolo,
Italy; Dutch Ministry of Public Health, Welfare and Sports;
Dutch Ministry of Health; Dutch Prevention Funds; LK
Research Funds; Dutch ZON (Zorg Onderzoek Nederland);
World Cancer Research Fund (WCRF); Swedish Cancer
Society; Swedish Scientific Council; Regional Government of
Skane, Sweden; Nordforsk – Centre of Excellence pro-
gramme. Some authors are partners of ECNIS, a network of
excellence of the 6FP of the EC. R Z.-R. is thankful for a post-
doctoral programme Fondo de Investigacion Sanitaria (FIS;
no. CD09/00133) from the Spanish Ministry of Science and
Innovation. The authors thank Raul M. Garcıa for developing
an application to link the FCDB and the 24-HDR. The authors
declare that there are no conflicts of interest. The authors’
contributions are as follows: R. Z.-R. and C. A. G. designed
the research; V. K. and R. Z.-R. conducted the research; V. K.
and L. L.-B. performed the statistical analysis; V. K. and R. Z.-R.
wrote the manuscript. V. K., R. Z.-R., L. L.-B., I. R., A. S., N. S.,
E. R., C. T. M. v. R., H. B. B.-d. M., A. T., V. D., K. T., G. S.,
V. Knaze et al.1104
British
Journal
ofNutrition

D. E., J. R. Q., E. M., J. M. H., F. C., E. W., U. E., P. H. M. P, R. K.,
B. T., G. J., I. J., R. T., H. B., D. D., P. A., A. M., K.-T. K., R. L., V.
Kr., E. A., C. S., S. S., K. O., A. T., A. O., M.-C. B.-R., G. F., F. P.
and C. A. G. read, critically reviewed and approved the final
manuscript.
References
1. Santos-Buelga C & Scalbert A (2000) Proanthocyanidins andtannin-like compounds – nature, occurence, dietary intakeand effects on nutrition and health. J Sci Food Agric 80,1094–1117.
2. Laura A de la Rosa, E Alvarez-Parrilla and GA Gonzalez-Aguilar (editors) (2010) Fruit and Vegetable Phytochemicals,1st ed. Ames, IA: Blackwell Publishing.
3. Manach C, Williamson G, Morand C, et al. (2005) Bioavail-ability and bioefficacy of polyphenols in humans. I. Reviewof 97 bioavailability studies. Am J Clin Nutr 81, 230S–242S.
4. Aron PM & Kennedy JA (2007) Compositional investigationof phenolic polymers isolated from Vitis vinifera L. Cv.Pinot noir during fermentation. J Agric Food Chem 55,5670–5680.
5. Hellstrom JK, Torronen AR & Mattila PH (2009) Proanthocya-nidins in common food products of plant origin. J Agric FoodChem 57, 7899–7906.
6. Auger C, Al-Awwadi N, Bornet A, et al. (2004) Catechinsand procyanidins in Mediterranean diets. Food Res Int 37,233–245.
7. Williamson G & Manach C (2005) Bioavailability andbioefficacy of polyphenols in humans. Am J Clin Nutr 81,243S–255S.
8. Gu L, Kelm MA, Hammerstone JF, et al. (2004) Concen-trations of proanthocyanidins in common foods andestimations of normal consumption. J Nutr 134, 613–617.
9. Crozier A, Lean MEJ, McDonald MS, et al. (1997) Quantitativeanalysis of the flavonoid content of commercial tomatoes,onions, lettuce, and celery. J Agric Food Chem 45, 590–595.
10. Rickman JC, Barrett DM & Bruhn CM (2007) Nutritional com-parison of fresh, frozen and canned fruits and vegetables.Part 1. Vitamins C and B and phenolic compounds. J SciFood Agric 87, 930–944.
11. Beecher GR (2003) Overview of dietary flavonoids: nomen-clature, occurrence and intake. J Nutr 133, 3248S–3254S.
12. Ramiro-Puig E & Castell M (2009) Cocoa: antioxidant andimmunomodulator. Br J Nutr 101, 931–940.
13. Suzuki J, Isobe M, Morishita R, et al. (2009) Tea polyphenolsregulate key mediators on inflammatory cardiovasculardiseases. Mediators Inflamm 2009, article ID 494928; Epubli-cation 19 July 2009.
14. Yang CS, Wang X, Lu G, et al. (2009) Cancer preventionby tea: animal studies, molecular mechanisms and humanrelevance. Nat Rev Cancer 9, 429–439.
15. Hooper L, Kroon PA, Rimm EB, et al. (2008) Flavonoids, fla-vonoid-rich foods, and cardiovascular risk: a meta-analysisof randomized controlled trials. Am J Clin Nutr 88, 38–50.
16. Williamson G, Sies H, Heber D, et al. (2009) Functionalfoods for health promotion: state-of-the-science on dietaryflavonoids. Extended abstracts from the 12th Annual Confer-ence on Functional Foods for Health Promotion, April 2009.Nutr Rev 67, 736–743.
17. Cos P, de Bruyne T, Hermans N, et al. (2004) Proanthocyani-dins in health care: current and new trends. Curr Med Chem11, 1345–1359.
18. Schroeter H, Heiss C, Balzer J, et al. (2006) (2)-Epicatechinmediates beneficial effects of flavanol-rich cocoa on vascular
function in humans. Proc Natl Acad Sci U S A 103,1024–1029.
19. Monagas M, Urpi-Sarda M, Sanchez-Patan F, et al. (2010)Insights into the metabolism and microbial biotransform-ation of dietary flavan-3-ols and the bioactivity of theirmetabolites. Food Funct 1, 233–253.
20. Rossi M, Negri E, Parpinel M, et al. (2010) Proanthocyanidinsand the risk of colorectal cancer in Italy. Cancer CausesControl 21, 243–250.
21. Rossi M, Rosato V, Bosetti C, et al. (2010) Flavonoids,proanthocyanidins, and the risk of stomach cancer. CancerCauses Control 21, 1597–1604.
22. Chun OK, Chung SJ & Song WO (2007) Estimated dietaryflavonoid intake and major food sources of U.S. adults.J Nutr 137, 1244–1252.
23. Zamora-Ros R, Andres-Lacueva C, Lamuela-Raventos RM,et al. (2010) Estimation of dietary sources and flavonoidintake in a Spanish adult population (EPIC-Spain). J AmDiet Assoc 110, 390–398.
24. Slimani N, Kaaks R, Ferrari P, et al. (2002) EuropeanProspective Investigation into Cancer and Nutrition (EPIC)calibration study: rationale, design and population character-istics. Public Health Nutr 5, 1125–1145.
25. Slimani N, Ferrari P, Ocke M, et al. (2000) Standardizationof the 24-hour diet recall calibration method used in theEuropean Prospective Investigation into Cancer and Nutri-tion (EPIC): general concepts and preliminary results. Eur JClin Nutr 54, 900–917.
26. Slimani N, Deharveng G, Charrondiere RU, et al. (1999)Structure of the standardized computerized 24-h diet recallinterview used as reference method in the 22 centers partici-pating in the EPIC project. European Prospective Investi-gation into Cancer and Nutrition. Comput MethodsPrograms Biomed 58, 251–266.
27. Brustad M, Skeie G, Braaten T, et al. (2003) Comparison oftelephone vs face-to-face interviews in the assessmentof dietary intake by the 24 h recall EPIC SOFT program –the Norwegian calibration study. Eur J Clin Nutr 57,107–113.
28. Kaaks R, Plummer M, Riboli E, et al. (1994) Adjustment forbias due to errors in exposure assessments in multicentercohort studies on diet and cancer: a calibration approach.Am J Clin Nutr 59, 245S–2250.
29. Kaaks R, Riboli E & van Staveren W (1995) Calibration ofdietary intake measurements in prospective cohort studies.Am J Epidemiol 142, 548–556.
30. Kaaks R & Riboli E (1997) Validation and calibration of diet-ary intake measurements in the EPIC project: methodologicalconsiderations. European Prospective Investigation intoCancer and Nutrition. Int J Epidemiol 26, Suppl. 1, S15–S25.
31. Haftenberger M, Schuit AJ, Tormo MJ, et al. (2002) Physicalactivity of subjects aged 50–64 years involved in the Euro-pean Prospective Investigation into Cancer and Nutrition(EPIC). Public Health Nutr 5, 1163–1176.
32. Haftenberger M, Lahmann PH, Panico S, et al. (2002)Overweight, obesity and fat distribution in 50- to 64-year-old participants in the European Prospective Investigationinto Cancer and Nutrition (EPIC). Public Health Nutr 5,1147–1162.
33. Riboli E, Hunt KJ, Slimani N, et al. (2002) European Prospec-tive Investigation into Cancer and Nutrition (EPIC): studypopulations and data collection. Public Health Nutr 5,1113–1124.
34. Slimani N, Fahey M, Welch AA, et al. (2002) Diversity ofdietary patterns observed in the European Prospective
Dietary flavanols in EPIC 1105
British
Journal
ofNutrition

Investigation into Cancer and Nutrition (EPIC) project.Public Health Nutr 5, 1311–1328.
35. United States Department of Agriculture (2007) USDADatabase for the Flavonoid Content of Selected Foods, release2.1 ed. Beltsville, MD: USDA.
36. United States Department of Agriculture (2004) USDADatabase for the Proanthocyanidin Content of SelectedFoods. Beltsville, MD: USDA.
37. Neveu V, Perez-Jimenez J & Vos F, et al. (2010) Phenol-Explorer: an online comprehensive database on polyphenolcontents in food. Database (Oxf), version 1.5.2. http://www.phenol-explorer.eu
38. Arts IC, van de Putte B & Hollman PC (2000) Catechincontents of foods commonly consumed in The Netherlands.1. Fruits, vegetables, staple foods, and processed foods.J Agric Food Chem 48, 1746–1751.
39. Zamora-Ros R, Knaze V, Lujan-Barroso L, et al. (2011)Estimation of the intake of anthocyanidins and their foodsources in the European Prospective Investigation intoCancer and Nutrition (EPIC) study. Br J Nutr 106,1090–1099.
40. Zamora-Ros R, Knaze V, Lujan-Barroso L, et al. (2011)Estimated dietary intakes of flavonols, flavanones andflavones in the European Prospective Investigation intoCancer and Nutrition (EPIC) 24 hour dietary recall cohort.Br J Nutr 106, 1915–1925.
41. Rechner AR, Wagner E, van Buren L, et al. (2002) Blacktea represents a major source of dietary phenolics amongregular tea drinkers. Free Radic Res 36, 1127–1135.
42. Levi F, Chatenoud L, Bertuccio P, et al. (2009) Mortality fromcardiovascular and cerebrovascular diseases in Europe andother areas of the world: an update. Eur J Cardiovasc PrevRehabil 16, 333–350.
43. Henning SM, Niu Y, Lee NH, et al. (2004) Bioavailability andantioxidant activity of tea flavanols after consumption ofgreen tea, black tea, or a green tea extract supplement.Am J Clin Nutr 80, 1558–1564.
44. Auger C, Mullen W, Hara Y, et al. (2008) Bioavailabilityof polyphenon E flavan-3-ols in humans with an ileostomy.J Nutr 138, 1535S–1542S.
45. Linseisen J, Welch AA, Ocke M, et al. (2009) Dietary fatintake in the European Prospective Investigation into Cancerand Nutrition: results from the 24-h dietary recalls. Eur J ClinNutr 63, Suppl. 4, S61–S80.
46. Lopez-Miranda J, Perez-Jimenez F, Ros E, et al. (2010)Olive oil and health: summary of the II internationalAconference on olive oil and health consensus report, Jaenand Cordoba (Spain) 2008. Nutr Metab Cardiovasc Dis 20,284–294.
47. Agudo A, Slimani N, Ocke MC, et al. (2002) Consumptionof vegetables, fruit and other plant foods in the EuropeanProspective Investigation into Cancer and Nutrition (EPIC)cohorts from 10 European countries. Public Health Nutr 5,1179–1196.
48. Vidavalur R, Otani H, Singal PK, et al. (2006) Significanceof wine and resveratrol in cardiovascular disease: Frenchparadox revisited. Exp Clin Cardiol 11, 217–225.
49. Thorp AA, Healy GN, Owen N, et al. (2010) Deleteriousassociations of sitting time and television viewing timewith cardiometabolic risk biomarkers: Australian Diabetes,Obesity and Lifestyle (AusDiab) study 2004–2005. DiabetesCare 33, 327–334.
50. Jakes RW, Day NE, Khaw KT, et al. (2003) Television viewingand low participation in vigorous recreation are indepen-dently associated with obesity and markers of cardiovascular
disease risk: EPIC-Norfolk population-based study. Eur JClin Nutr 57, 1089–1096.
51. McFadden E, Luben R, Wareham N, et al. (2008) Occu-pational social class, risk factors and cardiovascular diseaseincidence in men and women: a prospective study in theEuropean Prospective Investigation of Cancer and Nutritionin Norfolk (EPIC-Norfolk) cohort. Eur J Epidemiol 23,449–458.
52. Johannot L & Somerset SM (2006) Age-related variations inflavonoid intake and sources in the Australian population.Public Health Nutr 9, 1045–1054.
53. Whichelow MJ, Erzinclioglu SW & Cox BD (1991) A compari-son of the diets of non-smokers and smokers. Br J Addict86, 71–81.
54. Dauchet L, Montaye M, Ruidavets JB, et al. (2010)Association between the frequency of fruit and vegetableconsumption and cardiovascular disease in male smokersand non-smokers. Eur J Clin Nutr 64, 578–586.
55. Cui Y, Morgenstern H, Greenland S, et al. (2008) Dietaryflavonoid intake and lung cancer – a population-basedcase–control study. Cancer 112, 2241–2248.
56. Bobe G, Weinstein SJ, Albanes D, et al. (2008)Flavonoid intake and risk of pancreatic cancer in malesmokers (Finland). Cancer Epidemiol Biomarkers Prev 17,553–562.
57. Hughes LA, Arts IC, Ambergen T, et al. (2008) Higher dietaryflavone, flavonol, and catechin intakes are associated withless of an increase in BMI over time in women: a longitudi-nal analysis from the Netherlands Cohort Study. Am J ClinNutr 88, 1341–1352.
58. Hulshof KF, Brussaard JH, Kruizinga AG, et al. (2003)Socio-economic status, dietary intake and 10 y trends:the Dutch National Food Consumption Survey. Eur J ClinNutr 57, 128–137.
59. Williamson G & Holst B (2008) Dietary reference intake(DRI) value for dietary polyphenols: are we heading in theright direction? Br J Nutr 99, Suppl. 3, S55–S58.
60. Otaki N, Kimira M, Katsumata S, et al. (2009) Distributionand major sources of flavonoid intakes in the middle-agedJapanese women. J Clin Biochem Nutr 44, 231–238.
61. Dilis V & Trichopoulou A (2010) Antioxidant intakes andfood sources in Greek adults. J Nutr 140, 1274–1279.
62. Beking K & Vieira A (2011) An assessment of dietaryflavonoid intake in the UK and Ireland. Int J Food Sci Nutr62, 17–19.
63. Arts IC, Hollman PC, Feskens EJ, et al. (2001) Catechin intakemight explain the inverse relation between tea consumptionand ischemic heart disease: the Zutphen Elderly Study.Am J Clin Nutr 74, 227–232.
64. Kyle JA, Sharp L, Little J, et al. (2010) Dietary flavonoid intakeand colorectal cancer: a case–control study. Br J Nutr 103,429–436.
65. Perez-Jimenez J, Fezeu L, Touvier M, et al. (2011) Dietaryintake of 337 polyphenols in French adults. Am J Clin Nutr93, 1220–1228.
66. Ovaskainen ML, Torronen R, Koponen JM, et al. (2008)Dietary intake and major food sources of polyphenols inFinnish adults. J Nutr 138, 562–566.
67. Wang Y, Chung SJ, Song WO, et al. (2011) Estimation of dailyproanthocyanidin intake and major food sources in the U.S.diet. J Nutr 141, 447–452.
68. Skeie G, Braaten T, Hjartaker A, et al. (2009) Use of dietarysupplements in the European Prospective Investigationinto Cancer and Nutrition calibration study. Eur J Clin Nutr63, Suppl. 4, S226–S238.
V. Knaze et al.1106
British
Journal
ofNutrition

Annex 1. Adjusted* mean daily intakes (mg/d) of flavan-3-ol monomer compounds by European Prospective Investigation into Cancer and Nutritioncentre ordered from south to north
(Mean values with their standard errors)
Flavan-3-ol monomers
(þ)-Catechin(2 )-Epicate-
chin(2 )-Epigallo-
catechin(2 )-Epicate-chin 3-gallate
(2 )-Epigallo-catechin3-gallate
(þ)-Galloca-techin
(þ)-Catechin3-gallate
Country and centre n Mean SE Mean SE Mean SE Mean SE Mean SE Mean SE Mean SE
Greece 2687 8·21 0·27 9·63 0·31 1·26 0·37 1·40 0·31 1·58 0·92 0·50 0·08 1·07 0·28Spain
Granada 514 13·25 0·63 11·97 0·71 1·89 0·85 1·88 0·72 1·37 2·13 0·26 0·18 0·46 0·64Murcia 547 15·67 0·61 12·59 0·68 1·92 0·82 1·86 0·69 1·18 2·05 0·33 0·17 0·40 0·61Navarra 715 14·46 0·54 12·50 0·61 1·67 0·73 0·79 0·62 0·88 1·83 0·16 0·15 0·15 0·55San Sebastian 734 17·69 0·55 16·60 0·62 2·35 0·75 1·26 0·63 1·41 1·87 0·24 0·16 0·33 0·56Asturias 710 17·85 0·53 19·25 0·59 2·64 0·72 1·48 0·60 2·35 1·79 0·21 0·15 0·33 0·54
ItalyRagusa 306 15·04 0·81 14·74 0·91 4·28 1·09 2·47 0·92 8·09 2·73 0·44 0·23 0·55 0·82Naples 403 10·34 0·70 11·46 0·79 3·64 0·95 2·45 0·80 8·05 2·37 0·40 0·20 0·56 0·71Florence 1055 16·43 0·50 17·22 0·56 5·81 0·67 3·92 0·56 12·54 1·67 0·79 0·14 1·09 0·50Turin 1068 21·84 0·45 20·31 0·50 6·44 0·60 4·61 0·51 14·57 1·51 0·93 0·13 1·38 0·45Varese 1121 18·87 0·46 18·36 0·52 7·67 0·62 6·10 0·53 19·86 1·56 1·13 0·13 1·80 0·47
FranceSouth coast 620 14·53 0·56 17·26 0·63 7·63 0·76 7·19 0·64 10·71 1·91 1·84 0·16 6·96 0·57South 1425 15·41 0·37 18·37 0·42 11·01 0·50 9·79 0·42 14·63 1·26 2·76 0·11 10·62 0·38North-East 2059 15·80 0·31 18·44 0·35 10·07 0·42 8·86 0·35 13·62 1·05 2·45 0·09 9·32 0·31North-West 631 14·83 0·56 17·54 0·63 11·68 0·76 9·85 0·64 15·31 1·89 2·99 0·16 11·49 0·57
GermanyHeidelberg 2121 18·94 0·31 20·42 0·35 13·12 0·42 13·03 0·35 22·91 1·04 2·43 0·09 7·04 0·31Potsdam 2294 16·16 0·29 15·73 0·33 7·27 0·40 8·76 0·34 11·45 1·00 1·63 0·08 4·98 0·30
The NetherlandsBilthoven 2110 14·77 0·31 13·98 0·35 12·32 0·42 9·77 0·36 15·22 1·06 3·36 0·09 12·45 0·32Utrecht 1870 14·46 0·33 16·50 0·37 19·40 0·44 15·25 0·37 23·61 1·10 5·18 0·09 20·24 0·33
UKGeneral population 974 22·76 0·46 23·91 0·51 35·07 0·62 26·44 0·52 42·61 1·55 9·30 0·13 35·96 0·46Health-conscious 309 19·87 0·83 20·06 0·93 26·18 1·12 21·93 0·94 31·08 2·81 6·82 0·24 26·53 0·84
DenmarkCopenhagen 2840 23·27 0·26 19·09 0·30 12·92 0·36 10·65 0·30 16·46 0·89 3·69 0·08 12·93 0·27Aarhus 1077 21·85 0·43 20·99 0·48 10·50 0·58 8·98 0·49 13·87 1·45 2·92 0·12 10·01 0·44
SwedenMalmo 3132 12·27 0·26 13·83 0·29 14·30 0·35 12·01 0·30 43·44 0·88 2·10 0·07 3·42 0·27Umea 2918 11·15 0·26 14·09 0·29 16·33 0·35 13·63 0·30 49·99 0·88 2·35 0·07 3·89 0·27
NorwaySouth and East 1004 13·39 0·45 15·81 0·50 12·17 0·61 10·70 0·51 22·04 1·52 2·57 0·13 8·48 0·45North and West 793 11·70 0·50 14·68 0·57 9·46 0·68 8·93 0·57 17·75 1·70 1·88 0·14 6·09 0·51
* Adjusted for sex and age, and weighted by season and day of recall.
Dietary flavanols in EPIC 1107
British
Journal
ofNutrition

Annex 2. Adjusted* mean daily intakes (mg/d) of proanthocyanidin (PA) and theaflavin subgroups by European Prospective Investigation into Cancer and Nutrition centre ordered from south to north
(Mean values with their standard errors)
PA Theaflavins
PAdimers
PAtrimers
PA4–6mers
PA7–10mers
PA.10mers Theaflavin
Theaflavin-3,30-digallate
Theaflavin-30-gallate
Theaflavin-3-gallate
Country and centre n Mean SE Mean SE Mean SE Mean SE Mean SE Mean SE Mean SE Mean SE Mean SE
Greece 2687 17·9 0·8 7·7 0·3 24·8 0·9 19·0 0·7 48·9 2·3 0·13 0·06 0·12 0·05 0·12 0·05 0·11 0·05Spain
Granada 514 36·4 1·8 12·7 0·7 41·9 2·1 30·0 1·6 63·1 5·4 0·07 0·13 0·06 0·11 0·06 0·11 0·06 0·11Murcia 547 38·7 1·7 14·2 0·7 46·9 2·0 33·2 1·5 64·8 5·2 0·06 0·13 0·05 0·11 0·05 0·11 0·05 0·11Navarra 715 39·1 1·5 13·1 0·6 45·9 1·8 34·1 1·4 70·4 4·6 0·01 0·11 0·01 0·10 0·01 0·10 0·01 0·10San Sebastian 734 56·1 1·6 20·3 0·6 69·8 1·8 53·3 1·4 105·7 4·7 0·06 0·11 0·05 0·10 0·05 0·10 0·05 0·10Asturias 710 61·7 1·5 25·7 0·6 83·0 1·8 63·0 1·3 114·6 4·5 0·05 0·11 0·04 0·10 0·04 0·10 0·04 0·09
ItalyRagusa 306 44·3 2·3 15·5 0·9 52·6 2·7 38·3 2·1 79·6 6·9 0·13 0·17 0·11 0·15 0·11 0·15 0·11 0·14Naples 403 31·1 2·0 13·3 0·8 43·5 2·3 30·6 1·8 61·5 6·0 0·14 0·15 0·12 0·13 0·12 0·13 0·11 0·13Florence 1055 50·1 1·4 18·5 0·6 60·9 1·6 44·7 1·3 90·6 4·2 0·22 0·10 0·19 0·09 0·19 0·09 0·19 0·09Turin 1068 61·7 1·3 19·9 0·5 67·3 1·5 49·5 1·1 100·1 3·8 0·26 0·09 0·22 0·08 0·22 0·08 0·21 0·08Varese 1121 53·4 1·3 17·0 0·5 56·0 1·5 41·4 1·2 85·1 3·9 0·37 0·10 0·32 0·08 0·32 0·08 0·31 0·08
FranceSouth coast 620 36·7 1·6 12·2 0·6 40·1 1·9 28·0 1·4 62·8 4·8 1·40 0·12 1·23 0·10 1·23 0·10 1·20 0·10South 1425 40·8 1·1 13·9 0·4 44·1 1·2 31·3 0·9 69·6 3·2 2·14 0·08 1·88 0·07 1·88 0·07 1·84 0·07North-East 2059 41·9 0·9 14·8 0·4 46·2 1·0 32·0 0·8 69·5 2·6 1·88 0·06 1·64 0·06 1·64 0·06 1·61 0·06North-West 631 40·5 1·6 13·6 0·6 42·8 1·9 30·8 1·4 61·0 4·8 2·31 0·12 2·03 0·10 2·03 0·10 1·99 0·10
GermanyHeidelberg 2121 45·5 0·9 17·2 0·4 43·9 1·0 32·4 0·8 69·4 2·6 1·39 0·06 1·20 0·06 1·20 0·06 1·19 0·06Potsdam 2294 33·1 0·8 14·9 0·3 44·4 1·0 32·8 0·8 74·5 2·5 0·92 0·06 0·80 0·05 0·80 0·05 0·79 0·05
The NetherlandsBilthoven 2110 29·6 0·9 10·6 0·4 29·9 1·0 21·0 0·8 44·4 2·7 2·52 0·07 2·20 0·06 2·20 0·06 2·16 0·06Utrecht 1870 36·1 0·9 12·1 0·4 33·7 1·1 24·3 0·8 50·1 2·8 4·10 0·07 3·59 0·06 3·59 0·06 3·52 0·06
UKGeneral population 974 58·5 1·3 14·8 0·5 34·3 1·5 23·9 1·2 52·7 3·9 7·32 0·10 6·41 0·08 6·41 0·08 6·29 0·08Health-conscious 309 51·9 2·3 18·0 1·0 46·8 2·8 36·1 2·1 85·2 7·1 5·37 0·17 4·70 0·15 4·70 0·15 4·62 0·15
DenmarkCopenhagen 2840 58·9 0·7 15·1 0·3 43·5 0·9 30·4 0·7 65·5 2·3 2·62 0·05 2·30 0·05 2·30 0·05 2·25 0·05Aarhus 1077 57·9 1·2 17·7 0·5 51·7 1·4 36·6 1·1 69·3 3·7 2·02 0·09 1·77 0·08 1·77 0·08 1·74 0·08
SwedenMalmo 3132 26·3 0·7 10·1 0·3 28·2 0·9 19·4 0·7 50·3 2·2 0·83 0·05 0·72 0·05 0·72 0·05 0·69 0·05Umea 2918 23·4 0·7 10·3 0·3 28·2 0·9 21·8 0·7 80·7 2·2 0·95 0·05 0·82 0·05 0·82 0·05 0·79 0·05
NorwaySouth and East 1004 32·2 1·3 12·0 0·5 35·6 1·5 28·5 1·1 98·8 3·8 1·73 0·09 1·50 0·08 1·50 0·08 1·48 0·08North and West 793 31·1 1·4 12·6 0·6 37·1 1·7 29·5 1·3 103·7 4·3 1·23 0·10 1·07 0·09 1·07 0·09 1·06 0·09
* Adjusted for sex and age, and weighted by season and day of recall.
V.K
naze
eta
l.1108
British Journal of Nutrition