British Election Study 2017 Face to face...
56
British Election Study 2017 Face-to-face survey The British Election Study 2017 is managed via a consortium of the University of Manchester, the University of Oxford, and the University of Nottingham. The British Election Study Team is comprised of Ed Fieldhouse, Jane Green, Geoff Evans, Hermann Schmitt, Cees van der Eijk, Jon Mellon and Chris Prosser. The BES 2017 is working in close collaboration with colleagues within the Universities of Manchester, Oxford and Nottingham, and is partnering with a wide variety of affiliated datasets and projects (and proposed projects) to link BES voter data to other data on election candidates and campaigns. The face-to-face survey The face-to-face survey is an address-based random probability sample of eligible voters living in 468 wards in 234 Parliamentary Constituencies in England, Scotland, and Wales. 2,194 people completed the face-to-face survey. The fieldwork for the survey was conducted by GfK between June 26 th 2017 and October 1 st 2017 and achieved an overall response rate of 46.2%. The face- to-face dataset also includes a self-completion Comparative Study of Electoral Systems (CSES) module that was answered by 984 respondents. Full details of the methodology and fieldwork are available in the technical report that accompanies the data release. Full details of the questionnaire can be found in the codebook which also accompanies the data release. Weights To ensure that the BES face-to-face survey is representative of the population (18+ adults in Great Britain who are eligible to vote) the data were weighted. Three weights were applied: design weights to correct for unequal selection probabilities, demographic weights which account for differing levels of response from various groups in the population, and result weights which account for differing levels of response from voters and non-voters. We recommend using the results weights (wt_vote and wt_vote_valid). The data file contains 4 weight variables, as follows: wt_sel_wt – selection weights (including capping) wt_demog –demographic weight (capped selection plus uncapped demographic weights targeted to the voting eligible population) wt_vote –demographic and result weight (capped selection plus capped demographic weights targeted to the voting eligible population and weighting to GB turnout and vote results) wt_vote_valid – demographic and result weight validated (capped selection plus capped demographic weights targeted to the voting eligible population and weighting to GB turnout and vote results for cases with vote validation) wt_demog_cses – combined CSES weight (capped selection weight plus demographic weighting targeted to the voting eligible population for CSES cases) Vote Validation The name and address information of face-to-face respondents who had given their permission for their information to be linked with the electoral registers was matched against the marked electoral registers by our team of BES Research Assistants (Jessica Smith, Charlotte Hargrave, and Laura Sanchez Carboneras). The results of the validation process are found in the turnoutValidationReg and validatedTurnoutBinary variables. In order to assess the reliability of the validation process a subset of respondents was coded by a second research assistant. This process suggests the reliability is very high. In the double coded cases, the two coders report the same outcome 97.5% of the time. UK Data Archive Study Number 8418 - British Election Study, 2017: Face-to-Face Post-Election Survey
Transcript of British Election Study 2017 Face to face...

British Election Study 2017 Face-to-face survey
The British Election Study 2017 is managed via a consortium of the University of Manchester, the University of Oxford, and the University of Nottingham. The British Election Study Team is comprised of Ed Fieldhouse, Jane Green, Geoff Evans, Hermann Schmitt, Cees van der Eijk, Jon Mellon and Chris Prosser. The BES 2017 is working in close collaboration with colleagues within the Universities of Manchester, Oxford and Nottingham, and is partnering with a wide variety of affiliated datasets and projects (and proposed projects) to link BES voter data to other data on election candidates and campaigns.
The face-to-face survey The face-to-face survey is an address-based random probability sample of eligible voters living in 468 wards in 234 Parliamentary Constituencies in England, Scotland, and Wales. 2,194 people completed the face-to-face survey. The fieldwork for the survey was conducted by GfK between June 26th 2017 and October 1st 2017 and achieved an overall response rate of 46.2%. The face-to-face dataset also includes a self-completion Comparative Study of Electoral Systems (CSES) module that was answered by 984 respondents. Full details of the methodology and fieldwork are available in the technical report that accompanies the data release. Full details of the questionnaire can be found in the codebook which also accompanies the data release. Weights To ensure that the BES face-to-face survey is representative of the population (18+ adults in Great Britain who are eligible to vote) the data were weighted. Three weights were applied: design weights to correct for unequal selection probabilities, demographic weights which account for differing levels of response from various groups in the population, and result weights which account for differing levels of response from voters and non-voters. We recommend using the results weights (wt_vote and wt_vote_valid).
The data file contains 4 weight variables, as follows:
wt_sel_wt – selection weights (including capping)
wt_demog –demographic weight (capped selection plus uncapped demographic weights
targeted to the voting eligible population)
wt_vote –demographic and result weight (capped selection plus capped demographic
weights targeted to the voting eligible population and weighting to GB turnout and vote results)
wt_vote_valid – demographic and result weight validated (capped selection plus capped
demographic weights targeted to the voting eligible population and weighting to GB turnout and vote results for cases with vote validation)
wt_demog_cses – combined CSES weight (capped selection weight plus demographic
weighting targeted to the voting eligible population for CSES cases) Vote Validation The name and address information of face-to-face respondents who had given their permission for their information to be linked with the electoral registers was matched against the marked electoral registers by our team of BES Research Assistants (Jessica Smith, Charlotte Hargrave, and Laura Sanchez Carboneras). The results of the validation process are found in the turnoutValidationReg and validatedTurnoutBinary variables. In order to assess the reliability of the validation process a subset of respondents was coded by a second research assistant. This process suggests the reliability is very high. In the double coded cases, the two coders report the same outcome 97.5% of the time.
UK Data Archive Study Number 8418 - British Election Study, 2017: Face-to-Face Post-Election Survey
BES 2017 Post-election Face-to-Face survey
1 of 43 30044
British Election Study 2017
A MOST IMPORTANT PROBLEM ............................................................... 2
B RESPONDENT’S ELECTORAL BEHAVIOUR ......................................... 3
C ATTITUDES TOWARD VOTING ............................................................... 7
D PARTY ID .................................................................................................. 7
E LEFT-RIGHT ............................................................................................. 9
F DELETED ...................................... ERROR! BOOKMARK NOT DEFINED.
G TAX-SPEND (SELF AND PARTIES) ...................................................... 10
H ENVIRONMENT VS. ECONOMY (0-10) ................................................. 11
I LEADER LIKES-DISLIKES ..................................................................... 12
J IMMIGRATION RUNNING INTO ACCOUNTABILITY ............................ 12
K MEDIA USAGE, POLITICAL ENGAGEMENT AND CANVASSING ...... 14
L ECONOMY .............................................................................................. 16
M POLITICAL EFFICACY ........................................................................... 18
N POLITICIANS AND TRUST .................................................................... 18
O DELETED ...................................... ERROR! BOOKMARK NOT DEFINED.
P EUROPE 0-10, SELF AND PARTIES ..................................................... 19
Q PARTY IMAGES: KEEPING PROMISES/ABLE TO GOVERN/UNITED 21
R THINGS THAT GONE TOO FAR/NOT FAR ENOUGH .......................... 22
S LIKE SCALES ......................................................................................... 23
T CIVIL LIBERTIES VS. TERRORISM ...................................................... 24
U POLITICAL PARTICIPATION ................................................................. 25
V CONSTITUTIONAL MATTERS ............................................................... 26
W CLASS .................................................................................................... 27
X POLITICAL KNOWLEDGE ..................................................................... 30
Y DEMOGRAPHICS ................................................................................... 31
BES 2017 Post-election Face-to-Face survey
2 of 43 30044
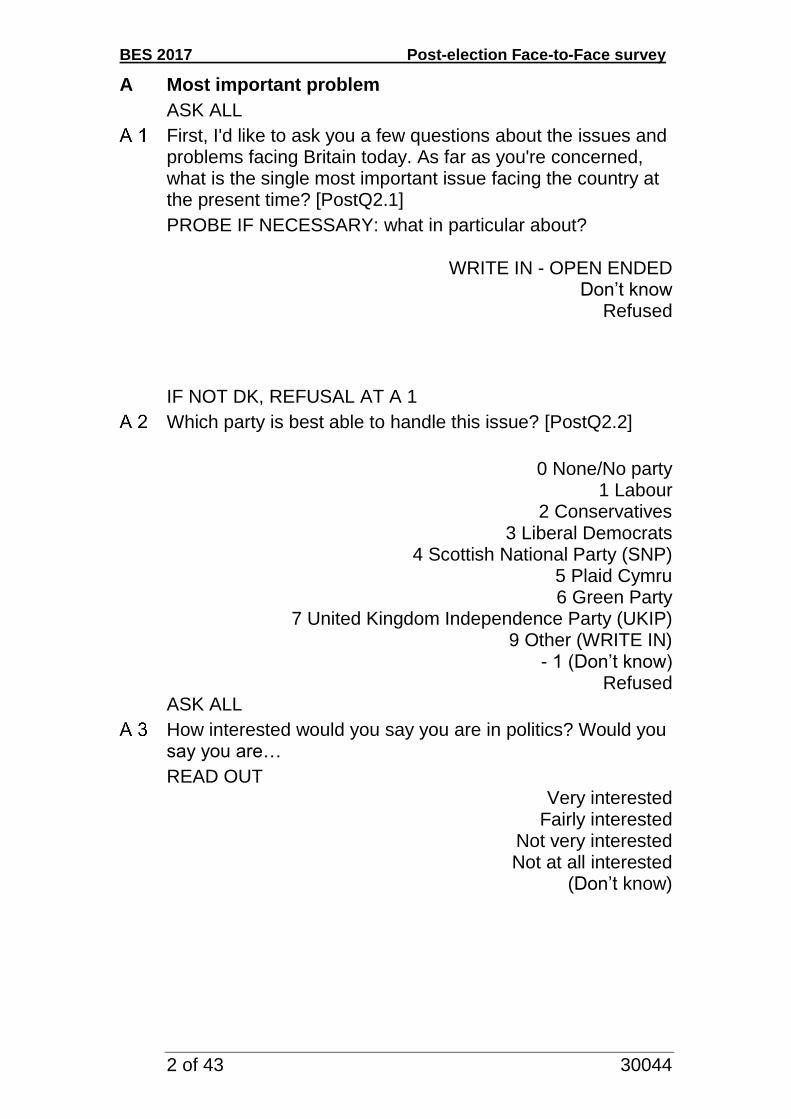
A Most important problem
ASK ALL
First, I'd like to ask you a few questions about the issues and problems facing Britain today. As far as you're concerned, what is the single most important issue facing the country at the present time? [PostQ2.1]
PROBE IF NECESSARY: what in particular about?
WRITE IN - OPEN ENDED Don’t know
Refused
IF NOT DK, REFUSAL AT A 1
Which party is best able to handle this issue? [PostQ2.2]
0 None/No party
1 Labour 2 Conservatives
3 Liberal Democrats 4 Scottish National Party (SNP)
5 Plaid Cymru 6 Green Party
7 United Kingdom Independence Party (UKIP) 9 Other (WRITE IN)
- 1 (Don’t know) Refused
ASK ALL
How interested would you say you are in politics? Would you say you are…
READ OUT Very interested
Fairly interested Not very interested Not at all interested
(Don’t know)

BES 2017 Post-election Face-to-Face survey
3 of 43 30044
M2 I'd like to read you a few statements about public life. Using an answer from this card, please tell me how strongly you agree or disagree with each of them. CAPI RANDOMISE ORDER OF STATEMENTS
Politicians don't care what people like me think It is often difficult for me to understand what is going on in
government and politics People like me have no say in what government does. The main political parties in Britain don't offer voters real
choices in elections because their policies are pretty much all the same
Parties and politicians in the UK are more concerned with fighting each other than with furthering the public interest.
Politicians ignore the issues I really care about SHOWCARD A
5 Strongly agree 4 Agree
3 Neither agree nor disagree 2 Disagree
1 Strongly disagree - 1 (Don’t know)
B Respondent’s Electoral behaviour
ASK ALL
Talking with people about the general election on June 8th, we have found that a lot of people didn't manage to vote. How about you, did you manage to vote in the general election? [PostQ12.1]
Single coded 1 Yes, voted
2 No, did not vote - 1 (Don’t know)
Refused IF ‘YES’ AT B1
Which party did you vote for in the general election? [PostQ12.2]
DO NOT PROMPT
1 Labour 2 Conservatives
3 Liberal Democrats

BES 2017 Post-election Face-to-Face survey
4 of 43 30044
4 Scottish National Party (SNP) 5 Plaid Cymru 6 Green Party
7 United Kingdom Independence Party (UKIP) 9 Other (WRITE IN)
- 1 (Don’t know) Refused
IF ‘NO’ AT B 1
If you had voted, which party would you probably have voted for?
DO NOT PROMPT 0 Would not vote for a party/refused/spoil ballot
1 Labour 2 Conservatives
3 Liberal Democrats 4 Scottish National Party (SNP)
5 Plaid Cymru 6 Green Party
7 United Kingdom Independence Party (UKIP) 9 Other (WRITE IN)
- 1 (Don’t know) Refused
IF ‘YES’ AT B 1
There are different ways in which people can cast their votes in general elections - in person, by post or by proxy, that is, getting someone else to vote on their behalf. How did you cast your vote in the general election on June 8th?
1 In person 2 By post
3 By proxy (someone else voted on my behalf) - 1 (Don’t know)
Refused
IF ‘YES’ AT B1
People give different reasons for why they vote for one party rather than another. Which of the following best describes your reasons? [PostQ52.2]
SHOW CARD 1 1 The party had the best policies 2 The party had the best leader

BES 2017 Post-election Face-to-Face survey
5 of 43 30044
3 I really preferred another party but it stood no chance of winning in my constituency
4 (I voted tactically (VOLUNTEERED)) 5 Other (WRITE IN)
- 1 (Don’t know) If 3 or 4 at B6
B 6A Which party do you really prefer?
1 Labour 2 Conservatives
3 Liberal Democrats 4 Scottish National Party (SNP)
5 Plaid Cymru 6 Green Party
7 United Kingdom Independence Party (UKIP) 8 Other (WRITE IN)
- 1 (Don’t know) Refused
ASK ALL
Did you care which party won the recent general election?
INTERVIEWER IF YES PROBE TO PRE-CODES. IF ‘NO’ CODE AS ‘DIDN’T CARE VERY MUCH’ INTERVIEWER NOTE If respondent says their answer is between the two asnwers ask which one comes closest. If they insist neither do then code as Don’t Know.
1 Cared a good deal 2 Didn't care very much
- 1 (Don’t know)
IF LIVE IN SCOTLAND ONLY
Thinking back to the referendum on Scottish independence held in September 2014, did you vote yes for independence or did you vote no, or did you not vote?
INTERVIEWER: DO NOT PROMPT 0 Did not vote
1 I voted “Yes” (Scotland should become an independent country)
BES 2017 Post-election Face-to-Face survey
6 of 43 30044
2 I voted “No” (Scotland should NOT become an independent country)
96 Not eligible/too young to vote - 1 (Don’t know)
Refused
Some people say that all political parties look after certain groups and are not so concerned about others. How closely do you think the Conservative Party looks after the interests of…
SHOW CARD 2 black people and Asians trade unions middle class people big business working class people people who are unemployed or on benefits
1 Very closely
2 Fairly closely 3 Not very closely 4 Not at all closely
- 1 (Don’t know)
How closely do you think the Labour Party looks after the interests of
black people and Asians trade unions middle class people big business working class people people who are unemployed or on benefits
SHOW CARD 2 1 Very closely
2 Fairly closely 3 Not very closely 4 Not at all closely
- 1 (Don’t know)

BES 2017 Post-election Face-to-Face survey
7 of 43 30044
C Attitudes toward voting
ASK ALL
How interested were you in the general election that was held on June 8th this year... READ OUT ...
1 ... very interested, 2 somewhat interested,
3 not very interested, 4 or, not at all interested?
How much do you agree or disagree with the following statements? Please choose an answer from this card
READ OUT STATEMENTS
SHOW CARD A
CAPI RANDOMISE ORDER OF STATEMENTS
Going to vote is a lot of effort I feel a sense of satisfaction when I vote It is every citizen's duty to vote in an election Most of my friends and family think that voting is a waste of
time.
1 Strongly disagree 2 Disagree
3 Neither agree nor disagree 4 Agree
5 Strongly agree - 1 (Don’t know)
D Party ID
ASK ALL
Generally speaking, do you think of yourself as Labour, Conservative, Liberal Democrat, (Scottish National/Plaid Cymru) [in Scotland/Wales] or what? [PostQ9.1]
DO NOT PROMPT

BES 2017 Post-election Face-to-Face survey
8 of 43 30044
0 None/No 1 Labour
2 Conservative 3 Liberal Democrat
4 Scottish National Party (SNP) 5 Plaid Cymru 6 Green Party
7 United Kingdom Independence Party (UKIP) 9 Other (WRITE IN)
- 1 (Don’t know) Refused
IF ‘none/no’, DK OR REFUSAL AT D1
Do you generally think of yourself as a little closer to one of the parties than the others? [PostQ9.2]
1 Yes 0 No
- 1 (Don’t know) Refused
IF ‘YES’ AT D 2
Which party is that? [PostQ9.3]
DO NOT PROMPT
0 None/No 1 Labour
2 Conservatives 3 Liberal Democrats
4 Scottish National Party (SNP) 5 Plaid Cymru 6 Green Party
7 United Kingdom Independence Party (UKIP) 9 Other (WRITE IN)
- 1 (Don’t know) Refused
IF PARTY GIVEN AT D 1 OR AT D 3
Would you call yourself very strong [party], fairly strong or not very strong? [PostQ9.4]
1 Very strong
2 Fairly strong 3 Not very strong

BES 2017 Post-election Face-to-Face survey
9 of 43 30044
- 1 (Don’t know)
E Left-right
F1 How much do you agree or disagree with the following
statements? Please choose an answer from this card READ OUT STATEMENTS SHOW CARD A CAPI RANDOMISE ORDER OF STATEMENTS
Ordinary working people get their fair share of the nation's wealth
There is one law for the rich and one for the poor Young people today don't have enough respect for traditional
British values Censorship of films and magazines is necessary to uphold
moral standards There is no need for strong trade unions to protect
employees' working conditions and wages Private enterprise is the best way to solve Britain's economic
problems Major public services and industries ought to be in state
ownership It is the government's responsibility to provide a job for
everyone who wants one People should be allowed to organise public meetings to
protest against the government People in Britain should be more tolerant of those who lead
unconventional lives For some crimes, the death penalty is the most appropriate
sentence People who break the law should be given stiffer sentences
1 Strongly disagree
2 Disagree 3 Neither agree nor disagree
4 Agree 5 Strongly agree - 1 (Don’t know)
F 2. Are you generally in favour of…
READ OUT 1 More nationalisation of companies by government

BES 2017 Post-election Face-to-Face survey
10 of 43 30044
2 More privatisation of companies by government 3 or, should things be left as they are now?
-1 (Don’t know)
ASK ALL
In politics people sometimes talk of left and right. Where would you place yourself on the following scale?
SHOW CARD 3 0 Left
1 2 3 4 5 6 7 8 9
10 - Right - 1 (Don’t know)
Refused
F
G Tax-spend (self and parties)
ASK ALL
Now, another issue. Please look at the 0 to 10 scale on this card, where the end marked 0 means that government should cut taxes a lot and spend much less on health and social services, and the end marked 10 means that government should raise taxes a lot and spend much more on health and social services, where would you place yourself on this scale? [first iteration] where do you think the policies of….. fit on this scale [2nd iteration onwards]
SHOW CARD 4 CAPI – RANDOMISE ORDER OF OPTIONS B – H. OPTION A SHOULD ALWAYS COME FIRST
a) yourself
b) The Conservative party

BES 2017 Post-election Face-to-Face survey
11 of 43 30044
c) the Labour Party d) the Liberal Democrats
e) UKIP f) The Green party
g) (ONLY IN SCOTLAND) The SNP h) (ONLY IN WALES) Plaid Cymru
0 Government should cut taxes a lot and spend much less on
health and social services 1 2 3 4 5 6 7 8 9
10 Government should increase taxes a lot and spend much more on health and social services
- 1 (Don’t know)
H Environment vs. Economy (0-10)
Thinking now about the environment, some believe that protecting the environment should have priority even if that reduces economic growth. Others believe that economic growth should have priority even if that hinders protecting the environment. What is your opinion? Please choose an answer from this card
SHOW CARD 5 0 - Economic growth should have priority
1 2 3 4 5 6 7 8 9
10 - Protecting the environment should have priority - 1 (Don’t know)

BES 2017 Post-election Face-to-Face survey
12 of 43 30044
I Leader likes-dislikes
Now let's think about party leaders for a moment [First iteration only]. Using a scale that runs from 0 to 10, where 0 means strongly dislike and 10 means strongly like, how do you feel about …..?
CAPI RANDOMISE ORDER OF INSERTS A) Jeremy Corbyn
B) Theresa May C) Tim Farron
D) Caroline Lucas E) Paul Nuttal
F) (ONLY IN SCOTLAND) Nicola Sturgeon G) (ONLY IN WALES) Leanne Wood
SHOW CARD 6
0 Strongly dislike 1 2 3 4 5 6 7 8 9
10 Strongly like - 1 (Don’t know)
96 (Haven't heard of )
J Immigration running into accountability
J 5. Moving now to another topic … Do you think that too many
immigrants have been let into this country, or not? 1 Yes, too many
0 No, not too many - 1 (Don’t know)
ASK ALL EXCEPT THOSE WHO SAID DON’T KNOW AT J5
J 6. How strongly do you feel about this? Do you feel… READ OUT
BES 2017 Post-election Face-to-Face survey
13 of 43 30044
3 Very strongly 2 Fairly strongly
1 Not very strongly - 1 (Don’t know)
ASK ALL
Do you think immigration is good or bad for Britain's economy? Please choose an answer from this card
SHOW CARD 7 1 Bad for economy
2 3 4 5 6
7 Good for economy - 1 (Don’t know)
Choosing an answer from this card, would you say that since the last general election in 2015 the National Health Service has got better, worse or has it stayed the same?
SHOW CARD B 1 Got a lot worse
2 Got a little worse 3 Stayed the same 4 Got a little better
5 Got a lot better - 1 (Don’t know)
Now, using one of the answers on this card, what is your view about putting more money into the health service?
SHOW CARD 8 5 Very important that it should be done
4 Fairly important that it should be done 3 It doesn’t matter either way
2 Fairly important that it should not be done 1 Very important that it should not be done
- 1 (Don’t know)
And do you think that the cost of living has got better, worse or stayed the same since the last general election in 2015?
SHOWCARD B 1 Got a lot worse
2 Got a little worse

BES 2017 Post-election Face-to-Face survey
14 of 43 30044
3 Stayed the same 4 Got a little better
5 Got a lot better - 1 (Don’t know)
Do you think that the quality of education in schools has got better, worse or stayed the same since the last general election in 2015?
SHOWCARD B
1 Got a lot worse 2 Got a little worse 3 Stayed the same 4 Got a little better
5 Got a lot better - 1 (Don’t know)
K Media usage, political engagement and canvassing
How much attention do you generally pay to politics?
SHOW CARD 9 0 Pay no attention
1 2 3 4 5 6 7 8 9
10 Pay a great deal of attention - 1 (Don’t know)
Do you regularly read about politics or current affairs in one or more newspapers (either online or in print)? [PostQxx]
1 Yes 0 No
- 1 (Don’t know) IF 'YES' TO K 2

BES 2017 Post-election Face-to-Face survey
15 of 43 30044
In which newspaper do you read about politics or current affairs in most often? INCLUDE SUNDAY VERSION OR DAILY VERSION WHERE APPLICABLE. CODE ONE ONLY. DO NOT PROMPT
Express Financial Times Glasgow Herald
Guardian/Observer Independent/The i
London Evening Standard Mail
Metro Mirror/Record
Scotsman Star Sun
Telegraph Times
Western Mail Any other national paper Any other regional paper
Other (specify]
Thinking again of the recent general election, did a canvasser from any party call at your home to talk to you during the election campaign?
1 Yes 0 No
- 1 (Don’t know) IF ‘yes’ to K 11
Which party or parties did they represent? (say all that apply)
DO NOT PROMPT 1 Labour
2 Conservatives 3 Liberal Democrats
4 Scottish National Party (SNP) 5 Plaid Cymru 6 Green Party
7 United Kingdom Independence Party (UKIP)
9 Other (WRITE IN) - 1 (Don’t know)

BES 2017 Post-election Face-to-Face survey
16 of 43 30044
ASK ALL
Did any of the political parties contact you during the recent election campaign in any other ways, shown on this card?
SHOW CARD C 1 Yes 2 No
- 1 (Don’t know) IF 'YES' AT K 13
In what way was that and by which party? CAPI SHOW AS GRID WITH TYPES OF CONTACT ACROSS TOP AND PARTIES DOWN SIDE. ALLOW MULTI CODING
1 Telephone call
2 Leaflets/ other material to home 3 Email or text message
4 Contact in the street 5 Twitter, Facebook or other social media
1 Labour
2 Conservative 3 Liberal Democrat
4 Scottish National Party SCOTLAND ONLY 5 Plaid Cymru WALES ONLY
6 Green Party 7 United Kingdom Independence Party (UKIP)
- 1 (Don’t know)
L Economy
Now a few questions about economic conditions. How does the financial situation of your household now compare with what it was 12 months ago? [PostQ21]
SHOW CARD D 1 a lot worse
2 a little worse 3 the same
4 a little better 5 a lot better
- 1 (Don’t know)

BES 2017 Post-election Face-to-Face survey
17 of 43 30044
How do you think the financial situation of your household will change over the next 12 months? [PostQ23]
SHOW CARD D
1 a lot worse 2 a little worse
3 the same 4 a little better
5 a lot better - 1 (Don’t know)
How do you think the general economic situation in this country will develop over the next 12 months? [PostQ24] SHOW CARD D
1 a lot worse
2 a little worse 3 the same
4 a little better 5 a lot better
- 1 (Don’t know)
How do you think the general economic situation in this country has changed over the last 12 months?
SHOW CARD D
1 a lot worse 2 a little worse
3 the same 4 a little better
5 a lot better - 1 (Don’t know)
Some people feel that government should make much greater efforts to make people's incomes more equal. Other people feel that government should be much less concerned about how equal people's incomes are. Where would you place youself on this scale?
SHOW CARD 10 0 Make much greater efforts to make people’s incomes more
equal 1
BES 2017 Post-election Face-to-Face survey
18 of 43 30044
2 3 4 5 6 7 8 9
10 Be much less concerned about how equal people’s incomes are
- 1 (Don’t know)
M Political efficacy
On the whole, are you satisfied or dissatisfied with the way that democracy works in this country? Please answer from this card INTERVIEWER NOTE – IF SOMEONE ASKS WHAT WE MEAN BY “THIS COUNTRY” SAY IT IS THE UK, AND NOT ENGLAND/SCOTLAND ETC
SHOW CARD 11
1 Very satisfied 2 Fairly satisfied
3 A little dissatisfied 4 Very dissatisfied
Don’t know
N Politicians and Trust
ASK ALL I’d now like you to answer some questions yourself on the laptop. The laptop is very easy to use and I can demonstrate to you how it can be used
N4a Are you happy to answer the questions yourself, on the laptop?
Yes -read on screen and enter answers by themselves

BES 2017 Post-election Face-to-Face survey
19 of 43 30044
No- prefer interviewer to read questions from screen
INTERVIEWER: HAND RESPONDENT THE CAPI MACHINE AND DEMONSTRATE USE BY GOING THROUGH THE FIRST QUESTION WITH THEM. PLEASE NOTE THAT THE DATA FROM THIS QUESTION WILL BE USED
How much do you trust British politicians generally?
0 No trust 1 2 3 4 5 6 7 8 9
10 A great deal of trust - 1 (Don’t know)
O
P Europe 0-10, self and parties
P 1 Thinking back to the EU referendum held on June 23rd 2016, if you voted did you vote to remain in the EU or to leave the EU, or did you not vote?
INTERVIEWER: DO NOT PROMPT 1 I did not vote
2 Leave the EU 3 Remain in the EU
-1 (Don't know)
If there was another referendum on Britain's membership of the European Union, how do you think you would vote? Would you vote to leave the EU or to stay in?
1 Leave the EU 0 Stay in the EU
98 I would not vote - 1 (Don’t know)

BES 2017 Post-election Face-to-Face survey
20 of 43 30044
Which of these comes closest to …… views. Britain Should:
CAPI – RANDOMISE ORDER OF OPTIONS B – H. OPTION A SHOULD ALWAYS COME FIRST A. Your own B. The Conservative Party’s C. The Labour Party’s D. the Liberal Democrats’ E. UKIP’s F. The Green party’s G. (ONLY IN SCOTLAND) The SNP’s H. (ONLY IN WALES) Plaid Cymru’s
0 Do all it can to unite fully with the European Union
1 2 3 4 5 6 7 8 9
10 Do all it can to protect its independence from the European Union - 1 (Don’t know)
P3 A. When Britain negotiates to leave the EU is it more important
for the UK government to protect Britain’s access to the single market or to gain full control of immigration?
0 Access to the single market
1 2 3 4 5 6 7 8 9
10 Control immigration - 1 (Don’t know)

BES 2017 Post-election Face-to-Face survey
21 of 43 30044
P3 B. After Brexit negotiations are finished would you be in favour
of having a referendum on whether to accept the deal or remain in the EU?
1 Yes 2 No
-1 (Don't know)
Thinking now about how active you are in politics and community affairs, during the last 12 months, have you done any of the following? Please code all that apply
1 Contacted a politician, government or local government official?
2 Signed a petition on the Internet? 3 Signed a petition not on the internet?
4 Done any work on behalf of a political party or action group?
5 Given any money to a political party, organization or cause 6 Taken part in a public demonstration?
7 Bought - or refused to buy – any products for political or ethical reasons?
8 Gone on strike or taken industrial action? 0 None of these - 1 (Don’t know)
Q Party images: keeping promises/able to govern/united
On the whole, how would you describe the following parties nowadays? [….. ] a party that…
CAPI RANDOMISE PARTIES
1. keeps its promises 2. or, breaks its promises
3. neither or both - 1 (Don’t know)
Is the Labour Party Is the Conservative Party Are the Liberal Democrats [ASK IN SCOTLAND ONLY] Is the Scottish National Party [ASK IN WALES ONLY] Is Plaid Cymru

BES 2017 Post-election Face-to-Face survey
22 of 43 30044
On the whole, how would you describe the following parties nowadays? Is [….. ] a party that is…
CAPI RANDOMISE PARTIES
The Conservative Party The Labour Party
1 Capable of being a strong government
2 Not capable of being a strong government 3 Neither or both - 1 (Don’t know)
And would you describe ….. as…
CAPI RANDOMISE PARTIES 1 United
2 or, divided? 3 Neither or both - 1 (Don’t know)
The Conservative Party The Labour Party The Liberal Democrats
Thank you for answering these questions. Please give the laptop back to the interviewer
R Things that gone too far/not far enough
Now moving on to another topic… how do you feel about the attempts to ensure equality for women? Please use the showcard
SHOW CARD 12 5 Gone much too far 4 Gone a little too far
3 Is about right 2 Not gone quite far enough
1 Not gone nearly far enough - 1 (Don’t know)
And how do you feel about attempts to give equal opportunities to black people and Asians in Britain?
SHOW CARD 12 5 Gone much too far

BES 2017 Post-election Face-to-Face survey
23 of 43 30044
4 Gone a little too far 3 Is about right
2 Not gone quite far enough 1 Not gone nearly far enough
- 1 (Don’t know)
R 5 And how do you feel about cuts to disability benefits? SHOW CARD 12
5 Gone much too far 4 Gone a little too far
3 Is about right 2 Not gone quite far enough
1 Not gone nearly far enough - 1 (Don’t know)
R5 A Should social care for the elderly be paid from general
taxation or from the person’s own money (if necessary by selling their home)?
SHOW CARD 12A 1 - Taxation
2 3 4
5 - Own money -1 (Don’t know)
S Like scales
How likely is it that you would ever vote for each of the following parties?
SHOW CARD 13 CAPI RANDOMISE
Conservatives Labour Liberal Democrats UKIP Greens SNP (Scotland only) Plaid Cymru (Wales only)
0 very unlikely 1

BES 2017 Post-election Face-to-Face survey
24 of 43 30044
2 3 4 5 6 7 8 9
10 very likely
Q 11 Now, considering everything the Conservative and Labour Parties stand for, would you say that READ OUT…
1 There is a great difference between them
2 Some difference 3 or, not much difference?
- 1 (Don’t know)
Q 12 Generally speaking do you regard the Liberal Democrats as closer to the Conservative Party or closer to the Labour Party?
1 Closer to the Conservatives 2 Closer to Labour
3 No difference/Equal - 1 (Don’t know)
T Civil Liberties vs. terrorism
Do you think the government should or should not do each of the following things or doesn't it matter either way…
CAPI RANDOMISE
Spend less on defence? Spend less on foreign aid?
SHOW CARD 14 5 Definitely should 4 Probably should
3 Doesn't matter either way 2 Probably should not 1 Definitely should not
- 1 (Don’t know)
BES 2017 Post-election Face-to-Face survey
25 of 43 30044
Some people feel that, in order to fight terrorism, we have to accept limits on privacy and civil liberties, others feel that privacy and civil liberties are to be protected at all cost. Where would you place yourself on this scale?
SHOW CARD 15 0 Fight terrorism
1 2 3 4 5 6 7 8 9
10 Protect civil liberties - 1 (Don’t know)
U Political participation
During the last week, on roughly how many days did you talk about politics with other people?
0 No days 1 One day
2 Two days 3 Three days 4 Four days 5 Five days 6 Six days
7 Seven days - 1 (Don’t know)
Are you, or have you ever been, a member of any Political party?
1 Yes I am a member of a party 2 I am not a member now but used to be
0 No, I have never been a member - 1 (Don’t know)
BES 2017 Post-election Face-to-Face survey
26 of 43 30044
Thinking back to the previous general election held on 7th May 2015, do you remember which party you voted for then - or perhaps you didn't vote? [PostQ46.1]
IF 'YES': Which party was that? INTERVIEWER: DO NOT PROMPT
0 Did not vote 1 Labour
2 Conservative 3 Liberal Democrat
4 Scottish National Party 5 Plaid Cymru 6 Green Party
7 United Kingdom Independence Party (UKIP) 8 British National Party (BNP)
9 Other (WRITE IN) 96 Not eligible/too young to vote
- 1 (Don’t know) Refused
V Constitutional Matters
Some people say that we should change the voting system to allow smaller political parties to get a fairer share of MPs. Others say that we should keep the voting system as it is to produce effective government. Which view comes closer to your own? READ OUT
1 that we should change the voting system, 2 or, keep it as it is?
- 1 (Don’t know)
[IN ENGLAND ONLY] Which, if any, of the following best describes how you see yourself?
SHOW CARD 16
1. English not British 2. More English than British
3. Equally English and British 4. More British than English
5. British not English 6. None of these
7. Other [WRITE IN] __________________________

BES 2017 Post-election Face-to-Face survey
27 of 43 30044
- 1 (Don’t know)
[IN SCOTLAND ONLY] Which, if any, of the following best describes how you see yourself?
SHOW CARD 16 (S)
1. Scottish not British 2. More Scottish than British
3. Equally Scottish and British 4. More British than Scottish
5. British not Scottish 6. None of these
7. Other [WRITE IN] ___________________________ - 1 (Don’t know)
[IN WALES ONLY] Which, if any, of the following best describes how you see yourself?
SHOW CARD 16 (W)
1. Welsh not British 2. More Welsh than British
3. Equally Welsh and British 4. More British than Welsh
5. British not Welsh 6. None of these
7. Other [WRITE IN] ___________________________ - 1 (Don’t know)
W Class
Do you ever think of yourself as belonging to any particular class?
IF YES: Which class is that? 1 Yes, middle class
2 Yes, working class 3 Yes, other (WRITE IN VERBATIM)
4 No 999 Don’t know
BES 2017 Post-election Face-to-Face survey
28 of 43 30044
IF NOT CODE 1 OR 2 AT W1 ASK W2
Most people say they belong either to the middle class or to the working class. If you had to make a choice, would you call yourself middle class or working class?
1 Middle class 2 Working class
3 DO NOT READ OUT Upper class - 1 (Don’t know)
ASK ALL
When you were growing up would you say your family was middle class or working class?
1 Middle class 2 Working class
3 DO NOT READ OUT Upper class
- 1 (Don’t know)
Thinking back to when you were growing up. Do you know what party your mother usually voted for if she voted?
DO NOT PROMPT IF QUERIED, FATHER AND MOTHER APPLIES TO THE PERSON WHO FILLED THAT ROLE WHEN THE RESPONDENT WAS GROWING UP.
1 Labour 2 Conservatives
3 Liberal Democrats/Liberals/SDP/Alliance 4 Scottish National Party (SNP)
5 Plaid Cymru 6 Green Party
7 United Kingdom Independence Party (UKIP) 8 British National Party (BNP)
9 Other (WRITE IN) 10 Had no usual party
0 Did not vote - 1 (Don’t know) 98 (No mother)
And what about your father? What party did your father vote for if he voted?
DO NOT PROMPT

BES 2017 Post-election Face-to-Face survey
29 of 43 30044
1 Labour 2 Conservatives
3 Liberal Democrats/Liberals/SDP/Alliance 4 Scottish National Party (SNP)
5 Plaid Cymru 6 Green Party
7 United Kingdom Independence Party (UKIP) 8 British National Party (BNP)
9 Other (WRITE IN) 10 Had no usual party
0 Did not vote - 1 (Don’t know)
98 (No father) INTERVIEWER RECORD WHETHER RESPONDENT MADE QUERY ABOUT DEFINITION FATHER/MOTHER
Thinking now of trade unions and big business in this country. First, do you think that trade unions ... READ OUT ...
1 ...have too much power 2 or not?
- 1 (Don’t know)
Do you think that big business in this country has too much power, or not?
1 ...has too much power 2 or, not?
- 1 (Don’t know)
How middle class or working class are the main political parties? Firstly RANDOMISE ORDER Conservative Party/ Labour Party?
SHOW CARD 17 1 Very middle class
2 Fairly middle class 3 Slightly middle class
4 Neither middle class nor working class 5 Slightly working class
6 Fairly working class 7 Very working class
- 1 (Don’t know)
How much do you agree or disagree with the following statements?

BES 2017 Post-election Face-to-Face survey
30 of 43 30044
CAPI RANDOMISE If welfare benefits weren't so generous, people would learn to
stand on their own two feet University students should be charged tuition fees Many people who get social security don’t really deserve any
help SHOW CARD A
5 Strongly agree 4 Agree
3 Neither agree nor disagree 2 Disagree
1 Strongly disagree Don’t know
R 6. Would you support or oppose re-introducing grammar
schools? SHOW CARD 17A
5 Strongly support 4 Support
3 Neither support nor oppose 2 Oppose
1 Strongly oppose -1 (Don't know)
X Political knowledge
Please tell me if you think that the following statements are true or false. If you don't know, just say so and we will skip to the next one.
1 True
2 False 3 Don’t Know
CAPI RANDOMISE ORDER OF STATEMENTS
Polling stations close at 10.00pm on election day. No-one may stand for parliament unless they pay a deposit? Only taxpayers are allowed to vote in a general election. The Liberal Democrats favour a system of proportional
representation for Westminster elections. MPs from different parties are on parliamentary committees?

BES 2017 Post-election Face-to-Face survey
31 of 43 30044
The number of members of parliament is about 100?
X 2 If there were another UK General Election tomorrow, how likely is it that you would vote? READ OUT
5 Very likely that I would vote 4 Fairly likely
3 Neither likely nor unlikely 2 Fairly unlikely
1 Very unlikely that I would vote -1 (Don't know)
Refused
X 3 And if there were a UK General Election tomorrow, which party would you vote for? DO NOT PROMPT
1 I would not vote 2 Labour
3 Conservatives 4 Liberal Democrats
5 Scottish National Party (SNP) [SCOTLAND ONLY] 6 Plaid Cymru [WALES ONLY]
7 Green Party 8 United Kingdom Independence Party (UKIP)
9 Other (WRITE IN) - 1 (Don’t know)
Refused
K 6 Do you use Twitter?
1 Yes 0 No
- 1 (Don’t know)
K 8 Do you use Facebook?
1 Yes 0 No
- 1 (Don’t know)
Y Demographics
Now some questions about you and your household which will enable us to understand the answers you have given.
BES 2017 Post-election Face-to-Face survey
32 of 43 30044
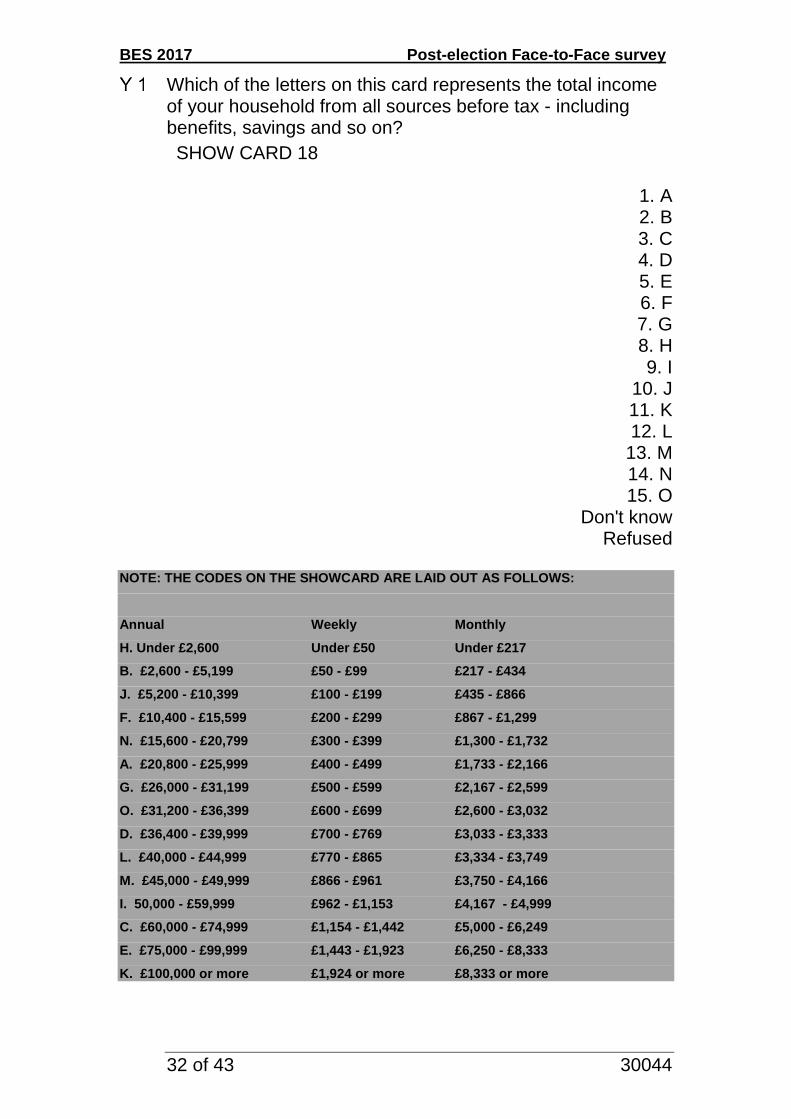
Which of the letters on this card represents the total income of your household from all sources before tax - including benefits, savings and so on?
SHOW CARD 18
1. A 2. B 3. C 4. D 5. E 6. F 7. G 8. H 9. I
10. J 11. K 12. L 13. M 14. N 15. O
Don't know Refused
NOTE: THE CODES ON THE SHOWCARD ARE LAID OUT AS FOLLOWS:
Annual Weekly Monthly
H. Under £2,600 Under £50 Under £217
B. £2,600 - £5,199 £50 - £99 £217 - £434
J. £5,200 - £10,399 £100 - £199 £435 - £866
F. £10,400 - £15,599 £200 - £299 £867 - £1,299
N. £15,600 - £20,799 £300 - £399 £1,300 - £1,732
A. £20,800 - £25,999 £400 - £499 £1,733 - £2,166
G. £26,000 - £31,199 £500 - £599 £2,167 - £2,599
O. £31,200 - £36,399 £600 - £699 £2,600 - £3,032
D. £36,400 - £39,999 £700 - £769 £3,033 - £3,333
L. £40,000 - £44,999 £770 - £865 £3,334 - £3,749
M. £45,000 - £49,999 £866 - £961 £3,750 - £4,166
I. 50,000 - £59,999 £962 - £1,153 £4,167 - £4,999
C. £60,000 - £74,999 £1,154 - £1,442 £5,000 - £6,249
E. £75,000 - £99,999 £1,443 - £1,923 £6,250 - £8,333
K. £100,000 or more £1,924 or more £8,333 or more

BES 2017 Post-election Face-to-Face survey
33 of 43 30044
Which of these best describes where you live?
SHOW CARD 19 1 Own home outright
2 Own home on mortgage 3 Rented from local authority
4 Rented from private landlord 5 It belongs to a Housing Association
- 1 (Don’t know)
Do you have day-to-day caring responsibilities for any of the following in your family? (Please choose all that apply)
IF NECESSARY – this means any type of looking after or caring that you might do SHOW CARD 20
1 Pre-school aged children 2 School aged children
3 Sick, disabled or elderly adults 9 None of the above
- 1 (Don’t know)
Do you regard yourself as belonging to any particular religion?
IF YES: Which? DO NOT PROMPT
0 No religion 1 Christian - no denomination
2 Roman Catholic 3 Church of England/ Anglican/Episcopal
4 Presbyterian/Church of Scotland 5 Methodist
6 Baptist 7 United Reform Church (URC)/Congregational
8 Free Presbyterian 9 Brethren
10 Other Protestant (WRITE IN) 11 Other Christian (WRITE IN)
12 Jewish 13 Hindu
14 Islam/Muslim 15 Sikh

BES 2017 Post-election Face-to-Face survey
34 of 43 30044
16 Buddhist 17 Other non-Christian (WRITE IN)
97 Refusal
IF DID NOT SAY ‘NO RELIGION’ OR REFUSED AT Y 6
Apart from such special occasions as weddings, funerals and baptisms and so on, how often nowadays do you attend services or meetings connected with your religion?
PROBE AS NECESSARY
1 Once a week or more 2 Less often but at least once in two weeks
3 Less often but at least once a month 4 Less often but at least twice a year 5 Less often but at least once a year
6 Less often 7 Varies too much to say
8 Never or practically never ASK ALL
Are you a member of a trade union or staff association?
PROBE AS NECESSARY. CODE FIRST TO APPLY
1 Yes: trade union 2 Yes: staff association
3 No
INTERVIEWER TO OBSERVE AND RECORD: GENDER OF RESPONDENT
1. Male 2. Female
GFK TO CODE LOCATION INFORMATION
Place can you me tell your age at your last birthday
ENTER AGE Refused
Please choose one option that best describes your ethnic group or background
SHOW CARD 21
BES 2017 Post-election Face-to-Face survey
35 of 43 30044
White 1. English/Welsh/Scottish/Northern Irish/British
2. Irish 3. Gypsy or Irish Traveller
4. Any other White background, please describe
Mixed/Multiple ethnic groups 5. White and Black Caribbean
6. White and Black African 7. White and Asian
8. Any other Mixed/Multiple ethnic background, please describe
Asian/Asian British
9. Indian
10. Pakistani 11. Bangladeshi
12. Chinese 13. Any other Asian background, please describe
. Black/ African/Caribbean/Black British
14. African 15. Caribbean
16. Any other Black/African/Caribbean background, please describe
Other ethnic group
17. Arab 18. Any other ethnic group, please describe
Y12A Do you have any educational or work-related qualifications?
1 Yes 2 No
IF ‘YES’ AT Y12A ASK Y13A ELSE GO TO Y17
Y13A What is the highest qualification you have? Please take your answer from this card and just give me the number next to it. SHOW CARD 22 INTERVIEWER: If qualification is not in list, probe for equivalent if possible.
1. Postgraduate degree 2. First degree

BES 2017 Post-election Face-to-Face survey
36 of 43 30044
3. Univ/poly diploma 4. Teaching qualification
5. Nursing qualification 6. HNC/HND, City&Guilds level 4, NVQ/SVQ 4/5
7. A level or equivalent 8. Scottish Higher or equivalent
9. ONC/OND, City&Guilds level 3, NVQ/SVQ 3 10. GCSE A*-C, CSE grade 1, O level grade A-C
11. Scottish Standard grades, Ordinary bands 12. GCSE D-G, CSE grades 2-5, O level D-E
13. City&Guilds level 2, NVQ/SVQ 2 and equiv 14. City&Guilds level 1, NVQ/SVQ 1 and equiv
15. Clerical and commercial qualifications 16. Recognised trade apprenticeship
17. Youth training certificate, skill seekers 18. Other technical, professional or higher
qualification (WRITE IN)
Y17 Which of these categories best describes what YOU mainly personally do at the moment?
SHOW CARD 23 CODE MAIN ACTIVITY ONLY
1. Working full time - employee (30+ hours) 2. Working full time - self-employed (30+ hours)
3. Working part time - employee (8-29 hours) 4. Working part time - self-employed (8-29 hours)
5. Unemployed and actively seeking work 6. On a government sponsored training scheme
7. A full time student or pupil 8. Looking after the family or home
9. Not working because temporarily sick or injured 10. Not working because long-term sick or disabled
11. Retired from paid work 12. None of these
CODE 5 AT Y17 Y17a Have you been unemployed for less than 1 year or longer than that?
1. Less than 1 year 2. 1 or more years

BES 2017 Post-election Face-to-Face survey
37 of 43 30044
CODES 5-12 AT Y17
Have you ever had a paid job at all, apart from any casual or holiday work?
1. Yes
2. No
IF YES AT Y 18 I would like to now ask you some questions about your last job…
Y18 A Were you an employee or self employed? 1. Employee
2. Self employed
CODES 1-4 AT Y17 OR YES AT Y 18
What [does/did1] the firm/organisation you worked for mainly make or do (at the place where you work/worked)?
NOTE: YOU NEED A FULL DESCRIPTION. PROBE FOR ‘MANUFACTURING’, ‘PROCESSING’, ‘DISTRIBUTING’, ETC AND MAIN GOODS PRODUCED, MATERIALS USED, WHOLESALE OR RETAIL ETC. OPEN ENDED
What [is/was] your (main) job?
OPEN ENDED IF MORE THAN ONE JOB, MAIN JOB IS THE JOB WITH THE MOST HOURS. IF EQUAL HOURS THEN MAIN JOB IS JOB THAT IS HIGHEST PAID
What [do/did] you mainly do in your job?’
OPEN NOTE: CHECK FOR ANY SPECIAL QUALIFICATIONS, TRAINING, ETC NEEDED TO DO THE JOB. IF EMPLOYEE AT Y17 or Y18A
1 For Y18 – Y24 use present tense for codes 1-4 at Y17 and past tense for code 1 at Y18

BES 2017 Post-election Face-to-Face survey
38 of 43 30044
In your job, [do/ did] you have any formal responsibility for supervising the work of other employees?
Note: Do not include supervisors of children, e.g. teachers, nannies, childminders; supervisors of animals; or people who supervise security or buildings only, e.g. caretakers, security guards.
1. Yes 2. No
How many people work[ed] for your employer at the place where you work[ed]? [Is/Were] there...
IF NECESSARY: this is the total number of employees at the your workplace, not just the number employed within your particular section or department. This might consist of a single building, part of a building or, at the largest, a self-contained group of buildings.
1. 1 to 24 2. 25 to 499, or
3. 500 or more employees? IF SELF EMPLOYED AT Y17 OR Y18A
[Are/Were] you working on your own or [do/did] you have employees?
1. On own/with partner(s) but no employees 2. With employees
IF WITH EMPLOYEES AT Y 24
How many people [do/did] you employ at the place where you worked? [Are/Were] there…
1. 1 to 9 2. 10 to 24
3. 25 to 499 or 4. 500 or more employees?
Can I just check, are you ...
READ OUT IF RESPONDENT SAYS THEY ARE IN A CIVIL PARTNERSHIP CODE AS MARRIED
1. Married 2. Living with partner
3. Single

BES 2017 Post-election Face-to-Face survey
39 of 43 30044
4. Widowed 5. Separated
6. Divorced
Finally, as far as you know, is your name on the electoral register, that is, the official list of people entitled to vote, either at this address or somewhere else? INTERVIEWER NOTE ‘if respondent says 2 addresses please select code 1 ‘at this address’
1 Yes, at this address 2 Yes, at another address 3 No, I am not registered
- 1 (Don’t know) IF REGISTERED AT ANOTHER ADDRESS CODE 2 AT Y 45
Where is the other address where your name is on the electoral register? Please enter the postcode.
ENTER POST CODE Don’t know Refused
Y46A_NEW We would like to link the answers you have given in this survey to other information about the proportion of people round here who voted. To do this we would like your permission to match your name and address to information held on the electoral register. This matching will only be done with information that is already publicly available, and will NOT include any information about who you voted for.
Would you be willing for us to add administrative data from the electoral register to the answers you have given us today?
IF NECESSARY ADD No information about how you voted is stored anywhere – your ballot papers are destroyed after the election IF RESPONDENT NEEDS MORE INFORMATION Please look at this card which explains more about the process
1. Yes
2. No
BES 2017 Post-election Face-to-Face survey
40 of 43 30044
That is the end of the interview. We are grateful for your help with this very important project. Please accept this £10/£20/£252 worth of gift vouchers as a thank you for taking part.
We are also conducting a short self-completion survey, and we would be very grateful for your help with this. All participants will receive another £5 voucher. Are you happy to take part ? It will take around 10 minutes to complete
IF YES: The survey can be completed online. Are you able to provide me with your email address please? IF NO OR IF SAYS DOES NOT WANT TO DO IT ONLINE: you can complete through a paper questionnaire and send it back to us if you cannot do it online IF NECESSARY: Only the person who took part in this survey should complete the self-completion questionnaire.
1. Yes- via the online survey 2. Yes – via paper questionnaire
3. No- do not want to take part
IF YES ONLINE AT Y47: Please tell me your email address or type it directly into the laptop for me
ENTER EMAIL ADDRESS Thank you - we will send you an email in the next few days that contains a link to the survey - the email will be from a GfK email address and the email heading will be Britain in 2017 follow up survey. Please check your spam or junk if you cannot find it in your inbox. IF YES VIA PAPER QUESTIONNAIRE AT Y47 INTERVIEWER: Please write the serial number below on the paper questionnaire [CAPI – PLEASE DISPLAY THE SERIAL NUMBER HERE] NEW SCREEN
2 Show £25 if respondent is aged 18-24, else show £20 if in London or £10 out of London (based on sample) or £20 if part of recontact sample

BES 2017 Post-election Face-to-Face survey
41 of 43 30044
Then please type in the serial number found on the front page of questionnaire here: NEW SCREEN: Now please hand the questionnaire and the freepost envelope to the respondent. IF YES AT Y47: Thank you for agreeing to take part in the self completion survey. Once you have [ONLINE] completed the survey / [PAPER] returned the questionnaire, we will send you a £5 voucher through the mail. INTERVIEWER: CONFIRM ADDRESS WITH RESPONDENT. IF ANYTHING NEEDS CHANGING, PLEASE USE THE BOX BELOW AND ASK THEM TO CONFIRM. IT IS IMPORTANT THAT WE HAVE THE CORRECT ADDRESS IN ORDER TO SEND THE VOUCHER ONCE THE QUESTIONNAIRE IS [ONLINE] COMPLETED / [PAPER] RECEIVED. SCRIPTER: PLEASE BRING UP THE ADDRESS INFO WITH 2 OPTIONS: A CODE TO CONFIRM ADDRESS IS CORRECT AND AN OPEN BOX FOR THEM TO WRITE IN CORRECT DETAILS 1 Address is correct
INTERVIEWER PLEASE ENSURE THAT THE RESPONDENT SIGNS THE CONTACT SHEET TO SAY THAT THEY HAVE RECEIVED THE INCENTIVE FOR THE MAIN SURVEY [CAPI – IF THAT APPLIES: AND THE SELF COMPLETION SURVEY] That should be [CAPI INSERT AMOUNT] worth of gift vouchers in total
FOLLOWUP 1 This survey is being carried out by GfK, an independent social research company. Occasionally we need to speak to people more than once. If we need to come back to you with any questions relating to this survey or to help with other connected research, would you be willing to help us?
BES 2017 Post-election Face-to-Face survey
42 of 43 30044
IF NECESSARY, ADD: You can be assured that your name will never be passed to anyone outside our organisation without your permission.
1. Yes – willing to be re-contacted 2. No – not willing to be re-contacted
FOLLOWUP 2
If follow up research was being carried out for the Universities of Manchester, Oxford, and Nottingham, would you be willing for GfK to pass your name and contact details and information from this survey to another research organisation so they could contact you? If you are recontacted there will be no obligation to take part in any further research.
1. Yes – willing for details to be passed on 2. No – not willing for details to be passed on
IntUse
Approximately how many hours in total have you spent actively using the internet in the last week (i.e. the last seven days)? This includes E-mail, web browsing/surfing and other on-line services such as downloading, but does not cover time when you were connected but were not using it. Please include both work and personal use.
Less than 1 hour 1. 1 to 2 hours
2. 3-5 hours 3. 6-7 hours
4. 8-10 hours 5. 11-19 hours 6. 20-29 hours
7. 30 hours or more 8. Don't know
INTERVIEWER CODE (DO NOT READ OUT)
Who else was present during interview? INTERVIEWER: Code all that apply.
1. No-one else present (should not be multi-coded)
2. Respondent's partner/husband/wife 3. Respondent’s son/daughter

BES 2017 Post-election Face-to-Face survey
43 of 43 30044
4. Other adult living in household 5. Other young person living in household
6. Other adult/young person not living in household

BES England V1.01 2017 1
Britain in 2017 study
Only the person who took part in the initial interview should complete this questionnaire:
Please read the following before completing this questionnaire:
• Most of the questions inside this booklet can be answered simply by placing a cross ( x ) in one or more of the boxes.
• Please cross one box per question unless otherwise instructed
• If you have made a mistake in your answer, please completely fill the box to show the mistake ( ) and then cross the correct answer. No special knowledge is required.
• If you have any queries please contact GfK on 0800 496 0301 or [email protected]
Returning the questionnaire:
Please complete the questionnaire as soon as you possibly can and return it in the prepaid address envelope provided by the interviewer or to:
GfK, Freepost RSZE-ARZR-SGAB
INTERVIEWER PLEASE DO THE FOLLOWING BEFORE HANDING THIS TO RESPONDENT
Enter serial number shown on CAPI: Then type in this number into CAPI when prompted:
ü

BES England V1.01 2017 2
Q1. How closely do you follow politics on TV, radio, newspapers, or the Internet? Very closely, fairly closely, not very closely, or not at all? PLEASE CROSS ONE BOX ONLY Very closely .............................................................................................................. Fairly closely .............................................................................................................. Not very closely ......................................................................................................... Not at all .................................................................................................................... Don’t know .................................................................................................................
Q2. Do you strongly agree, somewhat agree, neither agree nor disagree, somewhat disagree, or strongly disagree with the following statements? PLEASE CROSS ONE BOX ONLY ON EACH ROW Strongly Somewhat Neither Somewhat Strongly Don’t agree agree agree nor disagree disagree know disagree You feel you understand the most important political issues of this country. ......................... What people call compromise in politics is just selling out on one’s principles. ............................... Most politicians do not care about the people. ........................ Most politicians are trustworthy. ......... Politicians are the main problem in Britain. .............................. Having a strong leader in government is good for Britain even if the leader bends the rules to get things done.................... . The people, and not politicians, should make our most important policy decisions.............. ... Most politicians care only about the interests of the rich and powerful .
Q3. Now thinking about minorities in Britain. PLEASE CROSS ONE BOX ONLY ON EACH ROW Strongly Somewhat Neither Somewhat Strongly Don’t agree agree agree nor disagree disagree know disagree Minorities should adapt to the customs and traditions of Britain. ....... The will of the majority should always prevail, even over the rights of minorities. ............................... .............. Immigrants are generally good for Britain’s economy. .............................. Britain’s culture is generally harmed by immigrants. .................................... Immigrants increase crime rates in Britain. ................................................

BES England V1.01 2017 3
Q4. Some people say that the following things are important for being truly British. Others say they are not important. How important do you think the following is for being truly British... very important, fairly important, not very important, or not important at all? PLEASE CROSS ONE BOX ONLY ON EACH ROW
Very Fairly Not very Not Don’t important important important important know at all To have been born in Britain. ................. For your grandparents to have been born in Britain. .................................................... To have British ancestry. ........................ To be able to speak English. ................. To follow Britain’s customs and traditions.
Q5. Now on to another topic. How widespread do you think corruption such as bribe taking is among politicians in Britain: very widespread, quite widespread, not very widespread, or it hardly happens at all? PLEASE CROSS ONE BOX ONLY
Very widespread ....................................................................................................... Quite widespread ...................................................................................................... Not very widespread .................................................................................................. It hardly happens at all .............................................................................................. Don’t know .................................................................................................................
Q6. Now thinking about the performance of the UK government in general, how good or bad a job do you think the UK government did over the past two years? Has it done a very good job? A good job? A bad job? A very bad job? PLEASE CROSS ONE BOX ONLY Very good job ........................................................................................................... Good job .................................................................................................................... Bad job ...................................................................................................................... Very bad job .............................................................................................................. Don’t know .................................................................................................................
Q7. Would you say that any of the parties in Britain represent your views reasonably well?
Yes ............................................................................................................................. Go to Q8 No .............................................................................................................................. Go to Q9 Don’t know ................................................................................................................. Go to Q9
Q8. Which party represents your views best? PLEASE WRITE IN BELOW
..................................................................................................................................
Don’t know .................................................................................................................

BES England V1.01 2017 4
Q9. In politics people sometimes talk of left and right, where would you place the following parties on this scale? PLEASE CROSS ONE BOX ONLY FOR EACH ROW
Left Right Don’t 0 1 2 3 4 5 6 7 8 9 10 know Conservatives .................... Labour ............................... Liberal Democrats ............. UKIP .................................. Green Party ......................
Q10. Some people feel that government should make much greater efforts to make people’s incomes more equal. Other people feel that government should be much less concerned about how equal people’s incomes are. On a scale where 0 means the government should make much greater efforts to make people’s incomes more equal, and 10 means that government should be much less concerned about how equal people’s incomes are where would you place the policies of the following parties on this scale? PLEASE CROSS ONE BOX ONLY FOR EACH ROW
Government should Government should make much greater be much less efforts to make people’s concerned about people’s income more how equal people’s equal incomes are Don’t 0 1 2 3 4 5 6 7 8 9 10 know Conservatives .................... Labour ............................... Liberal Democrats ............. UKIP .................................. Green Party ......................
Q11. On a scale that runs from 0 to 10, where 0 means strongly dislike and 10 means strongly like, how do you feel about : PLEASE CROSS ONE BOX ONLY FOR EACH ROW
Strongly dislike Strongly like Don’t 0 1 2 3 4 5 6 7 8 9 10 know Conservatives .................... Labour ............................... Liberal Democrats ............. UKIP .................................. Green Party ......................
Q12. When thinking about the last general election in Britain, do you agree or disagree with the following statements? PLEASE CROSS ONE BOX ONLY FOR EACH ROW
Strongly Somewhat Neither Somewhat Strongly Don’t agree agree agree nor disagree disagree know disagree
Votes were counted fairly ................... Journalists provided fair coverage of elections ............................... ................ Elections officials were fair. ................ Rich people buy elections .................. Voters were offered a genuine choice at the ballot box.................... .............
BES England V1.01 2017 5
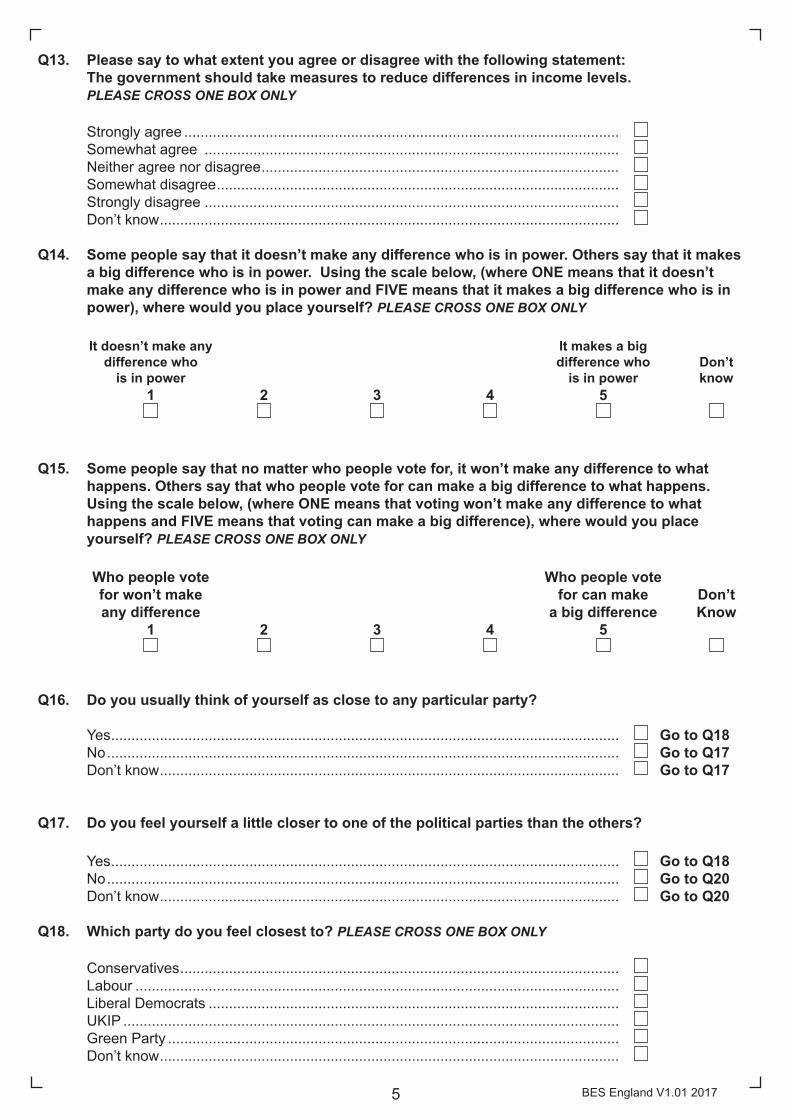
Q13. Please say to what extent you agree or disagree with the following statement: The government should take measures to reduce differences in income levels. PLEASE CROSS ONE BOX ONLY
Strongly agree ........................................................................................................... Somewhat agree ...................................................................................................... Neither agree nor disagree ........................................................................................ Somewhat disagree ................................................................................................... Strongly disagree ...................................................................................................... Don’t know .................................................................................................................
Q14. Some people say that it doesn’t make any difference who is in power. Others say that it makes a big difference who is in power. Using the scale below, (where ONE means that it doesn’t make any difference who is in power and FIVE means that it makes a big difference who is in power), where would you place yourself? PLEASE CROSS ONE BOX ONLY
It doesn’t make any It makes a big difference who difference who Don’t is in power is in power know 1 2 3 4 5
Q15. Some people say that no matter who people vote for, it won’t make any difference to what happens. Others say that who people vote for can make a big difference to what happens. Using the scale below, (where ONE means that voting won’t make any difference to what happens and FIVE means that voting can make a big difference), where would you place yourself? PLEASE CROSS ONE BOX ONLY
Who people vote Who people vote for won’t make for can make Don’t any difference a big difference Know 1 2 3 4 5
Q16. Do you usually think of yourself as close to any particular party?
Yes ............................................................................................................................. Go to Q18 No .............................................................................................................................. Go to Q17 Don’t know ................................................................................................................. Go to Q17
Q17. Do you feel yourself a little closer to one of the political parties than the others?
Yes ............................................................................................................................. Go to Q18 No .............................................................................................................................. Go to Q20 Don’t know ................................................................................................................. Go to Q20
Q18. Which party do you feel closest to? PLEASE CROSS ONE BOX ONLY
Conservatives ............................................................................................................ Labour ....................................................................................................................... Liberal Democrats ..................................................................................................... UKIP .......................................................................................................................... Green Party ............................................................................................................... Don’t know .................................................................................................................

BES England V1.01 2017 6
Q19. Do you feel very close to this party, somewhat close, or not very close? PLEASE CROSS ONE BOX ONLY
Very close .................................................................................................................. Somewhat close ........................................................................................................ Not very close ............................................................................................................ Don’t know .................................................................................................................
Q20. Which country were you born in?
England ..................................................................................................................... Scotland .................................................................................................................... Wales ......................................................................................................................... Northern Ireland ........................................................................................................ Other .........................................................................................................................
Q21. Were either or both of your parents born outside of Britain?
Yes ............................................................................................................................. No .............................................................................................................................. Don’t know .................................................................................................................
Q22. What language do you usually speak at home (If more than one language is spoken at home, please tell us the language spoken most of the time)?
English .......................................................................................................................
Other..........................................................................................................................
Q23. What date did you complete this questionnaire?
ENTER DATE
And lastly just a few details about yourself…
Q24. Are you ….
Male .............................................................................................. Female ..........................................................................................
Q25. And what was your age last birthday?
Enter years
Thank you for taking part in the survey. We would be grateful if you check whether you have answered all relevant questions. Please return this questionnaire in the pre-paid envelope provided or send to
GfK, Freepost RSZE-ARZR-SGAB as soon as possible
D D M M Y Y Y Y

Derived variables region STRING VARIABLE
East Midlands Eastern London
North East North West
Scotland South East South West
Wales West Midlands
Yorkshire & Humber recontact CODED VARIALBE
2015 recontact sample 1 Yes 2 No
agency CODED VARIABLE Fieldwork agency
1 GfK 2 Kantar 3 Natcen
Constit_Code STRING VARIABLE (INTERVIEWER CODED)
ONS Parliamentary Constituency identifier Constit_Name STRING VARIABLE (INTERVIEWER CODED)
ONS Parliamentary Constituency Name
pano CODED VARIABLE Press Association Parliamentary Constituency Identifier
Interview_Date String VARIABLE
Date of interview total_num_dwel INTEGER VARIABLE
Total number of dwellings at sampled address total_num_hous INTEGER VARIABLE
Total number of households at sampled dwelling

num_elig_people INTEGER VARIABLE
Total number of eligible people in sampled household nr_calls_1st INTEGER VARIABLE
Number of calls made in first issue reissue CODED VARIABLE (INTERVIEWER CODED)
Binary indicator of whether the interview was reissued 0 No
1 Yes nr_calls_reissue INTEGER VARIABLE
Number of calls made after interview reissue
edlevel CODED VARIABLE Education level
0 No qualifications 1 Below GCSE
2 GCSE 3 A-level
4 Undergraduate 5 Postgraduate
turnoutValidationReg CODED VARIABLE
Validate turnout
1 Voted: The respondents appeared on the electoral register and was marked as having voted.
2 Not voted-registered: The respondent appeared on the electoral register and was eligible to vote but was not marked as having voted.
3 Not voted-unregistered: The respondent did not appear on the electoral register.
4 Insufficient information: There was insufficient information available on either the survey or electoral register to match the respondent (e.g. due
to missing pages). 5 Ineligible: The respondent appeared on the electoral register but was
marked ineligible to vote in the general election.

validatedTurnoutBinary CODED VARIABLE Recode of turnoutValidationReg
0 Did not vote 1 Voted
ns_sec CODED VARIABLE
National Statistics Socio-economic classification operational categories based on Standard Occupational Classifications 2010
(SOC2010)
10 Employers in large establishments 20 Higher managerial and administrative occupations
31 L3.1 Traditional employees 32 L3.2 New employees
33 L3.3 Traditional self-employed 34 L3.4 New self-employed
41 L4.1 Traditional employees 42 L4.2 New employees
43 L4.3 Traditional self-employed 44 L4.4 New self-employed
50 Lower managerial and administrative occupations 60 Higher supervisory occupations
71 L7.1 Intermediate clerical and administrative occupations 72 L7.2 Intermediate sales and service occupations
73 L7.3 Intermediate technical and auxiliary occupations 74 L7.4 Intermediate engineering occupations
80 Employers in small organisations 81 L8.1 Employers in small establishments in industry, commerce,
services etc. 82 L8.2 Employers in small establishments in agriculture
90 Own account workers 91 L9.1 Own account workers (non-professional)
92 L9.2 Own account workers (agriculture) 100 Lower supervisory occupations
111 L11.1 Lower technical craft occupations 112 L11.2 Lower technical process operative occupations
121 L12.1 Semi-routine sales occupations 122 L12.2 Semi-routine service occupations
123 L12.3 Semi-routine technical occupations 124 L12.4 Semi-routine operative occupations
125 L12.5 Semi-routine agricultural occupations 126 L12.6 Semi-routine clerical occupations
127 L12.7 Semi routine childcare occupations

131 L13.1 Routine sales and service occupations 132 L13.2 Routine production occupations
133 L13.3 Routine technical occupations 134 L13.4 Routine operative occupations
135 L13.5 Routine agricultural occupations 141 L14.1 Never worked
142 L14.2 Long-term unemployed 150 Full-time students
160 Occupations not stated or inadequately described 170 Not classifiable for other reasons
ns_sec_analytic CODED VARIABLE
National Statistics Socio-economic classification analytic classes based on Standard Occupational Classifications 2010 (SOC2010)
11 Employers in large organisations and higher managerial 12 Higher professional occupations
20 Lower professional and managerial and higher supervisory 30 Intermediate occupations
40 Employers in small organisations and own account workers 50 Lower supervisory and technical occupations
60 Semi-routine occupations 70 Routine occupations
Seg CODED VARIABLE
Socio-Economic Group based on Standard Occupational Classifications 2010 (SOC2010)
https://www.iser.essex.ac.uk/archives/nssec/derivations-of-social-class
11 Employers in industry, commerce, etc large establishments
12 Managers in central and local government, industry, commerce, etc large establishments
21 Employers in industry, commerce, etc small establishments
22 Managers in industry, commerce, etc small establishments
30 Professional workers - self-employed 40 Professional workers -employees

51 Intermediate non-manual workers -ancillary workers and artists
52 Intermediate non-manual workers -foremen and supervisors non-manual
60 Junior non-manual workers 70 Personal service workers
80 Foremen and supervisors -manual 90 Skilled manual workers
100 Semi-skilled manual workers 110 Unskilled manual workers
120 Own account workers other than professional 130 Farmers -employers and managers
140 Farmers -own account 150 Agricultural workers
160 Members of armed forces
Sc CODED VARIABLE
Social Class based on Standard Occupational Classifications 2010 (SOC2010) https://www.iser.essex.ac.uk/archives/nssec/derivations-of-
social-class
10 Professional, etc occupations 20 Managerial and Technical occupations
31 Skilled occupations- Non-manual 32 Skilled occupations- manual
40 Partly skilled occupations 50 Unskilled occupations
60 Armed forces
mii_coded CODED VARIABLE
Coded responses to a01: Most important Issue 1 health
2 education 3 election outcome
4 pol-neg 5 partisan-neg
6 societal divides 7 morals
8 nat ident, goals-loss 9 racism/discrimination
10 welfare 11 terrorism

12 immigration 13 asylum
14 crime 15 europe
19 scot-ind 21 foreign affairs
22 war 23 defence
26 economy-general 27 economy-personal
28 unemployment 29 taxation
30 debt/deficit 31 inflation
32 living costs 33 poverty
34 austerity 35 inequality
36 housing 37 social care
38 pensions/ageing 39 transport/infrastructure
40 environment 41 pol value-auth
42 pol values-liberal 44 pol values-left
45 other 46 uncoded
msoa11 STRING VARIABLE
2011 Census middle layer super output area
imddecile INTEGER VARIABLE
IMD quintile 1 = most deprived through to 10 = least deprived. Range [1-10]