British Columbia Hydro and Power Authority D: Capital Project Descriptions .....96 Projects Recently...
101
British Columbia Hydro and Power Authority 2015/16 ANNUAL SERVICE PLAN REPORT
Transcript of British Columbia Hydro and Power Authority D: Capital Project Descriptions .....96 Projects Recently...

British Columbia Hydro and Power Authority
2015/16 ANNUAL SERVICE PLAN REPORT

British Columbia Hydro and Power Authority
For more information on BC Hydro contact:
333 Dunsmuir Street
Vancouver, BC
V6B 5R3
Lower Mainland
604 BCHYDRO
(604 224 9376)
Outside Lower Mainland
1 800 BCHYDRO
(1 800 224 9376)
bchydro.com
BC Hydro’s Annual Service Plan Report can be found online at: http://www.bchydro.com/about/accountability_reports/financial_reports/annual_reports.html
2015/16 Annual Service Plan Report 2

British Columbia Hydro and Power Authority
Chair, Board of Directors Accountability Statement
BC Hydro is a provincial Crown Corporation, owned by the people of British Columbia. We operate an integrated system of generation, transmission and distribution infrastructure to deliver reliable, affordable and clean electricity to our four million customers, safely. As an organization, we have a huge impact on the lives of the people of British Columbia and we are working together to uphold this responsibility and become the most trusted, innovative utility company in North America - smart about power in all we do.
The 2015/16 Annual Service Plan Report outlines BC Hydro’s performance on the strategies and measures set out in our 2015/16 – 2017/18 Service Plan. It details how we are meeting the objectives in the Government Mandate Letter and aligning with the Taxpayer Accountability Principles.
This report was prepared under the Board’s direction in accordance with the Budget Transparency and Accountability Act and the B.C. Reporting Principles. The Board and Management are accountable for the contents of the report, including what has been included and how it has been reported.
The information presented reflects the actual performance of BC Hydro for the year ended March 31, 2016, in relation to the 2015/16 - 2017/18 Service Plan. The Board is responsible for ensuring internal controls are in place to measure information and report accurately and in a timely fashion.
All significant assumptions, policy decisions, events and identified risks, as of March 31, 2016 have been considered in preparing the report. The report contains estimates and interpretive information that represent the best judgment of management. Any changes in mandate direction, goals, strategies, measures or targets made since the 2015/16 - 2017/18 Service Plan was released and any significant limitations in the reliability of the information are identified in the report.
The BC Hydro 2015/16 Annual Service Plan Report compares the corporation’s actual results to the expected results identified in the 2015/16 - 2017/18 Service Plan. I am accountable for those results as reported.
W.J. Brad Bennett, O.B.C. Chair, Board of Directors
2015/16 Annual Service Plan Report 3
British Columbia Hydro and Power Authority
2015/16 Annual Service Plan Report 4
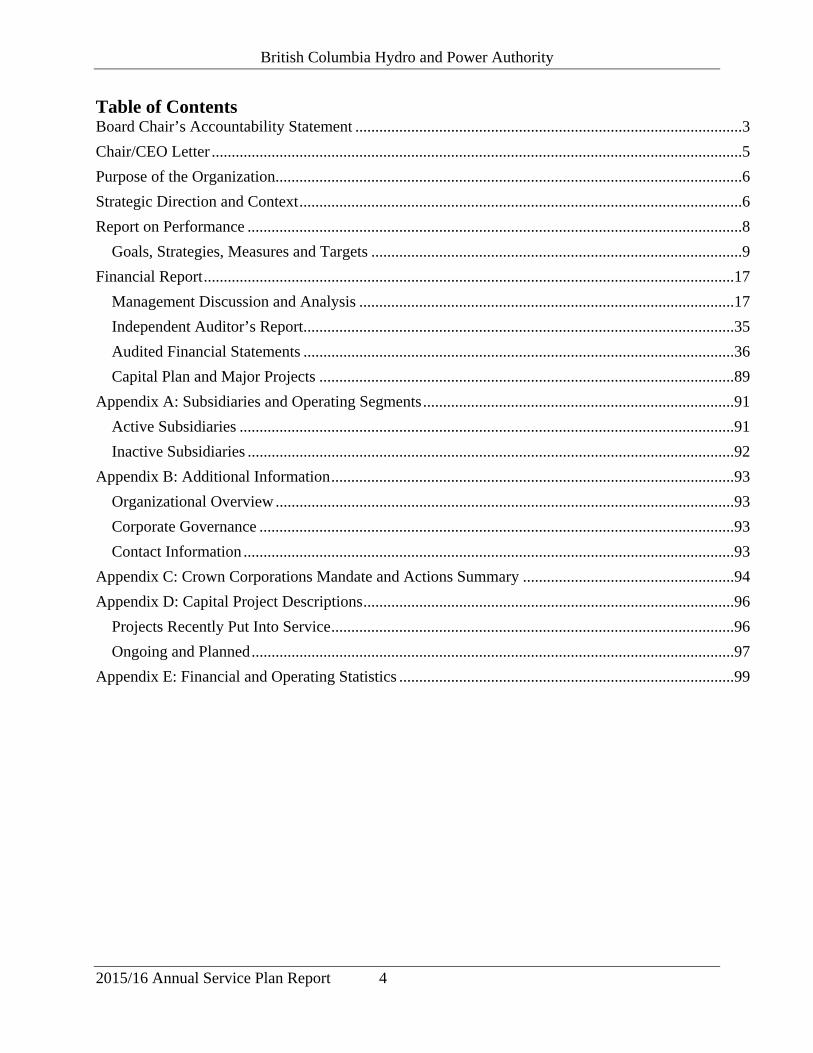
Table of Contents Board Chair’s Accountability Statement .................................................................................................3 Chair/CEO Letter .....................................................................................................................................5 Purpose of the Organization.....................................................................................................................6 Strategic Direction and Context ...............................................................................................................6 Report on Performance ............................................................................................................................8
Goals, Strategies, Measures and Targets .............................................................................................9 Financial Report .....................................................................................................................................17
Management Discussion and Analysis ..............................................................................................17 Independent Auditor’s Report ............................................................................................................35 Audited Financial Statements ............................................................................................................36 Capital Plan and Major Projects ........................................................................................................89
Appendix A: Subsidiaries and Operating Segments ..............................................................................91 Active Subsidiaries ............................................................................................................................91 Inactive Subsidiaries ..........................................................................................................................92
Appendix B: Additional Information .....................................................................................................93 Organizational Overview ...................................................................................................................93 Corporate Governance .......................................................................................................................93 Contact Information ...........................................................................................................................93
Appendix C: Crown Corporations Mandate and Actions Summary .....................................................94 Appendix D: Capital Project Descriptions .............................................................................................96
Projects Recently Put Into Service .....................................................................................................96 Ongoing and Planned .........................................................................................................................97
Appendix E: Financial and Operating Statistics ....................................................................................99

British Columbia Hydro and Power Authority
Chair, Board of Directors and Chief Executive Officer Letter
On behalf of the Board of Directors and all BC Hydro employees, we are pleased to submit BC Hydro’s Annual Service Plan Report for the year ending March 31, 2016. This past year we began construction on the Site C Clean Energy project which is one of the largest infrastructure projects ever undertaken in British Columbia. Construction is well underway and the job fairs we have held in the surrounding communities have attracted thousands of people. We are investing $2.3 billion per year for the next 10 years to maintain and upgrade our aging assets as well as develop new power infrastructure to ensure we reliably meet our customer’s current and future electricity needs. We have made advancements in the services we provide to our customers and this will continue to be a focus for us in the coming year. In January 2016, BC Hydro was named the most influential brand in B.C. for 2015 by B.C. Business Magazine. With this honour comes the responsibility to maintain the trust and respect of our customers and stakeholders. While fluctuating commodity prices and other economic shifts have created challenges, we are on target to meet the 10 Year Rates Plan set out by government to help keep rates low and predictable for our customers as a result of prudent actions to reduce costs and become a more focused organization. BC Hydro works closely with the Ministry of Energy and Mines to ensure alignment with government policy expectations through regular meetings and updates. These are held between the Executive, the Minister and his staff and the Board Chair, as appropriate, to discuss progress on achievement of the 10 Year Rates Plan and actions identified in the Government Mandate Letter (highlights in Appendix C: Crown Corporations Mandate and Actions Summary). Regular updates are provided to the Board of Directors each quarter through a Taxpayer Accountability Report which documents actions to support the Taxpayer Accountability Principles. With respect to organizational governance and shareholder engagement, the development and responsibilities of Directors and the Executive are outlined in Appendix B: Additional Information. We’re proud of this year’s accomplishments. We will continue to work together to deliver reliable, affordable and clean electricity to our customers, and to ensure that everyone gets home safely every day.
2015/16 Annual Service Plan Report 5

British Columbia Hydro and Power Authority
Purpose of the Organization BC Hydro’s mission is to provide our customers with reliable, affordable and clean electricity throughout British Columbia, safely. We are one of the largest energy suppliers in Canada, generating and delivering electricity to 95 per cent of the population of British Columbia. We operate an integrated system backed by 30 hydroelectric and two thermal generating stations as well as 79,000 kilometres of transmission and distribution lines. We are proud of our partnership with the independent power sector in British Columbia which operates over 100 projects across the province including biomass, hydro, wind, solar and more. As a provincial Crown corporation, the owner and sole shareholder of BC Hydro is the Province of British Columbia. BC Hydro reports to the B.C. Government through the Minister of Energy and Mines and the Government’s expectations are expressed through the following legislation, policy and instructions:
• The Hydro and Power Authority Act • The Utilities Commission Act • The BC Hydro Public Power Legacy and Heritage Contract Act • The Province’s 2007 BC Energy Plan • The 2010 Clean Energy Act (CEA)
The Hydro and Power Authority Act gives BC Hydro its mandate to generate, manufacture, conserve, supply, acquire, and dispose of power and related products. Powerex Corp. (Powerex) and Powertech Labs Inc. (Powertech) are two wholly-owned subsidiaries of BC Hydro. Powerex is a key participant in energy markets across North America, buying and selling wholesale power, renewable and low-carbon energy and products, natural gas, ancillary services, and financial energy products. Powertech is internationally recognized for providing research and development, testing, technical services, and advanced technology services to clients around the world, including BC Hydro. For more information on Powerex, Powertech, or other active and inactive subsidiaries, see Appendix A: Subsidiaries and Operating Segments. Strategic Direction and Context British Columbia has the third lowest electricity rates in North America for residential customers, the fourth lowest for commercial customers and the fifth lowest for industrial customers. The 10 Year Rates Plan sets out a framework to keep rates as low as possible while BC Hydro makes investments in aging assets and new infrastructure to modernize the province’s electricity system and support British Columbia's growing population and economy. BC Hydro continues to forecast long-term load growth across all customer classes. While our customer base is growing, we also have an aging electricity system which was largely built in the 1960s, 1970s and 1980s and needs to be rebuilt and upgraded to meet current and future needs. That’s why, to maintain our system’s reliability and support the growth of the province over the next decade, BC Hydro is investing an average of $2.3 billion each year on capital projects. From fiscal 2012-2016, BC Hydro completed 563 capital projects at a total cost of $6.49 billion which is 0.18 percent under budget overall.
2015/16 Annual Service Plan Report 6

British Columbia Hydro and Power Authority
BC Hydro is managing its capital portfolio to emphasize cost consciousness, respect the environment and communities in which we work, and strengthen our relationships with First Nations to ensure economic and social benefits for ratepayers. Over the next decade, BC Hydro’s capital projects are expected to generate a total provincial economic impact of $13 billion and create 110,000 person-years of employment0F
1. During 2015/16, capital projects placed in-service were $2.8 billion and several notable projects were completed including:
• Two new units, adding 1,000 megawatts of capacity, at the Mica Generating Station, • The Interior to Lower Mainland Transmission project, a 247 kilometre, 500 kilovolt line,
that will reliably deliver power from the Peace and Columbia systems to customers in our major load centers,
• The Gordon M. Shrum Units 1-5 Turbine Replacement project to upgrade 1960s-era turbines at BC’s largest generating station,
• The completion of our Smart Metering program to modernize our 1950s-era grid and provide customers with the information they need to make smart energy choices; and
• The new Dawson Creek/Chetwynd Area Transmission Project which will increase capacity in the region to provide oil and gas producers with reliable, clean power, support economic development and reduce provincial greenhouse gas emissions.
BC Hydro’s Site C Clean Energy Project will help meet the future electricity needs of British Columbia’s growing population and economy. Site preparation and construction has commenced with vegetation clearing, building of access roads, a construction bridge, and worker accommodations. Procurement activities have resulted in the award of many small and large contracts with commitments totaling approximately $3.8 billion as at March 31, 2016. Thousands of people have attended Site C job fairs and the number of on-site workers peaked at 691 this past year, of which 492 were from British Columbia. Specific to aboriginal business opportunities and employment, in fiscal 2016 $90 million in procurement commitments have been made to First Nations companies, and joint ventures including First Nations companies, and more than 50 First Nations employees and contractors are working on the project. BC Hydro renewed its customer service strategy this past year with the goal of making it easier for customers to do business with us. This has prompted process improvements and training including simplifying bills, and sharing information in a relevant and timely way. BC Hydro also continues to help customers manage their electricity consumption through our conservation and energy management programs and through new tools such as smart meters, which provide customers with the information they need to make smart energy choices. At BC Hydro, we are constantly striving to keep rates affordable and predictable for our customers, to support the achievement of the 10 Year Rates Plan and protect British Columbia’s competitive advantage of having amongst the lowest electricity rates in North America. A key component of these efforts is the prudent management of our operating costs. In 2015/16, we initiated a workforce optimization program to convert external contractors to internal staff in cases where it reduces costs or improves outcomes, and continued our Work Smart program, an employee-led program to identify process efficiencies across the business. As part of that program, our Transmission, Distribution and Customer Service business group identified 16
1 Economic Impact Assessment of BC Hydro’s 10-Year Capital Plan. Deetken Group September 2015.
2015/16 Annual Service Plan Report 7

British Columbia Hydro and Power Authority
projects ranging from trouble response process improvements to vegetation management tools implementation. We also conducted a review of our conservation programs and identified opportunities to reduce costs and take advantage of innovative technologies, such as smart meters, to better respond to customer and system needs. The savings from these types of initiatives over the next few years will continue to help fund important investments in priority areas like customer service, safety, maintenance and capital project planning. This past year, BC Hydro developed a debt management strategy and one component, a Debt Management Regulatory Account, was approved by the BC Utilities Commission (Commission), which will lock-in low long-term interest rates to protect customers from the risk of rising interest rates. We filed our first Rate Design Application since 2007, which reflects extensive stakeholder and customer feedback on our current rate designs, and on potential rate design options. We also filed and received approval for an interim Revenue Requirements Application with the Commission, requesting a four percent rate increase for fiscal 2017, in alignment with the 10 Year Rates Plan. After updating our forecasts to account for recent events in the mining and liquefied natural gas sectors, BC Hydro will file a full Revenue Requirements Application in July 2016, consistent with the rate caps set out in the 10 Year Rates Plan. In 2015/16, domestic revenues before regulatory transfers were lower than planned due to the loss of large industrial load related to declining market conditions including low commodity prices, and a warmer than normal winter affecting residential customers. BC Hydro has responded to these events through prudent management of its operating and capital expenditures to maintain low rates for its customers. In addition, we are implementing the Province’s direction to allow eligible mining customers, under certain circumstances, to postpone payment of their electricity bills with deferred bill amounts to be repaid in full, with interest, as commodity prices recover. Last August, we experienced the largest single day outage event in our history. Approximately 700,000 Lower Mainland and Vancouver Island customers were without power due to a severe windstorm. Despite the amount of damage and number of customers left without power, BC Hydro employees and our contractors performed a commendable job restoring power. The vast majority of customers were restored to service within 48 hours, and all customers were restored within five days. This required a massive effort including the replacement of 200 power poles, 500 broken cross-arms on pole tops, 10,000 meters of wire and more than 1,200 pieces of electrical equipment, as well as the repair of 25 transmission circuits. Compared with previous large-scale restoration efforts, this was the safest, fastest and most cost-effective large scale restoration on record. Delivering electricity safely is critical to our workers and the public, especially during storm events and importantly, no safety incidents occurred during this service restoration. In 2015/16, BC Hydro had no fatalities or serious injuries and our goal continues to be that, every day, all workers go home safe. Report on Performance BC Hydro continues to focus on achieving the objectives outlined in the Government Mandate Letter and aligning with the Taxpayer Accountability Principles. For specific details on
2015/16 Annual Service Plan Report 8

British Columbia Hydro and Power Authority
fulfillment of the Government Mandate Letter, please refer to Appendix C: Crown Corporations Mandate and Action Summary. Under the Taxpayer Accountability Principles, BC Hydro has implemented its action plan with regular communications between the CEO, Board Chair, the Minister and Deputy Minister; quarterly reporting to the Board of Directors; and, alignment of its Service Plan and Annual Service Plan Report with the spirit and intent of the Taxpayer Accountability Principles. Examples of specific outcomes this year include:
• Implementing the Work Smart process improvement program to identify efficiencies and service enhancements in areas like vegetation management, asbestos management and our customer build program where we work with developers in the design and construction of residential developments,
• Implementing the Province’s compensation guidelines for public sector employees, • Being ranked the #1 employer in Canada in an independent survey by Forbes, • Initiating a process to optimize the Standing Offer Program by identifying ways to better
reflect future system needs and considering technological improvements that have led to declining development costs,
• Implementing a new customer strategy to improve service outcomes; and • Developing BC Hydro’s Statement of Aboriginal Principles to guide our relationships
with First Nations. BC Hydro’s values align with the Taxpayer Accountability Principles and employees will continue to identify opportunities that reflect Cost Consciousness, Accountability, Appropriate Compensation, Service, Respect, and Integrity across our business. Goals, Strategies, Measures and Targets In 2015/16, BC Hydro updated its mission: To provide our customers with reliable, affordable, clean electricity throughout B.C., safely. We have continued to implement our strategies to achieve our six goals and 21 performance measures as set out in the 2015/16 - 2017/18 Service Plan; however, these have since been updated to better align with our new mission. The new goals and performance measures are reflected in our new Service Plan for 2016/17 - 2018/19. The goals and measures below track our progress on delivering the identified priorities for 2015/16. BC Hydro management is responsible for measuring performance against targets, and results are reported to the Board on a quarterly basis and publicly in the Annual Service Plan Report. The BC Hydro 2015/16 Annual Service Plan Report compares the corporation’s 2015/16 actual results to the expected results in the 2015/16 - 2017/18 Service Plan. The fiscal 2017 and fiscal 2018 targets presented below are based on the recent 2016/17 - 2018/19 Service Plan.
Goal 1: Safely Keep The Lights On Safely and reliably meet the electricity needs of our customers through integrated planning and technology, and in the operation, maintenance and advancement of our system.
2015/16 Annual Service Plan Report 9

British Columbia Hydro and Power Authority
Strategies Safety BC Hydro is implementing its five year safety strategy, and in 2015/16, the following was achieved:
• Trained and assessed the competency of our powerline technicians and electricians associated with BC Hydro’s Life Saving Rules. This work was initiated this year and will be completed in 2016/17.
• Implemented an improved process to identify critical hazards and ensure multiple safeguards are in place to protect workers.
• Continued work to reduce hazards associated with arc flash, working in confined spaces and with asbestos.
• Implemented a knife cut reduction program by distributing new cutting tools and cut resistant gloves to our employees.
• Made significant progress developing our contractor safety management program, field access to safety information and safety management system improvements.
• Used safety data analytics to assess the safety performance across the organization to identify areas for improvement, and to establish safety priorities and initiatives.
Reliability BC Hydro continues to ensure the reliability of the system by effectively implementing capital and maintenance programs to manage overall asset health:
• This past year, the focused vegetation management program helped to manage the frequency of outages caused by tree contacts.
• Continued deployment of the automatic recloser program has improved customer interruption impact by reducing sustained outages.
• The longer term implementation of the distribution automation strategy through smart meters and other technologies help to improve system flexibility in outage management.
• BC Hydro continues to effectively manage dam safety issues and risks and is focused on implementing the action plan that was identified through a probabilistic seismic hazard analysis completed in 2014/15. This plan calls for $1.9 billion in investment over the next 10 years in dam safety and seismic upgrades. This work is also driving a similar analysis of resiliency for our transmission and distribution system assets and informs our comprehensive emergency management and security plans.
Performance Measures 1-81 Performance Measures
Actual
2012/13
Actual
2013/14
Actual
2014/15
Target 2015/16
Actual 2015/16
Target 2016/17
Target 2017/18
Zero Fatality & Serious Injury2 [Loss of life or the injury has resulted in a permanent disability]
23
0
14 0 0 0 0
Severity2 [Number of calendar days lost due to injury per 200,000 hours worked]
45.15 28.9 23.3 25.0 30.0 N/A6 N/A6
2015/16 Annual Service Plan Report 10

British Columbia Hydro and Power Authority
Performance Measures
Actual
2012/13
Actual
2013/14
Actual
2014/15
Target 2015/16
Actual 2015/16
Target 2016/17
Target 2017/18
Lost Time Injury Frequency2 [Number of employee injury incidents resulting in lost time (beyond the day of the injury) per 200,000 hours worked]
1.0 1.17 1.0 1.0 1.1 1.0 0.9
CAIDI (duration)8
[customer average interruption duration index- hours per interrupted customer]
2.12 2.30 2.36 2.30 2.02 N/A6 N/A6
SAIDI (duration)8 [system average interruption duration index – total outage duration (in hours) experienced by an average customer in a year] (excluding major events)
2.73
3.599
3.07
3.22 3.01
3.22
3.20
SAIFI (frequency)8 [system average interruption frequency index - number of sustained interruptions per year] (excluding major events)
1.29 1.56 1.30 1.40 1.48 1.40 1.35
CEMI-4 (%)8 [customer experienced multiple interruptions - four or more outages]
9.10 12.35 9.23 11.00 12.60 N/A6 N/A6
Winter Generation Availability (%) 98.1 96.8 97.4 96.4 96.5 N/A6 N/A6 1 Performance Measure descriptions, rationale, data source information and benchmarking is available online at www.bchydro.com/performance. 2 BC Hydro’s safety performance measures do not include contractor or public safety injuries or fatalities. 3 Neither of the incidents in fiscal 2013 resulted in a fatality. 4 The fiscal 2015 results reflect a serious injury from an electrical contact that occurred in November 2014. 5 The fiscal 2013 Severity result of 45.1 is unusually high compared to other years. Over 40 per cent of the result is due to five injuries, each of which had considerable time loss (180 days or more). Traditionally, we only experience one or two injuries in a year resulting in this amount of time loss. 6 This measure was removed from the 2016/17 – 2018/19 Service Plan; therefore, targets are not included. 7 Prior years’ results have been calculated based on the latest available data and may be different than previously stated. 8Annual targets are based on a number of factors including long-term historic reliability trending, current year performance, previous years’ investments and future years’ investment plans. 9Actual 2013/14 actuals were updated based upon revised data and may be different than previously stated. Note: Reliability targets are based on specific values, however performance within 10 per cent is considered acceptable given the wide range of variations in weather patterns and uncontrollable elements that can significantly disrupt the electrical system. BC Hydro measures reliability under normal circumstances, because major events are not predictable and largely uncontrollable. The reliability measures are therefore based on data that excludes major events. BC Hydro reviews performance during major events and takes the performance into consideration in reliability improvement initiatives.
Discussion • In 2015/16, BC Hydro had no fatalities or serious injuries. BC Hydro missed the targets for
lost time injury frequency and severity but our performance has remained relatively stable over the past five years. Preventing injuries such as those resulting from slips, trips and falls and cuts through our knife injury reduction program should support future positive results.
• With regards to reliability, CAIDI and SAIDI were better than the annual targets meaning the average system customer interruption duration and the average outage duration of the impacted customers were lower than expected. SAIFI, which represents the average number of times that a customer experiences an outage during the year, remained within the 10 percent range of the target. CEMI-4 exceeded the annual target by more than 10 percent mainly due to multiple weather related outages affecting the same customers four or more times, mostly in the Lower Mainland and Vancouver Island areas.
2015/16 Annual Service Plan Report 11

British Columbia Hydro and Power Authority
Goal 2: Succeed Through Relationships Gain support for our work by building trusted relationships with First Nations, customers, suppliers and the communities we serve. Strategies • In 2015/16, we started the implementation of a comprehensive Customer Strategy. With a
renewed focus on the customer across the organization, along with execution of some specific initiatives to help make it easy for customers to do business with us, we were able to exceed our Customer Satisfaction Survey (CSAT) target by two percent. Some highlights include:
o Call centre training focussing on soft skills to find out what we can do to help our customers, as well as improvements to our planned outage process and our communications to listen to customer concerns and reduce any negative impacts.
o With the installation of smart meters, billing accuracy consistently high due to the nature and accuracy of daily registered reads. For non-smart metered premises, manual meter reading has continued with a quality assurance process to maintain accuracy.
o First call resolution improved this past year from 71 percent to 73.5 percent. • BC Hydro once again earned a gold-level certification for best practices from the Canadian
Council for Aboriginal Business’ Progressive Aboriginal Relations (PAR) program. Key activities we undertook this year to support program sustainment include:
o Engaging with First Nations earlier in the project planning cycle to improve transparency for First Nations to better incorporate their interests into the delivery of our capital programs, as well as enhance opportunities for collaboration.
o Supporting business development and employment by investing approximately $100 million for work undertaken by aboriginal businesses. An example is our contract with a Skeetchestn-owned company to provide gravel for a resurfacing project at our Kelly Lake Substation.
o Advancing training and employment plans with First Nations, educators and service providers in the Northeast, Okanagan, and Lower Mainland regions.
o Awarding $50,000 in scholarships and bursaries to aboriginal students who are working toward BC Hydro careers.
o Focusing our efforts on building support with aboriginal people in areas where BC Hydro has a large operating footprint and where our infrastructure footprint is expected to grow. For example, we are collaborating on a five year work plan with the Okanagan Nation Alliance.
2015/16 Annual Service Plan Report 12

British Columbia Hydro and Power Authority
Performance Measure 9 - 121 Performance Measures
Actual
2012/13
Actual
2013/14
Actual
2014/15
Target 2015/16
Actual 2015/16
Target 2016/17
Target 2017/18
CSAT Index [Customer Satisfaction Index: % of customers satisfied or very satisfied]
86.0 85.0 86.0 85.0 87.0 85.0 85.0
Billing Accuracy [% of accurate bills] 98.5 99.1 99.5 99.0 99.5 N/A2 N/A2
First Call Resolution [% of customer calls resolved first time]
68.0 71.0 71.0 71.0 73.5 N/A2 N/A2
Progressive Aboriginal Relations Designation3 Gold Gold Gold Gold Gold Gold Gold
1 Performance Measure descriptions, rationale, data source information and benchmarking is available online at www.bchydro.com/performance. 2 This performance measure was removed from the 2016/17 – 2018/19 Service Plan; therefore, targets are not included 3 BC Hydro attained a gold-level designation from the Canadian Council for Aboriginal Business in 2015/16 which is valid for a three year period. In fiscal 2019, BC Hydro will apply for the next certification.
Goal 3: Mind Our Footprint Create a sustainable energy future in B.C. by carefully managing our impacts on the environment and fostering an energy conservation and efficiency culture.
Strategies In 2015/16, BC Hydro continued to: • Implement its conservation plan which is forecast to exceed the Clean Energy Act objective
to meet at least two-thirds of future demand growth through conservation by 2020. This includes energy management programs and conservation rate structures, supporting new energy efficiency codes and standards, and maintaining an energy conservation and efficiency culture.
• Meet the 93 per cent clean energy objective in the Clean Energy Act by building Site C, completing electricity purchase agreements for new wind, solar and run-of-river projects, and exploring the development of zero-emission capacity resources.
• Meet regulatory requirements related to greenhouse gas emissions reporting and verification for our electricity generation, transmission and distribution operations.
• Contribute to meeting the Province’s goal of achieving carbon neutrality in the public sector by purchasing offsets to reach net zero greenhouse gas emissions from our buildings, vehicles and paper use.
• Facilitate the electrification of transportation in B.C. through the establishment of a new electric vehicle office and customer service strategy; obtaining approval from the Commission for a new shore power rate for ocean vessels to access grid power while in port; and providing leadership support to Plug In BC, an initiative empowered to lay the groundwork for plug-in electric vehicles and related electric charging infrastructure in B.C.
• Manage the impact on the environment from BC Hydro’s new developments and retrofits of existing facilities by incorporating an “avoid, minimize and offset” approach to project design, planning and implementation.
2015/16 Annual Service Plan Report 13

British Columbia Hydro and Power Authority
• Implement environmental studies and projects related to water licence requirements under BC Hydro’s Water Use Plans, to confirm the suitability of operational controls and infrastructure at our facilities.
• Implement the polychlorinated biphenyl (PCB) electrical equipment phase-out strategy, and the long-term strategy for the handling, decontamination and disposal of PCB contaminated equipment and materials.
Performance Measures 13 - 161 Performance Measures
Actual
2012/13
Actual
2013/14
Actual
2014/15
Target 2015/16
Actual 2015/16
Target 2016/17
Target 2017/18
Demand Side Management (DSM) (GWh/year)2 4,460 4,776 4,334 5,000
5,091
N/A3
N/A3
Clean Energy (%)4 98.2 97.1 97.9 93.0 98.3 93.0 93.0 Electricity Production GHG Emissions (kilotonnes CO2e)5,6 631 730 667 1,100 6067 N/A8 N/A8
Carbon Neutral Program Emissions (kilotonnes CO2e)5,9 28.8 27.0 26.6 28.0 27.310 N/A8 N/A8 1 Performance Measure descriptions, rationale, data source information and benchmarking is available online at www.bchydro.com/performance. 2Target numbers are rounded values presented as cumulative run-rate savings since 2008 and include energy savings from energy conservation programs as well as from codes/standards and rate structures. The conservation program results were within one percent of Plan. This was due to efforts in codes & standards, commercial new construction, load displacement, transmission service rates and our Commercial Leaders in Energy Management program. 3 This performance measure was changed in the 2016/17 – 2018/19 Service Plan; therefore, the F2017 and F2018 targets are not applicable. The new Energy Conservation Portfolio performance measure will be New Incremental Energy Savings (GWh/yr). The targets for this new measure are 700 GWh/yr in F2017 and 700 GWh/yr in F2018. 4 The Clean Energy Target represents the minimum threshold generation target in accordance with the B.C. Government’s requirement that at least 93 per cent of electricity generation in the province be from clean or renewable resources. BC Hydro’s forecast is based on actual resource use and is consistent with previous years. This year’s actual was the highest BC Hydro has achieved in a decade. 5All actuals, forecast and targets for Electricity Production GHG Emissions and Carbon Neutral Program Emissions are presented on a calendar year basis, not fiscal year. For Electricity Production, this is to ensure consistency with GHG emissions reports filed under the Canadian Environmental Protection Act, 1999 and the B.C. Reporting Regulation. For Carbon Neutral this is to ensure consistency with the B.C. Carbon Neutral Government Regulation. 6 The Electricity Production GHG Emissions measure includes emissions from electricity generation, electricity purchased from B.C. Independent Power Producers (IPP), and fugitive SF6 releases. 7 Electricity Production GHG emissions were 606 kilotonnes CO2e, which is 45 percent below the plan of 1,110 kilotonnes CO2e. Emissions were lower than forecasted for the Island Generation IPP, Burrard Generating Station, and Fort Nelson Generating Station. Fugitive SF6 releases were also lower than forecasted. 8 This performance measure was removed from the 2016/17 – 2018/19 Service Plan; therefore, targets are not included. 9 The Carbon Neutral Program Emissions measures are based on emissions from BC Hydro’s vehicle fleet, buildings and paper use. 10 Carbon Neutral Program Emissions were 27.3 kilotonnes CO2e, which is a favorable result and three percent below the target of 28.0 kilotonnes CO2e. The Carbon Neutral Program Emissions were almost three percent higher in 2015 than in the previous calendar year. This is due to a seven percent increase in vehicle fleet fuel consumption that was partially mitigated by a reduction in building energy use and paper use.
Goal 4: Foster Economic Development Foster economic development opportunities across B.C. through our projects, practices and advancement of the energy efficiency and clean energy sectors. Strategies Many of BC Hydro’s operating, capital and procurement activities support provincial economic development and create local employment. Several are noted in Appendix C: Crown Corporations Mandate and Actions Summary. In addition, this past year:
• BC Hydro received Commission approval for a tariff that would allow indirect interconnection service for transmission voltage customers. This will facilitate economic
2015/16 Annual Service Plan Report 14

British Columbia Hydro and Power Authority
development by allowing customers to connect to BC Hydro through other customer-owned transmission infrastructure.
• BC Hydro’s conservation programs help create jobs by fostering B.C.’s energy efficiency industry made up of contractors, engineers and suppliers, while helping customers lower their energy bills and utilize new technologies, to improve the competitiveness of their businesses.
Goal 5: Maintain Competitive Rates Deliver value for British Columbia and maintain competitive rates by efficiently and responsibly managing our business. Strategies BC Hydro prudently manages its operating and capital expenditures to maintain competitive rates for our customers. For example, from fiscal 2012-2016, BC Hydro completed 563 capital projects managed by the Project Delivery group at a total cost of $6.49 billion and came in at 0.18 percent under budget overall. Additional accomplishments this past year include:
• Operational improvements including the introduction of a weather forecasting service to provide localized and detailed weather information to assist with pre-deployment of transmission and distribution crews and resources to deliver a faster and more efficient restoration of service to our customers during storms.
• A Distribution Work Scheduling tool to provide a single view of all provincial distribution-related work which has supported better and more efficient work scheduling.
• Implementation of supply chain strategies to deliver improved operational performance and efficiencies which have supported improvements to the supplier model for safety clothing resulting in a greater than 20 percent improvement in the total life cycle cost.
• New regional optimized contracts which are achieving higher than forecasted savings, as well as improved contractor safety and quality performance.
Performance Measures 17 - 201
Performance Measures
Actual
2012/13
Actual
2013/14
Actual
2014/15
Target 2015/16
Actual 2015/16
Target 2016/17
Target 2017/18
Competitive Rates2
1st quartile
1st quartile
1st quartile
1st quartile 1st quartile 1st
quartile 1st quartile
Net Income3 ($ million)
509 549 581 653 655 N/A4 N/A4
Operating Costs3,5 ($ million)
705 702 710 713 715 N/A4 N/A4
Project Budget to Actual Cost6 +0.83% on $3.29 billion
-4.75% on
$3.33 billion
-1.83% on
$3.94 billion
Within +5% to -5% of budget
excluding project reserve
amounts
-0.18% on $6.49 billion
Within +5% to -5% of budget
excluding project reserve
amounts
Within +5% to -5% of budget
excluding project reserve
amounts
2015/16 Annual Service Plan Report 15

British Columbia Hydro and Power Authority
1 Performance Measure definitions, rationales, data sources, and benchmarking information are available at www.bchydro.com/performance. 2 Based on the annual HydroQuebec Report on Electricity Rates in North America. 3 Performance within (+/-) 0.5 per cent is considered acceptable. 4 This performance measure was removed from the 2016/17 – 2018/19 Service Plan; however, the information is available in the Finance section of the Annual Service Plan Report. 5 Operating Costs are defined as personnel, materials and external services expenses included in income that are incurred in the day-to-day operation of BC Hydro’s electric utility, net of recoveries, capitalized costs and reclassification adjustments. 6 Project Budget to Actual Cost metric is new for 2015/16. The data includes Generation, Substation and Transmission Line projects managed by the Project Delivery groups in Generation, and Transmission and Distribution. Annually, BC Hydro reflects the past five years’ performance in delivering capital projects. This is a five year rolling data set of actual costs compared to original approved full scope implementation budgets not including project reserve amounts, for capital projects that were put into service during the period. Distribution projects (including Smart Metering and Infrastructure) and property projects (including the Nanaimo Office) that went into service in 2015/16 are included in the F2016 five year rolling average. Distribution and properties were not included in previous five year rolling averages.
Goal 6: Engage a Safe and Empowered Team Empower a team that is committed to safety, innovative and prepared for the future.
Strategies In 2015/16, BC Hydro implemented:
• Targeted campaigns to address workforce gaps which have provided a readily available talent pool for specialized and critical roles.
• A new workforce plan to ensure the appropriate labour mix with the skills required to safely design, operate and maintain our system while seeking opportunities to adjust our labour mix (new staff, specific skills, and, contracted or outsourced service providers) in areas where costs or business risks can be reduced.
Note: For information on how BC Hydro is working to ensure the safety of employees, contractors and the public see Goal 1.
Performance Measure 211 Performance Measures
Actual
2012/13
Actual
2013/14
Actual
2014/15
Target 2015/16
Actual 2015/16
Target 2016/17
Target 2017/18
Employee Engagement (%)2
78
Global Utility Index score
was 79
79
Global Utility Index score
was 79
82
Global Utility Index score
was 79
Meet or exceed Towers
Watson’s Global
Utilities Index
83
Global Utility Index
score was 81
N/A3
N/A3
1Performance Measure definitions, rationales, data sources, and benchmarking information are available at www.bchydro.com/performance. 2The target is for BC Hydro's favourable score to meet or exceed the industry benchmark. The benchmark is the Towers Watson Global Utilities Companies Norm, which is calculated annually. Performance and engagement results continue to trend upward and particularly reflect employee willingness to contribute their discretionary effort to achieving organizational priorities. 3This performance measure was removed from the 2016/17 – 2018/19 Service Plan; therefore, targets are not included.
2015/16 Annual Service Plan Report 16

British Columbia Hydro and Power Authority
FINANCIAL REPORT MANAGEMENT’S DISCUSSION AND ANALYSIS
This Management’s Discussion and Analysis (MD&A) reports on British Columbia Hydro and Power Authority’s (BC Hydro or the Company) consolidated results and financial position for the year ended March 31, 2016 (fiscal 2016) and should be read in conjunction with the Audited Consolidated Financial Statements and related notes of the Company for the years ended March 31, 2016 and 2015. The Company applies accounting standards as prescribed by the Province of British Columbia (the Province) which combines the accounting principles of International Financial Reporting Standards (IFRS) with regulatory accounting in accordance with Financial Accounting Standards Board Accounting Standards Codification 980, Regulated Operations (ASC 980) (collectively, the Prescribed Standards). All financial information is expressed in Canadian dollars unless otherwise specified. This report contains forward-looking statements, including statements regarding the business and anticipated financial performance of the Company. These statements are subject to a number of risks and uncertainties that may cause actual results to differ from those contemplated in the forward-looking statements. HIGHLIGHTS
• Net income for the year ended March 31, 2016 was $655 million, $74 million higher than the prior fiscal year net income of $581 million. The increase from the prior year was primarily due to higher domestic revenues mainly due to higher average customer rates reflecting a British Columbia Utilities Commission (BCUC) approved rate increase of 6 per cent for fiscal 2016. This was partially offset by higher finance charges primarily due to higher planned volume of long-term debt borrowings, higher planned lease charges related to electricity purchase agreements, and higher planned short-term interest rates, as well as higher amortization and depreciation expenses primarily due to an increase in assets in service.
• Inflows to the system during fiscal 2016 were 97 per cent of average, compared to 102 per cent
of average for the prior fiscal year. Actual inflows to Williston and Kinbasket reservoirs were 102 per cent and 110 per cent of average, respectively, compared to 93 per cent and 112 per cent respectively in the prior fiscal year. The lower inflows in fiscal 2016 were due to lower than average inflows in the Kootenay and Pend-d’Oreille basins and at most of BC Hydro’s smaller plants.
• Capital expenditures, before contributions in aid of construction, for the year ended March 31,
2016 were $2,306 million, a $137 million increase over the prior fiscal year. BC Hydro continues to invest significantly in capital projects to refurbish its ageing infrastructure and build new assets for future growth, including the Site C Clean Energy project, John Hart Generating Station Replacement project, Ruskin Dam Safety and Powerhouse Upgrade project, Interior to Lower Mainland Transmission project, Dawson Creek/Chetwynd Area Transmission project, and the Upper Columbia Capacity Additions at Mica – Units 5 & 6 project.
2015/16 Annual Service Plan Report 17

British Columbia Hydro and Power Authority
CONSOLIDATED RESULTS OF OPERATIONS
REVENUES Total revenues after regulatory account transfers for the year ended March 31, 2016 were $5,657 million, a decrease of $91 million or 2 per cent compared to the prior fiscal year. The decrease was primarily due to lower trade revenues mainly due to a decrease in the average natural gas price and decreases in volumes of physical gas and electricity sold, partially offset by higher domestic revenues primarily due to higher average customer rates and higher surplus energy sales.
for the years ended March 31 ($ in millions) 2016 2015 ChangeTotal Revenues 5,657$ 5,748$ (91)$ Net Income 655$ 581$ 74$ Capital Expenditures 2,306$ 2,169$ 137$ GWh Sold (Domestic) 57,300 51,213 6,087
as at March 31 ($ in millions) 2016 2015 ChangeTotal Assets 30,034$ 27,753$ 2,281$ Shareholder's Equity 4,500$ 4,170$ 330$ Accrued Payment to the Province 326$ 264$ 62$ Retained Earnings 4,397$ 4,068$ 329$ Debt to Equity 80 : 20 80 : 20 n/aNumber of Domestic Customer Accounts 1,960,555 1,935,068 25,487 Total Reservoir Storage (GWh) 16,518 19,565 (3,047)
for the years ended March 31 2016 2015 2016 2015 2016 2015Domestic
Residential 1,842$ 1,712$ 17,331 17,047 106.28$ 100.43$ Light industrial and commercial 1,685 1,597 18,421 18,564 91.47 86.03Large industrial 766 748 13,669 14,020 56.04 53.35Other energy sales 464 280 7,879 1,582 58.89 176.99
Total Domestic Revenue Before Regulatory Transfer 4,757 4,337 57,300 51,213 83.02 84.69 Rate smoothing and load variance regulatory transfer 299 492 - - - - Total Domestic 5,056$ 4,829$ 57,300 51,213 88.24$ 94.29$ Trade
Electricity - Gross 643$ 989$ 14,732 21,928 43.65$ 45.10$ Less: forward electricity purchases (183) (214) - - - - Electricity - Net 460 775 - - - - Gas - Gross 462 886 17,042 21,637 27.11 40.95Less: forward gas purchases (321) (742) - - - - Gas - Net 141 144 - - - -
Total Trade1 601$ 919$ 31,774 43,565 18.91$ 21.09$ Total 5,657$ 5,748$ 89,074 94,778 63.51$ 60.65$ 1 Trade revenue regulatory transfer is netted with the trade cost of energy transfer to reflect a trade margin transfer and this is reflected in the cost of energy table.2 The Trade $/MWh figures are based on total gross sales which includes physical and financial transactions whereas the volumes only include physical transactions.
(in millions) (gigawatt hours) ($ per MWh) 2
2015/16 Annual Service Plan Report 18

British Columbia Hydro and Power Authority
Domestic Revenues
Total domestic revenues after regulatory account transfers for the year ended March 31, 2016 were $5,056 million, an increase of $227 million or 5 per cent compared to the prior fiscal year. Domestic revenues before regulatory account transfers of $4,757 million were $420 million or 10 per cent higher than the prior fiscal year. The increase compared to the prior fiscal year was primarily due to higher average customer rates and higher other energy sales. Average customer rates were higher in fiscal 2016 compared to the prior fiscal year, reflecting an average rate increase as approved by the British Columbia Utilities Commission of 6 per cent effective April 1, 2015. Other energy sales were higher as a result of more surplus energy sold into the market as compared to the prior fiscal year (6,277 GWh for fiscal 2016 and 14 GWh for fiscal 2015). Surplus energy sales were required to reduce spill risk, as a result of higher reservoir levels at the start of the fiscal year resulting from increased storage through the fall and winter of the prior year due to low market prices. In addition, increased generation at Mica was required in the current year to maintain downstream Arrow reservoir levels and to meet Columbia River Treaty obligations which contributed to increased surplus energy sales. Surplus sales vary year to year based on level and timing of inflows, risk of spill, and market conditions. Variances between actual and planned load are deferred to the Non-Heritage Deferral Account (NHDA) and variances between actual and planned other energy sales are deferred to the Heritage Deferral Account (HDA) and NHDA. Trade Revenues Powerex, a wholly owned subsidiary of the Company, is an active participant in western energy markets, buying and selling wholesale power, natural gas, ancillary services, clean and renewable power, and environmental products. The Company’s electricity system is interconnected with systems in Alberta and the Western United States, facilitating sales and purchases of electricity outside of British Columbia. Powerex’s trade activities help the Company balance its system by being able to import energy to meet domestic demand when there is a supply shortage and exporting energy when there is a supply surplus. Exports are made only after ensuring domestic demand requirements can be met. Total trade revenues for the year ended March 31, 2016 were $601 million, a decrease of $318 million or 35 per cent compared to the prior fiscal year. The decrease in revenue was primarily due to a 34 per cent decrease in the average natural gas sales price and a 21 per cent decrease in the volume of physical gas sold, as well as a 33 per cent decrease in the volume of physical electricity sold. The decrease in the average natural gas sales price was reflective of an increase in production in the U.S. and mild temperatures in Eastern North America in the current year resulting in lower than normal demand. The decrease in the volume of physical gas sold was primarily due to lower gas trading opportunities following decreased demand as a result of warmer temperatures. The decrease in the volume of physical electricity sold for trade was primarily due to higher volumes of surplus energy sold for domestic purposes as well as an outage for a key third party transmission line to California.
2015/16 Annual Service Plan Report 19

British Columbia Hydro and Power Authority
Variances between actual and planned trade revenues are transferred to the Trade Income Deferral Account (TIDA). OPERATING EXPENSES For the year ended March 31, 2016, total operating expenses of $4,250 million were $285 million lower than the prior fiscal year. The decrease over the prior fiscal year was primarily due to lower expenditures for trade electricity and gas purchases. In addition, there were lower domestic energy costs, partially offset by higher amortization and depreciation expense.
Cost of Energy Energy costs are comprised of electricity and gas purchases for domestic and trade customers, water rentals and transmission and other charges. Energy costs are influenced primarily by the volume of energy consumed by customers, the mix of sources of supply and market prices of energy. The mix of sources of supply is influenced by variables such as the current and forecast market prices of energy, water inflows, reservoir levels, energy demand, and environmental and social impacts. Total energy costs after regulatory transfers for the year ended March 31, 2016 were $1,852 million, $351 million or 16 per cent lower than the prior fiscal year. The decrease over the prior fiscal year was primarily due to lower trade electricity and gas purchases.
for the years ended March 31 2016 2015 2016 2015 2016 2015Domestic
Water rental payments (hydro generation)1 327$ 334$ 48,376 41,318 6.62$ 8.11$ Purchases from Independent Power Producers 1,229 1,064 14,319 13,377 85.82 79.54Other electricity purchases - Domestic 3 6 122 207 22.66 28.76Gas for thermal generation 29 34 215 213 134.64 157.36Transmission charges and other expenses 24 2 111 115 - - Non-treaty storage / Libby Coordination Agreement (15) 14 - - - - Allocation from (to) trade energy - 16 (6) 512 24.79 33.51
Total Domestic Cost of Energy Before Regulatory Transfers 1,597 1,470 63,137 55,742 25.30 26.37Domestic cost of energy regulatory transfers (172) (12) - - - -
Total Domestic 1,425$ 1,458$ 63,137 55,742 22.57$ 26.15$ Trade
Electricity - Gross 362$ 617$ 14,602 22,397 24.79$ 27.55$ Less: forward electricity purchases (183) (214) - - - - Electricity - Net 179 403 - - - - Remarketed gas - Gross 401 842 17,296 21,812 23.18 38.60 Less: forward gas purchases (321) (742) - - - - Remarketed gas - Net 80 100 - - - - Transmission charges and other expenses 215 248 - - - - Allocation (to) from domestic energy - (16) 6 (512) 24.79 33.51
Total Trade Cost of Energy Before Regulatory Transfers 474 735 31,904 43,697 20.58 21.73Trade net margin regulatory transfer (47) 10 - - - -
Total Trade 427$ 745$ 31,904 43,697 19.10$ 21.96$ Total Energy Costs 1,852$ 2,203$ 95,041 99,439 21.41$ 24.31$
2 Total cost per MWh includes other electricity purchases at gross cost.
1 Total GWh is net of storage exchange.
($ per MWh) 2 (in millions) (gigawatt hours)
2015/16 Annual Service Plan Report 20

British Columbia Hydro and Power Authority
Domestic Energy Costs Total domestic energy costs after regulatory transfers for the year ended March 31, 2016 were $1,425 million, $33 million or 2 per cent lower than the prior fiscal year. Domestic energy costs before regulatory transfers of $1,597 million for the year ended March 31, 2016 were $127 million or 9 per cent higher than the prior fiscal year. The increase in costs, before regulatory transfers, was primarily due to higher Independent Power Producer costs as more Independent Power Producers were in operation during the current year. The increase was also due to higher domestic transmission costs, as a result of increased surplus sales in the current year. This was partially offset by lower energy costs from water transactions related to the Non-Treaty Storage Agreement and Libby Coordination Agreement and a lower allocation from trade energy. Variances between actual and planned domestic cost of energy are transferred to the HDA and NHDA. Trade Energy Costs Total trade energy costs after regulatory account transfers for the year ended March 31, 2016 were $427 million, a decrease of $318 million or 43 per cent compared with the prior fiscal year. Trade energy costs before regulatory account transfers for the year ended March 31, 2016 were $474 million, a decrease of $261 million or 36 per cent compared with the prior fiscal year. The decrease was primarily due to a 40 per cent decrease in the average gas purchase price and a 21 per cent decrease in the volume of physical gas purchased, as well as a 35 per cent decrease in the volume of physical electricity purchased. The decrease in the average gas purchase price was primarily reflective of an increase in production in the U.S. and mild temperatures in Eastern North America in the current year resulting in lower than normal demand. The decrease in volume of physical electricity and physical gas purchased was consistent with the decrease in physical electricity and physical gas sold, respectively. Variances between actual and planned trade cost of energy are transferred to the TIDA. Water Inflows Water inflows to the system during fiscal 2016 were 97 per cent of average, compared to 102 per cent of average for the prior fiscal year. Actual inflows to Williston and Kinbasket reservoirs were 102 per cent and 110 per cent of average, respectively, compared to 93 per cent and 112 per cent respectively in the prior fiscal year. The lower inflows in fiscal 2016 were due to lower than average inflows in the Kootenay and Pend-d’Oreille basins and at most of BC Hydro’s smaller plants. The Williston and Kinbasket reservoirs have been managed such that system energy storage on March 31, 2016 was 14,900 GWh, or 2,100 GWh above the 10 year historic average. This was 2,900 GWh lower than the system energy storage of 17,800 GWh recorded one year earlier. The Williston and Kinbasket reservoir energy contents were 11,200 GWh (1,800 GWh above the 10 year historic average) and 3,700 GWh (300 GWh above the 10 year historic average), respectively, with Williston the same as the prior fiscal year and Kinbasket 2,900 GWh lower than the prior fiscal year. The relative imbalance between the Williston and Kinbasket reservoir operations during this period was due to running Mica to support Arrow reservoir levels while meeting Arrow releases obligated under the Columbia River Treaty. The higher than average levels of Williston storage at the end of the fiscal year are a culmination of lower than forecast system loads and market prices,
2015/16 Annual Service Plan Report 21

British Columbia Hydro and Power Authority
unit outages at the Gordon M. Shrum generating station, and more restrictive than normal ice constraints. Personnel Expenses Personnel expenses include salaries and wages, benefits and post-employment benefits. Personnel expenses for the year ended March 31, 2016 were $527 million, comparable to personnel expenses of $534 million in the prior fiscal year. Materials and External Services Expenditures on materials and external services for the year ended March 31, 2016 were $605 million, $12 million higher than the prior fiscal year, primarily due to increased expenditures on electricity purchase agreements accounted for as finance leases and a recovery from a third party recognized in the prior year, lowering that year’s expenses. Amortization and Depreciation Amortization and depreciation expense includes the depreciation of property, plant and equipment (PP&E), amortization of intangible assets, and the amortization of certain regulatory assets and liabilities. For the year ended March 31, 2016, amortization and depreciation expense was $1,241 million, $36 million or 3 per cent higher than the prior fiscal year primarily due to an increase in depreciation of property, plant and equipment due to an increase in assets in service. Grants and Taxes As a Crown Corporation, the Company is exempt from paying federal and provincial income taxes, but pays local government taxes and grants in lieu to municipalities and regional districts, and school tax to the Province on certain assets. Total grants and taxes for the year ended March 31, 2016 were $220 million, comparable to total grants and taxes of $209 million in the prior fiscal year. Capitalized Costs Capitalized costs consist of overhead costs directly attributable to capital expenditures that are transferred from operating costs to PP&E. Certain overhead costs not eligible for capitalization under IFRS are transferred from operating costs to the IFRS PP&E regulatory account. These transfers are amortized over 40 years which approximates the composite average life of the PP&E. In addition, starting fiscal 2013, the ongoing impact of this change is being smoothed into rates over a 10-year period through transfers to the IFRS PP&E regulatory account as approved by the BCUC. As such, each year, 1/10th more of ineligible costs will be charged to operating costs such that by the end of year ten, all ineligible costs will be charged to operating costs. Capitalized costs for the year ended March 31, 2016 were $203 million, $21 million lower than capitalized costs of $224 million in the prior fiscal year. The reduction in capitalized costs was primarily due to the annual reduction of the transfer of operating costs to the IFRS PP&E account. FINANCE CHARGES Finance charges for the year ended March 31, 2016 were $752 million, $120 million or 19 per cent higher than the prior fiscal year. The increase was primarily due to higher planned volume of long-term debt borrowings, higher planned lease charges related to electricity purchase agreements, and higher planned short-term interest rates. 2015/16 Annual Service Plan Report 22

British Columbia Hydro and Power Authority
REGULATORY TRANSFERS The Company presents its results and financial position under the Prescribed Standards. Under the Prescribed Standards, the Company applies the principles of IFRS combined with ASC 980 to reflect the rate-regulated environment in which the Company operates. These Prescribed Standards allow for the deferral of costs and recoveries that under IFRS would otherwise be included in the determination of total comprehensive income in the year the amounts are incurred or would be reflected in rates. The deferred amounts are either recovered or refunded through future rate adjustments. The use of regulatory accounts is common amongst regulated utility industries throughout North America. BC Hydro uses various regulatory accounts, in compliance with BCUC orders, in order to better match costs and benefits for different generations of customers, smooth out the rate impact of large non-recurring costs, and defer to future periods differences between forecast and actual costs or revenues. Regulatory accounts allow the Company to defer certain types of revenue and cost variances through transfers to and from the accounts which are then included in customer rates in future periods, subject to approval by the BCUC and have the effect of adjusting net income. 2015/16 Annual Service Plan Report 23

British Columbia Hydro and Power Authority
Net regulatory account transfers are comprised of the following:
For the year ended March 31, 2016, net additions to the Company’s regulatory accounts after interest and amortization were $475 million compared to prior year net additions of $734 million. The net asset balance in the regulatory asset and liability accounts as at March 31, 2016 was an asset of $5,908 million compared to an asset of $5,433 million as at March 31, 2015. Net additions to the regulatory accounts during the year ended March 31, 2016 included:
• Increases of $382 million to the energy deferral accounts primarily due to lower domestic revenues, higher Independent Power Producer costs, and lower trade income, partially offset by higher surplus sales;
• Planned expenditures of $145 million on Demand-Side Management projects, which support energy conservation;
• Transfers of $142 million to the Non-Current Pension Cost regulatory account for variances that arise between forecast and actual non-current pension and other post-employment benefit costs, which would otherwise be included in operating expenses as well as other
for the years ended March 31 (in millions) 2016 2015Energy Deferral Accounts
Heritage Deferral Account (152)$ 82$ Non-Heritage Deferral Account 483 238Trade Income Deferral Account 51 (10)
382 310 Forecast Variance Accounts
Total Finance Charges (158) (120)Rate Smoothing Account 121 166 Non-Current Pension Cost 142 317 Other 18 25
123 388 Capital-Like Accounts
Demand-Side Management 145 125 Site C - 65 Smart Metering & Infrastructure 20 26 IFRS Property, Plant & Equipment 134 157
299 373 Non-Cash Accounts
Environmental Provisions & Costs 51 69 First Nations Provisions & Costs 14 12 Other 6 6
71 87 Amortization of regulatory accounts (472) (491) Interest on regulatory accounts 72 67 Net change in regulatory accounts 475$ 734$
2015/16 Annual Service Plan Report 24

British Columbia Hydro and Power Authority
comprehensive income. The increase was primarily due to a change in the mortality assumption incorporating future mortality improvement, and by a lower rate of return on plan assets, partially offset by an increase in the discount rate used to value defined benefit obligations;
• Transfers of $134 million to the IFRS PP&E regulatory account for smoothing the rate impact of overhead costs not eligible for capitalization under IFRS as they are not considered directly attributable to the construction of capital assets;
• Increases of $121 million to the Rate Smoothing regulatory account for smoothing the rate impacts of the rate increases in the 10 Year Rates Plan;
• Interest on regulatory accounts of $72 million; and
• Transfers of $51 million to the Environmental Provisions & Costs regulatory account reflecting increases required to asbestos and polychlorinated biphenyls (PCBs) contamination provisions.
These net additions were partially offset by:
• Net amortization of $472 million which is the regulatory mechanism to recover the regulatory account balances in rates; and
• Transfers of $158 million to the Total Finance Charges regulatory liability account due to
lower interest rates, lower volume of borrowings, and higher capitalization of interest during construction.
2015/16 Annual Service Plan Report 25

British Columbia Hydro and Power Authority
Net regulatory account balances are as follows:
BC Hydro has regulatory mechanisms in place to collect 24 of 26 regulatory accounts in use or with balances at March 31, 2016, which represent approximately 88 per cent of the total net regulatory account balance, in rates over various periods. COMPARISON WITH SERVICE PLAN The Budget Transparency and Accountability Act requires that BC Hydro file a Service Plan each year. BC Hydro’s Service Plan for fiscal 2015/16-2017/18 was filed in February 2015 and forecast net income for fiscal 2016 at $653 million. The table below provides an overview of BC Hydro’s fiscal 2016 financial performance results, relative to its February 2015 Service Plan forecast.
as at March 31 (in millions) 2016 2015Energy Deferral Accounts
Heritage Deferral Account (24)$ 165$ Non-Heritage Deferral Account 917 524 Trade Income Deferral Account 249 244
1,142 933 Capital-Like Accounts
Demand-Side Management 908 842 Site C 436 419 Capital Project Investigation Costs 25 30 Smart Metering & Infrastructure 283 283 IFRS Property, Plant & Equipment 872 758
2,524 2,332 Forecast Variance Accounts
Rate Smoothing Account 287 166 Non-Current Pension Cost 691 564 Foreign Exchange Gains and Losses (69) (71) CIA Amortization 92 87 Total Finance Charges (305) (173) Other Forecast Variance Accounts 44 32
740 605 Non-Cash Accounts
First Nations Provisions & Costs 541 564 Environmental Provisions & Costs 358 382 Future Removal & Site Restoration Costs (9) (33) IFRS Pension 612 650
1,502 1,563 Total Regulatory Account Balance 5,908$ 5,433$
2015/16 Annual Service Plan Report 26

British Columbia Hydro and Power Authority
Trade revenue and trade cost of energy amounts were both lower than the forecast by $428 million; however, the trade gross margin was on Plan. Variances to the February 2015 Service Plan for trade revenue and trade cost of energy are both deferred through the TIDA. Overall, domestic revenues and expenses and net income were comparable to the Service Plan forecast. PAYMENT TO THE PROVINCE Under a Special Directive from the Province, the Company is required to make an annual payment to the Province (the Payment) on or before June 30 of each year. The Payment is equal to 85 per cent of the Company’s net income for the most recently completed fiscal year unless the debt to equity ratio, as defined by the Special Directive, after deducting the Payment, is greater than 80:20. If the Payment would result in a debt to equity ratio exceeding 80:20, then the Payment is the greatest amount that can be paid without causing the debt to equity ratio to exceed 80:20. The Payment accrued for the year ended March 31, 2016 was $326 million which was below 85 per cent of the Company’s net income due to the 80:20 cap. LIQUIDITY AND CAPITAL RESOURCES Cash flow provided by operating activities for the year ended March 31, 2016 was $1,060 million, which is comparable to cash flow provided by operating activities of $1,018 million in the prior fiscal year.
Consolidated Statement of Operations
(in millions)
Variance to 2016
Service Plan2015 2016 2016
RevenuesDomestic 4,829$ 5,056$ 5,057 (1)$ Trade 919 601 1,029 (428)
5,748 5,657 6,086 (429)ExpensesOperating Costs
Cost of energy 2,203 1,852 2,280 428Other operating expenses Personnel expenses, materials and external services 1 868 905 900 (5) Amortization 1,205 1,241 1,254 13 Finance charges 632 752 751 (1) Grants and taxes 209 220 218 (2) Other 50 32 30 (2)
5,167 5,002 5,433 431Net Income 581$ 655$ 653$ 2$
1 These amounts are net of capitalized overhead and recoveries.
2016 Service
PlanActual
2015/16 Annual Service Plan Report 27

British Columbia Hydro and Power Authority
The long-term debt balance net of sinking funds at March 31, 2016 was $18,046 million, compared with $16,721 million at March 31, 2015. The increase was mainly as a result of an increase in long-term bond issues totaling $2,641 million ($2,691 million par value) and net foreign exchange losses of $24 million. These increases were partially offset by a decrease in revolving borrowings of $1,171 million and long-term bond redemptions totaling $150 million par value. Long-term debt increased primarily to fund capital expenditures. CAPITAL EXPENDITURES Capital expenditures include property, plant and equipment and intangible assets. The capital expenditures, before contributions in aid of construction, were as follows:
Transmission lines and substation capital expenditures includes expenditures on the Interior to Lower Mainland Transmission Line project, Dawson Creek/Chetwynd Area Transmission project, Surrey Area Substation project, Big Bend Substation project, the Transmission Wood Structure Replacement program, Arnott Capacity Upgrade project, Horsey to George Tripp Substation 230kV Cable project, Meikle Wind Energy interconnection project, and Merritt Area Transmission project. Generation capital expenditures include expenditures for John Hart Generating Station Replacement project, Ruskin Dam Safety and Powerhouse Upgrade project, Upper Columbia Capacity Additions at Mica – Units 5 & 6 project, Hugh Keenleyside Spillway Gate Reliability project and G.M. Shrum Units 1-5 Turbine Rehabilitation project. Distribution capital expenditures include expenditures on customer driven work, end of life asset replacements, system expansion and improvements, and the Smart Metering & Infrastructure program. General capital expenditures include expenditures on various technology projects, building development programs, and vehicles. Site C Clean Energy project expenditures incurred after the provincial government’s positive investment decision in December 2014 are recorded as capital and include expenditures in support of construction which started in July 2015.
for the years ended March 31 (in millions) 2016 2015Transmission lines and substations replacements & expansion 612$ 1,003$ Generation replacements and expansion 498 526 Distribution system improvements and expansion 464 399 General, including technology, vehicles and buildings 243 216 Site C Clean Energy project 489 25 Total Capital Expenditures 2,306$ 2,169$ Total capital expenditures presented in this table are different from the amount of property, plant and equipment and intangible asset expenditures in the Consolidated Statement of Cash Flows due to the effect of accruals related to these expenditures.
2015/16 Annual Service Plan Report 28

British Columbia Hydro and Power Authority
RATE REGULATION In the process of regulating and setting rates for BC Hydro, the BCUC must ensure that the rates are sufficient to allow BC Hydro to provide reliable electricity service, meet its financial obligations, comply with government policy and achieve an annual rate of return on deemed equity (ROE). BC Hydro 10 Year Rates Plan
In November 2013, the Government announced a 10 Year Rates Plan for BC Hydro. On March 6, 2014, the Government issued Directions No. 6 and 7 to the BCUC to implement the 10 Year Rates Plan. Direction No. 6 set BC Hydro’s rate increase at 9 per cent for fiscal 2015 and 6 per cent for fiscal 2016 and also specifies the amounts to be amortized from BC Hydro’s regulatory accounts in those years. BC Hydro rate increases for fiscal 2017, fiscal 2018, and fiscal 2019 are subject to BCUC review but are capped at 4.0 per cent, 3.5 per cent, and 3.0 per cent pursuant to Direction No. 7. The BCUC will also set the rates for the final five years of the plan. In addition, Direction No. 7 sets the return on equity at 11.84 per cent for fiscal 2015, fiscal 2016 and fiscal 2017. Furthermore, the Deferral Account Rate Rider will remain at 5 per cent for fiscal 2016 and future years. Commencing in fiscal 2018, the dividend will be reduced by $100 million per year until it reaches zero and will thereafter remain at zero until BC Hydro achieves a 60:40 debt to equity ratio. Allowed net income for fiscal 2018 and future years will increase by the forecast growth in the B.C. consumer price index. BC Hydro Request for Fiscal 2017 Interim Rates
In February 2016, BC Hydro filed a rate application with the BCUC requesting an interim general rate increase of 4.0 per cent effective April 1, 2016 (fiscal 2017). In March 2016, the BCUC issued Order No. G-40-16, approving the interim rate increase. BC Hydro Fiscal 2017-2019 Revenue Requirements Application
BC Hydro plans to file a three-year Revenue Requirements Application with the BCUC in July 2016 for the test period covering fiscal 2017-2019. This application will seek to finalize the interim rate increase of 4.0 per cent approved for fiscal 2017 by BCUC Order No. G-40-16, and request approval of further rate increases of 3.5 per cent in fiscal 2018, and 3.0 per cent in fiscal 2019, consistent with the 10 Year Rates Plan. The BCUC will likely issue its decision on the Application in calendar 2017. BC Hydro 2015 Rate Design Application
In September 2015, BC Hydro filed Module 1 of its 2015 Rate Design Application with the BCUC. Among the various approvals sought in Module 1 of the 2015 Rate Design Application, BC Hydro is seeking approval to simplify its commercial rates, retain the inclining block structure for residential customers and introduce a new rate for transmission service customers that would provide market pricing during the freshet period (May to July) for incremental consumption. A final decision by the BCUC on the Rate Design Application is expected late in calendar 2016. Changes in rate design are designed to be revenue neutral to BC Hydro. Debt Management Regulatory Account Application
In December 2015, BC Hydro filed an Application with the BCUC seeking approval to establish a new regulatory account to capture mark-to-market gains and losses of financial contracts that hedge long-term future debt. This new account will assist BC Hydro in mitigating risks of increasing 2015/16 Annual Service Plan Report 29

British Columbia Hydro and Power Authority
interest rates while borrowing to support its capital plan. The Commission approved BC Hydro’s Application on March 30, 2016 (Order No. G-42-16). RISK MANAGEMENT BC Hydro is exposed to numerous risks, which can result in safety, environmental, financial, reliability and reputational impacts. This section of the MD&A discusses risks that impacted financial performance in the year.
The impact of many financial risks associated with uncontrollable external influences on BC Hydro’s net income is mitigated through the use of regulatory accounts. Regulatory accounts assist in matching costs and benefits for different generations of customers, to smooth the impact of large, non-recurring costs and to defer for future recovery in rates the differences between planned and actual costs or revenues that arise due to uncontrollable events. BC Hydro has a documented plan for the recovery of its regulatory accounts which it filed with the F15-F16 RRRA.
In addition, information on risks and opportunities that could significantly impact BC Hydro meeting its objectives are outlined at www.bchydro.com/serviceplan. Significant Financial Risks The largest sources of variability in BC Hydro’s financial performance are typically domestic and trade revenue and cost of energy. Both revenues and cost of energy are influenced by several elements, which generally fall into the following four categories:
• Generation available from BC Hydro-dispatched hydro plants;
• Domestic demand for energy;
• Energy market prices; and,
• Deliveries from electricity purchase agreement contracts.
Neither a high nor a low value of any of these individual drivers is intrinsically positive or negative for BC Hydro’s financial results. It is the specific combination of these drivers in any given year which has an impact.
While meeting domestic demand, environmental regulations and treaty obligations, BC Hydro attempts to operate the system to take maximum advantage of market energy prices – buying from the markets when prices are low and selling when prices are high. In doing so, BC Hydro attempts to optimize the combined effects of these elements and reduce the net cost of energy for our customers.
Energy Availability
The amount of generation available influences BC Hydro’s financial results through both changing the amount of energy we have available to export (or need to import to meet domestic load) and through changing our ability to take advantage of short-term market price variations. The amount of available generation is driven primarily by hydrology - the amount and timing of inflows into BC Hydro-dispatched plants. The range of historic inflows is significant, with over 15,000 GWh (or approximately 25 per cent of current domestic demand) separating the wettest years from the driest in the most recent 43 years of data in BC Hydro’s records. To a less significant extent, the amount
2015/16 Annual Service Plan Report 30

British Columbia Hydro and Power Authority
of available generation is also impacted by the availability of both BC Hydro and Independent Power Producer generating assets and by BC Hydro’s operation of the system. The financial forecast in the Service Plan assumes that inflows into BC Hydro-dispatched plants will be the average of the most recent 43 years of data in BC Hydro’s records. The system inflow energy for fiscal 2016 was 97 per cent of average, compared to the system inflow energy for fiscal 2015 at 102 per cent of average. Due to a number of contributing factors, energy in storage at the beginning of fiscal 2016 was 5,000 GWh above the 10 year average, reducing the flexibility of the system to absorb above average inflows. Above average system inflows were not observed, so over the course of fiscal 2016 storage was drawn down, although still 2,100 GWh above the 10 year average on March 31, 2016. This net drawdown was a result of a very dry summer (Q2 fiscal 2016 inflows were 79 per cent of average), but somewhat offset by higher fall and early winter inflows (Q3 fiscal 2016 at 111 per cent of average). Domestic Demand for Energy
Electricity demand is generally increasing as B.C.’s population and gross domestic product increases; however, short-term fluctuations in electricity demand can be experienced due to large industrial loads and weather impacts. Large industrial customers can have significant variability in load as a result of changing supply and demand balances in world commodity markets and related commodity prices. Weather can have a significant impact on particularly residential load with colder years resulting in higher demand for electrical heating than in average or warm years. The amount of electricity demand from BC Hydro’s customers combined with the variable inflow of water into BC Hydro’s large hydro reservoirs determines the volume of BC Hydro’s market energy purchases and sales. To the extent there is a mismatch between the amount of available generation and domestic demand, BC Hydro will be either a net importer or net exporter of energy in a given year. However, even in high inflow years, BC Hydro may need to make some purchases during periods of the year when generation availability is low because of either water management requirements or maintenance outages (generally late fall, winter, and early spring). Similarly, even in low water years, electricity sales may be advantageous during certain periods either to minimize spill from large reservoirs or to take advantage of market price fluctuations. The value of all of these transactions is subject to market price risk. In fiscal 2016, domestic revenues before regulatory transfers were lower than planned due to lower domestic loads resulting from the loss of large industrial load related to declining market conditions including low commodity prices, and a warmer than normal winter. This resulted in annual load being 3,351 GWh below plan (excluding surplus sales). The energy that would have gone to serving load will be sold to the market, at prices that are between 10 and 50 per cent of what would have been received had it been sold to domestic customers. More information can be found in the discussion on Domestic Revenues. Energy Market Prices
The cost of energy, the revenue from trade market activity, and the market opportunities available to Powerex all depend on a combination of system surplus or deficit energy, system flexibility and gas and electricity market fundamentals. Both domestic loads and market prices in fiscal 2016 were materially lower than forecast in the Service Plan. Nonetheless, significantly greater than forecast net market electricity sales were made in fiscal 2016 to manage the generation within the province that is surplus to load and the above average system storage energy content. 2015/16 Annual Service Plan Report 31

British Columbia Hydro and Power Authority
Deliveries from Electricity Purchase Agreement Contracts
Energy delivered under electricity purchase agreement contracts has a different cost than both energy generated by BC Hydro and energy purchased or sold in energy markets. Therefore, as the proportion of electricity purchase agreement contract energy changes BC Hydro’s average cost of energy changes. BC Hydro’s portfolio of electricity purchase agreement contracts includes a significant portion of hydro resources and the amount of generation under these contracts is driven by hydrology and other operational factors that impact deliveries, which may vary significantly from year to year. In fiscal 2016, there was greater than forecast energy delivered from hydro Independent Power Producers, primarily due to changes in operations at a large Independent Power Producer. However, this was partially offset by lower than forecast deliveries for several Independent Power Producers due to delays in achieving their commercial operations date and lower than planned thermal generation.
Finance Charges
Interest expense on borrowings is a significant component of Finance Charges. Variability in interest expense on borrowings is influenced by both the volume of debt BC Hydro requires and the interest rate paid on that debt. A portion of BC Hydro’s existing debt is subject to changes to interest rates (variable rate debt) which results in variability in interest expense. BC Hydro accepts this variability in return for the savings obtained from normally lower short-term rates. As of March 31, 2016, approximately 13 per cent of existing debt had a maturity of one year or less and is recognized as variable rate debt. BC Hydro has steadily reduced its allocation of variable rate debt over the last few years in response to historically low long-term interest rates and rising debt levels. The majority of BC Hydro’s foreign denominated debt is hedged with long-term foreign exchange derivative contracts and as a result is not a significant risk variable. In an effort to further reduce variability in interest expense, BC Hydro intends to hedge a portion of long-term future debt issuances. The actual fiscal 2016 financial results compared to the Service Plan can be found in the previous Comparison with Service Plan discussion. FUTURE OUTLOOK The Budget Transparency and Accountability Act requires that BC Hydro file a Service Plan each year. BC Hydro’s Service Plan filed in February 2016 forecasted net income for fiscal 2017 at $692 million. The Company’s earnings can fluctuate significantly due to various non-controllable factors such as the level of water inflows, domestic sales load, market prices for electricity and natural gas, weather, temperatures, interest rates and foreign exchange rates. The impact to net income of these non-controllable factors is largely mitigated through the use of regulatory accounts. The forecast for fiscal 2017 assumes average water inflows (100 per cent of average), domestic sales of 56,692 GWh, average market energy prices of US $24.15/MWh, short-term interest rates of 0.68 per cent and a US dollar exchange rate of US $0.7646. 2015/16 Annual Service Plan Report 32

British Columbia Hydro and Power Authority
EARNINGS SENSITIVITY The following table shows the estimated effect on earnings of changes in some key variables, before regulatory account transfers. The analysis is based on business conditions and production volumes forecast for fiscal 2017. Each separate item in the sensitivity analysis assumes the others are held constant. While these sensitivities are applicable to the period and magnitude of changes on which they are based, they may not be applicable in other periods, under other economic circumstances or greater magnitude of changes.
The volatility between BC Hydro’s plan and actual results are mostly mitigated through the use of BCUC-approved regulatory accounts.
Factor Change
Approximate change in earnings before regulatory account
transfers (in $ millions) 5 year high 5 year low
Fiscal 2016
Hydro generation 1 +/-1% 10 52,114 GWh 41,226 GWh 49,262 GWh Electricity trade margins5
+/-10% 20 $206 $174 $174
Interest rates +/- 100 basis
points 40 1.30% 2 0.87% 2 0.87% 2
Exchange rates (US/ CDN)
+/- $0.01 5 $1.01 3 $0.76 3 $0.76 3
Weather 10% change
in normal degree days
35 2,261 degree
days 4 1,944 degree
days 4
2,008 degree
days 4
1 Assumes change in hydro generation is offset by corresponding change in energy imports (i.e. increase in hydro generation is offset by decrease in energy imports). 2 Interest rates are the annual daily average Canadian short-term interest rates (3-month Canadian Dollar Offered Rate). 3 Exchange rates are the annual daily average US Dollar noon rates. 4 The high and low degree days represent the highest degree days in the past five years and the lowest degree days in the past five years for the five winter months (November to March) on sales weighted basis for the BC Hydro Domestic System. A degree day is calculated by the difference between the daily average temperature for the day and 18 Degrees Celsius. As such, if the daily average temperature is below 18 Degree Celsius, by one degree, then there is one degree day for that day. For fiscal 2016, the actual degree days on sales weighted basis is reported as a total for the five winter months. 5 Trade revenues less trade cost of energy (in millions).
2015/16 Annual Service Plan Report 33

British Columbia Hydro and Power Authority MANAGEMENT REPORT
The consolidated financial statements of British Columbia Hydro and Power Authority (BC Hydro) are the responsibility of management and have been prepared in accordance with the financial reporting provisions prescribed by the Province of British Columbia pursuant to Section 23.1 of the Budget Transparency and Accountability Act and Section 9.1 of the Financial Administration Act (see Note 2(a)). The preparation of financial statements necessarily involves the use of estimates which have been made using careful judgment. In management’s opinion, the consolidated financial statements have been properly prepared within the framework of the accounting policies summarized in the consolidated financial statements and incorporate, within reasonable limits of materiality, all information available at June 1, 2016. The consolidated financial statements have also been reviewed by the Audit & Finance Committee and approved by the Board of Directors. Financial information presented elsewhere in this Annual Service Plan Report is consistent with that in the consolidated financial statements. Management maintains systems of internal controls designed to provide reasonable assurance that assets are safeguarded and that reliable financial information is available on a timely basis. These systems include formal written policies and procedures, careful selection and training of qualified personnel and appropriate delegation of authority and segregation of responsibilities within the organization. An internal audit function independently evaluates the effectiveness of these internal controls on an ongoing basis and reports its findings to management and the Audit & Finance Committee.
The consolidated financial statements have been examined by independent external auditors. The external auditors’ responsibility is to express their opinion on whether the consolidated financial statements, in all material respects, fairly present BC Hydro’s financial position, comprehensive income and cash flows in accordance with financial reporting provisions prescribed by the Province of British Columbia pursuant to Section 23.1 of the Budget Transparency and Accountability Act and Section 9.1 of the Financial Administration Act (see Note 2(a)). The Auditors’ Report, which follows, outlines the scope of their examination and their opinion.
The Board of Directors, through the Audit & Finance Committee, is responsible for ensuring that management fulfills its responsibility for financial reporting and internal controls. The Audit & Finance Committee, comprised of directors who are not employees, meets regularly with the external auditors, the internal auditors and management to satisfy itself that each group has properly discharged its responsibility to review the financial statements before recommending approval by the Board of Directors. The Audit & Finance Committee also recommends the appointment of external auditors to the Board of Directors. The internal and external auditors have full and open access to the Audit & Finance Committee, with and without the presence of management.
Jessica McDonald Cheryl Yaremko President and Chief Executive Officer Executive Vice-President, Finance & Supply Chain and Chief Financial Officer Vancouver, Canada June 1, 2016
2015/16 Annual Service Plan Report 34

British Columbia Hydro and Power Authority INDEPENDENT AUDITORS’ REPORT The Minister of Energy and Mines and Minister Responsible For Core Review, Province of British Columbia and the Board of Directors of British Columbia Hydro and Power Authority:
We have audited the accompanying consolidated financial statements of British Columbia Hydro and Power Authority, which comprise the consolidated statement of financial position as at March 31, 2016, the consolidated statements of comprehensive income, changes in equity and cash flows for the year then ended, and notes, comprising a summary of significant accounting policies and other explanatory information.
Management’s Responsibility for the Consolidated Financial Statements Management is responsible for the preparation and fair presentation of these consolidated financial statements in accordance with the financial reporting provisions prescribed by the Province of British Columbia pursuant to Section 23.1 of the Budget Transparency and Accountability Act and Section 9.1 of the Financial Administration Act (see Note 2(a)), and for such internal control as management determines is necessary to enable the preparation of consolidated financial statements that are free from material misstatement, whether due to fraud or error.
Auditors’ Responsibility Our responsibility is to express an opinion on these consolidated financial statements based on our audit. We conducted our audit in accordance with Canadian generally accepted auditing standards. Those standards require that we comply with ethical requirements and plan and perform the audit to obtain reasonable assurance about whether the consolidated financial statements are free from material misstatement.
An audit involves performing procedures to obtain audit evidence about the amounts and disclosures in the consolidated financial statements. The procedures selected depend on our judgment, including the assessment of the risks of material misstatement of the consolidated financial statements, whether due to fraud or error. In making those risk assessments, we consider internal control relevant to the entity’s preparation and fair presentation of the consolidated financial statements in order to design audit procedures that are appropriate in the circumstances, but not for the purpose of expressing an opinion on the effectiveness of the entity’s internal control. An audit also includes evaluating the appropriateness of accounting policies used and the reasonableness of accounting estimates made by management, as well as evaluating the overall presentation of the consolidated financial statements.
We believe that the audit evidence we have obtained is sufficient and appropriate to provide a basis for our audit opinion. Opinion In our opinion, the consolidated financial statements present fairly, in all material respects, the consolidated financial position of British Columbia Hydro and Power Authority as at March 31, 2016 and its consolidated financial performance and its consolidated cash flows for the year then ended in accordance with the financial reporting provisions prescribed by the Province of British Columbia pursuant to Section 23.1 of the Budget Transparency and Accountability Act and Section 9.1 of the Financial Administration Act (see Note 2(a)).
Chartered Professional Accountants Vancouver, Canada June 1, 2016 2015/16 Annual Service Plan Report 35

British Columbia Hydro and Power Authority AUDITED FINANCIAL STATEMENTS CONSOLIDATED STATEMENTS OF COMPREHENSIVE INCOME
See accompanying Notes to the Consolidated Financial Statements.
for the years ended March 31 (in millions) 2016 2015RevenuesDomestic 5,056$ 4,829$ Trade 601 919
5,657 5,748 ExpensesOperating expenses (Note 5) 4,250 4,535 Finance charges (Note 6) 752 632 Net Income 655 581
OTHER COMPREHENSIVE INCOME (LOSS)
Items Reclassified Subsequently to Net IncomeEffective portion of changes in fair value of derivatives designated as cash flow hedges (Note 19) 12 81 Reclassification to income of derivatives designated as cash flow hedges (Note 19) (21) (127) Foreign currency translation gains 10 34 Other Comprehensive Income (Loss) 1 (12) Total Comprehensive Income 656$ 569$
2015/16 Annual Service Plan Report 36

British Columbia Hydro and Power Authority CONSOLIDATED STATEMENTS OF FINANCIAL POSITION
Commitments and Contingencies (Notes 11 and 21)
See accompanying Notes to the Consolidated Financial Statements.
as at March 31 (in millions) 2016 2015ASSETSCurrent AssetsCash and cash equivalents (Note 8) 44$ 39$ Accounts receivable and accrued revenue (Note 9) 669 627 Inventories (Note 10) 155 122 Prepaid expenses 202 211 Current portion of derivative financial instrument assets (Note 19) 137 152
1,207 1,151 Non-Current Assets Property, plant and equipment (Note 11) 21,385 19,933 Intangible assets (Note 12) 609 547 Regulatory assets (Note 13) 6,324 5,714 Derivative financial instrument assets (Note 19) 92 97 Other non-current assets (Note 14) 417 311
28,827 26,602 30,034$ 27,753$
LIABILITIES AND EQUITYCurrent LiabilitiesAccounts payable and accrued liabilities (Note 15) 1,816$ 1,708$ Current portion of long-term debt (Note 16) 2,376 3,698 Current portion of derivative financial instrument liabilities (Note 19) 143 85
4,335 5,491 Non-Current LiabilitiesLong-term debt (Note 16) 15,837 13,178 Regulatory liabilities (Note 13) 416 281 Derivative financial instrument liabilities (Note 19) 27 38 Contributions in aid of construction 1,669 1,583 Post-employment benefits (Note 18) 1,657 1,498 Other non-current liabilities (Note 20) 1,593 1,514
21,199 18,092 Shareholder's EquityContributed surplus 60 60 Retained earnings 4,397 4,068 Accumulated other comprehensive income 43 42
4,500 4,170 30,034$ 27,753$
2015/16 Annual Service Plan Report 37

British Columbia Hydro and Power Authority CONSOLIDATED STATEMENTS OF CHANGES IN EQUITY
See accompanying Notes to the Consolidated Financial Statements.
(in millions)Balance, April 1, 2014 33$ 21$ 54$ 60$ 3,751$ 3,865$ Payment to the Province (Note 17) - - - - (264) (264) Comprehensive Income (Loss) 34 (46) (12) - 581 569 Balance, March 31, 2015 67 (25) 42 60 4,068 4,170 Payment to the Province (Note 17) - - - - (326) (326) Comprehensive Income (Loss) 10 (9) 1 - 655 656 Balance, March 31, 2016 77$ (34)$ 43$ 60$ 4,397$ 4,500$
Contributed Surplus
Retained Earnings Total
CumulativeTranslation
Reserve
Unrealized Gains/(Losses) on Cash Flow
Hedges
Total Accumulated
Other Comprehensive
Income
2015/16 Annual Service Plan Report 38

British Columbia Hydro and Power Authority CONSOLIDATED STATEMENTS OF CASH FLOWS
See accompanying Notes to the Consolidated Financial Statements.
for the years ended March 31 (in millions) 2016 2015Operating ActivitiesNet income 655$ 581$ Regulatory account transfers (Note 13) (947) (1,225) Adjustments for non-cash items:
Amortization of regulatory accounts (Note 13) 472 491 Amortization and depreciation expense (Note 7) 745 691 Unrealized losses (gains) on mark-to-market 75 (53) Employee benefit plan expenses 110 84 Interest accrual 717 670
Other items 69 96 1,896 1,335
Changes in: Accounts receivable and accrued revenue (47) 465 Prepaid expenses 9 - Inventories (33) 1 Accounts payable, accrued liabilities and other non-current liabilities (73) (202) Contributions in aid of construction 98 89 Other non-current assets (79) -
(125) 353 Interest paid (711) (670) Cash provided by operating activities 1,060 1,018
Investing ActivitiesProperty, plant and equipment and intangible asset expenditures (2,102) (1,928) Cash used in investing activities (2,102) (1,928)
Financing ActivitiesLong-term debt:
Issued 2,641 1,565 Retired (150) (325)
Receipt of revolving borrowings 7,761 8,112 Repayment of revolving borrowings (8,927) (8,326) Payment to the Province (Note 17) (264) (167) Other items (14) (17) Cash provided by financing activities 1,047 842 Increase (decrease) in cash and cash equivalents 5 (68) Cash and cash equivalents, beginning of year 39 107 Cash and cash equivalents, end of year 44$ 39$
2015/16 Annual Service Plan Report 39

British Columbia Hydro and Power Authority NOTES TO THE CONSOLIDATED FINANCIAL STATEMENTS FOR THE YEARS ENDED MARCH 31, 2016 AND 2015 NOTE 1: REPORTING ENTITY British Columbia Hydro and Power Authority (BC Hydro) was established in 1962 as a Crown corporation of the Province of British Columbia (the Province) by enactment of the Hydro and Power Authority Act. As directed by the Hydro and Power Authority Act, BC Hydro’s mandate is to generate, manufacture, conserve and supply power. BC Hydro owns and operates electric generation, transmission and distribution facilities in the province of British Columbia. The consolidated financial statements of BC Hydro include the accounts of BC Hydro and its principal wholly-owned operating subsidiaries Powerex Corp. (Powerex), Powertech Labs Inc. (Powertech), and Columbia Hydro Constructors Ltd. (Columbia), (collectively with BC Hydro, the Company) including BC Hydro’s one third interest in the Waneta Dam and Generating Facility (Waneta). All intercompany transactions and balances are eliminated on consolidation. The Company accounts for its one third interest in Waneta as a joint operation. BC Hydro has classified Waneta as a joint operation on the basis that fundamental operating and investing decisions relating to Waneta require unanimous approval by each co-owner. The consolidated financial statements include the Company’s proportionate share in Waneta, including its share of any liabilities and expenses incurred jointly with Teck Metals Ltd. and its revenue from the sale of the output in relation to Waneta. NOTE 2: BASIS OF PRESENTATION (a) Basis of Accounting
These consolidated financial statements have been prepared in accordance with the significant accounting policies as set out in Note 4. These policies have been established based on the financial reporting provisions prescribed by the Province pursuant to Section 23.1 of the Budget Transparency and Accountability Act (BTAA) and Section 9.1 of the Financial Administration Act (FAA). In accordance with the directive issued by the Province’s Treasury Board, BC Hydro is to prepare these consolidated financial statements in accordance with the accounting principles of International Financial Reporting Standards (IFRS), combined with regulatory accounting in accordance with Financial Accounting Standards Board Accounting Standards Codification 980 (ASC 980), Regulated Operations (collectively, the Prescribed Standards). The application of ASC 980 results in BC Hydro recognizing in the statement of financial position the deferral and amortization of certain costs and recoveries that have been approved by the British Columbia Utilities Commission (BCUC) for inclusion in future customer rates. Such regulatory costs and recoveries would be included in the determination of comprehensive income unless recovered in rates in the year the amounts are incurred. BC Hydro’s accounting policies with respect to its regulatory accounts are disclosed in Note 4(a) and the impact of the application of ASC 980 on these consolidated financial statements is described in Note 13. Certain amounts in the prior year’s comparative figures have been reclassified to conform to the current year’s presentation. These consolidated financial statements were approved by the Board of Directors on June 1, 2016.
2015/16 Annual Service Plan Report 40

British Columbia Hydro and Power Authority NOTES TO THE CONSOLIDATED FINANCIAL STATEMENTS FOR THE YEARS ENDED MARCH 31, 2016 AND 2015 (b) Basis of Measurement
The consolidated financial statements have been prepared on the historical cost basis except for natural gas inventories in Note 4(j), financial instruments that are accounted for according to the financial instrument categories as defined in Note 4(k) and the post-employment benefits obligation as described in Note 4(o).
(c) Functional and Presentation Currency The functional currency of BC Hydro and all of its subsidiaries, except for Powerex, is the Canadian dollar. Powerex’s functional currency is the U.S. dollar. These consolidated financial statements are presented in Canadian dollars and financial information has been rounded to the nearest million.
(d) Key Assumptions and Significant Judgments The preparation of financial statements in conformity with the Prescribed Standards requires management to make judgments, estimates and assumptions in respect of the application of accounting policies and the reported amounts of assets, liabilities, income and expenses. Actual results may differ from those judgments, estimates, and assumptions. Estimates and underlying assumptions are reviewed on an ongoing basis. Revisions to estimates are recognized in the period in which the estimates are revised and in any future periods affected. Information about significant areas of judgment, estimates and assumptions in applying accounting policies that have the most significant effect on the amounts recognized in the financial statements is as follows: (i) Retirement Benefit Obligation
BC Hydro operates a defined benefit statutory pension plan for its employees which is accounted for in accordance with IAS 19, Employee Benefits. Actuarial valuations are based on key assumptions which include employee turnover, mortality rates, discount rates, earnings increases and expected rate of return on retirement plan assets. Judgment is exercised in determining these assumptions. The assumptions adopted are based on prior experience, market conditions and advice of plan actuaries. Future results are impacted by these assumptions including the accrued benefit obligation and current service cost. See Note 18 for significant benefit plan assumptions.
(ii) Provisions and Contingencies
Management is required to make judgments to assess if the criteria for recognition of provisions and contingencies are met, in accordance with IAS 37, Provisions, Contingent Liabilities and Contingent Assets. IAS 37 requires that a provision be recognized where there is a present obligation as a result of a past event, it is probable that transfer of economic benefits will be required to settle the obligation and a reliable estimate can be made of the amount of the obligation. Key judgments are whether a present obligation exists and the probability of an outflow being required to settle that obligation. Key assumptions in measuring recorded provisions include the timing and amount of future payments and the discount rate applied in valuing the provision. The Company is currently defending certain lawsuits where management must make judgments, estimates and assumptions about the final outcome, timing of trial activities and future costs as at
2015/16 Annual Service Plan Report 41

British Columbia Hydro and Power Authority NOTES TO THE CONSOLIDATED FINANCIAL STATEMENTS FOR THE YEARS ENDED MARCH 31, 2016 AND 2015
the period end date. Management has obtained the advice of its external counsel in determining the likely outcome and estimating the expected costs associated with these lawsuits; however, the ultimate outcome or settlement costs may differ from management’s estimates.
(iii) Financial Instruments
The Company enters into financial instrument arrangements which require management to make judgments to determine if such arrangements are derivative instruments in their entirety or contain embedded derivatives, including whether those embedded derivatives meet the criteria to be separated from their host contract, in accordance with IAS 39, Financial Instruments: Recognition and Measurement. Key judgments are whether certain non-financial items are readily convertible to cash, whether similar contracts are routinely settled net in cash or delivery of the underlying commodity taken and then resold within a short period, whether the value of a contract changes in response to a change in an underlying rate, price, index or other variable, and for embedded derivatives, whether the economic risks and characteristics are not closely related to the host contract and a separate instrument with the same terms would meet the definition of a derivative on a standalone basis. Valuation techniques are used in measuring the fair value of financial instruments when active market quotes are not available. Valuation of the Company’s financial instruments is based in part on forward prices which are volatile and therefore the actual realized value may differ from management’s estimates.
(iv) Leases
The Company enters into long-term energy purchase agreements that may be considered to be, or contain a lease. In making this determination, judgment is required to determine whether the fulfillment of an arrangement is dependent on the use of a specific asset, and whether the arrangement conveys a right to use the asset. For those arrangements considered to be leases, or which contain an embedded lease, further judgment is required to determine whether to account for the agreement as either a finance or operating lease by assessing whether substantially all of the significant risks and rewards of ownership are transferred to the Company or remain with the counterparty to the agreement. The measurement of finance leases requires estimations of the amounts and timing of future cash flows and the determination of an appropriate discount rate.
NOTE 3: CHANGES IN ACCOUNTING POLICIES
Effective April 1, 2015, the Company adopted Amendments to IAS 19, Employee Benefits, which had no impact on the consolidated financial statements. NOTE 4: SIGNIFICANT ACCOUNTING POLICIES (a) Rate Regulation
BC Hydro is regulated by the BCUC and both entities are subject to directives and directions issued by the Province. BC Hydro operates under a cost of service regulation as prescribed by the BCUC. Orders
2015/16 Annual Service Plan Report 42

British Columbia Hydro and Power Authority NOTES TO THE CONSOLIDATED FINANCIAL STATEMENTS FOR THE YEARS ENDED MARCH 31, 2016 AND 2015
in Council from the Province establish the basis for determining BC Hydro’s equity for regulatory purposes, as well as its allowed return on equity and the annual Payment to the Province. Calculation of its revenue requirements and rates charged to customers are established through applications filed with and approved by the BCUC.
BC Hydro applies the principles of ASC 980, which differs from IFRS, to reflect the impacts of the rate-regulated environment in which BC Hydro operates (see Note 13). Generally, this results in the deferral and amortization of costs and recoveries to allow for adjustment of future customer rates. In the absence of rate-regulation, these amounts would otherwise be included in comprehensive income unless recovered in rates in the year the amounts are incurred. BC Hydro capitalizes as a regulatory asset all or part of an incurred cost that would otherwise be charged to expense or other comprehensive income if it is probable that future revenue in an amount at least equal to the capitalized cost will result from inclusion of that cost in allowable costs for rate-making purposes and the future rates and revenue approved by the BCUC will permit recovery of that incurred cost. Regulatory liabilities are recognized for certain gains or other reductions of net allowable costs for adjustment of future rates as determined by the BCUC.
These accounting policies support BC Hydro’s rate regulation and regulatory accounts have been established through ongoing application to, and approval by, the BCUC. When a regulatory account has been or will be applied for, and, in management’s estimate, acceptance of deferral treatment by the BCUC is considered probable, BC Hydro defers such costs in advance of a final decision of the BCUC. If the BCUC subsequently denies the application for regulatory treatment, the remaining deferred amount is recognized immediately in comprehensive income.
(b) Revenue
Domestic revenues comprise sales to customers within the province of British Columbia and sales of firm energy outside the province under long-term contracts that are reflected in the Company’s domestic load requirements. Other sales outside the province are classified as trade. Revenue is recognized at the time energy is delivered to the Company’s customers, the amount of revenue can be measured reliably and collection is reasonably assured. Revenue is determined on the basis of billing cycles and also includes accruals for electricity deliveries not yet billed. Energy trading contracts that meet the definition of a financial or non-financial derivative are accounted for at fair value whereby any realized gains and losses and unrealized changes in the fair value are recognized in trade revenues in the period of change. Energy trading and other contracts which do not meet the definition of a derivative are accounted for on an accrual basis whereby the realized gains and losses are recognized as revenue as the contracts are settled. Such contracts are considered to be settled when, for the sale of products, the significant risks and rewards of ownership transfer to the buyer, and for the sale of services, those services are rendered.
(c) Finance Costs and Recoveries
Finance costs comprise interest expense on borrowings, accretion expense on provisions and other long-term liabilities, net interest on net defined benefit obligations, interest on finance lease liabilities,
2015/16 Annual Service Plan Report 43

British Columbia Hydro and Power Authority NOTES TO THE CONSOLIDATED FINANCIAL STATEMENTS FOR THE YEARS ENDED MARCH 31, 2016 AND 2015
foreign exchange losses and realized hedging instrument losses that are recognized in the statement of comprehensive income. All borrowing costs are recognized using the effective interest rate method. Finance costs exclude borrowing costs attributable to the construction of qualifying assets, which are assets that take more than six months to prepare for their intended use. Finance recoveries comprises income earned on sinking fund investments held for the redemption of long-term debt, foreign exchange gains and realized hedging instrument gains that are recognized in the statement of comprehensive income, excluding energy trading contracts.
(d) Foreign Currency
Foreign currency transactions are translated into the respective functional currencies of BC Hydro and its subsidiaries, using the exchange rates prevailing at the dates of the transactions. Monetary assets and liabilities denominated in foreign currencies at the reporting date are re-translated to the functional currency at the exchange rate in effect at that date. The foreign currency gains or losses on monetary items is the difference between the amortized cost in the functional currency at the beginning of the period, adjusted for effective interest and payments during the period, and the amortized cost in the foreign currency translated at the exchange rate at the end of the reporting period. Non-monetary items that are measured in terms of historical cost in a foreign currency are translated using the exchange rate at the date of the transaction. For purposes of consolidation, the assets and liabilities of Powerex, whose functional currency is the U.S. dollar, are translated to Canadian dollars using the rate of exchange in effect at the reporting date. Revenue and expenses of Powerex are translated to Canadian dollars at exchange rates at the date of the transactions. Foreign currency differences resulting from translation of the accounts of Powerex are recognized directly in other comprehensive income and are accumulated in the cumulative translation reserve. Foreign exchange gains or losses arising from a monetary item receivable from or payable to Powerex, the settlement of which is neither planned nor likely in the foreseeable future and which in substance is considered to form part of a net investment in Powerex by BC Hydro, are recognized directly in other comprehensive income in the cumulative translation reserve.
(e) Property, Plant and Equipment (i) Recognition and Measurement
Property, plant and equipment in service are measured at cost less accumulated depreciation and accumulated impairment losses.
Cost includes expenditures that are directly attributable to the acquisition of the asset. The cost of self-constructed assets includes the cost of materials, direct labour and any other costs directly attributable to bringing the asset into service. The cost of dismantling and removing an item of property, plant and equipment and restoring the site on which it is located is estimated and capitalized only when, and to the extent that, the Company has a legal or constructive obligation to dismantle and remove such asset. Property, plant and equipment in service include the cost of plant and equipment financed by contributions in aid of construction. Borrowing costs that are directly attributable to the acquisition or construction of a qualifying asset are capitalized as part of the cost of the qualifying asset. Upon retirement or disposal, any gain or loss is recognized in the statement of comprehensive income.
2015/16 Annual Service Plan Report 44

British Columbia Hydro and Power Authority NOTES TO THE CONSOLIDATED FINANCIAL STATEMENTS FOR THE YEARS ENDED MARCH 31, 2016 AND 2015
The Company recognizes government grants when there is reasonable assurance that any conditions attached to the grant will be met and the grant will be received. Government grants related to assets are deducted from the carrying amount of the related asset and recognized in profit or loss over the life of the related asset. Unfinished construction consists of the cost of property, plant and equipment that is under construction or not ready for service. Costs are transferred to property, plant and equipment in service when the constructed asset is capable of operation in a manner intended by management.
(ii) Subsequent Costs
The cost of replacing a component of an item of property, plant and equipment is recognized in the carrying amount of the item if it is probable that the future economic benefits embodied within the component will flow to the Company, and its cost can be measured reliably. The carrying amount of the replaced component is derecognized. The costs of property, plant and equipment maintenance are recognized in the statement of comprehensive income as incurred.
(iii) Depreciation
Property, plant and equipment in service are depreciated over the expected useful lives of the assets, using the straight-line method. When major components of an item of property, plant and equipment have different useful lives, they are accounted for as separate items of property, plant and equipment. The expected useful lives, in years, of the Company’s main classes of property, plant and equipment are:
Generation 15 – 100 Transmission 20 – 65 Distribution 20 – 60 Buildings 5 – 60 Equipment & Other 3 – 35
The expected useful lives and residual values of items of property, plant and equipment are reviewed annually. Depreciation of an item of property, plant and equipment commences when the asset is available for use and ceases at the earlier of the date the asset is classified as held for sale and the date the asset is derecognized.
(f) Intangible Assets Intangible assets are recorded at cost less accumulated amortization and accumulated impairment losses. Land rights associated with statutory rights of way acquired from the Province that have indefinite useful lives and are not subject to amortization. Other intangible assets include California carbon allowances which are not amortized because they are used to settle obligations arising from carbon emissions regulations. Intangible assets with finite useful lives are amortized over their expected useful lives on a straight line basis. These assets are tested for impairment annually or more
2015/16 Annual Service Plan Report 45

British Columbia Hydro and Power Authority NOTES TO THE CONSOLIDATED FINANCIAL STATEMENTS FOR THE YEARS ENDED MARCH 31, 2016 AND 2015
frequently if events or changes in circumstances indicate that the asset value may not be fully recoverable. The expected useful lives, in years, are as follows:
Software 2 – 10 Other 10 – 20
Amortization of intangible assets commences when the asset is available for use and ceases at the earlier of the date that the asset is classified as held for sale and the date that the asset is derecognized.
(g) Asset Impairment (i) Financial Assets
Financial assets, other than those measured at fair value, are assessed at each reporting date to determine whether there is impairment. A financial asset is impaired if evidence indicates that a loss event has occurred after the initial recognition of the asset, and that the loss event had a negative effect on the estimated future cash flows of that asset that can be estimated reliably.
An impairment loss in respect of a financial asset measured at amortized cost is calculated as the difference between its carrying amount and the present value of the estimated future cash flows discounted at the asset’s original effective interest rate. An impairment loss in respect of an available-for-sale financial asset is calculated by reference to its fair value. Individually significant financial assets are tested for impairment on an individual basis. The remaining financial assets are assessed collectively in groups that share similar credit risk characteristics. All impairment losses are recognized in net income. Any cumulative loss in respect of an available-for-sale financial asset previously recognized in other comprehensive income and presented in unrealized gains/losses on available-for-sale financial assets in equity is transferred to net income. An impairment loss is reversed if the reversal can be related to an event occurring after the impairment loss was recognized. For financial assets measured at amortized cost and available-for-sale financial assets that are debt securities, the reversal is recognized in net income.
(ii) Non-Financial Assets
The carrying amounts of the Company’s non-financial assets are reviewed at each reporting date to determine whether there is any indication of impairment. If any such indication exists, then the asset’s recoverable amount is estimated. For intangible assets that have indefinite useful lives or that are not yet available for use, the recoverable amount is estimated annually.
For the purpose of impairment testing, assets that cannot be tested individually are grouped together into the smallest group of identifiable assets that generates cash inflows from continuing use that are largely independent of the cash inflows of other assets or groups of assets (the cash-generating unit, or CGU). The recoverable amount of an asset or CGU is the greater of its value in use and its
2015/16 Annual Service Plan Report 46

British Columbia Hydro and Power Authority NOTES TO THE CONSOLIDATED FINANCIAL STATEMENTS FOR THE YEARS ENDED MARCH 31, 2016 AND 2015
fair value less costs to sell. In assessing value in use, the estimated future cash flows are discounted to their present value using a pre-tax discount rate that reflects current market assessments of the time value of money and the risks specific to the asset. All of BC Hydro’s assets form one CGU for the purposes of testing for impairment. An impairment loss is recognized if the carrying amount of an asset or CGU exceeds its estimated recoverable amount. Impairment losses are recognized in net income. Impairment losses recognized in respect of a CGU are allocated to reduce the carrying amounts of the assets in the CGU on a pro-rata basis. Impairment losses recognized in prior periods are assessed at the reporting date for any indications that the loss has decreased or no longer exists. Impairment reversals are recognized immediately in net income when the recoverable amount of an asset increases above the impaired net book value, not to exceed the carrying amount that would have been determined (net of depreciation) had no impairment loss been recognized for the asset in prior years.
(h) Cash and Cash Equivalents Cash and cash equivalents include unrestricted cash and units of a money market fund (short-term investments) that are redeemable on demand and are carried at amortized cost and fair value, respectively.
(i) Restricted Cash Restricted cash includes cash balances which the Company does not have immediate access to as they have been pledged to counterparties as security for investments or trade obligations. These balances are available to the Company only upon settlement of the trade obligations for which they have been pledged as security.
(j) Inventories Inventories are comprised primarily of natural gas, materials and supplies. Natural gas inventory is valued at fair value less costs to sell and included in Level 2 of the fair value hierarchy (Note 19: Financial Instruments – Fair Value Hierarchy). Materials and supplies inventories are valued at the lower of cost determined on a weighted average basis and net realizable value. The cost of materials and supplies comprises all costs of purchase, costs of conversion and other directly attributable costs incurred in bringing the inventories to their present location and condition. Net realizable value is the estimated selling price in the ordinary course of business, less the estimated selling expenses.
(k) Financial Instruments (i) Financial Instruments – Recognition and Measurement
All financial instruments are measured at fair value on initial recognition of the instrument, except for certain related party transactions. Measurement in subsequent periods depends on which of the following categories the financial instrument has been classified as: fair value through profit or loss, available-for-sale, held-to-maturity, loans and receivables, or other financial liabilities as defined by the standard. Transaction costs are expensed as incurred for financial instruments classified or designated as fair value through profit or loss. For other financial instruments, transaction costs are
2015/16 Annual Service Plan Report 47

British Columbia Hydro and Power Authority NOTES TO THE CONSOLIDATED FINANCIAL STATEMENTS FOR THE YEARS ENDED MARCH 31, 2016 AND 2015
included in the carrying amount. All regular-way purchases or sales of financial assets are accounted for on a settlement date basis.
Financial assets and financial liabilities classified as fair value through profit or loss are subsequently measured at fair value with changes in those fair values recognized in net income in the period of change. Financial assets classified as available-for-sale are subsequently measured at fair value, with changes in those fair values recognized in other comprehensive income until realized. Financial assets classified as held-to-maturity, loans and receivables, and financial liabilities classified as other financial liabilities are subsequently measured at amortized cost using the effective interest method of amortization less any impairment. Derivatives, including embedded derivatives that are not closely related to the host contract and are separately accounted for are generally classified as fair value through profit or loss and recorded at fair value in the statement of financial position.
The following table presents the classification of financial instruments in the various categories:
(ii) Fair Value
The fair value of financial instruments reflects changes in the level of commodity market prices, interest rates, foreign exchange rates and credit risk. Fair value is the amount of consideration that would be agreed upon in an arm’s length transaction between knowledgeable willing parties who are under no compulsion to act. Fair value amounts reflect management’s best estimates considering various factors including closing exchange or over-the-counter quotations, estimates of future prices and foreign exchange rates, time value of money, counterparty and own credit risk, and volatility. The assumptions used in establishing fair value amounts could differ from actual prices and the impact of such variations could be material. In certain circumstances, valuation inputs are used that are not based on
Category Financial InstrumentsFinancial assets and liabilities at fair value Short-term investments through profit or loss
Held to maturity US dollar sinking funds
Loans and receivables CashRestricted cashAccounts receivable and other receivables
Other financial liabilities Accounts payable and accrued liabilitiesRevolving borrowings Long-term debt (including current portion due in one year)Finance lease obligations, First Nations liabilities and other liabilities presented in other long-term liabilities
Derivatives not in a hedging relationship
2015/16 Annual Service Plan Report 48

British Columbia Hydro and Power Authority NOTES TO THE CONSOLIDATED FINANCIAL STATEMENTS FOR THE YEARS ENDED MARCH 31, 2016 AND 2015
observable market data and internally developed valuation models which are based on models and techniques generally recognized as standard within the energy industry.
(iii) Inception Gains and Losses
In some instances, a difference may arise between the fair value of a financial instrument at initial recognition, as defined by its transaction price, and the fair value calculated by a valuation technique or model (inception gain or loss). In addition, the Company’s inception gain or loss on a contract may arise as a result of embedded derivatives which are recorded at fair value, with the remainder of the contract recorded on an accrual basis. In these circumstances, the unrealized inception gain or loss is deferred and amortized into income over the full term of the underlying financial instrument. Additional information on deferred inception gains and losses is disclosed in Note 19, Financial Instruments.
(iv)Derivative Financial Instruments
The Company may use derivative financial instruments to manage interest rate and foreign exchange risks related to debt and to manage risks related to electricity and natural gas commodity transactions. Interest rate and foreign exchange related derivative instruments that are not designated as hedges, are recorded using the mark-to-market method of accounting whereby instruments are recorded at fair value as either an asset or liability with changes in fair value recognized in net income in the period of change. For liability management activities, the related gains or losses are included in finance charges. For foreign currency exchange risk associated with electricity and natural gas commodity transactions, the related gains or losses are included in domestic revenues. The Company’s policy is to not utilize interest rate and foreign exchange related derivative financial instruments for speculative purposes. Derivative financial instruments are also used by Powerex to manage economic exposure to market risks relating to commodity prices. Derivatives used for energy trading activities that are not designated as hedges are recorded using the market-to-market method of accounting whereby instruments are recorded at fair value as either an asset or liability with changes in fair value recognized in net income. Gains or losses are included in trade revenues.
(v) Hedges In a fair value hedging relationship, the carrying value of the hedged item is adjusted for unrealized gains or losses attributable to the hedged risk and recognized in net income. Changes in the fair value of the hedged item attributed to the hedged risk, to the extent that the hedging relationship is effective, are offset by changes in the fair value of the hedging derivative, which is also recorded in net income. When hedge accounting is discontinued, the carrying value of the hedged item is no longer adjusted and the cumulative fair value adjustments to the carrying value of the hedged item are amortized to net income over the remaining term of the original hedging relationship, using the effective interest method of amortization. In a cash flow hedging relationship, the effective portion of the change in the fair value of the hedging derivative is recognized in other comprehensive income. The ineffective portion is recognized in net income. The amounts recognized in accumulated other comprehensive income are
2015/16 Annual Service Plan Report 49

British Columbia Hydro and Power Authority NOTES TO THE CONSOLIDATED FINANCIAL STATEMENTS FOR THE YEARS ENDED MARCH 31, 2016 AND 2015
reclassified to net income in the periods in which net income is affected by the variability in the cash flows of the hedged item. When hedge accounting is discontinued the cumulative gain or loss previously recognized in accumulated other comprehensive income remains there until the forecasted transaction occurs. When the hedged item is a non-financial asset or liability, the amount recognized in accumulated other comprehensive income is transferred to the carrying amount of the asset or liability when it is recognized. In other cases the amount recognized in accumulated other comprehensive income is transferred to net income in the same period that the hedged item affects net income. Hedge accounting is discontinued prospectively when the derivative no longer qualifies as an effective hedge, the hedging relationship is discontinued, or the derivative is terminated or sold, or upon the sale or early termination of the hedged item.
(l) Investments Held in Sinking Funds
Investments held in sinking funds are held as individual portfolios and are classified as held to maturity. Securities included in an individual portfolio are recorded at cost, adjusted by amortization of any discounts or premiums arising on purchase, on a yield basis over the estimated term to settlement of the security. Realized gains and losses are included in sinking fund income.
(m) Deferred Revenue – Skagit River Agreement Deferred revenue consists principally of amounts received under the agreement relating to the Skagit River, Ross Lake and the Seven Mile Reservoir on the Pend d’Oreille River (collectively, the Skagit River Agreement). Under the Skagit River Agreement, the Company has committed to deliver a predetermined amount of electricity each year to the City of Seattle for an 80 year period ending in fiscal 2066 in return for annual payments of approximately US$22 million for a 35 year period ending in 2021 and US$100,000 (adjusted for inflation) for the remaining 45 year period ending in 2066. The amounts received under the agreement are deferred and included in income on an annuity basis over the electricity delivery period ending in fiscal 2066.
(n) Contributions in Aid of Construction Contributions in aid of construction are amounts paid by certain customers toward the cost of property, plant and equipment required for the extension of services to supply electricity. These amounts are recognized into revenue over the term of the agreement with the customer or over the expected useful life of the related assets, if the associated contracts do not have a finite period over which service is provided.
(o) Post-Employment Benefits The cost of pensions and other post-employment benefits earned by employees is actuarially determined using the projected accrued benefit method prorated on service and management’s best estimate of mortality, salary escalation, retirement ages of employees and expected health care costs. The net interest for the period is determined by applying the same market discount rate used to measure the defined benefit obligation at the beginning of the annual period to the net defined benefit asset or liability at the beginning of the annual period, taking into account any changes in the net
2015/16 Annual Service Plan Report 50

British Columbia Hydro and Power Authority NOTES TO THE CONSOLIDATED FINANCIAL STATEMENTS FOR THE YEARS ENDED MARCH 31, 2016 AND 2015
defined benefit asset or liability during the period as a result of current service costs, contributions and benefit payments. The market discount rate is determined based on the market interest rate at the end of the year on high-quality corporate debt instruments that match the timing and amount of expected benefit payments.
Past service costs arising from plan amendments and curtailments are recognized in net income immediately. A plan curtailment will result if the Company has demonstrably committed to a significant reduction in the expected future service of active employees or a significant element of future service by active employees no longer qualifies for benefits. A curtailment is recognized when the event giving rise to the curtailment occurs. The net interest cost on the net defined benefit plan liabilities arising from the passage of time are included in finance charges. The Company recognizes actuarial gains and losses immediately in other comprehensive income.
(p) Provisions A provision is recognized if the Company has a present legal or constructive obligation as a result of a past event, it is probable that an outflow of economic benefits will be required to settle the obligation and a reliable estimate of the obligation can be determined. For obligations of a long-term nature, provisions are measured at their present value by discounting the expected future cash flows at a pre-tax rate that reflects current market assessments of the time value of money and the risks specific to the liability except in cases where future cash flows have been adjusted for risk. Decommissioning Obligations Decommissioning obligations are legal and constructive obligations associated with the retirement of long-lived assets. A liability is recorded at the present value of the estimated future costs based on management’s best estimate. When a liability is initially recorded, the Company capitalizes the costs by increasing the carrying value of the asset. The increase in net present value of the provision for the expected cost is included in finance costs as accretion (interest) expense. Adjustments to the provision made for changes in timing, amount of cash flow and discount rates are capitalized and amortized over the useful life of the associated asset. Actual costs incurred upon settlement of a decommissioning obligation are charged against the related liability. Any difference between the actual costs incurred upon settlement of the decommissioning obligation and the recorded liability is recognized in net income at that time. Environmental Expenditures and Liabilities Environmental expenditures are expensed as part of operating activities, unless they constitute an asset improvement or act to mitigate or prevent possible future contamination, in which case the expenditures are capitalized and amortized to income. Environmental liabilities arising from a past event are accrued when it is probable that a present legal or constructive obligation will require the Company to incur environmental expenditures. Legal The Company recognizes legal claims as a provision when it is probable that the claim will be settled against the Company and the amount of the settlement can be reasonably measured. Management
2015/16 Annual Service Plan Report 51

British Columbia Hydro and Power Authority NOTES TO THE CONSOLIDATED FINANCIAL STATEMENTS FOR THE YEARS ENDED MARCH 31, 2016 AND 2015
obtains the advice of its external counsel in determining the likely outcome and estimating the expected costs associated with lawsuits. Further information regarding lawsuits in progress, that have not been recognized, is disclosed in Note 21, Commitments and Contingencies.
(q) Leases
Embedded Leases The Company may enter into an arrangement that does not take the legal form of a lease but conveys a right to use an asset in return for a payment or series of payments. Arrangements in which a party conveys a right to the Company to use an asset may in substance be, or contain, a lease that should be accounted for as either a finance or operating lease. Determining whether an arrangement is, or contains, a lease requires an assessment of whether fulfilment of the arrangement is dependent on the use of a specific asset; and whether the arrangement conveys a right to use the asset. The right to use an asset is conveyed if the right to operate or control physical access to the underlying asset is provided or if the Company consumes substantially all of the output of the asset and the price paid for the output is neither contractually fixed per unit of output nor equal to the current market price. Finance Leases Leases where substantially all of the benefits and risk of ownership rest with the Company are accounted for as finance leases. Finance leases are recognized as assets and liabilities at the lower of the fair value of the asset and the present value of the minimum lease payments at the date of acquisition. Finance costs represent the difference between the total leasing commitments and the fair value of the assets acquired. Finance costs are charged to net income over the term of the lease at interest rates applicable to the lease on the remaining balance of the obligations. Assets under finance leases are depreciated on the same basis as property, plant and equipment or over the term of the relevant lease, whichever is shorter. Operating Leases Leases where substantially all of the benefits and risk of ownership remain with the lessor are accounted for as operating leases. Rental payments under operating leases are expensed to net income on a straight-line basis over the term of the relevant lease. Benefits received and receivable as an incentive to enter into an operating lease are recognized as an integral part of the total lease expense and are recorded on a straight-line basis over the term of the lease.
(r) Taxes The Company pays local government taxes and grants in lieu to municipalities and regional districts. As a Crown corporation, the Company is exempt from Canadian federal and provincial income taxes.
(s) Jointly Controlled Operations The Company has joint ownership and control over certain assets with third parties. A jointly controlled operation exists when there is a joint ownership and control of one or more assets to obtain benefits for the joint operators. The parties that have joint control of the arrangement have rights to the assets, and obligations for the liabilities, related to the arrangement. Each joint operator takes a share of the output from the assets for its own exclusive use. These consolidated financial statements include the Company’s share of the jointly controlled assets. The Company also records its share of any
2015/16 Annual Service Plan Report 52

British Columbia Hydro and Power Authority NOTES TO THE CONSOLIDATED FINANCIAL STATEMENTS FOR THE YEARS ENDED MARCH 31, 2016 AND 2015
liabilities and expenses incurred jointly with third parties and any revenue from the sale or use of its share of the output in relation to the assets.
(t) New Standards and Interpretations Not Yet Adopted A number of new standards, and amendments to standards and interpretations, are not yet effective for the year ended March 31, 2016, and have not been applied in preparing these consolidated financial statements. In particular, the following new and amended standards become effective for the Company’s annual periods beginning on or after the dates noted below:
• Amendments to IFRS 10, Consolidated Financial Statements (April 1, 2016) • Amendments to IFRS 11, Joint Arrangements (April 1, 2016) • Amendments to IFRS 12, Disclosure of Interests in Other Entities (April 1, 2016) • Amendments to IAS 1, Presentation of Financial Statements (April 1, 2016) • Amendments to IAS 16, Property, Plant and Equipment (April 1, 2016) • Amendments to IAS 38, Intangible Assets (April 1, 2016) • Amendments to IAS 7, Statement of Cash Flows (April 1, 2017) • IFRS 9, Financial Instruments (April 1, 2018) • IFRS 15, Revenue From Contracts With Customers (April 1, 2018) • IFRS 16, Leases (April 1, 2019)
The Company does not have any plans to early adopt any of the new or amended standards. It is expected that the standards effective for the Company’s 2017 fiscal year will not have a material effect on the consolidated financial statements. The Company continues to assess the impact of adopting standards that become effective for the Company’s fiscal years commencing April 1, 2017 and later. IFRS 14, Regulatory Deferral Accounts, effective for fiscal years beginning on or after January 1, 2016, has been issued; however, the Company currently does not intend to adopt IFRS 14 as it applies the Prescribed Standards, not IFRS, and accounts for its regulatory accounts in accordance with ASC 980.
2015/16 Annual Service Plan Report 53

British Columbia Hydro and Power Authority NOTES TO THE CONSOLIDATED FINANCIAL STATEMENTS FOR THE YEARS ENDED MARCH 31, 2016 AND 2015 NOTE 5: OPERATING EXPENSES
NOTE 6: FINANCE CHARGES
Capitalized interest presented in the table above is after regulatory transfers. Actual interest capitalized to property, plant and equipment and intangible assets before regulatory transfers was $81 million (2015 - $89 million). The effective capitalization rate used to determine the amount of borrowing costs eligible for capitalization was 4.1 per cent (2015 - 4.1 per cent). NOTE 7: AMORTIZATION AND DEPRECIATION
(in millions) 2016 2015Electricity and gas purchases 1,345$ 1,707$ Water rentals 366 358 Transmission charges 141 138 Personnel expenses 527 534 Materials and external services 605 593 Amortization and depreciation (Note 7) 1,241 1,205 Grants and taxes 220 209 Capitalized costs (203) (224) Other costs, net of recoveries 8 15
4,250$ 4,535$
(in millions) 2016 2015Interest on long-term debt 771$ 685$ Interest on finance lease liabilities 94 77 Less: Other recoveries (52) (61) Capitalized interest (61) (69)
752$ 632$
(in millions) 2016 2015Depreciation of property, plant and equipment 678$ 626$ Amortization of intangible assets 67 65 Amortization of regulatory accounts 496 514
1,241$ 1,205$
2015/16 Annual Service Plan Report 54

British Columbia Hydro and Power Authority NOTES TO THE CONSOLIDATED FINANCIAL STATEMENTS FOR THE YEARS ENDED MARCH 31, 2016 AND 2015 NOTE 8: CASH AND CASH EQUIVALENTS
NOTE 9: ACCOUNTS RECEIVABLE AND ACCRUED REVENUE
Accrued revenue represents revenue for electricity delivered and not yet billed. NOTE 10: INVENTORIES
There were no materials and supplies inventory impairments during the years ended March 31, 2016 and 2015. Natural gas inventory held in storage is measured at fair value less costs to sell and therefore, not subject to impairment testing. Inventories recognized as an expense during the year amounted to $30 million (2015 - $69 million).
(in millions) 2016 2015Cash 33$ 28$ Short-term investments 11 11
44$ 39$
(in millions) 2016 2015Accounts receivable 390$ 411$ Accrued revenue 128 89 Restricted cash 62 31 Other 89 96
669$ 627$
(in millions) 2016 2015Materials and supplies 119$ 110$ Natural gas trading inventories 36 12
155$ 122$
2015/16 Annual Service Plan Report 55

British Columbia Hydro and Power Authority NOTES TO THE CONSOLIDATED FINANCIAL STATEMENTS FOR THE YEARS ENDED MARCH 31, 2016 AND 2015 NOTE 11: PROPERTY, PLANT AND EQUIPMENT
(i) The Company includes its one-third interest in Waneta with a net book value of $715 million (2015 - $735 million) in Generation assets. Depreciation expense on the Waneta asset for the year ended March 31, 2016 was $20 million (2015 - $20 million).
(ii) Included within Distribution assets are the Company’s portion of utility poles with a net book value of $911 million (2015 - $842 million) that are jointly owned with a third party. Depreciation expense on jointly owned utility poles for the year ended March 31, 2016 was $23 million (2015 - $21 million).
(iii)The Company received government grants arising from the Columbia River Treaty related to three dams built by the Company in the mid-1960s to regulate the flow of the Columbia River. The grants were made to assist in financing the construction of the dams. The grants were deducted from the carrying amount of the related dams. In addition, the Company received government grants for the construction of a new transmission line and has deducted the grants received from the cost of the asset. Government grants received in fiscal 2016 were $13 million (2015 - $nil).
(iv) The Company has contractual commitments to spend $3,710 million on major property, plant and equipment projects (individual projects greater than $50 million) as at March 31, 2016.
Leased assets Property, plant and equipment under finance leases of $388 million (2015 - $388 million), net of accumulated amortization of $186 million (2015 - $173 million), are included in the total amount of property, plant and equipment above.
(in millions) Generation Transmission DistributionLand &
BuilidingsEquipment &
OtherUnfinished
Construction TotalCostBalance at March 31, 2014 6,516$ 4,552$ 5,057$ 504$ 661$ 2,940$ 20,230$ Net additions (transfers) 479 1,096 349 77 85 (9) 2,077 Disposals and retirements (6) (8) (28) (3) (11) (26) (82) Balance at March 31, 2015 6,989 5,640 5,378 578 735 2,905 22,225 Net additions (transfers) 535 1,465 418 72 165 (487) 2,168 Disposals and retirements (6) (34) (31) - (34) (8) (113) Balance at March 31, 2016 7,518$ 7,071$ 5,765$ 650$ 866$ 2,410$ 24,280$
Accumulated DepreciationBalance at March 31, 2014 (645)$ (411)$ (433)$ (51)$ (165)$ -$ (1,705)$ Depreciation expense (198) (161) (165) (24) (64) - (612) Disposals and retirements 3 6 6 1 9 - 25 Balance at March 31, 2015 (840) (566) (592) (74) (220) - (2,292) Depreciation expense (211) (177) (171) (23) (72) - (654) Disposals and retirements 3 8 8 - 32 - 51 Balance at March 31, 2016 (1,048)$ (735)$ (755)$ (97)$ (260)$ -$ (2,895)$
Net carrying amountsAt March 31, 2015 6,149$ 5,074$ 4,786$ 504$ 515$ 2,905$ 19,933$ At March 31, 2016 6,470$ 6,336$ 5,010$ 553$ 606$ 2,410$ 21,385$
2015/16 Annual Service Plan Report 56

British Columbia Hydro and Power Authority NOTES TO THE CONSOLIDATED FINANCIAL STATEMENTS FOR THE YEARS ENDED MARCH 31, 2016 AND 2015 NOTE 12: INTANGIBLE ASSETS
Land rights consist primarily of statutory rights of way acquired from the Province in perpetuity. These land rights have indefinite useful lives and are not subject to amortization. These land rights are tested for impairment annually or more frequently if events or changes in circumstances indicate that the asset value may not be recoverable. NOTE 13: RATE REGULATION
Regulatory Accounts The following regulatory assets and liabilities have been established through rate regulation. In the absence of rate regulation, these amounts would be reflected in total comprehensive income unless the Company sought recovery through rates in the year in which they are incurred. For the year ended March 31, 2016, the impact of regulatory accounting has resulted in a net increase to total comprehensive income of $475 million (2015 - $734 million) which is comprised of an increase to net income of $403 million (2015 - $470 million) and an increase to other comprehensive income of $72 million (2015 – $264 million increase). For each regulatory account, the amount reflected in the Net Change column in the following regulatory tables represents the impact on comprehensive income for the applicable year, unless otherwise recovered through rates. Under rate regulated accounting, a net decrease in a regulatory asset or a net increase in a regulatory liability results in a decrease to comprehensive income.
(in millions)Land
Rights
Internally Developed Software
Purchased Software Other
Work in Progress Total
CostBalance at March 31, 2014 183$ 85$ 334$ 19$ 46$ 667$ Net additions 15 34 32 21 17 119 Disposals and retirements - - - (9) (4) (13) Balance at March 31, 2015 198 119 366 31 59 773 Net additions 42 30 73 7 1 153 Disposals and retirements - - (2) (19) (2) (23) Balance at March 31, 2016 240$ 149$ 437$ 19$ 58$ 903$
Accumulated AmortizationBalance at March 31, 2014 -$ (21)$ (129)$ (8)$ -$ (158)$ Amortization expense - (17) (48) (3) - (68) Balance at March 31, 2015 - (38) (177) (11) - (226) Amortization expense - (21) (48) - - (69) Disposals and retirements - (4) 5 - - 1 Balance at March 31, 2016 -$ (63)$ (220)$ (11)$ -$ (294)$
Net carrying amountsAt March 31, 2015 198$ 81$ 189$ 20$ 59$ 547$ At March 31, 2016 240$ 86$ 217$ 8$ 58$ 609$
2015/16 Annual Service Plan Report 57

British Columbia Hydro and Power Authority NOTES TO THE CONSOLIDATED FINANCIAL STATEMENTS FOR THE YEARS ENDED MARCH 31, 2016 AND 2015
(in millions)April 1 2015
Addition(Reduction) Interest Amortization
NetChange
March 31 2016
Regulatory AssetsHeritage Deferral Account 165$ (137)$ 1$ (29)$ (165)$ -$ Non-Heritage Deferral Account 524 483 28 (118) 393 917 Trade Income Deferral Account 244 51 9 (55) 5 249 Demand-Side Management 842 145 - (79) 66 908 First Nations Provisions & Costs 564 14 6 (43) (23) 541 Non-Current Pension Cost 564 142 - (15) 127 691 Site C 419 - 17 - 17 436 CIA Amortization 87 5 - - 5 92 Environmental Provisions & Costs 382 51 - (75) (24) 358 Smart Metering & Infrastructure 283 20 11 (31) - 283 IFRS Pension 650 - - (38) (38) 612 IFRS Property, Plant & Equipment 758 134 - (20) 114 872 Rate Smoothing Account 166 121 - - 121 287 Other Regulatory Accounts 66 30 1 (19) 12 78 Total Regulatory Assets 5,714 1,059 73 (522) 610 6,324 Regulatory LiabilitiesHeritage Deferral Account - 15 1 8 24 24 Future Removal & Site Restoration Costs 33 - - (24) (24) 9 Foreign Exchange Gains and Losses 71 (3) - 1 (2) 69 Total Finance Charges 173 158 - (26) 132 305 Other Regulatory Accounts 4 14 - (9) 5 9 Total Regulatory Liabilities 281 184 1 (50) 135 416 Net Regulatory Asset 5,433$ 875$ 72$ (472)$ 475$ 5,908$
2015/16 Annual Service Plan Report 58

British Columbia Hydro and Power Authority NOTES TO THE CONSOLIDATED FINANCIAL STATEMENTS FOR THE YEARS ENDED MARCH 31, 2016 AND 2015
RATE REGULATION In March 2014, the Province issued Directions No. 6 and 7 to the BCUC that, among other things, requires the Company to amortize specific amounts prescribed for a majority of BC Hydro’s regulatory accounts, in each of fiscal 2015 and fiscal 2016. HERITAGE DEFERRAL ACCOUNT Under a Special Direction issued by the Province, the BCUC was directed to authorize the Company to establish the Heritage Deferral Account. This account is intended to mitigate the impact of certain variances between the forecast costs in a revenue requirements application and actual costs of service associated with the Company’s hydroelectric and thermal generating facilities by adjustment of net income. These deferred variances are recovered in rates through the Deferral Account Rate Rider (DARR). The DARR, currently at 5 per cent, is an additional charge on customer bills and is used to recover the balances in the energy deferral accounts.
(in millions)April 1 2014
Addition(Reduction) Interest Amortization
NetChange
March 31 2015
Regulatory AssetsHeritage Deferral Account 105$ 82$ 4$ (26)$ 60$ 165$ Non-Heritage Deferral Account 362 238 15 (91) 162 524 Trade Income Deferral Account 324 (10) 11 (81) (80) 244 Demand-Side Management 788 125 - (71) 54 842 First Nations Provisions & Costs 589 12 7 (44) (25) 564 Non-Current Pension Cost 280 317 - (33) 284 564 Site C 338 65 16 - 81 419 CIA Amortization 81 6 - - 6 87 Environmental Provisions & Costs 383 69 3 (73) (1) 382 Smart Metering & Infrastructure 277 26 11 (31) 6 283 IFRS Pension 688 - - (38) (38) 650 IFRS Property, Plant & Equipment 617 157 - (16) 141 758 Rate Smoothing Account - 166 - - 166 166 Other Regulatory Accounts 96 15 1 (46) (30) 66 Total Regulatory Assets 4,928 1,268 68 (550) 786 5,714 Regulatory LiabilitiesFuture Removal & Site Restoration Costs 56 - - (23) (23) 33 Foreign Exchange Gains and Losses 89 (18) - - (18) 71 Total Finance Charges 79 120 - (26) 94 173 Other Regulatory Accounts 5 8 1 (10) (1) 4 Total Regulatory Liabilities 229 110 1 (59) 52 281 Net Regulatory Asset 4,699$ 1,158$ 67$ (491)$ 734$ 5,433$
2015/16 Annual Service Plan Report 59

British Columbia Hydro and Power Authority NOTES TO THE CONSOLIDATED FINANCIAL STATEMENTS FOR THE YEARS ENDED MARCH 31, 2016 AND 2015 NON-HERITAGE DEFERRAL ACCOUNT Under a Special Direction issued by the Province, the BCUC approved the establishment of the Non-Heritage Deferral Account, which is intended to mitigate the impact of certain cost variances between the forecast costs in a revenue requirements application and actual costs related to items including all non-heritage energy costs (e.g. costs related to power acquisitions from Independent Power Producers), load (i.e. customer demand), and certain unplanned major capital and maintenance expenditures. These deferred variances are recovered in rates through the DARR. TRADE INCOME DEFERRAL ACCOUNT Established under a Special Directive issued by the Province, this account is intended to mitigate the uncertainty associated with forecasting the net income of the Company’s trade activities. The impact is to defer the difference between the Trade Income forecast in the revenue requirements application and actual Trade Income. These deferred variances are recovered in rates through the DARR. Trade Income is defined as the greater of (a) the amount that is equal to BC Hydro’s consolidated net income, less BC Hydro’s non-consolidated net income, less the net income of the BC Hydro’s subsidiaries except Powerex, less the amount that BC Hydro’s consolidated net income changes due to foreign currency translation gains and losses on intercompany balances between BC Hydro and Powerex; and (b) zero. The difference between the Trade Income forecast and actual Trade Income is deferred except for amounts arising from a net loss in Trade Income. DEMAND-SIDE MANAGEMENT Amounts incurred for Demand-Side Management are deferred and amortized on a straight-line basis over the anticipated 15 year period of benefit of the program. Demand-Side Management programs are designed to reduce the energy requirements on the Company’s system. Demand-Side Management costs include materials, direct labour and applicable portions of support costs, equipment costs, and incentives, the majority of which are not eligible for capitalization. Costs relating to identifiable tangible assets that meet the capitalization criteria are recorded as property, plant and equipment. FIRST NATIONS PROVISIONS & COSTS The First Nations Costs regulatory account includes the present value of future payments related to agreements reached with various First Nations groups. These agreements address settlements related to the construction and operation of the Company’s existing facilities and provide compensation for associated impacts. Annual settlement costs paid pursuant to these settlements are transferred to the First Nations Costs regulatory account. In addition, annual negotiation costs and current year interest costs are deferred to the First Nations Costs regulatory account. Also, pursuant to the Company’s fiscal 2015-2016 Revenue Requirements Rate Application, lump sum settlement payments are to be amortized over 10 years and, in fiscal 2015 and fiscal 2016, annual negotiation costs, annual settlement payments, and current year interest will be expensed from the First Nations Costs regulatory account in the year incurred. NON-CURRENT PENSION COST Variances that arise between forecast and actual non-current pension and other post-employment benefit costs are deferred. In addition, actuarial gains and losses related to post employment benefit plans are also
2015/16 Annual Service Plan Report 60

British Columbia Hydro and Power Authority NOTES TO THE CONSOLIDATED FINANCIAL STATEMENTS FOR THE YEARS ENDED MARCH 31, 2016 AND 2015 deferred. The account is amortized over the average remaining service life of the employee group. In September 2015, the BCUC issued order G-148-15, approving the Company’s transfer of the operating cost variance between the fiscal 2015-2016 Revenue Requirements Rate Application plan amount and actual fiscal 2016 post-employment benefits current service costs. The deferral for fiscal 2016 was $17 million. SITE C Site C expenditures incurred in fiscal 2007 through the third quarter of fiscal 2015 have been deferred. In December 2014, the Provincial Government approved a final investment decision for the Site C project, resulting in expenditures being capitalized in property, plant and equipment starting in the fourth quarter of fiscal 2015. BC Hydro plans to seek BCUC approval to begin amortizing the balance of the Site C regulatory account once the assets are in service. CONTRIBUTIONS IN AID (CIA) OF CONSTRUCTION AMORTIZATION This account captures the difference in revenue requirement impacts of the 45 year amortization period the Company uses as per a depreciation study and the 25 year amortization period determined by the BCUC. ENVIRONMENTAL PROVISIONS & COSTS A liability provision and offsetting regulatory asset has been established for environmental compliance and remediation arising from the costs that will likely be incurred to comply with the Federal Polychlorinated Biphenyl (PCB) Regulations enacted under the Canadian Environmental Protection Act, the Asbestos requirements of the Occupational Health and Safety Regulations under the jurisdiction of WorkSafe BC and the remediation of environmental contamination at a property occupied by a predecessor company. The regulatory asset for PCB remediation is amortized based on actual expenditures incurred during the year. Balances related to non-PCB environmental regulatory provisions are not amortized – amounts are transferred to environmental cost regulatory assets based on actual expenditures incurred attributable to the provision. Environmental cost regulatory assets are amortized over the term covered by the Company’s next revenue requirements filing. SMART METERING & INFRASTRUCTURE Net operating costs incurred by the Company in fiscal 2015 and fiscal 2016 with respect to the Smart Metering & Infrastructure program were deferred through the end of fiscal 2016 when the project was completed. Costs relating to identifiable tangible and intangible assets that meet the capitalization criteria were recorded as property, plant and equipment or intangible assets respectively. The Smart Metering & Infrastructure costs incurred prior to fiscal 2015, including net operating costs, amortization of capital assets, and finance charges have been deferred and commenced amortization, based on the fiscal 2014 ending balance, over 15 years starting in fiscal 2015. Furthermore, per Direction 6, net operating costs incurred in fiscal 2015 and fiscal 2016 were deferred. Pursuant to Direction 7 to the BCUC, the BCUC may not disallow recovery in rates of the costs deferred to the Smart Metering & Infrastructure regulatory account. IFRS PENSION Unamortized experience gains and losses on the pension and other post-employment benefit plans recognized at the time of transition to the Prescribed Standards were deferred to this regulatory account to 2015/16 Annual Service Plan Report 61

British Columbia Hydro and Power Authority NOTES TO THE CONSOLIDATED FINANCIAL STATEMENTS FOR THE YEARS ENDED MARCH 31, 2016 AND 2015 allow for recovery in future rates. The account balance is amortized over 20 years on a straight-line basis beginning in fiscal 2013. IFRS PROPERTY, PLANT & EQUIPMENT This account includes the fiscal 2012 incremental earnings impacts due to the application of the accounting principles of IFRS to Property, Plant & Equipment to the comparative fiscal year for the adoption of the Prescribed Standards. In addition, the account includes an annual deferral of overhead costs, ineligible for capitalization under the accounting principles of IFRS, equal to the fiscal 2012 overhead deferral amount less a ten year phase-in adjustment. The annual deferred amounts are amortized over 40 years beginning the year following the deferral of the expenditures. RATE SMOOTHING ACCOUNT As part of the 10 Year Rates Plan, the Rate Smoothing regulatory account was established with the objective of smoothing rate increases over a 10 year period so that there is less volatility from year to year. The account balance will be fully amortized by the end of the 10 Year Rates Plan. FUTURE REMOVAL & SITE RESTORATION COSTS This account was established by a one-time transfer of $251 million from retained earnings for liabilities previously recorded in excess of amounts required as decommissioning obligations. The costs of dismantling and disposal of property, plant and equipment may be applied to this regulatory liability if they do not otherwise relate to an asset retirement obligation. This account is estimated to be fully depleted during fiscal 2017. FOREIGN EXCHANGE GAINS AND LOSSES Foreign exchange gains and losses from the translation of specified foreign currency financial instruments are deferred. Foreign exchange gains and losses are subject to external market forces over which BC Hydro has no control. The account balance is amortized using the straight-line pool method over the weighted average life of the related debt. TOTAL FINANCE CHARGES This account is intended to mitigate the impact of certain variances that arise between the forecast finance costs in a revenue requirements application and actual finance charges incurred. Variances incurred during the current test period are recovered over the next test period. A test period refers to the period covered by a revenue requirements application filing (the current test period is fiscal 2015-2016). OTHER REGULATORY ACCOUNTS Other regulatory asset and liability accounts with individual balances less than $30 million include the following: Storm Restoration, Capital Project Investigation, Real Property Sales, Arrow Water Provision, Minimum Reconnection Charge, Arrow Water Divestiture Costs and Amortization on Capital Additions.
2015/16 Annual Service Plan Report 62

British Columbia Hydro and Power Authority NOTES TO THE CONSOLIDATED FINANCIAL STATEMENTS FOR THE YEARS ENDED MARCH 31, 2016 AND 2015 NOTE 14: OTHER NON-CURRENT ASSETS
Non-Current Receivables Included in the non-current receivables balance is a $152 million (2015 - $156 million) receivable for contributions in aid of the construction of the Northwest Transmission Line (NTL). The contributions will be received in annual payments of approximately $11 million, adjusted for inflation. The fair value of the receivable was initially measured using an estimated inflation rate and a 4.6 per cent discount rate. The current portion of the NTL receivable is $11 million (2015 - $10 million) and has been recorded within accounts receivable and accrued revenue. Included in the non-current receivables balance is an $8 million receivable from certain mining customers. In February 2016, the Province of British Columbia issued a direction to the BCUC to establish the Mining Customer Payment Plan, which allows the operators of applicable B.C. mines to defer payment of a portion of electricity purchases for a period of up to five years. The direction also allows BC Hydro to establish a regulatory account in which BC Hydro would transfer the impact of any defaults on these deferred payments to allow recovery in future rates. Sinking Funds Investments held in sinking funds are held by the Trustee (the Minister of Finance for the Province) for the redemption of long-term debt. The sinking fund balances at the statement of financial position date are accounted for as held to maturity, and include the following investments:
Effective December 2005, all sinking fund payment requirements on all new and outstanding debt were removed.
(in millions) 2016 2015Non-current receivables 171$ 156$ Sinking funds 167 155 Other 79 -
417$ 311$
(in millions) 2015
Province of BC bonds 107$ 2.9 % 100$ 3.0 %Other provincial government and crown corporation bonds 60 3.1 % 55 3.1 %
167$ 155$ 1 Rate calculated on market yield to maturity.
Weighted Average
Effective Rate1
2016Weighted Average
Effective Rate1Carrying
ValueCarrying
Value
2015/16 Annual Service Plan Report 63

British Columbia Hydro and Power Authority NOTES TO THE CONSOLIDATED FINANCIAL STATEMENTS FOR THE YEARS ENDED MARCH 31, 2016 AND 2015 NOTE 15: ACCOUNTS PAYABLE AND ACCRUED LIABILITIES
NOTE 16: LONG-TERM DEBT AND DEBT MANAGEMENT The Company’s long-term debt comprises bonds and revolving borrowings obtained under an agreement with the Province. The Company has a commercial paper borrowing program with the Province which is limited to $4,500 million, and is included in revolving borrowings. At March 31, 2016, the outstanding amount under the borrowing program was $2,376 million (2015 - $3,547 million). During fiscal 2016, the Company issued bonds with a par value of $2,691 million (2015 – $1,665 million) a weighted average effective interest rate of 2.5 per cent (2015 – 3.4 per cent) and a weighted average term to maturity of 20.2 years (2015 – 26.4 years).
(in millions) 2016 2015Accounts payable 265$ 294$ Accrued liabilities 1,031 945 Current portion of other long-term liabilities (Note 20) 122 129 Dividend payable (Note 17) 326 264 Other 72 76
1,816$ 1,708$
2015/16 Annual Service Plan Report 64

British Columbia Hydro and Power Authority NOTES TO THE CONSOLIDATED FINANCIAL STATEMENTS FOR THE YEARS ENDED MARCH 31, 2016 AND 2015 Long-term debt, expressed in Canadian dollars, is summarized in the following table by year of maturity:
(in millions) 2016
Canadian US Euro Total
Weighted Average Interest Rate1 Canadian US Total
Weighted Average Interest Rate1
Maturing in fiscal:2016 -$ -$ -$ -$ - 150$ -$ 150$ 5.2 2017 - - - - - - - - - 2018 40 - - 40 4.8 40 - 40 4.8 2019 1,030 259 - 1,289 4.4 1,030 254 1,284 4.6 2020 175 - - 175 5.3 175 - 175 5.3 2021 1,100 - - 1,100 7.5 - - - -
1-5 years 2,345 259 - 2,604 5.8 1,395 254 1,649 4.7 6-10 years 2,136 649 390 3,175 4.9 2,336 - 2,336 7.3 11-15 years 1,000 - - 1,000 3.7 800 634 1,434 5.2 16-20 years 1,110 - - 1,110 5.0 1,110 - 1,110 5.0 21-25 years 1,250 389 - 1,639 5.5 - 380 380 7.4 26-30 years 4,588 - - 4,588 3.9 5,838 - 5,838 4.1 Over 30 years 1,730 - - 1,730 3.5 530 - 530 4.4 Bonds 14,159 1,297 390 15,846 4.6 12,009 1,268 13,277 5.0 Revolving borrowings 1,605 771 - 2,376 0.6 2,623 924 3,547 0.7
15,764 2,068 390 18,222 14,632 2,192 16,824 Adjustments to carrying value resulting from hedge accounting 23 24 - 47 27 25 52 Unamortized premium, discount, and issue costs (39) (12) (5) (56) 13 (13) -
15,748 2,080 385 18,213 14,672 2,204 16,876 Less: Current portion (1,605) (771) - (2,376) (2,774) (924) (3,698)
Long-term debt 14,143$ 1,309$ 385$ 15,837$ 11,898$ 1,280$ 13,178$
1 The weighted average interest rate represents the effective rate of interest on fixed-rate bonds.
2015
2015/16 Annual Service Plan Report 65

British Columbia Hydro and Power Authority NOTES TO THE CONSOLIDATED FINANCIAL STATEMENTS FOR THE YEARS ENDED MARCH 31, 2016 AND 2015 The following foreign currency contracts were in place at March 31, 2016 in a net asset position of $18 million (2015 – asset of $76 million). Such contracts are primarily used to hedge foreign currency long-term debt principal and U.S. commercial paper borrowings.
For more information about the Company’s exposure to interest rate, foreign currency and liquidity risk, see Note 19. NOTE 17: CAPITAL MANAGEMENT Orders in Council from the Province establish the basis for determining the Company’s equity for regulatory purposes, as well as the annual Payment to the Province (see below). Capital requirements are consequently managed through the retention of equity subsequent to the Payment to the Province and a limit on the Payment to the Province if it would cause the debt to equity ratio to exceed 80:20. The Company monitors its capital structure on the basis of its debt to equity ratio. For this purpose, the applicable Order in Council defines debt as revolving borrowings and interest-bearing borrowings less investments held in sinking funds and cash and cash equivalents. Equity comprises retained earnings, accumulated other comprehensive income and contributed surplus. During the period, there were no changes in the approach to capital management.
(in millions) 2016 2015Cross- Currency Swaps
Euro dollar to Canadian dollar - notional amount1 264€ -€ Euro dollar to Canadian dollar - weighted average contract rate 1.48 - Weighted remaining term 10 years -
Foreign Currency ForwardsUnited States dollar to Canadian dollar - notional amount1 US$ 1,450 US$ 1,542United States dollar to Canadian dollar - weighted average contract rate 1.28 1.22 Weighted remaining term 6 years 6 years
1 Notional amount for a derivative instrument is defined as the contractual amount on which payments are calculated.
2015/16 Annual Service Plan Report 66

British Columbia Hydro and Power Authority NOTES TO THE CONSOLIDATED FINANCIAL STATEMENTS FOR THE YEARS ENDED MARCH 31, 2016 AND 2015 The debt to equity ratio at March 31, 2016, and March 31, 2015 was as follows:
Payment to the Province The Company is required to make an annual Payment to the Province (the Payment) on or before June 30 of each year. The Payment is equal to 85 per cent of the Company’s net income for the most recently completed fiscal year unless the debt to equity ratio, as defined by the Province, after deducting the Payment, is greater than 80:20. If the Payment would result in a debt to equity ratio exceeding 80:20, then the Payment is the greatest amount that can be paid without causing the debt to equity ratio to exceed 80:20. The Payment accrued at March 31, 2016 is $326 million (March 31, 2015 - $264 million), which is included in accounts payable and accrued liabilities and is less than 85 per cent of the net income due to the 80:20 cap. NOTE 18: EMPLOYEE BENEFITS – POST-EMPLOYMENT BENEFIT PLANS The Company provides a defined benefit statutory pension plan to substantially all employees, as well as supplemental arrangements which provide pension benefits in excess of statutory limits. Pension benefits are based on years of membership service and highest five-year average pensionable earnings. The plan also provides pensioners a conditional indexing fund. Employees make basic and indexing contributions to the plan funds based on a percentage of current pensionable earnings. The Company contributes amounts as prescribed by the independent actuary. The Company is responsible for ensuring that the statutory pension plan has sufficient assets to pay the pension benefits upon retirement of employees. The supplemental arrangements are unfunded. The most recent actuarial funding valuation for the statutory pension plan was performed at December 31, 2012. The next valuation for funding purposes is being prepared as at December 31, 2015, and the results will be available in September 2016. The Company also provides post-employment benefits other than pensions including limited medical, extended health, dental and life insurance coverage for retirees who have at least 10 years of service and qualify to receive pension benefits. Certain benefits, including the short-term continuation of health care and life insurance, are provided to terminated employees or to survivors on the death of an employee. These post-employment benefits other than pensions are not funded. Post-employment benefits include the pay out of benefits that vest or accumulate, such as banked vacation.
(in millions) 2016 2015Total debt, net of sinking funds 18,046$ 16,721$ Less: Cash and cash equivalents (44) (39) Net Debt 18,002$ 16,682$
Retained earnings 4,397$ 4,068$ Contributed surplus 60 60 Accumulated other comprehensive income 43 42 Total Equity 4,500$ 4,170$ Net Debt to Equity Ratio 80 : 20 80 : 20
2015/16 Annual Service Plan Report 67

British Columbia Hydro and Power Authority NOTES TO THE CONSOLIDATED FINANCIAL STATEMENTS FOR THE YEARS ENDED MARCH 31, 2016 AND 2015 Information about the pension benefit plans and post-employment benefits other than pensions is as follows: (a) The expense for the Company’s benefit plans for the years ended at March 31, 2016 and 2015 is
recognized in the following line items in the statement of comprehensive income prior to any capitalization of employment costs attributable to property, plant and equipment and intangible asset additions and prior to the application of regulatory accounting:
Actuarial gains and losses recognized in other comprehensive income are $nil (2015 – $nil). As per Note 13, in accordance with Prescribed Standards and as approved by the BCUC, actuarial gains and losses, as summarized in Note 18(c) below, are deferred to the Non-Current Pension Cost regulatory account.
(b) Information about the Company’s defined benefit plans at March 31, in aggregate, is as follows:
The Company determined that there was no minimum funding requirement adjustment required in fiscal 2016 and fiscal 2015 in accordance with IFRIC 14, The Limit on Defined Benefit Asset, Minimum Funding Requirements and Their Interaction.
(in millions) 2016 2015 2016 2015Current service costs charged to personnel operating costs 97$ 77$ 16$ 13$ Net interest costs charged to finance costs 40 38 17 17 Total post-employment benefit plan expense 137$ 115$ 33$ 30$
Benefit PlansPension Other
Benefit Plans
(in millions) 2016 2015 2016 2015Defined benefit obligation of funded plans (4,228)$ (4,202)$ -$ -$ Defined benefit obligation of unfunded plans (157) (155) (441) (432) Fair value of plan assets 3,169 3,291 - - Plan deficit (1,216)$ (1,066)$ (441)$ (432)$
Benefits Plans Benefits PlansPension Other
2015/16 Annual Service Plan Report 68

British Columbia Hydro and Power Authority NOTES TO THE CONSOLIDATED FINANCIAL STATEMENTS FOR THE YEARS ENDED MARCH 31, 2016 AND 2015 (c) Movement of defined benefit obligations and defined benefit plan assets during the year:
(in millions) 2016 2015 2016 2015Defined benefit obligationOpening defined benefit obligation 4,357$ 3,784$ 432$ 374$ Current service cost 97 77 16 13
Interest cost on benefit obligations 115 230 17 17 Benefits paid1 (171) (175) (12) (12) Employee contributions 28 27 - - Actuarial (gains) losses2 (41) 414 (12) 40
Defined benefit obligation, end of year 4,385 4,357 441 432
Fair value of plan assetsOpening fair value 3,291 2,985 n/a n/a Interest income on plan assets3 74 192 n/a n/a
Employer contributions 66 66 n/a n/aEmployee contributions 28 27 n/a n/aBenefits paid1 (165) (169) n/a n/aActuarial (losses) gains2,3 (125) 190 n/a n/a
Fair value of plan assets, end of year 3,169 3,291 - - Accrued benefit liability (1,216)$ (1,066)$ (441)$ (432)$ 1 Benefits paid under Pension Benefit Plans include $13 million (2015 - $20 million) of settlement payments.2
3
PensionBenefit Plans
OtherBenefit Plans
Actual loss on defined benefit plan assets for the year ended March 31, 2016 was $51 million (2015 - $382 million income).
Actuarial gains/losses are included in the Non-Current Pension Cost regulatory account and for fiscal 2016 are comprised of $125 million of experience losses on return of plan assets and $53 million of net experience gains on the benefit obligations due to discount rate changes and experience gains, partially offset by a change in the mortality assumption incorporating future mortality improvement.
2015/16 Annual Service Plan Report 69

British Columbia Hydro and Power Authority NOTES TO THE CONSOLIDATED FINANCIAL STATEMENTS FOR THE YEARS ENDED MARCH 31, 2016 AND 2015 (d) The significant assumptions adopted in measuring the Company’s accrued benefit obligations as at
each March 31 year end are as follows:
The valuation cost method for the accrued benefit obligation is the projected accrued benefit pro-rated on service.
(e) Asset allocation of the defined benefit statutory pension plan as at the measurement date:
Plan assets are re-balanced within ranges around target applications. The Company’s expected return on plan assets is determined by considering long-term historical returns, future estimates of long-term investment returns and asset allocations.
(f) Other information about the Company’s benefit plans is as follows:
The Company’s contribution to be paid to its funded defined benefit plan in fiscal 2017 is expected to amount to $57 million. The expected benefit payment to be paid in fiscal 2017 in respect to the unfunded defined benefit plan is $19 million.
2016 2015 2016 2015Discount rate
Benefit cost 3.51% 4.37% 3.79% 4.59%Accrued benefit obligation 3.81% 3.51% 3.72% 3.79%
Rate of return on plan assets 3.51% 4.37% n/a n/aRate of compensation increase
Benefit cost 3.35% 3.35% n/a n/aAccrued benefit obligation 3.35% 3.35% n/a n/a
Health care cost trend ratesWeighted average health care cost trend rate n/a n/a 5.10% 5.47%Weighted average ultimate health care cost trend rate n/a n/a 4.29% 4.39%Year ultimate health care cost trend rate will be achieved n/a n/a 2026 2026
PensionBenefit Plans
OtherBenefit Plans
Target Allocation Min Max 2016 2015Equities 57% 41% 76% 60% 62%Fixed interest investments 29% 19% 39% 30% 28%Real estate 10% 5% 15% 8% 9%Infrastructure 4% 0% 10% 2% 1%
Target Range
2015/16 Annual Service Plan Report 70

British Columbia Hydro and Power Authority NOTES TO THE CONSOLIDATED FINANCIAL STATEMENTS FOR THE YEARS ENDED MARCH 31, 2016 AND 2015
Assumed healthcare cost trend rates have a significant effect on the amounts recognized in net income. A one percentage point change in assumed healthcare cost trend rates would have the following effects:
The impact on the defined benefit obligation for the Pension Benefit Plans of changing certain of the major assumptions is as follows:
NOTE 19: FINANCIAL INSTRUMENTS FINANCIAL RISKS The Company is exposed to a number of financial risks in the normal course of its business operations, including market risks resulting from fluctuations in commodity prices, interest rates and foreign currency exchange rates, as well as credit risks and liquidity risks. The nature of the financial risks and the Company’s strategy for managing these risks has not changed significantly from the prior period. The following discussion is limited to the nature and extent of risks arising from financial instruments, as defined under IFRS 7, Financial Instruments: Disclosures. However, for a complete understanding of the nature and extent of financial risks the Company is exposed to, this note should be read in conjunction with the Company’s discussion of Risk Management found in the Management’s Discussion and Analysis section of the 2016 Annual Service Plan Report.
(a) Credit Risk Credit risk refers to the risk that one party to a financial instrument will cause a financial loss for a counterparty by failing to discharge an obligation. The Company is exposed to credit risk related to cash and cash equivalents, restricted cash, sinking fund investments, and derivative instruments. It is also exposed to credit risk related to accounts receivable arising from its day-to-day electricity and natural gas sales in and outside British Columbia. Maximum credit risk with respect to financial assets is limited to the carrying amount presented on the statement of financial position with the exception of U.S. dollar sinking funds classified as held-to-maturity and carried on the statement of financial position at amortized cost of $167 million. The maximum credit risk exposure for these U.S. dollar
(in millions) 2016Effect on current service costs 4$ $ (3)Effect on defined benefit obligation 57 (46)
point increase point decreaseOne percentage
2016
One percentage
2016
($ in millions)
Increase/ decrease in assumption
Effect on accrued benefit
obligation
Effect on current
service costsDiscount rate 1% increase $ -463 $ -24Discount rate 1% decrease + 531 + 29Longevity 1 year +/- 134 +/- 3
2015/16 Annual Service Plan Report 71

British Columbia Hydro and Power Authority NOTES TO THE CONSOLIDATED FINANCIAL STATEMENTS FOR THE YEARS ENDED MARCH 31, 2016 AND 2015
sinking funds as at March 31, 2016 is its fair value of $194 million. The Company manages this risk through Board-approved credit risk management policies which contain limits and procedures related to the selection of counterparties. Exposures to credit risks are monitored on a regular basis. In addition, the Company has credit loss insurance that covers most credit exposures with U.S. counterparties or transactions delivered in the U.S.
(b) Liquidity Risk Liquidity risk refers to the risk that the Company will encounter difficulty in meeting obligations associated with financial liabilities. The Company manages liquidity risk by forecasting cash flows to identify financing requirements and by maintaining a commercial paper borrowing program under an agreement with the Province (Note 16 – Long-Term Debt and Debt Management). The Company’s long-term debt comprises bonds and revolving borrowings obtained under an agreement with the Province. Cash from operations reduces the Company’s liquidity risk. The Company does not believe that it will encounter difficulty in meeting its obligations associated with financial liabilities.
(c) Market Risks
Market risk refers to the risk that the fair value or future cash flows of a financial instrument will fluctuate because of changes in market prices. Market risk comprises three types of risk: currency risk, interest rate risk, and price risk, such as changes in commodity prices and equity values. The Company monitors its exposure to market fluctuations and may use derivative contracts to manage these risks, as it considers appropriate. Other than in its energy trading subsidiary Powerex, the Company does not use derivative contracts for trading or speculative purposes. (i) Currency Risk
Currency risk refers to the risk that the fair value or future cash flows of a financial instrument will fluctuate because of changes in foreign exchange rates. The Company’s currency risk is primarily with the U.S. dollar. The majority of the Company’s currency risk arises from long-term debt in the form of U.S. dollar denominated bonds. During the year, the Company issued a European currency denominated bond and simultaneously entered into a cross currency swap hedging the principal and interest payments of the bond against movements in the Euro, thereby effectively converting it into a Canadian bond. Energy commodity prices are also subject to currency risk as they are primarily denominated in U.S. dollars. As a result, the Company’s trade revenues and purchases of energy commodities, such as electricity and natural gas, and associated accounts receivable and accounts payable, are affected by the Canadian/U.S. dollar exchange rate. In addition, all commodity derivatives and contracts priced in U.S. dollars are also affected by the Canadian/U.S. dollar exchange rate. The Company actively manages its currency risk through a number of Board-approved policy documents. The Company uses cross-currency swaps and forward foreign exchange purchase contracts to achieve and maintain the Board-approved U.S. dollar exposure targets.
(ii) Interest Rate Risk Interest rate risk refers to the risk that the fair value or future cash flows of a financial instrument
2015/16 Annual Service Plan Report 72

British Columbia Hydro and Power Authority NOTES TO THE CONSOLIDATED FINANCIAL STATEMENTS FOR THE YEARS ENDED MARCH 31, 2016 AND 2015
will fluctuate because of changes in market interest rates. The Company is exposed to changes in interest rates primarily through its variable rate debt and the active management of its debt portfolio including its related sinking fund assets and temporary investments. The Company’s Board-approved debt management strategies include maintaining a percentage of variable interest rate debt within a certain range. The Company may enter into interest rate swaps to achieve and maintain the target range of variable interest rate debt.
(iii) Commodity Price Risk The Company is exposed to commodity price risk as fluctuations in electricity prices and natural gas prices could have a materially adverse effect on its financial condition. Prices for electricity and natural gas fluctuate in response to changes in supply and demand, market uncertainty, and other factors beyond the Company’s control.
The Company enters into derivative contracts to manage commodity price risk. Risk management strategies, policies and limits are designed to ensure the Company’s risks and related exposures are aligned with the Company’s business objectives and risk tolerance. Risks are managed within defined limits that are regularly reviewed by the Board of Directors.
Categories of Financial Instruments Finance charges, including interest income and expenses, for financial instruments disclosed in the following note, are prior to the application of regulatory accounting for the years ended March 31, 2016 and 2015.
2015/16 Annual Service Plan Report 73

British Columbia Hydro and Power Authority NOTES TO THE CONSOLIDATED FINANCIAL STATEMENTS FOR THE YEARS ENDED MARCH 31, 2016 AND 2015 The following table provides a comparison of carrying values and fair values for non-derivative financial instruments as at March 31, 2016 and 2015. The non-derivative financial instruments, where carrying value differs from fair value, would be classified as Level 2 of the fair value hierarchy.
The carrying value of cash equivalents, loans and receivables, and accounts payable and accrued liabilities approximates fair value due to the short duration of these financial instruments. The fair value of derivative instruments designated and not designated as hedges, was as follows:
The carrying value of derivative instruments designated and not designated as hedges was the same as the fair value.
2016 2015
(in millions)Carrying
ValueFair
ValueCarrying
ValueFair
Value
Interest Income (Expense) recognized in Finance Charges
Interest Income (Expense) recognized in Finance Charges
Financial Assets and Liabilities at Fair Value Through Profit or Loss:Cash equivalents - short-term investments $ 11 $ 11 $ 11 $ 11 $ 1 $ 1
Loans and Receivables:Accounts receivable and accrued revenue 669 669 627 627 - - Non-current receivables 171 171 156 162 7 5 Cash 33 33 28 28 - -
Held to Maturity:Sinking funds – US 167 194 155 184 8 7
Other Financial Liabilities:Accounts payable and accrued liabilities (1,816) (1,816) (1,708) (1,708) - - Revolving borrowings - CAD (1,605) (1,605) (2,623) (2,623) (14) (33)Revolving borrowings - US (771) (771) (924) (924) (2) - Long-term debt (including current portion due in one year)
(15,837) (18,684) (13,329) (16,799) (701) (638)
First Nations liabilities (non-current portion) (378) (547) (391) (758) (17) (9)Finance lease obligations (non-current portion) (219) (219) (240) (240) (21) (23)Other liabilities (147) (153) (81) (86) - -
20152016
2016 2015
(in millions)Fair
ValueFair
ValueDerivative Instruments Used to Hedge Risk Associated with Long-term Debt:Foreign currency contracts (cash flow hedges for $US denominated long-term debt) $ 57 $ 45 Foreign currency contracts (cash flow hedges for €Euro denominated long-term debt) (5) -
52 45 Non-Designated Derivative Instruments:Foreign currency contracts (34) 31 Commodity derivatives 41 50
7 81 Net asset 59$ $ 126
2015/16 Annual Service Plan Report 74

British Columbia Hydro and Power Authority NOTES TO THE CONSOLIDATED FINANCIAL STATEMENTS FOR THE YEARS ENDED MARCH 31, 2016 AND 2015 The derivatives are represented on the statement of financial position as follows:
For designated cash flow hedges for the year ended March 31, 2016, a gain of $12 million (2015 - $81 million gain) was recognized in other comprehensive income. For the year ended March 31, 2016, $21 million (2015 - $127 million) was removed from other comprehensive income and reported in net income, offsetting foreign exchange losses (2015 – losses) recorded in the year. For derivative instruments not designated as hedges, a gain of $2 million (2015 - $8 million gain) was recognized in finance charges for the year ended March 31, 2016 with respect to foreign currency contracts for cash management purposes. For the year ended March 31, 2016, a gain of $58 million (2015 - $22 million gain) was recognized in finance charges with respect to foreign currency contracts for U.S. short-term borrowings. These economic hedges offset $61 million of foreign exchange revaluation losses (2015 - $24 million loss) recorded with respect to U.S. short-term borrowings for the year ended March 31, 2016. A net gain of $9 million (2015 - $76 million gain) was recorded in trade revenue for the year ended March 31, 2016 with respect to commodity derivatives. Inception Gains and Losses Changes in deferred inception gains and losses are as follows:
CREDIT RISK Domestic Electricity Receivables A customer application and a credit check are required prior to initiation of services. For customers with no BC Hydro credit history, call center agents ensure accounts are secured either by a credit bureau check, a cash security deposit, or a credit reference letter.
(in millions) 2016 2015Current portion of derivative financial instrument assets $ 137 $ 152 Current portion of derivative financial instrument liabilities (143) (85)
Derivative financial instrument assets, non-current 92 97 Derivative financial instrument liabilities, non-current (27) (38)Net asset $ 59 $ 126
(in millions) 2016 2015Deferred inception loss, beginning of the year $ 70 $ 50 New transactions (14) 22 Amortization (8) (2)Deferred inception loss, end of the year $ 48 $ 70
2015/16 Annual Service Plan Report 75

British Columbia Hydro and Power Authority NOTES TO THE CONSOLIDATED FINANCIAL STATEMENTS FOR THE YEARS ENDED MARCH 31, 2016 AND 2015 The value of domestic and trade accounts receivable, by age and the related provision for doubtful accounts are presented in the following table. Domestic and Trade Accounts Receivable Net of Allowance for Doubtful Accounts
At the end of each reporting year, a review of the provision for doubtful accounts is performed. It is an assessment of the potential amount of domestic and trade accounts receivable which will not be paid by customers after the statement of financial position date. The assessment is made by reference to age, status and risk of each receivable, current economic conditions, and historical information.
Financial Assets Arising from the Company’s Trading Activities A substantial majority of the Company’s counterparties associated with its trading activities are in the energy sector. This industry concentration has the potential to impact the Company’s overall exposure to credit risk in that the counterparties may be similarly affected by changes in economic, regulatory, political, and other factors. The Company manages credit risk by authorizing trading transactions within the guidelines of the Company’s risk management policies, by monitoring the credit risk exposure and credit standing of counterparties on a regular basis, and by obtaining credit assurances from counterparties to which they are entitled under contract. The Company enters into derivative transactions under International Swaps and Derivatives Association (ISDA) and Western Systems Power Pool (WSPP) or similar master netting agreements and presents these transactions on a gross basis under derivative commodity assets/liabilities in the statement of financial position. These master netting agreements do not meet the criteria for offsetting as the Company does not have the legally enforceable right to offset recognized amounts. The right to offset is enforceable only on the occurrence of future events such as a credit default. Under the Company’s trading agreements, the amounts owed by each counterparty that are due on a single day in respect of all transactions outstanding in the same currency under the same agreement are aggregated into a single net amount being payable by one party to the other. Such receivable or payable amounts meet the criteria for offsetting and are presented as such on the Company’s statement of financial position.
(in millions) 2016 2015Current 362$ 381$ Past due (30-59 days) 27 26 Past due (60-89 days) 6 6 Past due (More than 90 days) 3 6
398 419 Allowance for doubtful accounts (8) (8) Total 390$ 411$
2015/16 Annual Service Plan Report 76

British Columbia Hydro and Power Authority NOTES TO THE CONSOLIDATED FINANCIAL STATEMENTS FOR THE YEARS ENDED MARCH 31, 2016 AND 2015 The following table sets out the carrying amounts of recognized financial instruments that are subject to the above agreements:
With respect to these financial assets, the Company assigns credit limits for counterparties based on evaluations of their financial condition, net worth, regulatory environment, cost recovery mechanisms, credit ratings, and other credit criteria as deemed appropriate. Credit limits and credit quality are monitored periodically and a detailed credit analysis is performed at least annually. Further, the Company has tied a portion of its contracts to master agreements that require security in the form of cash or letters of credit if current net receivables and replacement cost exposure exceed contractually specified limits. The following table outlines the distribution, by credit rating, of financial assets associated with our trading activities that are neither past due nor impaired:
(in millions)
Gross Derivative Instruments Presented in Statement of
Financial Position
Related Instruments That Are
Not Offset Net AmountDerivative commodity assets $ 165 $ 5 $ 160 Derivative commodity liabilities 124 5 119
2016
(in millions)
Gross Derivative Instruments Presented in Statement of
Financial Position
Related Instruments
That Are Not Offset Net Amount
Derivative commodity assets $ 165 $ 1 $ 164 Derivative commodity liabilities 115 1 114
2015
Investment Grade Unrated Non-Investment Grade TotalAs at March 31, 2016 % % % %Accounts receivable 92 2 6 100Assets from trading activities 100 0 0 100
Investment Grade Unrated Non-Investment Grade TotalAs at March 31, 2015 % % % %Accounts receivable 86 1 13 100Assets from trading activities 100 0 0 100
2015/16 Annual Service Plan Report 77

British Columbia Hydro and Power Authority NOTES TO THE CONSOLIDATED FINANCIAL STATEMENTS FOR THE YEARS ENDED MARCH 31, 2016 AND 2015 LIQUIDITY RISK The following table details the remaining contractual maturities at March 31, 2016 of the Company’s non-derivative financial liabilities and derivative financial liabilities, which are based on contractual undiscounted cash flows. Interest payments have been computed using contractual rates or, if floating, based on rates current at March 31, 2016. In respect of the cash flows in foreign currencies, the exchange rate as at March 31, 2016 has been used.
2015/16 Annual Service Plan Report 78

British Columbia Hydro and Power Authority NOTES TO THE CONSOLIDATED FINANCIAL STATEMENTS FOR THE YEARS ENDED MARCH 31, 2016 AND 2015
1 The Company believes that the liquidity risk associated with commodity derivative financial liabilities needs to be considered in conjunction with the profile of payments or receipts arising from commodity derivative financial assets. It should be noted that cash flows associated with future energy sales and commodity contracts which are not considered financial instruments under IAS 39 are not included in this analysis, which is prepared in accordance with IFRS 7.
Carrying Value
Fiscal 2017
Fiscal 2018
Fiscal 2019
Fiscal 2020
Fiscal 2021
Fiscal 2022
(in millions)and
thereafterNon-Derivative Financial LiabilitiesTotal accounts payable and other payables 1,573$ (1,573)$ -$ -$ -$ -$ -$
(excluding interest accruals and current portion of lease obligations and other long-term liabilities)
Long-term debt 18,404 (3,109) (769) (2,007) (838) (1,726) (21,708) (including interest payments)
Lease obligations 240 (40) (40) (21) (21) (21) (312) Other long-term liabilities 556 (15) (12) (41) (31) (31) (1,551) Total Non-Derivative Financial Liabilities 20,773 (4,737) (821) (2,069) (890) (1,778) (23,571) Derivative Financial Liabilities
5 Cash outflow (10) (10) (10) (10) (10) (439) Cash inflow 3 3 3 3 3 407
used for hedging 5 Cash outflow - - - - - (337) Cash inflow - - - - - 337
designated at fair value 36 Cash outflow (847) (21) - - - - Cash inflow 811 21 - - - -
104 (95) (12) (2) - - - Physically settled commodity derivative
20 (30) 2 - - - - Total Derivative Financial Liabilities 170 (168) (17) (9) (7) (7) (32) Total Financial Liabilities 20,943 (4,905) (838) (2,078) (897) (1,785) (23,603) Derivative Financial Assets
used for hedging (62) Cash outflow - - (204) - - (382) Cash inflow - - 259 - - 406
(2) Cash outflow (44) - - - - - Cash inflow 46 - - - - -
(90) 68 6 2 - - - Physically settled commodity derivative
(75) 182 30 8 4 - - Total Derivative Financial Assets (229) 252 36 65 4 - 24 Net Financial Liabilities1 20,714$ (4,653)$ (802)$ (2,013)$ (893)$ (1,785)$ (23,579)$
Forward foreign exchange contracts
Cross currency swaps used for hedging
liabilities designated at fair value
Other forward foreign exchange contracts
Financially settled commodity derivative
liabilities designated at fair value
liabilities designated at fair value
Other forward foreign exchange contracts
liabilities designated at fair value
designated at fair value
Forward foreign exchange contracts
Financially settled commodity derivative
2015/16 Annual Service Plan Report 79

British Columbia Hydro and Power Authority NOTES TO THE CONSOLIDATED FINANCIAL STATEMENTS FOR THE YEARS ENDED MARCH 31, 2016 AND 2015 MARKET RISKS
(a) Currency Risk Sensitivity Analysis A $0.01 strengthening (weakening) of the U.S. dollar against the Canadian dollar at March 31, 2016 would have a negative (positive) impact of $2 million on net income but as a result of regulatory accounting would have no impact on net income and would have an immaterial impact on other comprehensive income. The Finance Charges regulatory account that captures all variances from forecasted finance charges as described in Note 13 eliminates any impact on net income. This analysis assumes that all other variables, in particular interest rates, remain constant. This sensitivity analysis has been determined assuming that the change in foreign exchange rates had occurred at March 31, 2016 and been applied to each of the Company’s exposures to currency risk for both derivative and non-derivative financial instruments in existence at that date, and that all other variables remain constant. The stated change represents management’s assessment of reasonably possible changes in foreign exchange rates over the period until the next statement of financial position date.
(b) Interest Rate Risk Sensitivity analysis for variable rate non-derivative instruments An increase (decrease) of 100-basis points in interest rates at March 31, 2016 would have a negative (positive) impact on net income of $28 million but as a result of regulatory accounting would have no impact on net income and would have an immaterial impact on other comprehensive income. The Finance Charges regulatory account that captures all variances from forecasted finance charges as described in Note 13 eliminates any impact on net income. This analysis assumes that all other variables, in particular foreign exchange rates, remain constant. This sensitivity analysis has been determined assuming that the change in interest rates had occurred at March 31, 2016 and been applied to each of the Company’s exposure to interest rate risk for non-derivative financial instruments in existence at that date, and that all other variables remain constant. The stated change represents management’s assessment of reasonably possible changes in interest rates over the period until the next statement of financial position date.
(c) Commodity Price Risk Sensitivity Analysis Commodity price risk refers to the risk that the fair value or future cash flows of a financial instrument will fluctuate due to changes in commodity prices. BC Hydro’s subsidiary Powerex trades and delivers energy and associated products and services throughout North America. As a result, the Company has exposure to movements in prices for commodities Powerex trades, including electricity, natural gas and associated derivative products. Prices for electricity and natural gas commodities fluctuate in response to changes in supply and demand, market uncertainty, and other factors beyond the Company’s control. The Company manages these exposures through its Board-approved risk management policies, which limit components of and overall market risk exposures, pre-define approved products and mandate
2015/16 Annual Service Plan Report 80

British Columbia Hydro and Power Authority NOTES TO THE CONSOLIDATED FINANCIAL STATEMENTS FOR THE YEARS ENDED MARCH 31, 2016 AND 2015
regular reporting of exposures. The Company’s Risk Management Policy for trading activities defines various limits and controls, including Value at Risk (VaR) limits, mark-to-market limits, and various transaction specific limits which are monitored on a daily basis. VaR estimates the pre-tax forward trading loss that could result from changes in commodity prices, with a specific level of confidence, over a specific time period. Powerex uses an industry standard Monte Carlo VaR model to determine the potential change in value of its forward trading portfolio over a 10-day holding period, within a 95 per cent confidence level, resulting from normal market fluctuations. VaR as an estimate of price risk has several limitations. The VaR model uses historical information to determine potential future volatility and correlation, assuming that price movements in the recent past are indicative of near-future price movements. It cannot forecast unusual events which can lead to extreme price movements. In addition, it is sometimes difficult to appropriately estimate VaR associated with illiquid or non-standard products. As a result, Powerex uses additional measures to supplement the use of VaR to estimate price risk. These include the use of a Historic VaR methodology, stress tests and notional limits for illiquid or emerging products. Powerex’s VaR, calculated under this methodology, was approximately $10 million at March 31, 2016 (2015 - $5 million).
Fair Value Hierarchy The following provides an analysis of financial instruments that are measured subsequent to initial recognition at fair value, grouped based on the lowest level of input that is significant to that fair value measurement. The inputs used in determining fair value are characterized by using a hierarchy that prioritizes inputs based on the degree to which they are observable. The three levels of the fair value hierarchy are as follows:
• Level 1 - values are quoted prices (unadjusted) in active markets for identical assets and liabilities.
• Level 2 - inputs are those other than quoted prices included within Level 1 that are observable for the asset or liability, either directly or indirectly, as of the reporting date.
• Level 3 - inputs are those that are not based on observable market data.
2015/16 Annual Service Plan Report 81

British Columbia Hydro and Power Authority NOTES TO THE CONSOLIDATED FINANCIAL STATEMENTS FOR THE YEARS ENDED MARCH 31, 2016 AND 2015 The following tables present the financial instruments measured at fair value for each hierarchy level as at March 31, 2016 and 2015:
The Company determines Level 2 fair values for debt securities and derivatives using discounted cash flow techniques, which use contractual cash flows and market-related discount rates. Level 2 fair values for energy derivatives are determined using inputs other than unadjusted quoted prices that are observable for the asset or liability, either directly (i.e. as prices) or indirectly (i.e. derived from prices). Level 2 includes bilateral and over-the-counter contracts valued using interpolation from observable forward curves or broker quotes from active markets for similar instruments and other publicly available data, and options valued using industry-standard and accepted models incorporating only observable data inputs. For year ended March 31, 2016, energy derivatives with a carrying amount of $14 million were transferred from Level 2 to Level 1 as the Company now uses published price quotations in an active market. Powerex holds congestion products and structured power transactions that require the use of unobservable inputs when observable inputs are unavailable. Congestion products are valued using forward spreads at liquid hubs that include adjustments for the value of energy at different locations relative to the liquid hub as well as other adjustments that may impact the valuation. Option pricing models are used when the congestion product is an option. Structured power transactions are valued using standard contracts at a liquid hub with adjustments to account for the quality of the energy, the receipt or delivery location, and delivery flexibility where appropriate. Significant unobservable inputs include adjustments for the quality of the energy and the transaction location relative to the reference standard liquid hub.
As at March 31, 2016 (in millions) Level 1 Level 2 Level 3 TotalShort-term investments 11$ -$ -$ 11$ Derivatives designated as hedges - 62 - 62 Derivatives not designated as hedges 75 30 62 167 Total financial assets carried at fair value 86$ 92$ 62$ 240$ Derivatives designated as hedges -$ (10)$ -$ (10)$ Derivatives not designated as hedges (108) (46) (6) (160) Total financial liabilities carried at fair value (108)$ (56)$ (6)$ (170)$
As at March 31, 2015 (in millions) Level 1 Level 2 Level 3 TotalShort-term investments 11$ -$ -$ 11$ Derivatives designated as hedges - 53 - 53 Derivatives not designated as hedges 72 77 47 196 Total financial assets carried at fair value 83$ 130$ 47$ 260$ Derivatives designated as hedges -$ (8)$ -$ (8)$ Derivatives not designated as hedges (76) (31) (8) (115) Total financial liabilities carried at fair value (76)$ (39)$ (8)$ (123)$
2015/16 Annual Service Plan Report 82

British Columbia Hydro and Power Authority NOTES TO THE CONSOLIDATED FINANCIAL STATEMENTS FOR THE YEARS ENDED MARCH 31, 2016 AND 2015 The following table reconciles the changes in the balance of financial instruments carried at fair value on the statement of financial position, classified as Level 3, for the years ended March 31, 2016 and 2015:
Level 3 fair values for energy derivatives are determined using inputs that are based on unobservable inputs. Level 3 includes instruments valued using observable prices adjusted for unobservable basis differentials such as delivery location and product quality, instruments which are valued by extrapolation of observable market information into periods for which observable market information is not yet available, and instruments valued using internally developed or non-standard valuation models. During the year, unrealized gains of $22 million (2015 - $42 million gain) were recognized on Level 3 derivative commodity assets still on hand at year end. During the year, unrealized gains of $3 million (2015 - $8 million loss) were recognized on Level 3 derivative commodity liabilities still on hand at year end. These gains and losses are recognized in trade revenues. Methodologies and procedures regarding Powerex’s energy trading Level 3 fair value measurements are determined by Powerex’s Risk Management group. Level 3 fair values are calculated within Powerex’s Risk Management policies for trading activities based on underlying contractual data as well as observable and non-observable inputs. Development of non-observable inputs requires the use of judgment. To ensure reasonability, Level 3 fair value measurements are reviewed and validated by Powerex’s Risk Management and Finance departments on a regular basis.
(in millions)Balance at March 31, 2014 $ 43 Cumulative impact of net gain recognized 38 New transactions (3) Existing transactions settled (39) Balance at March 31, 2015 39 Cumulative impact of net gain recognized 21 New transactions (4) Balance at March 31, 2016 $ 56
2015/16 Annual Service Plan Report 83

British Columbia Hydro and Power Authority NOTES TO THE CONSOLIDATED FINANCIAL STATEMENTS FOR THE YEARS ENDED MARCH 31, 2016 AND 2015 NOTE 20: OTHER NON-CURRENT LIABILITIES
Changes in each class of provision during the financial year are set out below:
Environmental Liabilities The Company has recorded a liability for the estimated future environmental expenditures related to present or past activities of the Company. The Company’s recorded liability is based on management’s best estimate of the present value of the future expenditures expected to be required to comply with existing regulations. There are uncertainties in estimating future environmental costs due to potential external events such as changes in legislation or regulations and advances in remediation technologies. All factors used in estimating the Company’s environmental liabilities represent management’s best estimates of the present value of costs required to meet existing legislation or regulations. Estimated environmental liabilities are reviewed annually or more frequently if significant changes in regulation or other relevant factors occur. Estimate changes are accounted for prospectively. The undiscounted cash flow related to the Company’s environmental liabilities, which will be incurred between fiscal 2017 and 2045, is approximately $453 million and was determined based on current cost estimates. A range of discount rates between 0.5 to 2.1 per cent were used to calculate the net present value of the obligations.
(in millions) 2016 2015Provisions Environmental liabilities 390$ 368$ Decommissioning obligations 56 53 Other 10 27
456 448 First Nations liabilities 409 414 Finance lease obligations 240 259 Other liabilities 147 81 Deferred revenue - Skagit River Agreement 463 441
1,715 1,643 Less: Current portion, included in accounts payable and accrued liabilities (122) (129)
1,593$ 1,514$
Environmental Decommissioning Other TotalBalance at March 31, 2015 368$ 53$ 27$ 448$ Made during the period - - 4 4 Used during the period (27) (4) (21) (52) Changes in estimate 45 6 - 51 Accretion 4 1 - 5 Balance at March 31, 2016 390$ 56$ 10$ 456$
2015/16 Annual Service Plan Report 84

British Columbia Hydro and Power Authority NOTES TO THE CONSOLIDATED FINANCIAL STATEMENTS FOR THE YEARS ENDED MARCH 31, 2016 AND 2015 Decommissioning Obligations The Company’s decommissioning obligation provision consists of estimated removal and destruction costs associated with certain PCB contaminated assets and certain submarine cables. The Company has determined its best estimate of the undiscounted amount of cash flows required to settle remediation obligations at $85 million (2015 – $84 million), which will be settled between fiscal 2017 and 2054. The undiscounted cash flows are then discounted by a range of discount rates between 0.5 to 2.1 per cent were used to calculate the net present value of the obligations. The obligations are re-measured at each period end to reflect changes in estimated cash flows and discount rates. First Nations Liabilities The First Nations liabilities consist primarily of settlement costs related to agreements reached with various First Nations groups. First Nations liabilities are recorded as financial liabilities and are measured at fair value on initial recognition with future contractual cash flows being discounted at rates ranging from 4.4 per cent to 5.0 per cent. These liabilities are measured at amortized cost and not re-measured for changes in discount rates. The First Nations liabilities are non-interest bearing. Finance Lease Liabilities The finance lease obligations are related to long-term energy purchase agreements. The present value of the lease obligations were discounted at rates ranging from 7.9 per cent to 9.3 per cent with contract terms of 25 years expiring from 2018 until 2036. Finance lease liabilities are payable as follows:
Other Liabilities Other liabilities consist of a contractual obligation associated with the construction of assets. The contractual obligation has an implied interest rate of 7 per cent and a repayment term of 15 years commencing in fiscal 2019. The liability is measured at amortized cost and not re-measured for changes in discount rates.
Future minimum
lease payments Interest
Present value of
minimum lease
payments
Future minimum
lease payments Interest
Present value of minimum
lease payments
(in millions) 2016 2016 2016 2015 2015 2015Less than one year 40$ 20$ 20$ 40$ 21$ 19$ Between one and five years 103 63 40 143 83 60 More than five years 312 132 180 312 132 180 Total minimum lease payments 455$ 215$ 240$ 495$ 236$ 259$
2015/16 Annual Service Plan Report 85

British Columbia Hydro and Power Authority NOTES TO THE CONSOLIDATED FINANCIAL STATEMENTS FOR THE YEARS ENDED MARCH 31, 2016 AND 2015 NOTE 21: COMMITMENTS AND CONTINGENCIES Energy Commitments BC Hydro (excluding Powerex) has long-term energy and capacity purchase contracts to meet a portion of its expected future domestic electricity requirements. The expected obligations to purchase energy under these contracts have a total value of approximately $56,336 million of which approximately $157 million relates to the purchase of natural gas and natural gas transportation contracts. The remaining commitments are at predetermined prices. Included in the total value of the long-term energy purchase agreements is $455 million accounted for as obligations under capital leases. The total BC Hydro combined payments are estimated to be approximately $1,472 million for less than one year, $6,592 million between one and five years, and $48,272 million for more than five years and up to 55 years. Powerex has energy purchase commitments with an estimated minimum payment obligation of $1,971 million extending to 2034. The total Powerex energy purchase commitments are estimated to be approximately $446 million for less than one year, $834 million between one and five years, and $691 million for more than five years. Powerex has energy sales commitments of $602 million extending to 2026 with estimated amounts of $381 million for less than one year, $208 million between one and five years, and $13 million for more than five years. Lease and Service Agreements The Company has entered into various agreements to lease facilities or assets classified as operating leases, or support operations. The agreements cover periods of up to 70 years, and the aggregate minimum payments are approximately $755 million. Payments are $127 million for less than 1 year, $182 million between one and five years, and $446 million for more than five years. Contingencies and Guarantees
a) Facilities and Rights of Way: the Company is subject to existing and pending legal claims relating to alleged infringement and damages in the operation and use of facilities owned by the Company. These claims may be resolved unfavourably with respect to the Company and may have a significant adverse effect on the Company’s financial position. For existing claims in respect of which settlement negotiations have advanced to the extent that potential settlement amounts can reasonably be predicted, management has recorded a liability for the potential costs of those settlements. For pending claims, management believes that any loss exposure that may ultimately be incurred may differ materially from management’s current estimates. Management has not disclosed the ranges of expected outcomes due to the potentially adverse effect on the negotiation process for these claims.
b) Due to the size, complexity and nature of the Company’s operations, various other legal matters are
pending. It is not possible at this time to predict with any certainty the outcome of such litigation. Management believes that any settlements related to these matters will not have a material effect on the Company’s consolidated financial position or results of operations.
c) The Company and its subsidiaries have outstanding letters of credit totaling $1,065 million (2015 - $822 million), of which there is US $ 30 million (2015 – US $44 million).
2015/16 Annual Service Plan Report 86

British Columbia Hydro and Power Authority NOTES TO THE CONSOLIDATED FINANCIAL STATEMENTS FOR THE YEARS ENDED MARCH 31, 2016 AND 2015 NOTE 22: RELATED PARTY TRANSACTIONS Subsidiaries The principal subsidiaries of BC Hydro are Powerex, Powertech, and Columbia. All companies are wholly owned and incorporated in Canada and all ownership is in the form of common shares. Powerex is an active participant in western energy markets, buying and selling wholesale power, natural gas, ancillary services, clean and renewable power, and environmental products in Canada and the United States. Powertech offers services to solve technical problems with power equipment and systems in Canada and throughout the world. Columbia provides construction services in support of certain BC Hydro capital programs. All intercompany transactions and balances are eliminated upon consolidation. Related Parties As a Crown corporation, the Company and the Province are considered related parties. All transactions between the Company and its related parties are considered to possess commercial substance and are consequently recorded at the exchange amount, which is the amount of consideration established and agreed to by the related parties. The related party transactions are summarized below:
The Company’s debt is either held or guaranteed by the Province (see Note 16). Under an agreement with the Province, the Company indemnifies the Province for any credit losses incurred by the Province related to interest rate and foreign currency contracts entered into by the Province on the Company’s behalf. At March 31, 2016, the aggregate exposure under this indemnity totaled approximately $62 million (2015 - $74 million). The Company has not experienced any losses to date under this indemnity. The Company and British Columbia Investment Management Corporation (bcIMC) are related parties and are both wholly owned by the Province. The Company has responsibility for administration of the British Columbia Hydro and Power Authority Pension Plan and uses internal and external service providers for this purpose. It has engaged bcIMC to manage investments on behalf of the plan. bcIMC uses internal and external investment managers for this purpose. Refer to Note 18 for the Company contributions to the pension plan for 2016 and 2015.
(in millions) 2016 2015Consolidated Statement of Financial Position Accounts receivable 103$ 91$ Accounts payable and accrued liabilities 381 320
Amounts incurred/accrued during the year include: Water rental fees 327 334 Cost of energy sales 116 130 Taxes 132 125 Interest 720 674 Payment to the Province 326 264
2015/16 Annual Service Plan Report 87

British Columbia Hydro and Power Authority NOTES TO THE CONSOLIDATED FINANCIAL STATEMENTS FOR THE YEARS ENDED MARCH 31, 2016 AND 2015 Key Management Personnel and Board Compensation Key management personnel and board compensation includes compensation to the Company’s executive management team and board of directors.
(in millions) 2016 2015Short-term employee benefits 4$ 4$ Post-employment benefits 1 1
2015/16 Annual Service Plan Report 88

British Columbia Hydro and Power Authority
Capital Plan and Major Projects
Planned Projects over $50 million BC Hydro has planned for the following projects, each with capital costs expected to exceed $50 million, listed according to targeted completion date. These projects have been approved by the Board of Directors. Appendix D: Capital Project Descriptions provides further details on each $50 million project.
Major Capital Projects (Project descriptions can be found in Appendix D)
Targeted Completion Date (calendar year)
Approved Anticipated Total Cost of Project
($ millions)
Project Cost to March 31,
2016 ($ millions)
Projects Recently Put Into Service
Gordon M. Shrum Units 1 to 5 Turbine Replacement
October 2015, In-Service $185 $169
Long Beach Area Reinforcement October 2015, In-Service $38* $36
Merritt Area Transmission Project November 2015, In-Service $60* $55
Dawson Creek/Chetwynd Area Transmission Project
November 2015, In-Service $296 $281
Interior to Lower Mainland Transmission Line Project
December 2015, In-Service $743 $706
Smart Metering & Infrastructure Program**
December 2015, In-Service $780 $779
Hugh Keenleyside Spillway Gate Reliability Upgrade
December 2015, In-Service $115* $107
Upper Columbia Capacity Additions at Mica – Units 5 & 6
December 2015, In-Service $627* $575
Surrey Area Substation Project March 2016, In-Service $94 $77
*The approved anticipated total cost of the project has been reduced to the current total project forecast amount as the project is expected to come in under budget (Long Beach from $56M to $38M; Merritt from $65M to $60M; Hugh Keenleyside from $123M to $115M; and Upper Columbia from $714M to $627M). **Smart Metering & Infrastructure Program includes both capital costs and operating expenditures subject to regulatory deferral and the total authorized cost has been reduced to the total project forecast amount as the project is expected to come in under budget.
2015/16 Annual Service Plan Report 89

British Columbia Hydro and Power Authority
Major Capital Projects (Project descriptions can be found in Appendix D)
Targeted Completion Date (calendar year)
Approved Anticipated
Total Cost of Project
($ millions)
Project Cost to March 31, 2016
($ millions)
Ongoing and Planned
Big Bend Substation 2017 Targeted In-Service $67 $40
Ruskin Dam Safety and Powerhouse Upgrade
2017 Targeted In-Service $748 $418
Horne Payne Substation 2018 Targeted In-Service $93 $5
John Hart Generating Station Replacement
2019 Targeted In-Service $1,093 $441
Cheakamus Unit 1 and Unit 2 Generator Replacement
2019 Targeted In-Service
$74 $9
Fort St. John and Taylor Electric Supply
2019 Targeted In-Service $53 $ nil
Gordon M. Shrum G1-G10 Control System Upgrade
2021 Targeted In-Service $60 (Partial
Implemen-tation
Funding)
$8
Site C Clean Energy Project 2024* Targeted In-Service $8,335** $950
*Planned in-service date for all units. This timeline reflects the project’s current schedule and is subject to change based on a review of the construction schedule. **Site C total cost excludes the Project Reserve of $440 million (established by the British Columbia Government to account for events outside of BC Hydro’s control that could occur during construction) which is held by the Treasury Board.
2015/16 Annual Service Plan Report 90

British Columbia Hydro and Power Authority
Appendix A: Subsidiaries and Operating Segments Active Subsidiaries BC Hydro has created or retained a number of subsidiaries for various purposes, including holding licenses in other jurisdictions, to manage real estate holdings and to manage various risks. Powerex Corp. Powerex Corp. is a wholly-owned subsidiary of BC Hydro and a key participant in energy markets across North America, buying and supplying wholesale power, renewable and low-carbon energy and products, natural gas, ancillary services, and financial energy products. Established in 1988, its export, marketing and trade activities help optimize BC Hydro’s electric system resources and provide significant economic benefits to British Columbia. Powerex supports BC Hydro’s electric system requirements through importing and exporting energy as necessary in addition to meeting its own trade commitments. Powerex also markets, through an agreement with the Province, the Canadian Entitlement to the Downstream Benefits of the Columbia River Treaty. The Chief Executive Officer (CEO) of Powerex reports directly to the Board of Directors of Powerex. The Board of Directors, the Chair of the Powerex Board, and the Powerex CEO, ensure the Board of BC Hydro is informed of Powerex’s key strategies and business activities. The Powerex CEO also works closely with the BC Hydro CEO and Executive Team and informs the BC Hydro CEO and Executive Team of Powerex’s business activities. Powerex operates in complex and volatile energy-markets, which can cause net income in any given year to vary significantly. Market and economic conditions, reduced BC Hydro system flexibility, income timing differences and the strength of the Canadian dollar can materially impact Powerex net income. Over the previous five years, Powerex income has ranged from $61 million to $142 million (2011/12 to 2015/16). The Service Plan forecast includes annual net income from Powerex of approximately $120 million per year for 2016/17 to 2018/19. For more information, visit powerex.com. Powertech Labs Inc. Powertech Labs, operating in Surrey since its inception in 1979, is a wholly-owned subsidiary of BC Hydro. Powertech is internationally recognized as holding expertise in various fields including: research and development, testing, technical services and advanced technology services to the international energy community including BC Hydro. The Powertech Chief Executive Officer (CEO) reports to the BC Hydro Executive Vice President Transmission, Distribution and Customer Services. The Powertech Board is chaired by BC Hydro’s President and CEO and its Directors include senior Executive of BC Hydro. Over the last five years Powertech’s revenue has ranged from $26 million to $36 million (2010/11 to 2015/16) with a net income in the range of $2 million to $4 million. The Service
2015/16 Annual Service Plan Report 91

British Columbia Hydro and Power Authority
Plan forecast includes annual net income from Powertech ranging from $4 million to $6 million for 2016/17 to 2018/19. For more information, visit powertechlabs.com. Other Active Subsidiaries All the staff and management needs of the active subsidiaries below are fulfilled by BC Hydro employees, who perform these duties without additional remuneration. Three of these subsidiaries are considered active: BCHPA Captive Insurance Company Ltd. Procures insurance products and services on behalf of BC Hydro. Columbia Hydro Constructors Ltd. Administers and supplies the labour force to specified projects. Tongass Power and Light Company Provides electrical power to Hyder, Alaska from Stewart, BC, due to Hyder’s remoteness from the Alaska electrical system.
Nominee Holding Companies and/or Inactive/Dormant Subsidiaries BC Hydro’s remaining subsidiaries either serve as nominee holding companies (indicated with an *) or are considered to be inactive/dormant. The inactive/dormant subsidiaries do not carry on active operations. As of March 31, 2016, these other subsidiaries consisted of the following:
1. British Columbia Hydro International Limited 2. British Columbia Power Exchange Corporation 3. British Columbia Power Export Corporation 4. British Columbia Transmission Corporation 5. Columbia Estate Company Limited* 6. Edmonds Centre Developments Limited* 7. Fauquier Water and Sewerage Corporation* 8. Hydro Monitoring (Alberta) Inc.* 9. Victoria Gas Company Limited 10. Waneta Holdings (US) Inc.*
2015/16 Annual Service Plan Report 92

British Columbia Hydro and Power Authority
Appendix B: Additional Information Organizational Overview BC Hydro has offices in more than 100 communities throughout British Columbia and our employees operate in some of the most difficult terrain in the world. Our transmission system connects with transmission systems in Alberta and Washington State, which improves overall reliability of the system and provides opportunities for trade. Our largest offices are located in Burnaby, Cranbrook, Kamloops, Nanaimo, Prince George, Revelstoke, Surrey, Vancouver, Vernon and Victoria. Information about BC Hydro’s organization and operating environment can be found at: http://www.bchydro.com/about/accountability_reports/financial_reports/service_plan.html. Corporate Governance BC Hydro is governed by a Board of Directors that is accountable to the Minister Responsible for the implementation of government direction. The Board’s direction is implemented by management, who carries out the day-to-day operations of the Corporation under the supervision of the Chief Executive Officer. For more information on Corporate Governance, please refer to our web page at: http://www.bchydro.com/about/accountability_reports/financial_reports/service_plan.html. To support Director training and development, an orientation program is aimed at increasing their familiarity with the Corporation, our industry, and the unique responsibilities of Crown Corporation Directors, as well as equipping them with sufficient information and resources to make fully-informed decisions. The program utilizes materials and resources that inform Directors on the Corporation’s corporate governance framework, its businesses, operations, and current issues and strategies. Directors are also provided with ongoing development opportunities that educate and inform them on issues that are of strategic importance to the Corporation. These include special site visits to provide Directors with additional insight into the Corporation’s operations. To promote awareness and understanding of the standards of conduct that BC Hydro expects, the Board of Directors has approved a Code of Conduct as well as Contractor Standards for Ethical Conduct. These documents provide general guidance on standards of conduct, including guidelines on conflict of interest, as well as requirements associated with confidential information, entertainment and gifts, environment and safety, and use of BC Hydro property. The Code also allows exemptions from its requirements to be granted in extraordinary circumstances, and where it is clearly in the best interests of BC Hydro to do so. This is supplemented by guidance available from BC Hydro’s Ethics Officer, as well as an independent Code Advisor for Directors and senior members of the executive. Contact Information See Page 2 for full contact information. More information on BC Hydro can be found at www.bchydro.com.
2015/16 Annual Service Plan Report 93

British Columbia Hydro and Power Authority
Appendix C: Crown Corporations Mandate and Actions Summary In the 2015/16 Government Mandate Letter, BC Hydro received direction on strategic priorities for the 2015/16 fiscal year. These priorities and the Crown Corporation’s resulting actions are summarized below: Mandate Letter Direction Crown Corporation’s Action 1. To efficiently and responsibly manage the business, deliver value and maintain competitive rates by implementing the Integrated Resource Plan and the 10 Year Rates Plan.
In 2015/16 BC Hydro initiated a workforce optimization program to convert external contractors to internal staff in cases where it reduces costs or improves outcomes and continued our Work Smart program. The savings from these initiatives and others have helped to fund important investments in key priority areas like customer service, safety, maintenance and capital project planning. BC Hydro also conducted a review of our conservation programs and identified opportunities to reduce costs, and take advantage of new technologies, such as smart meters, to better respond to customer and system needs. BC Hydro developed a debt management strategy and one component, a Debt Management Regulatory Account, was approved by the BC Utilities Commission which will lock-in low long-term interest rates to protect customers from the risk of rising interest rates. All of these actions support the achievement of the 10 Year Rates Plan and will help to keep rates as low as possible for our customers.
2. Continue to develop the Site C project.
BC Hydro’s Site C Clean Energy Project will meet the future electricity needs of British Columbia’s growing population and economy. Site preparation and construction has commenced with vegetation clearing, building of access roads, a construction bridge, and worker accommodations. Procurement activities have resulted in the award of many small and large contracts with commitments totaling approximately $3.8 billion as of March 31, 2016. Thousands of people have attended Site C job fairs and the number of on-site workers peaked at 691 this past year, of which 492 were from British Columbia. Specific to aboriginal business opportunities and employment, in fiscal 2016 there has been $90 million in procurement commitments to First Nations companies, and joint ventures including First Nations companies, and more than 50 First Nations employees and contractors are working on the project.
2015/16 Annual Service Plan Report 94

British Columbia Hydro and Power Authority
Mandate Letter Direction Crown Corporation’s Action 3. Deliver BC Hydro’s $2 billion per year capital plan, in addition to Site C, to support British Columbia’s economic growth and meet the needs of BC Hydro customers by refurbishing, replacing and building generation and transmission infrastructure, on time and on budget.
From fiscal 2012-2016, BC Hydro completed 563 capital projects at a total cost of $6.49 billion which is 0.18 percent under budget overall. Capital expenditures for 2015/16 were $2.3 billion and capital in-service additions were $2.8 billion. The list of projects above $50 million which came into service in 2015/16 is included in the Financial section of the Annual Service Plan Report.
4. Continue to develop and promote positive, long-term and mutually beneficial relationships with First Nations through agreements related to BC Hydro’s capital projects and power procurement under the Standing Offer Program.
BC Hydro achieved a gold level certification for best practices under the Progressive Aboriginal Relations program through the Canadian Council for Aboriginal Business and we continue to work on our Aboriginal Employment and Business Development strategy which is focused on serving communities impacted by our capital plan and operating footprint. In October 2015, BC Hydro, the Province and Clean Energy BC signed a Memorandum of Understanding to secure opportunities that can both benefit ratepayers and grow the independent power sector. This includes a process to optimize the Standing Offer Program to better incent projects that best meet system needs. BC Hydro has also launched a new Micro-Standing Offer Program targeting First Nations and communities focused on smaller clean and renewable energy projects (100 kilowatts up to 1 megawatt in size). A framework to identify key information requirements, milestones, and processes to most effectively advance potential renewable energy projects was developed for First Nations communities that are part of the non-integrated areas. An Energy Purchase Agreement was signed with the Kwadacha First Nation in January 2016 for a clean and renewable biomass project that will displace diesel generation in the community.
2015/16 Annual Service Plan Report 95

British Columbia Hydro and Power Authority
Appendix D: Capital Project Descriptions Projects Recently Put Into Service
Gordon M. Shrum Units 1 to 5 Turbine Replacement Replaced Units 1 to 5 turbines to reduce the risk of runner failure, decrease maintenance costs and improve operating efficiency. Long Beach Area Reinforcement Expanded the Long Beach and Great Central Lake substations with two new transformers at each and capacitor banks at Long Beach to support the load growth and provide voltage support in the area. Merritt Area Transmission Project Constructed a new 138 kV transmission line between the Merritt and Highland substations; added a new Merritt Substation and new equipment at the Highland Substation to meet the increased demand for power in the Merritt area. Dawson Creek/Chetwynd Area Transmission Project The project expanded the Peace Region 230 kV transmission system to the Dawson Creek/Chetwynd Area to supply the area’s load growth. The solution includes the construction of new 230 kV lines between Dawson Creek and Bear Mountain Terminal (BMT), and from BMT to a new substation called Sundance Lake Substation, located approximately 19 km east of Chetwynd.
Interior to Lower Mainland Transmission Line Project Constructed a new 500 kV transmission line, approximately 247 km in length, between the Nicola Substation near Merritt and the Meridian Substation in Coquitlam, and a new series capacitor station at Ruby Creek near Agassiz to help meet domestic load growth in the Lower Mainland. Smart Metering & Infrastructure Program The Smart Metering and Infrastructure Program included the installation of 1.9 million smart meters in homes and businesses across the province, an advanced telecommunications infrastructure to support electricity system management and customer applications, and information technology to support customer billing, load forecasting and outage management systems. Hugh Keenleyside Spillway Gate Reliability Upgrade Upgraded the spillway gates at the Hugh Keenleyside Dam to increase public and employee safety by ensuring the gates meet flood discharge reliability requirements.
Spillway gates control the amount of water that can be discharged from the reservoir. They are generally used in times of flooding to pass high inflows.
2015/16 Annual Service Plan Report 96

British Columbia Hydro and Power Authority
Upper Columbia Capacity Additions at Mica – Units 5 & 6 Installed two additional 500 MW generating units into existing unit bays at the Mica Generating Station. The new units are similar to the four existing units, but with more efficient turbines. Surrey Area Substation Project Constructed a new 200 MVA 230/25 kV substation in the Fleetwood area of Surrey. The station is supplied from the adjacent 230 kV transmission line and allows for future expansion to 400 MVA to service high load growth in the Fraser Valley West area. Construction of this new Fleetwood Substation allows for the decommissioning of four aging substations in the Surrey/Langley area. Ongoing and Planned Big Bend Substation The South Burnaby, Big Bend area requires a new, 100 MVA, 69/12 kV substation to meet local residential and commercial load growth. Ruskin Dam Safety and Powerhouse Upgrade Improve seismically deficient dam and rehabilitation/replacement of powerhouse equipment that was brought into service between 1930 and 1950. The project includes: upgrading of the right abutment; redeveloping the dam and powerhouse to meet current seismic standards for earthquakes; and replacement of major generation equipment which is in poor unsatisfactory condition. Horne Payne Substation Expand the Horne Payne Substation with the addition of two 230/25kV, 150MVA transformers, gas-insulated (GIS) feeder sections, and a new control building. This project will increase the firm capacity of the substation, add needed feeder positions, facilitate the gradual conversion of the area supply voltage from 12kV to 25kV, and allow for the implementation of an open-loop distribution system. John Hart Generating Station Replacement Replace the existing six-unit 126 MW generating station (in operation since 1947), add integrated emergency bypass capability to ensure reliable long-term generation, and mitigate earthquake risk and environmental risk to fish and fish habitat. Cheakamus Unit 1 and Unit 2 Generator Replacement Replace the two generators at Cheakamus generating station (in operation since 1957) to address the poor condition and known deficiencies which will increase the capacity of each unit from 70 MW to 90 MW. Fort St. John and Taylor Electric Supply This project will maintain adequate supply capability, reduce line losses and improve reliability to the loads in the Fort St. John and Taylor areas by re-terminating 138kV transmission lines 1L360 and 1L374 at the new Site C switchyard.
2015/16 Annual Service Plan Report 97

British Columbia Hydro and Power Authority
Gordon M. Shrum G1-G10 Control System Upgrade The condition of the legacy controls for the GMS generating units, which were originally installed in the 1960s and 1970s, is of growing concern due to increasing maintenance requirements, lack of spare parts availability and decreasing reliability. The controls are well beyond their expected life, cause operating problems and increase the risk of damage to major equipment. The project will replace the controls equipment, provide full remote control capability from the remote control center and rectify deficiencies in the current system. Site C Clean Energy Project Site C will be a third dam and hydroelectric generating station on the Peace River approximately seven kilometres southwest of Fort St. John. It will be capable of producing approximately 5,100 gigawatt-hours of electricity annually and 1,100 megawatts of capacity. Site C project was approved by the Provincial Government in December 2014. Site C will provide clean, renewable and cost-effective power in B.C. for more than 100 years.
2015/16 Annual Service Plan Report 98

British Columbia Hydro and Power Authority
Appendix E: Financial and Operating Statistics
FINANCIAL STATISTICSfor the years ended or as at March 31 (in millions) 2016 2015 2014 2013 2012
Revenues Domestic 5,056$ 4,829$ 4,319$ 4,038$ 3,748$ Trade 601 919 1,073 860 982
ExpensesDomestic energy costs 1,425 1,458 1,252 1,123 1,100 Trade energy costs 427 745 894 683 776
Other operating expenses 1 937 918 901 894 820 Amortization and depreciation 1,241 1,205 995 953 793 Grants and taxes 220 209 203 196 184 Finance charges 752 632 598 540 499
5,002 5,167 4,843 4,389 4,172 Net Income 655$ 581$ 549$ 509$ 558$
Property, Plant and Equipment & Intangible AssetsAt cost 25,183$ 22,998$ 20,897$ 18,932$ 17,161$ Less: Accumulated depreciation 3,189 2,518 1,863 1,268 758 Net Book Value 21,994$ 20,480$ 19,034$ 17,664$ 16,403$
Property, Plant & Equipment and Intangible Asset Expenditures Sustaining 1,136$ 1,005$ 979$ 1,009$ 956$ Growth 1,170 1,164 1,057 920 747 Total Property, Plant & Equipment and Intangible Asset Expenditures 2 2,306$ 2,169$ 2,036$ 1,929$ 1,703$
Net Long-Term Debt 3 18,002$ 16,682$ 15,461$ 13,962$ 12,833$
Retained Earnings 4,397$ 4,068$ 3,751$ 3,369$ 3,075$
Debt to Equity Ratio 80 : 20 80 : 20 80 : 20 80 : 20 80 : 20
1
2
3
Personnel, materials & external services, capitalized costs and other costs, as per the operating expenses note in the consolidated financial statements.
Consists of long-term debt, including the current portion, net of sinking funds and cash and cash equivalents.
Total property, plant and equipment and intangible asset expenditures are different from the amount of property, plant and equipment and intangible asset expenditures in the Consolidated Statements of Cash Flows due to the effect of accruals related to these expenditures.
2015/16 Annual Service Plan Report 99

British Columbia Hydro and Power Authority
OPERATING STATISTICSfor the years ended or as at March 31 2016 2015 2014 2013 2012
Generating Capacity (megawatts)Hydroelectric 11,869 11,379 10,927 10,927 10,923 Thermal 175 1,120 1,120 1,120 1,117 Total 12,044 12,499 12,047 12,047 12,040
Peak One-Hour Integrated System Demand (megawatts) 9,602 9,441 10,072 9,345 9,929
Number of Customer AccountsResidential 1,751,296 1,727,945 1,709,071 1,689,050 1,671,412 Light industrial and commercial 205,615 203,466 201,812 199,981 197,821 Large industrial 185 183 177 172 168 Other 3,459 3,474 3,489 3,482 3,490 Trade 214 226 239 249 264 Total 1,960,769 1,935,294 1,914,788 1,892,934 1,873,155
Domestic Electricity Sold (gigawatt-hours)Residential 17,331 17,047 17,965 17,703 18,395 Light industrial and commercial 18,421 18,564 18,501 18,384 18,005 Large industrial 13,669 14,020 13,994 13,508 13,522 Other 7,879 1,582 2,558 7,417 2,275 Total 57,300 51,213 53,018 57,012 52,197
Revenues (in millions)Residential 1,842$ 1,712$ 1,663$ 1,612$ 1,581$ Light industrial and commercial 1,685 1,597 1,489 1,436 1,327 Large industrial 766 748 687 642 598 Other energy sales 464 280 275 322 236 Total Domestic Revenue Before Regulatory Transfer 4,757 4,337 4,114 4,012 3,742 Regulatory transfer 299 492 205 26 6 Total Domestic 5,056 4,829 4,319 4,038 3,748 Trade - electricity 460 775 866 727 712 Trade - gas 141 144 207 133 270 Total Revenues 5,657$ 5,748$ 5,392$ 4,898$ 4,730$
Average Revenue (per kilowatt-hour) 1
Residential 10.6¢ 10.0¢ 9.3¢ 9.1¢ 8.6¢Light industrial and commercial 9.1 8.6 8.0 7.8 7.4 Large industrial 5.6 5.3 4.9 4.8 4.4
Average Annual Kilowatt-Hour Use Per Residential Customer Account 9,958 9,919 10,571 10,534 11,067
Lines In ServiceDistribution (kilometres) 58,765 58,518 58,317 58,115 57,914 Transmission (circuit kilometres) 20,176 19,792 19,322 19,163 18,864
1 Average revenues are before regulatory transfers.
2015/16 Annual Service Plan Report 100

British Columbia Hydro and Power Authority
TOTAL REQUIREMENTS FOR ELECTRICITY, SOURCES OF SUPPLY AND WATER INFLOWS
for the years ended March 31 2016 2015 2014 2013 2012Generating Generating Generating Generating Generating
Capacity Gigawatt- Capacity Gigawatt- Capacity Gigawatt- Capacity Gigawatt- Capacity Gigawatt-(Megawatts) Hours % (Megawatts) Hours % (Megawatts) Hours % (Megawatts) Hours % (Megawatts) Hours %
RequirementsDomestic 12,044 57,300 73.7 12,499 51,213 66.0 12,047 53,018 65.0 12,047 50,992 58.5 12,040 52,197 62.2Electricity trade 14,732 18.9 21,928 28.2 23,806 29.2 30,975 35.6 26,908 32.1
72,032 92.6 73,141 94.2 76,824 94.2 81,967 94.1 79,105 94.3Line loss and
system use 5,713 7.4 4,486 5.8 4,733 5.8 5,159 5.9 4,783 5.777,745 100.0 77,627 100.0 81,557 100.0 87,126 100.0 83,888 100.0
Sources of SupplyHydroelectric generation
Gordon M. Shrum 2,730 14,274 18.4 2,730 10,801 13.9 2,730 13,650 16.7 2,730 15,878 18.2 2,730 14,447 17.2Revelstoke 2,480 9,805 12.6 2,480 7,297 9.4 2,480 8,121 10.0 2,480 9,760 11.2 2,480 8,756 10.4Mica 2,747 9,451 12.2 2,257 6,028 7.8 1,805 7,030 8.6 1,805 7,873 9.0 1,805 7,943 9.5Kootenay Canal 583 2,837 3.6 583 3,304 4.4 583 2,935 3.6 583 3,595 4.1 583 3,108 3.7Peace Canyon 694 3,470 4.5 694 2,678 3.4 694 3,423 4.2 694 3,902 4.5 694 3,613 4.3Seven Mile 805 2,666 3.4 805 3,907 5.0 805 3,183 3.9 805 3,176 3.6 805 3,491 4.2Bridge River 478 2,582 3.3 478 2,093 2.7 478 2,397 2.9 478 2,626 3.0 478 2,732 3.3Other 1,352 4,267 5.5 1,352 5,122 6.6 1,352 4,589 5.6 1,352 5,304 6.1 1,348 5,743 6.9
11,869 49,352 63.5 11,379 41,230 53.2 10,927 45,328 55.5 10,927 52,115 59.8 10,923 49,833 59.5
Thermal generationBurrard 0 24 0.0 950 26 0.0 950 84 0.1 950 25 0.0 950 19 0.0Other 175 191 0.2 170 187 0.2 170 184 0.2 170 97 0.1 167 124 0.1
Purchases underlong-termcommitments 18,441 23.7 17,510 22.6 15,300 18.8 15,003 17.2 15,317 18.3
Purchases undershort-termcommitments 10,713 13.8 18,586 23.9 20,764 25.5 19,858 22.8 18,640 22.2
Other (976) (1.2) 88 0.1 (103) (0.1) 28 0.0 (45) (0.1) 12,044 77,745 100.0 12,499 77,627 100.0 12,047 81,557 100.0 12,047 87,126 100.0 12,040 83,888 100.0
Water inflows 97 102 95 109 108(% of average)
2015/16 Annual Service Plan Report 101