Brisbane Vacant Land Market Overview Q2 2011
6
Brisbane Vacant Residential Land Report Second Quarter l 2011
-
Upload
prdnationwide -
Category
Documents
-
view
216 -
download
0
description
The Brisbane Vacant Land Report is a comprehensive analysis of factors contributing to the performance of residential land within the bounds of the Brisbane LGA.
Transcript of Brisbane Vacant Land Market Overview Q2 2011
Brisbane Vacant
Residential Land Report
Second Quarter l 2011
Brisbane | March | 2009
Colliers International does not give any warranty in relation to the accuracy of the information contained in this report. If you intend to rely upon the information contained herein, you must take note that the information, figures and
projections have been provided by various sources and have not been verified by us. We have no belief one way or the other in relation to the accuracy of such information, figures and projections. Colliers International will not be
liable for any loss or damage resulting from any statement, figure, calculation or any other information that you rely upon that is contained in the material. Use with written permission only. Copyright © – 2009
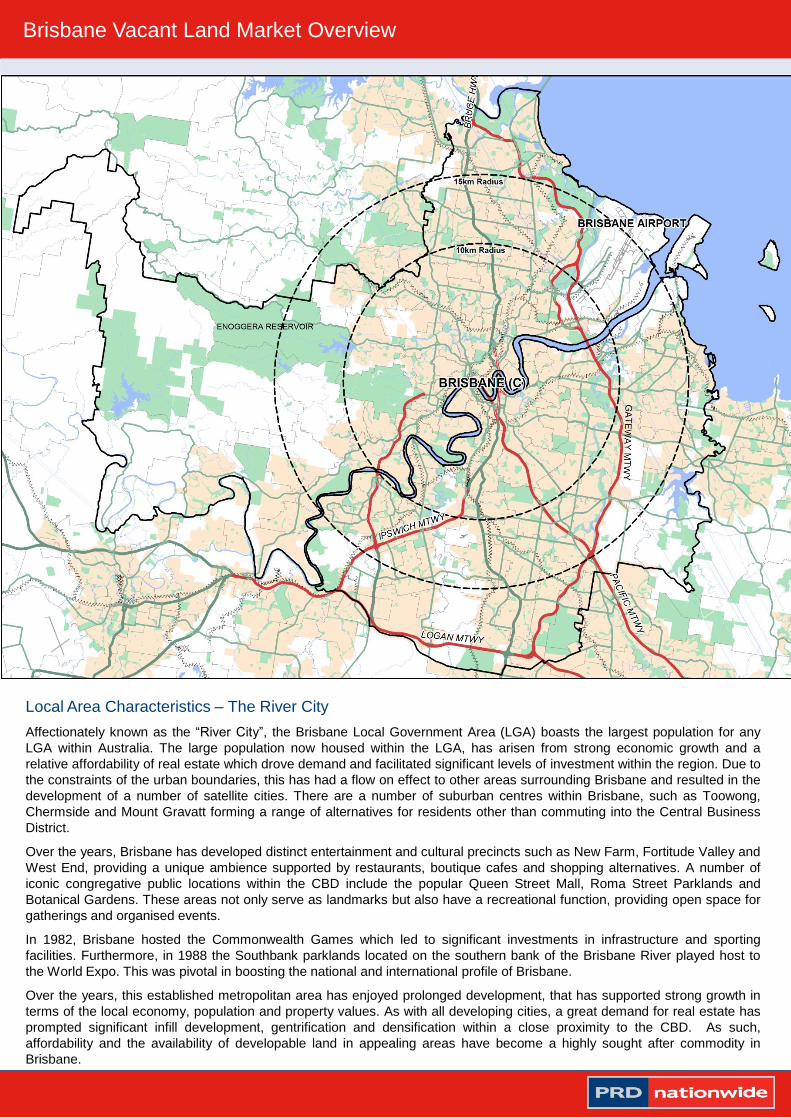
Local Area Characteristics – The River City
Affectionately known as the “River City”, the Brisbane Local Government Area (LGA) boasts the largest population for any
LGA within Australia. The large population now housed within the LGA, has arisen from strong economic growth and a
relative affordability of real estate which drove demand and facilitated significant levels of investment within the region. Due to
the constraints of the urban boundaries, this has had a flow on effect to other areas surrounding Brisbane and resulted in the
development of a number of satellite cities. There are a number of suburban centres within Brisbane, such as Toowong,
Chermside and Mount Gravatt forming a range of alternatives for residents other than commuting into the Central Business
District.
Over the years, Brisbane has developed distinct entertainment and cultural precincts such as New Farm, Fortitude Valley and
West End, providing a unique ambience supported by restaurants, boutique cafes and shopping alternatives. A number of
iconic congregative public locations within the CBD include the popular Queen Street Mall, Roma Street Parklands and
Botanical Gardens. These areas not only serve as landmarks but also have a recreational function, providing open space for
gatherings and organised events.
In 1982, Brisbane hosted the Commonwealth Games which led to significant investments in infrastructure and sporting
facilities. Furthermore, in 1988 the Southbank parklands located on the southern bank of the Brisbane River played host to
the World Expo. This was pivotal in boosting the national and international profile of Brisbane.
Over the years, this established metropolitan area has enjoyed prolonged development, that has supported strong growth in
terms of the local economy, population and property values. As with all developing cities, a great demand for real estate has
prompted significant infill development, gentrification and densification within a close proximity to the CBD. As such,
affordability and the availability of developable land in appealing areas have become a highly sought after commodity in
Brisbane.
Brisbane Vacant Land Market Overview
Brisbane | March | 2009
Colliers International does not give any warranty in relation to the accuracy of the information contained in this report. If you intend to rely upon the information contained herein, you must take note that the information, figures and
projections have been provided by various sources and have not been verified by us. We have no belief one way or the other in relation to the accuracy of such information, figures and projections. Colliers International will not be
liable for any loss or damage resulting from any statement, figure, calculation or any other information that you rely upon that is contained in the material. Use with written permission only. Copyright © – 2009
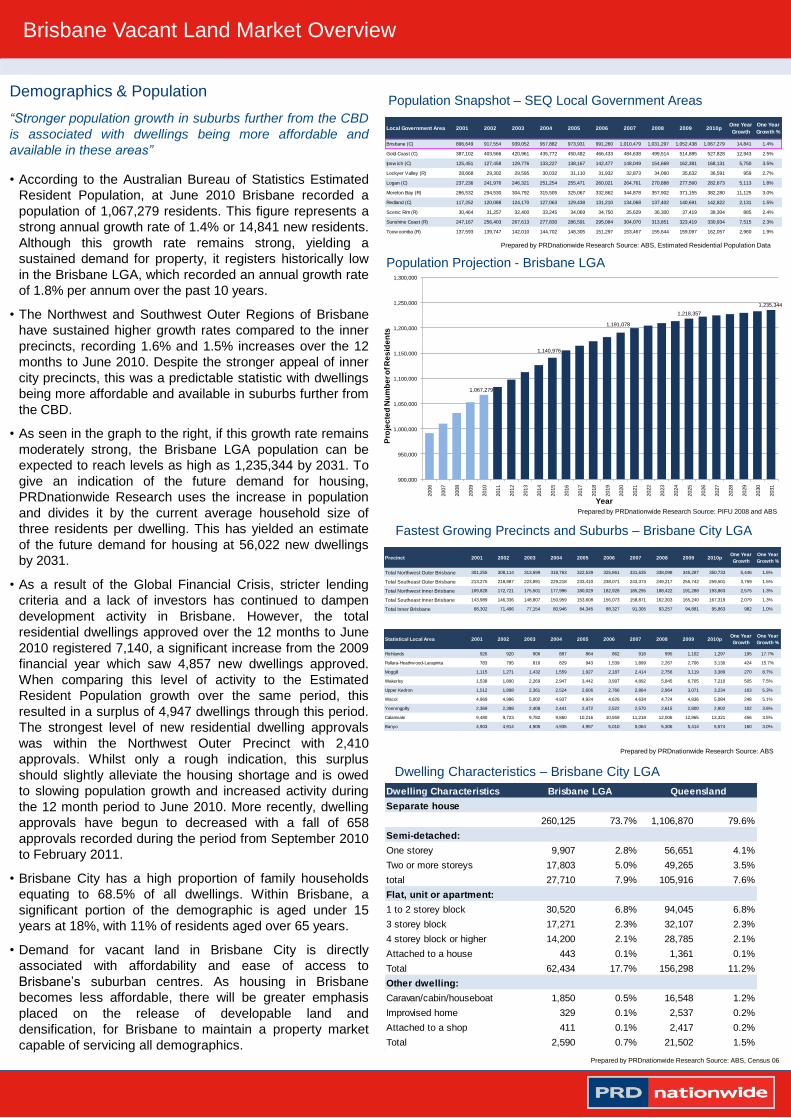
Demographics & Population
“Stronger population growth in suburbs further from the CBD
is associated with dwellings being more affordable and
available in these areas”
• According to the Australian Bureau of Statistics Estimated
Resident Population, at June 2010 Brisbane recorded a
population of 1,067,279 residents. This figure represents a
strong annual growth rate of 1.4% or 14,841 new residents.
Although this growth rate remains strong, yielding a
sustained demand for property, it registers historically low
in the Brisbane LGA, which recorded an annual growth rate
of 1.8% per annum over the past 10 years.
• The Northwest and Southwest Outer Regions of Brisbane
have sustained higher growth rates compared to the inner
precincts, recording 1.6% and 1.5% increases over the 12
months to June 2010. Despite the stronger appeal of inner
city precincts, this was a predictable statistic with dwellings
being more affordable and available in suburbs further from
the CBD.
• As seen in the graph to the right, if this growth rate remains
moderately strong, the Brisbane LGA population can be
expected to reach levels as high as 1,235,344 by 2031. To
give an indication of the future demand for housing,
PRDnationwide Research uses the increase in population
and divides it by the current average household size of
three residents per dwelling. This has yielded an estimate
of the future demand for housing at 56,022 new dwellings
by 2031.
• As a result of the Global Financial Crisis, stricter lending
criteria and a lack of investors has continued to dampen
development activity in Brisbane. However, the total
residential dwellings approved over the 12 months to June
2010 registered 7,140, a significant increase from the 2009
financial year which saw 4,857 new dwellings approved.
When comparing this level of activity to the Estimated
Resident Population growth over the same period, this
resulted in a surplus of 4,947 dwellings through this period.
The strongest level of new residential dwelling approvals
was within the Northwest Outer Precinct with 2,410
approvals. Whilst only a rough indication, this surplus
should slightly alleviate the housing shortage and is owed
to slowing population growth and increased activity during
the 12 month period to June 2010. More recently, dwelling
approvals have begun to decreased with a fall of 658
approvals recorded during the period from September 2010
to February 2011.
• Brisbane City has a high proportion of family households
equating to 68.5% of all dwellings. Within Brisbane, a
significant portion of the demographic is aged under 15
years at 18%, with 11% of residents aged over 65 years.
• Demand for vacant land in Brisbane City is directly
associated with affordability and ease of access to
Brisbane’s suburban centres. As housing in Brisbane
becomes less affordable, there will be greater emphasis
placed on the release of developable land and
densification, for Brisbane to maintain a property market
capable of servicing all demographics.
Population Snapshot – SEQ Local Government Areas
Prepared by PRDnationwide Research Source: ABS, Estimated Residential Population Data
Prepared by PRDnationwide Research Source: ABS, Census 06
Dwelling Characteristics – Brisbane City LGA
Fastest Growing Precincts and Suburbs – Brisbane City LGA
Population Projection - Brisbane LGA
Prepared by PRDnationwide Research Source: PIFU 2008 and ABS
Prepared by PRDnationwide Research Source: ABS
Brisbane Vacant Land Market Overview
Local Government Area 2001 2002 2003 2004 2005 2006 2007 2008 2009 2010pOne Year
Growth
One Year
Growth %
Brisbane (C) 896,649 917,554 939,052 957,882 973,931 991,260 1,010,479 1,031,297 1,052,438 1,067,279 14,841 1.4%
Gold Coast (C) 387,102 403,566 420,961 435,772 450,482 466,433 484,638 499,514 514,885 527,828 12,943 2.5%
Ipsw ich (C) 125,451 127,458 129,776 133,227 138,167 142,477 148,049 154,669 162,381 168,131 5,750 3.5%
Lockyer Valley (R) 28,668 29,302 29,595 30,032 31,110 31,932 32,873 34,060 35,632 36,591 959 2.7%
Logan (C) 237,236 241,976 246,321 251,254 255,471 260,021 264,761 270,888 277,560 282,673 5,113 1.8%
Moreton Bay (R) 286,532 294,530 304,792 315,505 325,067 332,862 344,878 357,902 371,155 382,280 11,125 3.0%
Redland (C) 117,252 120,088 124,170 127,063 129,438 131,210 134,068 137,402 140,691 142,822 2,131 1.5%
Scenic Rim (R) 30,464 31,257 32,400 33,245 34,069 34,750 35,629 36,300 37,419 38,304 885 2.4%
Sunshine Coast (R) 247,167 256,403 267,613 277,830 286,591 295,084 304,070 313,851 323,419 330,934 7,515 2.3%
Toow oomba (R) 137,593 139,747 142,010 144,702 148,305 151,297 153,467 155,644 159,097 162,057 2,960 1.9%
Statistical Local Area 2001 2002 2003 2004 2005 2006 2007 2008 2009 2010pOne Year
Growth
One Year
Growth %
Richlands 926 920 906 887 864 862 916 995 1,102 1,297 195 17.7%
Pallara-Heathw ood-Larapinta 783 795 816 829 943 1,539 1,899 2,267 2,706 3,130 424 15.7%
Moggill 1,115 1,271 1,432 1,559 1,927 2,187 2,414 2,756 3,119 3,389 270 8.7%
Wakerley 1,538 1,890 2,269 2,947 3,442 3,997 4,892 5,845 6,705 7,210 505 7.5%
Upper Kedron 1,512 1,898 2,361 2,524 2,606 2,766 2,864 2,964 3,071 3,234 163 5.3%
Wacol 4,969 4,996 5,002 4,937 4,924 4,626 4,634 4,724 4,836 5,084 248 5.1%
Yeerongpilly 2,369 2,398 2,408 2,441 2,472 2,522 2,570 2,615 2,800 2,902 102 3.6%
Calamvale 9,480 9,723 9,782 9,860 10,216 10,559 11,218 12,006 12,865 13,321 456 3.5%
Banyo 4,903 4,914 4,905 4,935 4,957 5,010 5,064 5,306 5,414 5,574 160 3.0%
Precinct 2001 2002 2003 2004 2005 2006 2007 2008 2009 2010pOne Year
Growth
One Year
Growth %
Total Northwest Outer Brisbane 301,255 308,114 313,699 318,763 322,539 325,861 331,635 338,098 345,287 350,733 5,446 1.6%
Total Southeast Outer Brisbane 213,275 218,887 223,891 229,218 233,410 238,071 243,373 249,217 255,742 259,501 3,759 1.5%
Total Northwest Inner Brisbane 169,828 172,721 175,501 177,996 180,029 182,928 185,295 188,422 191,288 193,863 2,575 1.3%
Total Southeast Inner Brisbane 143,989 146,336 148,807 150,959 153,608 156,073 158,871 162,303 165,240 167,319 2,079 1.3%
Total Inner Brisbane 68,302 71,496 77,154 80,946 84,345 88,327 91,305 93,257 94,881 95,863 982 1.0%
Dwelling Characteristics
Separate house
260,125 73.7% 1,106,870 79.6%
Semi-detached:
One storey 9,907 2.8% 56,651 4.1%
Two or more storeys 17,803 5.0% 49,265 3.5%
total 27,710 7.9% 105,916 7.6%
Flat, unit or apartment:
1 to 2 storey block 30,520 6.8% 94,045 6.8%
3 storey block 17,271 2.3% 32,107 2.3%
4 storey block or higher 14,200 2.1% 28,785 2.1%
Attached to a house 443 0.1% 1,361 0.1%
Total 62,434 17.7% 156,298 11.2%
Other dwelling:
Caravan/cabin/houseboat 1,850 0.5% 16,548 1.2%
Improvised home 329 0.1% 2,537 0.2%
Attached to a shop 411 0.1% 2,417 0.2%
Total 2,590 0.7% 21,502 1.5%
Brisbane LGA Queensland
1,067,279
1,140,976
1,191,078
1,218,357
1,235,344
900,000
950,000
1,000,000
1,050,000
1,100,000
1,150,000
1,200,000
1,250,000
1,300,000
2006
2007
2008
2009
2010
2011
2012
2013
2014
2015
2016
2017
2018
2019
2020
2021
2022
2023
2024
2025
2026
2027
2028
2029
2030
2031
Pro
jec
ted
Nu
mb
er o
f R
es
ide
nts
Year
Brisbane | March | 2009
Colliers International does not give any warranty in relation to the accuracy of the information contained in this report. If you intend to rely upon the information contained herein, you must take note that the information, figures and
projections have been provided by various sources and have not been verified by us. We have no belief one way or the other in relation to the accuracy of such information, figures and projections. Colliers International will not be
liable for any loss or damage resulting from any statement, figure, calculation or any other information that you rely upon that is contained in the material. Use with written permission only. Copyright © – 2009
The most significant projects under construction or proposed include;
Bowen Hills Urban Development Area
A portion of Bowen Hills covering 108 hectares has been declared an urban development area which will facilitate a significant
level of investment to be delivered over an extended time frame. Located in this Inner North suburb of Brisbane, 3km from the
CBD, this plan has factored in an injection of $15 billion dollars into transforming this suburb into one of Brisbane's key precincts.
Already there has been:
• Early planning in progress for a Transit Oriented Development (TOD)
• Development approval granted for the RNA Showgrounds redevelopment
• Early site works commenced for The Chelsea, a 13 storey residential development
• Development Application submitted for a sporting complex within the Perry Park Precinct
• Development Application submitted for Madison on Mayne, a 32 storey residential development.
Cross River Rail Project
This proposed project will cost an estimated $14.2 billion and will provide much needed “inner city rail capacity upgrades”. This
rail line is set to include underground stations at the preferred locations of Woolloongabba, Albert Street, Boggo Road Urban
Village and Roma Street. Ultimately, this will be the biggest transport project undertaken in Queensland to date and will transform
South East Queensland's transport system. Currently this project is in feasibility stage.
TransApex
Under Brisbane City Council’s TransApex plan, Brisbane has seen the inclusion of the Clem7 tunnel and Hale Street Link (Go
Between Bridge) to its transport nexus. However, still on the agenda are the Airport Link, Legacy Way and East-West Link which
will further fill fundamental holes in Brisbane's road network. The specifics on these projects are expected to be as follows:
• Airport Link – Due for completion in 2012, the Airport Link will connect the ICB and Clem7 to Stafford Road, Gympie Road and
East-West Arterial.
• Legacy Way – Scheduled for completion by 2016 and will connect the Western Freeway at Toowong to the ICB in Kelvin Grove.
• East-West Link – Expected to be finished post 2026 and will link the Pacific Motorway and O’Keefe Street in Buranda to the
Western Freeway at Toowong.
Newstead Riverpark
This mixed use development is comprised of residential, business and retail along the riverfront at Newstead and will cost an
estimated $2 billion. Brisbane City Council has approved the development applications as at 2009, with completion scheduled for
2017.
Ipswich Motorway Road Upgrade – Dinmore to Goodna
The $1.95 billion Ipswich Motorway Upgrade from Dinmore to Goodna will continue to deliver enhancements to a vital traffic and
freight corridor along this stretch of highway, until its completion expected in late 2012. The upgrade incorporates a complete
overhaul of the highway and includes increasing the number of lanes from two to six with provisions for eight in the future,
pedestrian bridges/underpasses, new cycle lanes and foot paths and upgrading major interchanges.
Doomben Racetrack Redevelopment
Over the next ten years Doomben and Eagle Farm racecourses will be developed and upgraded into a racing precinct at an
estimated cost of $1.2 billion.
Future Development and Infrastructure
In the wake of the January floods which wreaked havoc across Queensland, a significant level of funding has been allocated for
the rebuild to restore critical infrastructure. The State Government has sourced $1 billion of this from deferring some non-critical
existing infrastructure projects, which will see a number of highway upgrades put on hold .
Brisbane City currently has a number of infrastructure developments either proposed or under construction. Through zoning and
the development application process, these investments have been regulated by the Brisbane City Council to cater for the
forecasted growth in population and also facilitate economic development. However, with subdued demand from purchasers
slowing the level of presales, finance remaining tight and the task of the flood rebuild ahead, it is expected that some much
needed infrastructure will be postponed.
Brisbane Vacant Land Market Overview
Brisbane | March | 2009
Colliers International does not give any warranty in relation to the accuracy of the information contained in this report. If you intend to rely upon the information contained herein, you must take note that the information, figures and
projections have been provided by various sources and have not been verified by us. We have no belief one way or the other in relation to the accuracy of such information, figures and projections. Colliers International will not be
liable for any loss or damage resulting from any statement, figure, calculation or any other information that you rely upon that is contained in the material. Use with written permission only. Copyright © – 2009
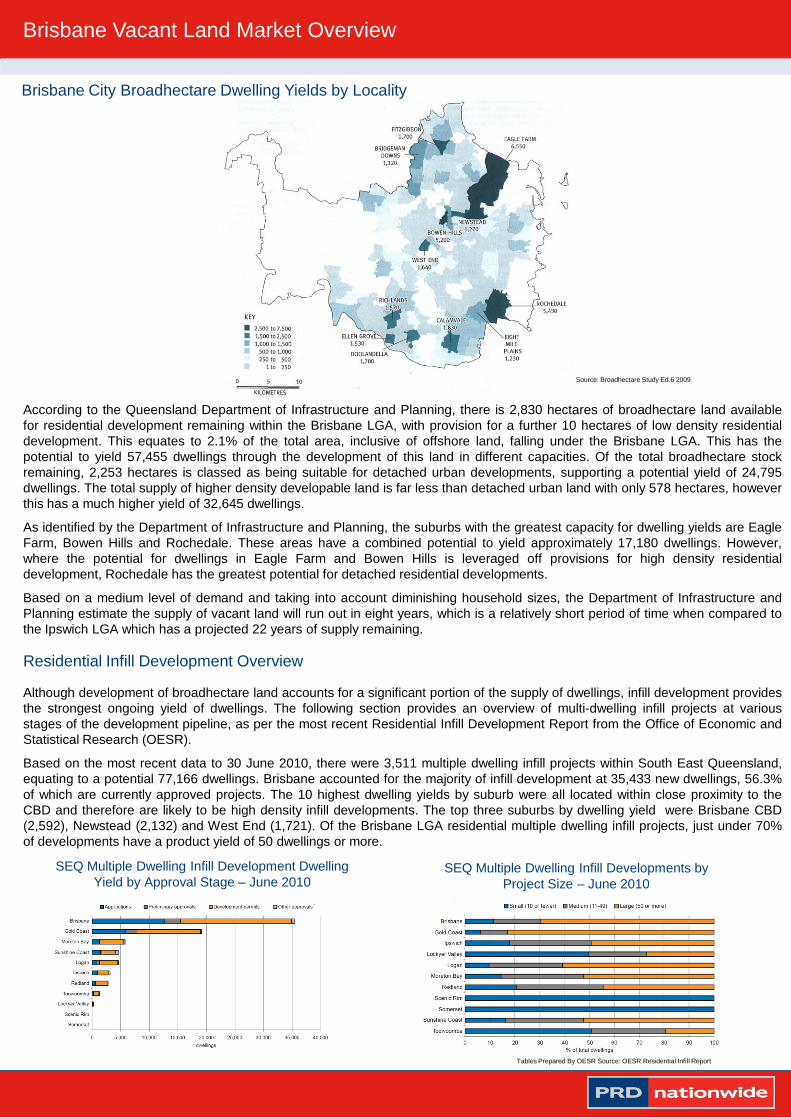
According to the Queensland Department of Infrastructure and Planning, there is 2,830 hectares of broadhectare land available
for residential development remaining within the Brisbane LGA, with provision for a further 10 hectares of low density residential
development. This equates to 2.1% of the total area, inclusive of offshore land, falling under the Brisbane LGA. This has the
potential to yield 57,455 dwellings through the development of this land in different capacities. Of the total broadhectare stock
remaining, 2,253 hectares is classed as being suitable for detached urban developments, supporting a potential yield of 24,795
dwellings. The total supply of higher density developable land is far less than detached urban land with only 578 hectares, however
this has a much higher yield of 32,645 dwellings.
As identified by the Department of Infrastructure and Planning, the suburbs with the greatest capacity for dwelling yields are Eagle
Farm, Bowen Hills and Rochedale. These areas have a combined potential to yield approximately 17,180 dwellings. However,
where the potential for dwellings in Eagle Farm and Bowen Hills is leveraged off provisions for high density residential
development, Rochedale has the greatest potential for detached residential developments.
Based on a medium level of demand and taking into account diminishing household sizes, the Department of Infrastructure and
Planning estimate the supply of vacant land will run out in eight years, which is a relatively short period of time when compared to
the Ipswich LGA which has a projected 22 years of supply remaining.
Residential Infill Development Overview
Although development of broadhectare land accounts for a significant portion of the supply of dwellings, infill development provides
the strongest ongoing yield of dwellings. The following section provides an overview of multi-dwelling infill projects at various
stages of the development pipeline, as per the most recent Residential Infill Development Report from the Office of Economic and
Statistical Research (OESR).
Based on the most recent data to 30 June 2010, there were 3,511 multiple dwelling infill projects within South East Queensland,
equating to a potential 77,166 dwellings. Brisbane accounted for the majority of infill development at 35,433 new dwellings, 56.3%
of which are currently approved projects. The 10 highest dwelling yields by suburb were all located within close proximity to the
CBD and therefore are likely to be high density infill developments. The top three suburbs by dwelling yield were Brisbane CBD
(2,592), Newstead (2,132) and West End (1,721). Of the Brisbane LGA residential multiple dwelling infill projects, just under 70%
of developments have a product yield of 50 dwellings or more.
Brisbane City Broadhectare Dwelling Yields by Locality
Source: Broadhectare Study Ed.6 2009
Brisbane Vacant Land Market Overview
Tables Prepared By OESR Source: OESR Residential Infill Report
SEQ Multiple Dwelling Infill Development Dwelling
Yield by Approval Stage – June 2010SEQ Multiple Dwelling Infill Developments by
Project Size – June 2010
$0
$50,000
$100,000
$150,000
$200,000
$250,000
$300,000
$350,000
0
500
1,000
1,500
2,000
2,500
20
00
DE
C
20
01
JU
N
20
01
DE
C
20
02
JU
N
20
02
DE
C
20
03
JU
N
20
03
DE
C
20
04
JU
N
20
04
DE
C
20
05
JU
N
20
05
DE
C
20
06
JU
N
20
06
DE
C
20
07
JU
N
20
07
DE
C
20
08
JU
N
20
08
DE
C
20
09
JU
N
20
09
DE
C
20
10
JU
N
20
10
DE
C
Me
dia
n s
ale
pri
ce
Nu
mb
er o
f s
ale
s
Half year period
Number of sales
Median
Brisbane | March | 2009
Colliers International does not give any warranty in relation to the accuracy of the information contained in this report. If you intend to rely upon the information contained herein, you must take note that the information, figures and
projections have been provided by various sources and have not been verified by us. We have no belief one way or the other in relation to the accuracy of such information, figures and projections. Colliers International will not be
liable for any loss or damage resulting from any statement, figure, calculation or any other information that you rely upon that is contained in the material. Use with written permission only. Copyright © – 2009
Brisbane Vacant Land Market Overview
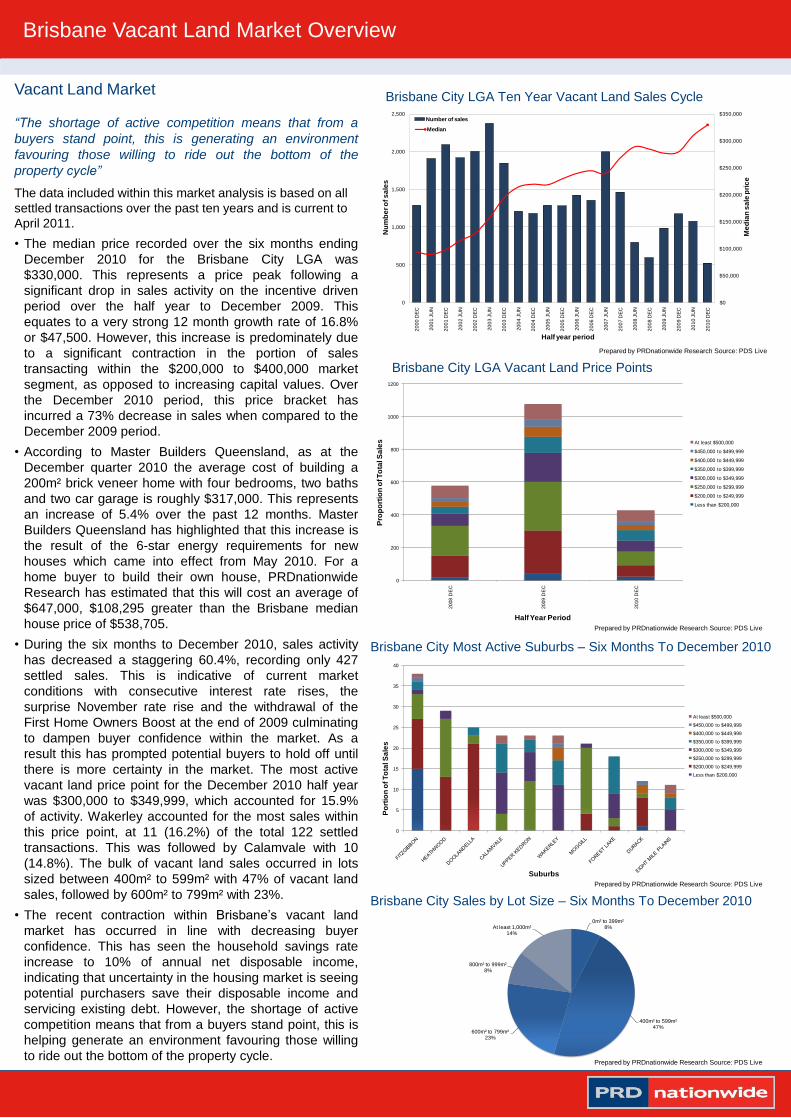
Vacant Land Market
“The shortage of active competition means that from a
buyers stand point, this is generating an environment
favouring those willing to ride out the bottom of the
property cycle”
The data included within this market analysis is based on all
settled transactions over the past ten years and is current to
April 2011.
• The median price recorded over the six months ending
December 2010 for the Brisbane City LGA was
$330,000. This represents a price peak following a
significant drop in sales activity on the incentive driven
period over the half year to December 2009. This
equates to a very strong 12 month growth rate of 16.8%
or $47,500. However, this increase is predominately due
to a significant contraction in the portion of sales
transacting within the $200,000 to $400,000 market
segment, as opposed to increasing capital values. Over
the December 2010 period, this price bracket has
incurred a 73% decrease in sales when compared to the
December 2009 period.
• According to Master Builders Queensland, as at the
December quarter 2010 the average cost of building a
200m² brick veneer home with four bedrooms, two baths
and two car garage is roughly $317,000. This represents
an increase of 5.4% over the past 12 months. Master
Builders Queensland has highlighted that this increase is
the result of the 6-star energy requirements for new
houses which came into effect from May 2010. For a
home buyer to build their own house, PRDnationwide
Research has estimated that this will cost an average of
$647,000, $108,295 greater than the Brisbane median
house price of $538,705.
• During the six months to December 2010, sales activity
has decreased a staggering 60.4%, recording only 427
settled sales. This is indicative of current market
conditions with consecutive interest rate rises, the
surprise November rate rise and the withdrawal of the
First Home Owners Boost at the end of 2009 culminating
to dampen buyer confidence within the market. As a
result this has prompted potential buyers to hold off until
there is more certainty in the market. The most active
vacant land price point for the December 2010 half year
was $300,000 to $349,999, which accounted for 15.9%
of activity. Wakerley accounted for the most sales within
this price point, at 11 (16.2%) of the total 122 settled
transactions. This was followed by Calamvale with 10
(14.8%). The bulk of vacant land sales occurred in lots
sized between 400m² to 599m² with 47% of vacant land
sales, followed by 600m² to 799m² with 23%.
• The recent contraction within Brisbane’s vacant land
market has occurred in line with decreasing buyer
confidence. This has seen the household savings rate
increase to 10% of annual net disposable income,
indicating that uncertainty in the housing market is seeing
potential purchasers save their disposable income and
servicing existing debt. However, the shortage of active
competition means that from a buyers stand point, this is
helping generate an environment favouring those willing
to ride out the bottom of the property cycle.
Brisbane City LGA Ten Year Vacant Land Sales Cycle
Prepared by PRDnationwide Research Source: PDS Live
Prepared by PRDnationwide Research Source: PDS Live
Prepared by PRDnationwide Research Source: PDS Live
Brisbane City Most Active Suburbs – Six Months To December 2010
Brisbane City LGA Vacant Land Price Points
0
200
400
600
800
1000
1200
2008 D
EC
2009 D
EC
2010 D
EC
Pro
po
rtio
n o
f T
ota
l S
ale
s
Half Year Period
At least $500,000
$450,000 to $499,999
$400,000 to $449,999
$350,000 to $399,999
$300,000 to $349,999
$250,000 to $299,999
$200,000 to $249,999
Less than $200,000
0
5
10
15
20
25
30
35
40
Po
rtio
n o
f T
ota
l S
ale
s
Suburbs
At least $500,000
$450,000 to $499,999
$400,000 to $449,999
$350,000 to $399,999
$300,000 to $349,999
$250,000 to $299,999
$200,000 to $249,999
Less than $200,000
Brisbane City Sales by Lot Size – Six Months To December 2010
0m² to 399m²8%
400m² to 599m²47%
600m² to 799m²23%
800m² to 999m²8%
At least 1,000m²14%
Prepared by PRDnationwide Research Source: PDS Live