Brinks ÅlandMaritimeDay Future shipping energy sources and ......– Heavy fuel oil (HFO) to marine...
34
DNV GL © 2016 Ungraded 12 May 2016 SAFER, SMARTER, GREENER DNV GL © 2016 Ungraded 12 May 2016 Hendrik W. Brinks Future shipping energy sources and lessons learnt 1 Åland Maritime Day
Transcript of Brinks ÅlandMaritimeDay Future shipping energy sources and ......– Heavy fuel oil (HFO) to marine...

DNV GL © 2016
Ungraded
12 May 2016 SAFER, SMARTER, GREENERDNV GL © 2016
Ungraded
12 May 2016Hendrik W. Brinks
Future shipping energy sources and lessons learnt
1
Åland Maritime Day

DNV GL © 2016
Ungraded
12 May 2016
Alternatives for compliance with sulfur regulations
� Use of cleaner oil-based fuel
– Heavy fuel oil (HFO) to marine gas oil (MGO)
� Switch to a different fuel
– LNG (Liquid Natural Gas)
– Methanol
– LPG (Liquid Petroleum Gas)
– Biofuels (e.g. HVO, pyrolysis oil, LBG)
– Hydrogen
– Electricity
– Nuclear power
� Cleaning of the exhaust with a scrubber
2
� Typically, particulate matter emissions and NOx
emissions are reduced by fuel switch

DNV GL © 2016
Ungraded
12 May 2016
Factors affecting decision making on fuel
� Cost of fuel over the expected lifetime
� Regulatory requirements on local and global emissions
� Corporate social responsibility
� Availability in ports
� Risks of introducing new technology
� Safety of ship
3

DNV GL © 2016
Ungraded
12 May 2016
Factors affecting decision making on fuel
4
� Cost of fuel over the expected lifetime
� Regulatory requirements on local and global emissions
� Corporate social responsibility
� Availability in ports
� Risks of introducing new technology
� Safety of ship
The fuel trilemma

DNV GL © 2016
Ungraded
12 May 2016
Emissions for LNG
� The baseline is not static: It depends on regulation
� LNG has the potential of reducing greenhouse gas emissions
– Methane leakages in production, distribution and use is critical
– Currently acknowledged slip: 2-3%
5
0
20
40
60
80
100
120
HFOBaseline
Low sulfurMGO
HFOw/scrubber
LNGAverage
LNGwithout slip
To
tal
GH
G e
mis
sio
ns
CH4 is a ≥25 times stronger GHG than CO2.
At 4% CH4
leakage, LNG is emitting as
much GHG as diesel

DNV GL © 2016
Ungraded
12 May 2016
Introduction to case study (DNV GL & MAN DT)
� Compare alternatives for a specific ship
– 75 000 DWT LR1 tanker
� Focus on comparing fuels
6

DNV GL © 2016
Ungraded
12 May 2016
Fuel variants considered
7
Variant ECA fuelNon-ECA,
2018-2019Non-ECA,
2020 -
Reference MGO HFO LSFO 0.5%
LNG LNG LNG LNG
LPG LPG LPG LPG
Methanol Methanol Methanol Methanol
LNG/HFO LNG HFO LSFO 0.5%
LPG/HFO LPG HFO LSFO 0.5%
Methanol/HFO Methanol HFO LSFO 0.5%
ULSFO 0.1% ULSFO 0.1% ULSFO 0.1% ULSFO 0.1%

DNV GL © 2016
Ungraded
12 May 2016
Additional investment costs
8
LNG
LNG/HFO
LPG
LPG/HFO
Methan
olMet
hanol/H
FO
ULSFO
0
2
4
6
8
10
∆∆ ∆∆CA
PE
X (
mill
ion
US
D)
Capex costs:- Engine upgrades- Fuel supply system- Fuel storageEngineering and installation costs included

DNV GL © 2016
Ungraded
12 May 2016
Application – trading route
Leg State Total distance
(nm)
Approach (h/leg)
Port (h/leg)
Houston –Rotterdam
Cargo(diesel)
5,052 10 36
Rotterdam –Ventspils
Ballast 961 10 36
Ventspils –Houston
Cargo(MGO)
5,670 10 36
Port (10%)
Approach (3%)
Transit (87%)
0 1 2 3 4 5 6
Power (MW)
MW Propulsion MW Auxiliary MW PTO
53% load including PTOSpeed: 12.5 knots

DNV GL © 2016
Ungraded
12 May 2016
Fuel prices – historic data
Europe vs. USA
� HFO and Methanol: same price
� LNG and LPG cheaper in USA
� MGO slightly cheaper in Europe
2010 2011 2012 2013 2014 20150
5
10
15
20
25
30
35
Fu
el p
rice
($/
GJ
on
LH
V b
asis
)
Time
HFO (380 cSt) (Europe) MGO/MDO (Europe) Methanol (US) LPG (US) LNG (US)

DNV GL © 2016
Ungraded
12 May 2016
Fuel price scenarios
� High price scenario based on mid 2014 prices
� For LNG and LPG distribution costs are added
2012 2014 2016 2018 2020 20220
5
10
15
20
25
30
35
40
45
Fu
el p
rice
($/
GJ
on
LH
V b
asis
)
Time
HFO (380 cSt) HFO/LSFO: High price MGO/MDO MGO: High price Methanol Methanol: High price LNG LNG: High price LPG LPG: High price

DNV GL © 2016
Ungraded
12 May 2016
Fuel price scenarios
� High price scenario based on mid 2014 prices
� For LNG and LPG distribution costs are added
� Low price scenario based on mid 2015 prices
� Less price reduction for methanol and LNG
2012 2014 2016 2018 2020 20220
5
10
15
20
25
30
35
40
45
Fu
el p
rice
($/
GJ
on
LH
V b
asis
)
Time
HFO (380 cSt) HFO/LSFO: Low Price MDO/MGO MGO: Low Price Methanol Methanol: Low Price LPG LPG: Low Price LNG LNG: Low Price

DNV GL © 2016
Ungraded
12 May 2016
Annual cashflow for single-fuel variants
� LNG and LPG generate a positive cashflow after the investment
� Methanol and ULSFO not financially attractive
2017 2018 2019 2020-10
-8
-6
-4
-2
0
2
Investments
An
nu
al c
ash
flo
w (
mU
SD
)
Time
High-price scenario LNG LPG Methanol ULSFO 0.1%
Globalsulfur cap:0.5%

DNV GL © 2016
Ungraded
12 May 2016
Annual cashflow for combined variants
� Combined variants are not affected by global sulfur cap
� A global sulfur cap favours the single-fuel variants
2017 2018 2019 2020-10
-8
-6
-4
-2
0
2
sulfur cap:0.5%
Global
Investments
An
nu
al c
ost
dif
fere
nce
(M
US
D)
Year
Low-price scenario LNG LNG/HFO LPG LPG/HFO Methanol Methanol/HFO ULSFO 0.1%

DNV GL © 2016
Ungraded
12 May 2016
Payback time for LNG and LPG
� Payback time is faster for single-fuel variants
� Payback time is faster by increased speed
� Payback time is faster in the high price scenarios
� LPG is at least comparable to LNG
– Shorter payback
– Less sensitive to price scenario
– Less investments
12 13 14 152
4
6
8
10
12
Pay
bac
k ti
me
(yea
rs)
Speed (knots)
High price scenario LNG LNG/HFO LPG LPG/HFO
12 13 14 152
4
6
8
Pay
bac
k ti
me
(yea
rs)
Speed (knots)
LPG: Low price scenario LPG: High price scenario
DNV GL © 2016
Ungraded
12 May 2016
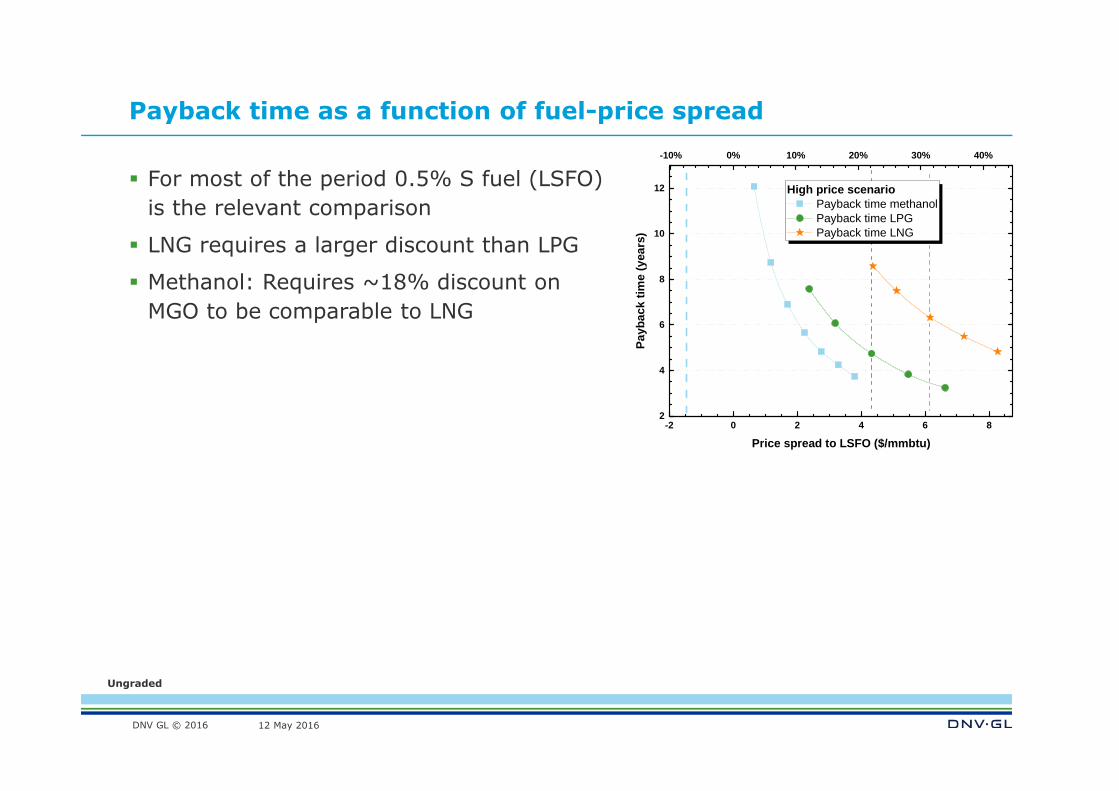
Payback time as a function of fuel-price spread
� For most of the period 0.5% S fuel (LSFO) is the relevant comparison
� LNG requires a larger discount than LPG
� Methanol: Requires ~18% discount on MGO to be comparable to LNG
-2 0 2 4 6 82
4
6
8
10
12
Pay
bac
k ti
me
(yea
rs)
Price spread to LSFO ($/mmbtu)
High price scenario Payback time methanol Payback time LPG Payback time LNG
-10% 0% 10% 20% 30% 40%

DNV GL © 2016
Ungraded
12 May 2016
Conclusions for case study (DNV GL & MAN DT)
� Regulations call for alternative fuels as a means of compliance
� Costs and benefits for various fuels (LNG, LPG, methanol, ULSFO) were investigated
� LNG and LPG were found to be the most promising options
� For the most promising alternative fuels, the best option is to use the fuel both in ECAs and non-ECAs.
� Financial attractiveness is highly dependent on fuel price scenario.

DNV GL © 2016
Ungraded
12 May 2016
Methanol as a shipping fuel
� Typically produced from
– Natural gas (70% efficiency; 93 kgCO2/GJ)
– Coal (182-190 kgCO2/GJ)
� Reduced local emissions
– Sulfur-free
– Less PM and NOx
18
MGO: 89 kgCO2/GJ
DNV GL © 2016
Ungraded
12 May 2016
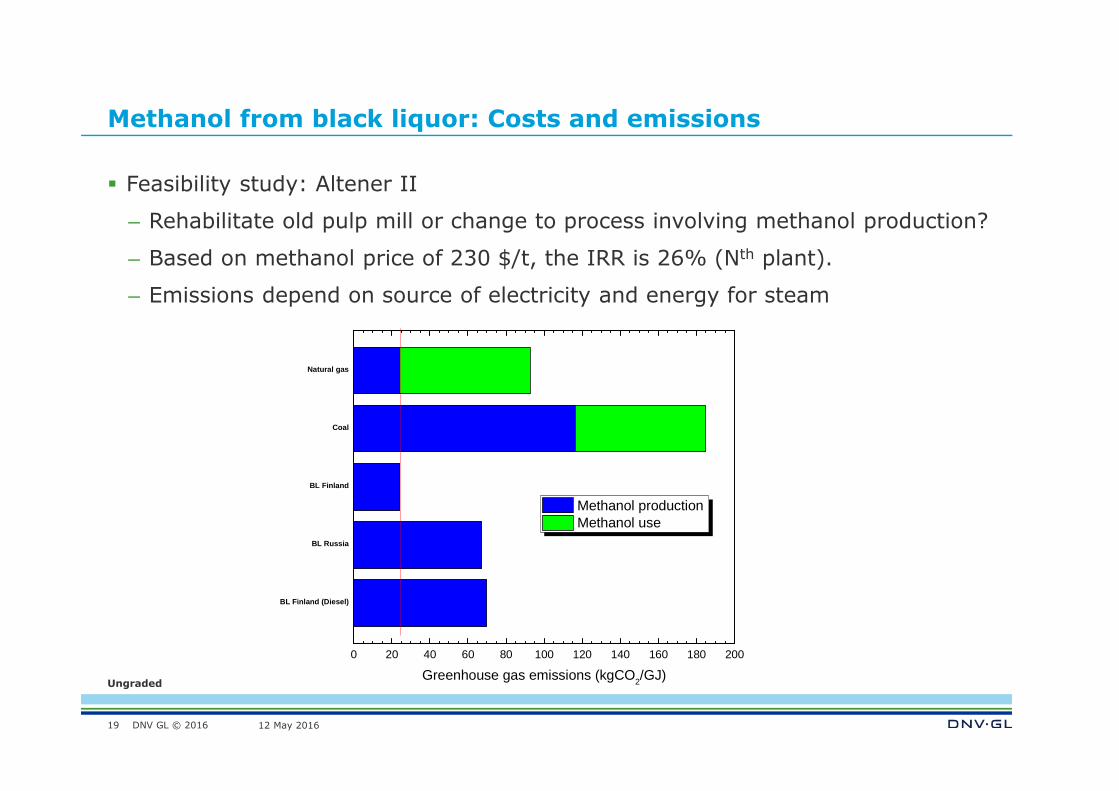
Methanol from black liquor: Costs and emissions
� Feasibility study: Altener II
– Rehabilitate old pulp mill or change to process involving methanol production?
– Based on methanol price of 230 $/t, the IRR is 26% (Nth plant).
– Emissions depend on source of electricity and energy for steam
19
BL Finland (Diesel)
BL Russia
BL Finland
Coal
Natural gas
0 20 40 60 80 100 120 140 160 180 200
Greenhouse gas emissions (kgCO2/GJ)
Methanol production Methanol use

DNV GL © 2016
Ungraded
12 May 2016
Summary
20
� Many fuels are available:
– Oil
– LNG
– Methanol
– Biofuel
– Electricity
– Nuclear power
� Diversification; no silver-bullet solution
DNV GL © 2016
Ungraded
12 May 2016
SAFER, SMARTER, GREENER
www.dnvgl.com
Global impact for a safe and sustainable future
21
Hendrik W. Brinks
Christos Chryssakis (DNV GL)
Pierre Sames (DNV GL)
Christian Mørch (MAN DT)
Niels Clausen (MAN DT)
Per Kristensen (MAN DT)
Acknowledgements:
DNV GL © 2016
Ungraded
12 May 2016
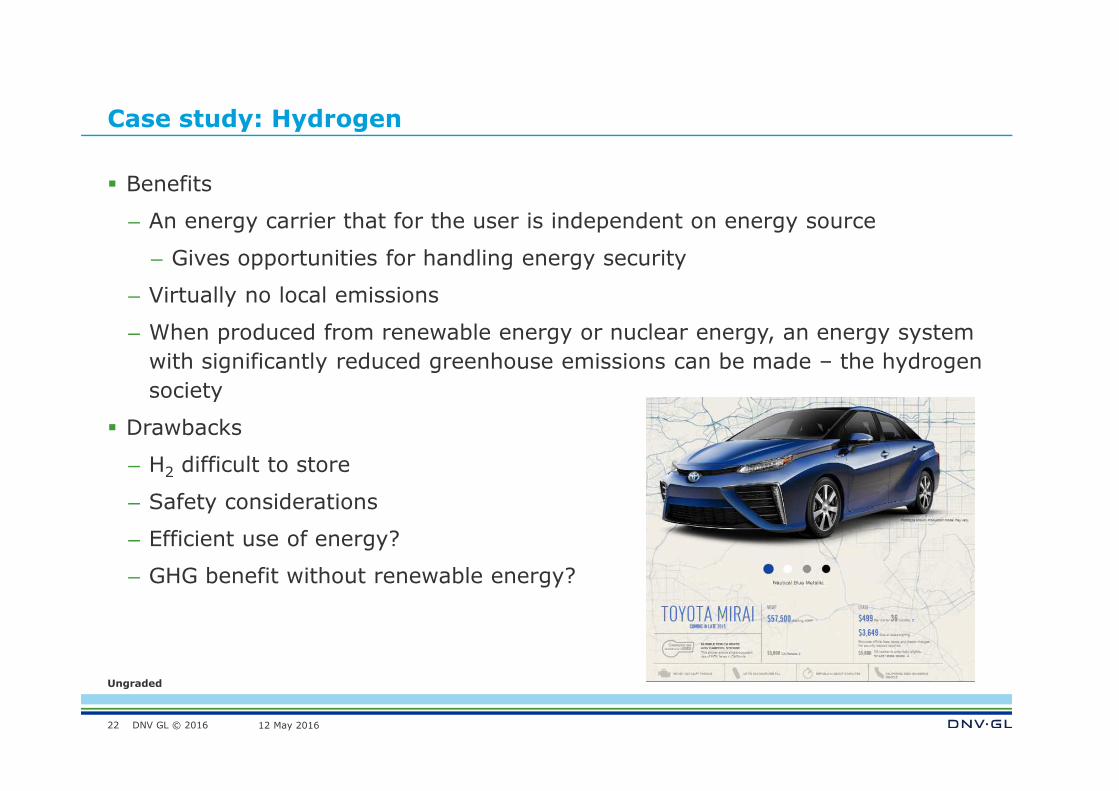
Case study: Hydrogen
� Benefits
– An energy carrier that for the user is independent on energy source
– Gives opportunities for handling energy security
– Virtually no local emissions
– When produced from renewable energy or nuclear energy, an energy system with significantly reduced greenhouse emissions can be made – the hydrogen society
� Drawbacks
– H2 difficult to store
– Safety considerations
– Efficient use of energy?
– GHG benefit without renewable energy?
22

DNV GL © 2016
Ungraded
12 May 2016
Hydrogen: Type of production
� Reforming of natural gas cheaper than electrolysis of water
� Distributed production (at filling stations) cheaper than central production with truck distribution
23
� Reforming has a 3 times less CO2 footprint than electrolysis
� Distributed production only adds a little to the CO2
footprint
Costs (US)
Emissions (US)

DNV GL © 2016
Ungraded
12 May 2016
Hydrogen: Conclusion
� Hydrogen adds 20-40% to the fuel price with about 10% reduction in GHG
� In addition costs applies to
– Purchase of fuel cells
– Storage of H2 onboard
– Safety measures on the ship
– Lost cargo capacity
� Hydrogen not likely to play a major role in propulsion in shipping for the next decade or two.
24

DNV GL © 2016
Ungraded
12 May 2016
Hydrogen: Resource management
� Storage of electric energy in batteries are more efficient than in H2.
25

DNV GL © 2016
Ungraded
12 May 2016
Case study: Pyrolysis oil
� Flash pyrolysis:
– Biomass heated without oxygen at ∼500ºC for <2 sec.
– 65% yield of pyrolysis oil (also called bio-oil)
26
Pros Cons
Simple process Water content 25%pH = 2.5-3.0
Suitable for direct use in adapted boilers and turbines
Upgrading needed for use in engines
Easier to transport than biomass
Energy density half of diesel (by volume)

DNV GL © 2016
Ungraded
12 May 2016
Case study: Pyrolysis oil in Finland/Canada
27
� Case 1: Logging + pyrolysis oil plant in Finland. Shipping to the Netherlands
� Case 2: Logging + pyrolysis oil plant in Canada. Shipping to the Netherlands
� Techno-economical assessment
MGO: 89 kgCO2/GJ MGO (Q2 2014): 20 $/GJ
7.8kgCO2/GJ
23$/GJ

DNV GL © 2016
Ungraded
12 May 2016
Pyrolysis oil: Price versus CO2 footprint
28
7.8kgCO2/GJ
23$/GJ
10.4kgCO2/GJ
19$/GJ

DNV GL © 2016
Ungraded
12 May 2016
Methanol from black liquor (pulp and paper mill)
� Black liquor: An intermediate usually burned to recover chemicals and heat
� Black liquor benefits:
– Easy to feed to a pressurized gasifier
– Rapid gasification rates
– No tar formation
– Typically 250-300 MW of black liquor available per pulp mill
� Black liquor may alternatively be used to make methanol
– Gasification in oxygen
– Cleaning
– Water gas shift
– Syngas to methanol
� Test facility by Chemrec in Piteå, Sweden
– 3 MWth gasifier (since 2005)
– Production of methanol and DME (since 2011)
29

DNV GL © 2016
Ungraded
12 May 2016
Refinery process
� IFO380: Visbroken residue, HCO and LCO
� MDO: More LCO than in MGO
30

DNV GL © 2016
Ungraded
12 May 2016
ISO8217
31

DNV GL © 2016
Ungraded
12 May 2016
ISO8217
32
DNV GL © 2016
Ungraded
12 May 2016
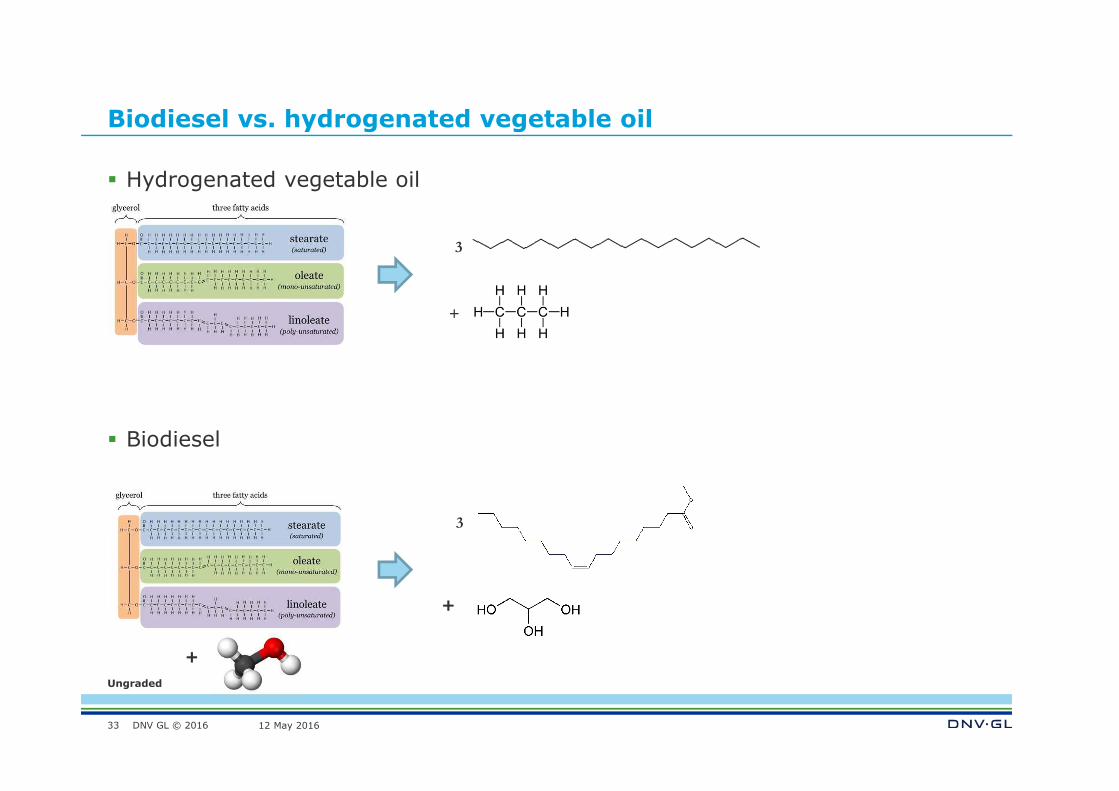
Biodiesel vs. hydrogenated vegetable oil
33
3
+
� Hydrogenated vegetable oil
� Biodiesel
+
+
3

DNV GL © 2016
Ungraded
12 May 2016
Setting the baseline
� The baseline is not static
– Depends on regulation
� Scrubber
– 2-3% increased fuel consumption
– 2% increased CO2 emissions from neutralization
– Total: 2-5% increase of CO2 emissions
� Use of MGO
– Emissions:
– More CO2 emissions in the refinery
– Less CO2 intensive in use
– Price:
– MGO is 300 $/t more costly than HFO
34
0 10 20 30 40 50 600
100
200
300
400
Scr
ubbe
r pr
ice
($/k
W)
Engine size (MW)