Bringing your data to life - etouches · Bringing your data to life . Introducing: Ian Dunn Visible...
63
Bringing your data to life
-
Upload
hoangxuyen -
Category
Documents
-
view
214 -
download
1
Transcript of Bringing your data to life - etouches · Bringing your data to life . Introducing: Ian Dunn Visible...
Bringing your data to life

Introducing:
Ian Dunn Visible Equity
Elias Tuma Experian

©Experian 3 4/28/2017 Experian Public Vision 2017
How can technology help to:
• Make data easier to obtain and manage?
• Unlock additional insights from your data?
• Streamline exams and satisfy regulators?
Bring your data to life Creating efficiencies through technology

©Experian 4 4/28/2017 Experian Public Vision 2017
Prescreen and account review data at your fingertips
• Reduce file transfers – both internally and externally
• Data delivered directly back into the platform over the web
• Real-time counts with a robust set of scores and attributes (Prescreen)
Removing friction Data on-demand

©Experian 5 4/28/2017 Experian Public Vision 2017
Intuitive report building makes it easier than ever before to bring meaningful insight out of your data
• Ditch the CSV file!
• Pre-built and fully customizable reports
• Integrate Experian data with other data sets (loans, applications, etc.)
Interactive reporting Extracting value from your data

©Experian 6 4/28/2017 Experian Public Vision 2017
• Easy-to-use solution gets more out of your existing resources
• Information is centrally located
• Pre-built reports regulators have requested previously
Exams made simple(r) Getting and staying ahead of regulatory requests

©Experian 7 4/28/2017 Experian Public Vision 2017
Three real-world scenarios…
… but first let’s play a little game

©Experian 8 4/28/2017 Experian Public Vision 2017
30 Seconds to go…
15 Seconds…
Where’s Waldo? (One minute. Ready. Set. Go!)
Times up…
©Experian 9 4/28/2017 Experian Public Vision 2017
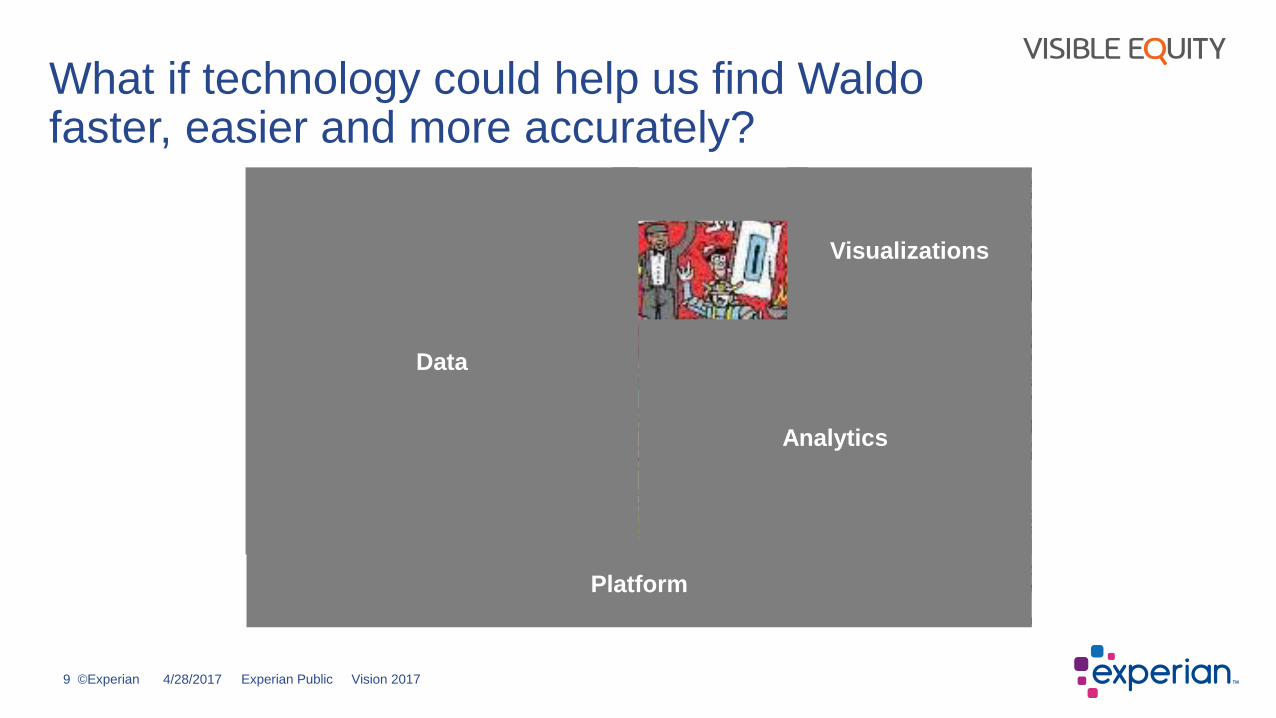
What if technology could help us find Waldo faster, easier and more accurately?
Platform
Analytics
Visualizations
Data

©Experian 10 4/28/2017 Experian Public Vision 2017
• Scenario 1: Identify borrowers
with hidden risk
• Scenario 2: Identify best home
equity loan candidates
• Scenario 3: Identify borrowers most
likely to transfer their credit card balance
Three real world scenarios…

©Experian 11 4/28/2017 Experian Public Vision 2017
1. Refresh credit scores
2. Produce credit score migration report
3. Drill down to borrowers with negative migration
4. View these borrowers by “out of institution” delinquency
5. Add to watchlist (or make other appropriate decision)
Scenario 1 Identify borrowers with hidden risk
Goal: Make
steps 1-4 fast
and easy
So you can spend time making good decisions…

Welcome, David
Home Report Packets Upload/Manage Data Tools Settings Messages David v
Schedule Training
APPLICATION Analytics Analytics
LOAN LOAN Analytics
DEPOSIT Analytics
Not Subscribed
CUSTOMER & Marketing Analytics
ADVANCED LOAN Analytics
ALLOWANCE Expected Credit Loss (CECL)
PEER Analytics
Not Subscribed
FAIR LENDING Analytics
Not Subscribed Not Subscribed
EXPERIAN Account Review
Select Account
Review to get started
EXPERIAN Prescreen
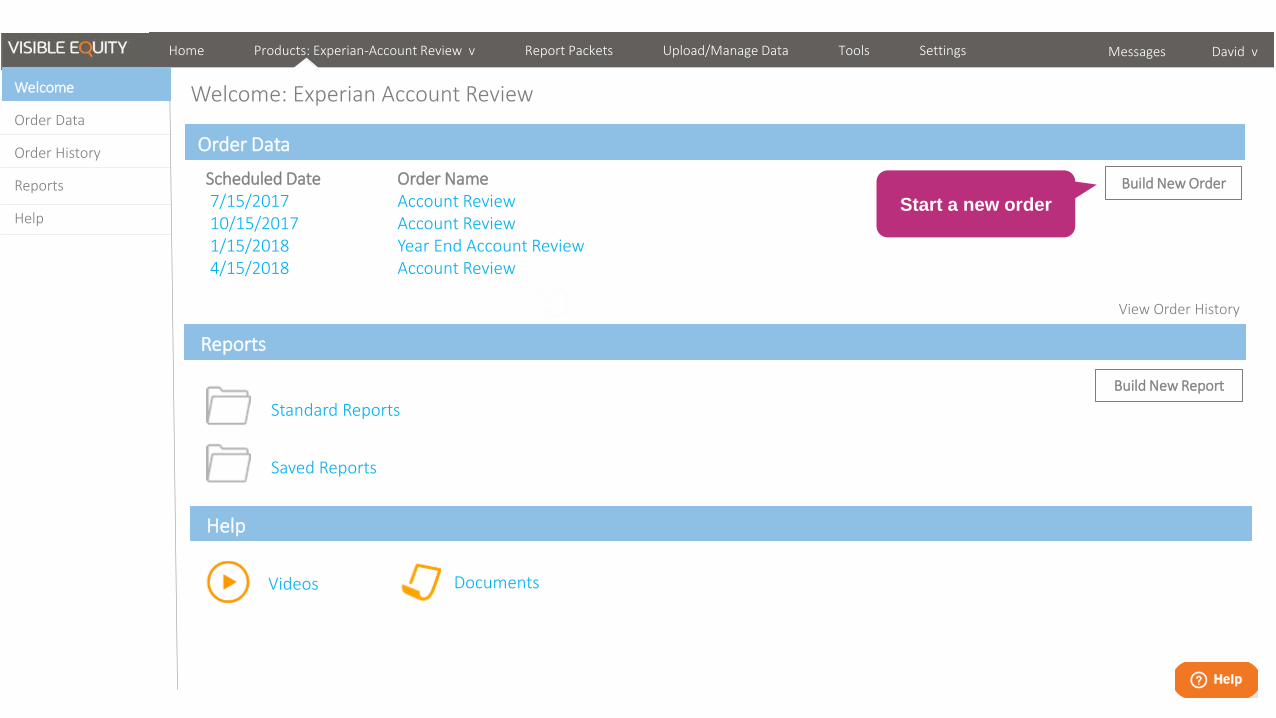
Welcome: Experian Account Review
Scheduled Date Order Name 7/15/2017 Account Review 10/15/2017 Account Review 1/15/2018 Year End Account Review 4/15/2018 Account Review
Order Data
Reports
Standard Reports
Saved Reports
Build New Report
Help
Videos Documents
Home Products: Experian-Account Review v Report Packets Upload/Manage Data Tools Settings
Messages David v
Welcome
Order Data
Order History
Reports
Help
View Order History
Build New Order
Start a new order

Home Products: Experian-Account Review v Report Packets Upload/Manage Data Tools Settings
Messages David v
Welcome
Order Data
Order History
Reports
Help
Order Select Order [ Build New Order v ] Contact Experian
Order Summary
V
Premier Attributes
Scores
EIRC (Estimated Interest Rate Calculations)
TAPS (Total Annual Plastic Spend)
Trended Data
V
V
V
V
V
Choose your
desired product(s)
Choose from new
or prior orders

Home Products: Experian-Account Review v Report Packets Upload/Manage Data Tools Settings
Messages David v
Welcome
Order Data
Order History
Reports
Help
Order Select Order [ Build New Order v ] Contact Experian
Data Selected Accounts (Records) to Process Estimated Quantity Cost / Record Estimated Cost* VantageScore 3.0 Standard Filter: Primary Borrowers 43,230 $X.XX $X,XXX.XX Processing Fee (Experian) 43,230 $X.XX $X,XXX.XX Processing Fee (Visible Equity) 43,230 $X.XX $X,XXX.XX
$X,XXX.XX*
*Actual costs depends on number of records returned. Processing Fees based on unique records.
Order Summary V
V
V
2 V
Confirm & Order
Premier Attributes
Scores
V
Select Accounts (Records) to Process: [ Standard Filter: Primary Borrowers v ]
Learn More
Update
FICO V2
FICO V8
FICO V9
Bankruptcy Plus
Bankruptcy Plus (Rescaled)
V
VantageScore 3.0
Income Insights
V
Let’s choose a
credit score
On all Primary
Borrowers

V
V
Home Products: Experian-Account Review v Report Packets Upload/Manage Data Tools Settings
Messages David v
Welcome
Order Data
Order History
Reports
Help
2
Order
V
Select Order [ Build New Order v ]
Confirm & Order Premier Attributes
Scores
V
V
Select Accounts (Records) to Process: [ Standard Filter: Primary Borrowers v ]
Learn More
Update
Visible Equity Standard Package
Contact Experian
V
Core Package
Order Summary V
Data Selected Accounts (Records) to Process Estimated Quantity Cost / Record Estimated Cost* VantageScore 3.0 Standard Filter: Primary Borrowers 43,230 $X.XX $X,XXX.XX Core Package Standard Filter: Primary Borrowers 43,230 $X.XX $X,XXX.XX Processing Fee (Experian) 43,230 $X.XX $X,XXX.XX Processing Fee (Visible Equity) 43,230 $X.XX $X,XXX.XX
$X,XXX.XX*
*Actual costs depends on number of records returned. Processing Fees based on unique records.
Credit Union Package
Auto Package
Bankcard Package
Mortgage Package
And Core Premier Attributes℠
so we can get the “Out of
Institution” Delinquency…
Let’s order

Home Products: Experian-Account Review v Report Packets Upload/Manage Data Tools Settings
Messages David v
Welcome
Order Data
Order History
Reports
Help
Place Order Order Name [ Scenario 1 ]
[ x ] One Time
Order on [ Now ]
[ ] Recurring
*Please select a date that allows enough time for desired data files to be updated.
Order Summary
Place Order
Cancel
Order
Data Selected Accounts (Records) to Process Estimated Quantity Cost / Record Estimated Cost* VantageScore 3.0 Standard Filter: Primary Borrowers 43,230 $X.XX $X,XXX.XX Core Package Standard Filter: Primary Borrowers 43,230 $X.XX $X,XXX.XX Processing Fee (Experian) 43,230 $X.XX $X,XXX.XX Processing Fee (Visible Equity) 43,230 $X.XX $X,XXX.XX
$X,XXX.XX*
*Actual costs depends on number of records returned. Processing Fees based on unique records.
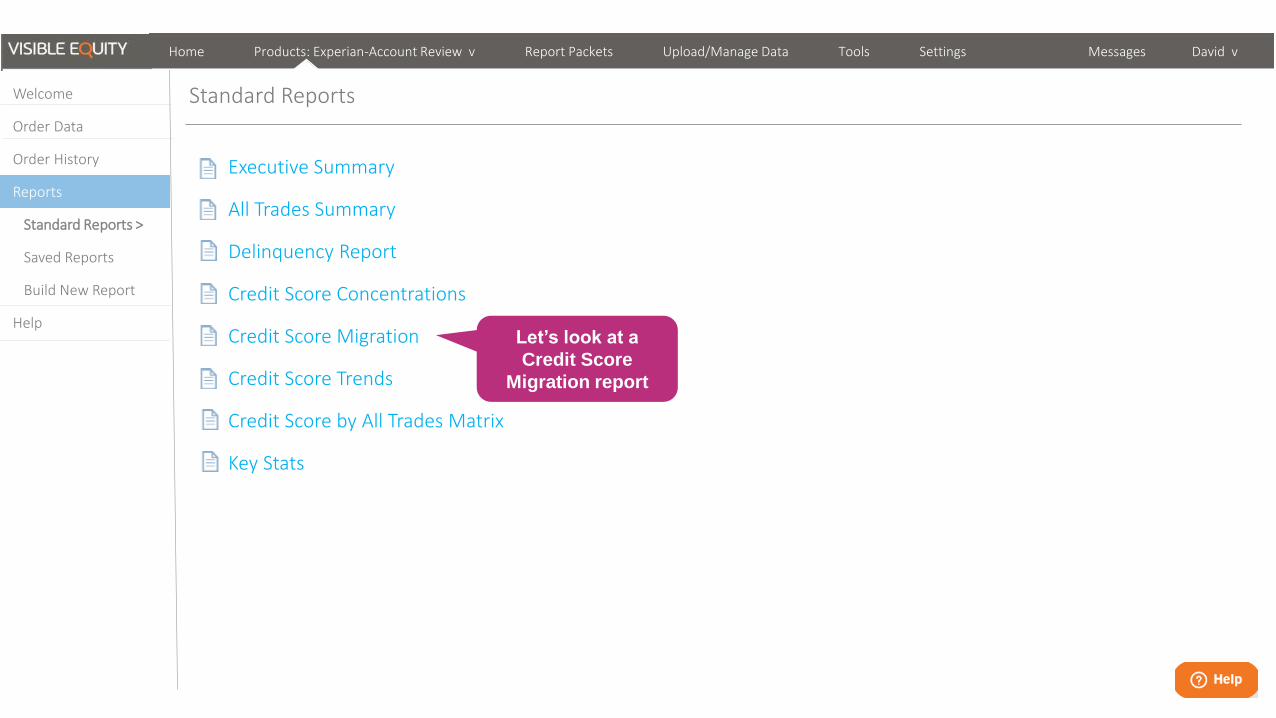
Standard Reports
V Executive Summary
All Trades Summary
Delinquency Report
Credit Score Concentrations
Credit Score Migration
Credit Score Trends
Credit Score by All Trades Matrix
Key Stats
Welcome
Order Data
Order Historyy
Reports
Standard Reports >
Saved Reports
Build New Report
Help
Messages David v Home Products: Experian-Account Review v Report Packets Upload/Manage Data Tools Settings
Let’s look at a
Credit Score
Migration report

Credit Score Migration
Home Products: Loan Analytics v Report Packets Upload/Manage Data Tools Settings Messages David v
Drilldown to a
list of loans
Return Export v Let’s take a closer look at all
borrowers negative migration
Credit Score Grade
Ori
gin
al C
red
it S
core
Gra
de
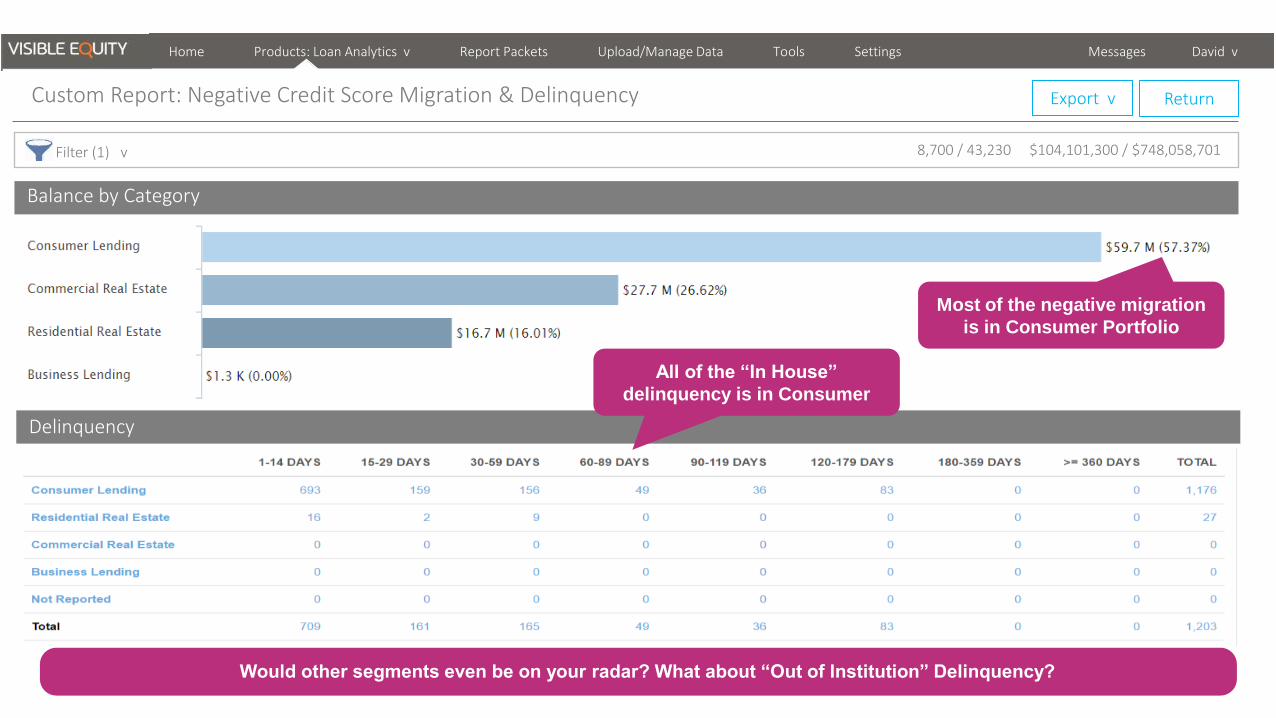
Custom Report: Negative Credit Score Migration & Delinquency
Home Products: Loan Analytics v Report Packets Upload/Manage Data Tools Settings Messages David v
Return Export v
Filter (1) v 8,700 / 43,230 $104,101,300 / $748,058,701
Would other segments even be on your radar? What about “Out of Institution” Delinquency?
Most of the negative migration
is in Consumer Portfolio
Balance by Category
Delinquency
All of the “In House”
delinquency is in Consumer
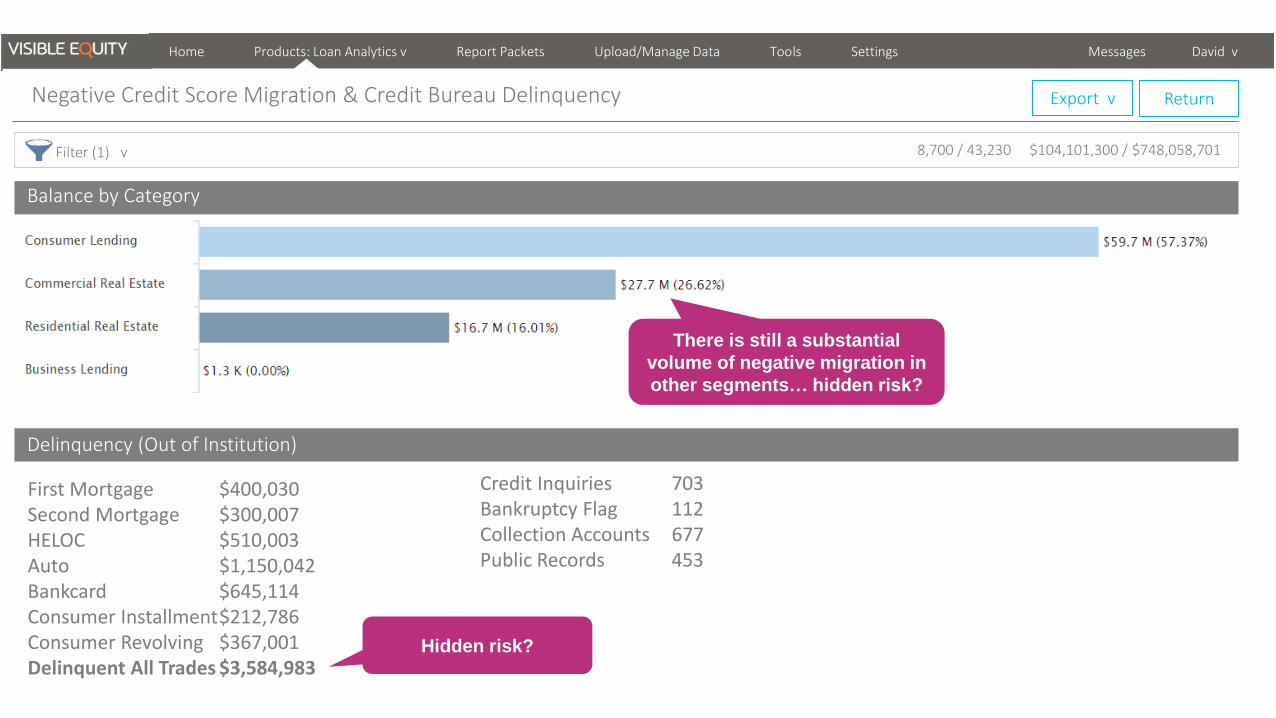
Negative Credit Score Migration & Credit Bureau Delinquency
Home Products: Loan Analytics v Report Packets Upload/Manage Data Tools Settings Messages David v
Return Export v
Filter (1) v 8,700 / 43,230 $104,101,300 / $748,058,701
There is still a substantial
volume of negative migration in
other segments… hidden risk?
Hidden risk?
First Mortgage $400,030 Second Mortgage $300,007 HELOC $510,003 Auto $1,150,042 Bankcard $645,114 Consumer Installment $212,786 Consumer Revolving $367,001 Delinquent All Trades $3,584,983
Credit Inquiries 703 Bankruptcy Flag 112 Collection Accounts 677 Public Records 453
Balance by Category
Delinquency (Out of Institution)

©Experian 22 4/28/2017 Experian Public Vision 2017
1. Refreshed credit scores and Premier Attributes℠
2. Produced credit score migration report
3. Drilled down to borrowers with negative migration
4. Viewed these borrowers by “out of institution” delinquency
5. Add to watchlist (or make other appropriate decision)
Scenario 1 Identify borrowers with hidden risk
Goal: Make
steps 1-4 fast
and easy
So you can spend time making good decisions…
Hidden risk
More hidden risk
Goal: Make
steps 1-4 fast
and easy
So you can spend time making good decisions…
Let’s talk exams…
Do you have a handle on what’s going on at your institution? (Do you know your data? Do you have consistent, comprehensive reporting?) Can you prove it? (Ad hoc reports!) Do you know what the focus will be? (Best practices reporting)

Let’s talk building custom reports and filtering…

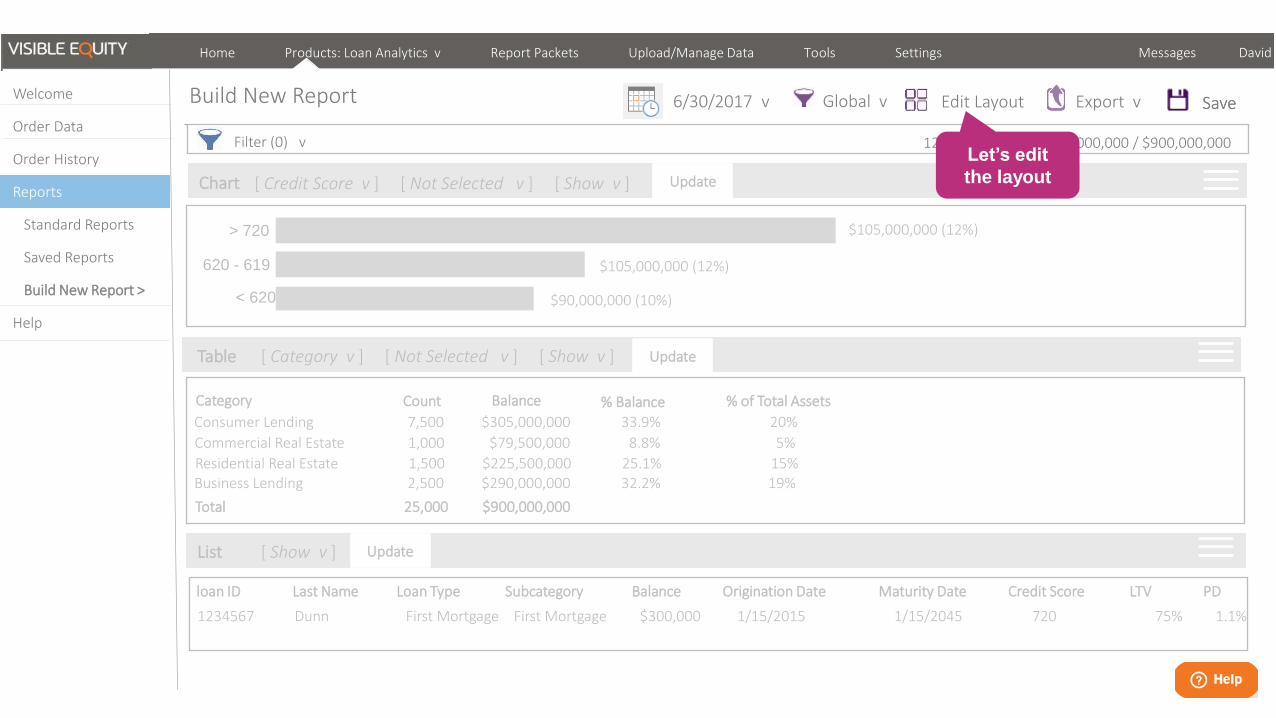
Build New Report
V
Welcome
Order Data
Order Historyy
Reports
Standard Reports
Saved Reports
Build New Report >
Help
Messages David v Home Products: Experian-Account Review v Report Packets Upload/Manage Data Tools Settings
1. Global Filter or Per Element Filter
2. Report Layout (Select Report Elements)
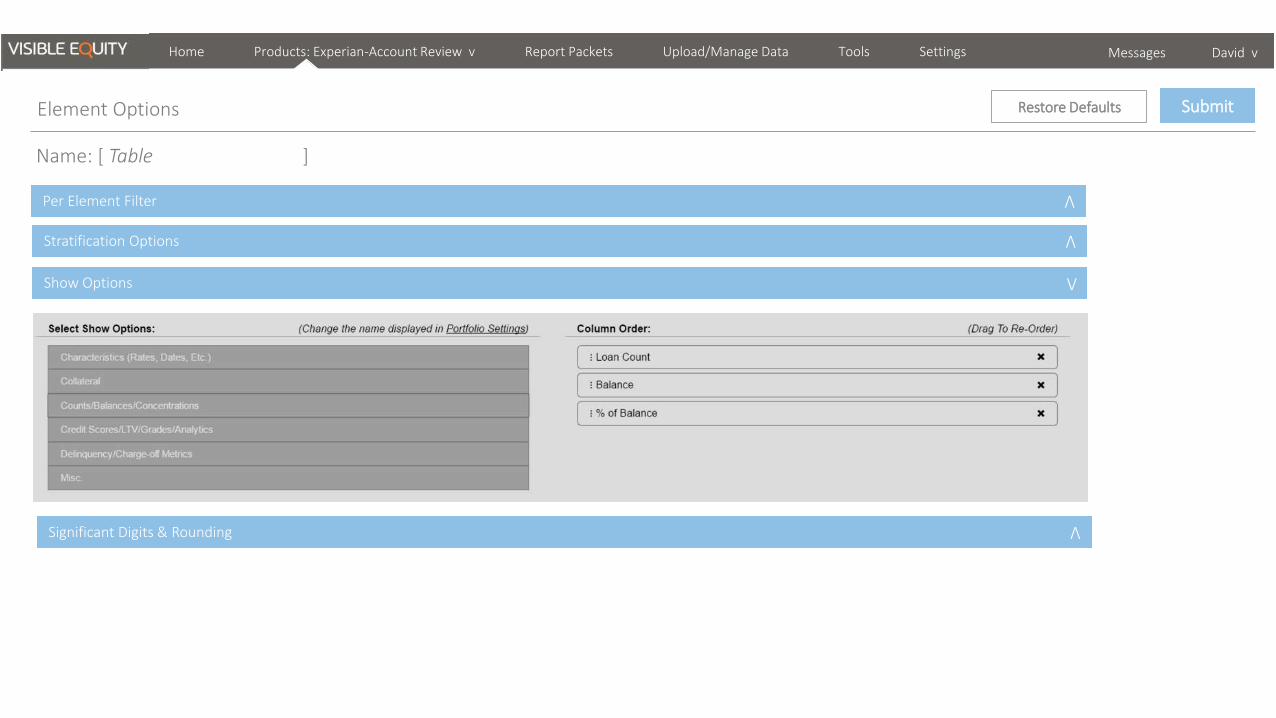
3. Element Options (Stratifications,
Show Options, Customizations, etc.)

Home Products: Loan Analytics v Report Packets Upload/Manage Data Tools Settings Messages David v
Build New Report 6/30/2017 v
Residential Real Estate 1,500 $225,500,000 25.1% 15%
Count Balance % Balance % of Total Assets Category
Business Lending 2,500 $290,000,000 32.2% 19%
Consumer Lending 7,500 $305,000,000 33.9% 20%
Total 25,000 $900,000,000
> 720
620 - 619
< 620
$105,000,000 (12%)
$105,000,000 (12%)
$90,000,000 (10%)
12,500 / 12,500 $900,000,000 / $900,000,000
Chart
Table [ Category v ] [ Not Selected v ] [ Show v ]
[ Credit Score v ] [ Not Selected v ] [ Show v ]
Update
Filter (0) v
Global v Edit Layout Export v Save
loan ID Last Name Loan Type Subcategory Balance Origination Date Maturity Date Credit Score LTV PD
List [ Show v ]
1234567 Dunn First Mortgage First Mortgage $300,000 1/15/2015 1/15/2045 720 75% 1.1%
Welcome
Order Data
Order Historyy
Reports
Standard Reports
Saved Reports
Build New Report >
Help
Update
Update
Global Filter
Per Element Filter
Commercial Real Estate 1,000 $79,500,000 8.8% 5%

Home Products: Loan Analytics v Report Packets Upload/Manage Data Tools Settings Messages David v
Return Export v
Filter (0) v 43,230 / 43,230 $748,058,701 / $748,058,701
Standard filters >
Saved filters >
Advanced filter (build new saved filter) Standard filters
Standard category/subcategory >
Custom category/subcategory >
Origination period >
Delinquency >
Grade/rating >

Update
Advanced Filter
V
[ ] Residential Lending
[ ] First Mortgage
[ ] Second Mortgage
[ ] Etc…
Count: 18,500 / 43,230
Balance: $300,000,000 / $748,058,701
Save / Return v
Filtering by:
1 Subcategory: New Auto x
Select Filter Category: [ Standard Categories v ]
[ ] Consumer Lending
[ X ] New Auto (Include v )
[ X ] Used Auto (Include v )
[ X ] Credit Card (Excludes v )
[ ] Etc.
Home Products: Experian-Account Review v Report Packets Upload/Manage Data Tools Settings
Messages David v
Select from multiple filter categories
including loan characteristics,
borrower characteristics,
credit bureau data, etc.
[ ] Business Lending
[ ] C&I Loans
[ ] CRE
[ ] Etc…
2 Subcategory: Used Auto x
[ And v ]
[ And v ]
3 Subcategory: Not Credit Cards x
Save filter for
quick future
access
Save
Home Products: Loan Analytics v Report Packets Upload/Manage Data Tools Settings Messages David v
Build New Report 6/30/2017 v
Residential Real Estate 1,500 $225,500,000 25.1% 15%
Count Balance % Balance % of Total Assets Category
Business Lending 2,500 $290,000,000 32.2% 19%
Consumer Lending 7,500 $305,000,000 33.9% 20%
Total 25,000 $900,000,000
> 720
620 - 619
< 620
$105,000,000 (12%)
$105,000,000 (12%)
$90,000,000 (10%)
12,500 / 12,500 $900,000,000 / $900,000,000
Chart
Table [ Category v ] [ Not Selected v ] [ Show v ]
[ Credit Score v ] [ Not Selected v ] [ Show v ]
Update
Filter (0) v
Global v Edit Layout Export v Save
loan ID Last Name Loan Type Subcategory Balance Origination Date Maturity Date Credit Score LTV PD
List [ Show v ]
1234567 Dunn First Mortgage First Mortgage $300,000 1/15/2015 1/15/2045 720 75% 1.1%
Welcome
Order Data
Order Historyy
Reports
Standard Reports
Saved Reports
Build New Report >
Help
Update
Update
Commercial Real Estate 1,000 $79,500,000 8.8% 5%
Let’s edit
the layout

Subscriptions:
Home Products: Loan Analytics v Report Packets Upload/Manage Data
Tools Institution Settings Ian v
Edit Layout
Elements
Submit
Current Layout
PDF Settings: [ x ] Portrait [ ] Landscape
Home Products: Loan Analytics v Report Packets Upload/Manage Data
Institution Settings Messages v Ian v Home Products: Loan Analytics v Report Packets Upload/Manage Data Tools Settings Messages David v
Chart
Multiline Box
Matrix
Chart
Table
List
Drag and drop
“Elements” to the
Current Layout

Home Products: Loan Analytics v Report Packets Upload/Manage Data Tools Settings Messages David v
Build New Report 6/30/2017 v
Class: 1st Mortgages (First Mortgage)
Residential Real Estate 1,500 $225,500,000 25.1% 15%
Count Balance % Balance % of Total Assets Category
Business Lending 2,500 $290,000,000 32.2% 19%
Commercial Real Estate 1,000 $79,500,000 8.8% 5%
Total 25,000 $900,000,000
Class: 1st Mortgages (First Mortgage) > 720
620 - 619
< 620
$105,000,000 (12%)
$105,000,000 (12%)
$90,000,000 (10%)
12,500 / 12,500 $900,000,000 / $900,000,000
Chart
Table [ Category v ] [ Not Selected v ] [ Show v ]
[ Credit Score v ] [ Not Selected v ] [ Show v ]
Update
Filter (0) v
Global v Edit Layout Export v Save
loan ID Last Name Loan Type Subcategory Balance Origination Date Maturity Date Credit Score LTV PD
List [ Show v ]
1234567 Dunn First Mortgage First Mortgage $300,000 1/15/2015 1/15/2045 720 75% 1.1%
Update
Update
6789101 Tuma First Mortgage First Mortgage $500,000 1/15/2015 1/15/2045 800 55% 0.1%
Welcome
Reports
Standard Reports
Saved Reports
Build New Report >
Help More report options: Filters
(if Per Element is selected),
More Stratification and Show
Options, Aliasing, Rounding,
Order, Labeling, etc.
Consumer Lending 7,500 $305,000,000 33.9% 20%
Home Products: Experian-Account Review v Report Packets Upload/Manage Data Tools Settings
Messages David v
Submit
Name: [ Table ]
V
V V
V
V
V
Per Element Filter
V
Stratification Options
V
Show Options V
Element Options
Significant Digits & Rounding
V
Restore Defaults

©Experian 33 4/28/2017 Experian Public Vision 2017
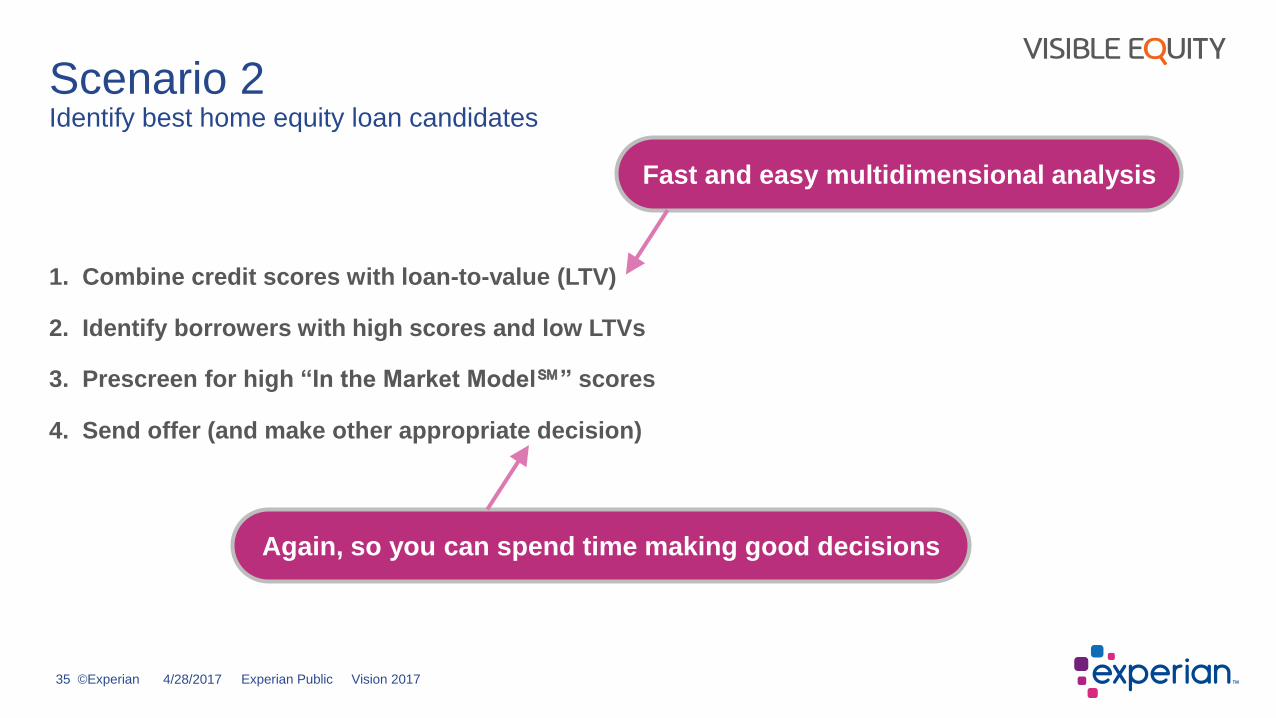
Scenario 2 Identify best home equity loan candidates
Property type: Single family home
Address: 1721 N Westmoreland Dr
Orlando, FL 32804
Details: 3 beds, 2 baths, 1,456 sqft.
Original value: $296,000
Valuation date: Dec, 2007
Value as of May 8, 2017 is?
But first let’s give away another prize…

©Experian 34 4/28/2017 Experian Public Vision 2017
Scenario 2 Identify best home equity loan candidates
Property type: Single family home
Address: 1721 N Westmoreland Dr
Orlando, FL 32804
Original value: $296,000
Valuation date: Dec, 2007
Current value: $332,000
Up $36,000
©Experian 35 4/28/2017 Experian Public Vision 2017
1. Combine credit scores with loan-to-value (LTV)
2. Identify borrowers with high scores and low LTVs
3. Prescreen for high “In the Market Model℠” scores
4. Send offer (and make other appropriate decision)
Scenario 2 Identify best home equity loan candidates
Fast and easy multidimensional analysis
Again, so you can spend time making good decisions

Standard Reports
V Executive Summary
Position Reports
Performance Reports
Migration & Trend Reports
Static Pool Reports
Welcome
Reports
Standard Reports >
Saved Reports
Build New Report
Help
Messages David v Home Products: Loan Analytics v Report Packets Upload/Manage Data Tools Settings
Select position
reports

Standard Reports>Position Reports
V Concentrations Report
Concentrations Matrix
Grade/Rating Comparison
Delinquency Migration
Messages David v Home Products: Loan Analytics v Report Packets Upload/Manage Data Tools Settings
Select
concentrations matrix
Welcome
Reports
Standard Reports >
Saved Reports
Build New Report
Help

Home Products: Loan Analytics v Report Packets Upload/Manage Data Tools Settings Messages David v
Return Export v
Filter (0) v 43,230 / 43,230 $748,058,701 / $748,058,701
Standard filters >
Saved filters >
Advanced filter (build new saved filter) Standard filters
Standard category/subcategory >
Custom category/subcategory >
Origination >
Delinquency >
Grade/rating >
Credit Score & LTV Matrix (Residential Lending)

<Previou
s
Home Products: Loan Analytics v Report Packets Upload/Manage Data Tools Settings Messages David v
Return Export v
Filter (1) v 8,700 / 43,230 $101,306,453 / 748,058,701
[ Credit Score v ] [ LTV v ] [ Show v ]
Update Matrix
Credit Score | LTV
Credit Score & LTV Matrix (Residential Lending)
Powerful to combine metrics!
We want to target residential loans with
high scores and low LTV (in other words,
low risk borrowers with equity…)

Welcome, David
Home Report Packets Upload/Manage Data Tools Settings Messages David v
Schedule Training
APPLICATION Analytics Analytics
LOAN LOAN Analytics
DEPOSIT Analytics
Not Subscribed
CUSTOMER & Marketing Analytics
ADVANCED LOAN Analytics
ALLOWANCE Expected Credit Loss (CECL)
PEER Analytics
Not Subscribed
FAIR LENDING Analytics
Not Subscribed Not Subscribed
EXPERIAN Account Review
EXPERIAN Prescreen
Select Prescreen
(permissible use)
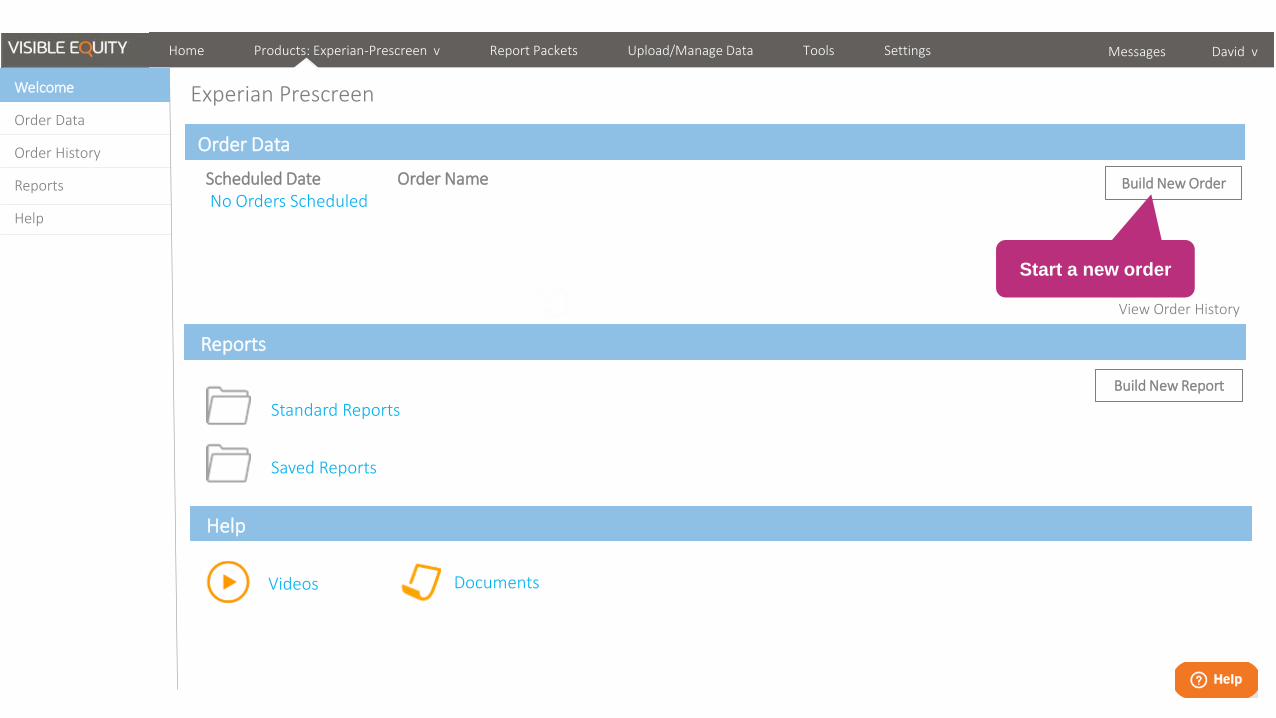
Experian Prescreen
Scheduled Date Order Name No Orders Scheduled
Order Data
Reports
Standard Reports
Saved Reports
Build New Report
Help
Videos Documents
Home Products: Experian-Prescreen v Report Packets Upload/Manage Data Tools Settings
Messages David v
Welcome
Order Data
Order History
Reports
Help
View Order History
Build New Order
Start a new order
Home Products: Experian-Prescreen v Report Packets Upload/Manage Data Tools Settings
Messages David v
Welcome
Order Data
Order History
Reports
Help
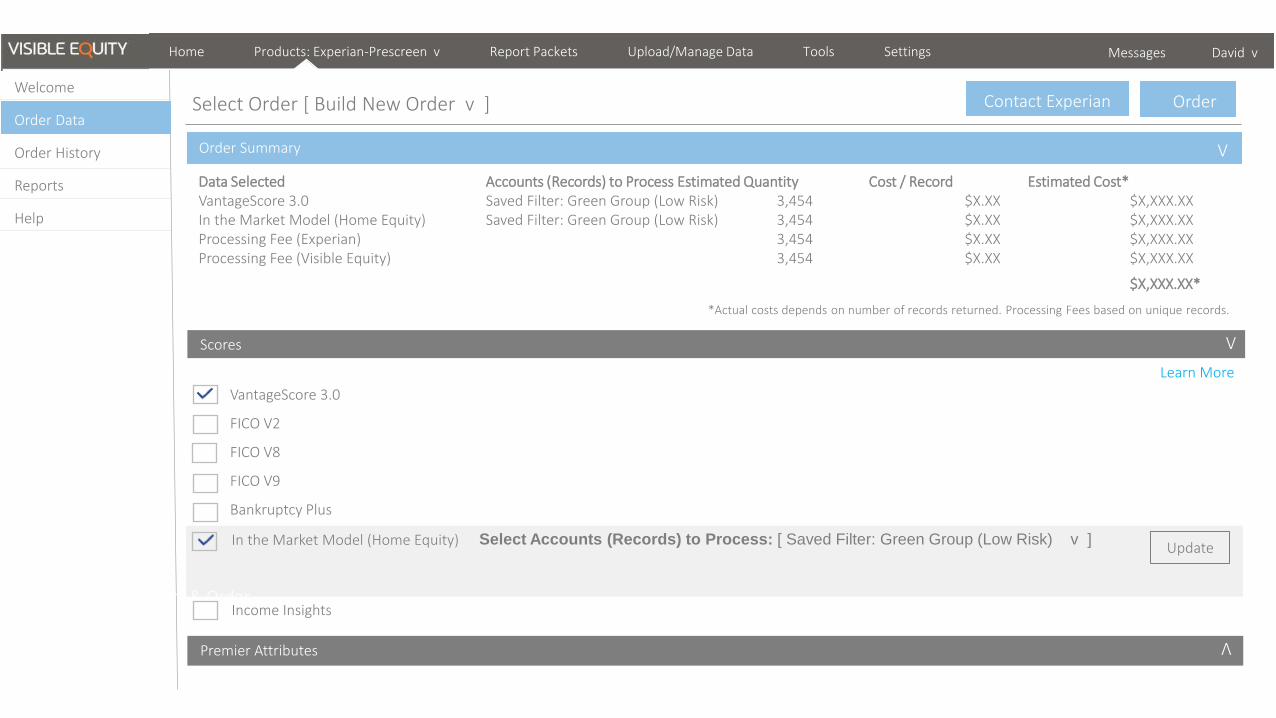
Order Select Order [ Build New Order v ] Contact Experian
Order Summary V
V
V 2 V
Confirm & Order
Premier Attributes
Scores
V
Select Accounts (Records) to Process: [ Saved Filter: Green Group (Low Risk) v ]
Learn More
Update In the Market Model (Home Equity)
V
VantageScore 3.0
FICO V2
FICO V8
FICO V9
Bankruptcy Plus
Income Insights
V
Data Selected Accounts (Records) to Process Estimated Quantity Cost / Record Estimated Cost* VantageScore 3.0 Saved Filter: Green Group (Low Risk) 3,454 $X.XX $X,XXX.XX In the Market Model (Home Equity) Saved Filter: Green Group (Low Risk) 3,454 $X.XX $X,XXX.XX Processing Fee (Experian) 3,454 $X.XX $X,XXX.XX Processing Fee (Visible Equity) 3,454 $X.XX $X,XXX.XX
$X,XXX.XX*
*Actual costs depends on number of records returned. Processing Fees based on unique records.

Home Products: Experian-Prescreen v Report Packets Upload/Manage Data Tools Settings
Messages David v
Welcome
Order Data
Order History
Reports
Help
Place Order Order Name [ Scenario 2 ]
[ x ] One Time
Order on [ Now ]
[ ] Recurring
*Please select a date that allows enough time for desired data files to be updated.
Order Summary
Place Order
Cancel
Order
Data Selected Accounts (Records) to Process Estimated Quantity Cost / Record Estimated Cost* VantageScore 3.0 Saved Filter: Green Group (Low Risk) 3,454 $X.XX $X,XXX.XX In the Market Model (Home Equity) Saved Filter: Green Group (Low Risk) 3,454 $X.XX $X,XXX.XX Processing Fee (Experian) 3,454 $X.XX $X,XXX.XX Processing Fee (Visible Equity) 3,454 $X.XX $X,XXX.XX
$X,XXX.XX*
*Actual costs depends on number of records returned. Processing Fees based on unique records.

Save
Home Products: Experian Prescreen v Report Packets Upload/Manage Data Tools
Settings
Messages David v
Build New Report 6/30/2017 v
Residential Real Estate 1,500 $225,500,000 25.1% 15%
Count Balance % Balance % of Total Assets Category
Business Lending 2,500 $290,000,000 32.2% 19%
Consumer Lending 7,500 $305,000,000 33.9% 20%
Total 25,000 $900,000,000
> 720
620 - 619
< 620
$105,000,000 (12%)
$105,000,000 (12%)
$90,000,000 (10%)
12,500 / 12,500 $900,000,000 / $900,000,000
Chart
Table [ Category v ] [ Not Selected v ] [ Show v ]
[ Credit Score v ] [ Not Selected v ] [ Show v ]
Update
Filter (0) v
Global v Edit Layout Export v
loan ID Last Name Loan Type Subcategory Balance Origination Date Maturity Date Credit Score LTV PD
List [ Show v ]
1234567 Dunn First Mortgage First Mortgage $300,000 1/15/2015 1/15/2045 720 75% 1.1%
Welcome
Order Data
Order Historyy
Reports
Standard Reports
Saved Reports
Build New Report >
Help
Update
Update
Commercial Real Estate 1,000 $79,500,000 8.8% 5%
<Previou
s
Home Products: Experian-Prescreen v Report Packets Upload/Manage Data Tools Settings
Messages David v
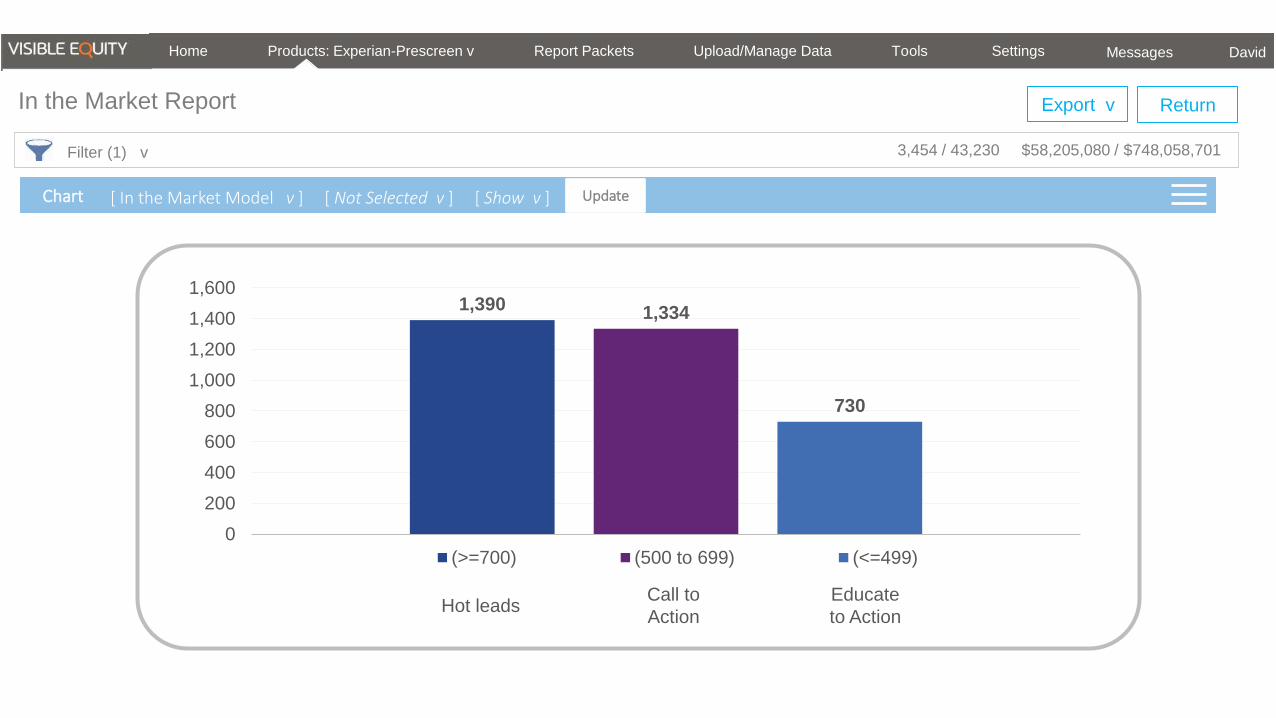
Return Export v
3,454 / 43,230 $58,205,080 / $748,058,701
[ In the Market Model v ] [ Not Selected v ] [ Show v ]
Update Chart
Filter (1) v
In the Market Report
1,390 1,334
730
0
200
400
600
800
1,000
1,200
1,400
1,600
(>=700) (500 to 699) (<=499)
Call to
Action
Educate
to Action Hot leads

<Previou
s
Home Products: Experian-Prescreen v Report Packets Upload/Manage Data Tools Settings
Messages David v
Return Export v
Filter (1) v 3,550 / 43,230 $58,205,080 / $748,058,701
1245567 $110,500 First Mortgage 4/15/2017 4/15/2025 700
4562233 $222,092 First Mortgage 4/16/2017 4/16/2029 680
7262434 $98,000 First Mortgage 3/15/2017 3/15/2027 650
3562239 $143,304 First Mortgage 3/15/2017 3/15/2025 740
2222245 $214,006 First Mortgage 1/15/2017 1/15/2029 810
6239954 $95,605 First Mortgage 12/02/2016 12/02/2025 790
4334991 $229,052 First Mortgage 12/01/2016 12/01/2027 715
9443782 $333,031 First Mortgage 11/25/2016 11/25/2029 735
…
< Previous Next >
Loan ID Balance Loan Type Description Origination Date Maturity Date In the Market Model Score
[ Show v ]
Update List
In the Market Report
©Experian 47 4/28/2017 Experian Public Vision 2017
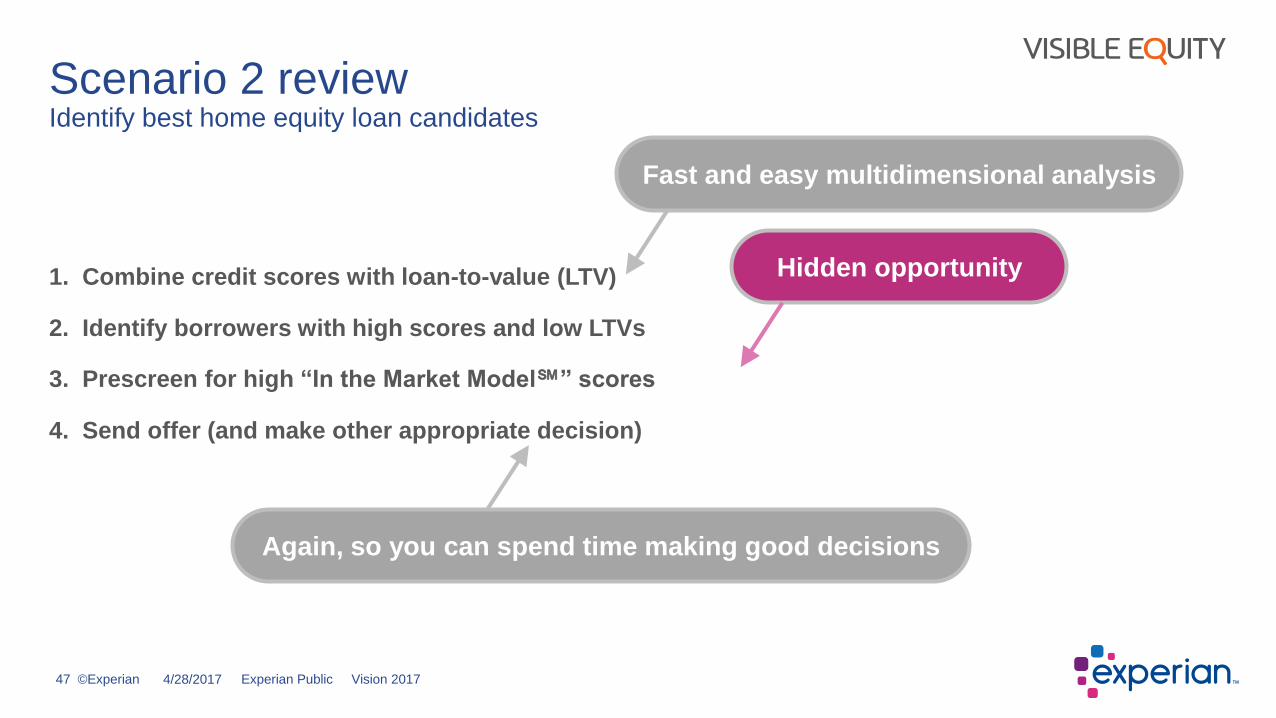
1. Combine credit scores with loan-to-value (LTV)
2. Identify borrowers with high scores and low LTVs
3. Prescreen for high “In the Market Model℠” scores (home equity)
4. Send offer (and make other appropriate decision)
Scenario 2 review Identify best home equity loan candidates
Fast and easy multidimensional analysis
Again, so you can spend time making good decisions
Hidden opportunity

©Experian 48 4/28/2017 Experian Public Vision 2017
Last game … birthday match
Interesting fact: In a room of 23 people, there is
a 50.7% probability of two or more people having
the same birthday. For 60 people, it’s 99.4%.
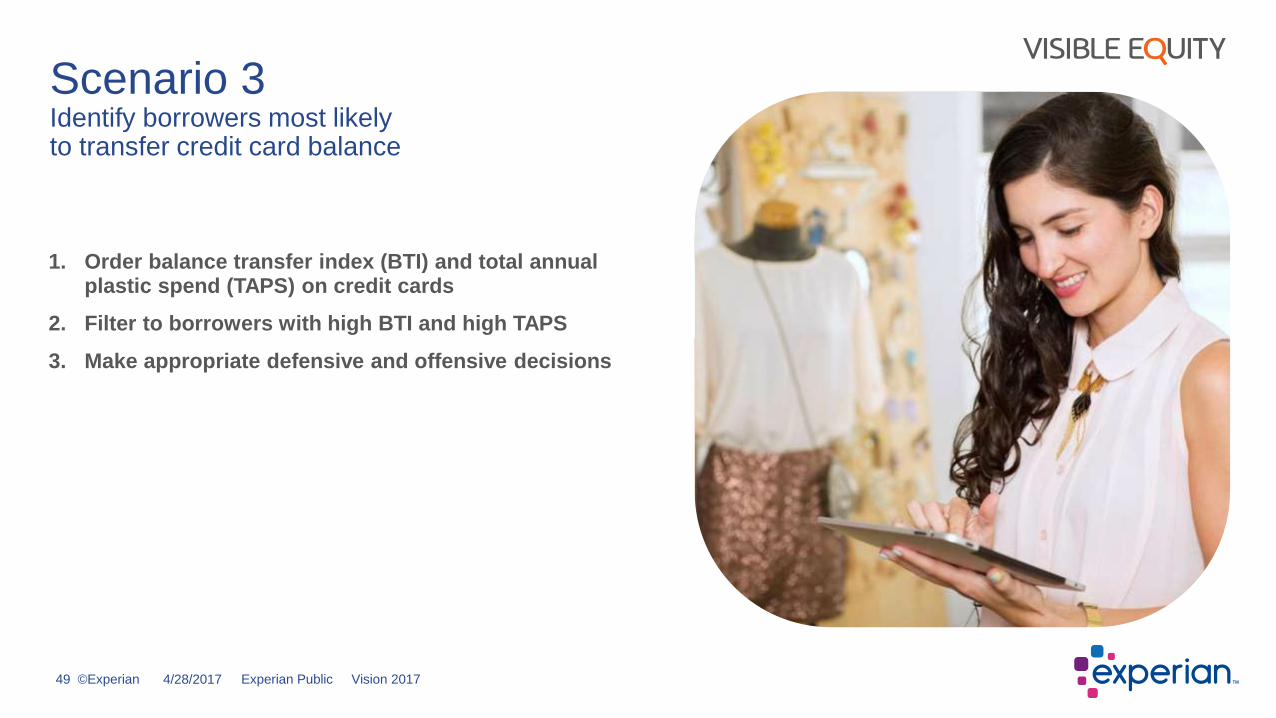
Scenario 3 Identify borrowers most likely to transfer credit card balance
Image source: Pixabay.com
©Experian 49 4/28/2017 Experian Public Vision 2017
1. Order balance transfer index (BTI) and total annual plastic spend (TAPS) on credit cards
2. Filter to borrowers with high BTI and high TAPS
3. Make appropriate defensive and offensive decisions
Scenario 3 Identify borrowers most likely to transfer credit card balance
Welcome, David
Home Report Packets Upload/Manage Data Tools Settings Messages David v
Schedule Training
APPLICATION Analytics Analytics
LOAN LOAN Analytics
DEPOSIT Analytics
Not Subscribed
CUSTOMER & Marketing Analytics
ADVANCED LOAN Analytics
ALLOWANCE Expected Credit Loss (CECL)
PEER Analytics
Not Subscribed
FAIR LENDING Analytics
Not Subscribed Not Subscribed
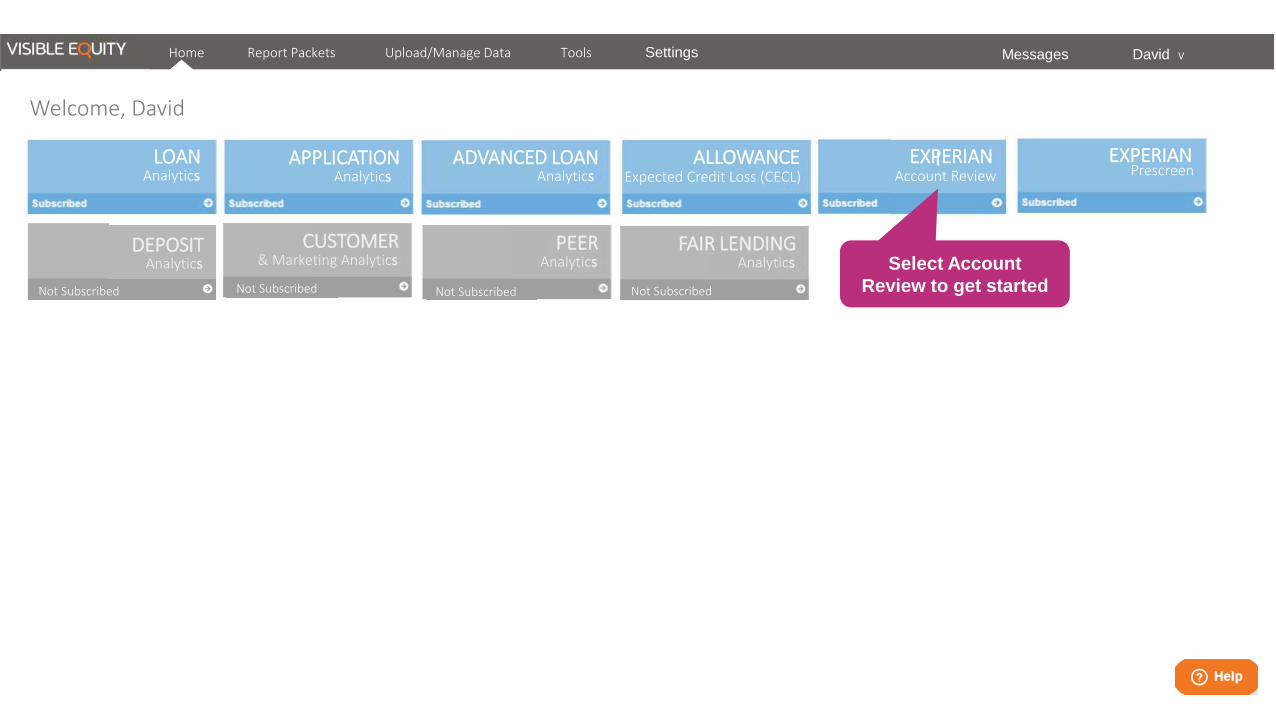
EXPERIAN Account Review
EXPERIAN Prescreen
Select Account
Review to get started

Welcome: Experian Account Review
Scheduled Date Order Name 7/15/2017 Account Review 10/15/2017 Account Review 1/15/2018 Year End Account Review 4/15/2018 Account Review
Order Data
Reports
Standard Reports
Saved Reports
Build New Report
Help
Videos Documents
Home Products: Experian-Account Review v Report Packets Upload/Manage Data Tools Settings
Messages David v
Welcome
Order Data
Order History
Reports
Help
View Order History
Build New Order
Start a new order

Apply | Edit
Home Products: Experian- Account Review v Report Packets Upload/Manage Data Tools
Settings Messages David v
Welcome
Order Data
Order History
Reports
Help
Order Select Order [ Build New Order v ] Contact Experian
Order Summary V
V
V
2 V
Premier Attributes
Scores
V
Select Accounts (Records) to Process: [ Not Selected v ]
Learn More
Update Balance Transfer Index
V
VantageScore 3.0
FICO V2
FICO V8
FICO V9
Bankruptcy Plus
Income Insights
V
Standard Filters >
Saved Filters >
Advanced Filter (Build New Saved Filter)
Let’s use a saved filter
we created earlier.
Saved Filters
Watchlist
Has CC, High spend
Etc.
Here

Home Products: Experian-Account Review v Report Packets Upload/Manage Data Tools Settings
Messages David v
Welcome
Order Data
Order History
Reports
Help
Order Select Order [ Build New Order v ] Contact Experian
Order Summary
V
Premier Attributes
Scores
EIRC (Estimated Interest Rate Calculations)
TAPS (Total Annual Plastic Spend)
Trended Data
V
V
V
V
V
TAPS 4.0
Learn More
Update
Data Selected Accounts (Records) to Process Estimated Quantity Cost / Record Estimated Cost* Balance Transfer Index Saved Filter: Has CC, High spend 4,200 $X.XX $X,XXX.XX TAPS 4.0 Standard Filter: Consumer Card 15,000 $X.XX $X,XXX.XX Processing Fee (Experian) 15,000 $X.XX $X,XXX.XX Processing Fee (Visible Equity) 15,000 $X.XX $X,XXX.XX
$X,XXX.XX*
*Actual costs depends on number of records returned. Processing Fees based on unique records.
Select Accounts (Records) to Process: [ Standard Filter: Consumer Card v ]
Order BTI
and TAPS

Home Products: Experian-Account Review v Report Packets Upload/Manage Data Tools Settings
Messages David v
Welcome
Order Data
Order History
Reports
Help
Order Select Order [ Build New Order v ] Contact Experian
Premier Attributes
Scores
EIRC (Estimated Interest Rate Calculations)
TAPS (Total Annual Plastic Spend)
Trended Data
V
V
V
V
V
TAPS 4.0
Learn More
Update Select Accounts (Records) to Process: [ Saved Filter: Has Auto, no Card v ]
Order Summary
V
Data Selected Accounts (Records) to Process Estimated Quantity Cost / Record Estimated Cost* Balance Transfer Index Saved Filter: Has CC, High spend 4,200 $X.XX $X,XXX.XX TAPS 4.0 Standard Filter: Consumer Card 15,000 $X.XX $X,XXX.XX Processing Fee (Experian) 15,000 $X.XX $X,XXX.XX Processing Fee (Visible Equity) 15,000 $X.XX $X,XXX.XX
$X,XXX.XX*
*Actual costs depends on number of records returned. Processing Fees based on unique records.
Each product has a link
to get more information

Experian TAPSSM (Total Annual Plastic Spend)
Select Data to Buy
Data Dictionary
Sample Report
V
V
Experian TAPSSM is the first industry-unique algorithm that accurately estimates a consumer’s spend on all general purpose credit
and charge cards over the last 12 months.
Product Sheet
V
How Does it Work?
V
Home Products: Experian-Account Review v Report Packets Upload/Manage Data Tools Settings
Messages David v
Contact Experian Return

Home Products: Experian-Account Review v Report Packets Upload/Manage Data Tools Settings
Messages David v
Welcome
Order Data
Order History
Reports
Help
Place Order Order Name [ Credit Card Analysis ]
[ ] One Time
Order on [ 4/15/17 ]
[ x ] Recurring
Frequency: [ Monthly v ]
Starting Date: [ 7/15/17 ]
Ending Date: [ None Selected ]
*Please select a date that allows enough time for desired data files to be updated.
Order Summary
Place Order
Cancel
Order
Order Summary
Data Selected Accounts (Records) to Process Estimated Quantity Cost / Record Estimated Cost* Balance Transfer Index Saved Filter: Has CC, High spend 4,200 $X.XX $X,XXX.XX TAPS 4.0 Standard Filter: Consumer Card 15,000 $X.XX $X,XXX.XX Processing Fee (Experian) 15,000 $X.XX $X,XXX.XX Processing Fee (Visible Equity) 15,000 $X.XX $X,XXX.XX
$X,XXX.XX*
*Actual costs depends on number of records returned. Processing Fees based on unique records.

<Previou
s
Home Products: Experian-Prescreen v Report Packets Upload/Manage Data Tools Settings
Messages David v
Return Export v Credit Card Defense List
Filter (1) v 1,134 / 15,000 $11,205,080 / $54,058,701
1245567 $10,500 Consumer Card 1/15/2016 120000 705
4562233 $22,092 Consumer Card 2/16/2015 60000 780
7262434 $12,000 Consumer Card 3/15/2014 70000 750
3562239 $10,304 Consumer Card 11/15/2011 65000 740
2222245 $14,006 Consumer Card 10/11/2014 90000 810
6239954 $15,605 Consumer Card 12/02/2016 130000 790
4334991 $21,052 Consumer Card 12/01/2012 210000 815
9443782 $15,031 Consumer Card 11/25/2016 45000 835
…
< Previous Next >
Customer ID Balance Loan Type Description Origination Date TAPS 4.0 BTI Score
[ Show v ]
Update List
How you can you protect
against high spender attrition?

<Previou
s
Home Products: Experian-Prescreen v Report Packets Upload/Manage Data Tools Settings
Messages David v
Return Export v Credit Card Offense List
Filter (1) v 4,500 / 15,000 $605,080 / $54,058,701
5245567 $500 Consumer Card 1/15/2016 46000
4552235 $450 Consumer Card 2/16/2015 54000
7552434 $1,200 Consumer Card 3/15/2014 70000
5552239 $920 Consumer Card 11/15/2011 57000
5442245 $0 Consumer Card 10/11/2014 120000
2339954 $340 Consumer Card 12/02/2016 87000
44434991 $93 Consumer Card 12/01/2012 29000
4043782 $1,121 Consumer Card 11/25/2016 62000
…
< Previous Next >
Customer ID Balance Loan Type Description Origination Date TAPS 4.0
[ Show v ]
Update List
How can you promote more
spend on your product?
©Experian 59 4/28/2017 Experian Public Vision 2017
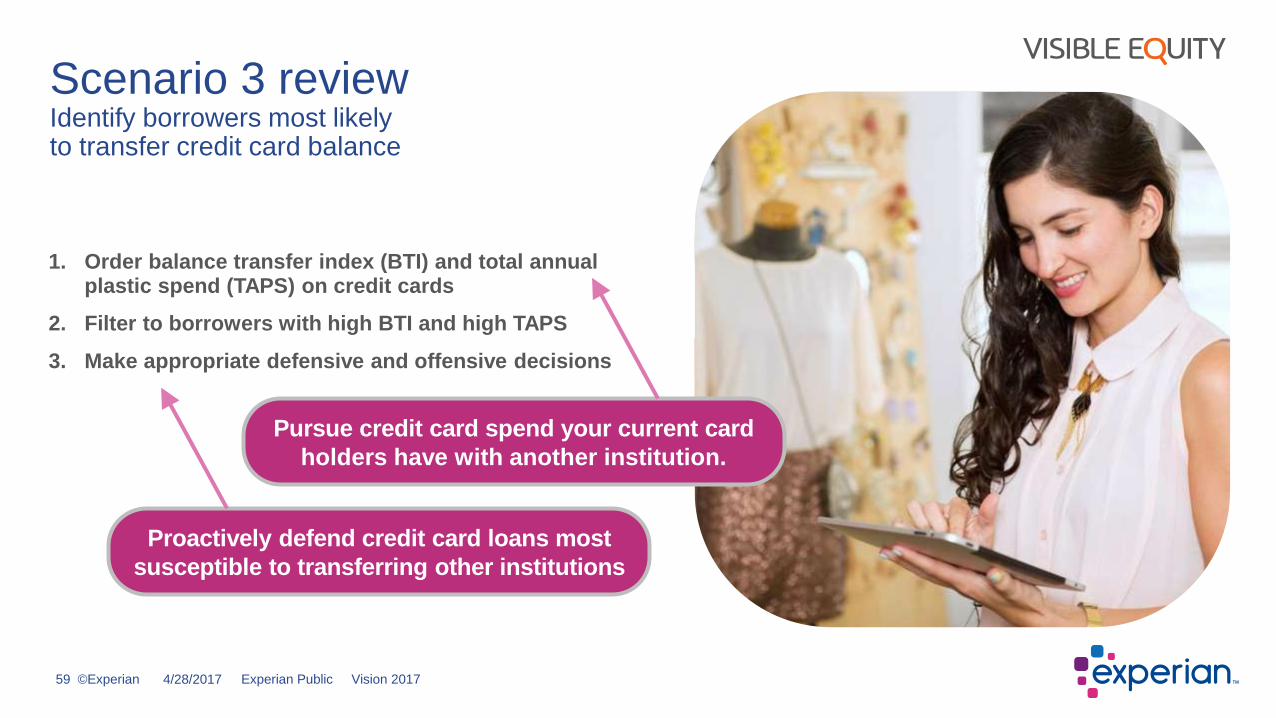
1. Order balance transfer index (BTI) and total annual plastic spend (TAPS) on credit cards
2. Filter to borrowers with high BTI and high TAPS
3. Make appropriate defensive and offensive decisions
Scenario 3 review Identify borrowers most likely to transfer credit card balance
Pursue credit card spend your current card
holders have with another institution.
Proactively defend credit card loans most
susceptible to transferring other institutions
©Experian 60 4/28/2017 Experian Public Vision 2017
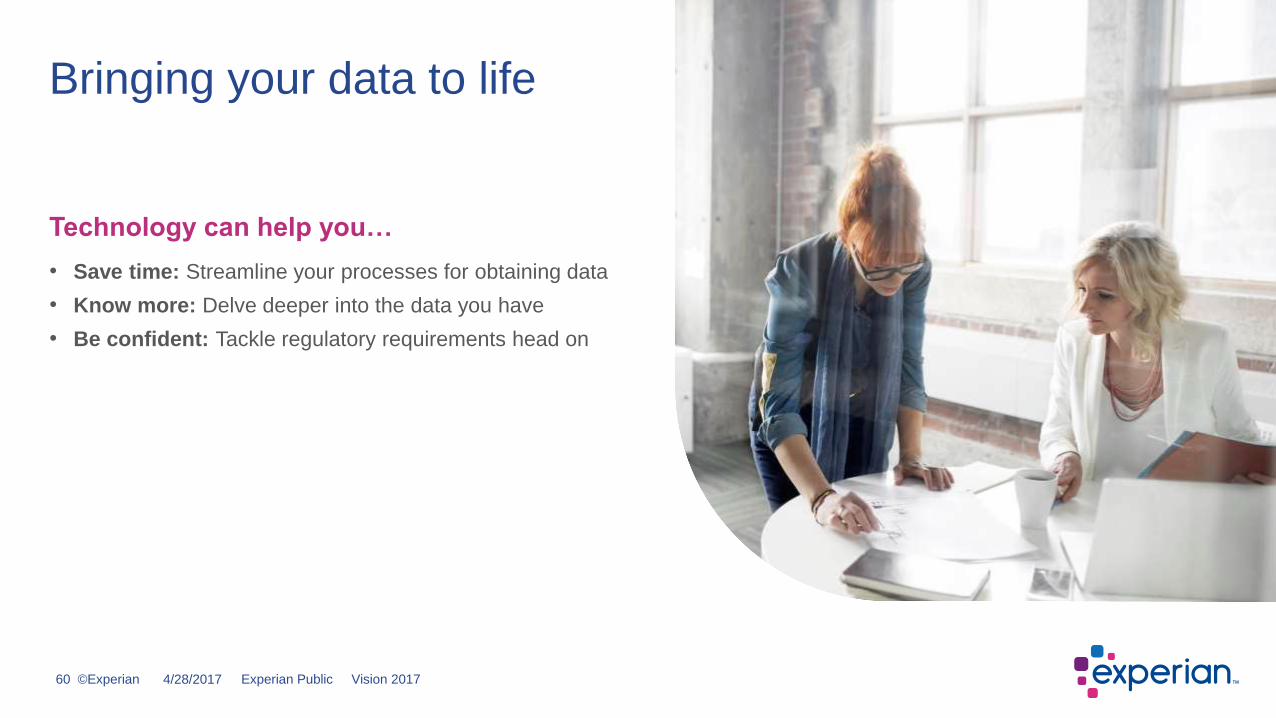
Technology can help you…
• Save time: Streamline your processes for obtaining data
• Know more: Delve deeper into the data you have
• Be confident: Tackle regulatory requirements head on
Bringing your data to life

©Experian 61 4/28/2017 Experian Public Vision 2017
Experian contact:
Elias Tuma [email protected]
Questions and answers

©Experian 62 4/28/2017 Experian Public Vision 2017
Share your thoughts about Vision 2017!
Please take the time now to give us your feedback about this session.
You can complete the survey at the kiosk outside.
How would you rate both the Speaker and Content?