Bringing Technology Innovation to your Business to your Business Bringing Technology Annual Report...
128
Innovation to your Business Bringing Technology Annual Report 2015
Transcript of Bringing Technology Innovation to your Business to your Business Bringing Technology Annual Report...

Innovation to your BusinessBringing Technology
Annual Report2015
Lahore - Head Office Karachi Dubai
Chamber of Commerce Building,11 Sharae Aiwane Tijarat,Lahore, PakistanT: +92 42 36304825-35F: +92 42 36368857
E-5, Central Commercial Area,Shaheed-e-Millat Road,Karachi, PakistanT: +92 21 34549385-87F: +92 21 34549389
TechVista Systems FZ-LLCOffice 105, Building 11 Dubai Internet City,PO Box 500497, Dubai, UAET: + 9714 369 3525F: +9714 456 3761
Systems Limited
Des
ign
ed &
Pro
du
ced
by

Company Profile
Stakeholders’ Information
Corporate Governance
Separate Financial Statements
Consolidated Financial Statements
Corporate Information
Board of Directors
Vision and Mission
About Systems Limited
Services and Solutions
Partnerships and Recognitions
Our Products
Business Model and Competencies
Testimonials
Financial Analysis
Shareholders’ Information
Chairman’s Review
CEO’s Review
Directors’ Report to the Shareholders
Pattern of Shareholding
Notice of Annual General Meeting
Statement of Compliancewith Best Practices of the Code of Corporate Governance
Review Report to the Memberson Statement of Compliance with Best Practices ofCode of Corporate Governance
Auditors’ Report to the Members
Balance Sheet
Profit and Loss Account
Statement of Comprehensive Income
Cash Flow Statement
Statement of Changes in Equity
Notes to the Financial Statements
Auditors’ Report to the Members
Consolidated Balance Sheet
Consolidated Profit and Loss Account
Consolidated Statement of Comprehensive Income
Consolidated Cash Flow Statement
Consolidated Statement of Changes in Equity
Notes to the Consolidated Financial Statements
Form of Proxy
02
04
06
08
10
12
13
14
15
16
22
24
25
26
38
40
42
44
Contents
47
48
50
51
52
53
54
87
88
90
91
92
93
94
125

Company Information
Where does 38 years of Business Technology get you?
It gets you to Systems Limited.
BOARD OF DIRECTORS
AUDIT COMMITTEE
HUMAN RESOURCE & REMUNERATION COMMITTEE
CHIEF FINANCIAL OFFICER & COMPANY SECRETARY
AUDITORS
Mr. Aezaz Hussain Non-executiveChairman
Mr. Asif Peer ExecutiveCEO and Managing Director
Mr. Arshad Masood Non-executiveDirector
Mr. Omar Saeed IndependentDirector
Mr. Ayaz Dawood IndependentDirector
Mr. Asif Jooma IndependentDirector
Mr. Tahir Masaud IndependentDirector
Mr. Ayaz DawoodChairman
Mr. Omer SaeedMember
Mr. Tahir MasaudMember
Mr. Omar SaeedChairman
Mr. Asif JoomaMember
Mr. Tahir MasaudMember
Mr. Affan Sajjad
Ernst & Young Ford Rhodes Sidat HyderChartered Accountants Lahore
LEGAL ADVISOR
BANKERS
SHARES REGISTRAR
REGISTERED OFFICE
KARACHI OFFICE
DUBAI OFFICE
WEB PRESENCE
Hassan & Hassan Advocates
Habib Metropolitan Bank LimitedUnited Bank LimitedStandard Chartered Bank (Pakistan) Limited Albaraka Bank LimitedBank Alfalah LimitedBank Islami LimitedMeezan Bank LimitedDubai Islamic BankFaysal Bank LimitedDeutsche Bank AG
THK Associates (Private) Limited. 2nd Floor, State Life Building-3,Dr. Ziauddin Ahmed Road,Karachi.T: +92 21 111-000-322F: +92 21 35655595
Chamber of Commerce Building,11 Sharae Aiwane Tijarat,Lahore, Pakistan.T: +92 42 36304825-35F: +92 42 36368857
E-5, Central Commercial Area,Shaheed-e-Millat Road,Karachi, PakistanT: +92 21 34549385-87F: +92 21 34549389
TechVista Systems FZ-LLCOffice 105, Building 11Dubai Internet City,PO Box 500497,Dubai, UAET: + 9714 3693525F: +9714 456 3761
www.systemsltd.com

Mr. Omar SaeedIndependent Director
Mr. Ayaz DawoodIndependent Director
Mr. Asif JoomaIndependent Director
Mr. Omar Saeed is the Chief Executive of Service Industries Limited. He is also the founder and Chairman of Ovex Technologies and sits on the Boards of System Limited and Atlas Battery Limited.
He is also a member of the National Policy Platform formed by the Competitiveness Support Fund.
He teaches Entrepreneurship at LUMS where he is an adjunct faculty member.
Mr. Omar got his Bachelors degree from Brown University and MBA from Harvard Business School, and currently serves as the President of the Harvard Business School Club of Pakistan.
Mr. Omar Saeed also serves as a Chairman of Human Resource and Remuneration Committee of Systems Limited.
Mr. Asif Jooma started his career in the corporate sector with ICI Pakistan in 1983 and has over 28 years of extensive experience in senior commercial and leadership roles. Following early years with ICI Pakistan and subsequently Pakistan PTA Limited, Asif Jooma was appointed Managing Director of Abbott Laboratories Pakistan Limited in 2007. After serving there for nearly six years, he was appointed Chief Executive of ICI Pakistan Limited in February 2013.
A Bachelor of Arts in Developmental Economics from Boston University, Mr. Asif has previously served as President, American Business Council (ABC), President of Overseas Investors Chamber of Commerce & Industry (OICCI) and Chairman of Pharma Bureau. He also serves as a Director on NIB Bank Limited, Systems Limited and Board of Investment, Government of Pakistan.
Mr. Ayaz Dawood is serving BRR Investments (Private) Ltd.(Managers of BRR Guardian Modaraba and Crescent Standard Modaraba) as its Chief Executive.
He has the distinction of being Founder of Burj Bank (Dawood Islamic Bank), Dawood Family Takaful, Dawood Equities Limited, First Dawood Investment Bank, Dawood Capital Management, managers of First Dawood Mutual Fund, Dawood Money Market Fund and Dawood Islamic Fund.
Mr. Dawood has also served Modaraba Association of Pakistan as its Chairman. He is a director of Japan Power Company Limited and Chairman of its Human Resource Committee and a director of Systems Limited and Chairman of its Audit Committee.
A member of Young Presidents Organization, Mr. Dawood is a graduate in Economics from McGill University, Montreal and completed his MBA in Finance and Money and Financial Markets with distinction from Colombia Business School, New York.
Mr. Tahir Masaud is the Chief Executive Officer of IGI Insurance Limited and a Director on the Board of IGI Life Insurance Limited. He joined as a Director on Board of Systems Limited on 18 March 2015.
Mr. Masaud brings with him over 17 years of rich and varied experience gained in senior leadership positions within the general insurance sector in Pakistan and United Kingdom. His background includes sales and marketing administration, product development and project management.
He is a Chartered Insurer with an Advanced Diploma in Insurance (ACII) from Chartered Insurance Institute, United Kingdom. Mr. Tahir has completed his post graduations in Computer Sciences and Business Administration from Lahore University of Management Sciences (LUMS), Pakistan. He has attended numerous professional development programs in Pakistan, United Kingdom and Germany.
Mr. Tahir MasaudIndependent Director
Profile of the Board of Directors
Mr. Aezaz HussainChairman/Non-Executive Director
Mr. Asif PeerChief Executive Officer
Mr. Arshad MasoodNon-Executive Director
Mr. Aezaz Hussain founded Systems Limited in 1977 as the first software house in Pakistan. His professional acumen provided the overall direction for turn-key computer projects involving systems design, hardware selection and installation, and the planning and management of large scale industrial projects. Within the organization, he has been responsible for the internal restructuring needed to respond to periodic shifts in the Company's strategy. Mr. Aezaz was also involved in the acquisition of Visionet Systems, Inc., in New Jersey, USA. His main role is the development of enterprise strategy.
He was a member of Pakistan's Information Technology Commission, which advised the President of Pakistan on IT related matters and national policies. He has been a member of a number of Committees and Advisory bodies set up by the government on information technology strategies and on the development of public sector/government information systems.
He was a founding Member and Founding President of Pakistan Software Houses Association (PASHA).
He is a Member, Economic Advisory Board, Government of Pakistan and of the Information Technology Commission of Pakistan as well as the Council of the Computer Society of Pakistan. He is a Member of the Board of TEVTA Lahore.
Mr. Arshad Masood started his career with IBM Corporation in the US and held various professional and managerial positions, including Sales Manager. He was a consistent top performer and his primary objective was to enhance customer relationship, protect the revenue base and identify new revenue opportunities.
In 1994, Mr. Arshad Masood founded Visionet Systems Inc., USA which was acquired as subsidiary by Systems Limited in 1997. As the founder, Mr. Arshad Masood envisioned and executed a strategy to create a general purpose consulting and a solutions Company.
Mr. Arshad Masood as President is responsible for Sales & Marketing and for managing the engagements with key clients of the group in the US. He helped Visionet Systems, Inc. build a strategy and value proposition for products and services in the mortgage industry.
Mr. Arshad Masood holds a BSc (Engineering) degree from Engineering University Lahore, a M.Sc. degree from University of Guelph, Canada, and a MBA degree from Baruch College, New York.
Mr. Asif started his professional career with Systems Limited, Pakistan, in 1996 straight out from University. Out of the 20 years of his Professional Experience, Mr. Asif has spent 13 years in US and played vital role in the success and growth of Systems Limited US Office as Chief Operating Officer.
Currently, as the CEO of Systems Limited, he is leading the organization into a new era of growth in both IT and BPO sector by strengthening strategic partnerships with clients, vendors, and further strengthening the Company's business model towards the leading edge technology solution provider.
Mr. Asif holds a BCS degree from FAST and an MBA degree in Finance & Marketing from Institute of Business Administration.
Systems Limited | Annual Report 2015 005
www.systemsltd.com004

Our VisionSystems Limited as an Institution is committed to being the Leader of IT & ITES in the Region through our Thought Leadership, Sustained Service Delivery Excellence, Strong Customer Focused Employees, Strong relationship with our Customers, Partners, and Vendors. To that end we must continuously innovate, enhance our service offerings, achieve superior financial results and increase value to our clients and trusted shareholders. These unwavering expectations provide the foundation of our commitment to those whom we interact.
Our Mission
ValuesINSPIRED BY CUSTOMER
Ÿ Customer Value – Focus on the customer value enhancement driven by our customer insights that result in growth of practice areas and position solution at the top priority for our customers.
Ÿ Innovation – Deliver big bold innovative solutions that challenges the assumptions of the market and enhances the margins by adding value for customers.
ENABLED BY SYSTEMS WAY
Ÿ People & Culture – Our people and culture is driven by high performance aligned with strategic goals and structure that enables staff to focus on core areas of expertise and on time delivery.
Ÿ Excellent Execution – Organized around excellent execution, sharing best practices across our operating markets, ensuring delegated decision making and empowered accountability.
Systems Limited | Annual Report 2015 007
www.systemsltd.com006
Systems Limited is dedicated to provide the Highest Quality Business Solutions, IT & IT Enabled Services and People to our clients and business partners that earns their respect and loyalty, we aim to be the number one service provider through our battle tested methodologies, processes, frameworks and customer focused resources in the niche Industry and Technology/Business Sector we operate.

About Systems Limited
Systems Limited is a globally recognized leader of the next-generation IT and BPO services with a track record of successfully delivering large-scale projects. Since its inception in 1977, the company has been the first in many innovations in the technology and BPO industry. It has constantly reinvented itself every few years and today, it stands as a truly innovative company that has taken the center stage and is considered to be the most valuable company for IT and BPO services in Pakistan.
Its vast list of customers features several Fortune 500 companies, government and corporate entities. Its offices and operations span across North America, UAE, Qatar, Oman and Australia. It also has ongoing projects in countries like Saudi Arabia, South Africa, Namibia and Canada and its workforce is focused to provide great customer experience to its valued customers across the world.
Being a leading Microsoft and IBM partner with deep experience public and private sectors, Systems Limited is uniquely positioned to deliver a complete solution to its customers. Its Centers of Excellence are ERP, CRM, BI, Portals & Collaboration, e-Commerce, Mobility and Managed Services. Systems Limited is a one stop shop that offers end-to-end and cohesive solution to its customers.
The country’s first Information Technology company that provides business solutions, Business Process Outsourcing services, and is the largest software exporter in Pakistan.
Leaders in IT
Corporate LegacyWe have 38 years of sustainable, profitable growth with over 2,500+ client-focused employees globally.
Certified Global EnterpriseWe are SSAE-16 and ISO 9001:2000 & 27001:2005 certified company.
Core Services & SolutionsWe possess proven expertise in deploying and supporting ERP, Mobile, BPM, Turnkey and Complex Software solutions.
Financial StrengthOur Group turnover exceeds over 50 Million USD, providing us a financial strength to grow 25% year over year.
Employee OwnershipFrom its inception, SL was meant to be an employee-owned enterprise. Some 38 years later, its leaders or top performing employees, past and present, own 84pc of its stock.
www.systemsltd.com008
HISTORY AND STRUCTURE
Systems Limited was founded in 1977 as Pakistan’s first software house. Since its inception, innovation and commitment to technical excellence has been the basis of its leadership role in the IT industry. In the mid-nineties Systems Limited recognized that its growth was limited by the size of the IT services market in Pakistan. Therefore, Systems Limited launched its international operations for the first time in the US in 1997. Since then the company’s international operations grew radically, and it acquired several high profile clients from amongst the Fortune 500 companies in the US and the main source of delivery for offshore was done from Pakistan. Throughout these years, Systems Limited focused on software services using its strong domain expertise in
certain industry verticals as well as technology services.
Over the past 10 years, Systems Limited has developed its strong presence in the US mortgage industry, Apparel and Retail sectors. These sectors have been the engine of growth for development of software products and services revenue. In early-2000s, Systems Limited initiated its BPO services in Pakistani domestic market and its clients in North America in 2006. In year 2012, Systems Limited launched its operations in the Middle East markets that further gave boost to its export business.
Systems Limited’s customers are primarily businesses, and with the recent launch of OneLoad, a digital payment aggregation platform with many other benefits that
come with a mobile payment gateway, we are now reaching out to large number of consumers as well. OneLoad is launched through EP Systems, a subsidiary of Systems Limited, and the beta launch feedback has been excellent. More value additions are on the way for OneLoad, and consumers across Pakistan are experiencing the convenience brought to them by the Systems Limited brand, within palm of their hand.
Systems Limited | Annual Report 2015 009

Services and SolutionsDelivering Value to Our Clients
SERVICES
Business Process Outsourcing
Consulting Services
Software & IT Services
Outsourcing Services
Data EntryConsolidate, analyze and visualize your data
Scanning, Indexing and ArchivingThe cutting-edge digitization experience
Process ConsultingBoost productivity with optimized IT services
Management ConsultancyYour strategic partner for a resilient IT strategy
Information Security & ComplianceProtecting your data integrity
User ExperienceCreating people-centered and elegant digital solutions
Systems IntegrationHarness the power of global best practices
Database AdministrationFlexible, scalable and 24/7 available DBA solutions
Application Development & MaintenanceMeeting your unique business requirements
Systems Re-engineeringInnovative business solutions
Staff AugmentationConnecting you with the right people
SOLUTION AREAS
Business Process ManagementDriving Process Improvements Through IT Innovation
Business IntelligenceEnhance, extend and support your decision making process
Enterprise Resource PlanningGain competitive edge through innovation and performance
Enterprise Application IntegrationEnable single integration pillar to connect all systems
Document ManagementGoing ‘paperless’ for rapid, easy and convenient data storage
Customer Relationship ManagementCraft a superior customer experience to uplift business
e-CommerceSave money, save time, and sell more with a powerful e-commerce solution
Product Lifecycle ManagementAccelerate product innovation and maximize profitability
Portals and CollaborationSuccessfully deploy web portals for a streamlined & collaboration
Mobile AppsIndulge in positive innovation with next generation technology
Human Capital ManagementUnify the entire recruit-to-retire spectrum into a single system-of-record
www.systemsltd.com010
What makes us distinctive is our ability
to assist clients and meet challenges.
Systems Limited | Annual Report 2015 011

Partnershipsand Recognitions
This past year, Systems Limited was able to strengthen its relationship with its partners, particularly with Microsoft, which recognized the company as top 5% of its partners in the world by giving us recognition as Microsoft Dynamics President’s Club partner for the second year in a row, making Systems Limited the only Pakistani company in this prestigious tier. This recognition is granted to the elite partners who reach key business milestones while maintaining a constant dedication to the highest levels of customer satisfaction and an active pursuit of product and technological advancement. In the same year, Systems Limited successfully delivered upon multiple large-scale IBM implementations that resulted in upgrading its partnership status to IBM Premier Business Partner.
Being a technology-agnostic company, Systems Limited also spanned its capabilities by entering into partnership with global giant players including Informatica, MicroStrategy, Intel, HP and Dell. These partnerships would have not been possible without flawless projects delivery and customer support service. All these business closures and partnerships prove that Systems Limited is the leading IT services brand. There is no IT company running in Pakistan that has such a diversified technological capability.
Moreover, through the company’s involvement in P@sha’s Nest i/O and Punjab Information Technology Board’s (PITB) Plan 9, Plan X and TechHub initiatives, the company’s brand is growing in the eyes of entrepreneurs as a mentor. Pakistan Software Export Board recently showcased Systems Limited in a documentary created to foster Foreign Direct Investment, and PITB TechHub Connect celebrated a week of Systems Limited by recognizing it as an ‘IT Hero’ of Pakistan.
www.systemsltd.com012
Our Products
Boost efficiency by automating your
HR operations with an advanced
HCM solution
Globally, leading organizations consider their employees as an asset rather than overheads because of business results they deliver. SysHCM, Human Capital Management solution of Systems Limited, offers organizations the tools to help manage, share and steer the vast capabilities of its staff, to focus on its critical talent and support strategic HR processes. It enables organizations to create a workforce that can become its most coveted competitive advantage. The modular architecture of SysHCM application makes it simple to add modules to the core application as your organization grows.
The application supports organizations to lower its human resource costs, streamline the entire recruit-to-retire spectrum, expand the talent pool, shorten the hiring process and make it easy for employees to manage their own HR information and benefits.
AX
Accelerate product delivery in aglobal omni-channel environment
www.edgeax.com
EdgeAX is a highly collaborative and scalable software solution designed to address the global needs of enterprises in the Apparel and Retail Industr ies. Merging our unique implementation methodologies with industry’s best practices, we integrated Microsoft Dynamics AX 2012, a leading enterprise solution, and further extended its capabilities to create EdgeAX suite of business solutions that helps businesses thrive and compete in a rapidly changing global environment.
Each component of the EdgeAX suite has been built upon the core strengths of MS Dynamics AX infrastructure to maintain an end-to-end delivery of complex solutions. The modules’ work flows and functionality follow the Apparel and Retail industry standards that highlight our value added business processes and guarantees greater ROI to our clients.
Add more value to your business witha smart e-payment solution
www.oneLoadpk.com
OneLoad is a unique product offering for the local market that provides aggregated prepaid airtime recharge and a host of other value-added services. Using a multi-channel approach, OneLoad facilitates the purchase and disbursement of mobile prepaid vouchers and using SMS, IVR, the web, and mobile apps. With an integrated and seamless service ecosystem, OneLoad offers an extremely simple, convenient and easy-to-use service:
Users can easily create a OneLoad account online and easily credit it through a vast, extensive outreach of well over 25,000+ branded retail outlets around the country. Using their OneLoad account, consumers can avail services from multiple mobile operators and utility companies at the tip of their fingers using SMS or mobile app - there is no need to make multiple, physical trips to the shop anymore.
Systems Limited | Annual Report 2015 013
Talent Suite is a suite of products that cater to your complete human capital management needs. From recruitment to retirement, complete employee management cycle can be handled through our AX Talent Suite. AX Talent Suite is your top Microsoft Dynamics AX add on for managing your employees from profiles, to payrolls, and from performance to final settlements.

Business Model andCompetencies
Technology shifts and changes are quicker and deeper than ever, tools and platforms are ever changing so there was a need to leverage and build on our combined expertise and experience. Believing in the combined knowledge of our employees, the real challenge is in capturing and using this knowledge and experience in our daily engagements. That called for a platform to share and collaborate.
The company established a practice-oriented structure to bring together resources from all across the company to participate, collaborate, and leverage upon the combined knowledge and strength. It enabled cross-skilling, up-skilling and multi-skilling in practice areas. It enabled sharing of best practices and encouraged innovation so that we are able to capture our IP and capitalize on our HR investments.
All the professional service staff is aligned in the following practice structure:
Ÿ Application Development & Maintenance
Ÿ Business Intelligence and Data Integration
Ÿ Business Process Outsourcing
Ÿ Customer Relationship Management
Ÿ E-Commerce
Ÿ Enterprise Resource Planning
Ÿ Middleware & Business Process Management
Ÿ Mobility, Portals & Collaboration
The horizontal business functions such as DBA, PMO, UX, QA, Admin, Finance, HR, Infrastructure and Marketing continue to support these practice areas. This new structure will help us transform to higher value business, realize quick wins and fast invest to benefit opportunities, share intellectual property and staff across operating countries and new markets, creating business focus, thus strengthening our customer confidence and accelerating business growth.
Business
benefits:
CompetencyActivities:
skill mapping,competency specific
processes andmethods andcollaboration
CapabilityEnhancement:
training materials,certifications, events,knowledge sharing
and innovation
Market Related:pre-sales, proof
of concept, buildtools & accelerators,project support and
collateral
EmergingTechnologies:technology is
changing so weneed to be in sync
with emergingtechnologies
R&D:creativity,
market-drivenformation of newproducts, repeat
success storiesacross new
markets
www.systemsltd.com014
Testimonials
“The system provided by Systems Limited is in use since 1994 and has been expanded to cover other customs functions. We are thankful to Systems Limited for their remarkable services.”
Pakistan CustomsGovernment of Pakistan
“We made the best decision by deploying this ERP as it enabled us to have the most integrated processes and the most accurate data with minimal errors.”
Dr. Arshad SaleemDirector Commercial, Pharmatec
“We are highly satisfied with the services provided by Systems Limited to accomplish the objectives of the assigned project”
Osama Bin SaeedProvincial ICT Manager, LRMIS Board of Revenue, Punjab
“We selected Systems Limited’s state-of-the-art Oracle’s JDE EnterpriseOne ERP solution and chose them because of their expertise, competitive rates, and extensive experience.”
Saleem ButtCOO, Hascol Petroleum Limited
“One of the things that makes Systems Limited’s execution of the JamaPunji portal stand out so much is the fact that they understood the core concept”
Akif SaeedSECP Commissioner, SECP
“We selected Systems Limited because of its suitability for Indus Homes Limited business functions and processes.”
Ahmed FrazCFO, Indus Home Limited
Systems Limited | Annual Report 2015 015

PROFIT AFTER TAX
-
100
200
300
400
500
Rs.
in m
illio
ns
2010 2011 2012 2013 2014 2015
Financial Analysis
www.systemsltd.com016
Systems Limited | Annual Report 2015 017
Revenue
Cost of sales
Gross profit
Operating expenses
Finance cost
Other income
Profit before tax
Taxation
Profit after tax
Earnings per share
CONSOLIDATED
Gross profit to Revenue
Operating expenses to Revenue
Profit after tax to Revenue
Profitability Analysis (% age)
2012
1,080,598,569
615,454,025
465,144,544
152,997,391
9,681,423
43,808,631
346,274,361
18,391,150
327,883,211
7.76
43.05
14.16
30.34
2011
851,579,957
528,297,644
323,282,313
118,018,168
9,993,493
25,232,616
220,503,268
2,219,459
218,283,809
5.61
37.96
13.86
25.63
2010
567,712,428
341,708,011
226,004,417
89,376,455
7,281,838
18,658,654
148,004,778
(1,919,422)
149,924,200
5.78
39.81
15.74
26.41
2015
2,470,725,663
1,669,924,222
800,801,441
468,002,671
3,065,865
88,506,926
418,239,831
12,991,024
405,248,807
3.75
32.41
18.94
16.40
2013
1,423,069,361
861,356,300
561,713,061
219,338,781
3,457,811
70,833,470
409,749,939
10,663,819
399,086,120
4.74
39.47
15.41
28.04
2014
1,922,711,560
1,245,857,134
676,854,426
296,403,020
3,995,964
35,342,737
411,798,179
4,143,840
407,654,339
4.31
35.20
15.42
21.20
-
100
200
300
400
500
2010 2011 2012 2013 2014 2015
Revenue
Cost of sales
Gross profit
Operating expenses
Finance cost
Other income
Profit before tax
Taxation
Profit after tax
Earnings per share
Operating Performance (Rs.)
2015
2,263,290,351
1,506,544,772
756,745,579
381,082,023
2,121,044
91,963,242
465,505,754
12,991,024
452,514,730
4.14
33.44
16.84
19.99
2013
1,420,562,189
859,467,123
561,095,066
202,692,544
3,402,989
70,805,575
425,805,108
10,663,819
415,141,289
4.91
39.50
14.27
29.22
2012
1,080,598,569
615,454,025
465,144,544
152,997,391
9,681,423
43,808,631
346,274,361
18,391,150
327,883,211
7.76
43.05
14.16
30.34
2011
851,579,957
528,297,644
323,282,313
118,018,168
9,993,493
25,232,616
220,503,268
2,219,459
218,283,809
5.61
37.96
13.86
25.63
2010
567,712,428
341,708,011
226,004,417
89,376,455
7,281,838
18,658,654
148,004,778
(1,919,422)
149,924,200
5.78
39.81
15.74
26.41
Gross profit to Revenue
Operating expenses to Revenue
Profit after tax to Revenue
Profitability Analysis (% age)
Rs.
in m
illio
ns
-
500
1,000
1,500
2,000
2010 2011 2012 2013 2014 2015
REVENUE
PROFIT AFTER TAX
Rs.
in m
illio
ns
UNCONSOLIDATED
1,922,615,854
1,242,708,948
679,906,906
283,560,402
3,985,590
38,502,506
430,863,420
4,143,840
426,719,580
4.47
35.36
14.75
22.19
2014
2,500
REVENUE
Rs.
in m
illio
ns
2010 2011 2012 2013 2014-
500
1,000
1,500
2,000
2,500
2015
SIX YEARS AT A GLANCE
Operating Performance (Rs.)

PROFIT AFTER TAX
-
100
200
300
400
500
Rs.
in m
illio
ns
2010 2011 2012 2013 2014 2015
Financial Analysis
www.systemsltd.com016
Systems Limited | Annual Report 2015 017
Revenue
Cost of sales
Gross profit
Operating expenses
Finance cost
Other income
Profit before tax
Taxation
Profit after tax
Earnings per share
CONSOLIDATED
Gross profit to Revenue
Operating expenses to Revenue
Profit after tax to Revenue
Profitability Analysis (% age)
2012
1,080,598,569
615,454,025
465,144,544
152,997,391
9,681,423
43,808,631
346,274,361
18,391,150
327,883,211
7.76
43.05
14.16
30.34
2011
851,579,957
528,297,644
323,282,313
118,018,168
9,993,493
25,232,616
220,503,268
2,219,459
218,283,809
5.61
37.96
13.86
25.63
2010
567,712,428
341,708,011
226,004,417
89,376,455
7,281,838
18,658,654
148,004,778
(1,919,422)
149,924,200
5.78
39.81
15.74
26.41
2015
2,470,725,663
1,669,924,222
800,801,441
468,002,671
3,065,865
88,506,926
418,239,831
12,991,024
405,248,807
3.75
32.41
18.94
16.40
2013
1,423,069,361
861,356,300
561,713,061
219,338,781
3,457,811
70,833,470
409,749,939
10,663,819
399,086,120
4.74
39.47
15.41
28.04
2014
1,922,711,560
1,245,857,134
676,854,426
296,403,020
3,995,964
35,342,737
411,798,179
4,143,840
407,654,339
4.31
35.20
15.42
21.20
-
100
200
300
400
500
2010 2011 2012 2013 2014 2015
Revenue
Cost of sales
Gross profit
Operating expenses
Finance cost
Other income
Profit before tax
Taxation
Profit after tax
Earnings per share
Operating Performance (Rs.)
2015
2,263,290,351
1,506,544,772
756,745,579
381,082,023
2,121,044
91,963,242
465,505,754
12,991,024
452,514,730
4.14
33.44
16.84
19.99
2013
1,420,562,189
859,467,123
561,095,066
202,692,544
3,402,989
70,805,575
425,805,108
10,663,819
415,141,289
4.91
39.50
14.27
29.22
2012
1,080,598,569
615,454,025
465,144,544
152,997,391
9,681,423
43,808,631
346,274,361
18,391,150
327,883,211
7.76
43.05
14.16
30.34
2011
851,579,957
528,297,644
323,282,313
118,018,168
9,993,493
25,232,616
220,503,268
2,219,459
218,283,809
5.61
37.96
13.86
25.63
2010
567,712,428
341,708,011
226,004,417
89,376,455
7,281,838
18,658,654
148,004,778
(1,919,422)
149,924,200
5.78
39.81
15.74
26.41
Gross profit to Revenue
Operating expenses to Revenue
Profit after tax to Revenue
Profitability Analysis (% age)
Rs.
in m
illio
ns
-
500
1,000
1,500
2,000
2010 2011 2012 2013 2014 2015
REVENUE
PROFIT AFTER TAX
Rs.
in m
illio
ns
UNCONSOLIDATED
1,922,615,854
1,242,708,948
679,906,906
283,560,402
3,985,590
38,502,506
430,863,420
4,143,840
426,719,580
4.47
35.36
14.75
22.19
2014
2,500
REVENUE
Rs.
in m
illio
ns
2010 2011 2012 2013 2014-
500
1,000
1,500
2,000
2,500
2015
SIX YEARS AT A GLANCE
Operating Performance (Rs.)

HORIZONTAL ANALYSIS - BALANCE SHEET
0% 20% 40% 60% 80% 100%
2010
2011
2012
2013
2014
2015
Fixed Assets Long term Assets Current Assets
BALANCE SHEET ANALYSIS (ASSETS)
www.systemsltd.com018
Financial Analysis
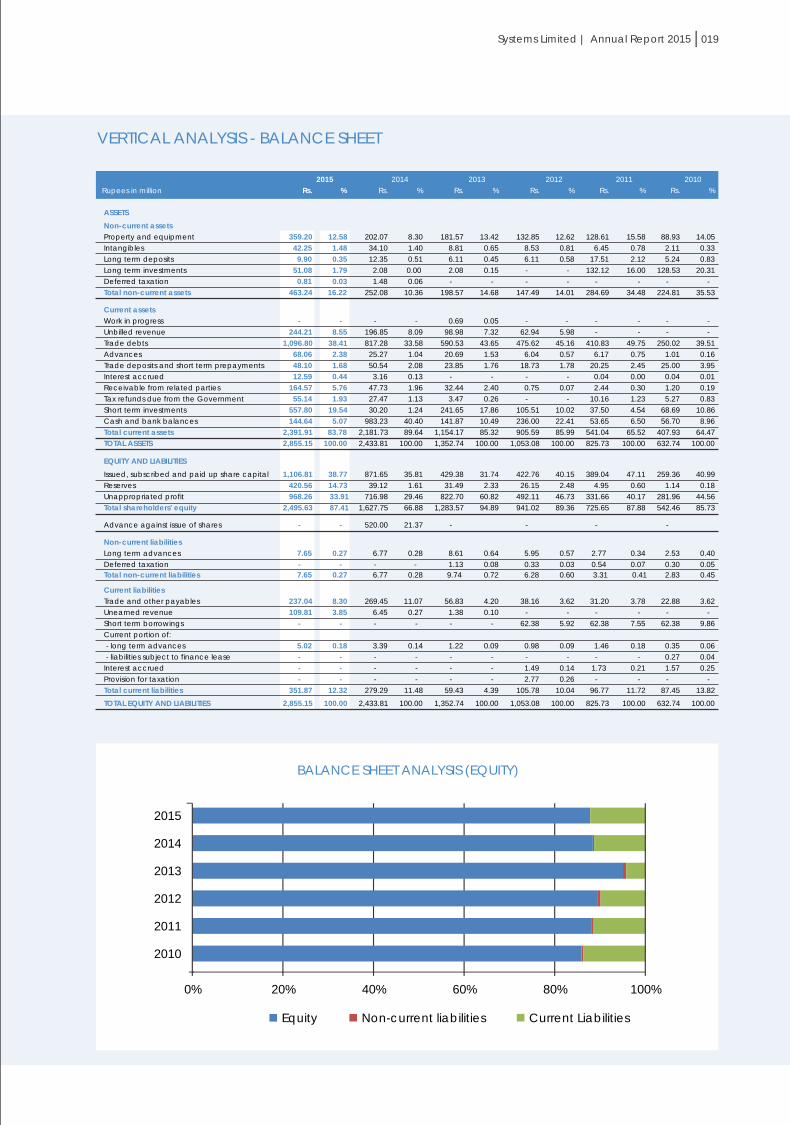
VERTICAL ANALYSIS - BALANCE SHEET
Rupees in million
Current LiabilitiesNon-current liabilitiesEquity
0% 20% 40% 60% 80% 100%
2010
2011
2012
2013
2014
2015
BALANCE SHEET ANALYSIS (EQUITY)
Systems Limited | Annual Report 2015 019
11.29
287.06
102.13
-
100.00
26.95
(100.00)
98.88
38.40
22.14
111.91
100.00
47.13
691.64
(87.50)
593.05
89.03
79.92
103.00
24.23
(12.85)
26.81
100.00
(21.37)
(100.00)
374.13
367.39
-
177.87%
-
-
-
79.92
36.67
3.28
-
100.00
-
34.63
100.00
57.26
24.16
242.55
27.34
-
4225.33
100.00
129.03
(39.89)
27.45
28.46
1.57
20.42
67.18
36.40
-
44.71
242.42
48.93
100.00
(100.00)
24.49
-
(100.00)
(100.00)
28.46
3.30
32.25
(65.11)
(100.00)
-
(48.19)
-
100.00
15.77
(2.11)
(7.51)
-
(69.26)
-
181.36
339.89
67.38
27.53
8.67
428.28
48.38
29.68
-
114.80
(38.89)
22.31
-
-
(32.88)
-
(13.87)
-
27.53
44.62
205.69
234.16
2.79
-
26.64
-
-
64.32
510.89
(19.00)
-
103.33
92.79
(45.41)
(5.38)
32.63
30.50
50.00
334.21
17.63
33.77
-
9.49
80.00
36.36
-
-
317.14
(100.00)
10.19
-
30.50
88.93
2.11
5.24
128.53
-
224.81
-
-
250.02
1.01
25.00
0.04
1.20
5.27
68.69
56.70
407.93
632.74
259.36
1.14
281.96
542.46
-
2.53
0.30
22.88
-
62.38
0.35
0.27
1.57
-
632.74
6.25
441.03
92.65
205.08
-
74.35
-
-
(12.21)
431.58
184.74
(60.00)
(74.14)
92.34
1196.04
(19.69)
8.16
25.03
-
2.70
64.95
25.74
-
13.45
500.00
199.48
-
-
(51.39)
(83.73)
100.00
-
25.03
128.61
6.45
17.51
132.12
-
284.69
-
-
410.83
6.17
20.25
0.04
2.44
10.16
37.50
53.65
541.04
825.73
389.04
4.95
331.66
725.65
-
2.77
0.54
31.20
-
62.38
1.46
-
1.73
-
825.73
181.57
8.81
6.11
2.08
-
198.57
0.69
98.98
590.53
20.69
23.85
-
32.44
3.47
241.65
141.87
1,154.17
1,352.74
429.38
31.49
822.70
1,283.57
-
8.61
1.13
56.83
1.38
-
1.22
-
-
-
1,352.74
132.85
8.53
6.11
147.49
62.94
475.62
6.04
18.73
0.75
105.51
236.00
905.59
1,053.08
422.76
26.15
492.11
941.02
5.95
0.33
38.16
62.38
0.98
1.49
2.77
1,053.08
202.07
34.10
12.35
2.08
1.48
252.08
-
196.85
817.28
25.27
50.54
3.16
47.73
27.47
30.20
983.23
2,181.73
2,433.81
871.65
39.12
716.98
1,627.75
520.00
6.77
-
269.45
6.45
-
3.39
-
-
-
2,433.81
77.76
23.90
(19.84)
2355.77
(45.27)
83.77
-
24.06
34.20
169.33
(4.83)
298.42
244.79
100.73
1747.02
(85.29)
9.63
17.31
26.98
975.05
35.05
53.32
(100.00)
13.00
-
(12.03)
1602.48
-
48.08
-
-
-
17.31
ASSETS
Non-current assets
Property and equipment
Intangibles
Long term deposits
Long term investments
Deferred taxation
Total non-current assets
Current assets
Work in progress
Unbilled revenue
Trade debts
Advances
Trade deposits and short term prepayments
Interest accrued
Receivable from related parties
Tax refunds due from the Government
Short term investments
Cash and bank balances
Total current assets
TOTAL ASSETS
EQUITY AND LIABILITIES
Issued, subscribed and paid up share capital
Reserves
Unappropriated profit
Total shareholders' equity
Advance against issue of shares
Non-current liabilities
Long term advances
Deferred taxation
Current liabilities
Trade and other payables
Unearned revenue
Short term borrowings
Current portion of:
- long term advances
- liabilities subject to finance lease
Interest accrued
Provision for taxation
TOTAL EQUITY AND LIABILITIES
359.20
42.25
9.90
51.08
0.81
463.24
-
244.21
1,096.80
68.06
48.10
12.59
164.57
55.14
557.80
144.64
2,391.91
2,855.15
1,106.81
420.56
968.26
2,495.63
-
7.65
-
237.04
109.81
-
5.02
-
-
-
2,855.15
2014
Vs. 2013
%
2013
Vs. 2012
%
2012
Vs. 2011
% %
2011
Vs. 2010 2010
Rs.
2010
Vs. 2009
%
2011
Rs.
2013
Rs.
2012
Rs.
2014
Rs.
2015
Vs. 2014
%
2015
Rs.
88.93
2.11
5.24
128.53
-
224.81
-
-
250.02
1.01
25.00
0.04
1.20
5.27
68.69
56.70
407.93
632.74
259.36
1.14
281.96
542.46
-
2.53
0.30
14.05
0.33
0.83
20.31
-
35.53
-
-
39.51
0.16
3.95
0.01
0.19
0.83
10.86
8.96
64.47
100.00
40.99
0.18
44.56
85.73
0.40
0.05
128.61
6.45
17.51
132.12
-
284.69
-
-
410.83
6.17
20.25
0.04
2.44
10.16
37.50
53.65
541.04
825.73
389.04
4.95
331.66
725.65
-
2.77
0.54
15.58
0.78
2.12
16.00
-
34.48
-
-
49.75
0.75
2.45
0.00
0.30
1.23
4.54
6.50
65.52
100.00
47.11
0.60
40.17
87.88
0.34
0.07
132.85
8.53
6.11
-
-
147.49
-
62.94
475.62
6.04
18.73
-
0.75
-
105.51
236.00
905.59
1,053.08
422.76
26.15
492.11
941.02
-
5.95
0.33
12.62
0.81
0.58
-
-
14.01
5.98
45.16
0.57
1.78
-
0.07
-
10.02
22.41
85.99
100.00
40.15
2.48
46.73
89.36
0.57
0.03
13.42
0.65
0.45
0.15
-
14.68
0.05
7.32
43.65
1.53
1.76
-
2.40
0.26
17.86
10.49
85.32
100.00
31.74
2.33
60.82
94.89
0.64
0.08
181.57
8.81
6.11
2.08
-
198.57
0.69
98.98
590.53
20.69
23.85
-
32.44
3.47
241.65
141.87
1,154.17
1,352.74
429.38
31.49
822.70
1,283.57
-
8.61
1.13
202.07
34.10
12.35
2.08
1.48
252.08
-
196.85
817.28
25.27
50.54
3.16
47.73
27.47
30.20
983.23
2,181.73
2,433.81
871.65
39.12
716.98
1,627.75
520.00
6.77
- -
100.00
8.30
1.40
0.51
0.00
0.06
10.36
-
8.09
33.58
1.04
2.08
0.13
1.96
1.13
1.24
40.40
89.64
35.81
1.61
29.46
66.88
21.37
0.28
12.58
1.48
0.35
1.79
0.03
16.22
-
8.55
38.41
2.38
1.68
0.44
5.76
1.93
19.54
5.07
83.78
100.00
38.77
14.73
33.91
87.41
-
0.27
-
ASSETS
Non-current assets
Property and equipment
Intangibles
Long term deposits
Long term investments
Deferred taxation
Total non-current assets
Current assets
Work in progress
Unbilled revenue
Trade debts
Advances
Trade deposits and short term prepayments
Interest accrued
Receivable from related parties
Tax refunds due from the Government
Short term investments
Cash and bank balances
Total current assets
TOTAL ASSETS
EQUITY AND LIABILITIES
Issued, subscribed and paid up share capital
Reserves
Unappropriated profit
Total shareholders' equity
Advance against issue of shares
Non-current liabilities
Long term advances
Deferred taxation
359.20
42.25
9.90
51.08
0.81
463.24
-
244.21
1,096.80
68.06
48.10
12.59
164.57
55.14
557.80
144.64
2,391.91
2,855.15
1,106.81
420.56
968.26
2,495.63
-
7.65
-
Rupees in million
369.95 (43.82) 9.31 10.66 87.45 20.7996.7759.43 105.78279.2925.99Total current liabilities 351.87
Rs. %
20102015 2014 2013 2012 2011
Rs. %Rs. %%Rs.Rs. %%Rs.
22.88
-
62.38
0.35
0.27
1.57
-
632.74
3.62
-
9.86
0.06
0.04
0.25
-
100.00
31.20
-
62.38
1.46
-
1.73
-
825.73
3.78
-
7.55
0.18
-
0.21
-
100.00
38.16
-
62.38
0.98
-
1.49
2.77
1,053.08
3.62
-
5.92
0.09
-
0.14
0.26
100.00
4.20
0.10
-
0.09
-
-
-
100.00
56.83
1.38
-
1.22
-
-
-
1,352.74
269.45
6.45
-
3.39
-
-
-
2,433.81
11.07
0.27
-
0.14
-
-
-
100.00
Current liabilities
Trade and other payables
Unearned revenue
Short term borrowings
Current portion of:
- long term advances
- liabilities subject to finance lease
Interest accrued
Provision for taxation
TOTAL EQUITY AND LIABILITIES
8.30
3.85
-
0.18
-
-
-
100.00
237.04
109.81
-
5.02
-
-
-
2,855.15
87.45 13.8296.77 11.72105.78 10.044.3959.43
279.29 11.48 Total current liabilities
12.32351.87
Total non-current liabilities 43.87 (55.10) 89.72 16.96 2.83 24.123.319.74 6.286.7713.007.65
2.83 0.453.31 0.416.28 0.600.729.74
6.77 0.28 Total non-current liabilities
0.277.65
-
-
-
-
-
-
-
-
-
HORIZONTAL ANALYSIS - BALANCE SHEET
0% 20% 40% 60% 80% 100%
2010
2011
2012
2013
2014
2015
Fixed Assets Long term Assets Current Assets
BALANCE SHEET ANALYSIS (ASSETS)
www.systemsltd.com018
Financial Analysis
VERTICAL ANALYSIS - BALANCE SHEET
Rupees in million
Current LiabilitiesNon-current liabilitiesEquity
0% 20% 40% 60% 80% 100%
2010
2011
2012
2013
2014
2015
BALANCE SHEET ANALYSIS (EQUITY)
Systems Limited | Annual Report 2015 019
11.29
287.06
102.13
-
100.00
26.95
(100.00)
98.88
38.40
22.14
111.91
100.00
47.13
691.64
(87.50)
593.05
89.03
79.92
103.00
24.23
(12.85)
26.81
100.00
(21.37)
(100.00)
374.13
367.39
-
177.87%
-
-
-
79.92
36.67
3.28
-
100.00
-
34.63
100.00
57.26
24.16
242.55
27.34
-
4225.33
100.00
129.03
(39.89)
27.45
28.46
1.57
20.42
67.18
36.40
-
44.71
242.42
48.93
100.00
(100.00)
24.49
-
(100.00)
(100.00)
28.46
3.30
32.25
(65.11)
(100.00)
-
(48.19)
-
100.00
15.77
(2.11)
(7.51)
-
(69.26)
-
181.36
339.89
67.38
27.53
8.67
428.28
48.38
29.68
-
114.80
(38.89)
22.31
-
-
(32.88)
-
(13.87)
-
27.53
44.62
205.69
234.16
2.79
-
26.64
-
-
64.32
510.89
(19.00)
-
103.33
92.79
(45.41)
(5.38)
32.63
30.50
50.00
334.21
17.63
33.77
-
9.49
80.00
36.36
-
-
317.14
(100.00)
10.19
-
30.50
88.93
2.11
5.24
128.53
-
224.81
-
-
250.02
1.01
25.00
0.04
1.20
5.27
68.69
56.70
407.93
632.74
259.36
1.14
281.96
542.46
-
2.53
0.30
22.88
-
62.38
0.35
0.27
1.57
-
632.74
6.25
441.03
92.65
205.08
-
74.35
-
-
(12.21)
431.58
184.74
(60.00)
(74.14)
92.34
1196.04
(19.69)
8.16
25.03
-
2.70
64.95
25.74
-
13.45
500.00
199.48
-
-
(51.39)
(83.73)
100.00
-
25.03
128.61
6.45
17.51
132.12
-
284.69
-
-
410.83
6.17
20.25
0.04
2.44
10.16
37.50
53.65
541.04
825.73
389.04
4.95
331.66
725.65
-
2.77
0.54
31.20
-
62.38
1.46
-
1.73
-
825.73
181.57
8.81
6.11
2.08
-
198.57
0.69
98.98
590.53
20.69
23.85
-
32.44
3.47
241.65
141.87
1,154.17
1,352.74
429.38
31.49
822.70
1,283.57
-
8.61
1.13
56.83
1.38
-
1.22
-
-
-
1,352.74
132.85
8.53
6.11
147.49
62.94
475.62
6.04
18.73
0.75
105.51
236.00
905.59
1,053.08
422.76
26.15
492.11
941.02
5.95
0.33
38.16
62.38
0.98
1.49
2.77
1,053.08
202.07
34.10
12.35
2.08
1.48
252.08
-
196.85
817.28
25.27
50.54
3.16
47.73
27.47
30.20
983.23
2,181.73
2,433.81
871.65
39.12
716.98
1,627.75
520.00
6.77
-
269.45
6.45
-
3.39
-
-
-
2,433.81
77.76
23.90
(19.84)
2355.77
(45.27)
83.77
-
24.06
34.20
169.33
(4.83)
298.42
244.79
100.73
1747.02
(85.29)
9.63
17.31
26.98
975.05
35.05
53.32
(100.00)
13.00
-
(12.03)
1602.48
-
48.08
-
-
-
17.31
ASSETS
Non-current assets
Property and equipment
Intangibles
Long term deposits
Long term investments
Deferred taxation
Total non-current assets
Current assets
Work in progress
Unbilled revenue
Trade debts
Advances
Trade deposits and short term prepayments
Interest accrued
Receivable from related parties
Tax refunds due from the Government
Short term investments
Cash and bank balances
Total current assets
TOTAL ASSETS
EQUITY AND LIABILITIES
Issued, subscribed and paid up share capital
Reserves
Unappropriated profit
Total shareholders' equity
Advance against issue of shares
Non-current liabilities
Long term advances
Deferred taxation
Current liabilities
Trade and other payables
Unearned revenue
Short term borrowings
Current portion of:
- long term advances
- liabilities subject to finance lease
Interest accrued
Provision for taxation
TOTAL EQUITY AND LIABILITIES
359.20
42.25
9.90
51.08
0.81
463.24
-
244.21
1,096.80
68.06
48.10
12.59
164.57
55.14
557.80
144.64
2,391.91
2,855.15
1,106.81
420.56
968.26
2,495.63
-
7.65
-
237.04
109.81
-
5.02
-
-
-
2,855.15
2014
Vs. 2013
%
2013
Vs. 2012
%
2012
Vs. 2011
% %
2011
Vs. 2010 2010
Rs.
2010
Vs. 2009
%
2011
Rs.
2013
Rs.
2012
Rs.
2014
Rs.
2015
Vs. 2014
%
2015
Rs.
88.93
2.11
5.24
128.53
-
224.81
-
-
250.02
1.01
25.00
0.04
1.20
5.27
68.69
56.70
407.93
632.74
259.36
1.14
281.96
542.46
-
2.53
0.30
14.05
0.33
0.83
20.31
-
35.53
-
-
39.51
0.16
3.95
0.01
0.19
0.83
10.86
8.96
64.47
100.00
40.99
0.18
44.56
85.73
0.40
0.05
128.61
6.45
17.51
132.12
-
284.69
-
-
410.83
6.17
20.25
0.04
2.44
10.16
37.50
53.65
541.04
825.73
389.04
4.95
331.66
725.65
-
2.77
0.54
15.58
0.78
2.12
16.00
-
34.48
-
-
49.75
0.75
2.45
0.00
0.30
1.23
4.54
6.50
65.52
100.00
47.11
0.60
40.17
87.88
0.34
0.07
132.85
8.53
6.11
-
-
147.49
-
62.94
475.62
6.04
18.73
-
0.75
-
105.51
236.00
905.59
1,053.08
422.76
26.15
492.11
941.02
-
5.95
0.33
12.62
0.81
0.58
-
-
14.01
5.98
45.16
0.57
1.78
-
0.07
-
10.02
22.41
85.99
100.00
40.15
2.48
46.73
89.36
0.57
0.03
13.42
0.65
0.45
0.15
-
14.68
0.05
7.32
43.65
1.53
1.76
-
2.40
0.26
17.86
10.49
85.32
100.00
31.74
2.33
60.82
94.89
0.64
0.08
181.57
8.81
6.11
2.08
-
198.57
0.69
98.98
590.53
20.69
23.85
-
32.44
3.47
241.65
141.87
1,154.17
1,352.74
429.38
31.49
822.70
1,283.57
-
8.61
1.13
202.07
34.10
12.35
2.08
1.48
252.08
-
196.85
817.28
25.27
50.54
3.16
47.73
27.47
30.20
983.23
2,181.73
2,433.81
871.65
39.12
716.98
1,627.75
520.00
6.77
- -
100.00
8.30
1.40
0.51
0.00
0.06
10.36
-
8.09
33.58
1.04
2.08
0.13
1.96
1.13
1.24
40.40
89.64
35.81
1.61
29.46
66.88
21.37
0.28
12.58
1.48
0.35
1.79
0.03
16.22
-
8.55
38.41
2.38
1.68
0.44
5.76
1.93
19.54
5.07
83.78
100.00
38.77
14.73
33.91
87.41
-
0.27
-
ASSETS
Non-current assets
Property and equipment
Intangibles
Long term deposits
Long term investments
Deferred taxation
Total non-current assets
Current assets
Work in progress
Unbilled revenue
Trade debts
Advances
Trade deposits and short term prepayments
Interest accrued
Receivable from related parties
Tax refunds due from the Government
Short term investments
Cash and bank balances
Total current assets
TOTAL ASSETS
EQUITY AND LIABILITIES
Issued, subscribed and paid up share capital
Reserves
Unappropriated profit
Total shareholders' equity
Advance against issue of shares
Non-current liabilities
Long term advances
Deferred taxation
359.20
42.25
9.90
51.08
0.81
463.24
-
244.21
1,096.80
68.06
48.10
12.59
164.57
55.14
557.80
144.64
2,391.91
2,855.15
1,106.81
420.56
968.26
2,495.63
-
7.65
-
Rupees in million
369.95 (43.82) 9.31 10.66 87.45 20.7996.7759.43 105.78279.2925.99Total current liabilities 351.87
Rs. %
20102015 2014 2013 2012 2011
Rs. %Rs. %%Rs.Rs. %%Rs.
22.88
-
62.38
0.35
0.27
1.57
-
632.74
3.62
-
9.86
0.06
0.04
0.25
-
100.00
31.20
-
62.38
1.46
-
1.73
-
825.73
3.78
-
7.55
0.18
-
0.21
-
100.00
38.16
-
62.38
0.98
-
1.49
2.77
1,053.08
3.62
-
5.92
0.09
-
0.14
0.26
100.00
4.20
0.10
-
0.09
-
-
-
100.00
56.83
1.38
-
1.22
-
-
-
1,352.74
269.45
6.45
-
3.39
-
-
-
2,433.81
11.07
0.27
-
0.14
-
-
-
100.00
Current liabilities
Trade and other payables
Unearned revenue
Short term borrowings
Current portion of:
- long term advances
- liabilities subject to finance lease
Interest accrued
Provision for taxation
TOTAL EQUITY AND LIABILITIES
8.30
3.85
-
0.18
-
-
-
100.00
237.04
109.81
-
5.02
-
-
-
2,855.15
87.45 13.8296.77 11.72105.78 10.044.3959.43
279.29 11.48 Total current liabilities
12.32351.87
Total non-current liabilities 43.87 (55.10) 89.72 16.96 2.83 24.123.319.74 6.286.7713.007.65
2.83 0.453.31 0.416.28 0.600.729.74
6.77 0.28 Total non-current liabilities
0.277.65
-
-
-
-
-
-
-
-
-

HORIZONTAL ANALYSIS - PROFIT AND LOSS ACCOUNT
VERTICAL ANALYSIS - PROFIT AND LOSS ACCOUNT
0% 10% 20% 30% 40% 50% 60% 70% 80% 90% 100%
2010
2011
2012
2013
2014
2015
Cost of sales Distribution cost Administrative expenses Research and development expenses
Finance cost Other operating expenses
ANALYSIS OF EXPENSES
www.systemsltd.com020
Financial Analysis
STATEMENT OF VALUE ADDITION
Wealth Generated
Gross revenue
Other income
Wealth Distributed
Employees remuneration and benefits
Depreciation and amortization
Direct cost
Government levies
Profit for the year
2,343,538,766
91,963,242
2,435,502,008
1,963,847,850
16,689,230
1,980,537,080
1,338,989,913
94,921,024
455,836,902
93,239,439
452,514,730
2,435,502,008
972,645,161
59,274,927
476,521,576
45,375,836
426,719,580
1,980,537,080
2015 2014
1,970,271,905
13,691,938
1,983,963,843
983,931,003
59,566,196
481,108,120
51,704,185
407,654,339
1,983,963,843
2,550,974,078
88,506,926
2,639,481,004
1,508,857,252
86,892,835
545,242,671
93,239,439
405,248,807
2,639,481,004
20142015
UNCONSOLIDATED CONSOLIDATED
UN
CO
NSO
LID
ATE
D
49%
3%
24%
2%
22% Employees remuneration
and benefits
Depreciation and
amortization
Direct cost
Government levies
Profit for the year2015 2014
4%
54%
4%
19%
19%
4%
57%
3%
21%
15%
49%
3%
24%
3%
21%
CO
NSO
LID
ATE
D
2015 2014
Employees remuneration
and benefits
Depreciation and
amortization
Direct cost
Government levies
Profit for the year
DUPONT ANALYSIS
2015Rupees in million
Profit 453
Revenue 2,263
Profit margin 19.99%
Revenue 2,263
Total assets 2,855
Assets turnover 79.27%
Total assets 2,855
Equity 2,496
Equity multiplier 114.41%
2014Rupees in million
Profit 427
Revenue 1,923
Profit margin 22.19%
Revenue 1,923
Total assets 2,434
Assets turnover 79.00%
Total assets 2,434
Equity 1,628
Equity multiplier 149.52%
ROE18.13%
ROE26.22%
Systems Limited | Annual Report 2015 021
Revenue
Cost of sales
Gross profit
Distribution cost
Administrative expenses
Research and development expenses
Operating profit
Other income
Other operating expenses
Finance cost
Profit before taxation
Taxation
Profit after taxation
2,263.29
(1,506.54)
756.75
(69.63)
(262.30)
(29.21)
(361.14)
395.61
91.96
487.57
(19.95)
(2.12)
(22.07)
465.50
(12.99)
452.51
17.72
21.23
11.30
16.95
32.05
1102.06
38.58
(5.65)
138.86
6.50
(13.11)
(46.87)
(18.11)
8.04
213.77
6.04
1,922.62
(1,242.71)
679.91
(59.54)
(198.63)
(2.43)
(260.60)
419.31
38.50
457.81
(22.96)
(3.99)
(26.95)
430.86
(4.14)
426.72
35.34
44.59
21.18
37.19
36.50
(53.89)
34.20
14.28
(45.63)
4.59
169.80
17.35
126.28
1.19
(61.16)
2.79
1,420.56
(859.47)
561.09
(43.40)
(145.52)
(5.27)
(194.19)
366.90
70.81
437.71
(8.51)
(3.40)
(11.91)
425.80
(10.66)
415.14
2015
Rs.
2015
Vs. 2014
%
2014
Rs.
2014
Vs. 2013
%
2013
Rs.
31.46
39.65
20.63
38.70
32.91
170.26
36.05
13.80
61.63
19.52
(17.06)
(64.88)
(40.27)
22.96
(42.03)
26.61
2013
Vs. 2012
%
26.89
16.50
43.88
49.64
21.35
(71.62)
20.95
57.07
73.64
58.89
100.00
(3.10)
99.60
57.04
728.38
50.21
2012
Vs. 2011
%
851.58
(528.30)
323.28
(20.91)
(90.23)
(6.87)
(118.01)
205.27
25.23
230.50
-
(9.99)
(9.99)
220.51
(2.22)
218.29
2011
Rs.
50.00
54.60
43.04
68.49
35.34
(6.66)
36.52
47.08
35.21
45.68
(100.00)
37.23
(2.25)
48.99
(215.63)
45.60
2011
Vs. 2010
%
567.71
(341.71)
226.00
(12.41)
(66.67)
(7.36)
(86.44)
139.56
18.66
158.22
(2.94)
(7.28)
(10.22)
148.00
1.92
149.92
2010
Rs.
24.54
18.93
34.12
33.30
10.73
100.00
24.34
40.98
(16.06)
30.52
27.83
21.13
22.98
31.08
(178.37)
35.72
2010
Vs. 2009
%
1,080.60
(615.45)
465.15
(31.29)
(109.49)
(1.95)
(142.73)
322.42
43.81
366.23
(10.26)
(9.68)
(19.94)
346.29
(18.39)
327.90
2012
Rs.
Revenue
Cost of sales
Gross profit
Distribution cost
Administrative expenses
Research and development expenses
Operating profit
Other income
Other operating expenses
Finance cost
Profit before taxation
Taxation
Profit after taxation
2,263.29
(1,506.54)
756.75
(69.63)
(262.30)
(29.21)
(361.14)
395.61
91.96
487.57
(19.95)
(2.12)
(22.07)
465.50
(12.99)
452.51
100.00
(64.64)
35.36
(3.10)
(10.33)
(0.13)
(13.55)
21.81
2.00
23.81
(1.19)
(0.21)
(1.40)
22.41
(0.22)
22.19
1,420.56
(859.47)
561.09
(43.40)
(145.52)
(5.27)
(194.19)
366.90
70.81
437.71
(8.51)
(3.40)
(11.91)
425.80
(10.66)
415.14
100.00
(66.56)
33.44
(3.08)
(11.59)
(1.29)
(15.96)
17.48
4.06
21.54
(0.88)
(0.09)
(0.98)
20.57
(0.57)
19.99
100.00
(60.50)
39.50
(3.06)
(10.24)
(0.37)
(13.67)
25.83
4.98
30.81
(0.60)
(0.24)
(0.84)
29.97
(0.75)
29.22
1,080.60
(615.45)
465.15
(31.29)
(109.49)
(1.95)
(142.73)
322.42
43.81
366.23
(10.26)
(9.68)
(19.94)
346.29
(18.39)
327.90
851.58
(528.30)
323.28
(20.91)
(90.23)
(6.87)
(118.01)
205.27
25.23
230.50
-
(9.99)
(9.99)
220.51
(2.22)
218.29
100.00
(62.04)
37.96
(2.46)
(10.60)
(0.81)
(13.86)
24.10
2.96
27.07
0.00
(1.17)
(1.17)
25.89
(0.26)
25.63
567.71
(341.71)
226.00
(12.41)
(66.67)
(7.36)
(86.44)
139.56
18.66
158.22
(2.94)
(7.28)
(10.22)
148.00
1.92
149.92
100.00
(60.19)
39.81
(2.19)
(11.74)
(1.30)
(15.23)
24.58
3.29
27.87
(0.52)
(1.28)
(1.80)
26.07
0.34
26.41
1,922.62
(1,242.71)
679.91
(59.54)
(198.63)
(2.43)
(260.60)
419.31
38.50
457.81
(22.96)
(3.99)
(26.95)
430.86
(4.14)
426.72
100.00
(56.95)
43.05
(2.90)
(10.13)
(0.18)
(13.21)
29.84
4.05
33.89
(0.95)
(0.90)
(1.85)
32.05
(1.70)
30.34
Rupees in million
Rs. % Rs. % Rs. % Rs. %
20102015
%Rs.
2014 2013
Rs. %
2012 2011
Rupees in million
BOOK CLOSURE DATES
The Register of Members and Share Transfer Books of the Company will remain closed from 21 April 2016 to 27 April 2016 both days inclusive.
REGISTERED OFFICE
Chamber of Commerce Building,11 Sharae Aiwane Tijarat, Lahore, Pakistan.T: +92 42 36304825-35F: +92 42 36368857
SHARE REGISTRAR
THK Associates (Private) Limited.2nd Floor, State Life Building-3,Dr. Ziauddin Ahmed Road, Karachi.T: +92 21 111-000-322F: +92 21 35655595
LISTING ON STOCK EXCHANGES
Ordinary shares of Systems Limited listed on Pakistan Stock Exchange Limited.
STOCK CODE / SYMBOL
The stock code / symbol for trading in ordinary shares of Systems Limited at Karachi, Lahore and Islamabad stock exchanges is SYS.
STATUTORY COMPLIANCE
During the year, the Company has complied with all applicable provisions, filed all returns/forms and furnished all the relevant particulars as required under the Companies Ordinance, 1984 and allied rules, the Securities and Exchange Commission of Pakistan Regulations and the listing requirements.
DIVIDEND
DIVIDEND REMITTANCE
Ordinary dividend declared and approved at the Annual General Meeting will be paid within the statutory time limit of 30 days.
(i) For shares held in physical form: to shareholders whose names appear in the Register of Members of the Company after entertaining all requests for transfer of shares lodged with the Company on or before the book closure date.
(ii) For shares held in electronic from: to shareholders whose names appear in the statement of beneficial ownership furnished by CDC as at end of business on book closure date.
WITHHOLDING OF TAX & ZAKATON ORDINARY DIVIDEND
As per the provisions of the Income Tax Ordinance, 2001, income tax is deductible at source by the Company at the rate of 10% wherever applicable.
Zakat is also deductible at source form the ordinary dividend at the rate of 2.5% of the face value of the share, other than corporate holders or individuals who have provided an undertaking for non-deduction.
DIVIDEND WARRANTS
Cash dividends are paid through dividend warrants addressed to the ordinary shareholders whose names appear in the Register of Shareholders at the date of book closure.
INVESTOR’S GRIEVANCES
To date none of the investors or shareholders has filed any significant complaint against any service provided by the Company to its shareholders.
GENERAL MEETINGS & VOTING RIGHTS
Pursuant to section 158 of The Companies Ordinance 1984, Systems Limited holds a General Meeting of shareholders at least once a year. Every shareholder has a right to attend the General Meeting. The notice of such meeting is sent to all the shareholders at least 21 days before the meeting and also advertised in at least one English and one Urdu newspaper having circulation in Karachi, Lahore and Islamabad.
Shareholders having holding of at least 10% of voting rights may also apply to the Board of Directors to call for meeting of shareholders, and if the Board does not take action on such application within 21 days, the shareholders may themselves call the meeting.
All ordinary shares issued by the Company carry equal voting rights, Generally, matters at the general meetings are decided by a show of hands in the first instance. Voting by show of hands operates on the principle of “One Member-One Vote”. If majority of shareholders raise their hands in favor of a particular resolution, it is taken as passed, unless a poll is demanded.
Since the fundamental voting principle in the Company is “One Share-One Vote”, voting takes place by a poll, if demanded. On a poll being taken, the decision arrived by poll is final, overruling any decision taken on a show of hands.
The Board of Directors has recommended 12.5 % cash dividend on ordinary shares for the year ended 31 December 2015.
Shareholders’ Information
www.systemsltd.com022
PROXIES
Pursuant to Section 161 of The Companies Ordinance, 1984 and according to the Memorandum and Articles of Association of the Company, every shareholder of the Company who is entitled to attend and vote at a general meeting of the Company can appoint another member as his/her proxy to attend and vote instead of him/her. Every notice calling a general meeting of the Company contains a statement that a shareholder entitled to appoint a proxy.
The instrument appointing a proxy (duly signed by the shareholder appointing that proxy) should be deposited at the office of the Company not less than forty-eight hours before the meeting.
WEB PRESENCE
Updated information regarding the Company can be accessed at its website, www.systemsltd.com. The website contains the latest financial results of the Company together with the Company’s profile.
SERVICE STANDARDS
Systems Limited has always endeavored to provide investors with prompt services. Listed below are various investor services and the maximum time limits set for their execution:
Transfer of shares
Transmission of shares
Issue of duplicate share certificates
Issue of duplicate dividend warrants
Issue of revalidated dividend warrants
Change of address
30 days after receipt
30 days after receipt
30 days after receipt
5 days after receipt
5 days after receipt
2 days after receipt
For requests receivedthrough post
30 days after receipt
30 days after receipt
30 days after receipt
5 days after receipt
5 days after receipt
1 day after receipt
For requests receivedover the counter
Well qualified personnel of the Shares Registrar have been entrusted with the responsibility of ensuring that services are rendered within the set time limits.
Fundamental knowledge and understanding of financial market is crucial for the general public and lack of financial literacy or capability makes them vulnerable to frauds. SECP recognizes the importance of investor education and therefore initiated this investor education program, called 'JamaPunji', an investor training program, to promote financial literacy in Pakistan.
www.jamapunji.pk
Systems Limited | Annual Report 2015 023
Chairman’sreview
Aezaz HussainChairman
www.systemsltd.com024
CEO'sreview
Year 2015 had been a tremendous year for Systems Limited. While we remained at par in overachieving our growth goals, we marked the year with a key milestone of listing Systems Limited on the local stock exchanges. Both the phases of IPO were over three times oversubscribed, which is a testimony to our credibility and brand positioning as the market leader.
As a result of these business and operational expansion, Systems Limited’s Y-O-Y revenue growth exceeded 18% in Pakistan. We acquired a number of new customers and successfully completed projects in both corporate and public sectors in Pakistan, GCC, North America and Australian regions. For BPO services in Pakistan, it was a great year in which we completed and were acknowledged for various land record automation projects while others are near to completion with regard to Board of Revenue - Sindh, Punjab and KPK. As for international BPO operations, we continued to focus on achieving operational efficiency and in turn successfully delivered upon large-scale projects throughout the year.
The company bagged several PASHA ICT Awards 2015 for – Best in Export Growth, Best in HR Excellence, Best in Business Process Outsourcing and runner up in Project Management category at Pakistan All Software Houses Association (P@ SHA) ICT Awards 2015. The aim of these award is to provide a platform to honor the company’s cutting-edge technology innovation as well as leading professionals across the ICT industry. The awards pay homage to Pakistani innovators acknowledging their creative talent, excellence and innovation in the field of Information and Communications Technology.
Additionally, Systems Limited was named as the Microsoft Dynamics President’s Club Partner for second year in the row. This recognition as the market leader and a preferred partner is the result of collaboration and team work of all the departments including Sales, Marketing, UI/UX,
Human Resources, Administration and Finance and Support for their incredible contributions throughout the year towards our common goals.
In 2015, Human Resource department has done great work in capacity building with in-house sessions, soft skills training, and technical skills enhancement programs for Systemers who have gained more than 1000’s certifications by now. These and so many other initiatives taken by HR have resulted in a 10% increase in employee retention, with cultural awareness trainings, performance-based increments, mentoring programs and opportunities for global exposure. Future HR programs in the pipeline include High Potential Identification, Leadership Expectations Framework, Succession Management, Performance Management Enhancement and Competency-Based Talent Management.
As we step into 2016, we have set aggressive growth and profitability goals and important milestones ahead. We would be strengthening our focus towards achieving operational excellence and delivering unparalleled services to our customers. We also plan to align organizational structure as per the Centers of Excellence. In this year, we would be making contributions to the career development, planning and growth of our most cherished assets, our employees and create exceptional value for our shareholders.
Asif PeerChief Executive
Systems Limited | Annual Report 2015 025
Dear Shareholders,
It gives me great pleasure to welcome the new shareholders and I also take the opportunity to thank the earlier shareholders for their support over the years. I on behalf of the company assure you of our commitment to continue building shareholder value. We are confident of doing so because of our historical commitment of providing excellent service to our clients who are central to our continued success and growth.
2015 was a significant one in our history as it was our first as a listed company. After a successful IPO in February and an encouraging response by investors, Systems Limited continued its growth path in 2015.
One of the key purpose for the IPO funds was to invest in establishing new markets and your company has successfully done this starting from the UAE market. The revenue from this initiative has been encouraging and promises a steady growth in the years to come. However as expected the margins from the new markets and clients has been initially at a low compared to what we have achieved from our long established market in North America. This has affected overall profitability. However we are confident that as these new markets mature and we get into long term repeat revenue relationships with our clients in these markets, our profitability from these markets will also be as healthy as it has been from the established clients.
The encouraging fact is that despite the focus on new markets, the revenue from our established market in the North America has continued to grow and be as profitable.
I would like to commend the management team for their success and wish them God Speed in their endeavor to make 2016 an even better year.
I would also like to thank the members of our board who have provided the leadership and guidance to the management team.
Sincerely

Directors’ Reportto the Shareholders
thThe Board of Directors is pleased to present the Company’s 39 Annual Report together with Audited Financial Statements and Auditors Report for the year ended 31 December 2015.
MARKET OUTLOOK
We have seen growth and demand of skilled resources and services in US Market, our strategy to align ourselves with various competency centers has paid off and we have received good recurring revenue stream from our customers. We have invested heavily in developing accelerators, frameworks, and solution templates for Apparel and Retail Segment. We have also developed Retail Business Intelligence tool. In BPO Services we have invested in the accuracy of our OCR/ICR solution through Machine Learning and Artificial Intelligence. We have been using our Technology Platform to sell our BPO services and this has been instrumental in the growth of our business. We have signed up our first EdgeAX customer of our Apparel and Retail Offering and we believe this will be the key building block in the growth of our Apparel and Retail Practice. We have also acquired number of new logos during 2015. We believe this will help the group in enhancing the growth of the company and we will have a solid base for repeatable and diversified business and clients across the globe.
During 2015 we have expanded our base in MEA Region, during the first quarter of 2015 we have changed our business strategy from selling through local partners to direct selling through our own relationship and sales force, we have invested and hired top notch local sales, presales and project management resources to expand and solidify our foot print in the region. Our change in direction and strategy started paying off during the 2nd half of 2015, we have signed up many large public and private sector accounts in both UAE and Qatar. We are still well aligned with our regional partners to support us in generating indirect business as well. Due to significant decline in oil prices, public sector IT spending has been sluggish in GCC region, we are expecting first half of 2016 will be slow as well and IT spending will be picking up again during the second half of 2016.
During 2015 we have also started our Australia operation and we were able to sign up few projects, which will help us in establishing references in the Australian market and will provide us diversified future growth.
On the Domestic Front, we have seen growth in IT Spending from Public and Private Sector.
During 2015 we have signed up many large public sector projects, which has provided us significant top line growth, in addition to the growth we have also been able to groom our resources for Enterprise Class Application Delivery and Customer Handling experience, which is the key for our growth and success globally.
In the year 2015 the Company's revenues grew by 18% as compared to the year 2014. Cost of sales for the year were recorded at Rs. 1.51 billion with an increase of 21% from last year mainly due to expansion and capacity building in local and Middle East region. The Company invested heavily in getting market share by investing from bottom line. This investment will help achieve future revenue and profit targets. Gross profit of your company increased by 11% to Rs. 756.75 million compared to Rs. 679.91 million during last year. There is a significant increase in other income on account of gain on short term investments and favorable exchange rates as against the last year. Resultantly, your company achieved profit before taxation of Rs. 465.51 million, 8% above last year. Earnings per share decreased by 7% mainly due to increase in the number of ordinary shares by 23 million on account of Initial Public Offering (IPO) of 13 million and bonus issue of 10 million ordinary shares issued by the Company. Summary of Financial Results is as follows:
FINANCIAL RESULTS
www.systemsltd.com026
Particulars
Revenue
Gross profit
Profit before taxation
Profit after taxation
Earnings per share
2,470,725,663
800,801,441
418,239,831
405,248,807
3.75
1,922,711,560
676,854,426
411,798,179
407,654,339
4.31
29%
18%
2%
(1%)
(13%)
2015 2014 Y/Y
Consolidated
Particulars
Revenue
Gross profit
Profit before taxation
Profit after taxation
Earnings per share
2,263,290,351
756,745,579
465,505,754
452,514,730
4.14
1,922,615,854
679,906,906
430,863,420
426,719,580
4.47
18%
11%
8%
6%
(7%)
2015 2014 Y/Y
Unconsolidated
Systems Limited | Annual Report 2015 027
Upgrading your business future through technology and innovation
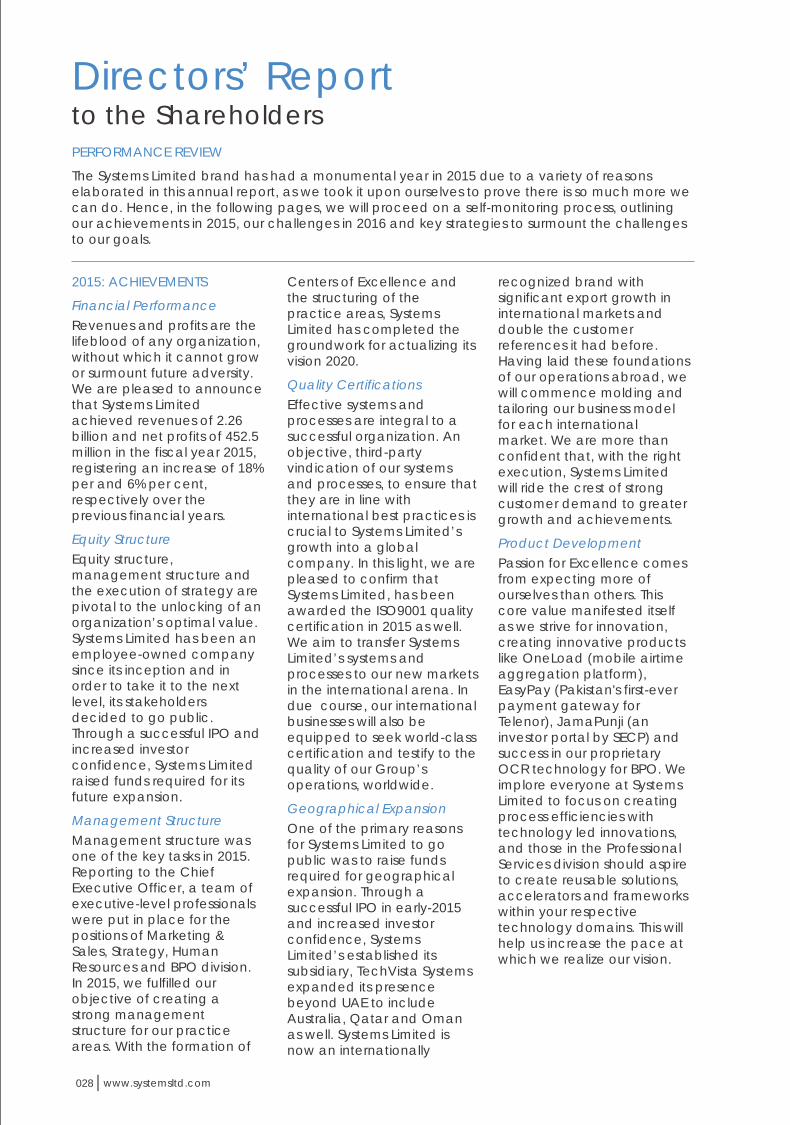
PERFORMANCE REVIEW
The Systems Limited brand has had a monumental year in 2015 due to a variety of reasons elaborated in this annual report, as we took it upon ourselves to prove there is so much more we can do. Hence, in the following pages, we will proceed on a self-monitoring process, outlining our achievements in 2015, our challenges in 2016 and key strategies to surmount the challenges to our goals.
2015: ACHIEVEMENTS
Financial Performance
Equity Structure
Management Structure
Revenues and profits are the lifeblood of any organization, without which it cannot grow or surmount future adversity. We are pleased to announce that Systems Limited achieved revenues of 2.26 billion and net profits of 452.5 million in the fiscal year 2015, registering an increase of 18% per and 6% per cent, respectively over the previous financial years.
Equity structure, management structure and the execution of strategy are pivotal to the unlocking of an organization’s optimal value. Systems Limited has been an employee-owned company since its inception and in order to take it to the next level, its stakeholders decided to go public. Through a successful IPO and increased investor confidence, Systems Limited raised funds required for its future expansion.
Management structure was one of the key tasks in 2015. Reporting to the Chief Executive Officer, a team of executive-level professionals were put in place for the positions of Marketing & Sales, Strategy, Human Resources and BPO division. In 2015, we fulfilled our objective of creating a strong management structure for our practice areas. With the formation of
Centers of Excellence and the structuring of the practice areas, Systems Limited has completed the groundwork for actualizing its vision 2020.
Effective systems and processes are integral to a successful organization. An objective, third-party vindication of our systems and processes, to ensure that they are in line with international best practices is crucial to Systems Limited’s growth into a global company. In this light, we are pleased to confirm that Systems Limited, has been awarded the ISO9001 quality certification in 2015 as well. We aim to transfer Systems Limited’s systems and processes to our new markets in the international arena. In due course, our international businesses will also be equipped to seek world-class certification and testify to the quality of our Group’s operations, worldwide.
One of the primary reasons for Systems Limited to go public was to raise funds required for geographical expansion. Through a successful IPO in early-2015 and increased investor confidence, Systems Limited’s established its subsidiary, TechVista Systems expanded its presence beyond UAE to include Australia, Qatar and Oman as well. Systems Limited is now an internationally
Quality Certifications
Geographical Expansion
recognized brand with significant export growth in international markets and double the customer references it had before. Having laid these foundations of our operations abroad, we will commence molding and tailoring our business model for each international market. We are more than confident that, with the right execution, Systems Limited will ride the crest of strong customer demand to greater growth and achievements.
Passion for Excellence comes from expecting more of ourselves than others. This core value manifested itself as we strive for innovation, creating innovative products like OneLoad (mobile airtime aggregation platform), EasyPay (Pakistan's first-ever payment gateway for Telenor), JamaPunji (an investor portal by SECP) and success in our proprietary OCR technology for BPO. We implore everyone at Systems Limited to focus on creating process efficiencies with technology led innovations, and those in the Professional Services division should aspire to create reusable solutions, accelerators and frameworks within your respective technology domains. This will help us increase the pace at which we realize our vision.
Product Development
www.systemsltd.com028
Directors’ Reportto the Shareholders
2016: CHALLENGES
Ÿ Will our new international markets and new practices contribute positively.
Ÿ Will our profitability be constrained due to investment in new markets.
CHALLENGES AND OBJECTIVES
While our achievements in 2015 serve as a promising start for Systems Limited’s next lap, the path forward will be lined with challenges demanding our management’s dedicated focus and concerted efforts.
These questions are representative. They are by no means exhaustive. Having marked the boundaries of our battleground and identified the obstacles ahead, we summarize key objectives for 2015 as follows:
Ÿ Will macroeconomic factors continue to work in our favor to support our goals.
Ÿ Will the global economy continue its part of expansion.
2016: OBJECTIVES
Growth Momentum
Centers of Excellence
Employee Engagement & Culture
We will continue our top line growth momentum and accelerate our bottom line growth and leverage on our 2015 investment.
We have aligned our resource poll towards specialized and focused practice areas and competency centers. Nurturing these practices and transforming them into standalone profit centers is the most critical process. We must ensure that they will contribute positively.
A cornerstone in our management philosophy is to build a distinctive Systems way. To attain the vision 2020,
Systems Limited must be driven by objectives, measurable performance and monitoring. Having successfully implemented the culture of Management by Objectives and Key Performance Indicators among senior management, we will proceed to percolate this philosophy to the subsidiaries, so as to permeate this process through every level of our organization. To ensure the continuity of Systems Limited, we have also proceeded to put in place a management succession plan commencing with Pakistan and eventually with all subsidiaries.
Accelerating Innovation
The history of Systems Limited is replete with disruptive innovation by its employees at all levels and the successful conversion of these ideas to provide products and services to our clients. This has been possible because of continuous commitment of Systems Limited to invest in Research and Development and its commitment towards employee-ownership. In this respect, Systems Limited launched SILa (the Systems Ideas Lab) initiative last year. SILa reinforces our and new ideas. We are actively investing in ideas and proposals that are evaluated and approved by the Steering Committee and taking these from ideas to realities.
Systems Limited | Annual Report 2015 029

Macro Business Climate:
Competitive Dynamics:
Ÿ Software IT export is $2bn, projected to grow (at 35% Y-o-Y) to $6bn by 2020
Ÿ Increasing number of IT education focused universities and graduates
Ÿ Market maturity with technology adaption and e-government initiatives
Ÿ Country risk – poor perception on domestic law and order situation
Ÿ Commodity price pressure is putting pressure on MEA public sector IT spending
Ÿ Highly competitive and dynamic market with large untapped potential
Ÿ Differentiations quickly copied. Frequent hiring of each others resources
Ÿ High cost of new customer acquisition
Ÿ Quick changes in technology land scape
Ÿ Slow adoption of technology trends in local market
Ÿ High resistance of change in local and MEA clients
INDUSTRIAL / SECTOR ANALYSIS
www.systemsltd.com030
Systems Limited | Annual Report 2015 031
Market maturity
Price margins
Scarce experienced resources in local market
Employee turnover to MEA
Higher receivables ratio in regional and domestic market
Experience and knowledgebase
Leadership and human capital
Financial strength
Local references
Partnerships
Employee Ownership
Country risk
Price war
Information security
Competition hiring resource
Government support for the industry
Changing tax laws
Access to market
Domain expertise
Recurring business
Repeat success stories
Innovation and product development
Growth in North American market

2016 Plans
The 2016 budget is targeted towards achieving historical growth trend. This growth is attributed to the following factors:
Ÿ Our relationship with most of our existing customers is of recurring nature and through our laser focused efforts and engagement management approach we are confident that majority of our customers will carry along with us and contribute to our growth.
Ÿ We are well poised to take advantage this year from our investment in innovation and solution development for Apparel/Retail, Business Process Automation, and Business Intelligence.
Ÿ We have invested and aligned our resources to practice based structure and this is strengthening our market positioning to be a more specialized player versus generic player in the market.
Ÿ Our Geographic Diversification Strategy will play vital role in our growth this year.
Ÿ In Pakistan Public Sector has been investing heavily in Information Technology Enabled Services and we are well poised to get good chunk of business due to our positioning and successful track record in Pakistan.
Ÿ Our relationship with Principals (IBM, Microsoft) have been solidified over past few years and we are getting good business references, leads and support globally.
Ÿ We are focusing on Sustainable growth this year and critically focused on signing new business which has desired margin.
Ÿ We are committed to continuously invest in innovation for our better future.
Ÿ With Pakistan Law and Order getting better we envision significant
opportunities in our business, as our foreign customers/ prospects will feel comfortable in visiting us and this will spur growth in Pakistan IT Sector.
Ÿ We are expecting about 80% of our business from Export Services and hence dollar based, our expenses are in PKR and any dollar devaluation will help us in improving our overall profitability.
Ÿ OneLoad product development has been completed and now we are working aggressively towards launch and commercialization.
Ÿ Our Export Tax Exemption will most likely be extended for next 5 years and this will provide further confidence to the sector.
Ÿ Our new Office Building in Lahore will be operational towards end of this year and this will bring efficiency and savings by combining our four rental office locations to our own premise.
FUTURE OUTLOOK
www.systemsltd.com032
RISK FACTORS
Following are some of the risk factors that may impact our business and financial results:
Ÿ World perception of Pakistan
Ÿ Global Economic Downturn
Ÿ Pricing Pressures
Ÿ Resource Availability
World Perception of Pakistan
Although world perception of Pakistan has been enhancing and we are seeing improvements over the last year; but still there is negativity and we do not have a clean chit. The volatile situation of security in Pakistan is still a risk for us.
To mitigate this risk we have diversified our business in various regions and expanded our footprint locally and regionally. We are heavily focused on creating IP based solution offerings, which can be sold in any country without hindrance of perception.
Global Economic Downturn
With the commodity pricing falling and less demand in China we are envisioning this year will be difficult especially for Oil producing countries in GCC and ITES demand can be slow.
Since, we are not relying on one region and we do not have strong dependency on any specific region or a client so we are confident even with the global downturn we will achieve our growth targets.
Pricing Pressure
Given the scarce IT resources in Market cost of Resources are going up year on year.
In order to mitigate this risk we will continue to induct Fresh Graduates from top notch universities, and working on proper resource mix, where senior resources can be utilized as more customer facing and client engagement role and back office work can be done by the junior resources, this will help us in balancing the cost of resources in various engagements.
Resource Availability
High profile IT consultants and Engineers are in heavy demand and very hard to find, and considering our growth target, this is extremely hard to find quality resources.
In order to mitigate this risk this year we have been heavily focused on in-house and outside training of our resources to bring them at the level where we can use them effectively. We have also signed up with many recruitment firms. So, we can continuously screen and select leaders, who are essential for our sustainable growth.
Systems Limited | Annual Report 2015 033

CORPORATE GOVERNANCE AND FINANCIAL REPORTING FRAMEWORK
KEY OPERATING AND FINANCIAL DATA
DIVIDEND
As required by the Code of Corporate Governance, the directors are pleased to confirm that:
Ÿ The financial statements prepared by the management of the Company, present its state of affairs fairly, the result of its operations, cash flows and changes in equity;
Ÿ Proper books of accounts of the Company have been maintained;
Ÿ Appropriately accounting policies have been consistently applied in the preparation of financial statements and accounting estimates are based on reasonable and prudent judgment;
Ÿ International Financial Reporting Standards, as applicable in Pakistan, have been followed in the preparation of financial statements and there have been no departures therefrom;
Ÿ The system of internal control is sound in design and has been effectively implemented and monitored;
Ÿ There are no significant doubts about the Company's ability to continue as a going concern.
Key operating and financial data for the last six years is annexed with the annual report.
The Board of Directors has
recommended 12.5% cash dividend on ordinary shares for the year ended 31 December 2015.
The value of provident fund operated by the Company, based on the un-audited accounts of the fund as on 31 December 2015 amounts to Rs. 139.63 million.
The Board comprises of seven (7) directors, out of which four (4) are Independent Directors, two (2) are Non-Executive Directors and one (1) Executive Director (CEO/MD).
The Audit Committee comprises of three (3) Non-Executive Directors including the Chairman of the Committee. All members of Audit Committee are Independent Directors. The terms of reference of Audit Committee, which is in line with the Code of Corporate Governance, has been presented and approved by the Board of Directors.
The Company has established Human Resource and Remuneration Committee in accordance with requirements of the Code of Corporate Governance. The Committee consists of three (3) Non-Executive Directors which are also Independent Directors.
INVESTMENTS OF PROVIDENT FUND
COMPOSITION OF THE BOARD OF DIRECTORS
COMPOSITION OF THE AUDIT COMMITTEE
COMPOSITION OF THE HUMAN RESOURCE AND REMUNERATION COMMITTEE
BOARD'S AND COMMITTEES' MEETINGS
Board of Directors
During the year, five (5) meetings of the Board of Directors were held. The attendance of each Director is as follows:
Name of Directors Attendance
Mr. Aezaz Hussain
Mr. Asif Peer
Mr. Arshad Masood
Mr. Omer Saeed
Mr. Ayaz Dawood
Mr. Asif Jooma
Mr. Tahir Masaud
5
5
4
5
5
4
3
Leave of absence was granted to the Directors who could not attend the Board Meetings.
During the year, four (4) meetings of the Audit Committee were held. The attendance of each director is as follows:
Audit Committee
Name of Directors Attendance
Mr. Omer Saeed
Mr. Tahir Masaud
Mr. Ayaz Dawood 4
1
3
Leave of absence was granted to the Directors who could not attend the meetings of Audit Committee.
During the year, one (1) meeting of the Committee was held. The attendance of each director is as follows:
Human Resource and Remuneration Committee
Name of Directors Attendance
Mr. Omer Saeed
Mr. Asif Jooma
Mr. Tahir Masaud
1
1
1
www.systemsltd.com034
Directors’ Reportto the Shareholders
NEW APPOINTMENTS ON THE BOARD
DIRECTORS' TRAINING PROGRAMS
TRADING BY DIRECTORS, EXECUTIVES AND THEIR SPOUSES AND MINOR CHILDREN
REVIEW OF RELATED PARTIES TRANSACTIONS
During the year, two (2) new directors, Mr. Asif Jooma and Mr. Tahir Masaud, were appointed to fill the casual vacancies. The Board wishes to place on record its appreciation of the valuable services rendered by outgoing Directors, Syed Zahoor Hassan and Mr. Amir Zia during the tenure of their office and welcomes the new Directors who will hold office for the remainder of the term.
During the year, the Board arranged Orientation Courses for its Directors. Three (3) of the directors, Mr. Asif Peer, Mr. Ayaz Dawood and Mr. Tahir Masaud have completed the Directors' Training Program from recognized institutions of Pakistan that meet the criteria specified by SECP. Furthermore, the Board has put in place a mechanism for an annual evaluation of the Board's own performance.
The Company's Directors, executives and their spouses and minor children did not trade in the Company's shares during the year ended 31 December 2015.
In compliance with the Code of Corporate Governance and applicable laws and regulations, details of all related parties transactions are placed before the Audit Committee and upon recommendation of the
Audit Committee, the same are placed before the Board for review and approval.
The financial statements were duly endorsed by CEO and CFO before approval of the Board. Quarterly financial statements of the Company, along with consolidated financial statements of the Group, were approved, published and circulated to shareholders within one month of the closing date, while Half Yearly financial statements of the Company and consolidated financial statements of the Group were reviewed by the external auditors, approved by the Board, published and circulated to shareholders within two months of the closing date.
The Company acknowledges its responsibility towards society and performs its duty by providing financial assistance to projects for society development by various charitable institutions on consistent basis.
The Company is operating an Employee Stock Option Scheme approved by Securities and Exchange Commission of Pakistan. According to scheme, 100% options become exercisable after completion of vesting period of 2 years and an exercise period of 3 years from the date the option is vested.
According to the requirements of section 12 of Employees Stock Option Rules, 2001 following
QUARTERLY AND ANNUAL FINANCIAL STATEMENTS
CORPORATE SOCIAL RESPONSIBILITY
EMPLOYEE STOCK OPTION POLICY
Chief ExecutiveOfficer
Other Employees
540,000 options
271,500 options
No employee was granted option amounting to one percent or more of the issued capital of the Company.
The grant price of these options in accordance with the approved mechanism is Rs. 25.45 per option. Price of options is determined by taking average of the following:
Ÿ One (1) time last audited Annual Revenue divided by Total Outstanding Shares
Ÿ Six (6) times last audited Annual Profit before Tax divided by Total Outstanding Shares
Ÿ Breakup value calculated by dividing last audited equity by Total Shares Outstanding
453,676 shares were issued during the year ended 31 December 2015 due to exercise of options granted in the years 2013 or before, by the employees. On exercise of these options Rs. 7,236,132 were received in the Company.
The Pattern of Shareholding as at 31 December 2015, is presented on page on 38.
PATTERN OF SHAREHOLDING
disclosure is made for the year ended 31 December 2015.
The Company has granted 811,500 options to its employees during the year 2015, which will be available for exercise in 2017.
The detail of options granted to the directors and employees of the Company during the year 2015 are as follows:
Systems Limited | Annual Report 2015 035

On behalf of the Board
Asif Peer
Chief Executive
31 March 2016
Lahore
AUDITORS
CONSOLIDATED FINANCIAL STATEMENTS
ACKNOWLEDGEMENT
Ernst & Young Ford Rhodes Sidat Hyder, Chartered Accountants, has completed its tenure for the year 2015 and retire at the conclusion of the 39th Annual General Meeting. Being eligible, they have offered themselves for re-appointment.
Consolidated financial statements of the Company together with its subsidiary companies E-Processing Systems (Private) Limited and Tech Vista Systems FZ-LLC are also included.
The Board takes this opportunity to thank the Company's valued customers, bankers and other stakeholders for their corporation and support. The Board greatly appreciates hard work and dedication of all employees of the Company.
www.systemsltd.com036
Combining innovation and putting data to work
We implement solutions that befit all your business needs
Systems Limited | Annual Report 2015 037
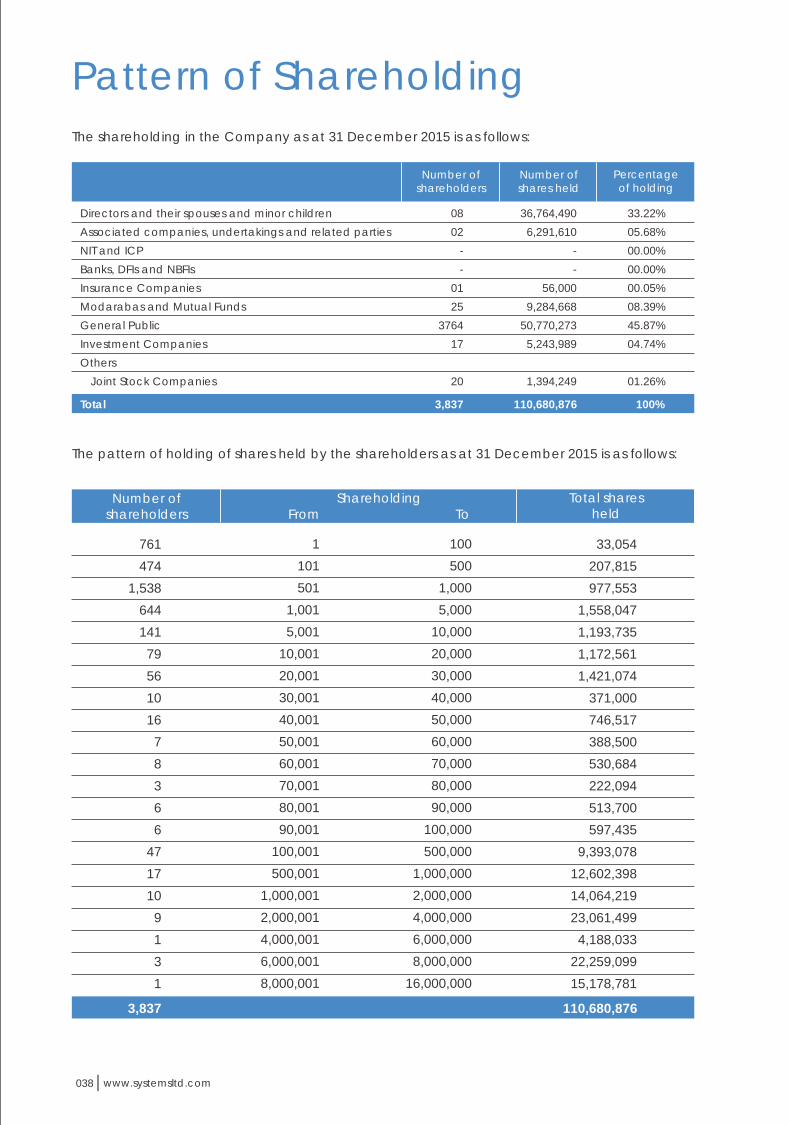
Pattern of Shareholding
The shareholding in the Company as at 31 December 2015 is as follows:
Shareholders' category
Directors and their spouses and minor children
Associated companies, undertakings and related parties
NIT and ICP
Banks, DFIs and NBFIs
Insurance Companies
Modarabas and Mutual Funds
General Public
Investment Companies
Others
Joint Stock Companies
08
02
-
-
01
25
3764
17
20
Number of shareholders
Number of shares held
Percentageof holding
36,764,490
6,291,610
-
-
56,000
9,284,668
50,770,273
5,243,989
1,394,249
33.22%
05.68%
00.00%
00.00%
00.05%
08.39%
45.87%
04.74%
01.26%
Total 3,837 110,680,876 100%
www.systemsltd.com038
Shareholder's category Number ofshares held
Percentage%
Category no.
Information of shareholding as at 31 December 2015 as required under Code of CorporateGovernance is as follows:
6.
6,303,489 5.70%
Banks, DFIs and NBFIs, Insurance Companies,
Modarabas and Pension Funds
Public Sector Companies and Corporations 5. - 00.00%
Executives 4. - 00.00%
Mutual Funds2.
1.
7. Shareholders holding five percent or more voting rights
Aezaz HussainAsif PeerArshad MasoodSalma MianManzurul Haq
14,282,2345,979,658
16,384,7457,976,8656,742,822
12.90%05.40%14.80%07.21%06.09%
51,366,324 46.41%
Directors and their spouses and minor children3.
Aezaz HussainNeelam HussainAsif PeerArshad MasoodOmar SaeedChaudhary Tahir MasaudAsif JoomaAyaz Dawood
14,282,234105,109
5,979,65816,384,745
1,095100549
11,000
36,764,490 33.22%
The pattern of holding of shares held by the shareholders as at 31 December 2015 is as follows:
Number of shareholders
Total shares held
761
474
1,538
644
141
79
56
10
16
7
8
3
6
6
47
17
10
9
1
3
1
3,837
Shareholding
1
101
501
1,001
5,001
10,001
20,001
30,001
40,001
50,001
60,001
70,001
80,001
90,001
100,001
500,001
1,000,001
2,000,001
4,000,001
6,000,001
8,000,001
From To
33,054
207,815
977,553
1,558,047
1,193,735
1,172,561
1,421,074
371,000
746,517
388,500
530,684
222,094
513,700
597,435
9,393,078
12,602,398
14,064,219
23,061,499
4,188,033
22,259,099
15,178,781
110,680,876
100
500
1,000
5,000
10,000
20,000
30,000
40,000
50,000
60,000
70,000
80,000
90,000
100,000
500,000
1,000,000
2,000,000
4,000,000
6,000,000
8,000,000
16,000,000
Systems Limited | Annual Report 2015 039
Associated Companies, undertakings and
related parties
M/S IGI Insurance Limited
M/S B.R.R. Guardian Modarba
3.78%
1.90%
5.68%
Tundra Pakistan Fund
CDC - Trustee MCB Pakistan Stock Market Fund
CDC - Trustee Alfalah GHP Islamic Stock Fund
CDC - Trustee Alfalah GHP Stock Fund
CDC - Trustee Alfalah GHP Alpha Fund
CDC - Trustee PICIC Stock Fund
CDC - Trustee PICIC Islamic Stock Fund
CDC - Trustee MCB Pakistan Asset Allocation Fund
Others
4,188,033
2,103,577
6,291,610
2,413,000
1,732,250
383,000
753,000
420,000
384,875
539,650
390,367
2,268,526
2.18%
1.57%
0.35%
0.68%
0.38%
0.35%
0.49%
0.35%
2.05%
8.39%9,284,668
12.90%0.09%5.40%
14.80%0.00%0.00%0.00%0.01%

www.systemsltd.com040
Annual General Meeting
Annual General Meeting on 27th April
2016 at Chamber of Commerce Building,
11 Sharae Aiwane Tijarat, Lahore at
12:30 p.m
Systems Limited | Annual Report 2015 041
By order of the Board
Affan SajjadCompany Secretary
Date: 06 April 2016Lahore
Notice is hereby given to all the members of Systems Limited (the "Company") that 39th Annual General Meeting of the Company is scheduled to be held on 27 April 2016 at 12:30 P.M. at Chamber of Commerce Building, 11 Sharae Aiwan-e-Tijarat, Lahore to transact the following business:
Ordinary Business:
1. To confirm the minutes of the last Annual General Meeting held on 24 April 2015.
2. To, receive, consider and adopt the Audited Accounts of the Company for the year ended 31 December 2015 together with the Board of Directors' and Auditors' report thereon.
3. To approve and declare cash dividend @ 12.5 % i.e. PKR 1.25/ per share, for the year ended 31 December 2015 as recommended by the Board of Directors
4. To appoint Auditors and fix their remuneration for the year ending 31 December 2016. The Board of Directors upon recommendation of audit committee has recommended M/s Ernst & Young Ford Rhodes Sidat Hyder, Chartered Accountants, being eligible for appointment as auditors of the company for the year ending 31 December 2016.
Other Business:
5. Any other Business with the permission of the Chair.
their CNIC (if not already provided) to the Company Share Registrar, M/s THK Associates (Pvt.) Limited, 2nd Floor, State Life Building No. 3, Dr. Zia-uddin Ahmed Road, Karachi.
4. The Government of Pakistan through Finance Act, 2015 has made certain amendments in Section 150 of the Income Tax Ordinance, 2001 whereby different rates are prescribed for deduction of withholding Tax on the amount of dividend paid by the companies/banks. These tax rates are as follows:
(a) For filers of income tax returns 12.5%(b) For non-filers of income tax returns 17.5%
To enable the Company to make tax deduction on the amount of cash dividend @12.5% instead of 17.5% all shareholders whose names are not entered into the Active Tax- payers list (ATL) provided on the website of FBR, despite the fact that they are filers, are advised to make sure that their names are entered into ATL before the date of payment of the cash dividend, otherwise tax on their cash dividend will be deducted @17.5% instead of 12.5%.
The joint shareholders are requested to provide shareholding proportions of principal shareholders & joint shareholders as withholding tax will be determined separately on Filer/Non-filer status based on their shareholding proportions otherwise it will be assumed that shares are equally held.
The Corporate shareholders having CDC account are required to have their National Tax Number (NTN) updated with their respective participants, whereas physical shareholders should send a copy of their NTN Certificate to the Company or Company's Share Registrar, M/s. THK Associates (Pvt.) Limited. The shareholders while sending NTN or NTN Certificate, as the case may be, must quote Company name and their respective folio numbers.
5. SECP through its notification SRO 787(1) /2014 dated September 8, 2014 has allowed the circulations of Audited Financial Statement along with Notice of Annual General Meeting to the Members through e-mail. Therefore, all members of the Company who wish to receive soft copy of Annual Report are requested to send their e-mail addresses. The consent form for electronic transmission could be downloaded from the Company Website: www.systemsltd.com Audited financial statements & reports are being placed on the aforesaid website.
6. All the account holders whose registration details are uploaded as per CDC Regulations shall authenticate their identity by showing original CNIC at the time of attending the meeting. In case of corporate entity, a certified copy of resolution of the Board of Directors / valid Power of Attorney having the name and specimen signature of the nominee should be produced at the time of meeting.
NOTES:
1. The Share Transfer books of the Company will be closed from 21 April 2016 to 27 April 2016 (both days inclusive). Transfer received at the address of M/s THK Associates (Pvt.) Limited, 2nd Floor, State Life Building No. 3, Dr. Zia-uddin Ahmed Road, Karachi at the close of business on 20 April 2016 will be treated in time for the purpose of above entitlement to the transferees.
2. A member entitled to attend and vote at the meeting may appoint another member as his/her proxy to attend and vote in his/her place. Proxies completed in all respect, in order to be effective, must be received at the Registered Office of the Company not less than forty eight (48) hours before the time of meeting.
3. Pursuant to the directive of the Securities & Exchange Commission of Pakistan, CNIC numbers of shareholders are mandatorily required to be mentioned on Dividend Warrants. Shareholders are, therefore, requested to submit a copy of

Statement of Compliancewith best practices of the Code of Corporate Governance
This statement is being presented to comply with the Code of Corporate Governance contained in Regulation No. 35 of listing regulations of Pakistan Stock Exchanges for the purpose of establishing a framework of good governance, whereby a listed company is managed in compliance with the best practices of corporate governance.
The company has applied the principles contained in the CCG in the following manner:
1. The company encourages representation of independent non-executive directors and directors representing minority interests on its board of directors. As of 31 December 2015, the Board comprises of the following;
Category
Independent Directors Mr. Tahir Masud
Mr. Omar Saeed
Mr. Ayaz Dawood
Mr. Asif Jooma
Names
Executive Director Mr. Asif Peer
Non-Executive Directors Mr. Aezaz Hussain
Mr. Arshad Masood
The independent directors meets the criteria of independence under clause i (b) of the CCG.
2. The directors have confirmed that none of them is serving as a director on more than seven listed companies, including this company (excluding the listed subsidiaries of listed holding companies where applicable).
3. All the resident directors of the company are registered as taxpayers and none of them has defaulted in payment of any loan to a banking company, a DFI or an NBFI or, being a member of a stock exchange, has been declared as a defaulter by that stock exchange.
4. Syed Zahoor Hassan and Mr. Amir Zia resigned on March 18, 2015. Mr. Asif Jooma and Mr. Tahir Masaud was appointed on March 18, 2015 to fill the casual vacancy.
5. The company has prepared a "Code of Conduct" and has ensured that appropriate steps have been taken to disseminate it throughout the company along with its supporting policies and procedures.
6. The board has developed a vision/mission statement, overall corporate strategy and significant policies of the company. A complete record of particulars of significant policies along with the dates on which they were approved or amended has been maintained.
7. All the powers of the board have been duly exercised and decisions on material transactions, including appointment and determination of remuneration and terms and conditions of employment of the CEO, other executive and non-executive directors, have been taken by the board.
8. The meetings of the board were presided over by the Chairman and, in his absence, by a director elected by the board for this purpose and the board met at least once in every quarter. Written notices of the board meetings, along with agenda and working papers, were circulated at least seven days before the meetings. The minutes of the meetings were appropriately recorded and circulated.
9. The Board has arranged Orientation Courses for its Directors during the year. Mr. Muhammad Asir Peer, Mr. Ayaz Dawood and Mr. Tahir Masud has completed the Director's Training Program from recognized institutions of Pakistan that meet the criteria specified by the SECP. Further, the Directors have also provided declarations that they are aware of their duties, powers and responsibilities under the Companies Ordinance, 1984 and the Listing Regulations of the Stock Exchange. Furthermore, the Board has put in place a mechanism for an annual evaluation of the Board's own performance.
10. The board has approved appointment of CFO, Company Secretary and Head of Internal Audit, including their remuneration and terms and conditions of employment.
11. The directors' report for this year has been prepared in compliance with the requirements of the CCG and fully describes the salient matters required to be disclosed.
12. The financial statements of the company were duly endorsed by CEO and CFO before approval of the board.
www.systemsltd.com042
13. The directors, CEO and executives do not hold any interest in the shares of the company other than that disclosed in the pattern of shareholding.
14. The company has complied with all the corporate and financial reporting requirements of the CCG.
15. The board has formed an Audit Committee. It comprises three members, of whom all are independent directors
16. The meetings of the audit committee were held at least once every quarter prior to approval of interim and final results of the company and as required by the CCG. The terms of reference of the committee have been formed and advised to the committee for compliance.
17. The board has formed an HR and Remuneration Committee. It comprises three members, of whom all are independent directors and the chairman of the committee.
18. The board has outsourced the internal audit function to Uzair Hammad Faisal & Co. Chartered Accountants, which are considered suitably qualified and experienced for the purpose and are conversant with the policies and procedures of the company and their representatives are involved in the internal audit function on a full time basis. Further, as required under clause xxxi of Code of Corporate Governance, the company has also appointed a full time employee other than CFO as Head of Internal Audit to act as coordinator between firm providing internal audit services and the Board.
19. The statutory auditors of the company have confirmed that they have been given a satisfactory rating under the quality control review program of the ICAP, that they or any of the partners of the firm, their spouses and minor children do not hold shares of the company and that the firm and all its partners are in compliance with International Federation of Accountants (IFAC) guidelines on code of ethics as adopted by the ICAP.
20. The statutory auditors or the persons associated with them have not been appointed to provide other services except in accordance with the listing regulations and the auditors have confirmed that they have observed IFAC
guidelines in this regard.
21. The 'closed period', prior to the announcement of interim/final results, and business decisions, which may materially affect the market price of company's securities, was determined and intimated to directors, employees and stock exchange(s).
22. Material/price sensitive information has been disseminated among all market participants at once through stock exchange(s).
23. We confirm that all other material principles enshrined in the CCG have been complied with.
On behalf of the Board
Asif Peer
Chief Executive
31 March 2016
Lahore
Systems Limited | Annual Report 2015 043

Review Report to the Memberson the Statement of Compliance with best practicesof the Code of Corporate Governance
www.systemsltd.com044
We have reviewed the Statement of Compliance with the best practices (the statement) contained in the Code of Corporate Governance prepared by the Board of Directors of Systems Limited (the Company) for the year ended 31 December 2015 to comply with the Rule Book of Pakistan Stock Exchange Limited (formerly known as Karachi, Lahore and Islamabad Stock Exchanges), where the Company is listed.
The responsibility for compliance with the Code of Corporate Governance is that of the Board of Directors of the Company. Our responsibility is to review, to the extent where such compliance can be objectively verified, whether the Statement of Compliance reflects the status of the Company's compliance with the provisions of the Code of Corporate Governance and report if it does not. A review is limited primarily to inquiries of the Company personnel and review of various documents prepared by the Company to comply with the Code.
As part of our audit of financial statements we are required to obtain an understanding of the accounting and internal control systems sufficient to plan the audit and develop an effective audit approach. We are not required to consider whether the Board's statement on internal controls covers all the risks and controls, or to form an opinion on the effectiveness of such internal controls, the Company's corporate governance procedures and risks.
The Code requires the Company to place before the Audit Committee, and upon recommendation of the Audit Committee, place before the Board of Directors for their review and approval its related party transactions distinguishing between transactions carried out on terms equivalent to those that prevail in arm's length transactions and transactions which are not executed at arm's length price and recording proper justification for using such alternate pricing mechanism. We are only required and have ensured compliance of this requirement to the extent of the approval of the related party transactions by the Board of Directors upon recommendation of the Audit Committee. We have not carried out any procedures to determine whether the related party transactions were undertaken at arm's length price or not.
Based on our review, nothing has come to our attention which causes us to believe that the Statement of Compliance does not appropriately reflect the Company's compliance, in all material respects, with the best practices contained in the Code of Corporate Governance as applicable to the Company for the year ended 31 December 2015.
Chartered AccountantsEngagement Partner: Naseem Akbar
Lahore.Date: 31 March 2016
SeparateFinancial Statements

This page has been left blank intentionally

AUDITORS’ REPORT TO THE MEMBERS
Systems Limited | Annual Report 2015 047
We have audited the annexed balance sheet of Systems Limited ("the Company") as at 31 December 2015 and the related profit and loss account, cash flow statement, statement of comprehensive income and statement of changes in equity together with the notes forming part thereof, for the year then ended and we state that we have obtained all the information and explanations which, to the best of our knowledge and belief, were necessary for the purposes of our audit.
It is the responsibility of the Company's management to establish and maintain a system of internal control and prepare and present the above said statements in conformity with the approved accounting standards and the requirements of Companies Ordinance, 1984. Our responsibility is to express an opinion on these statements based on our audit.
We conducted our audit in accordance with the auditing standards as applicable in Pakistan. These standards require that we plan and perform the audit to obtain reasonable assurance about whether the above said statements are free of any material misstatement. An audit includes examining on a test basis, evidence supporting the amounts and disclosures in the above said statements. An audit also includes assessing the accounting policies and significant estimates made by the management, as well as, evaluating the overall presentation of the above said statements. We believe that our audit provides a reasonable basis for our opinion and, after due verification, we report that:
a) in our opinion, proper books of accounts have been kept by the company as required by the Companies Ordinance, 1984;
b) in our opinion:
i) the balance sheet and profit and loss account together with the notes thereon have been drawn up in conformity with the Companies Ordinance, 1984, and are in agreement with the books of account and are further in accordance with accounting policies consistently applied;
ii) the expenditure incurred during the year was for the purpose of the company's business; and
iii) the business conducted, investments made and the expenditure incurred during the year were in accordance with the objects of the Company;
c) in our opinion and to the best of our information and according to the explanations given to us, the balance sheet, profit and loss account, cash flow statement, statement of comprehensive income and statement of changes in equity together with the notes forming part thereof conform with approved accounting standards as applicable in Pakistan, and give the information required by the Companies Ordinance, 1984 in the manner so required and respectively give a true and fair view of the state of the Company's affairs as at 31 December 2015 and of the profit, comprehensive income, its cash flows and changes in equity for the year then ended; and
d) in our opinion, Zakat deductible at source under the Zakat and Ushr Ordinance, 1980 (XVIII of 1980), was deducted by the Company and deposited in the Central Zakat Fund established under section 7 of that Ordinance.
Other matter
The financial statements of the Company for the year ended 31 December 2014 were audited by another firm of chartered accountants whose report dated 18 March 2015 expressed an unqualified opinion.
Chartered Accountants
Engagement Partner: Naseem AkbarLahore. Date : 31 March 2016

BALANCE SHEETAS AT DECEMBER 31, 2015
AEZAZ HUSSAINChairman
2015NoteAmounts in rupees 2014
EQUITY AND LIABILITIES
Share capital and reserves
Authorized share capital
150,000,000 (2014: 150,000,000) ordinary shares of Rs. 10 each 1,500,000,000 1,500,000,000
The annexed notes from 1 to 42 form an integral part of these financial statements.
Long term advances 19 7,652,045 6,766,611
CONTINGENCIES AND COMMITMENTS 22
-
-
Current liabilities
Trade and other payables 20
Unearned revenue 21
Current portion of long term advances
Total current liabilities
237,042,067 109,811,070
5,017,350
351,870,487
269,446,164 6,447,492
3,391,885
279,285,541
2,855,149,969TOTAL EQUITY AND LIABILITIES 2,433,813,176
Issued, subscribed and paid up share capital 17
Reserves 18
Unappropriated profit
Total shareholders' equity
1,106,808,760
420,558,053 968,260,624
2,495,627,437
871,653,020
39,124,151 716,983,853
1,627,761,024
Advance against issue of shares - 520,000,000
ASIF PEERChief Executive
ASSETS
Non-current assets
Property and equipment 5 359,204,912 202,065,814
Intangibles 6 34,101,951
Long term deposits 12,346,357 Long term investments 7 2,077,980 Deferred taxation 8 1,483,224
Total non-current assets 252,075,326
Current assets
Unbilled revenue 9 196,852,530 Trade debts 10 817,283,423 Advances 11 25,269,376 Trade deposits and short term prepayments 12 50,536,901
Interest accrued 3,164,738
Receivable from related parties 13 47,728,753
Tax refunds due from the Government 14 27,467,230
Short term investments 15 30,204,644
Cash and bank balances 16 983,230,255
Total current assets 2,181,737,850
42,247,518
9,895,100 51,077,980
809,510
463,235,020
244,214,338 1,096,796,692
68,055,610 48,101,585
12,585,928
164,572,856
55,143,956
557,799,398
144,644,586
2,391,914,949
TOTAL ASSETS 2,855,149,969 2,433,813,176
2015NoteAmounts in rupees 2014
Systems Limited | Annual Report 2015 049
www.systemsltd.com048
Non-current liabilities

2015Amounts in rupees 2014
STATEMENT OF COMPREHENSIVE INCOME
AEZAZ HUSSAINChairman
ASIF PEERChief Executive
Profit for the year 452,514,730 426,719,580
Other comprehensive income: - -
Total comprehensive income for the year 452,514,730 426,719,580
The annexed notes from 1 to 42 form an integral part of these financial statements.
PROFIT AND LOSS ACCOUNTFOR THE YEAR ENDED 31 DECEMBER 2015
2015NoteAmounts in rupees 2014
AEZAZ HUSSAINChairman
ASIF PEERChief Executive
Revenue 23
Cost of sales 24
Gross profit
Distribution cost 25
Administrative expenses 26
Research and development expenses 27
Operating profit
Other income 28
Other operating expenses 29
Finance cost 30
Profit before taxation
Taxation 31
Profit after taxation
Earnings per share
Basic earnings per share 35
Diluted earnings per share 35
2,263,290,351
(1,506,544,772)
756,745,579
(69,629,714)
(262,301,728)
(29,201,984)
(361,133,426)
395,612,153
91,963,242
487,575,395
(19,948,597)
(2,121,044)
(22,069,641)
465,505,754
(12,991,024)
452,514,730
4.14
4.09
1,922,615,854
(1,242,708,948)
679,906,906
(59,542,078)
(198,631,669)
(2,429,418)
(260,603,165)
419,303,741
38,502,506
457,806,247
(22,957,237)
(3,985,590)
(26,942,827)
430,863,420
(4,143,840)
426,719,580
(Restated)
4.47
4.43
The annexed notes from 1 to 42 form an integral part of these financial statements.
Systems Limited | Annual Report 2015 051
www.systemsltd.com050
FOR THE YEAR ENDED 31 DECEMBER 2015

CASH FLOW STATEMENT
2015NoteAmounts in rupees 2014
AEZAZ HUSSAINChairman
ASIF PEERChief Executive
CASH FLOWS FROM OPERATING ACTIVITIES
Cash generated from operations 36
Finance cost paid
Taxes paid
Net cash flows from operating activities
CASH FLOWS FROM INVESTING ACTIVITIES
Purchase of property and equipment
Development expenditures
Sale proceeds from disposal of property and equipment
Investment in subsidiary
(Purchase) / disposal of short term investments
Profit received on short term investments
Decrease / (Increase) in long term deposits
Net cash (outflow) / inflow from investing activities
CASH FLOWS FROM FINANCING ACTIVITIES
Proceeds from issue of share capital
Initial Public Offer (IPO) related expenses
Proceeds from exercise of share options
Dividend paid
Increase in long term advances
Net cash (outflow) / inflow from financing activities
(Decrease) / Increase in cash and cash equivalents
Cash and cash equivalents at the beginning of the year
Cash and cash equivalents at the end of year 16
88,216,127
(2,121,044)
(27,005,173)
(29,126,217)
59,089,910
(229,936,881)
(23,281,560)
6,765,562
(49,000,000)
(525,000,000)
31,714,561
2,451,257
(786,287,061)
-
(20,515,030)
7,234,592
(100,618,979)
2,510,899
(111,388,518)
(838,585,669)
983,230,255
144,644,586
318,751,417
(3,985,590)
(30,761,689)
(34,747,279)
284,004,138
(79,953,402)
(33,102,870)
13,435,356
-
214,360,082
11,057,949
(6,237,924)
119,559,191
14,083,494
520,000,000
-
(96,609,391)
327,725
437,801,828
841,365,157
141,865,098
983,230,255
The annexed notes from 1 to 42 form an integral part of these financial statements.
STATEMENT OF CHANGES IN EQUITY
AEZAZ HUSSAINChairman
ASIF PEERChief Executive
Revenuereserve
Balance as on 01 January 2014
Total comprehensive income for the year
Transactions with owners
Exercise of options
100% Bonus issue of 43,582,651 ordinary shares of Rs.
10 each
Advance received during the year
Balance as on 31 December 2014
Total comprehensive income for the year
Transactions with owners
Issue of share capital
Exercise of options
Share based payments
10% Bonus issue of 10,061,898 ordinary shares of Rs.
10 each
Initial Public Offer (IPO) related expenses
Balance as at 31 December 2015
The annexed notes from 1 to 42 form an integral part of these financial statements.
Final dividend for the year ended 31 December
2014 at the rate of Rs. 1 per share
Final dividend for the year ended 31 December
2013 at the rate of Rs. 2.25 per share
Capital reserves
Issued,
subscribed
and paid up
share capital
429,375,070
-
6,451,440
435,826,510
-
442,277,950
-
871,653,020
-
130,000,000
4,536,760
100,618,980
-
-
235,155,740
1,106,808,760
Advance
against issue
of shares
(520,000,000)
(520,000,000)
-
-
-
-
-
-
520,000,000
520,000,000
-
-
-
-
-
-
Share capital
premium
31,487,730
-
7,632,054
-
-
7,632,054
-
39,119,784
-
390,000,000
2,697,832
-
(20,515,030)
-
372,182,802
411,302,586
Employee
compensation
reserve
9,251,100
9,251,100
4,367
-
-
-
-
-
-
4,367
-
-
-
-
-
-
9,255,467
Un-
appropriated
profit
822,700,174
426,719,580
-
(435,826,510)
(96,609,391)
(532,435,901)
-
716,983,853
452,514,730
-
-
(100,618,980)
-
(100,618,979)
(201,237,959)
968,260,624
Total
1,283,567,341
426,719,580
14,083,494
-
(96,609,391)
(82,525,897)
520,000,000
2,147,761,024
452,514,730
-
7,234,592
9,251,100
-
(20,515,030)
(100,618,979)
(104,648,317)
2,495,627,437
Amounts in rupees
Systems Limited | Annual Report 2015 053
www.systemsltd.com052
FOR THE YEAR ENDED 31 DECEMBER 2015 FOR THE YEAR ENDED 31 DECEMBER 2015

NOTES TO THE FINANCIAL STATEMENTS
1. LEGAL STATUS AND NATURE OF BUSINESS
2. STATEMENT OF COMPLIANCE
3. BASIS OF MEASUREMENT
The Company is a public limited Company incorporated in Pakistan under the Companies Ordinance 1984, and is listed on the Pakistan Stock Exchange (formerly Karachi, Islamabad and Lahore Stock Exchanges). The Company is principally engaged in the business of software development, trading of software and business process outsourcing services. The head office of the Company is situated at Chamber of Commerce building, 11- Shahra-e-Aiwan-e-Tijarat, Lahore.
These financial statements have been prepared in accordance with approved accounting standards as applicable in Pakistan and the requirements of Companies Ordinance, 1984. Approved accounting standards comprise of such International Financial Reporting Standards (IFRSs) issued by the International Accounting Standards Board and Islamic Financial Accounting Standards (IFAS) issued by the Institute of Chartered Accountants of Pakistan as are notified under the provisions of the Companies Ordinance, 1984. Wherever, the requirements of the Companies Ordinance, 1984 or directives issued by the Securities and Exchange Commission of Pakistan differ with the requirements of these standards, the requirements of Companies Ordinance, 1984 or the requirements of the said directives shall prevail.
3.1 Basis of preparation
These financial statements have been prepared under the historical cost convention except for short term investments which are stated at fair value.
3.2 Functional and presentation currency
Items included in the financial statements are measured using the currency of the primary economic environment in which the Company operates. The financial statements are presented in Pak Rupees, which is the Company’s functional and presentation currency. Figures have been rounded off to the nearest rupees unless otherwise stated.
3.3 Use of estimates and judgments
The Company's significant accounting policies are stated in Note 4. Not all of these significant policies require the management to make difficult, subjective or complex judgments or estimates. The following is intended to provide an understanding of the policies the management considers critical because of their complexity, judgment of estimation involved in their application and their impact on these financial statements. Estimates and judgments are continually evaluated and are based on historical experience, including expectation of future events that are believed to be reasonable under the circumstances. These judgments involve assumptions or estimates in respect of future events and the actual results may differ from these estimates. The areas involving higher degree of judgments or complexity or areas where assumptions and estimates are significant to the financial statements are as follows:
3.3.1 Provision for taxation
The Company takes into account the current income tax law and the decisions taken by appellate authorities. Instances where the Company's view differs from the view taken by the income tax department at the assessment stage and where the Company considers that its views on items of material nature are in accordance with law, the amounts are shown as contingent liabilities.
3.3.2 Useful life and residual values of property and equipment
The Company reviews the useful lives of property and equipment on a regular basis. Any change in estimates in future years might affect the carrying amounts of respective items of property and equipment with a corresponding effect on the depreciation charge and impairment.
3.3.3 Provision for doubtful debts
The Company regularly reviews its receivables for impairment, if any. The provision in this regard is made, based on management's estimate, where the prospects of recovery are doubtful.
3.3.4 Stage of completion
The Company determines stage of completion on the basis of services performed to date as a percentage of total services to be performed.
3.3.5 Provisions
A provision is recognized in the balance sheet when the Company has a legal or constructive obligation as a result of a past event, and it is probable that an outflow of economic benefits will be required to settle the obligation and a reliable estimate can be made of the amount of obligation. The amount recognized as a provision reflects the best estimate of the expenditure required to settle the present obligation at the end of the reporting period.
The significant accounting policies which have been adopted in the preparation of financial statements of the Company are consistent with previous year except as described in Note 4.1.
4.1 New, amended standards and interpretations which became effective
The Company has adopted the following accounting standard and the amendments and interpretation of IFRSs which became effective for the current year:
IFRS 10 – Consolidated Financial Statements
IFRS 11 – Joint Arrangements
IFRS 12 – Disclosure of Interests in Other Entities
IFRS 13 – Fair Value Measurement
IAS 19 – Employee Benefits – (Amendment) - Defined Benefit Plans: Employee Contributions
Improvements to Accounting Standards Issued by the IASB
IFRS 2 Share-based Payment - Definitions of vesting conditions
IFRS 3 Business Combinations – Accounting for contingent consideration in a business combination
IFRS 3 Business Combinations - Scope exceptions for joint ventures
IFRS 8 Operating Segments – Aggregation of operating segments
IFRS 8 Operating Segments - Reconciliation of the total of the reportable segments’ assets to the entity’s assets
IFRS 13 Fair Value Measurement - Scope of paragraph 52 (portfolio exception)
IAS16 Property, Plant and Equipment and IAS 38 Intangible Assets – Revaluation method – proportionate restatement of accumulated depreciation / amortization
IAS 24 Related Party Disclosures - Key management personnel
IAS 40 Investment Property - Interrelationship between IFRS 3 and IAS 40 (ancillary services)
The adoption of the above amendments, improvements to accounting standards and interpretations did not have any effect on the financial statements.
4.2 Taxation
4.2.1 Current
Provision for current tax is based on the taxable income for the year determined in accordance with the prevailing law for taxation of income. The charge for current tax is calculated using prevailing tax rates or tax rates expected to apply to the profit for the year, if enacted. The charge for current tax also includes adjustments, where considered necessary, to provision for taxation made in previous years arising from assessments framed during the year for such years.
4. SIGNIFICANT ACCOUNTING POLICIES
Systems Limited | Annual Report 2015 055
www.systemsltd.com054
FOR THE YEAR ENDED 31 DECEMBER 2015

4.2.2 Deferred
Deferred tax is accounted for using the balance sheet liability method in respect of all temporary differences arising from differences between the carrying amount of assets and liabilities in the financial statements and the corresponding tax bases used in the computation of the taxable profit. Deferred tax liabilities are generally recognized for all taxable temporary differences and deferred tax assets are recognized to the extent that it is probable that taxable profits will be available against which the deductible temporary differences, unused tax losses and tax credits can be utilized.
Deferred tax is calculated at the rates that are expected to apply to the year when the differences reverse based on tax rates that have been enacted or substantively enacted by the balance sheet date. Deferred tax is charged or credited in the profit and loss account, except in the case of items credited or charged to other comprehensive income in which case it is included in other comprehensive income.
4.3 Property and equipment
Property and equipment are stated at cost less accumulated depreciation and any identified impairment loss. Freehold land is stated at historic cost. Cost of operating fixed assets consist of purchase cost, borrowing cost pertaining to construction period and directly attributable cost of bringing the asset to working condition. Subsequent costs are included in the assets carrying amount or recognized as separate asset, as appropriate, only when it is probable that future economic benefits associated with the item will flow to the Company and the cost of the item can be measured reliably. All other repair and maintenance costs are charged to profit and loss account during the period in which they are incurred.
Depreciation on property, plant and equipment is charged to income by applying straight line method on pro rata basis so as to write off the historical cost of the assets over their estimated useful lives at the rates given in Note 5. Depreciation charge commences from the month in which the asset is available for use and continues until the month of disposal.
The assets residual values and useful lives are reviewed at each financial year end, and adjusted if impact on depreciation is significant.
An item of property and equipment is derecognized upon disposal or when no future economic benefits are expected from its use or disposal. Profit or loss on disposal of operating fixed assets represented by the difference between the sale proceeds and the carrying amount of the asset is included in income.
4.4 Capital work-in-progress
Capital work in progress represents expenditure on property and equipment which are in the course of construction and installation. Transfers are made to relevant property and equipment category as and when assets are available for use.
Capital work-in-progress is stated at cost less identified impairment loss, if any.
4.5 Intangible assets
Intangible assets acquired from the market are carried at cost less accumulated amortization and any impairment losses.
Expenditure on research (or the research phase of an internal project) is recognized as an expense in the period in which it is incurred;
Development costs incurred on specific projects are capitalized when all the following conditions are satisfied:
Completion of the intangible asset is technically feasible so that it will be available for use or sale.
The Company intends to complete the intangible asset and use or sell it.
The Company has the ability to use or sell the intangible asset.
Development costs not meeting the criteria for capitalization are expensed as incurred.
The cost of an internally generated intangible asset comprises all directly attributable costs necessary to create, produce and prepare the asset to be capable of operating in the manner intended by the management.
After initial recognition, internally generated intangible assets are carried at cost less accumulated amortization and impairment losses. These are amortized using straight line method at the rate given in note 6. Full month amortization on additions is charged in the month of acquisition and no amortization is charged in month of disposal.
The Company assesses at each balance sheet date whether there is any indication that intangible assets may be impaired. If such indication exists, the carrying amounts of such assets are reviewed to assess whether they are recorded in excess of their recoverable amount. Where carrying amounts exceed the respective recoverable amount, assets are written down to their recoverable amounts and the resulting impairment loss is recognized in profit and loss account. The recoverable amount is the higher of an asset’s fair value less costs to sell and value in use. Where an impairment loss is recognized, the amortization charge is adjusted in the future periods to allocate the asset’s revised carrying amount over its estimated useful life.
4.6 Impairment
4.6.1 Financial assets including receivables
Financial assets are assessed at each reporting date to determine whether there is objective evidence that they are impaired. A financial asset is impaired if objective evidence indicates that a loss event has occurred after the initial recognition of the asset and that the loss event had a negative effect on the estimated future cash flows of that asset that can be estimated reliably. Objective evidence that financial assets are impaired may include default or delinquency by a debtor indications that a debtor or issuer will enter bankruptcy. All individually significant receivables are assessed for specific impairment. All individually significant receivables found not to be specifically impaired are then collectively assessed for any impairment that has been incurred but not yet identified. Receivables that are not individually significant are collectively assessed for impairment by grouping together receivables with similar risk characteristics.
An impairment loss in respect of a financial asset measured at amortized cost is calculated as the difference between its carrying amount and the present value of the estimated future cash flows discounted at the asset's original effective interest rate. Losses are recognized in profit and loss and reflected in an allowance account against receivables.
4.6.2 Non financial assets
The carrying amounts of non-financial assets other than inventories and deferred tax asset, are reviewed at each reporting date to determine whether there is any indication of impairment. If any such indication exists, then the asset's recoverable amount is estimated. The recoverable amount of an asset or cash-generating unit is the greater of its value in use and its fair value less costs to sell. In assessing value in use, the estimated future cash flows are discounted to their present value using a pre-tax discount rate that reflects current market assessment of the time value of money and the risks specific to the asset. For the purpose of impairment testing, assets that cannot be tested individually are grouped together into the smallest group of assets that generates cash inflows from continuing use that are largely independent of the cash inflows of other assets or groups of assets (the “cash generating unit, or CGU”).
The Company's corporate assets do not generate separate cash inflows. If there is an indication that a corporate asset may be impaired, then the recoverable amount is determined for the CGU to which the corporate asset belongs. An impairment loss is recognized if the carrying amount of an asset or its CGU exceeds its estimated recoverable amount. Impairment losses are recognized in profit and loss account.
Impairment loss recognized in prior periods is assessed at each reporting date for any indications that the loss has decreased or no longer exists. An impairment loss is reversed if there has been a change in the estimates used to determine the recoverable amount. An impairment loss is reversed only to the extent that the asset's carrying amount does not exceed the carrying amount that would have been determined, net of depreciation or amortization, if no impairment loss had been recognized.
Systems Limited | Annual Report 2015 057
www.systemsltd.com056

4.7 Staff benefits
The Company has the following plans for its employees:
4.7.1 Provident fund
The Company operates a funded recognized provident fund contribution plan which covers all permanent employees. Equal contributions are made on monthly basis both by the Company and the employees at 10% of basic pay.
4.7.2 Employees' share option scheme
The Company operates an equity settled share based Employees Stock Option Scheme. The compensation committee of the Board evaluates the performance and other criteria of employees and approves the grant of options. These options vest with employees over a specified period subject to fulfillment of certain conditions. Upon vesting, employees are eligible to apply and secure allotment of Company's shares at a price determined on the date of grant of options.
The fair value of the grant of share options is measured at grant date and recognized as an employee compensation expense, with a corresponding increase in equity, on the straight line basis over the vesting period. The fair value of the options granted is measured at option discount i.e. excess of option price at date of grant of option under a scheme over exercise price of option.
When share options are exercised, the proceeds received, net of any transaction costs, are credited to share capital (nominal value) and share premium.
4.8 Investments
Management determines the classification of its investments at the time of purchase depending on the purpose for which the investments are acquired and re-evaluates this classification at the end of each financial year. Investments intended to be held for less than twelve months from the balance sheet date or to be sold to raise operating capital are included in current assets, all other investments are classified as non-current.
Investments are either classified as financial assets at fair value through profit or loss, held-to-maturity investments, available-for-sale investments or investment in subsidiary and associated companies, as appropriate. When investments are recognized initially, they are measured at fair value, plus, in case of investments not at fair value through profit or loss, directly attributable transaction cost.
4.8.1 Investments in equity instruments of subsidiaries and associates
Investments in subsidiaries and associates where the Company has significant influence are measured at cost in the Company’s separate financial statements.
The Company is required to issue consolidated financial statements along with its separate financial statements, in accordance with the requirements of IAS 27 ‘Consolidated and separate financial statements’. Investments in associates, in the consolidated financial statements, are being accounted for using the equity method.
4.8.2 Investments at fair value through profit or loss
Investments that are acquired principally for the purpose of generating profit from short term fluctuations in price are classified as investments at fair value through profit or loss. Investments at fair value through profit or loss are initially recognized at cost (excluding transaction cost), being the fair value of the consideration given. Subsequent to initial recognition they are recognized at fair value unless fair value cannot be reliably measured. Any surplus or deficit on revaluation of investment is recognized in the profit or loss account.
All purchases and sale of investments are recognized on trade date, which is the date the Company commits to purchase, or sell the investment.
4.8.3 Investments held to maturity
These are investments with fixed pre determinable payment and fixed maturity. The company has the positive intent and ability to hold till maturity. These are stated at amortized cost.
4.8.4 Foreign currency transactions
Assets and liabilities in foreign currencies are translated into Rupees at the rate of exchange prevailing at the balance sheet date. Transactions during the year are converted into Rupees at the exchange rate prevailing at the date of such transaction. All exchange differences are charged to profit and loss account.
4.9 Trade debts
Trade debts from local customers are stated at cost while foreign debtors are stated at revalued amount by applying exchange rate applicable on the balance sheet reporting date.
4.9.1 Provision for doubtful debts
The Company reviews its trade and other receivable on each balance sheet date to assess whether the provision should be recorded in the profit and loss account relating to doubtful receivable. Judgment by the management is made of the amount and timing of future cash flows while determining the extent of provision required. Such estimation involves the application of the Company's provision for doubtful debt policy including the assessment of credit history of the counter party. Actual cash flows may differ resulting in subsequent change in provisions.
4.10 Trade and other payables
Liabilities for trade and other accounts payable are carried at cost which is the fair value of the consideration to be paid in future for goods and services.
4.11 Provisions and contingencies
Provisions are recognized in the balance sheet when the Company has a legal or constructive obligation as a result of past events and it is probable that outflow of resources embodying economic benefits will be required to settle the obligation and a reliable estimate of the amount can be made. However, provisions are reviewed at each balance sheet date and adjusted to reflect current best estimate. Where outflow of resources embodying economic benefits is not probable, a contingent liability is disclosed, unless the possibility of outflow is remote.
4.12 Revenue recognition
4.12.1 Professional services
Revenue from professional / software services includes fixed price contracts and time and material contracts. Revenue from services performed under fixed price contracts is recognized in accordance with the percentage of completion method. Revenue from services performed under time and material contracts is recognized as services are provided.
4.12.2 License and license support services
Revenue from license contracts without major customization is recognized when the license agreement is signed, delivery of software has occurred, fee is fixed or determinable and collectability is probable. Revenue from license contracts with major modification, customization and development is recognized on percentage of completion method. Revenue from support services is recognized on time proportion basis.
4.12.3 Outsourcing services
Revenue from business process outsourcing services is recognized on completion of processing. Revenue from other outsourcing services is recognized as services are provided.
4.12.4 Consultancy
Revenue from provision of consultancy services is recognized as the work is performed.
4.12.5 Sale of third party software
Revenue from sale of third party software is recognized when delivery has occurred and invoices are raised to the customer.
Systems Limited | Annual Report 2015 059
www.systemsltd.com058

4.13 Other income
Profit on deposit account and gain on short term investments is recognized on accrual basis. Miscellaneous income is recognized on receipt basis.
4.14 Financial instruments
4.14.1 Financial assets
Significant financial assets include trade debts, advances, long term deposits and cash and bank balances. Finances and receivables from clients are stated at their nominal value as reduced by provision for doubtful finances and receivable, while other financial assets are stated at cost.
4.14.2 Financial liabilities
Financial liabilities are classified according to the substance of the contractual arrangements entered into. Significant financial liabilities include short term ijarah rentals, musharika and morabaha finances, salam finances, accrued markup, trade and other payables and dividends payable. Markup based financial liabilities are recorded at gross proceeds received. Other liabilities are stated at their nominal value.
4.14.3 Recognition and derecognition
All the financial assets and financial liabilities are recognized at the time when the Company becomes party to the contractual provisions of the instrument. Financial assets are derecognized when the Company looses control of the contractual rights that comprise the financial assets. Financial liabilities are derecognized when they are extinguished i.e. when the obligation specified in the contract is discharged, cancelled or expires. Any gain or loss on derecognition of the financial assets and financial liabilities is taken to income currently.
4.14.4 Offsetting of financial assets and liabilities
A financial asset and a financial liability is offset and the net amount is reported in the balance sheet if the Company has legal enforceable right to set off the recognized amount and intends either to settle on a net basis or to realize the assets and settle the liability simultaneously.
4.15 Finance cost
Finance cost is charged to profit and loss account in the year in which it is incurred.
4.16 Cash and cash equivalents
Cash and cash equivalents are stated in the balance sheet at cost. For the purpose of the Cash flow Statement, cash and cash equivalents comprise of cash in hand, cheques/demand draft in hand and deposits in the bank.
4.17 Operating lease
Leases where a significant portion of the risks and rewards of ownership are retained by the lessor are classified as operating leases. Payments made under operating leases (net of any incentives received from the lessor) are charged to profit on a straight-line basis over the lease term unless another systematic basis is representative of the time pattern of the Company’s benefit.
4.18 Dividends and appropriation reserves
Dividends distribution to Company's shareholders is recognized as a liability in the period in which dividends are approved by Company's shareholders.
4.19 Earnings per share
The Company presents basic and diluted earnings per share (EPS). Basic EPS is calculated by dividing the profit after tax attributable to ordinary shareholders of the Company by the weighted average number of ordinary shares outstanding during the period. Diluted EPS is determined by adjusting profit and loss attributable to ordinary shareholders and the weighted-average number of ordinary shares outstanding, adjusted for the facts of all diluted potential ordinary shares.
4.20 Segment reporting
Segment reporting is based on the operating (business) segments of the Company. An operating segment is a component of the Company that engages in business activities from which it may earn revenues and incur expenses, including revenues and expenses that relate to transactions with any of the Company’s other components. An operating segment’s operating results are reviewed regularly by the Chief Executive Officer (the CEO) to assess segment's performance, and for which discrete financial information is available. Segment results that are reported to the CEO include items directly attributable to a segment as well as those that can be allocated on a reasonable basis. Unallocated items comprise mainly other operating expenditures, other income, finance cost, corporate assets, income tax assets and liabilities. Segment capital expenditure is the total cost incurred during the year to acquire property and equipment.
4.21 Standards, Interpretations and Amendments to Published Approved Accounting Standards that are not yet effective
The following standards, amendments and interpretations with respect to the approved accounting standards as applicable in Pakistan would be effective from the dates mentioned below against the respective standard or interpretation:
Effective Date(Annual periods
beginning on or after)
Standard or Interpretation
01 January 2016
01 January 2016
01 January 2016
01 January 2016
01 January 2016
01 January 2016
01 January 2016
IFRS 10 Consolidated Financial Statements, IFRS 12 Disclosure of Interests in Other Entities and IAS 27 Separate Financial Statements – Investment Entities: Applying the Consolidation Exception (Amendment)
IFRS 10 Consolidated Financial Statements and IAS 28 Investment in Associates and Joint Ventures - Sale or Contribution of Assets between an Investor and its Associate or Joint Venture (Amendment)
IFRS 11 Joint Arrangements - Accounting for Acquisition of Interest in Joint Operation (Amendment)
IAS 1 – Presentation of Financial Statements - Disclosure Initiative (Amendment)
IAS 16 Property, Plant and Equipment and IAS 38 intangible assets - Clarification of Acceptable Method of Depreciation and Amortization (Amendment)
IAS 16 Property, Plant and Equipment IAS 41 Agriculture - Agriculture: Bearer Plants (Amendment)
IAS 27 – Separate Financial Statements – Equity Method in Separate Financial Statements (Amendment)
In addition to the above, the following new standards have been issued by IASB which are yet to be notified by the SECP for the purpose of applicability in Pakistan:
IFRS 9 -Financial Instruments: Classification and Measurement
IFRS 14 - Regulatory Deferral Accounts
IFRS 15 -Revenue from Contracts with Customers
IFRS 16 – Leases
IASB effective date(Annual periods
beginning on or after)
Standard
01 January 2018
01 January 2016
01 January 2018
01 January 2019
Systems Limited | Annual Report 2015 061
www.systemsltd.com060

Land - free hold
Computers
Computer equipment and installations
Other equipment and installations
Generator
Furniture and fittings
Office equipment
Vehicles
Project assets
Mobile sets
Land - free hold
Computers
Computers equipment and installations
Other equipment and installations
Generator
Furniture and fittings
Office equipment
Vehicles
Project assets
Mobile sets
2015
DESCRIPTION
2014
DESCRIPTION
Cost Depreciation
Cost Depreciation
Amounts in rupees Amounts in rupees
Amounts in rupees Amounts in rupees
-
33
33
20
20
20
20
25
Project life
33
-
33
33
20
20
20
20
25
Project life
33
Depreciation
rate
(% per
annum)
Depreciation
rate
(% per
annum)
Net book value
as at 31
December
Net book value
as at 31
December
Accumulated
depreciation
as at 31
December
Accumulated
depreciation
as at 31
December
Disposals
-
939,976
-
-
-
-
-
4,652,819
20,007
-
5,612,802
Disposal
Accumulated
depreciation
as at 01
January
-
103,236,461
22,684,931
15,471,625
9,912,696
39,346,967
6,680,717
14,288,023
4,086,293
1,048,272
216,755,985
Accumulated
depreciation
as at 01
January
Cost
as at 31
December
Cost
as at 31
December
53,030,412
207,715,636
37,714,877
24,762,378
19,822,922
53,662,407
12,403,051
53,098,044
7,532,119
40,990,412
55,706,701
8,186,332
6,479,426
7,476,766
10,872,769
4,779,124
25,846,855
446,433
1,609,057
162,393,875
4,518,455
474,260,301
Disposals
-
939,985
-
-
-
-
-
6,728,562
20,007
-
161,650
-
-
-
-
-
5,082,267
-
12,100
5,256,017
-
103,236,461
22,684,931
15,471,625
9,912,696
39,346,967
6,680,717
14,288,023
4,086,293
1,048,272
216,755,985
-
7,688,554
Disposals
12,040,000
49,712,459
6,843,614
2,811,327
2,433,460
3,442,671
943,210
19,691,728
3,019,400
-
75,827,964
18,748,359
12,777,065
8,541,795
35,051,760
5,213,469
10,231,871
3,712,084
440,798
170,545,165
1,861,126
102,798,995
-
40,014,107
7,963,431
2,319,145
4,976,993
3,135,032
1,634,529
13,788,587
795,200
1,184,470
75,811,494
Additions
Additions
Cost
as at 01
January
40,990,412
158,943,162
30,871,263
21,951,051
17,389,462
50,219,736
11,459,841
40,134,878
4,532,726
-
422,500
-
75,600
-
-
-
12,708,316
-
40,000
13,246,416
40,990,412
158,943,162
30,871,263
21,951,051
17,389,462
50,219,736
11,459,841
40,134,878
4,532,726
2,657,329
379,149,860
2,657,329
379,149,860
Cost
as at 01
January
40,990,412
119,351,555
22,907,832
19,707,506
12,412,469
47,084,704
9,825,312
39,054,607
3,737,526
1,512,859
316,584,782
-
38,903,747
4,587,936
3,189,831
2,391,745
5,524,640
1,790,831
10,553,754
2,656,742
1,122,805
70,722,031
-
27,570,147
3,936,572
2,694,560
1,370,901
4,295,207
1,467,248
9,138,419
374,209
619,574
51,466,837
5. PROPERTY AND EQUIPMENT
Operating fixed assets
Capital work in progress
5.1 192,395,087 162,393,875
5.2 166,809,825 39,671,939
359,204,912 202,065,814
2015NoteAmounts in rupees 2014
5.1 Operating fixed assets
-
141,200,232
27,272,867
18,661,456
12,304,441
44,871,607
8,471,548
20,188,958
6,723,028
2,171,077
281,865,214
53,030,412
66,515,404
10,442,010
6,100,922
7,518,481
8,790,800
3,931,503
32,909,086
809,091
2,347,378
192,395,087
5.1.1 The cost of owned assets include assets amounting to Rs. 281.87 (2014: 151.68 ) million with nil
book value.
5.2 Capital work in progress
Advance to supplier 7,466,611
23,295,538
Land improvements 4,791,256
4,316,890
Building - freehold 154,551,958
12,059,511
5.2.1 166,809,825 39,671,939
5.2.1 This represents in progress construction of the Company's new office building.
5.2.2 The following is the movement in capital work-in-progress during the year:
2015NoteAmounts in rupees 2014
Depreciation
charge
Depreciation
charge
Vehicles
Toyota Corolla
Suzuki Cultus
Toyota Corolla
Suzuki Cultus
Suzuki Swift
Suzuki Swift
Other
Miscellaneous
2015
Vehicles
Honda Civic
Toyota Corolla
Honda City
Honda City
Suzuki Cultus
Toyota Corolla
Suzuki Cultus
Honda City
Suzuki Cultus
Suzuki Mehran
Other
Miscellaneous
Mode of
disposal
Company Policy
Company Policy
Company Policy
Company Policy
Company Policy
Company Policy
Negotiation
Company Policy
Company Policy
Company Policy
Company Policy
Company Policy
Company Policy
Company Policy
Company Policy
Company Policy
Company Policy
Negotiation
Muhammad Zahid Hussain
Particulars
of buyer
Mushtaq Patni
Laique Ahmed
Syed Aamir Turab Gillani
Adeel Edhi
Rauf Ahmed
Syed Umer Javed
Various
Asharaf Kapadia
Kashif Krimi
Usman Asif
Wali Muhammad Qadri
Tariq Gill
Muhammad Nasar Sabih
Warood Choudhry
Nadeem Yusuf
Adnan Yaqoob
Various
2014
Accumulated
depreciation
1,312,537
872,885
1,148,505
548,058
416,667
354,167
4,652,819
959,983
5,612,802
780,513
970,452
793,302
161,119
236,972
163,527
669,533
125,000
736,386
445,463
5,082,267
173,750
5,256,017
Written
down value
-
-
382,835
463,742
583,333
645,833
2,075,743
9
2,075,752
1,714,908
635,813
793,302
1,385,621
797,089
846,598
334,767
875,000
125,724
117,227
7,626,049
364,350
7,990,399
Sale
proceeds
1,312,537
872,885
1,531,340
1,011,800
1,000,000
1,000,000
6,728,562
37,000
6,765,562
2,495,421
1,606,265
1,586,604
1,546,740
1,034,061
1,010,125
1,004,300
1,000,000
862,110
562,690
12,708,316
727,040
13,435,356
Particulars
1,312,537
872,885
1,531,340
1,011,800
1,000,000
1,000,000
6,728,562
959,992
7,688,554
2,495,421
1,606,265
1,586,604
1,546,740
1,034,061
1,010,125
1,004,300
1,000,000
862,110
562,690
12,708,316
538,100
13,246,416
Cost
1,312,537
872,885
1,148,505
548,058
416,667
354,167
4,652,819
36,991
4,689,810
780,513
970,452
793,302
161,119
236,972
163,527
669,533
125,000
736,386
445,463
5,082,267
362,690
5,444,957
Profit
Amounts in rupees
Amounts in rupees
Mode of
disposal
Particulars
of buyer
Accumulated
depreciation
Written
down value
Sale
proceedsParticulars Cost Profit
Balance at the beginning of the year 39,671,939 35,530,031
Additions during the year 127,137,886 4,141,908
Balance at the end of the year 166,809,825 39,671,939
5.3 Depreciation charge for the year hasbeen allocated as follows:
Cost of sales 24 55,763,630 41,106,178
Distribution cost 25 2,108,947
1,135,128
Administrative expenses 26 11,843,419
9,104,230
Research and development expenses 27 1,006,035 121,301
70,722,031 51,466,837
2015NoteAmounts in rupees 2014
5.4 Disposal of property and equipment
Systems Limited | Annual Report 2015 063
www.systemsltd.com062

Land - free hold
Computers
Computer equipment and installations
Other equipment and installations
Generator
Furniture and fittings
Office equipment
Vehicles
Project assets
Mobile sets
Land - free hold
Computers
Computers equipment and installations
Other equipment and installations
Generator
Furniture and fittings
Office equipment
Vehicles
Project assets
Mobile sets
2015
DESCRIPTION
2014
DESCRIPTION
Cost Depreciation
Cost Depreciation
Amounts in rupees Amounts in rupees
Amounts in rupees Amounts in rupees
-
33
33
20
20
20
20
25
Project life
33
-
33
33
20
20
20
20
25
Project life
33
Depreciation
rate
(% per
annum)
Depreciation
rate
(% per
annum)
Net book value
as at 31
December
Net book value
as at 31
December
Accumulated
depreciation
as at 31
December
Accumulated
depreciation
as at 31
December
Disposals
-
939,976
-
-
-
-
-
4,652,819
20,007
-
5,612,802
Disposal
Accumulated
depreciation
as at 01
January
-
103,236,461
22,684,931
15,471,625
9,912,696
39,346,967
6,680,717
14,288,023
4,086,293
1,048,272
216,755,985
Accumulated
depreciation
as at 01
January
Cost
as at 31
December
Cost
as at 31
December
53,030,412
207,715,636
37,714,877
24,762,378
19,822,922
53,662,407
12,403,051
53,098,044
7,532,119
40,990,412
55,706,701
8,186,332
6,479,426
7,476,766
10,872,769
4,779,124
25,846,855
446,433
1,609,057
162,393,875
4,518,455
474,260,301
Disposals
-
939,985
-
-
-
-
-
6,728,562
20,007
-
161,650
-
-
-
-
-
5,082,267
-
12,100
5,256,017
-
103,236,461
22,684,931
15,471,625
9,912,696
39,346,967
6,680,717
14,288,023
4,086,293
1,048,272
216,755,985
-
7,688,554
Disposals
12,040,000
49,712,459
6,843,614
2,811,327
2,433,460
3,442,671
943,210
19,691,728
3,019,400
-
75,827,964
18,748,359
12,777,065
8,541,795
35,051,760
5,213,469
10,231,871
3,712,084
440,798
170,545,165
1,861,126
102,798,995
-
40,014,107
7,963,431
2,319,145
4,976,993
3,135,032
1,634,529
13,788,587
795,200
1,184,470
75,811,494
Additions
Additions
Cost
as at 01
January
40,990,412
158,943,162
30,871,263
21,951,051
17,389,462
50,219,736
11,459,841
40,134,878
4,532,726
-
422,500
-
75,600
-
-
-
12,708,316
-
40,000
13,246,416
40,990,412
158,943,162
30,871,263
21,951,051
17,389,462
50,219,736
11,459,841
40,134,878
4,532,726
2,657,329
379,149,860
2,657,329
379,149,860
Cost
as at 01
January
40,990,412
119,351,555
22,907,832
19,707,506
12,412,469
47,084,704
9,825,312
39,054,607
3,737,526
1,512,859
316,584,782
-
38,903,747
4,587,936
3,189,831
2,391,745
5,524,640
1,790,831
10,553,754
2,656,742
1,122,805
70,722,031
-
27,570,147
3,936,572
2,694,560
1,370,901
4,295,207
1,467,248
9,138,419
374,209
619,574
51,466,837
5. PROPERTY AND EQUIPMENT
Operating fixed assets
Capital work in progress
5.1 192,395,087 162,393,875
5.2 166,809,825 39,671,939
359,204,912 202,065,814
2015NoteAmounts in rupees 2014
5.1 Operating fixed assets
-
141,200,232
27,272,867
18,661,456
12,304,441
44,871,607
8,471,548
20,188,958
6,723,028
2,171,077
281,865,214
53,030,412
66,515,404
10,442,010
6,100,922
7,518,481
8,790,800
3,931,503
32,909,086
809,091
2,347,378
192,395,087
5.1.1 The cost of owned assets include assets amounting to Rs. 281.87 (2014: 151.68 ) million with nil
book value.
5.2 Capital work in progress
Advance to supplier 7,466,611
23,295,538
Land improvements 4,791,256
4,316,890
Building - freehold 154,551,958
12,059,511
5.2.1 166,809,825 39,671,939
5.2.1 This represents in progress construction of the Company's new office building.
5.2.2 The following is the movement in capital work-in-progress during the year:
2015NoteAmounts in rupees 2014
Depreciation
charge
Depreciation
charge
Vehicles
Toyota Corolla
Suzuki Cultus
Toyota Corolla
Suzuki Cultus
Suzuki Swift
Suzuki Swift
Other
Miscellaneous
2015
Vehicles
Honda Civic
Toyota Corolla
Honda City
Honda City
Suzuki Cultus
Toyota Corolla
Suzuki Cultus
Honda City
Suzuki Cultus
Suzuki Mehran
Other
Miscellaneous
Mode of
disposal
Company Policy
Company Policy
Company Policy
Company Policy
Company Policy
Company Policy
Negotiation
Company Policy
Company Policy
Company Policy
Company Policy
Company Policy
Company Policy
Company Policy
Company Policy
Company Policy
Company Policy
Negotiation
Muhammad Zahid Hussain
Particulars
of buyer
Mushtaq Patni
Laique Ahmed
Syed Aamir Turab Gillani
Adeel Edhi
Rauf Ahmed
Syed Umer Javed
Various
Asharaf Kapadia
Kashif Krimi
Usman Asif
Wali Muhammad Qadri
Tariq Gill
Muhammad Nasar Sabih
Warood Choudhry
Nadeem Yusuf
Adnan Yaqoob
Various
2014
Accumulated
depreciation
1,312,537
872,885
1,148,505
548,058
416,667
354,167
4,652,819
959,983
5,612,802
780,513
970,452
793,302
161,119
236,972
163,527
669,533
125,000
736,386
445,463
5,082,267
173,750
5,256,017
Written
down value
-
-
382,835
463,742
583,333
645,833
2,075,743
9
2,075,752
1,714,908
635,813
793,302
1,385,621
797,089
846,598
334,767
875,000
125,724
117,227
7,626,049
364,350
7,990,399
Sale
proceeds
1,312,537
872,885
1,531,340
1,011,800
1,000,000
1,000,000
6,728,562
37,000
6,765,562
2,495,421
1,606,265
1,586,604
1,546,740
1,034,061
1,010,125
1,004,300
1,000,000
862,110
562,690
12,708,316
727,040
13,435,356
Particulars
1,312,537
872,885
1,531,340
1,011,800
1,000,000
1,000,000
6,728,562
959,992
7,688,554
2,495,421
1,606,265
1,586,604
1,546,740
1,034,061
1,010,125
1,004,300
1,000,000
862,110
562,690
12,708,316
538,100
13,246,416
Cost
1,312,537
872,885
1,148,505
548,058
416,667
354,167
4,652,819
36,991
4,689,810
780,513
970,452
793,302
161,119
236,972
163,527
669,533
125,000
736,386
445,463
5,082,267
362,690
5,444,957
Profit
Amounts in rupees
Amounts in rupees
Mode of
disposal
Particulars
of buyer
Accumulated
depreciation
Written
down value
Sale
proceedsParticulars Cost Profit
Balance at the beginning of the year 39,671,939 35,530,031
Additions during the year 127,137,886 4,141,908
Balance at the end of the year 166,809,825 39,671,939
5.3 Depreciation charge for the year hasbeen allocated as follows:
Cost of sales 24 55,763,630 41,106,178
Distribution cost 25 2,108,947
1,135,128
Administrative expenses 26 11,843,419
9,104,230
Research and development expenses 27 1,006,035 121,301
70,722,031 51,466,837
2015NoteAmounts in rupees 2014
5.4 Disposal of property and equipment
Systems Limited | Annual Report 2015 063
www.systemsltd.com062

6.3 Amortization charge for the period has beenallocated as follows:
Cost of sales 24 12,732,828 6,707,439
Distribution cost 25 239,289
94,367
Administrative expenses 26 1,889,566
982,874
Research and development expenses 27 274,310
23,410 15,135,993
7,808,090
Accumulated Amortization Accumulated Book value
Amortization as charge Amortization as as at
at 1 January for the period at 31 December 31 December
Computer software 53,289,042
23,281,560
4,462,849
72,107,753
19,187,091
15,135,993
4,462,849 29,860,235 42,247,518 30%
Computer software 20,186,172 33,102,870 - 53,289,042 11,379,001 7,808,090 - 19,187,091 34,101,951 30%
Particulars
2015
RateAdditions
Cost as at
31
December
Cost as at 1
JanuaryDisposals Disposals
Amounts in rupees
Accumulated Amortization Accumulated Book value
Amortization as charge Amortization as as at
at 1 January for the period at 31 December 31 December
Particulars
2014
RateAdditions
Cost as at
31
December
Cost as at 1
JanuaryDisposals Disposals
Amounts in rupees
6. INTANGIBLES
6.1 The cost of the intangibles include intangible assets amounting to Rs. 9.98 million (2014: 5.34 million) with nil book value.
6.2 Additions include in-house developed intangibles amounting to Rs. 20.97 (2014: 26.05) million capitalized during the current year.
2015NoteAmounts in rupees 2014
7. LONG TERM INVESTMENTS
Investment in subsidiaries - at cost - unquoted
E Processing Systems (Private) Limited. 7.1 49,700,030
700,030
TechVista Systems FZ- LLC 7.2 1,377,950
1,377,950
51,077,980
2,077,980
7.1 This represents 70% share in Company's subsidiary E Processing Systems (Private) Limited, a company engaged in the business of purchase and sale of airtime and software development including the development of systems and infrastructure in Pakistan. The subsidiary was incorporated on 06 Feb 2013. The share capital has been fully acquired in cash.
During the year, Company has acquired 70,000 additional shares of E Processing Systems (Private) Limited at the rate of Rs. 700 per share with a premium of Rs. 690 per share.
7.2 This represents 100% share in Company's subsidiary, TechVista Systems FZ- LLC, a company set up in Dubai Technology and Media Free Zone Authority engaged in providing a host of services including enterprise application integration and software development and has been registered as a limited liability company on 03 April 2013.
8. DEFERRED TAXATION
Taxable temporary differences
Depreciation on property and equipment
Amortization on intangibles
Deductible temporary differences
Depreciation on property and equipment
Amortization on intangibles
Provision for doubtful debts
Minimum tax
Deferred tax asset
77,048
1,054,043
1,131,091
-
-
826,471
1,114,130
1,940,601
809,510
-
-
-
810,308
228,485
444,431
-
1,483,224
1,483,224
10. TRADE DEBTS
Considered good - unsecured
Export 10.1
Local
Considered doubtful - unsecured
Local
Less: Provision for doubtful debts 10.2
814,509,381
282,287,311 1,096,796,692
11,971,419
(11,971,419)
- 1,096,796,692
671,031,948 146,251,475
817,283,423
5,719,683
(5,719,683)
-
817,283,423
2015Amounts in rupees 2014
9. UNBILLED REVENUE
This represents work performed but not billed to the client. Revenue against this has been recognized on the basis of percentage of work done in accordance with IAS-18 "Revenue".
2015NoteAmounts in rupees 2014
10.1 This includes receivable against sale of services from Visionet Systems Incorporation and Techvista Systems FZ - LLC amounting to Rs. 552.76 (2014: 496.26) million and Rs. 222.79 (2014: Rs. 99.31) million respectively.
Systems Limited | Annual Report 2015 065
www.systemsltd.com064

10.2 Balance as at 01 January
Provision made during the year
Less: provision reversed during the year
Net charge for the year 29
Less:
Bad debts written off
Balance as at 31 December
5,719,683
11,971,419
(5,045,000)
6,926,419
(674,683)
11,971,419
8,948,300
1,143,961
-
1,143,961
(4,372,578)
5,719,683
10.3 Aging analysis of the amounts due from related parties is as follows:
Not past due
Past due but not impaired:
- Not more than three months
- More than three months but
not more than six months
- More than six months
Visionet
Systems
Incorporatio
n - USA
494,968,822
57,796,623
-
- 552,765,445
Tech Vista
Systems FZ-
LLC - UAE
64,538,484
-
47,806,756
110,447,683 222,792,923
115,695,106
194,438,234
185,060,656
-
495,193,996
Visionet
Systems
Incorporation -
USA
Tech Vista
Systems FZ-LLC
- UAE
2,759,402
10,598,568
31,452,165
54,497,458
99,307,593
11. ADVANCES - considered good
Advances to staff:
against salary 4,958,554 1,782,142 against expenses 26,179,629 16,443,332
11.1 31,138,183
18,225,474
Advances to suppliers 36,917,427
7,043,902
68,055,610
25,269,376
11.1 It includes advances to executives amounting to Rs. 20.13 (2014: Rs. 13.77) million.
2015 2014
2015NoteAmounts in rupees 2014
Amounts in rupees
2015NoteAmounts in rupees 2014
12. TRADE DEPOSITS AND SHORT TERM PREPAYMENTS
Security deposits 41,176,013
25,961,122
Prepayments 12.1 6,925,572
24,575,779
48,101,585 50,536,901
2015NoteAmounts in rupees 2014
12.1 This includes prepaid IPO expenditures of Rs. Nil (2014: 18.48) million which mainly includes listing fees of Pakistan Stock Exchange (formerly Karachi, Lahore and Islamabad stock exchange), underwriting commission and consulting fees.
13. RECEIVABLE FROM RELATED PARTIES
Considered good - unsecured
Visionet Systems Incorporation - USA 13.1 11,536,311
2,150,066
E - Processing Systems (Private) Limited 13.2 21,605,358
40,036,747
Tech Vista FZ LLC - UAE 13.3 131,431,187
5,541,940
164,572,856 47,728,753
14. TAX REFUNDS DUE FROM GOVERNMENT
Balance as at 01 January
Income tax paid during the year
Provision for the year 31
Balance as at 31 December
27,467,230
39,994,036
(12,317,310)
55,143,956
3,465,939
30,761,689
(6,760,398)
27,467,230
2015NoteAmounts in rupees 2014
13.1 This represents amount receivable against expenses incurred on behalf of Visionet Systems Incorporation and are payable on demand by the related party. These receivables are unsecured and interest free.
13.2 This represents amount receivable against expenses incurred on behalf of E-Processing (Private) Limited and are payable on demand by the related party. These receivables are unsecured and are subject to interest at the rate of 9% (2014:12%) on the outstanding balance at the end of each month.
13.3 This represents amount receivable against expenses incurred on behalf of Techvista Systems FZ - LLC and are payable on demand by the related party. These receivables are unsecured and interest free.
2015NoteAmounts in rupees 2014
Systems Limited | Annual Report 2015 067
www.systemsltd.com066

2015NoteAmounts in rupees 2014
15. SHORT TERM INVESTMENTS
Held to maturity
Habib Metropolitan Bank
Faysal Bank Limited
Bank Alfalah Limited
Mezan Bank limited
15.1
Investment at fair value through profit and loss
NAFA Fund units 275,938 (2014: 269,871)
Add: Unrealized gain on investments at
fair value through profit and loss
300,000,000
50,000,000
25,000,000
150,000,000
525,000,000
30,204,644
2,594,754
32,799,398
557,799,398
-
-
-
-
-
27,290,414
2,914,230
30,204,644
30,204,644
16. CASH AND BANK BALANCES
Cash in hand
Cash at bank:
Local currency:
Current accounts 16.1
Saving accounts 16.2
Foreign currency
89,503
32,823,929
110,981,590
143,805,519
749,564
144,644,586
38,861
699,070,911
283,401,017
982,471,928
719,466
983,230,255
15.1 These are Term Deposit Receipts (TDRs) carrying markup at rates ranging from 6% to 8.75% (2014: 7% to 8.50% ) per annum.
2015NoteAmounts in rupees 2014
16.1 This includes amount of subscription money aggregating to Rs. Nil (2014: 687.63) million received from high net worth individuals, institutional investors and general public against the shares offered through IPO out of which Rs. 167.63 (2014: Nil) million have been refunded to unsuccessful applicants during the year.
16.2 These carry markup at the rate of 6.5% to 8.5% (2014: 7.5% to 9.5%) per annum. Moreover, these include Rs. Nil (2014: 184.99) million in KASB Bank which the Company is unable to withdraw due to imposition of moratorium by Federal Government on application of State Bank of Pakistan for a period of six months effective from 17 November 2014.
17. ISSUED, SUBSCRIBED AND PAID-UP CAPITAL
218,293,110
83,756,350
888,515,650
787,896,670
1,106,808,760
871,653,020
17.1 Reconciliation of ordinary shares
87,165,302
13,000,000
453,676
10,061,898
110,680,876
42,937,507
-
645,144
43,582,651
87,165,302
871,653,020
130,000,000
4,536,760
100,618,980
1,106,808,760
429,375,070
-
6,451,440
435,826,510
871,653,020
18. RESERVES - capital
Share premium reserve 18.1 411,302,586 39,119,784
Deferred employee compensation reserve 18.2 9,255,467 4,367
420,558,053 39,124,151
Ordinary shares of Rs. 10/-
fully paid in cash
Ordinary shares of Rs. 10/-
each fully paid up as bonus
shares
Shares issued through Initial
Public Offering
Bonus shares issued during
the year
Balance at 31 December
Stock options exercised
Balance at 1 January
2015 2014
Amounts in rupees
21,829,311
8,375,635
88,851,565
78,789,667
110,680,876
87,165,302
2015 2014
Number of shares
2015 2014
Amounts in rupees
2015 2014
Number of shares
2015NoteAmounts in rupees 2014
18.1 This reserve shall be utilized only for the purpose as specified in section 83(2) of the Companies Ordinance, 1984.
18.2 This represents balance amount after exercise of share options by the employees under the Employee Stock Option Scheme approved by SECP. According to the scheme, 100% options become exercisable after completion of vesting period from date of grant. The options have a vesting period of 2 years and an exercise period of 3 years from the date the option is vested.
18.3 The following table illustrates the number and weighted average exercise prices of, and movements in, share options during the year:
Systems Limited | Annual Report 2015 069
www.systemsltd.com068
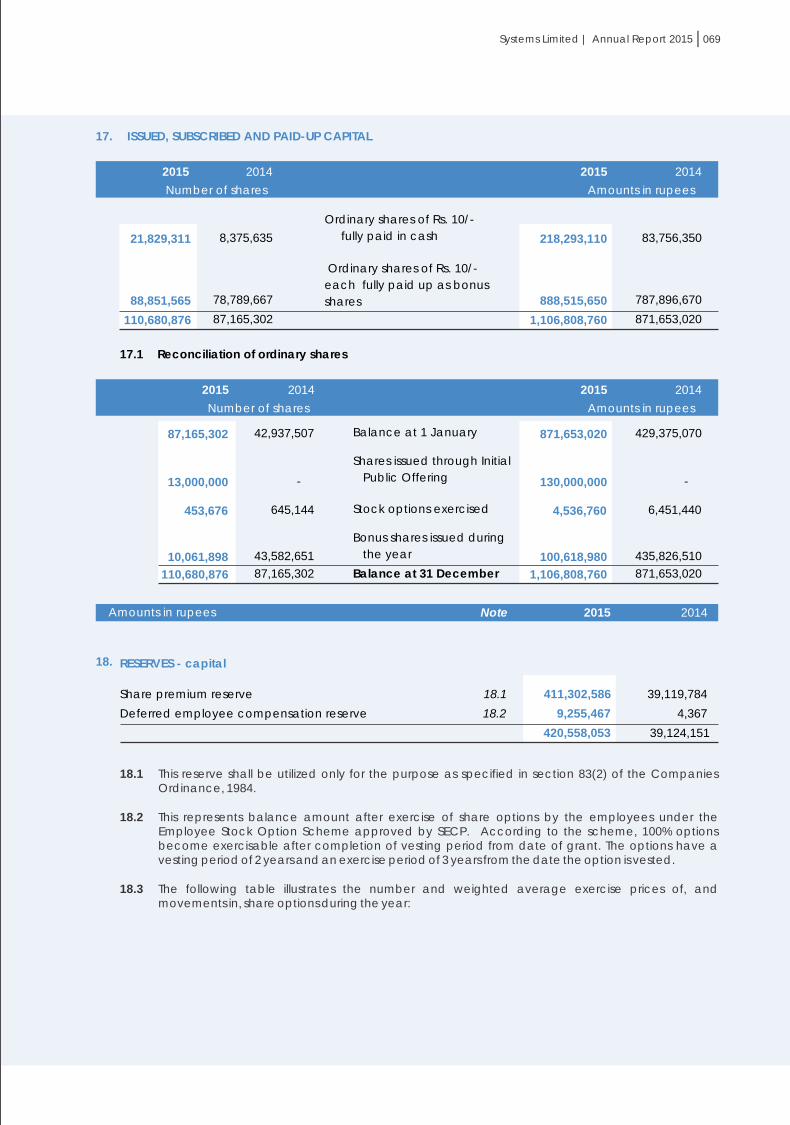
2015NoteAmounts in rupees 2014
15. SHORT TERM INVESTMENTS
Held to maturity
Habib Metropolitan Bank
Faysal Bank Limited
Bank Alfalah Limited
Mezan Bank limited
15.1
Investment at fair value through profit and loss
NAFA Fund units 275,938 (2014: 269,871)
Add: Unrealized gain on investments at
fair value through profit and loss
300,000,000
50,000,000
25,000,000
150,000,000
525,000,000
30,204,644
2,594,754
32,799,398
557,799,398
-
-
-
-
-
27,290,414
2,914,230
30,204,644
30,204,644
16. CASH AND BANK BALANCES
Cash in hand
Cash at bank:
Local currency:
Current accounts 16.1
Saving accounts 16.2
Foreign currency
89,503
32,823,929
110,981,590
143,805,519
749,564
144,644,586
38,861
699,070,911
283,401,017
982,471,928
719,466
983,230,255
15.1 These are Term Deposit Receipts (TDRs) carrying markup at rates ranging from 6% to 8.75% (2014: 7% to 8.50% ) per annum.
2015NoteAmounts in rupees 2014
16.1 This includes amount of subscription money aggregating to Rs. Nil (2014: 687.63) million received from high net worth individuals, institutional investors and general public against the shares offered through IPO out of which Rs. 167.63 (2014: Nil) million have been refunded to unsuccessful applicants during the year.
16.2 These carry markup at the rate of 6.5% to 8.5% (2014: 7.5% to 9.5%) per annum. Moreover, these include Rs. Nil (2014: 184.99) million in KASB Bank which the Company is unable to withdraw due to imposition of moratorium by Federal Government on application of State Bank of Pakistan for a period of six months effective from 17 November 2014.
17. ISSUED, SUBSCRIBED AND PAID-UP CAPITAL
218,293,110
83,756,350
888,515,650
787,896,670
1,106,808,760
871,653,020
17.1 Reconciliation of ordinary shares
87,165,302
13,000,000
453,676
10,061,898
110,680,876
42,937,507
-
645,144
43,582,651
87,165,302
871,653,020
130,000,000
4,536,760
100,618,980
1,106,808,760
429,375,070
-
6,451,440
435,826,510
871,653,020
18. RESERVES - capital
Share premium reserve 18.1 411,302,586 39,119,784
Deferred employee compensation reserve 18.2 9,255,467 4,367
420,558,053 39,124,151
Ordinary shares of Rs. 10/-
fully paid in cash
Ordinary shares of Rs. 10/-
each fully paid up as bonus
shares
Shares issued through Initial
Public Offering
Bonus shares issued during
the year
Balance at 31 December
Stock options exercised
Balance at 1 January
2015 2014
Amounts in rupees
21,829,311
8,375,635
88,851,565
78,789,667
110,680,876
87,165,302
2015 2014
Number of shares
2015 2014
Amounts in rupees
2015 2014
Number of shares
2015NoteAmounts in rupees 2014
18.1 This reserve shall be utilized only for the purpose as specified in section 83(2) of the Companies Ordinance, 1984.
18.2 This represents balance amount after exercise of share options by the employees under the Employee Stock Option Scheme approved by SECP. According to the scheme, 100% options become exercisable after completion of vesting period from date of grant. The options have a vesting period of 2 years and an exercise period of 3 years from the date the option is vested.
18.3 The following table illustrates the number and weighted average exercise prices of, and movements in, share options during the year:
Systems Limited | Annual Report 2015 069
www.systemsltd.com068

Outstanding at 1 January
Granted during the year
Exercised during the year
Outstanding at 31 December
Weighted
average
exercise
price
Number of
options
Number of
options
Rupees Number Number
25.59 884,561 1,098,820
25.45 811,500 430,885
15.95 (453,676) (645,144)
23.50 1,242,385 884,561
20142015
Weighted
average
exerciseprice
Rupees
21.83
40.83
21.83
25.59
Amounts in rupees
19. LONG TERM ADVANCES
This represents advances received from staff and will be adjusted as per Company's car policy against sale of vehicles.
20. TRADE AND OTHER PAYABLES
Creditors
Advance from customers
Accrued liabilities
Provision for Worker's Welfare Fund (WWF) 22.3
Payable to unsuccessful applicants - IPO
Provident fund payable
Withholding income tax payable
Sales tax payable
38,902,972
19,484,724
124,930,336
17,930,514
-
11,607,008
7,203,746
16,982,767
237,042,067
13,085,865
24,266,750
28,137,009
17,930,514
167,628,000
7,200,376
485,923
10,711,727
269,446,164
2015NoteAmounts in rupees 2014
21. UNEARNED REVENUE
22. CONTINGENCIES AND COMMITMENTS
Commitments
Contingencies
It represents license, maintenance and services fee received in advance. The license and services fee are transferred to revenue on work done basis where as maintenance is transferred to revenue on time proportion basis.
22.1 Guarantees issued by the financial institutions on behalf of the Company amount to Rs. 129.12 million (2014: Rs. 63.05 million).
22.2 Commitments include capital commitments for construction of building of the Company amounting to Rs. 344 million (2014: 225.43 million) out of which Rs. 115.02 million have been invoiced.
22.3 During the current period as well as last year, the Company has not charged Workers' Welfare Fund (WWF) under WWF Ordinance, 1971 amounting to Rs. 9.3 (2014: Rs. 8.9) million respectively, as the amendments made through Finance Act 2006 and 2008 relating to scope and applicability of the same has been declared unconstitutional by the Honorable Lahore High Court through its judgment number 2011 PLD 2643. The matter is pending before the Honorable Supreme Court of Pakistan. However, management is confident that the decision of the Lahore High Court shall prevail, accordingly no provision has been made by the Company during the year in this regard.
23. REVENUE - net
Development and other services:
Export
Local
Less: Sales tax on local sales 23.1
Trading income:
Software sale - export Software sale - local Less: Sales tax on local sales 23.1
1,721,701,661
485,235,228
(52,288,117)
432,947,111
37,469,733
99,132,144
(27,960,298)
71,171,846
2,263,290,351
1,419,780,765
324,836,908
(26,944,437)
297,892,561
87,323,353
138,235,173
(20,615,998)
117,619,175
1,922,615,854
23.1 This represents sales tax chargeable under Provincial and Federal Sales tax laws.
22.4 The Deputy Commissioner Inland Revenue has issued withholding tax assessment orders u/s 161/205 of the Income Tax Ordinance 2001 (the Ordinance) for the tax year 2010 and 2012 whereby tax amounting to Rs. 779,513 and Rs. 13,540,966 respectively has been levied. The Company preferred appeals against the orders which are pending adjudications.
22.5 The Company filed an undertaking pursuant to Income Tax (Second Amendment) Ordinance, 2015, thereby opting out of minimum tax on services under section 153(1)(b) of the Ordinance. The Assistant Commissioner, Inland Revenue has declined the undertaking against which the Company has filed an appeal before Commissioner Inland Revenue (Appeals) which is pending adjudication, which might result in tax liability of Rs. 30.25 million.
22.6 The Company has filed appeals before the Commissioner lnland Revenue (Appeals) against the orders passed under section 122(5A) of the Ordinance by the Additional Commissioner Inland Revenue for payment of additional amount Rs. 10.6 million and Rs. 9 million in respect of tax years 2010 and 2011 respectively.
Pending adjudication of the above matters, the tax consultants and management of the Company expect favorable outcome of the appeals and anticipate no outflow of economic benefits.
2015NoteAmounts in rupees 2014
Systems Limited | Annual Report 2015 071
www.systemsltd.com070
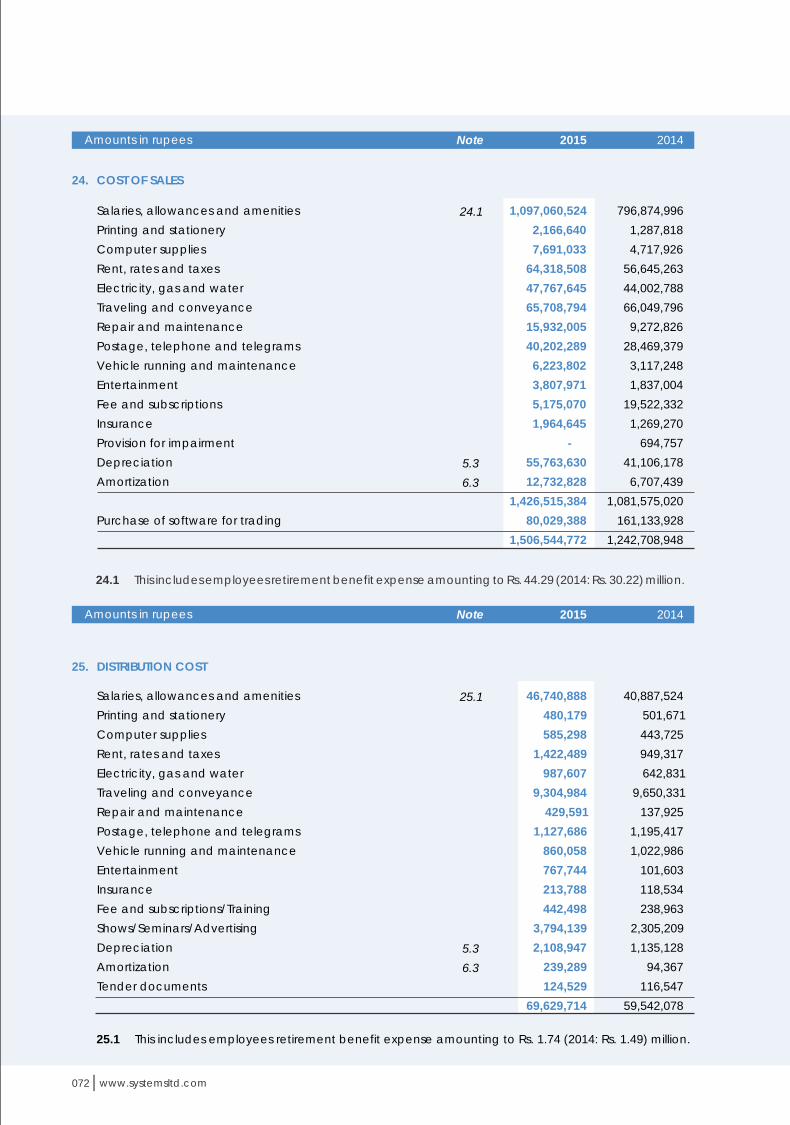
25.1 46,740,888 40,887,524
480,179 501,671
585,298 443,725
1,422,489 949,317
987,607 642,831
9,304,984 9,650,331 429,591 137,925
1,127,686 1,195,417 860,058 1,022,986 767,744
101,603
213,788
118,534
442,498
238,963
3,794,139
2,305,209
5.3 2,108,947
1,135,128
6.3 239,289
94,367
25. DISTRIBUTION COST
Salaries, allowances and amenities
Printing and stationery
Computer supplies
Rent, rates and taxes
Electricity, gas and water
Traveling and conveyance
Repair and maintenance
Postage, telephone and telegrams
Vehicle running and maintenance
Entertainment
Insurance
Fee and subscriptions/Training
Shows/Seminars/Advertising
Depreciation
Amortization
Tender documents 124,529
116,547
69,629,714
59,542,078
25.1 This includes employees retirement benefit expense amounting to Rs. 1.74 (2014: Rs. 1.49) million.
24.1 This includes employees retirement benefit expense amounting to Rs. 44.29 (2014: Rs. 30.22) million.
2015NoteAmounts in rupees 2014
26.1 This includes employees retirement benefit expense amounting to Rs. 7.19 (2014: Rs. 5.5) million.
26.2 Auditors' remuneration
Statutory audit fee
Half yearly and quarterly audits
Half yearly review
800,000
-
400,000
1,200,000
650,000
810,000
-
1,460,000
26.3 The Directors or their spouses have no interest in the Donee's fund.
26. ADMINISTRATIVE EXPENSES
Salaries, allowances and amenities 26.1
Printing and stationery
Computer supplies
Rent, rates and taxes
Electricity, gas and water
Traveling and conveyance
Repair and maintenance
Postage, telephone and telegrams
Vehicle running and maintenance
Legal and professional
Auditors' remuneration 26.2
Entertainment
Donations 26.3
Fee and subscriptions/Training
Insurance
Hiring cost
Newspapers, books and periodicals
Depreciation 5.3
Amortization 6.3
Others
171,610,572
3,373,902
4,342,920
4,168,623
6,355,570
11,358,295
8,021,124
8,242,104
2,573,171
17,984,289
1,200,000
1,759,158
38,500
5,175,790
669,178
1,139,699
74,498
11,843,419
1,889,566
481,350
262,301,728
133,294,808
1,039,153
3,336,391
7,580,772
7,125,624
8,422,142
5,207,364
5,005,280
2,406,366
3,844,195
1,460,000
1,948,413
684,000
5,183,544
670,143
653,499
374,816
9,104,230
982,874
308,055
198,631,669
2015NoteAmounts in rupees 2014
EY KPMG
2015Amounts in rupees 2014
Systems Limited | Annual Report 2015 073
www.systemsltd.com072
24. COST OF SALES
Salaries, allowances and amenities 24.1
Printing and stationery
Computer supplies
Rent, rates and taxes
Electricity, gas and water
Traveling and conveyance
Repair and maintenance
Postage, telephone and telegrams
Vehicle running and maintenance
Entertainment
Fee and subscriptions
Insurance
Provision for impairment
Depreciation 5.3
Amortization 6.3
Purchase of software for trading
1,097,060,524
2,166,640
7,691,033
64,318,508
47,767,645
65,708,794
15,932,005
40,202,289
6,223,802
3,807,971
5,175,070
1,964,645
-
55,763,630
12,732,828
1,426,515,384
80,029,388
1,506,544,772
796,874,996
1,287,818
4,717,926
56,645,263
44,002,788
66,049,796
9,272,826
28,469,379
3,117,248
1,837,004
19,522,332
1,269,270
694,757
41,106,178
6,707,439
1,081,575,020
161,133,928
1,242,708,948
2015NoteAmounts in rupees 2014

27. RESEARCH AND DEVELOPMENT EXPENSES
Salaries, allowances and amenities 27.1
Computer supplies
Printing and stationery
Rent, rates and taxes
Electricity, gas and water
Traveling and conveyance
Repair and maintenance
Postage, telephone and telegrams
Vehicle running and maintenance
Entertainment
Fee and subscriptions/Training
Insurance
Depreciation 5.3
Amortization 6.3
23,577,929
387,222
15,197
931,443
529,755
1,232,344
359,884
567,230
118,189
86,080
94,312
22,054
1,006,035
274,310
29,201,984
1,587,833
115,132
-
179,196
103,482
111,138
41,237
86,966
25,539
-
24,165
10,019
121,301
23,410
2,429,418
27.1 This includes employees retirement benefit expense amounting to Rs. 0.77 (2014: Rs. 0.02) million.
28. OTHER INCOME
Income from financial assets:
Profit on deposit accounts
Gain on short term investments
Exchange gain on translation of export debts
Interest on loan to subsidiary
Income from non-financial assets:
Gain on disposal of property and equipment
Others
11,553,132
43,730,505
25,061,317
4,362,629
84,707,583
4,689,810
2,565,849
7,255,659
91,963,242
15,920,632
13,972,179
-
3,164,738
33,057,549
5,444,957
-
5,444,957
38,502,506
29. OTHER OPERATING EXPENSES
Provision for doubtful debts
Bad debts - direct written off
Exchange loss on translation of export debts
6,926,419
13,022,178
-
19,948,597
1,143,961
-
21,813,276
22,957,237
30. FINANCE COST
Markup on guarantee commission 380,512 403,591
Bank charges and commission 1,740,532 3,581,999
2,121,044
3,985,590
2015NoteAmounts in rupees 2014
2015Amounts in rupees 2014
31. TAXATION
Income tax
- Current 31.1&31.2
- Prior
Deferred tax expense / (income)
10,082,379
2,234,931
12,317,310
673,714
12,991,024
6,760,398
-
6,760,398
(2,616,558)
4,143,840
2015NoteAmounts in rupees 2014
31.1 This represents tax chargeable under Normal Tax Regime on local sale of software and services. The income of the Company from export of software is exempt under clause 133 Part 1 of Second Schedule to the Income Tax Ordinance, 2001.
31.2 This represents minimum tax under section 153 of Income Tax Ordinance, 2001 (2014: 33% of taxable income). Reconciliation of accounting profit and tax charge for the year is meaningless in view of the said section.
The aggregate amounts charged in the accounts for the year for remuneration including certain benefits to the Chief Executive Officer, Directors and Executives of the Company are as follows :
32. REMUNERATION OF CHIEF EXECUTIVE OFFICER, DIRECTORS AND EXECUTIVES
2015 2014 2015 2014 2015 2014
Number of persons 1 1 6 6 533 334
Managerial remuneration 23,000,000
24,400,000
-
-
745,232,242
461,490,249
Retirement benefits 1,200,000 960,000 - - 41,163,662 25,676,206
24,200,000
25,360,000
-
-
786,395,904
487,166,455
Chief Executive Officer Non Executive Directors Executives
Numbers
2015 2014 20142015 20142015Amounts in rupees
The Chief Executive Officer and certain executives are also provided with free medical reimbursements, mobile phone facility and free use of the Company maintained cars in accordance with their entitlement.
During the current year, Chief Executive Officer and certain executives of the Company exercised stock option under employee stock option scheme according to which 223,406 (2014: 223,975) shares were allotted to them respectively.
Geographical segments
For management purposes, the Systems Limited is organized into business units based on their geographical areas and has three reportable operating segments as follows:
North AmericaMiddle EastPakistan
No other operating segments have been aggregated to form the above reportable operating segments.
Management monitors the operating results of its operating segments separately for the purpose of performance assessment. Segment performance is evaluated based on operating profit or loss and is measured consistently with operating profit or loss in the consolidated financial statements.
33. OPERATING SEGMENT INFORMATION
Systems Limited | Annual Report 2015 075
www.systemsltd.com074
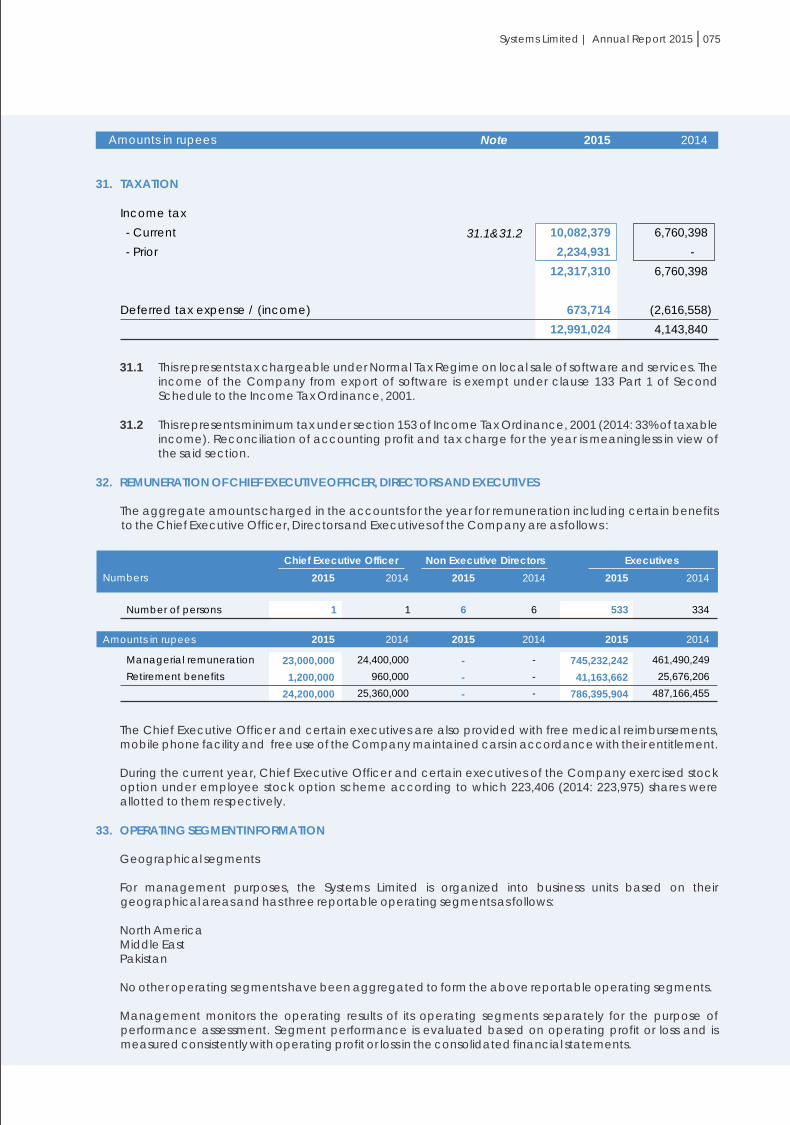

Undertaking
Staff retirement funds
E Processing Systems
(Private) Limited.
Tech Vista Systems FZ-
LLC - UAE
Visionet Systems
Incorporation - USA
Relation
Subsidiary
Subsidiary
Common
Directorship
Nature of transaction
Payment for expenses
Interest income
Sales
Payment for expenses
Sales
Reimbursement of expenses
Contribution
1,083,629,875
24,769,646
4,362,629
201,472,306
124,766,009
1,390,832,102
36,767,441
55,504,158
2015 2014
25,661,610
3,164,738
146,062,711
-
23,623,310
38,199,915
Unallocated income and expenses:
Other operating expenses
Other income
Finance cost
Profit before taxation
Taxation
Profit for the year
(19,948,597)
91,963,242
(2,121,044)
69,893,601
465,505,754
(12,991,024)
452,514,730
(22,957,237)
38,502,506
(3,985,590)
11,559,679
430,863,420
(4,143,840)
426,719,580
33.1 All assets and liabilities of the Company have been allocated to Pakistan segment.
Sales
Cost of sales
Gross profit
Distribution cost
R & D
Administrative expenses
Profit / (loss) before taxation andunallocated income and expenses
2015
1,429,263,768
(805,465,436)
623,798,332
-
(7,140,212)
(168,964,471)
(176,104,683)
447,693,649
2014
1,121,196,014
(614,972,794)
506,223,220
-
(26,900)
(119,762,879)
(119,789,779)
386,433,441
2015
329,907,627
(298,883,462)
31,024,165
(18,647,821)
(9,802,475)
(38,653,440)
(67,103,736)
(36,079,571)
2014
386,747,450
(306,404,879)
80,342,571
(25,494,780)
(951,266)
(33,534,001)
(59,980,047)
20,362,524
2015
504,118,956
(402,195,874)
101,923,082
(50,981,893)
(12,259,297)
(54,683,817)
(117,925,007)
(16,001,925)
2014
414,672,390
(321,331,275)
93,341,115
(34,047,298)
(1,451,252)
(45,334,789)
(80,833,339)
12,507,776
2015
(1,506,544,772)
756,745,579
(69,629,714)
(29,201,984)
(262,301,728)
(361,133,426)
395,612,153
2014
(1,242,708,948)
679,906,906
(59,542,078)
(2,429,418)
(198,631,669)
(260,603,165)
419,303,741
North America Middle East Pakistan Total
2,263,290,351 1,922,615,854
Amounts in rupees
Transfer prices between operating segments are on arm’s length basis in a manner similar to transactions with third parties.
2015Amounts in rupees 2014
34. TRANSACTIONS WITH RELATED PARTIES
The related parties and associated undertakings comprise subsidiary, associated companies, companies in which directors are interested, staff retirement funds and directors and key management personnel (Note 32). The Company in the normal course of business carries out transactions with various related parties. Amounts due from and to related parties are shown under respective notes to the financial statements. Other significant transactions with related parties are as follows:
Amounts in rupees
35.2 Diluted earnings per share
Profit for the year after tax 452,514,730 426,719,580
Restated
109,294,130 95,408,727
1,242,385 884,561
110,536,515 96,293,288
Weighted-average number of ordinary shares (basic)
Effect of share options
Weighted average number of ordinary shares - diluted
Diluted earnings per share (Rupees) 4.09 4.43
35.1 Basic earnings per share
Profit for the year after tax 452,514,730 426,719,580
Restated
Weighted-average number of ordinary sharesas at 31 December 109,294,130
95,408,727
Basic earnings per share (Rupees) 4.14 4.47
35. EARNINGS PER SHARE- BASIC AND DILUTED
Earnings per share are calculated by dividing the net profit for the year by weighted average number of shares outstanding during the year as follows:
2015Amounts in rupees 2014
2015Number os shares 2014
The earnings per share of prior year has been adjusted to reflect the changes of bonus shares issued during the year ended 31 December 2015.
2015Amounts in rupees 2014
2015Number os shares 2014
Systems Limited | Annual Report 2015 077
www.systemsltd.com076
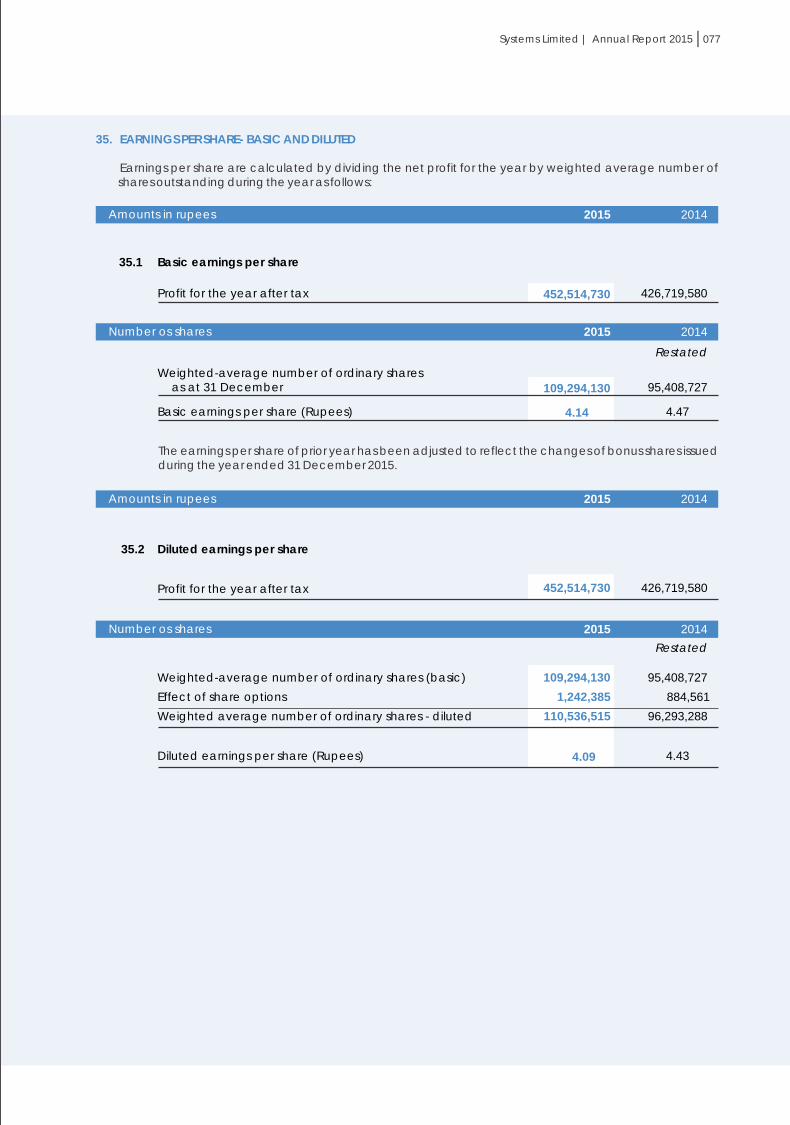

2015Amounts in rupees 2014
36. CASH GENERATED FROM OPERATIONS
Profit before taxation
Adjustment for:
Depreciation on property and equipment
Amortization of intangibles
Provision for bad debts
Bad debts - written off
Provision for impairment
Finance cost
Exchange gain on translation of export debts
Gain on short term investments
Share based payment expense
Gain on disposal of property and equipment
Working capital changes
Decrease / (increase) in current assets
Unbilled revenue - net
Trade debts
Advances
Receivable from related parties
Trade deposits and short term prepayments
(Decrease) / increase in current liabilities
Trade and other payables
Cash generated from operations
465,505,754
70,722,031
15,135,993
6,926,419
13,022,178
-
2,121,044
(25,061,317)
(43,730,505)
9,251,100
(4,689,810)
509,202,887
56,001,770
(274,400,549)
(42,786,234)
(116,844,103)
2,435,316
(375,593,800)
(45,392,960)
(420,986,760)
88,216,127
430,863,420
51,466,837
7,808,090
1,143,961
-
694,757
3,985,590
21,813,276
(13,972,179)
-
(5,444,957)
498,358,795
5,069,146
(347,587,150)
(34,423,135)
(15,293,370)
-
(392,234,509)
212,627,131
(179,607,378)
318,751,417
37. FINANCIAL RISK MANAGEMENT
Financial instruments comprise advances, deposits, interest accrued, trade debts, other receivables, receivable from related parties, cash and bank balances and trade and other payables.
The Company has exposure to the following risks from its use of financial instruments:
- Market risk - Credit risk - Liquidity risk
The Board of Directors has the overall responsibility for the establishment and oversight of Company’s risk management framework. The Board is also responsible for developing and monitoring the Company's risk management policies.
This note represents information about the Company’s exposure to each of the above risks, it's objectives, policies and processes for measuring and managing risk, and it's management of capital.
The Company's risk management policies are established to identify and analyze the risks faced by the Company, to set appropriate risk limits and controls, and to monitor risks and adherence to limits. Risk management policies and systems are reviewed regularly to react to changes in market conditions and the Company's activities.
37.1 Market risk
(a) Currency risk
Currency risk is the risk that the fair value or future cash flows of a financial instrument will fluctuate because of changes in foreign exchange rates. Currency risk arises mainly from future commercial transactions or receivables and payables that exist due to transactions in foreign currencies.
Monetary items, including financial assets and financial liabilities, denominated in currency other than functional currency of the Company are periodically restated to Pak rupee equivalent and the associated gain or loss is taken to the profit and loss account.
The following analysis demonstrates the sensitivity to a reasonably possible change in exchange rates, with all other variables held constant, of the Company's profit before tax.
2015 2014
+1 81,570,803
67,175,141
-1 (81,570,803)
(67,175,141)
Reporting date rate:
USD 104.6 100.4
Changes
in Rate
Effects on
Profit
Before Tax
Effects on Profit
Before Tax
USD
Amounts in rupees
(b) Other price risk
Other price risk is the risk that the fair value or future cash flows of a financial instrument will fluctuate because of changes in market prices (other than those arising from interest rate risk or currency risk). Material investments within the portfolio are managed on an individual basis and all buy and sell decisions are approved by the Board. The primary goal of the Company's investment strategy is to maximize investment returns
Management believes that sensitivity analysis is unrepresentive of the price risks
(c) Interest rate risk
Interest rate risk represents the risk that the fair value or future cash flows of a financial instrument will fluctuate because of changes in market interest rates.
The Company does not account for any fixed rate financial assets and liabilities at fair value through profit or loss. Therefore, a change in interest rate at the balance sheet date would not affect profit or loss of the Company.
37.2 Credit risk
Credit risk represents the accounting loss that would be recognized at the reporting date if counter-parties failed completely to perform as contracted. The Company does not have significant exposure to any individual counter-party. To reduce exposure to credit risk the Company has developed a formal approval process whereby credit limits are applied to its customers. The management also continuously monitors the credit exposure towards the customers and makes provision against those balances considered doubtful of recovery. Outstanding customer receivables are regularly monitored.
Systems Limited | Annual Report 2015 079
www.systemsltd.com078

Unbilled revenue
Trade debts
Advances
Trade deposits and short term prepayments
Receivable from related parties
Interest accrued
Short term investment
Cash and bank balances
The aging of trade receivables at the reporting date is:
0 - 120 days
121 - 365 days
Above one year
Impairment above one year
244,214,338
1,096,796,692
4,958,554
41,176,013
164,572,856
12,585,928
525,000,000
144,555,083
2,233,859,464
805,765,482
216,681,022
86,321,607
1,108,768,111
(11,971,419)
1,096,796,692
196,852,530
817,283,423
1,782,142
25,961,122
47,728,753
3,164,738
-
983,191,394
2,075,964,102
582,352,530
225,251,684
15,398,892
823,003,106
(5,719,683)
817,283,423
The credit risk on liquid funds is limited because the counter parties are banks and mutual funds with reasonably high credit ratings. The Company believes that it is not exposed to major concentration of credit risk as its exposure is spread over a large number of counter parties and subscribers in case of trade debts.
The carrying amount of financial assets represents the maximum credit exposure. The maximum exposure to credit risk at the reporting date was as follows:
2015Amounts in rupees 2014
As at year end, 91% of trade debts (2014: 80%) are represented by two customers amounting to Rs. 874 million (2014: Rs. 595 million). The management believes that the Company is not exposed to customer concentration risk as these customers are related parties of the Company.
Based on past experience and policy of the Company, the management believes that an impairment allowance is necessary in respect of trade receivables past due by one year except if those receivables are recovered subsequent to year end and if management has sufficient grounds to believe that the amounts will be recovered.
The credit quality of financial assets that are neither past due nor impaired can be assessed by reference to external credit ratings or to historical information about counterparty default rate. The table below shows the bank balances and investments held with some major counterparties at the balance sheet date:
2015 2014
Amounts in rupeesShort term Long term Agency
Habib Metropolitan Bank A1+ AA+ PACRA 362,868,557
105,880,000
Bank Islami A1 A+ PACRA 33,020,729
-
Nafa Asset
Management Fund5 Star 4 Star PACRA 32,799,398
30,204,644
United Bank Limited A-1+ AA+ JCR-VIS 30,159,195
52,213,354
Faysal Bank A1+ AA PACRA 62,686,970
54,509,373
Standard Chartered
Bank Limited A1+ AAA PACRA 1,480,199
2,838,562
Albarakah Bank Limited A1 A PACRA 1,425,068
1,394,141
Meezan Bank A1+ AA JCR-VIS 151,010,307 -
Dubai Islamic Bank A1 A+ JCR-VIS 910,384 17,208,754
Bank Alfalah Limited A1+ AA PACRA 25,501,210 66,217,230
BanksRating
Deutsche Bank Limited P-1 A2 Moody's 460,970
1,011,900
KASB Bank Limited C B PACRA 31,494
194,658,080
Habib Bank Limited A1+ AA JCR-VIS -
83,520,000
Silk Bank A2 A- JCR-VIS -
4,300,000
Summit Bank A1 A JCR-VIS - 390,000,000
Samba Bank A1 AA JCR-VIS - 1,960,000
Askari Bank A1+ AA JCR-VIS - 7,480,000
702,354,481 1,013,396,038
37.3 Liquidity risk
Liquidity risk is the risk that the Company will not be able to meet its financial obligations as they fall due. The Company's approach to managing liquidity is to ensure as far as possible to always have sufficient liquidity to meet its liabilities when due. The following are the contractual maturities of financial liabilities:
The following are the contractual maturities of financial liabilities as at 31 December 2015:
Carrying
amount
Less than
one year
One to five
years
More than five
years
Trade and other payables 217,557,343
217,557,343
-
-
Long term advances 12,669,395
5,017,350
7,652,045
-
230,226,738
222,574,693
7,652,045
-
The following are the contractual maturities of financial liabilities as at 31 December 2014:
Amounts in rupees
Systems Limited | Annual Report 2015 081
www.systemsltd.com080
Trade and other payables 245,179,414
245,179,414
-
-
Long term advances 10,158,496
3,391,885
6,766,611
255,337,910 248,571,299 6,766,611 -
Carrying
amount
Less than
one year
One to five
years
More than five
years Amounts in rupees
37.4 Fair values of financial assets and liabilities
Fair value of available-for-sale financial assets is derived from quoted market prices in active markets, if available.

2015 Level 1 Level 2 Level 3
Assets measured at fair value
Mutual funds 32,799,398
32,799,398
- -
Date of valuation : 31 December 2015
There were no liabilities measured at fair value as at 31 December 2015.
2014 Level 1 Level 2 Level 3
Assets measured at fair value
Mutual funds 30,204,644
30,204,644
-
-
Date of valuation : 31 December 2014
There were no liabilities measured at fair value as at 31 December 2014.
As at 31 December 2014, the Company held the following financial instruments carried at fairvalue:
37.6 Capital risk management
The Company’s policy is to safeguard the Company’s ability to remain as a going concern and ensure a strong capital base in order to maintain investors’, creditors’ and market’s confidence and to sustain future development of the business. The Board of Directors monitors the returns on capital, which the Company defines as net operating income divided by total shareholders’ equity. The Company’s objectives when managing:
a) to safeguard the entity’s ability to continue as a going concern, so that it can continue to provide returns for shareholders and benefits for other stakeholders; and
b) to provide an adequate return to shareholders by pricing products.
In order to maintain or adjust the capital structure, the Company may adjust the amount of dividends paid to shareholders, return capital to shareholders, or issue new shares.
Consistent with the industry norms, the Company monitors its capital on the basis of gearing ratio. The ratio is calculated as net debt divided by total capital. Net debt is calculated as total borrowings as shown in the balance sheet less cash and cash equivalent. Total capital is calculated as ‘equity’ as shown in the balance sheet plus net debt (as defined above).
The debt - to- equity ratio as to 31 December is as follows
Net debt
Total equity
Capital gearing ratio
-
2,495,627,437
-
-
1,627,761,024
-
2015Amounts in rupees 2014
Since the Company, has healthy cash flows at period end which is primarily because of higher revenue resulting in profits and increased equity due to new shares issued, therefore, it does not carry any long term or short term debts at 31 December 2015.
The Company is not subject to any externally-imposed capital requirements.
38.1 The Company has maintained an employee provident fund trust and investments out of provident fund have been made in accordance with the provisions of section 227 of the Companies Ordinance 1984, and the rules formulated for this purpose. The salient information of the fund is as follows:
38. PROVIDENT FUND TRUST
Size of the fund (net assets) 193,416,811 149,726,979
Cost of investment made (actual investments made) 139,630,775
105,210,667
Percentage of investment made (cost of investments) 72.19% 70.27%
Fair value of investments 139,630,775
105,210,667
2015Amounts in rupees 2014
38.2 Break-up of investments of provident fund
Break-up of investments in terms of amount and percentage of the size of the provident fund are as follows:
Systems Limited | Annual Report 2015 083
www.systemsltd.com082
The carrying values of other financial assets and financial liabilities reflected in financial statements approximate their fair values. Fair value is determined on the basis of objective evidence at each reporting date.
37.5 Fair value hierarchy
The Company uses the following hierarchy for determining and disclosing the fair value of financial instruments by valuation technique:
Level 1: quoted (unadjusted) prices in active markets for identical assets or liabilities.
Level 2: other techniques for which all inputs which have a significant effect on the recorded fair value are observable either, directly or indirectly.
Level 3: techniques which use inputs that have a significant effect on the recorded fair value that are not based on observable market data.
As at 31 December 2015, the Company held the following financial instruments carried at fair value:
At fair value
Mutual Funds 52,554,756 37.6% 40,361,532 38.4%
Term Deposit Receipts 65,076,019 46.6% 42,849,135 40.7%
Defense saving certificates 22,000,000 15.8% 22,000,000 20.9%
139,630,775 100% 105,210,667 100%
% of
investment as
size of the fund
% of
investment as
size of the fund
InvestmentsInvestments
20142015
Description
Rupees Rupees
38.3 The above information is based on unaudited financial statements of the provident fund.
Amounts in rupees
Amounts in rupees
39. NUMBER OF EMPLOYEES
Number of employees at the end of the year 1,829 1,254
Average number of employees during the year 1,660 1,409
2015 2014
%%

40. POST BALANCE SHEET EVENTS
41. DATE OF AUTHORIZATION FOR ISSUE
42. CORRESPONDING FIGURES
The Directors in their meeting held on 31 March 2016 have recommended a final dividend of Rs. 1.25 per share (2014: Rs. 1 per share) amounting to Rs. 138.351 million (2014: Rs. 100.165 million) and bonus shares at the rate of NIL (2014: 10%) in respect of year ended December 31, 2015. The financial statements for the year ended December 31, 2015 do not include the effect of these appropriations which will be accounted for in the year in which it is approved.
These financial statements were authorised for issue in the Board of Directors meeting held on 31 March 2016.
Corresponding figures have been re-classified for better presentation, in respect of following:
106,438,245
To:
Advances 25,269,376
Tax refunds due from government 27,467,230
Interest accrued 3,164,738
Trade deposits and short term prepayments 50,536,901
106,438,245
Profit and loss account
21,813,276
Advances, deposits, prepayments and other receivables have been shown
separately on the face of the balance sheet as:
Provision for doubtful debts reclassified from 'Distribution cost' to 'Other
operating expenses' 1,143,961
Exchange loss reclassified from 'Other income' to Other operating expenses'
Balance sheet Rupees
From:
AEZAZ HUSSAINChairman
ASIF PEERChief Executive
www.systemsltd.com084
ConsolidatedFinancial Statements

This page has been left blank intentionally

AUDITORS’ REPORT TO THE MEMBERS
Systems Limited | Annual Report 2015 087
We have audited the annexed consolidated financial statements comprising consolidated Balance Sheet of Systems Limited (the Holding Company) and its subsidiary companies (together referred to as Group) as at 31 December 2015 and the related consolidated Profit and Loss Account, consolidated Cash Flow Statement and consolidated Statement of Changes in Equity together with the notes forming part thereof, for the year then ended. We have also expressed separate opinions on the financial statements of the Holding Company and its subsidiary company namely E-Processing Systems (Private) Limited except for a subsidiary company namely TechVista Systems FZ-LLC which was audited by other firm of auditors whose report has been furnished to us and our opinion, in so far as it relates to the amounts included for such company, is based solely on the report of such other auditors. These financial statements are the responsibility of the Holding Company's management. Our responsibility is to express an opinion on these financial statements based on our audit.
Our audit was conducted in accordance with the International Standards on Auditing and accordingly included such tests of accounting records and such other auditing procedures as we considered necessary in the circumstances.
In our opinion, the consolidated financial statements present fairly the financial position of the Holding Company and its subsidiary companies as at 31 December 2015 and the results of their operations for the year then ended.
Other matter
The consolidated financial statements of the Group for the year ended 31 December 2014 were audited by another firm of chartered accountants whose report dated 18 March 2015 expressed an unqualified opinion.
Chartered Accountants
Engagement Partner: Naseem AkbarLahore.Date: 31 March 2016

ASIF PEERChief Executive
2015NoteAmounts in rupees 2014
Authorized share capital
EQUITY AND LIABILITIES
Share capital and reserves
150,000,000 (2014: 150,000,000) ordinary shares of Rs. 10 each
Issued, subscribed and paid up share capital 16
Reserves 17
Unappropriated profit Total shareholders' equity Non-controlling interest
Advance against issue of shares
Non-current liabilities
Long term advances 18 Provision for gratuity
Total non-current liabilities
Current liabilities
Trade and other payables 19
Unearned revenue 20 Current portion of long term advances
Total current liabilities CONTINGENCIES AND COMMITMENTS 21
TOTAL EQUITY AND LIABILITIES
1,500,000,000
1,106,808,760 420,591,135
895,921,042
2,423,320,937 (9,746,736) 2,413,574,201
-
7,652,045 1,616,973
9,269,018
262,879,897 109,811,070 5,017,350
377,708,317 -
2,800,551,536
1,500,000,000
871,653,020
39,208,094
687,263,344
1,598,124,458
(5,099,886)
1,593,024,572
520,000,000
6,766,611
1,651,087
8,417,698
273,361,263
6,447,492
3,391,885
283,200,640
-
2,404,642,910
CONSOLIDATED BALANCE SHEETAS AT DECEMBER 31, 2015
AEZAZ HUSSAINChairman
The annexed notes from 1 to 41 form an integral part of these consolidated financial statements.
2015NoteAmounts in rupees 2014
ASSETS
Non-current assets
Property and equipment 5
Intangibles 6
Long term deposits
Deferred taxation 7
Total non-current assets
Current assets
Unbilled revenue 8
Trade debts 9
Advances 10
Trade deposits and short term prepayments 11
Interest accrued
Receivable from related parties 12
Tax refunds due from the Government 13
Short term investments 14
Cash and bank balances 15
Total current assets
362,703,298 83,233,400 11,901,100
809,510
458,647,308
369,960,316 961,694,628 72,877,563
114,239,639 5,058,561
11,536,311 55,143,956
557,799,398 193,593,856
2,341,904,228
203,407,660 54,210,428 14,346,357 1,483,224
273,447,669
252,055,058 745,586,865 27,725,933 58,912,647
- 2,150,066
27,467,230 30,204,644
987,092,798
2,131,195,241
TOTAL ASSETS 2,800,551,536 2,404,642,910
Systems Limited | Annual Report 2015 089
www.systemsltd.com088

CONSOLIDATED PROFIT AND LOSS ACCOUNTFOR THE YEAR ENDED 31 DECEMBER 2015
NoteAmounts in rupees
AEZAZ HUSSAINChairman
ASIF PEERChief Executive
Revenue 22
Cost of sales 23
Gross profit
Distribution cost 24
Administrative expenses 25
Research and development expenses 26
Operating profit
Other income 27
Other operating expenses 28
Finance cost 29
Profit before taxation
Taxation 30
Profit after taxation
Attributable to:
Equity holders of the parent
Non-controlling interest
Earnings per share
Basic earnings per share 34
Diluted earnings per share 34
The annexed notes from 1 to 41 form an integral part of these consolidated financial statements.
2015
2,470,725,663
(1,669,924,222)
800,801,441
(72,778,492)
(342,295,586)
(29,201,984)
(444,276,062)
356,525,379
88,506,926
445,032,305
(23,726,609)
(3,065,865)
(26,792,474)
418,239,831
(12,991,024) 405,248,807
409,895,657
(4,646,850)
405,248,807
3.75
3.71
2014
1,922,711,560
(1,245,857,134)
676,854,426
(62,068,776)
(206,647,353)
(2,429,418)
(271,145,547)
405,708,879
35,342,737
441,051,616
(25,257,473)
(3,995,964)
(29,253,437)
411,798,179
(4,143,840) 407,654,339
411,265,030 (3,610,691)
407,654,339
(Restated)
4.31
4.27
2015Amounts in rupees 2014
CONSOLIDATED STATEMENT OF COMPREHENSIVE INCOME
AEZAZ HUSSAINChairman
ASIF PEERChief Executive
Profit for the year
Other comprehensive income
Exchange differences on translation of foreign operation
Total comprehensive income for the year, net of tax
Attributable to:
Equity holders of the parent
Non-controlling interest
405,248,807
(50,861)
405,197,946
409,844,796
(4,646,850)
405,197,946
407,654,339
428,539
408,082,878
411,693,569
(3,610,691)
408,082,878
The annexed notes from 1 to 41 form an integral part of these consolidated financial statements.
Other comprehensive income to be reclassified to
profit and loss account in subsequent periods (net of
tax):
Systems Limited | Annual Report 2015 091
www.systemsltd.com090
FOR THE YEAR ENDED 31 DECEMBER 2015

CONSOLIDATED STATEMENT OF CHANGES IN EQUITY
AEZ
AZ
HU
SSA
INC
hai
rman
ASI
F P
EER
Ch
ief
Exec
uti
ve
Issu
ed
,
sub
scrib
ed
an
d p
aid
up
sha
re c
ap
ita
l
Ad
va
nc
e
ag
ain
st iss
ue
of sh
are
s
Sh
are
ca
pita
l
pre
miu
m
Em
plo
ye
e
co
mp
en
satio
n
rese
rve
Fo
reig
n
cu
rre
nc
y
tra
nsl
atio
n
rese
rve
Un
-
ap
pro
pria
ted
pro
fit
No
n
inte
rest
co
ntr
olli
ng
Re
ve
nu
e r
ese
rve
To
tal e
qu
ity
att
rib
uta
ble
to
sha
reh
old
ers
of p
are
nt
co
mp
an
y
Tota
l
429,3
75,0
70
-
31,4
87,7
30
4,3
67
(344,5
96)
808,4
34,2
15
1,2
68,9
56,7
86
(1,4
89,1
95)
1,2
67,4
67,5
91
-
-
-
-
-411,2
65,0
30
411,2
65,0
30
(3,6
10,6
91)
407,6
54,3
39
--
--
428,5
39
428,5
39
-428,5
39
-
-
-
-
428,5
39
411,2
65,0
30
411,6
93,5
69
(3,6
10,6
91)
408,0
82,8
78
6,4
51,4
40
-
7,6
32,0
54
-
--
14,0
83,4
94
-14,0
83,4
94
-
-
-
-
(96,6
09,3
91)
(96,6
09,3
91)
(96,6
09,3
91)
442,2
77,9
50
-
7,6
32,0
54
-
-(5
32,4
35,9
01)
(82,5
25,8
97)
-(8
2,5
25,8
97)
-
520,0
00,0
00
-
-
--
520,0
00,0
00
-520,0
00,0
00
871,6
53,0
20
520,0
00,0
00
39,1
19,7
84
4,3
67
83,9
43
687,2
63,3
44
2,1
18,1
24,4
58
(5,0
99,8
86)
2,1
13,0
24,5
72
-
-
-
-
-409,8
95,6
57
409,8
95,6
57
(4,6
46,8
50)
405,2
48,8
07
--
--
(50,8
61)
-(5
0,8
61)
-(5
0,8
61)
--
--
(50,8
61)
409,8
95,6
57
409,8
44,7
96
(4,6
46,8
50)
405,1
97,9
46
130,0
00,0
00
(520,0
00,0
00)
390,0
00,0
00
--
--
--
4,5
36,7
60
-2,6
97,8
32
--
-7,2
34,5
92
-7,2
34,5
92
--
-9,2
51,1
00
--
9,2
51,1
00
-9,2
51,1
00
100,6
18,9
80
--
--
(100,6
18,9
80)
--
-
--
(20,5
15,0
30)
--
-(2
0,5
15,0
30)
-(2
0,5
15,0
30)
--
--
-(1
00,6
18,9
79)
(100,6
18,9
79)
-(1
00,6
18,9
79)
235,1
55,7
40
(520,0
00,0
00)
372,1
82,8
02
9,2
51,1
00
-(2
01,2
37,9
59)
(104,6
48,3
17)
-(1
04,6
48,3
17)
1,1
06,8
08,7
60
-411,3
02,5
86
9,2
55,4
67
33,0
82
895,9
21,0
42
2,4
23,3
20,9
37
(9,7
46,7
36)
2,4
13,5
74,2
01
Ca
pita
l re
serv
es
The
an
ne
xed
no
tes
fro
m 1
to
41 f
orm
an
inte
gra
l pa
rt o
f th
ese
co
nso
lida
ted
fin
an
cia
l sta
tem
en
ts.
Ba
lan
ce
as
on
01 J
an
ua
ry 2
014
Pro
fit
for
the
ye
ar
Oth
er
co
mp
reh
en
sive
inc
om
e f
or
the
ye
ar
Tota
l co
mp
reh
en
sive
inc
om
e
Tra
nsa
ctio
ns
with
ow
ne
rs
Exe
rcis
e o
f o
ptio
ns
435,8
26,5
10
--
--
(435,8
26,5
10)
--
-100%
Bo
nu
s is
sue
of
43,5
82,6
51 o
rdin
ary
sh
are
s o
f R
s. 1
0 e
ac
h
Ad
va
nc
e r
ec
eiv
ed
du
rin
g t
he
ye
ar
Ba
lan
ce
as
on
31 D
ec
em
be
r 2014
Pro
fit
for
the
ye
ar
Oth
er
co
mp
reh
en
sive
inc
om
e f
or
the
ye
ar
Tota
l co
mp
reh
en
sive
inc
om
e
Tra
nsa
ctio
ns
with
ow
ne
rs
Issu
e o
f sh
are
ca
pita
l
Exe
rcis
e o
f o
ptio
ns
Sha
re b
ase
d p
aym
en
ts
10%
Bo
nu
s is
sue
of
10,0
61,8
98 o
rdin
ary
sh
are
s o
f R
s. 1
0 e
ac
h
Initia
l Pu
blic
Off
er
(IP
O)
rela
ted
exp
en
ses
Ba
lan
ce
as
at
31 D
ec
em
be
r 2015
Fin
al d
ivid
en
d f
or
the
ye
ar
en
de
d 3
1 D
ec
em
be
r 2014 a
t th
e
rate
of
Rs.
1 p
er
sha
re
Fin
al d
ivid
en
d f
or
the
ye
ar
en
de
d 3
1 D
ec
em
be
r 2013 a
t th
e
rate
of
Rs.
2.2
5 p
er
sha
re
Am
ou
nts
in r
up
ee
s
CONSOLIDATED CASH FLOW STATEMENT
2015NoteAmounts in rupees 2014
AEZAZ HUSSAINChairman
ASIF PEERChief Executive
CASH FLOWS FROM OPERATING ACTIVITIES
Cash generated from operations 35
Finance cost paid
Taxes paid
Net cash flows from operating activities
CASH FLOWS FROM INVESTING ACTIVITIES
Purchase of property and equipment
Development expenditures (44,158,965)
Sale proceeds from disposal of property and equipment
(Purchase) / disposal of short term investments
Profit received on short term investments
Decrease / (Increase) in long term deposits
Net cash (outflow) / inflow from investing activities
CASH FLOWS FROM FINANCING ACTIVITIES
Proceeds from issue of share capital
Advance received against issue of shares
Initial Public Offer (IPO) related expenses
Proceeds from exercise of share options
Dividend paid
Increase in long term advances
Net cash (outflow) / inflow from financing activities
Net foreign exchange difference
(Decrease) / Increase in cash and cash equivalents
Cash and cash equivalents at the beginning of the year
Cash and cash equivalents at the end of year 15
104,857,668
(3,065,865)
(26,879,994)
(29,945,859)
74,911,809
(233,159,216)
6,824,362
(525,000,000)
36,077,190
2,445,257
(756,971,372)
-
-
(20,515,030)
7,234,592
(100,618,979)
2,510,899
(111,388,518)
(50,861)
(793,448,081)
987,092,798
193,593,856
332,333,336
(3,995,964)
(30,761,689)
(34,757,653)
297,575,683
(81,082,475)
(45,965,632)
13,435,356
214,360,082
11,057,949
(4,480,783)
107,324,497
14,083,494
520,000,000
-
-
(96,609,391)
327,725
437,801,828
428,539
842,702,008
143,962,251
987,092,798
The annexed notes from 1 to 41 form an integral part of these consolidated financial statements.
Systems Limited | Annual Report 2015 093
www.systemsltd.com092
FOR THE YEAR ENDED 31 DECEMBER 2015 FOR THE YEAR ENDED 31 DECEMBER 2015
NOTES TO THE CONSOLIDATED FINANCIAL STATEMENTS
1. THE GROUP AND ITS OPERATIONS
2. STATEMENT OF COMPLIANCE
3. BASIS OF MEASUREMENT
Holding Company
Systems Limited (the Company) is a public limited Company incorporated in Pakistan under the Companies Ordinance 1984, and is listed on the Pakistan Stock Exchange (formerly Karachi, Islamabad and Lahore Stock Exchanges). The Company is principally engaged in the business of software development, trading of software and business process outsourcing services. The head office of the Company is situated at Chamber of Commerce building, 11- Shahra-e-Aiwan-e-Tijarat, Lahore.
Subsidiary Companies
TechVista Systems FZ - LLC, a limited liability Company incorporated in Dubai Technology and Media Free Zone Authority, is a 100% owned subsidiary of Systems Limited. The Company is principally engaged in software development and providing business process outsourcing solutions.
Based on the audited financial statements of TechVista Systems FZ - LLC , the subsidiary has net accumulated losses of Rs. 49 million (AED 1.69 million) and its current liabilities exceeded its current assets by Rs. 48 million (AED 1.66 million) as on 31 December 2015. The shareholders of Holding Company has confirmed to have made the arrangements to provide funds to enable the Company to meet its liabilities of the business as they fall due. Without qualifying opinion in this regard, auditors of TechVista Systems FZ-LLC drew attention to the above mentioned matter in their report.
E-Processing Systems (Private) Limited, a private limited Company registered under Companies Ordinance, 1984 incorporated on 06 February 2013, is a 70% owned subsidiary of Systems Limited. The Company is principally engaged in the business of purchase and sale of airtime and software development including the development of systems and infrastructure.
Based on the audited financial statements of E-Processing System (Private) Limited, the subsidiary has net accumulated losses of Rs. 34.49 million and its currents liabilities exceeded its current assets by Rs. 7 million as on 31 December 2015. The Company is in the process of developing its product i.e. One Load Software and the commercial operations of the product was in beta testing phase and few retailers were given access to the system. Based on projected results of the subsidiary's operations and market research, the management is confident that the subsidiary will revert to profitable position in near future.
These consolidated financial statements have been prepared in accordance with approved accounting standards as applicable in Pakistan and the requirements of Companies Ordinance, 1984. Approved accounting standards comprise of such International Financial Reporting Standards (IFRSs) issued by the International Accounting Standards Board and Islamic Financial Accounting Standards (IFAS) issued by the Institute of Chartered Accountants of Pakistan as are notified under the provisions of the Companies Ordinance, 1984. Wherever, the requirements of the Companies Ordinance, 1984 or directives issued by the Securities and Exchange Commission of Pakistan differ with the requirements of these standards, the requirements of Companies Ordinance, 1984 or the requirements of the said directives shall prevail.
3.1 Basis of preparation
These consolidated financial statements have been prepared under the historical cost convention except for short term investments which are stated at fair value.
3.2 Principles of consolidation
The consolidated financial statements include the financial statements of Systems Limited and its subsidiary companies, here-in-after referred to as “the Group”.
3.2.1 Subsidiaries
A Company is a subsidiary, if an entity (the Holding Company) directly or indirectly controls, beneficially owns or holds more than fifty percent of its voting securities or otherwise has power to elect and appoint more than fifty percent of its directors.
Subsidiaries are consolidated from the date on which the Holding Company obtains control, and continue to be consolidated until the date when such control ceases.
The financial statements of the subsidiaries are prepared for the same reporting period as the Holding Company, using consistent accounting policies.
All intra-Company balances, transactions and unrealized gains and losses resulting from intra-Company transactions and dividends are eliminated in full.
The assets, liabilities, income and expenses of subsidiary companies are consolidated on a line by line basis and carrying value of investments held by the Holding Company is eliminated against the subsidiary companies’ shareholders’ equity in the consolidated financial statements.
3.2.2 Non-controlling interest
Non-controlling interest is that part of net results of operations and of net assets of the subsidiaries which are not owned by the Group either directly or indirectly. Non-controlling interest is presented as a separate item in the consolidated financial statements. The Group applies a policy of treating transactions with non-controlling interests as transactions with parties external to the Group. Disposals to non-controlling interest result in gains and losses for the Group and are recorded in the consolidated statement of changes in equity.
3.3 Functional and presentation currency
Items included in these consolidated financial statements are presented in Pak Rupees, which is the Group's functional and presentation currency. Figures have been rounded off to the nearest rupees unless otherwise stated.
3.4 Use of estimates and judgments
The Group's significant accounting policies are stated in Note 4. Not all of these significant policies require the management to make difficult, subjective or complex judgments or estimates. The following is intended to provide an understanding of the policies the management considers critical because of their complexity, judgment of estimation involved in their application and their impact on these consolidated financial statements. Estimates and judgments are continually evaluated and are based on historical experience, including expectation of future events that are believed to be reasonable under the circumstances. These judgments involve assumptions or estimates in respect of future events and the actual results may differ from these estimates. The areas involving higher degree of judgments or complexity or areas where assumptions and estimates are significant to the consolidated financial statements are as follows:
3.4.1 Provision for taxation
The Group takes into account the current income tax law and the decisions taken by appellate authorities. Instances where the Group's view differs from the view taken by the income tax department at the assessment stage and where the Group considers that its views on items of material nature are in accordance with law, the amounts are shown as contingent liabilities.
3.4.2 Useful life and residual values of property and equipment
The Group reviews the useful lives of property and equipment on a regular basis. Any change in estimates in future years might affect the carrying amounts of respective items of property and equipment with a corresponding effect on the depreciation charge and impairment.
3.4.3 Provision for doubtful debts
The Group regularly reviews its receivables for impairment, if any. The provision in this regard is made, based on management's estimate, where the prospects of recovery are doubtful.
3.4.4 Stage of completion
The Group determines stage of completion on the basis of services performed to date as a percentage of total services to be performed.
Systems Limited | Annual Report 2015 095
www.systemsltd.com094
FOR THE YEAR ENDED 31 DECEMBER 2015

3.4.5 Provisions
A provision is recognized in the consolidated balance sheet when the Group has a legal or constructive obligation as a result of a past event, and it is probable that an outflow of economic benefits will be required to settle the obligation and a reliable estimate can be made of the amount of obligation. The amount recognized as a provision reflects the best estimate of the expenditure required to settle the present obligation at the end of the reporting period.
The significant accounting policies which have been adopted in the preparation of consolidated financial statements of the Group are consistent with previous year except as described in Note 4.1.
4.1 New, amended standards and interpretations which became effective
The Group has adopted the following accounting standard and the amendments and interpretation of IFRSs which became effective for the current year:
IFRS 10 – Consolidated Financial Statements
IFRS 11 – Joint Arrangements
IFRS 12 – Disclosure of Interests in Other Entities
IFRS 13 – Fair Value Measurement
IAS 19 – Employee Benefits – (Amendment) - Defined Benefit Plans: Employee Contributions
Improvements to Accounting Standards Issued by the IASB
IFRS 2 Share-based Payment - Definitions of vesting conditions
IFRS 3 Business Combinations – Accounting for contingent consideration in a business combination
IFRS 3 Business Combinations - Scope exceptions for joint ventures
IFRS 8 Operating Segments – Aggregation of operating segments
IFRS 8 Operating Segments - Reconciliation of the total of the reportable segments’ assets to the entity’s assets
IFRS 13 Fair Value Measurement - Scope of paragraph 52 (portfolio exception)
IAS16 Property, Plant and Equipment and IAS 38 Intangible Assets – Revaluation method – proportionate restatement of accumulated depreciation / amortization
IAS 24 Related Party Disclosures - Key management personnel
IAS 40 Investment Property - Interrelationship between IFRS 3 and IAS 40 (ancillary services)
The adoption of the above amendments, improvements to accounting standards and interpretations did not have any effect on the consolidated financial statements.
4.2 Taxation
4.2.1 Current
Provision for current tax is based on the taxable income for the year determined in accordance with the prevailing law for taxation of income. The charge for current tax is calculated using prevailing tax rates or tax rates expected to apply to the profit for the year, if enacted. The charge for current tax also includes adjustments, where considered necessary, to provision for taxation made in previous years arising from assessments framed during the year for such years.
4.2.2 Deferred
Deferred tax is accounted for using the balance sheet liability method in respect of all temporary differences arising from differences between the carrying amount of assets and liabilities in the financial statements and the corresponding tax bases used in the computation of the taxable profit. Deferred tax liabilities are generally recognized for all taxable temporary differences and deferred tax assets are recognized to the extent that it is probable that taxable profits will be available against which the deductible temporary differences, unused tax losses and tax credits can be utilized.
4. SIGNIFICANT ACCOUNTING POLICIES
Deferred tax is calculated at the rates that are expected to apply to the year when the differences reverse based on tax rates that have been enacted or substantively enacted by the balance sheet date. Deferred tax is charged or credited in the profit and loss account, except in the case of items credited or charged to other comprehensive income in which case it is included in other comprehensive income.
4.3 Property and equipment
Property and equipment are stated at cost less accumulated depreciation and any identified impairment loss. Freehold land is stated at historic cost. Cost of operating fixed assets consist of purchase cost, borrowing cost pertaining to construction period and directly attributable cost of bringing the asset to working condition. Subsequent costs are included in the assets carrying amount or recognized as separate asset, as appropriate, only when it is probable that future economic benefits associated with the item will flow to the Group and the cost of the item can be measured reliably. All other repair and maintenance costs are charged to consolidated profit and loss account during the period in which they are incurred.
Depreciation on property and equipment is charged to income by applying straight line method on pro rata basis so as to write off the historical cost of the assets over their estimated useful lives at the rates given in Note 5. Depreciation charge commences from the month in which the asset is available for use and continues until the month of disposal.
The assets residual values and useful lives are reviewed at each financial year end, and adjusted if impact on depreciation is significant.
An item of property and equipment is derecognized upon disposal or when no future economic benefits are expected from its use or disposal. Profit or loss on disposal of operating fixed assets represented by the difference between the sale proceeds and the carrying amount of the asset is included in income.
4.4 Capital work-in-progress
Capital work in progress represents expenditure on property and equipment which are in the course of construction and installation. Transfers are made to relevant property and equipment category as and when assets are available for use.
Capital work-in-progress is stated at cost less identified impairment loss, if any.
4.5 Intangible assets
Intangible assets acquired from the market are carried at cost less accumulated amortization and any impairment losses.
Expenditure on research (or the research phase of an internal project) is recognized as an expense in the period in which it is incurred;
Development costs incurred on specific projects are capitalized when all the following conditions are satisfied:
Completion of the intangible asset is technically feasible so that it will be available for use or sale.
The Group intends to complete the intangible asset and use or sell it.
The Group has the ability to use or sell the intangible asset.
Development costs not meeting the criteria for capitalization are expensed as incurred.
The cost of an internally generated intangible asset comprises all directly attributable costs necessary to create, produce and prepare the asset to be capable of operating in the manner intended by the management.
After initial recognition, internally generated intangible assets are carried at cost less accumulated amortization and impairment losses. These are amortized using straight line method at the rate given in note 6. Full month amortization on additions is charged in the month of acquisition and no amortization is charged in month of disposal.
Systems Limited | Annual Report 2015 097
www.systemsltd.com096

The Group assesses at each balance sheet date whether there is any indication that intangible assets may be impaired. If such indication exists, the carrying amounts of such assets are reviewed to assess whether they are recorded in excess of their recoverable amount. Where carrying amounts exceed the respective recoverable amount, assets are written down to their recoverable amounts and the resulting impairment loss is recognized in consolidated profit and loss account. The recoverable amount is the higher of an asset’s fair value less costs to sell and value in use. Where an impairment loss is recognized, the amortization charge is adjusted in the future periods to allocate the asset’s revised carrying amount over its estimated useful life.
4.6 Impairment
4.6.1 Financial assets including receivables
Financial assets are assessed at each reporting date to determine whether there is objective evidence that they are impaired. A financial asset is impaired if objective evidence indicates that a loss event has occurred after the initial recognition of the asset and that the loss event had a negative effect on the estimated future cash flows of that asset that can be estimated reliably. Objective evidence that financial assets are impaired may include default or delinquency by a debtor indications that a debtor or issuer will enter bankruptcy. All individually significant receivables are assessed for specific impairment. All individually significant receivables found not to be specifically impaired are then collectively assessed for any impairment that has been incurred but not yet identified. Receivables that are not individually significant are collectively assessed for impairment by grouping together receivables with similar risk characteristics.
An impairment loss in respect of a financial asset measured at amortized cost is calculated as the difference between its carrying amount and the present value of the estimated future cash flows discounted at the asset's original effective interest rate. Losses are recognized in consolidated profit and loss and reflected in an allowance account against receivables.
4.6.2 Non financial assets
The carrying amounts of non-financial assets other than inventories and deferred tax asset, are reviewed at each reporting date to determine whether there is any indication of impairment. If any such indication exists, then the asset's recoverable amount is estimated. The recoverable amount of an asset or cash-generating unit is the greater of its value in use and its fair value less costs to sell. In assessing value in use, the estimated future cash flows are discounted to their present value using a pre-tax discount rate that reflects current market assessment of the time value of money and the risks specific to the asset. For the purpose of impairment testing, assets that cannot be tested individually are grouped together into the smallest group of assets that generates cash inflows from continuing use that are largely independent of the cash inflows of other assets or group of assets (the “cash generating unit, or CGU”).
The Group's corporate assets do not generate separate cash inflows. If there is an indication that a corporate asset may be impaired, then the recoverable amount is determined for the CGU to which the corporate asset belongs. An impairment loss is recognized if the carrying amount of an asset or its CGU exceeds its estimated recoverable amount. Impairment losses are recognized in consolidated profit and loss account.
Impairment loss recognized in prior periods is assessed at each reporting date for any indications that the loss has decreased or no longer exists. An impairment loss is reversed if there has been a change in the estimates used to determine the recoverable amount. An impairment loss is reversed only to the extent that the asset's carrying amount does not exceed the carrying amount that would have been determined, net of depreciation or amortization, if no impairment loss had been recognized.
4.7 Staff benefits
The Group has the following plans for its employees:
4.7.1 Provident fund
The Group operates a funded recognized provident fund contribution plan which covers all permanent employees. Equal contributions are made on monthly basis both by the Group and the employees at 10% of basic pay.
4.7.2 Employees' share option scheme
The Group operates an equity settled share based Employees Stock Option Scheme. The compensation committee of the Board evaluates the performance and other criteria of employees and approves the grant of options. These options vest with employees over a specified period subject to fulfillment of certain conditions. Upon vesting, employees are eligible to apply and secure allotment of Holding Company's shares at a price determined on the date of grant of options.
The fair value of the grant of share options is measured at grant date and recognized as an employee compensation expense, with a corresponding increase in equity, on the straight line basis over the vesting period. The fair value of the options granted is measured at option discount i.e. excess of option price at date of grant of option under a scheme over exercise price of option.
When share options are exercised, the proceeds received, net of any transaction costs, are credited to share capital (nominal value) and share premium.
4.7.3 Gratuity
"Provision is made for TechVista (the ''Subsidiary'') employees' end of service benefits in accordancewith the UAE Federal labour laws."
4.8 Investments
Management determines the classification of its investments at the time of purchase depending on the purpose for which the investments are acquired and re-evaluates this classification at the end of each financial year. Investments intended to be held for less than twelve months from the consolidated balance sheet date or to be sold to raise operating capital are included in current assets, all other investments are classified as non-current.
Investments are either classified as financial assets at fair value through profit or loss, held-to-maturity investments, available-for-sale investments or investment in subsidiary and associated companies, as appropriate. When investments are recognized initially, they are measured at fair value, plus, in case of investments not at fair value through profit or loss, directly attributable transaction cost.
4.8.2 Investments at fair value through profit or loss
Investments that are acquired principally for the purpose of generating profit from short term fluctuations in price are classified as investments at fair value through profit or loss. Investments at fair value through profit or loss are initially recognized at cost (excluding transaction cost), being the fair value of the consideration given. Subsequent to initial recognition they are recognized at fair value unless fair value cannot be reliably measured. Any surplus or deficit on revaluation of investment is recognized in the consolidated profit or loss account.
All purchases and sale of investments are recognized on trade date, which is the date the Group commits to purchase, or sell the investment.
4.8.3 Investments held to maturity
These are investments with fixed pre determinable payment and fixed maturity. The Group has the positive intent and ability to hold till maturity. These are stated at amortized cost.
4.8.4 Foreign currency transactions and translation
Assets and liabilities in foreign currencies are translated into Rupees at the rate of exchange prevailing at the balance sheet date. Transactions during the year are converted into Rupees at the exchange rate prevailing at the date of such transaction. All exchange differences are charged to consolidated profit and loss account.
On consolidation, the assets and liabilities of foreign operations are translated into Pak Rupees at the rate of exchange prevailing at the reporting date and their profit and loss account are translated at average rates prevailing during the year. The exchange differences arising on translation for consolidation are recognized in consolidated other comprehensive income. On
Systems Limited | Annual Report 2015 099
www.systemsltd.com098

disposal of a foreign operation, the component of consolidated other comprehensive income relating to that particular foreign operation is recognized in consolidated profit and loss account.
4.9 Trade debts
Trade debts from local customers are stated at cost while foreign debtors are stated at revalued amount by applying exchange rate applicable on the balance sheet reporting date.
4.9.1 Provision for doubtful debts
The Group reviews its trade and other receivable on each balance sheet date to assess whether the provision should be recorded in the consolidated profit and loss account relating to doubtful receivable. Judgment by the management is made of the amount and timing of future cash flows while determining the extent of provision required. Such estimation involves the application of the Group's provision for doubtful debt policy including the assessment of credit history of the counter party. Actual cash flows may differ resulting in subsequent change in provisions.
4.10 Trade and other payables
Liabilities for trade and other accounts payable are carried at cost which is the fair value of the consideration to be paid in future for goods and services.
4.11 Provisions and contingencies
Provisions are recognized in the consolidated balance sheet when the Group has a legal or constructive obligation as a result of past events and it is probable that outflow of resources embodying economic benefits will be required to settle the obligation and a reliable estimate of the amount can be made. However, provisions are reviewed at each balance sheet date and adjusted to reflect current best estimate. Where outflow of resources embodying economic benefits is not probable, a contingent liability is disclosed, unless the possibility of outflow is remote.
4.12 Revenue recognition
4.12.1 Professional services
Revenue from professional / software services includes fixed price contracts and time and material contracts. Revenue from services performed under fixed price contracts is recognized in accordance with the percentage of completion method. Revenue from services performed under time and material contracts is recognized as services are provided.
4.12.2 License and license support services
Revenue from license contracts without major customization is recognized when the license agreement is signed, delivery of software has occurred, fee is fixed or determinable and collectability is probable. Revenue from license contracts with major modification, customization and development is recognized on percentage of completion method. Revenue from support services is recognized on time proportion basis.
4.12.3 Outsourcing services
Revenue from business process outsourcing services is recognized on completion of processing. Revenue from other outsourcing services is recognized as services are provided.
4.12.4 Consultancy
Revenue from provision of consultancy services is recognized as the work is performed.
4.12.5 Sale of third party software
Revenue from sale of third party software is recognized when delivery has occurred and invoices are raised to the customer.
4.13 Other income
Profit on deposit account and gain on short term investments is recognized on accrual basis. Miscellaneous income is recognized on receipt basis.
4.14 Financial instruments
4.14.1 Financial assets
Significant financial assets include trade debts, advances, long term deposits and cash and bank balances. Finances and receivables from clients are stated at their nominal value as reduced by provision for doubtful finances and receivable, while other financial assets are stated at cost.
4.14.2 Financial liabilities
Financial liabilities are classified according to the substance of the contractual arrangements entered into. Significant financial liabilities include short term ijarah rentals, musharika and morabaha finances, salam finances, accrued markup, trade and other payables and dividends payable. Markup based financial liabilities are recorded at gross proceeds received. Other liabilities are stated at their nominal value.
4.14.3 Recognition and derecognition
All the financial assets and financial liabilities are recognized at the time when the Group becomes party to the contractual provisions of the instrument. Financial assets are derecognized when the Group looses control of the contractual rights that comprise the financial assets. Financial liabilities are derecognized when they are extinguished i.e. when the obligation specified in the contract is discharged, cancelled or expires. Any gain or loss on derecognition of the financial assets and financial liabilities is taken to income currently.
4.14.4 Offsetting of financial assets and liabilities
A financial asset and a financial liability is offset and the net amount is reported in the consolidated balance sheet if the Group has legal enforceable right to set off the recognized amount and intends either to settle on a net basis or to realize the assets and settle the liability simultaneously.
4.15 Finance cost
Finance cost is charged to consolidated profit and loss account in the year in which it is incurred.
4.16 Cash and cash equivalents
Cash and cash equivalents are stated in the consolidated balance sheet at cost. For the purpose of the consolidated cash flow statement, cash and cash equivalents comprise of cash in hand, cheques/demand draft in hand and deposits in the bank.
4.17 Operating lease
Leases where a significant portion of the risks and rewards of ownership are retained by the lessor are classified as operating leases. Payments made under operating leases (net of any incentives received from the lessor) are charged to profit on a straight-line basis over the lease term unless another systematic basis is representative of the time pattern of the Group’s benefit.
4.18 Dividends and appropriation reserves
Dividends distribution to Group's shareholders is recognized as a liability in the period in which dividends are approved by Group's shareholders.
4.19 Earnings per share
The Group presents basic and diluted earnings per share (EPS). Basic EPS is calculated by dividing the profit after tax attributable to ordinary shareholders of the Group by the weighted average number of ordinary shares outstanding during the period. Diluted EPS is determined by adjusting profit and loss attributable to ordinary shareholders and the weighted-average number of ordinary shares outstanding, adjusted for the facts of all diluted potential ordinary shares.
Systems Limited | Annual Report 2015 101
www.systemsltd.com100
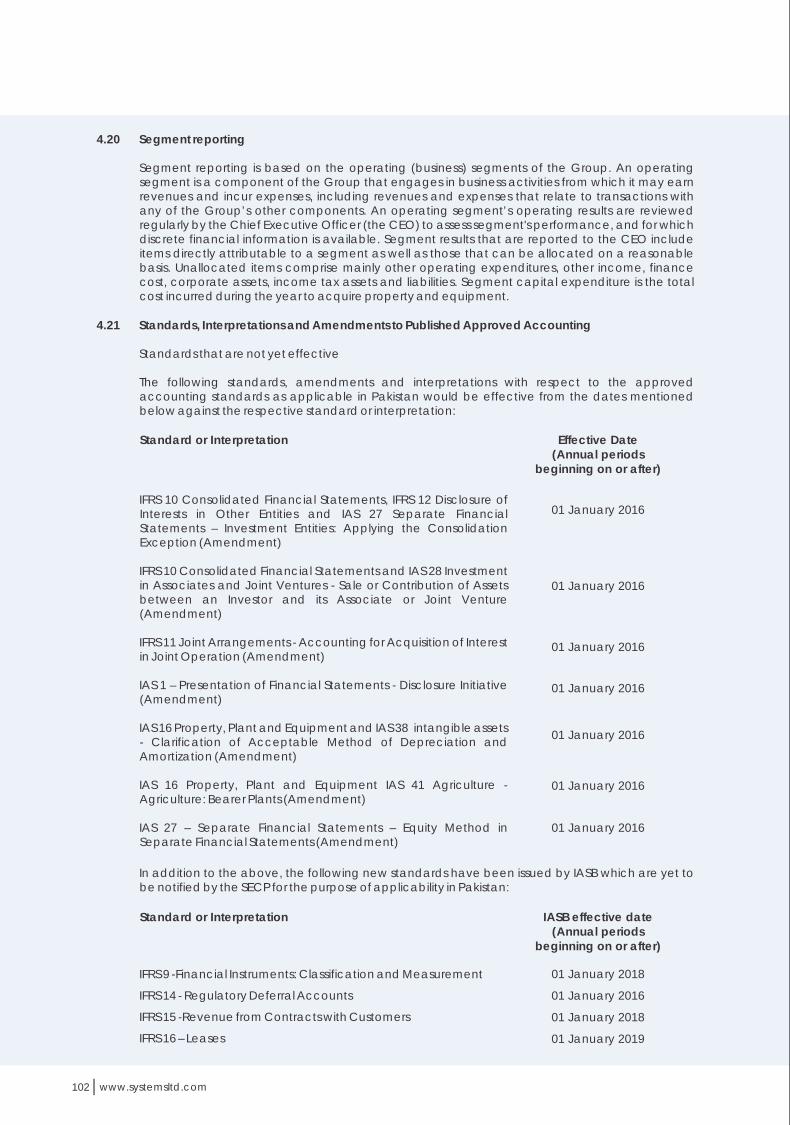
IASB effective date (Annual periods
beginning on or after)
4.20 Segment reporting
Segment reporting is based on the operating (business) segments of the Group. An operating segment is a component of the Group that engages in business activities from which it may earn revenues and incur expenses, including revenues and expenses that relate to transactions with any of the Group’s other components. An operating segment’s operating results are reviewed regularly by the Chief Executive Officer (the CEO) to assess segment's performance, and for which discrete financial information is available. Segment results that are reported to the CEO include items directly attributable to a segment as well as those that can be allocated on a reasonable basis. Unallocated items comprise mainly other operating expenditures, other income, finance cost, corporate assets, income tax assets and liabilities. Segment capital expenditure is the total cost incurred during the year to acquire property and equipment.
4.21 Standards, Interpretations and Amendments to Published Approved Accounting
Standards that are not yet effective
The following standards, amendments and interpretations with respect to the approved accounting standards as applicable in Pakistan would be effective from the dates mentioned below against the respective standard or interpretation:
Standard or Interpretation Effective Date(Annual periods
beginning on or after)
IFRS 10 Consolidated Financial Statements, IFRS 12 Disclosure of Interests in Other Entities and IAS 27 Separate Financial Statements – Investment Entities: Applying the Consolidation Exception (Amendment)
IFRS 10 Consolidated Financial Statements and IAS 28 Investment in Associates and Joint Ventures - Sale or Contribution of Assets between an Investor and its Associate or Joint Venture (Amendment)
IFRS 11 Joint Arrangements - Accounting for Acquisition of Interest in Joint Operation (Amendment)
IAS 1 – Presentation of Financial Statements - Disclosure Initiative (Amendment)
IAS 16 Property, Plant and Equipment and IAS 38 intangible assets - Clarification of Acceptable Method of Depreciation and Amortization (Amendment)
IAS 16 Property, Plant and Equipment IAS 41 Agriculture - Agriculture: Bearer Plants (Amendment)
IAS 27 – Separate Financial Statements – Equity Method in Separate Financial Statements (Amendment)
01 January 2016
01 January 2016
01 January 2016
01 January 2016
01 January 2016
01 January 2016
01 January 2016
In addition to the above, the following new standards have been issued by IASB which are yet to be notified by the SECP for the purpose of applicability in Pakistan:
Standard or Interpretation
IFRS 9 -Financial Instruments: Classification and Measurement
IFRS 14 - Regulatory Deferral Accounts
IFRS 15 -Revenue from Contracts with Customers
IFRS 16 – Leases
01 January 2018
01 January 2016
01 January 2018
01 January 2019
5.2 Capital work in progress
Advance to supplier 7,466,611
23,295,538
Land improvements 4,791,256
4,316,890
Building - freehold 154,551,958
12,059,511
5.2.1 166,809,825 39,671,939
5. PROPERTY AND EQUIPMENT
Operating fixed assets 5.1 195,893,473 163,735,721
Capital work in progress 5.2 166,809,825 39,671,939
362,703,298 203,407,660
2015NoteAmounts in rupees 2014
5.1 Operating fixed assets
Land - free hold
Computers
Computer equipment
and installations
Other equipment and installations
Generator
Furniture and fittings
Office equipment
Vehicles
Project assets
Mobile sets
Land - free hold
Computers
Computers equipment
and installations
Other equipment and installations
Generator
Furniture and fittings
Office equipment
Vehicles
Project assets
Mobile sets
40,990,412
119,382,975
23,170,831
19,707,506
12,412,469
47,318,856
9,836,720
39,054,607
3,737,526
1,512,859
317,124,761
-
41,097,839
7,993,467
2,319,145
4,976,993
3,135,032
1,649,834
13,788,587
795,200
1,184,470
76,940,567
-
422,500
-
75,600
-
-
-
12,708,316
-
40,000
13,246,416
-
-
-
-
-
-
-
-
-
-
-
40,990,412
160,058,314
31,164,298
21,951,051
17,389,462
50,453,888
11,486,554
40,134,878
4,532,726
2,657,329
380,818,912
-
75,829,508
18,770,316
12,777,065
8,541,795
35,063,253
5,214,412
10,231,871
3,712,084
440,798
170,581,102
-
27,806,291
3,942,557
2,694,560
1,370,901
4,333,934
1,477,661
9,138,419
374,209
619,574
51,758,106
-
161,650
-
-
-
-
-
5,082,267
-
12,100
5,256,017
-
-
-
-
-
-
-
-
-
-
-
-
103,474,149
22,712,873
15,471,625
9,912,696
39,397,187
6,692,073
14,288,023
4,086,293
1,048,272
217,083,191
40,990,412
56,584,165
8,451,425
6,479,426
7,476,766
11,056,701
4,794,481
25,846,855
446,433
1,609,057
163,735,721
-
33
33
20
20
20
20
25
Project life
33
2015
DESCRIPTION
Cost Depreciation
Amounts in rupees Amounts in rupees
2014
DESCRIPTION
Cost Depreciation
Cost
as at 01
January Additions Disposals
Exchange
differences
Cost
as at 31
December
Accumulated
depreciation
as at 01
January
Depreciation
charge Disposals
Exchange
differences
Accumulated
depreciation
as at 31
December
Net book
value
as at 31
December
Depreciation
rate
(% per
annum)
Amounts in rupees Amounts in rupees
40,990,412
160,058,314
31,164,298
21,951,051
17,389,462
50,453,888
11,486,554
40,134,878
4,532,726
2,657,329
380,818,912
Cost
as at 01
January
12,040,000
52,809,354
6,843,614
2,811,327
2,433,460
3,568,111
943,210
19,691,728
3,019,400
1,861,126
106,021,330
Additions
-
1,015,585
-
-
-
-
-
6,728,562
20,007
-
7,764,154
Disposals
-
334,344
(293,035)
-
-
1,630
628
-
-
-
43,567
Exchange
differences
53,030,412
212,186,427
37,714,877
24,762,378
19,822,922
54,023,629
12,430,392
53,098,044
7,532,119
4,518,455
479,119,655
Cost
as at 31
December
-
103,474,149
22,712,873
15,471,625
9,912,696
39,397,187
6,692,073
14,288,023
4,086,293
1,048,272
217,083,191
Accumulated
depreciation
as at 01
January
-
39,863,461
4,587,936
3,189,831
2,391,745
5,590,664
1,799,903
10,553,754
2,656,742
1,122,805
71,756,841
Depreciation
charge
-
956,776
-
-
-
-
-
4,652,819
20,007
-
5,629,602
Disposals
-
40,268
(27,942)
-
-
8,573
(5,147)
-
-
-
15,752
Exchange
differences
-
142,421,102
27,272,867
18,661,456
12,304,441
44,996,424
8,486,829
20,188,958
6,723,028
2,171,077
283,226,182
Accumulated
depreciation
as at 31
December
53,030,412
69,765,325
10,442,010
6,100,922
7,518,481
9,027,205
3,943,563
32,909,086
809,091
2,347,378
195,893,473
Net book
value
as at 31
December
-
33
33
20
20
20
20
25
Project life
33
Depreciation
rate
(% per
annum)
5.1.1 The cost of owned assets include assets amounting to Rs. 281.87 (2014: 151.68 ) million with nil book value.
2015NoteAmounts in rupees 2014
Systems Limited | Annual Report 2015 103
www.systemsltd.com102

6. INTANGIBLES
6.3 Amortization charge for the period has beenallocated as follows:
Cost of sales 23
Distribution cost 24
Administrative expenses 25
Research and development expenses 26
Computer software
15,135,993
29,860,235 83,233,400
Computer software 27,431,887 45,965,632 - 73,397,519 11,379,001 7,808,090 - 19,187,091 54,210,428 30%
30%44,158,965 113,093,63573,397,519 4,462,849 4,462,84919,187,091
RateParticularsAmortization
charge
for the period
Accumulated
Amortization as
at 31 December
Book value
as at
31 December
AdditionsCost as at 31
December
Cost as at 1
JanuaryDisposals Disposals
Accumulated
Amortization as
at 1 January
2015
Amounts in rupees
RateParticularsAmortization
charge
for the period
Accumulated
Amortization as
at 31 December
Book value
as at
31 December
AdditionsCost as at 31
December
Cost as at 1
JanuaryDisposals Disposals
Accumulated
Amortization as
at 1 January
2014
Amounts in rupees
6.1 The cost of the intangibles include intangible assets amounting to Rs. 9.98 million (2014: 5.34 million) with nil book value.
6.2 Additions include in-house developed intangibles amounting to Rs. 20.97 (2014: 26.05) million capitalized during the current year.
2015NoteAmounts in rupees 2014
12,732,828
239,289
1,889,566
274,310
15,135,993
6,707,439
94,367
982,874
23,410
7,808,090
7. DEFERRED TAXATION
Taxable temporary differences
Depreciation on property and equipment
Amortization on intangibles
Deductible temporary differences
Depreciation on property and equipment
Amortization on intangibles
Provision for doubtful debts
Minimum tax
Deferred tax asset
77,048
1,054,043
1,131,091
-
-
826,471
1,114,130
1,940,601
809,510
-
-
-
810,308
228,485
444,431
-
1,483,224
1,483,224
8. UNBILLED REVENUE
This represents work performed but not billed to the client. Revenue against this has been recognized on the basis of percentage of work done in accordance with IAS-18 "Revenue".
Particulars
of buyer
Mode of
disposalProfit
Sale
proceedsdown value
Written Accumulated
depreciationCostParticulars
Amounts in rupees
Particulars
of buyer
Mushtaq Patni
Laique Ahmed
Syed Aamir Turab Gillani
Adeel Edhi
Rauf Ahmed
Syed Umer Javed
Various
Asharaf Kapadia
Kashif Krimi
Usman Asif
Wali Muhammad Qadri
Tariq Gill
Muhammad Nasar Sabih
Muhammad Zahid Hussain
Warood Choudry
Nadeem Yusuf
Adnan Yaqoob
Various
Mode of
disposal
Group Policy
Group Policy
Group Policy
Group Policy
Group Policy
Group Policy
Negotiation
Group Policy
Group Policy
Group Policy
Group Policy
Group Policy
Group Policy
Group Policy
Group Policy
Group Policy
Group Policy
Negotiation
1,312,537
872,885
1,148,505
548,058
416,667
354,167
4,652,819
36,991
4,689,810
780,513
970,452
793,302
161,119
236,972
163,527
669,533
125,000
736,386
445,463
5,082,267
362,690
5,444,957
1,312,537
872,885
1,531,340
1,011,800
1,000,000
1,000,000
6,728,562
95,800
6,824,362
2,495,421
1,606,265
1,586,604
1,546,740
1,034,061
1,010,125
1,004,300
1,000,000
862,110
562,690
12,708,316
727,040
13,435,356
-
-
382,835
463,742
583,333
645,833
2,075,743
58,809
2,134,552
1,714,908
635,813
793,302
1,385,621
797,089
846,598
334,767
875,000
125,724
117,227
7,626,049
364,350
7,990,399
1,312,537
872,885
1,148,505
548,058
416,667
354,167
4,652,819
976,783
5,629,602
780,513
970,452
793,302
161,119
236,972
163,527
669,533
125,000
736,386
445,463
5,082,267
173,750
5,256,017
1,312,537
872,885
1,531,340
1,011,800
1,000,000
1,000,000
6,728,562
1,035,592
7,764,154
2,495,421
1,606,265
1,586,604
1,546,740
1,034,061
1,010,125
1,004,300
1,000,000
862,110
562,690
12,708,316
538,100
13,246,416
Profit
Sale
proceedsdown value
Written Accumulated
depreciationCost
Vehicles
Toyota Corolla
Suzuki Cultus
Toyota Corolla
Suzuki Cultus
Suzuki Swift
Suzuki Swift
Other
Miscellaneous
2015
Honda Civic
Toyota Corolla
Honda City
Honda City
Suzuki Cultus
Toyota Corolla
Suzuki Cultus
Honda City
Suzuki Cultus
Suzuki Mehran
Other
Miscellaneous
2014
Particulars
2015NoteAmounts in rupees 2014
5.2.1 This represents in progress construction ofthe Group's new office building.
5.2.2 The following is the movement in capital work-in-progress during the year:
Balance at the beginning of the year 39,671,939
35,530,031
Additions during the year 127,137,886 4,141,908
Balance at the end of the year 166,809,825 39,671,939
5.3 Depreciation charge for the year has beenallocated as follows:
Cost of sales 23 56,676,436 41,390,320
Distribution cost 24 2,116,795
1,142,255
Administrative expenses 25 11,957,575
9,104,230
Research and development expenses 26 1,006,035 121,301
71,756,841 51,758,106
5.4 Disposal of property and equipment
Amounts in rupees
Systems Limited | Annual Report 2015 105
www.systemsltd.com104

Considered good - unsecured
Export 9.1
Local
Considered doubtful - unsecured
Local
Less: Provision for doubtful debts 9.2
677,611,263
284,083,365
961,694,628
11,971,419
(11,971,419)
-
961,694,628
571,724,311
173,862,554
745,586,865
8,182,396
(8,182,396)
-
745,586,865
9.2 Balance as at 01 January
Provision made during the year
Less: provision reversed during the year
Net charge for the year 28
Less:
Bad debts written off
Balance as at 31 December
9.3 Aging analysis of the amounts due fromrelated parties is as follows:
Visionet Systems Incorporation - USA
Not past due
Past due but not impaired:
- Not more than three months
- More than three months but
not more than six months
8,182,396 11,971,419 (7,507,713) 4,463,706
(674,683)
11,971,419
494,968,822
57,796,623
- 552,765,445
8,948,300 3,606,674
- 3,606,674
(4,372,578)
8,182,396
115,695,106
194,438,234
185,060,656 495,193,996
9. TRADE DEBTS
2015NoteAmounts in rupees 2014
9.1 This includes receivable against sale of services from Visionet Systems Incorporation - USA amounting to Rs. 552.76 (2014: 495.19) million.
2015NoteAmounts in rupees 2014
10.
9,780,507 4,238,699
26,179,629
16,443,332
10.1 35,960,136
20,682,031
ADVANCES - considered good
Advances to staff:
against salary
against expenses
Advances to suppliers 36,917,427
7,043,902
72,877,563
27,725,933
10.1 It includes advances to executives amounting to Rs. 20.13 (2014: Rs. 13.77) million.
11. TRADE DEPOSITS AND SHORT TERM PREPAYMENTS
Security deposits 43,012,627
28,079,470
Prepayments 11.1 71,227,012
30,833,177
114,239,639
58,912,647
12. RECEIVABLE FROM RELATED PARTIES
Considered good - unsecured
Visionet Systems Incorporation - USA 12.1 11,536,311 2,150,066
13. TAX REFUNDS DUE FROM THE GOVERNMENT
14. SHORT TERM INVESTMENTS
Held to maturity
Habib Metropolitan Bank 300,000,000 Faysal Bank Limited 50,000,000 Bank Alfalah Limited 25,000,000 Meezan Bank limited 150,000,000
14.1 525,000,000 Investment at fair value through profit and loss
NAFA Fund units 275,938 (2014: 269,871) 30,204,644 Add: Unrealized gain on investments at
fair value through profit and loss 2,594,754 32,799,398
557,799,398
- - - - -
27,290,414
2,914,230 30,204,644 30,204,644
2015NoteAmounts in rupees 2014
11.1 This includes prepaid IPO expenditures of Rs. Nil (2014: 18.48) million which mainly includes listing fees of Pakistan Stock Exchange (formerly Karachi, Lahore and Islamabad stock exchange), underwriting commission and consulting fees.
2015NoteAmounts in rupees 2014
12.1 This represents amount receivable against expenses incurred on behalf of Visionet Systems Incorporation and are payable on demand by the related party. These receivables are unsecured and interest free.
2015NoteAmounts in rupees 2014
Balance as at 01 January
Income tax paid during the year
Provision for the year 30
Balance as at 31 December
27,467,230
39,994,036
(12,317,310)
55,143,956
3,465,939
30,761,689
(6,760,398)
27,467,230
14.1 These are Term Deposit Receipts (TDRs) carrying markup at rates ranging from 6% to 8.75% (2014: 7% to 8.50% ) per annum.
Systems Limited | Annual Report 2015 107
www.systemsltd.com106

Considered good - unsecured
Export 9.1
Local
Considered doubtful - unsecured
Local
Less: Provision for doubtful debts 9.2
677,611,263
284,083,365
961,694,628
11,971,419
(11,971,419)
-
961,694,628
571,724,311
173,862,554
745,586,865
8,182,396
(8,182,396)
-
745,586,865
9.2 Balance as at 01 January
Provision made during the year
Less: provision reversed during the year
Net charge for the year 28
Less:
Bad debts written off
Balance as at 31 December
9.3 Aging analysis of the amounts due fromrelated parties is as follows:
Visionet Systems Incorporation - USA
Not past due
Past due but not impaired:
- Not more than three months
- More than three months but
not more than six months
8,182,396 11,971,419 (7,507,713) 4,463,706
(674,683)
11,971,419
494,968,822
57,796,623
- 552,765,445
8,948,300 3,606,674
- 3,606,674
(4,372,578)
8,182,396
115,695,106
194,438,234
185,060,656 495,193,996
9. TRADE DEBTS
2015NoteAmounts in rupees 2014
9.1 This includes receivable against sale of services from Visionet Systems Incorporation - USA amounting to Rs. 552.76 (2014: 495.19) million.
2015NoteAmounts in rupees 2014
10.
9,780,507 4,238,699
26,179,629
16,443,332
10.1 35,960,136
20,682,031
ADVANCES - considered good
Advances to staff:
against salary
against expenses
Advances to suppliers 36,917,427
7,043,902
72,877,563
27,725,933
10.1 It includes advances to executives amounting to Rs. 20.13 (2014: Rs. 13.77) million.
11. TRADE DEPOSITS AND SHORT TERM PREPAYMENTS
Security deposits 43,012,627
28,079,470
Prepayments 11.1 71,227,012
30,833,177
114,239,639
58,912,647
12. RECEIVABLE FROM RELATED PARTIES
Considered good - unsecured
Visionet Systems Incorporation - USA 12.1 11,536,311 2,150,066
13. TAX REFUNDS DUE FROM THE GOVERNMENT
14. SHORT TERM INVESTMENTS
Held to maturity
Habib Metropolitan Bank 300,000,000 Faysal Bank Limited 50,000,000 Bank Alfalah Limited 25,000,000 Meezan Bank limited 150,000,000
14.1 525,000,000 Investment at fair value through profit and loss
NAFA Fund units 275,938 (2014: 269,871) 30,204,644 Add: Unrealized gain on investments at
fair value through profit and loss 2,594,754 32,799,398
557,799,398
- - - - -
27,290,414
2,914,230 30,204,644 30,204,644
2015NoteAmounts in rupees 2014
11.1 This includes prepaid IPO expenditures of Rs. Nil (2014: 18.48) million which mainly includes listing fees of Pakistan Stock Exchange (formerly Karachi, Lahore and Islamabad stock exchange), underwriting commission and consulting fees.
2015NoteAmounts in rupees 2014
12.1 This represents amount receivable against expenses incurred on behalf of Visionet Systems Incorporation and are payable on demand by the related party. These receivables are unsecured and interest free.
2015NoteAmounts in rupees 2014
Balance as at 01 January
Income tax paid during the year
Provision for the year 30
Balance as at 31 December
27,467,230
39,994,036
(12,317,310)
55,143,956
3,465,939
30,761,689
(6,760,398)
27,467,230
14.1 These are Term Deposit Receipts (TDRs) carrying markup at rates ranging from 6% to 8.75% (2014: 7% to 8.50% ) per annum.
Systems Limited | Annual Report 2015 107
www.systemsltd.com106

2015NoteAmounts in rupees 2014
15. CASH AND BANK BALANCES
Cash in hand 92,408
76,861
Cash at bank:
Local currency:
Current accounts 15.1 42,604,487
699,353,085
Saving accounts 15.2 150,147,397
283,423,583
192,751,884
982,776,668
Foreign currency 749,564
4,239,269
193,593,856
987,092,798
15.1 This includes amount of subscription money aggregating to Rs. Nil (2014: 687.63) million received from high net worth individuals, institutional investors and general public against the shares offered through IPO out of which Rs. 167.63 (2014: Nil) million have been refunded to unsuccessful applicants during the year.
15.2 These carry markup at the rate of 6.5% to 8.5% (2014: 7.5% to 9.5%) per annum. Moreover, these include Rs. Nil (2014: 184.99) million in KASB Bank which the Group is unable to withdraw due to imposition of moratorium by Federal Government on application of State Bank of Pakistan for a period of six months effective from 17 November 2014.
16.1 Reconciliation of ordinary shares
87,165,302
42,937,507
13,000,000
-
453,676
645,144
10,061,898 43,582,651
110,680,876 87,165,302
871,653,020
130,000,000
4,536,760
100,618,980
1,106,808,760
429,375,070
-
6,451,440
435,826,510
871,653,020
Shares issued through Initial
Public Offering
Bonus shares issued during
the year
Balance at 31 December
Stock options exercised
Balance at 1 January
16. ISSUED, SUBSCRIBED AND PAID-UP CAPITAL
21,829,311
8,375,635
218,293,110
83,756,350
88,851,565
78,789,667
888,515,650
787,896,670
110,680,876 87,165,302 1,106,808,760 871,653,020
Ordinary shares of Rs. 10/-
fully paid in cash
Ordinary shares of Rs. 10/-
each fully paid up as bonus
shares
2015 2014 2015 2014
Amounts in rupeesNumber os shares
2015 2014 2015 2014
Amounts in rupeesNumber os shares
17. RESERVES - capital
Share premium reserve 17.1 411,302,586 39,119,784
Deferred employee compensation reserve 17.2 9,255,467 4,367
Translation reserve on foreign operations 33,082 83,943
420,591,135 39,208,094
Outstanding at 1 January
Granted during the year
Exercised during the year
Outstanding at 31 December
19. TRADE AND OTHER PAYABLES
Creditors
13,385,653 Advance from customers
26,969,004
Accrued liabilities 148,678,767
28,926,148 Provision for Worker's Welfare Fund (WWF) 21.3
17,930,514
Payable to unsuccessful applicants - IPO
167,628,000 Provident fund payable
7,200,376
Withholding income tax payable
485,923 Sales tax payable
10,711,727
Other payables
123,918 262,879,897
40,230,374 19,484,724
17,930,514 -
11,607,008 7,328,925 16,982,767
636,818
273,361,263
2015NoteAmounts in rupees 2014
17.1 This reserve shall be utilized only for the purpose as specified in section 83(2) of the Companies Ordinance, 1984.
17.2 This represents balance amount after exercise of share options by the employees under the Employee Stock Option Scheme approved by SECP. According to the scheme, 100% options become exercisable after completion of vesting period from date of grant. The options have a vesting period of 2 years and an exercise period of 3 years from the date the option is vested.
17.3 The following table illustrates the number and weighted average exercise prices of, and movements in, share options during the year:
25.59
25.45
15.95
23.50
884,561
811,500
(453,676)
1,242,385
21.83
40.83
21.83
25.59
1,098,820
430,885
(645,144)
884,561
20142015
Weighted
average
exercise
price
Rupees
Number of
options
Number Rupees
Weighted
average
exercise price
Number of
options
Number Amounts in rupees
18. LONG TERM ADVANCES
This represents advances received from staff and will be adjusted as per Group's car policy against sale of vehicles.
2015NoteAmounts in rupees 2014
20. UNEARNED REVENUE
It represents license, maintenance and services fee received in advance. The license and services fee are transferred to revenue on work done basis where as maintenance is transferred to revenue on time proportion basis.
Systems Limited | Annual Report 2015 109
www.systemsltd.com108

2015NoteAmounts in rupees 2014
15. CASH AND BANK BALANCES
Cash in hand 92,408
76,861
Cash at bank:
Local currency:
Current accounts 15.1 42,604,487
699,353,085
Saving accounts 15.2 150,147,397
283,423,583
192,751,884
982,776,668
Foreign currency 749,564
4,239,269
193,593,856
987,092,798
15.1 This includes amount of subscription money aggregating to Rs. Nil (2014: 687.63) million received from high net worth individuals, institutional investors and general public against the shares offered through IPO out of which Rs. 167.63 (2014: Nil) million have been refunded to unsuccessful applicants during the year.
15.2 These carry markup at the rate of 6.5% to 8.5% (2014: 7.5% to 9.5%) per annum. Moreover, these include Rs. Nil (2014: 184.99) million in KASB Bank which the Group is unable to withdraw due to imposition of moratorium by Federal Government on application of State Bank of Pakistan for a period of six months effective from 17 November 2014.
16.1 Reconciliation of ordinary shares
87,165,302
42,937,507
13,000,000
-
453,676
645,144
10,061,898 43,582,651
110,680,876 87,165,302
871,653,020
130,000,000
4,536,760
100,618,980
1,106,808,760
429,375,070
-
6,451,440
435,826,510
871,653,020
Shares issued through Initial
Public Offering
Bonus shares issued during
the year
Balance at 31 December
Stock options exercised
Balance at 1 January
16. ISSUED, SUBSCRIBED AND PAID-UP CAPITAL
21,829,311
8,375,635
218,293,110
83,756,350
88,851,565
78,789,667
888,515,650
787,896,670
110,680,876 87,165,302 1,106,808,760 871,653,020
Ordinary shares of Rs. 10/-
fully paid in cash
Ordinary shares of Rs. 10/-
each fully paid up as bonus
shares
2015 2014 2015 2014
Amounts in rupeesNumber os shares
2015 2014 2015 2014
Amounts in rupeesNumber os shares
17. RESERVES - capital
Share premium reserve 17.1 411,302,586 39,119,784
Deferred employee compensation reserve 17.2 9,255,467 4,367
Translation reserve on foreign operations 33,082 83,943
420,591,135 39,208,094
Outstanding at 1 January
Granted during the year
Exercised during the year
Outstanding at 31 December
19. TRADE AND OTHER PAYABLES
Creditors
13,385,653 Advance from customers
26,969,004
Accrued liabilities 148,678,767
28,926,148 Provision for Worker's Welfare Fund (WWF) 21.3
17,930,514
Payable to unsuccessful applicants - IPO
167,628,000 Provident fund payable
7,200,376
Withholding income tax payable
485,923 Sales tax payable
10,711,727
Other payables
123,918 262,879,897
40,230,374 19,484,724
17,930,514 -
11,607,008 7,328,925 16,982,767
636,818
273,361,263
2015NoteAmounts in rupees 2014
17.1 This reserve shall be utilized only for the purpose as specified in section 83(2) of the Companies Ordinance, 1984.
17.2 This represents balance amount after exercise of share options by the employees under the Employee Stock Option Scheme approved by SECP. According to the scheme, 100% options become exercisable after completion of vesting period from date of grant. The options have a vesting period of 2 years and an exercise period of 3 years from the date the option is vested.
17.3 The following table illustrates the number and weighted average exercise prices of, and movements in, share options during the year:
25.59
25.45
15.95
23.50
884,561
811,500
(453,676)
1,242,385
21.83
40.83
21.83
25.59
1,098,820
430,885
(645,144)
884,561
20142015
Weighted
average
exercise
price
Rupees
Number of
options
Number Rupees
Weighted
average
exercise price
Number of
options
Number Amounts in rupees
18. LONG TERM ADVANCES
This represents advances received from staff and will be adjusted as per Group's car policy against sale of vehicles.
2015NoteAmounts in rupees 2014
20. UNEARNED REVENUE
It represents license, maintenance and services fee received in advance. The license and services fee are transferred to revenue on work done basis where as maintenance is transferred to revenue on time proportion basis.
Systems Limited | Annual Report 2015 109
www.systemsltd.com108

23. COST OF SALES
Salaries, allowances and amenities 23.1
E - link connectivity charges
Air time consumed
Printing and stationery
Computer supplies
Rent, rates and taxes
Electricity, gas and water
Traveling and conveyance
Repair and maintenance
Postage, telephone and telegrams
Vehicle running and maintenance
Entertainment
Third party consultancy
Trade margin
Fee and subscriptions
Insurance
Provision for impairment
Depreciation 5.3
Amortization 6.3
Others
Purchase of software for trading
1,198,802,967
2,927,163
-
2,166,640
7,692,833
66,287,832
47,767,645
97,485,016
15,932,005
42,261,124
6,223,802
3,853,247
13,622,739
506,334
11,470,870
3,349,973
-
56,676,436
12,732,828
135,380
1,589,894,834
80,029,388
1,669,924,222
798,084,596
1,106,333
48,962
1,301,183
4,733,590
56,645,263
44,002,788
66,210,274
9,275,826
28,776,021
3,117,248
1,743,385
-
93,619
19,522,332
1,269,270
694,757
41,390,320
6,707,439
-
1,084,723,206
161,133,928
1,245,857,134
24. DISTRIBUTION COST
Salaries, allowances and amenities 24.1 49,570,724 43,114,142
Printing and stationery 573,504 501,671
Computer supplies 585,298 443,725
Rent, rates and taxes 1,422,489 949,317
Electricity, gas and water 987,607 642,831
Traveling and conveyance 9,517,264 9,917,335 Repair and maintenance 429,591 137,925 Postage, telephone and telegrams 1,127,686 1,195,417 Vehicle running and maintenance 860,058 1,022,986 Entertainment 767,744 101,603 Insurance 213,788 118,534 Fee and subscriptions/Training 442,498 238,963 Shows/Seminars/Advertising 3,799,628 2,310,842 Depreciation 5.3 2,116,795 1,142,255 Amortization 6.3 239,289 94,367 Tender documents 124,529 136,863
72,778,492 62,068,776
2015NoteAmounts in rupees 2014
23.1 This includes employees retirement benefit expense amounting to Rs. 44.29 (2014: Rs. 30.22) million.
2015NoteAmounts in rupees 2014
24.1 This includes employees retirement benefit expense amounting to Rs. 1.74 (2014: Rs. 1.49) million.
Systems Limited | Annual Report 2015 111
www.systemsltd.com110
21. CONTINGENCIES AND COMMITMENTS
Commitments
Contingencies
21.1 Guarantees issued by the financial institutions on behalf of the Group amount to Rs. 129.12 million (2014: Rs. 63.05 million).
21.2 Commitments include capital commitments for construction of building of the Group amounting to Rs. 344 million (2014: 225.43 million) out of which Rs. 115.02 million have been invoiced.
21.3 During the current period as well as last year, the Group has not charged Workers' Welfare Fund (WWF) under WWF Ordinance, 1971 amounting to Rs. 9.3 (2014: Rs. 8.9) million respectively, as the amendments made through Finance Act 2006 and 2008 relating to scope and applicability of the same has been declared unconstitutional by the Honorable Lahore High Court through its judgment number 2011 PLD 2643. The matter is pending before the Honorable Supreme Court of Pakistan. However, management is confident that the decision of the Lahore High Court shall prevail, accordingly no provision has been made by the Group during the year in this regard.
21.4 The Deputy Commissioner Inland Revenue has issued withholding tax assessment orders u/s 161/205 of the Income Tax Ordinance 2001 (the Ordinance) for the tax year 2010 and 2012 whereby tax amounting to Rs. 779,513 and Rs. 13,540,966 respectively has been levied. The Holding Company preferred appeals against the orders which are pending adjudications.
21.5 The Holding Company filed an undertaking pursuant to Income Tax (Second Amendment) Ordinance, 2015, thereby opting out of minimum tax on services under section 153(1)(b) of the Ordinance. The Assistant Commissioner, Inland Revenue has declined the undertaking against which the Company has filed an appeal before Commissioner Inland Revenue (Appeals) which is pending adjudication, which might result in tax liability of Rs. 30.25 million.
21.6 The Holding Company has filed appeals before the Commissioner lnland Revenue (Appeals) against the orders passed under section 122(5A) of the Ordinance by the Additional Commissioner Inland Revenue for payment of additional amount Rs. 10.6 million and Rs. 9 million in respect of tax years 2010 and 2011 respectively. The appeals filed by the Holding Company are pending adjudications.
Pending adjudication of the above matters, the tax consultants and management of the Company expect favorable outcome of the appeals and anticipate no outflow of economic benefits.
22. REVENUE - net
Development and other services:
Export
Local
Less: Sales tax on local sales 22.1
Trading income:
Software sale - export
Software sale - local
Less: Sales tax on local sales 22.1
1,928,771,475
485,600,726
(52,288,117)
433,312,609
37,469,733
99,132,144
(27,960,298)
71,171,846
2,470,725,663
1,419,780,765
324,836,908
(26,944,437)
297,892,561
87,323,353
138,330,879
(20,615,998)
117,714,881
1,922,711,560
22.1 This represents sales tax chargeable under Provincial and Federal Sales tax laws.
2015NoteAmounts in rupees 2014

2015NoteAmounts in rupees 2014
25. ADMINISTRATIVE EXPENSES
Salaries, allowances and amenities 25.1
Printing and stationery
Computer supplies
Rent, rates and taxes
Electricity, gas and water
Traveling and conveyance
Repair and maintenance
Postage, telephone and telegrams Vehicle running and maintenance Legal and professional Auditors' remuneration 25.2 Entertainment Donations 25.3 Fee and subscriptions/Training Insurance Hiring cost Newspapers, books and periodicals Depreciation 5.3 Amortization 6.3
Others
236,905,632
4,176,134 4,346,320 6,299,507 6,355,570
19,235,891 8,045,933 9,828,424 2,573,171 18,673,814
1,400,000 1,765,769 38,500
5,659,214 669,178
1,139,699 74,498
11,957,575 1,889,566
1,261,191
342,295,586
141,144,432
1,041,747
3,343,601
7,580,772
7,125,624
8,663,615
5,207,364
5,027,783 2,406,366 4,031,141 1,716,025 1,952,029 684,000
5,183,544 670,143
- 374,816
9,104,230 982,874
407,247
206,647,353
25.1 This includes employees retirement benefit expense amounting to Rs. 7.19 (2014: Rs. 5.5) million.
25.2 Auditors' remuneration
Statutory audit fee 900,000
Half yearly and quarterly audits 100,000
Half yearly review 400,000
1,400,000
25.3 The Directors or their spouses have no interest in the Donee's fund.
906,025
810,000
-
1,716,025
EY KPMG
2015Amounts in rupees 2014
26. RESEARCH AND DEVELOPMENT EXPENSES
Salaries, allowances and amenities 26.1 23,577,929
1,587,833
Computer supplies 387,222
115,132
Printing and stationery 15,197
-
Rent, rates and taxes 931,443
179,196
Electricity, gas and water 529,755
103,482
Traveling and conveyance 1,232,344
111,138
Repair and maintenance 359,884
41,237
Postage, telephone and telegrams 567,230
86,966
Vehicle running and maintenance 118,189
25,539
Entertainment 86,080
-
Fee and subscriptions/Training 94,312
24,165
Insurance 22,054 10,019
Depreciation 5.3 1,006,035 121,301
Amortization 6.3 274,310 23,410
29,201,984
2,429,418
26.1 This includes employees retirement benefit expense amounting to Rs. 0.77 (2014: Rs. 0.02) million.
27. OTHER INCOME
Income from financial assets:
Profit on deposit accounts 11,558,797
Gain on short term investments 43,730,505
Exchange gain on translation of export debts 25,061,317
80,350,619
Income from non-financial assets:
Gain on disposal of property and equipment 4,689,810
Others 3,466,497
8,156,307
88,506,926
15,920,632
13,972,179
-
29,892,811
5,444,957
4,969
5,449,926
35,342,737
28. OTHER OPERATING EXPENSES
Provision for doubtful debts Bad debts - direct written off Exchange loss on translation of export debts
4,463,706 19,262,903
- 23,726,609
3,606,674 -
21,650,799 25,257,473
29. FINANCE COST
Markup on guarantee commission 380,512 403,591
Bank charges and commission 2,685,353 3,592,373
3,065,865 3,995,964
2015NoteAmounts in rupees 2014
2015NoteAmounts in rupees 2014
Systems Limited | Annual Report 2015 113
www.systemsltd.com112

2015NoteAmounts in rupees 2014
25. ADMINISTRATIVE EXPENSES
Salaries, allowances and amenities 25.1
Printing and stationery
Computer supplies
Rent, rates and taxes
Electricity, gas and water
Traveling and conveyance
Repair and maintenance
Postage, telephone and telegrams Vehicle running and maintenance Legal and professional Auditors' remuneration 25.2 Entertainment Donations 25.3 Fee and subscriptions/Training Insurance Hiring cost Newspapers, books and periodicals Depreciation 5.3 Amortization 6.3
Others
236,905,632
4,176,134 4,346,320 6,299,507 6,355,570
19,235,891 8,045,933 9,828,424 2,573,171 18,673,814
1,400,000 1,765,769 38,500
5,659,214 669,178
1,139,699 74,498
11,957,575 1,889,566
1,261,191
342,295,586
141,144,432
1,041,747
3,343,601
7,580,772
7,125,624
8,663,615
5,207,364
5,027,783 2,406,366 4,031,141 1,716,025 1,952,029 684,000
5,183,544 670,143
- 374,816
9,104,230 982,874
407,247
206,647,353
25.1 This includes employees retirement benefit expense amounting to Rs. 7.19 (2014: Rs. 5.5) million.
25.2 Auditors' remuneration
Statutory audit fee 900,000
Half yearly and quarterly audits 100,000
Half yearly review 400,000
1,400,000
25.3 The Directors or their spouses have no interest in the Donee's fund.
906,025
810,000
-
1,716,025
EY KPMG
2015Amounts in rupees 2014
26. RESEARCH AND DEVELOPMENT EXPENSES
Salaries, allowances and amenities 26.1 23,577,929
1,587,833
Computer supplies 387,222
115,132
Printing and stationery 15,197
-
Rent, rates and taxes 931,443
179,196
Electricity, gas and water 529,755
103,482
Traveling and conveyance 1,232,344
111,138
Repair and maintenance 359,884
41,237
Postage, telephone and telegrams 567,230
86,966
Vehicle running and maintenance 118,189
25,539
Entertainment 86,080
-
Fee and subscriptions/Training 94,312
24,165
Insurance 22,054 10,019
Depreciation 5.3 1,006,035 121,301
Amortization 6.3 274,310 23,410
29,201,984
2,429,418
26.1 This includes employees retirement benefit expense amounting to Rs. 0.77 (2014: Rs. 0.02) million.
27. OTHER INCOME
Income from financial assets:
Profit on deposit accounts 11,558,797
Gain on short term investments 43,730,505
Exchange gain on translation of export debts 25,061,317
80,350,619
Income from non-financial assets:
Gain on disposal of property and equipment 4,689,810
Others 3,466,497
8,156,307
88,506,926
15,920,632
13,972,179
-
29,892,811
5,444,957
4,969
5,449,926
35,342,737
28. OTHER OPERATING EXPENSES
Provision for doubtful debts Bad debts - direct written off Exchange loss on translation of export debts
4,463,706 19,262,903
- 23,726,609
3,606,674 -
21,650,799 25,257,473
29. FINANCE COST
Markup on guarantee commission 380,512 403,591
Bank charges and commission 2,685,353 3,592,373
3,065,865 3,995,964
2015NoteAmounts in rupees 2014
2015NoteAmounts in rupees 2014
Systems Limited | Annual Report 2015 113
www.systemsltd.com112
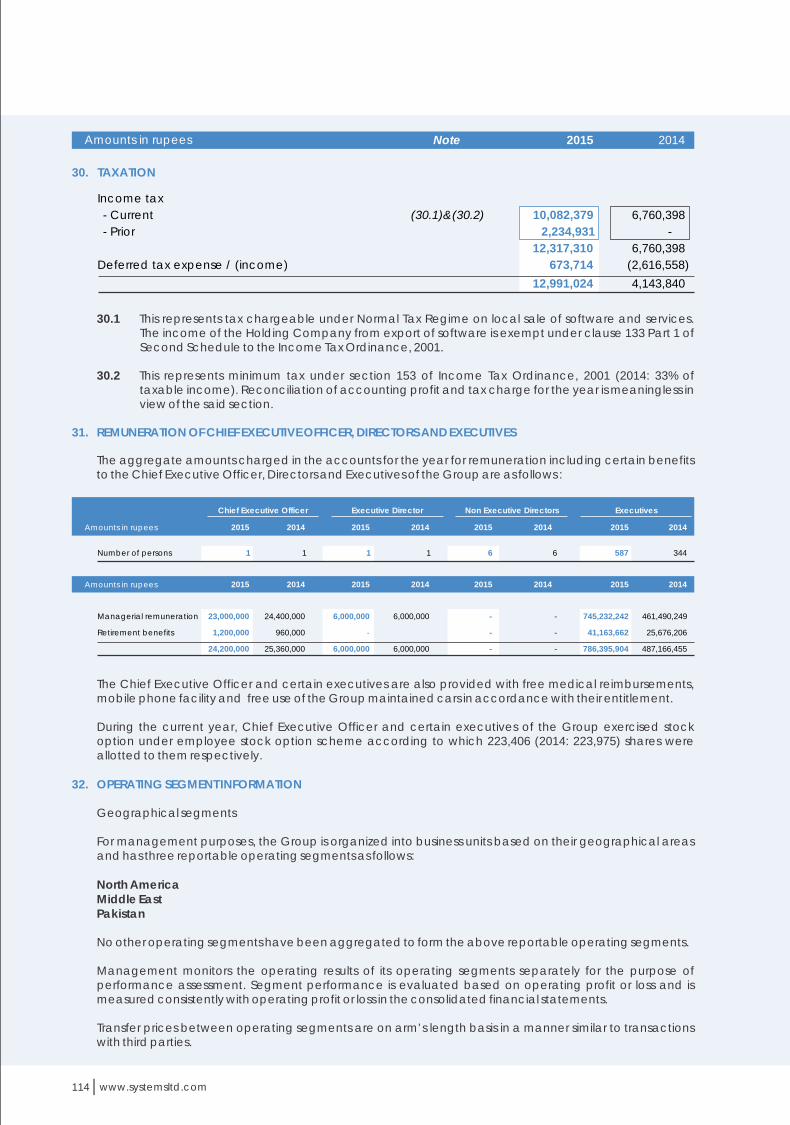
30. TAXATION
Income tax
- Current (30.1)&(30.2) 10,082,379
- Prior 2,234,931
12,317,310
Deferred tax expense / (income) 673,714
12,991,024
6,760,398
-
6,760,398
(2,616,558)
4,143,840
2015NoteAmounts in rupees 2014
30.1 This represents tax chargeable under Normal Tax Regime on local sale of software and services. The income of the Holding Company from export of software is exempt under clause 133 Part 1 of Second Schedule to the Income Tax Ordinance, 2001.
30.2 This represents minimum tax under section 153 of Income Tax Ordinance, 2001 (2014: 33% of taxable income). Reconciliation of accounting profit and tax charge for the year is meaningless in view of the said section.
The aggregate amounts charged in the accounts for the year for remuneration including certain benefits to the Chief Executive Officer, Directors and Executives of the Group are as follows :
31. REMUNERATION OF CHIEF EXECUTIVE OFFICER, DIRECTORS AND EXECUTIVES
2015 2014
Number of persons 1 1 1 1 6 587 344
20142015
6
Chief Executive Officer Non Executive Directors ExecutivesExecutive Director
2014201520142015Amounts in rupees
Managerial remuneration 23,000,000 24,400,000 6,000,000 6,000,000 - 745,232,242 461,490,249
Retirement benefits 1,200,000 960,000 - - 41,163,662 25,676,206
24,200,000 25,360,000 6,000,000 6,000,000
-
-
- - 786,395,904 487,166,455
2015 2014201420152014201520142015Amounts in rupees
The Chief Executive Officer and certain executives are also provided with free medical reimbursements, mobile phone facility and free use of the Group maintained cars in accordance with their entitlement.
During the current year, Chief Executive Officer and certain executives of the Group exercised stock option under employee stock option scheme according to which 223,406 (2014: 223,975) shares were allotted to them respectively.
Geographical segments
For management purposes, the Group is organized into business units based on their geographical areas and has three reportable operating segments as follows:
North AmericaMiddle EastPakistan
No other operating segments have been aggregated to form the above reportable operating segments.
Management monitors the operating results of its operating segments separately for the purpose of performance assessment. Segment performance is evaluated based on operating profit or loss and is measured consistently with operating profit or loss in the consolidated financial statements.
Transfer prices between operating segments are on arm’s length basis in a manner similar to transactions with third parties.
32. OPERATING SEGMENT INFORMATION
Unallocated income and expenses:
Other operating expenses
Other income
Finance cost
Profit before taxation
Taxation
Profit for the year
(23,726,609)
88,506,926
(3,065,865)
61,714,452
418,239,831
(12,991,024)
405,248,807
(25,257,473)
35,342,737
(3,995,964)
6,089,300
411,798,179
(4,143,840)
407,654,339
32.1 Inter segment sales and purchases have been eliminated.
2015 2014
Sales 386,747,450 - 2,470,725,663 1,922,711,560
Cost of sales 306,404,879 - 1,669,924,222 1,245,857,134
Gross profit 80,342,571 - 800,801,441 676,854,426
Distribution cost 25,494,780 - 72,778,492 62,068,776
R & D 951,266 - 29,201,984 2,429,418
Administrative expenses 33,534,001 - 342,295,586 206,647,353
59,980,047 - 444,276,062 271,145,547
Profit / (loss) before taxation and
unallocated income and expenses
1,429,263,768
805,465,436
623,798,332
-
7,140,212
168,964,471
176,104,683
447,693,649
1,121,196,014
614,972,794
506,223,220
-
26,900
119,762,879
119,789,779
386,433,441
738,449,747
686,327,274
52,122,473
18,647,821
9,802,475
116,854,584
145,304,880
(93,182,407) 20,362,524
504,484,454
407,359,826
97,124,628
54,130,671
12,259,297
56,476,531
122,866,499
(25,741,871)
414,768,096
324,479,461
90,288,635
36,573,996
1,451,252
53,350,473
91,375,721
(1,087,086)
(201,472,306)
(229,228,314)
27,756,008
-
-
-
-
27,756,008 - 356,525,379 405,708,879
North America Middle East Pakistan TotalInter segment eliminations
2015 20142015 20142015 20142015 2014
2015Amounts in rupees 2014
32.2 Allocation of assets and liabilities
32.3 All assets and liabilities of the North America segment have been allocated to Pakistan segment.
2015 2014
Segment operating assets
Property and equipment - - 360,653,515 362,703,298 203,407,660
Intangibles - - 83,233,400 83,233,400 54,210,428
Long term deposits - - 11,901,100 11,901,100 14,346,357
Long term investments - - 51,077,980 - -
Deferred taxation - - 809,510 809,510 1,483,224
Unbilled revenue - - 244,214,338 369,960,316 252,055,058
Trade debts - - 1,098,592,746 961,694,628 745,586,865
Advances - - 68,055,610 72,877,563 27,725,933
Trade deposits -
and short term prepayments - - 48,207,115 114,239,639 58,912,647
Interest accrued - - 12,585,928 5,058,561 -
Receivable from related parties - - 164,572,856 11,536,311 2,150,066
Tax refunds due from government - - 55,143,956 55,143,956 27,467,230
Short term investments - - 557,799,398 557,799,398 30,204,644
Cash and bank balances - - 145,528,020 193,593,856 987,092,798
Total operating assets - - 2,902,375,472 2,800,551,536 2,404,642,910
Segment operating liabilities
Long term advances - - 7,652,045 7,652,045 6,766,611
Long term financing - - 21,605,357 - -
Amounts due to related party - - - - -
Trade and other payables - - 239,323,966 262,879,897 273,361,263
Provision for gratuity - - - 1,616,973 1,616,973
Markup on long term financing - - 7,527,367 - -
Unearned revenue - - 109,811,070 109,811,070 6,447,492
Current portion of long term advances - - 5,017,350 5,017,350 3,391,885
Total operating liabilities - - 390,937,155 386,977,335 291,584,224
Other disclosures
Capital expenditure - -
2,049,783
-
-
-
-
125,745,978
85,019,129
4,821,953
66,032,524
-
-
-
-
48,065,836
331,735,203
-
-
353,348,435
23,555,931
1,616,973
-
-
-
378,521,339
2,050,610
567,284
-
-
-
-
55,202,528
27,084,622
2,456,557
8,125,236
-
-
-
-
3,519,803
96,956,030
-
-
104,964,670
2,907,229
1,616,973
-
-
-
109,488,872
225,994 147,364,096
202,840,376
54,210,428
14,346,357
2,077,980
1,483,224
196,852,530
817,852,130
25,269,376
50,787,411
3,164,738
47,728,753
27,467,230
30,204,644
983,572,995
2,457,858,172
6,766,611
40,036,747
-
270,454,034
-
3,164,738
6,447,492
3,391,885
330,261,507
123,482,751
-
-
-
(51,077,980)
-
-
(221,917,247)
-
-
(7,527,367)
(153,036,545)
-
-
-
(433,559,139)
-
(21,605,357)
(353,348,435)
-
-
(7,527,367)
-
-
(382,481,159)
-
-
-
-
(2,077,980)
-
-
(99,349,887)
-
-
(3,164,738)
(45,578,687)
-
-
-
(150,171,292)
-
(40,036,747)
(104,964,670)
-
-
(3,164,738)
-
-
(148,166,155)
-
149,414,706 123,708,745
North America Middle East Pakistan Total
Elimination of
Inter-segment
transactions
2015 20142015 20142015 20142015 2014
Amounts in rupees
Amounts in rupees
Systems Limited | Annual Report 2015 115
www.systemsltd.com114

34.1 Basic earnings per share
Profit for the year after tax 409,895,657 411,265,030
Weighted-average number of ordinary shares as at 31 December 109,294,130 95,408,727
Basic earnings per share (Rupees) 3.75 4.31
34.2 Diluted earnings per share
Profit for the year after tax 409,895,657 411,265,030
Weighted-average number of ordinary shares (basic) 109,294,130 95,408,727
Effect of share options 1,242,385 884,561
Weighted average number of ordinary shares - diluted 110,536,515 96,293,288
Diluted earnings per share (Rupees) 3.71 4.27
2015Amounts in rupees 2014
2015 2014Undertaking Relationship Nature of transaction
Sales 1,390,832,102 1,083,629,875
Reimbursement of expenses 36,767,441 23,623,310
Staff retirement
fundsContribution 55,504,158 38,199,915
Visionet Systems
Incorporation -
USA
Associate
33. TRANSACTIONS WITH RELATED PARTIES
The related parties and associated undertakings comprise subsidiary, associated companies, companies in which directors are interested, staff retirement funds and directors and key management personnel (Note 31). The Group in the normal course of business carries out transactions with various related parties. Amounts due from and to related parties are shown under respective notes to the consolidated financial statements. Other significant transactions with related parties are as follows:
Amounts in rupees
34. EARNINGS PER SHARE- BASIC AND DILUTED
Earnings per share are calculated by dividing the net profit for the year by weighted average number of shares outstanding during the year as follows:
Restated
2015Number os shares 2014
The earnings per share of prior year has been adjusted to reflect the changes of bonus shares issued during the year ended 31 December 2015.
2015Amounts in rupees 2014
Restated
2015Number os shares 2014
Note
35. CASH GENERATED FROM OPERATIONS
Profit before taxation
Adjustment for:
Depreciation on property and equipment 5.3
Amortization of intangibles 6.3
Provision for bad debts - net 28
Bad debts - written off 28
Provision for impairment
(Provision reversed) / Provision for gratuity
Finance cost 29
Net foreign exchange differences 5.1
Exchange gain on translation of export debts 27
Gain on short term investments 27
Share based payment expense
Gain on disposal of property and equipment 27
Working capital changes
Decrease / (increase) in current assets
Work in progress
Unbilled revenue - net
Trade debts
Advances
Receivable from related parties
Trade deposits and short term prepayments
(Decrease) / increase in current liabilities
Trade and other payables
Cash generated from operations
418,239,831
71,756,841
15,135,993
4,463,706
19,262,903
-
(34,114)
3,065,865
(27,815)
(25,061,317)
(43,730,505)
9,251,100
(4,689,810)
467,632,678
-
(14,541,680)
(214,773,055)
(45,151,630)
(9,386,245)
(55,326,992)
(339,179,602)
(23,595,408) (362,775,010)
104,857,668
411,798,179
51,758,106
7,808,090
3,606,674
-
694,757
1,494,471
3,995,964
-
21,650,799
(13,972,179)
-
(5,444,957)
483,389,904
52,400
5,069,146
(334,432,316)
(40,797,118)
4,336,204
-
(365,771,684)
214,715,116 (151,056,568)
332,333,336
2015Amounts in rupees 2014
36. FINANCIAL RISK MANAGEMENT
Financial instruments comprise advances, deposits, interest accrued, trade debts, other receivables, receivable from related parties, cash and bank balances and trade and other payables.
The Group has exposure to the following risks from its use of financial instruments:
- Market risk - Credit risk - Liquidity risk
The Board of Directors has the overall responsibility for the establishment and oversight of Group’s risk management framework. The Board is also responsible for developing and monitoring the Group's risk management policies.
This note represents information about the Group’s exposure to each of the above risks, it's objectives, policies and processes for measuring and managing risk, and it's management of capital.
Systems Limited | Annual Report 2015 117
www.systemsltd.com116

The Group's risk management policies are established to identify and analyze the risks faced by the Group, to set appropriate risk limits and controls, and to monitor risks and adherence to limits. Risk management policies and systems are reviewed regularly to react to changes in market conditions and the Group's activities.
36.1 Market risk
(a) Currency risk
Currency risk is the risk that the fair value or future cash flows of a financial instrument will fluctuate because of changes in foreign exchange rates. Currency risk arises mainly from future commercial transactions or receivables and payables that exist due to transactions in foreign currencies.
Monetary items, including financial assets and financial liabilities, denominated in currency other than functional currency of the Group are periodically restated to Pak rupee equivalent and the associated gain or loss is taken to the consolidated profit and loss account.
The following analysis demonstrates the sensitivity to a reasonably possible change in exchange rates, with all other variables held constant, of the Group's profit before tax.
+1 81,570,803 67,175,141
-1 (81,570,803)
(67,175,141)
Reporting date rate:
USD 104.6 100.4
USD
2015 2014
Changes
in Rate
Effects on
Profit
Before Tax
Effects on Profit
Before Tax
(b) Other price risk
Other price risk is the risk that the fair value or future cash flows of a financial instrument will fluctuate because of changes in market prices (other than those arising from interest rate risk or currency risk). Material investments within the portfolio are managed on an individual basis and all buy and sell decisions are approved by the Board. The primary goal of the Group's investment strategy is to maximize investment returns.
The Group is not exposed to other price risk as its investments are fixed with respect to price and maturity.
(c) Interest rate risk
Interest rate risk represents the risk that the fair value or future cash flows of a financial instrument will fluctuate because of changes in market interest rates.
The Group does not account for any fixed rate financial assets and liabilities at fair value through profit or loss. Therefore, a change in interest rate at the balance sheet date would not affect consolidated profit or loss of the Group.
36.2 Credit risk
Credit risk represents the accounting loss that would be recognized at the reporting date if counter-parties failed completely to perform as contracted. The Group does not have significant exposure to any individual counter-party. To reduce exposure to credit risk the Group has developed a formal approval process whereby credit limits are applied to its customers. The management also continuously monitors the credit exposure towards the customers and makes provision against those balances considered doubtful of recovery. Outstanding customer receivables are regularly monitored.
Habib Metropolitan Bank A1+ AA+ PACRA 362,868,557
105,880,000
Bank Islami Pak A1 A+ PACRA 33,020,729 -
Nafa Asset
Management Fund 5 Star 4 Star PACRA 32,799,398
30,204,644
United Bank Limited A-1+ AA+ JCR-VIS 31,039,724 52,213,354
Faysal Bank Limited A1+ AA PACRA 62,686,970 54,509,373
Unbilled revenue 369,960,316 252,055,058
Trade debts 961,694,628 745,586,865
Advances 9,780,507 27,725,933
Trade deposits and short term prepayments 43,012,627 58,912,647
Receivable from related parties 11,536,311 2,150,066
Interest accrued 5,058,561 27,467,230
Short term investment 525,000,000 30,204,644
Cash and bank balances 193,501,448 987,092,798
2,119,544,398 2,131,195,241
The aging of trade receivables at the reporting date is:
0 - 120 days 810,189,010 588,303,751
121 - 365 days 77,155,430 147,616,464
Above one year 86,321,607 17,849,046
973,666,047 753,769,261
Impairment above one year (11,971,419) (8,182,396)
961,694,628 745,586,865
The credit risk on liquid funds is limited because the counter parties are banks and mutual funds with reasonably high credit ratings. The Group believes that it is not exposed to major concentration of credit risk as its exposure is spread over a large number of counter parties and subscribers in case of trade debts.
The carrying amount of financial assets represents the maximum credit exposure. The maximum exposure to credit risk at the reporting date was as follows:
2015Amounts in rupees 2014
As at year end, 68% of trade receivables (2014: 66%) are represented by one customer amounting to Rs. 552.77 million (2014: Rs. 495.19 million). The management believes that the Group is not exposed to customer concentration risk as this customer is related party of the Group.
Based on past experience and policy of the Group, the management believes that an impairment allowance is necessary in respect of trade receivables past due by one year except if those receivables are recovered subsequent to year end and if management has sufficient grounds to believe that the amounts will be recovered.
The credit quality of financial assets that are neither past due nor impaired can be assessed by reference to external credit ratings or to historical information about counterparty default rate. The table below shows the bank balances and investments held with some major counterparties at the balance sheet date:
2015 2014
Short term Long term Agency
Rating
Banks Amounts in rupees
Standard Chartered Bank A1+ AAA PACRA 1,480,199 2,838,562
Balance carried forward 523,895,577 245,645,933
Systems Limited | Annual Report 2015 119
www.systemsltd.com118

Assets measured at fair value
Mutual funds 32,799,398 32,799,398 - -
Date of valuation : 31 December 2015
There were no liabilities measured at fair value as at 31 December 2015.
Assets measured at fair value
Mutual funds 30,204,644 30,204,644 - -
Date of valuation : 31 December 2014
There were no liabilities measured at fair value as at 31 December 2014.
As at 31 December 2014, the Group held the following financial instruments carried at fair
value:
36.5 Fair value hierarchy
The Group uses the following hierarchy for determining and disclosing the fair value of financial instruments by valuation technique:
Level 1: quoted (unadjusted) prices in active markets for identical assets or liabilities.
Level 2: other techniques for which all inputs which have a significant effect on the recorded fair value are observable either, directly or indirectly.
Level 3: techniques which use inputs that have a significant effect on the recorded fair value that are not based on observable market data.
As at 31 December 2015, the Group held the following financial instruments carried at fair value:
2015 Level 1 Level 2 Level 3Amounts in rupees
2014 Level 1 Level 2 Level 3Amounts in rupees
36.6 Capital risk management
The Group’s policy is to safeguard the Group’s ability to remain as a going concern and ensure a strong capital base in order to maintain investors’, creditors’ and market’s confidence and to sustain future development of the business. The Board of Directors monitors the returns on capital, which the Group defines as net operating income divided by total shareholders’ equity. The Group’s objectives when managing:
a) to safeguard the entity’s ability to continue as a going concern, so that it can continue to provide returns for shareholders and benefits for other stakeholders; and
b) to provide an adequate return to shareholders by pricing products.
In order to maintain or adjust the capital structure, the Group may adjust the amount of dividends paid to shareholders, return capital to shareholders, or issue new shares.
Consistent with the industry norms, the Group monitors its capital on the basis of gearing ratio. The ratio is calculated as net debt divided by total capital. Net debt is calculated as total borrowings as shown in the balance sheet less cash and cash equivalent. Total capital is calculated as ‘equity’ as shown in the balance sheet plus net debt (as defined above).
The debt - to- equity ratio as to 31 December is as follows:
Dubai Islamic Bank A1 A+ JCR-VIS 48,976,220 17,208,754
Bank Alfalah Limited A1+ AA PACRA 25,501,210 66,217,230
Deutsche Bank Limited P-1 A2 Moody's 460,970 1,011,900
KASB Bank Limited C B PACRA 31,494 194,658,080
Habib Bank Limited A1+ AA JCR-VIS - 83,520,000
Silk Bank A2 A- JCR-VIS - 4,300,000
Summit Bank A1 A JCR-VIS - 390,000,000
Samba Bank A1 AA JCR-VIS - 1,960,000
Askari Bank A1+ AA JCR-VIS - 7,480,000
751,300,846 1,013,396,038
2015 2014
Short term Long term Agency
Rating
Banks Amounts in rupees
36.3 Liquidity risk
Liquidity risk is the risk that the Group will not be able to meet its financial obligations as they fall due. The Group's approach to managing liquidity is to ensure as far as possible to always have sufficient liquidity to meet its liabilities when due. The following are the contractual maturities of financial liabilities:
The following are the contractual maturities of financial liabilities as at 31 December 2015:
Trade and other payables
Long term advances
The following are the contractual maturities of financial liabilities as at 31 December 2014:
Trade and other payables 246,392,259
246,392,259
-
-
Long term advances 10,158,496
3,391,885
6,766,611
256,550,755
249,784,144
6,766,611
-
243,395,173
12,669,395
256,064,568
Carrying
amount
243,395,173
5,017,350
248,412,523
Less than
one year
-
7,652,045
7,652,045
One to five
years
-
-
-
More than five
years
Amounts in rupees
Albarakah Bank A1 A PACRA 1,425,068 1,394,141
Meezan Bank A1+ AA JCR-VIS 151,010,307
-
Carrying
amount
Less than
one year
One to five
years
More than five
years Amounts in rupees
36.4 Fair values of financial assets and liabilities
Fair value of available-for-sale financial assets is derived from quoted market prices in active markets, if available.
The carrying values of other financial assets and financial liabilities reflected in consolidated financial statements approximate their fair values. Fair value is determined on the basis of objective evidence at each reporting date.
Systems Limited | Annual Report 2015 121
www.systemsltd.com120

Assets measured at fair value
Mutual funds 32,799,398 32,799,398 - -
Date of valuation : 31 December 2015
There were no liabilities measured at fair value as at 31 December 2015.
Assets measured at fair value
Mutual funds 30,204,644 30,204,644 - -
Date of valuation : 31 December 2014
There were no liabilities measured at fair value as at 31 December 2014.
As at 31 December 2014, the Group held the following financial instruments carried at fair
value:
36.5 Fair value hierarchy
The Group uses the following hierarchy for determining and disclosing the fair value of financial instruments by valuation technique:
Level 1: quoted (unadjusted) prices in active markets for identical assets or liabilities.
Level 2: other techniques for which all inputs which have a significant effect on the recorded fair value are observable either, directly or indirectly.
Level 3: techniques which use inputs that have a significant effect on the recorded fair value that are not based on observable market data.
As at 31 December 2015, the Group held the following financial instruments carried at fair value:
2015 Level 1 Level 2 Level 3Amounts in rupees
2014 Level 1 Level 2 Level 3Amounts in rupees
36.6 Capital risk management
The Group’s policy is to safeguard the Group’s ability to remain as a going concern and ensure a strong capital base in order to maintain investors’, creditors’ and market’s confidence and to sustain future development of the business. The Board of Directors monitors the returns on capital, which the Group defines as net operating income divided by total shareholders’ equity. The Group’s objectives when managing:
a) to safeguard the entity’s ability to continue as a going concern, so that it can continue to provide returns for shareholders and benefits for other stakeholders; and
b) to provide an adequate return to shareholders by pricing products.
In order to maintain or adjust the capital structure, the Group may adjust the amount of dividends paid to shareholders, return capital to shareholders, or issue new shares.
Consistent with the industry norms, the Group monitors its capital on the basis of gearing ratio. The ratio is calculated as net debt divided by total capital. Net debt is calculated as total borrowings as shown in the balance sheet less cash and cash equivalent. Total capital is calculated as ‘equity’ as shown in the balance sheet plus net debt (as defined above).
The debt - to- equity ratio as to 31 December is as follows:
Dubai Islamic Bank A1 A+ JCR-VIS 48,976,220 17,208,754
Bank Alfalah Limited A1+ AA PACRA 25,501,210 66,217,230
Deutsche Bank Limited P-1 A2 Moody's 460,970 1,011,900
KASB Bank Limited C B PACRA 31,494 194,658,080
Habib Bank Limited A1+ AA JCR-VIS - 83,520,000
Silk Bank A2 A- JCR-VIS - 4,300,000
Summit Bank A1 A JCR-VIS - 390,000,000
Samba Bank A1 AA JCR-VIS - 1,960,000
Askari Bank A1+ AA JCR-VIS - 7,480,000
751,300,846 1,013,396,038
2015 2014
Short term Long term Agency
Rating
Banks Amounts in rupees
36.3 Liquidity risk
Liquidity risk is the risk that the Group will not be able to meet its financial obligations as they fall due. The Group's approach to managing liquidity is to ensure as far as possible to always have sufficient liquidity to meet its liabilities when due. The following are the contractual maturities of financial liabilities:
The following are the contractual maturities of financial liabilities as at 31 December 2015:
Trade and other payables
Long term advances
The following are the contractual maturities of financial liabilities as at 31 December 2014:
Trade and other payables 246,392,259
246,392,259
-
-
Long term advances 10,158,496
3,391,885
6,766,611
256,550,755
249,784,144
6,766,611
-
243,395,173
12,669,395
256,064,568
Carrying
amount
243,395,173
5,017,350
248,412,523
Less than
one year
-
7,652,045
7,652,045
One to five
years
-
-
-
More than five
years
Amounts in rupees
Albarakah Bank A1 A PACRA 1,425,068 1,394,141
Meezan Bank A1+ AA JCR-VIS 151,010,307
-
Carrying
amount
Less than
one year
One to five
years
More than five
years Amounts in rupees
36.4 Fair values of financial assets and liabilities
Fair value of available-for-sale financial assets is derived from quoted market prices in active markets, if available.
The carrying values of other financial assets and financial liabilities reflected in consolidated financial statements approximate their fair values. Fair value is determined on the basis of objective evidence at each reporting date.
Systems Limited | Annual Report 2015 121
www.systemsltd.com120

Size of the fund (net assets) 193,416,811
149,726,979
Cost of investment made (actual investments made) 139,630,775
105,210,667
Percentage of investment made (cost of investments) 72.19% 70.27%
Fair value of investments 139,630,775
105,210,667
Net debt -
Total equity 1,598,124,458
Capital gearing ratio
-
2,423,320,937
- -
2015Amounts in rupees 2014
Since the Group, has healthy cash flows at period end which is primarily because of higher revenue resulting in profits and increased equity due to new shares issued, therefore, it does not carry any long term or short term debts at 31 December 2015.
The Group is not subject to any externally-imposed capital requirements.
37.1 The Group has maintained an employee provident fund trust and investments out of provident fund have been made in accordance with the provisions of section 227 of the Companies Ordinance 1984, and the rules formulated for this purpose. The salient information of the fund is as follows:
37. PROVIDENT FUND TRUST
2015Amounts in rupees 2014
37.2 Break-up of investments of provident fund
Break-up of investments in terms of amount and percentage of the size of the provident fund are as follows:
At fair value
Mutual Funds 52,554,756 37.6% 40,361,532 38.4%
Term Deposit Receipts 65,076,019 46.6% 42,849,135 40.7%
Defense saving certificates 22,000,000 15.8% 22,000,000 20.9%
139,630,775 100% 105,210,667 100%
20142015
Description
% of
investment as
size of the fund
% of
investment
as size of the
fund
InvestmentsInvestments
Rupees Rupees
37.3 The above information is based on unaudited financial statements of the provident fund.
38. NUMBER OF EMPLOYEES
Number of employees at the end of the year 1876 1428
Average number of employees during the year 1684 1273
2015 2014
From:
114,105,810
To:
Advances 27,725,933
Tax refunds due from the Government 27,467,230
Trade deposits and short term prepayments 58,912,647
114,105,810
Advances, deposits, prepayments and other receivables have been shown
separately on the face of the balance sheet as:
39. POST BALANCE SHEET EVENTS
40. DATE OF AUTHORIZATION FOR ISSUE
41. CORRESPONDING FIGURES
The Directors in their meeting held on 31 March 2016 have recommended a final dividend of Rs. 1.25 per share (2014: Rs. 1 per share) amounting to Rs. 138.351 million (2014: Rs. 100.165 million) and bonus shares at the rate of NIL (2014: 10%) in respect of year ended December 31, 2015. The financial statements for the year ended December 31, 2015 do not include the effect of these appropriations which will be accounted for in the year in which it is approved.
These financial statements were authorised for issue in the Board of Directors meeting held on 31 March 2016.
Corresponding figures have been re-classified for better presentation, in respect of following:
Balance sheet Rupees
Profit and loss account
21,650,799
Provision for doubtful debts reclassified from 'Distribution cost' to 'Other
operating expenses' 3,606,674
Exchange loss reclassified from 'Other income' to Other operating expenses'
AEZAZ HUSSAINChairman
ASIF PEERChief Executive
Systems Limited | Annual Report 2015 123
www.systemsltd.com122
%%

Form of Proxyth39 Annual General Meeting
Signature
Name
Address
CNIC
2.
I/We
son/daughter of
Mr./Ms.
son/daughter of
who is also member of the Company vide Registered Folio No.
a member of Systems Limited and holder of shares as
per Registered Folio No. do hereby appoint Mr./Ms.
son/daughter of or failing him/her
In witness whereof on this day of 2016.
WITNESSES:
Affix RevenueStamp
Member's Signature
NOTES:
Signature
Name
Address
CNIC
1.
The Forma of Proxy should be deposited at the Registered Office of the Company not later than 48 hours before the time for holding the meeting.
CDC Shareholders, entitled to attend and vote at this meeting, must bring with them their national Identity Cards/Passport in original to provide his/her identity, and in case of Proxy, must enclosed an attested copy of his/her CNIC or Passport. Representatives of corporate members should bring the usual documents for such purpose.
1.
2.
as my/our Proxy to attend, speak and vote for me/us and on my/our behalf at the Annual General
Meeting of the Company to be held on 27 April 2016 at 12:30 p.m. at
adjournment thereof.
Chamber of Commerce Building,
11 Sharae Aiwane Tijarat, Lahore and at any
Notes

AFFIX
CORRECT
POSTAGE
The Company Secretary
Systems Limited
Chamber of Commerce Building,11 Sharae Aiwane Tijarat,Lahore, Pakistan

Lahore - Head Office Karachi Dubai
Chamber of Commerce Building,11 Sharae Aiwane Tijarat,Lahore, PakistanT: +92 42 36304825-35F: +92 42 36368857
E-5, Central Commercial Area,Shaheed-e-Millat Road,Karachi, PakistanT: +92 21 34549385-87F: +92 21 34549389
TechVista Systems FZ-LLCOffice 105, Building 11 Dubai Internet City,PO Box 500497, Dubai, UAET: + 9714 369 3525F: +9714 456 3761
Des
ign
ed &
Pro
du
ced
by