Bringing Others A Second Chance: The Pennsylvania Perspective presented by Serving western...
39
Bringing Others A Second Chance: The Pennsylvania Perspective presented by Serving western Pennsylvania Serving eastern Pennsylvania
-
Upload
abner-fletcher -
Category
Documents
-
view
216 -
download
2
Transcript of Bringing Others A Second Chance: The Pennsylvania Perspective presented by Serving western...
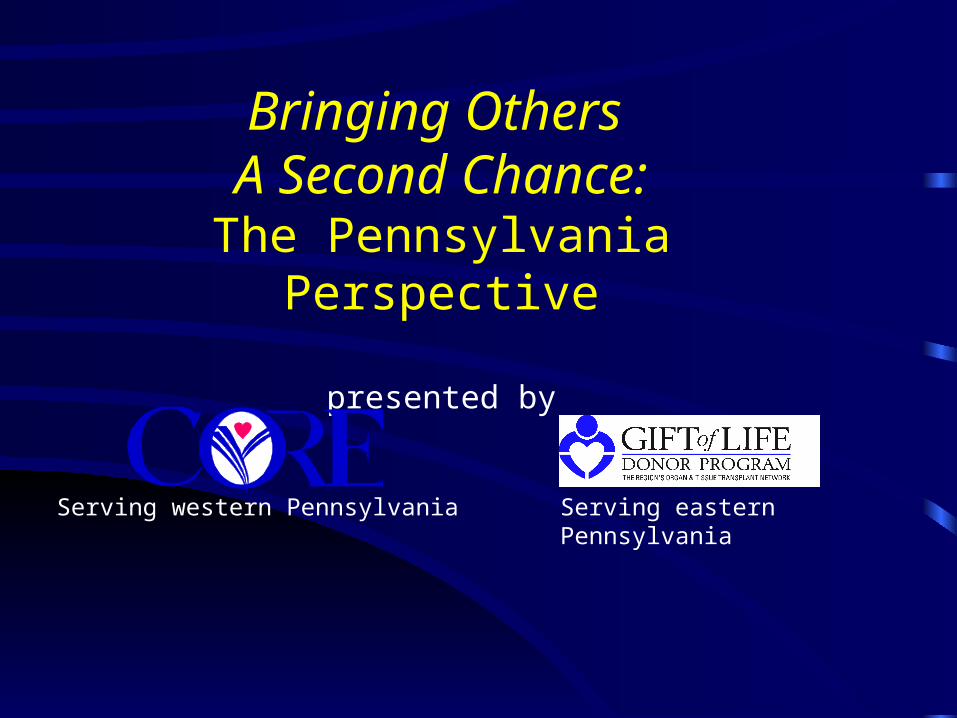
Bringing Others A Second Chance:
The Pennsylvania Perspective
presented by
Serving western Pennsylvania Serving eastern Pennsylvania
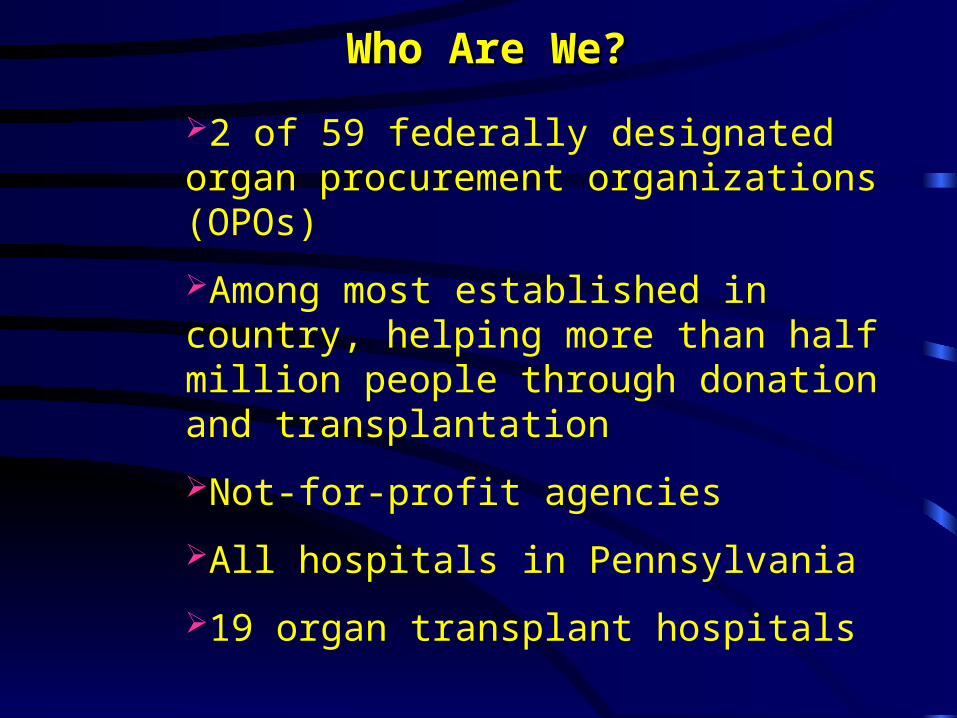
2 of 59 federally designated organ procurement organizations (OPOs)
Among most established in country, helping more than half million people through donation and transplantation
Not-for-profit agencies
All hospitals in Pennsylvania
19 organ transplant hospitals
Who Are We?Who Are We?
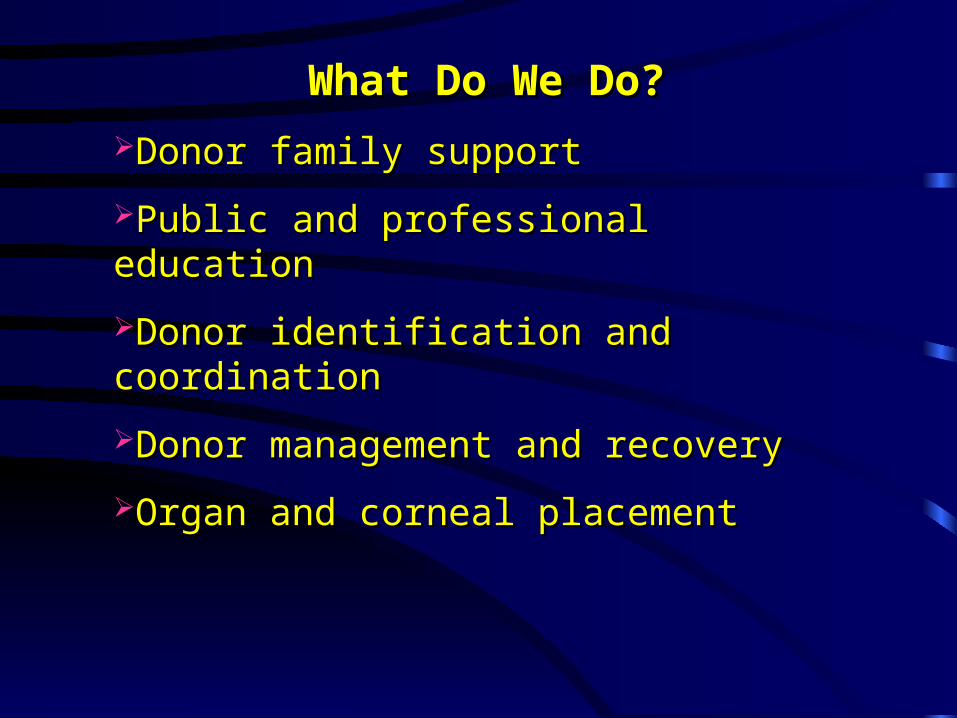
What Do We Do?What Do We Do?Donor family supportDonor family support
Public and professional educationPublic and professional education
Donor identification and coordinationDonor identification and coordination
Donor management and recoveryDonor management and recovery
Organ and corneal placementOrgan and corneal placement
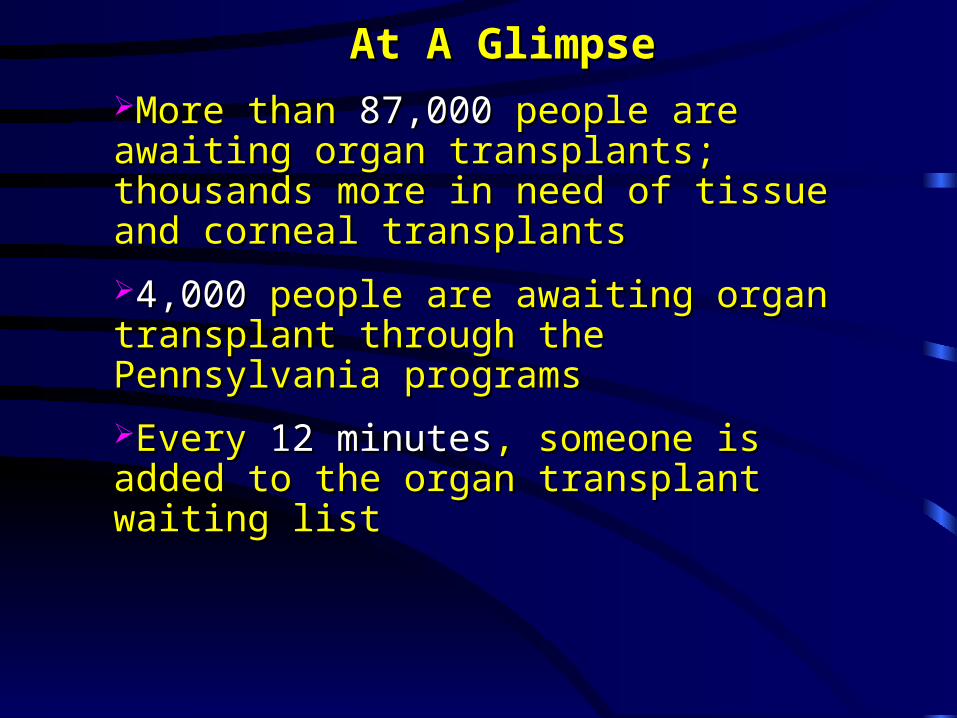
At A GlimpseAt A GlimpseMore than More than 87,00087,000 people are awaiting people are awaiting organ transplants; thousands more in organ transplants; thousands more in need of tissue and corneal transplantsneed of tissue and corneal transplants
4,0004,000 people are awaiting organ people are awaiting organ transplant through the Pennsylvania transplant through the Pennsylvania programsprograms
Every Every 12 minutes12 minutes, someone is added to , someone is added to the organ transplant waiting listthe organ transplant waiting list

U.S. Organ Procurement U.S. Organ Procurement &Transplantation Structure &Transplantation Structure
• 5959 Organ Procurement Organizations (OPO)Organ Procurement Organizations (OPO)– non-profit, federally designated, report to HCFAnon-profit, federally designated, report to HCFA
• 272 Medical Institutions w/Txp Programs272 Medical Institutions w/Txp Programs• United Network for Organ Sharing (UNOS)United Network for Organ Sharing (UNOS)• 2001 U.S. Donation & Transplantation Data:2001 U.S. Donation & Transplantation Data:
– deceased organ donors – 6,081deceased organ donors – 6,081– living organ donors – 6,499living organ donors – 6,499– U.S. transplants performed - 22,854U.S. transplants performed - 22,854

What UNOS Does• Facilitates organ matching
– Manages Waiting List - establishes candidate wait list criteria
– Matches donated organs to patients via 24-hour Organ Center/computer
• Establishes allocation policies
• Establishes criteria for transplant centers
• Maintains data on all donors & Txs.
• Supports OPOs by educating national healthcare
associations & societies

UNOS Regional Map
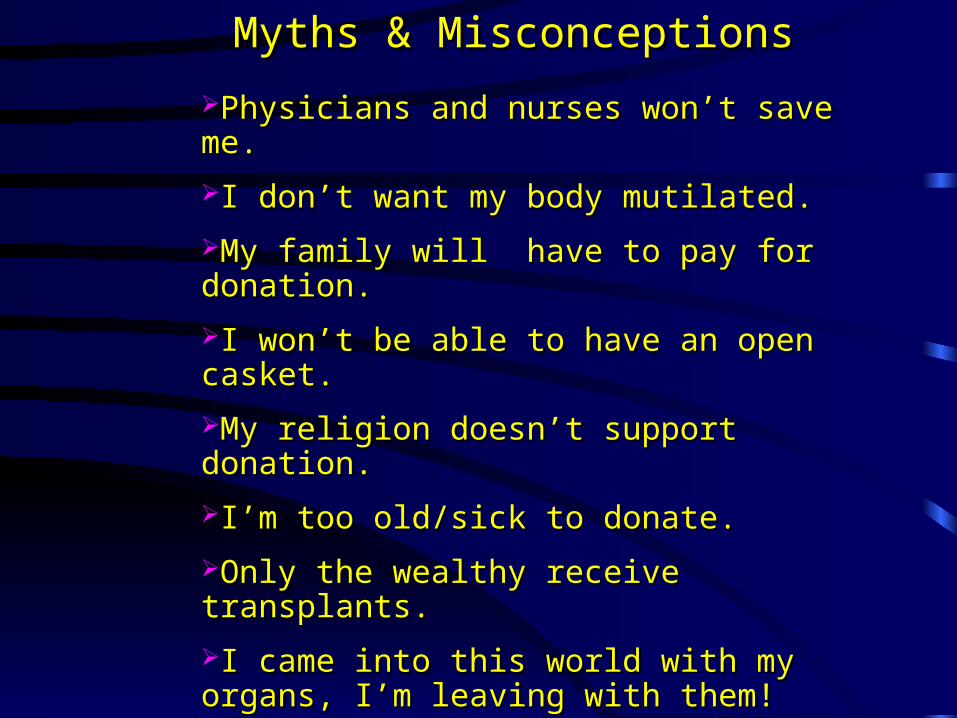
Physicians and nurses won’t save me.Physicians and nurses won’t save me.
I don’t want my body mutilated.I don’t want my body mutilated.
My family will have to pay for My family will have to pay for donation.donation.
I won’t be able to have an open I won’t be able to have an open casket.casket.
My religion doesn’t support donation.My religion doesn’t support donation.
I’m too old/sick to donate.I’m too old/sick to donate.
Only the wealthy receive transplants.Only the wealthy receive transplants.
I came into this world with my organs, I came into this world with my organs, I’m leaving with them!I’m leaving with them!
Donation and transplantation are for Donation and transplantation are for others to worry about; not my familyothers to worry about; not my family
Myths & MisconceptionsMyths & Misconceptions

United StatesUnited StatesPatient Waiting ListPatient Waiting List
May 2004May 2004 52,772 Kidney
17,520 Liver 4,163 Heart 3,799 Lung
2,520 Kidney/Pancreas 1,311 Pancreas
301 Pancreas Islet Cell 209 Heart/Lung 193 Intestine
87,000 Total Patients Waiting
Source: UNOS

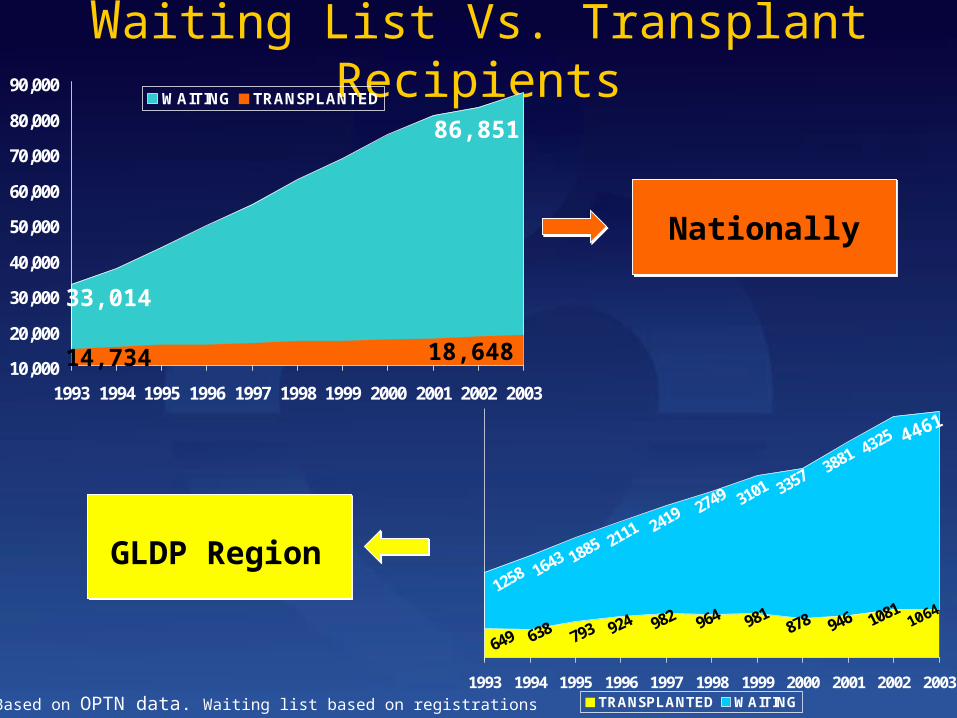
National DataWaiting List Vs. Transplant Recipients
10,000
20,000
30,000
40,000
50,000
60,000
70,000
80,000
90,000
1993 1994 1995 1996 1997 1998 1999 2000 2001 2002 2003
WAITING TRANSPLANTED
14,73418,648
33,014
86,851
Source: Based on OPTN data. Waiting list based on registrations
Waiting List Vs. Transplant Recipients
10,000
20,000
30,000
40,000
50,000
60,000
70,000
80,000
90,000
1993 1994 1995 1996 1997 1998 1999 2000 2001 2002 2003
WAITING TRANSPLANTED
14,734 18,648
33,014
86,851
Source: Based on OPTN data. Waiting list based on registrations
1993 1994 1995 1996 1997 1998 1999 2000 2001 2002 2003TRANSPLANTED WAITING
4461
NationallyNationally
GLDP Region

National Deaths Waiting for a Transplant
2003
Kidney 3,413Liver 1,703Heart 506Lung 443Intestine 47Pancreas 32Total 6,355
Source: Based on OPTN data as of April 9, 2004

National Waiting ListDemographics
Children <18 3%
Elderly (65+) 11%
Females 42%
Ethnic Minorities 34%Source: Based on OPTN data.

0
5,000
10,000
15,000
20,000
25,000
30,000
35,000
40,000
1993 1994 1995 1996 1997 1998 1999 2000 2001 2002 2003
<18 65+ 18-34 35-49 50-64
U.S. Waiting ListBy Age
Source: Based on OPTN data.

National Median Time to Transplant How long is the wait?
230
1068
796
491
1121
0
200
400
600
800
1000
1200
Heart Lung Liver K-P Kidney
Source: Based on OPTN data.

U.S. Waiting List By Organ 1993-2003
0
1000
2000
3000
4000
5000
1993 1994 1995 1996 1997 1998 1999 2000 2001 2002 2003
Nu
mb
er o
f R
egis
trat
ion
s
Heart Lung Pancreas Heart-Lung Kidney-Pancreas
Source: Based on OPTN data . Number of registrations.

U.S. Waiting List Kidney and Liver
1993-2003
Source: Based on OPTN data . Number of registrations.
0
10,000
20,000
30,000
40,000
50,000
60,000
1993 1994 1995 1996 1997 1998 1999 2000 2001 2002 2003
Nu
mb
er o
f R
egis
trat
ion
s
Kidney Liver

National Trends in Organ DonationNational Trends in Organ Donation
Deceased Deceased Organ DonorsOrgan Donors
6,4556,455
Living Living
Organ DonorsOrgan Donors6,8146,814
20032003
Living vs. Deceased Organ DonorsLiving vs. Deceased Organ Donors
1992 - 20031992 - 2003
6,814
4,557
4,052
3,7813,488
3,1022,905
6,618
2,572
5,001
5,873
6,560
6,455
5,794 5,824
6,1876,080
4,520
4,8615,099
5,362 5,416 5,478
5,985
2,500
3,000
3,500
4,000
4,500
5,000
5,500
6,000
6,500
7,000
7,500
1992 1993 1994 1995 1996 1997 1998 1999 2000 2001 2002 2003
Living Donors Deceased Donors
Source: Based on OPTN data as of April 9, 2004.
Waiting List Waiting List DeathsDeaths
6,3556,355

The Aging Organ Donor Population
0%
5%
10%
15%
20%
25%
30%
35%
1993 1994 1995 1996 1997 1998 1999 2000 2001 2002 2003
18-34 35-49 50-64 65+
Source: Based on OPTN data.
In 2003 approximately 14% of deceased donors were < 18 years old
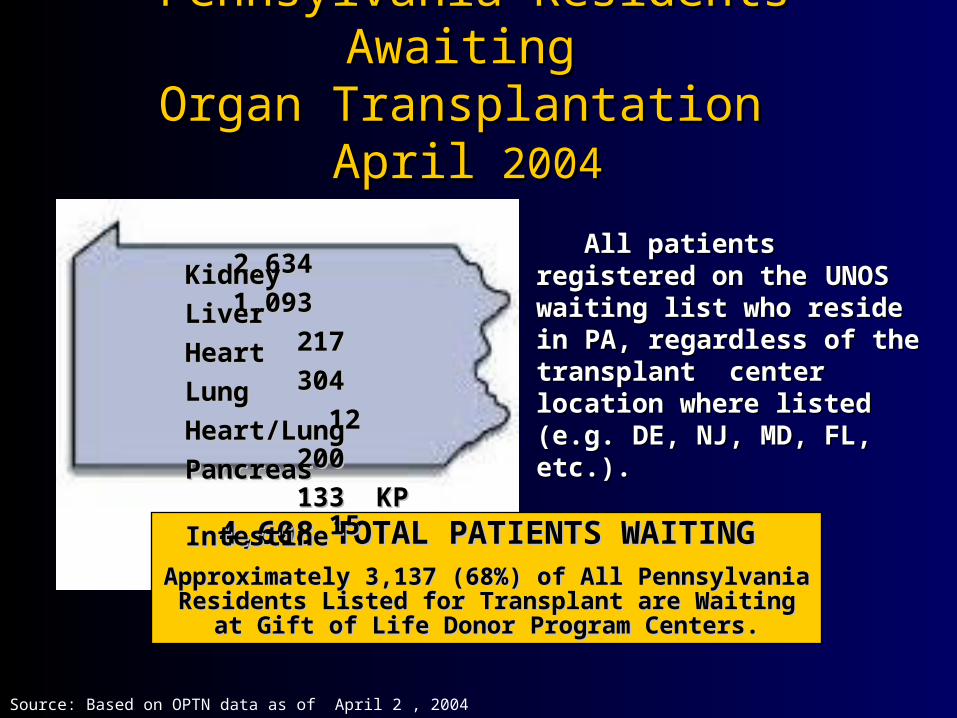
Pennsylvania Residents Awaiting Pennsylvania Residents Awaiting Organ Transplantation Organ Transplantation
AprilApril 2004 2004
All patients registered on theAll patients registered on theUNOS waiting list who reside in UNOS waiting list who reside in PA, regardless of the transplant PA, regardless of the transplant center location where listed (e.g. center location where listed (e.g. DE, NJ, MD, FL, etc.).DE, NJ, MD, FL, etc.).
4,608 TOTAL PATIENTS WAITING4,608 TOTAL PATIENTS WAITINGApproximately 3,137 (68%) of All Pennsylvania Residents Approximately 3,137 (68%) of All Pennsylvania Residents
Listed for Transplant are Waiting at Gift of Life Donor Listed for Transplant are Waiting at Gift of Life Donor Program Centers.Program Centers.
2,634 Kidney2,634 Kidney 1,093 Liver1,093 Liver 217 Heart217 Heart 304 Lung304 Lung 12 Heart/Lung12 Heart/Lung 200 Pancreas200 Pancreas 133 KP133 KP 15 Intestine15 Intestine
Source: Based on OPTN data as of April 2 , 2004

174190
217
251 250282
243267
292 293
0
50
100
150
200
250
300
1994 1995 1996 1997 1998 1999 2000 2001 2002 2003
Organ Donors in PA Hospitals
Gift of Life Donor ProgramGift of Life Donor ProgramOrgan Donations Coordinated in PA HospitalsOrgan Donations Coordinated in PA Hospitals

Gift of Life Donor ProgramOrgan Donation and Transplant Activity
2003 Summary
• 1,526 PA residents received lifesaving organ transplants; 703 (46%) of these transplants
occurred in GLDP centers
• 404 PA residents became organ donors; 269 (67%) PA residents were organ donors in the GLDP region
• 293 individuals became organ donors in PA hospitals representing 85% of GLDP donors
• 4,608 PA residents are currently awaiting transplantation; 3,137 (68%) are waiting at GLDP centers Source: Based on OPTN & GLDP data.
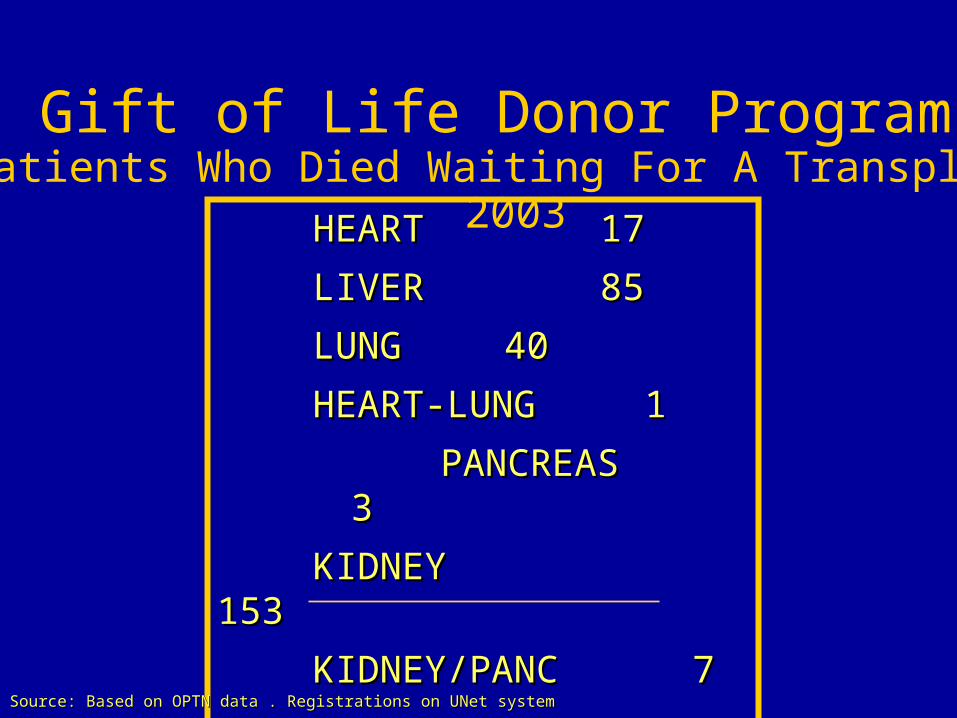
Gift of Life Donor Program Patients Who Died Waiting For A Transplant
2003HEARTHEART 1717
LIVERLIVER 8585
LUNGLUNG 4040
HEART-LUNGHEART-LUNG 1 1
PANCREAS 3PANCREAS 3
KIDNEYKIDNEY 153 153
KIDNEY/PANC 7KIDNEY/PANC 7
TOTALTOTAL 306 306Source: Based on OPTN data . Registrations on UNet system Source: Based on OPTN data . Registrations on UNet system

Gift of Life Donor ProgramWaiting List vs. Patients Transplanted
10641081
946878981964
924793 982
649 638
4325
3881
2419
1258 1643 1885 21112749 3101 3357
1993 1994 1995 1996 1997 1998 1999 2000 2001 2002 2003TRANSPLANTED WAITING
Waiting list consists of patient registrations. Transplants occurred in the GLDP area.
4461

Gift of Life Donor ProgramGift of Life Donor ProgramTotal Transplants CoordinatedTotal Transplants Coordinated
1994 - 20031994 - 2003
12381306
11121050
118611301133
1049
938
729
600
800
1000
1200
1400
1994 1995 1996 1997 1998 1999 2000 2001 2002 2003

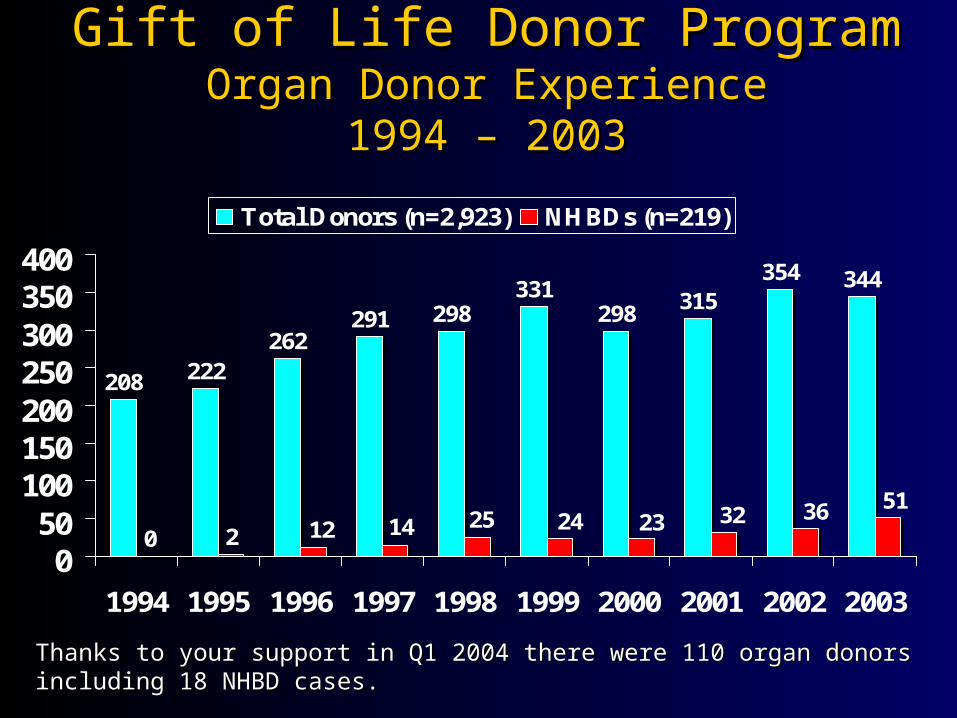
Gift of Life Donor ProgramGift of Life Donor ProgramOrgan Donor ExperienceOrgan Donor Experience
1994 – 20031994 – 2003
208 222262
291 298331
298315
354 344
050
100150200250300350400
1994 1995 1996 1997 1998 1999 2000 2001 2002 2003
Total Donors (n=2,923)
In the first quarter of 2004 there were 455 organ referrals (a 13% increase over the same period In the first quarter of 2004 there were 455 organ referrals (a 13% increase over the same period last year) resulting in 110 organ donors, ( a 25% increase over the same period last year).last year) resulting in 110 organ donors, ( a 25% increase over the same period last year).
Gift of Life Donor ProgramGift of Life Donor ProgramOrgan Donor ExperienceOrgan Donor Experience
1994 – 20031994 – 2003
208 222262
291 298331
298315
354 344
0 2
5136322324251412
050
100150200250300350400
1994 1995 1996 1997 1998 1999 2000 2001 2002 2003
Total Donors (n=2,923) NHBDs (n=219)
Thanks to your support in Q1 2004 there were 110 organ donors including 18 NHBD cases.Thanks to your support in Q1 2004 there were 110 organ donors including 18 NHBD cases.

Gift of Life Donor ProgramGift of Life Donor ProgramOrgan Donor ExperienceOrgan Donor Experience
1994 – 2004*1994 – 2004*
208 222262
291 298331
298315
354 344
140
0 22012 14 25 24 23 32 36 51
0
50
100
150
200
250
300
350
400
1994 1995 1996 1997 1998 1999 2000 2001 2002 2003 2004
Total Donors (n=3,063) NHBD (n=239)
* As of 4/30/04. Annualized projection to exceed 400 Total Organ Donors.

Gift of Life Donor ProgramOrgan Donors By Race
2003 2003
HISPANICHISPANICn = 24 (7%)n = 24 (7%)
CAUCASIANCAUCASIANn = 254 (74%)n = 254 (74%)
AFRICAN AMERICANAFRICAN AMERICAN n = 62 (18%)n = 62 (18%)
ASIAN/INDIANASIAN/INDIANn = 4 (1%)n = 4 (1%)
N= 344N= 344

Gift of Life Donor Program Organ Donors By Age
2003
N= 344
0-59 (3%) 16-45
135 (39%)
6-1513 (4%)71+
28 (8%)
46-60114 (33%)
61-7045 (13%)

Gift of Life Donor ProgramOrgan Donors By Age
2003
0
25
50
75
100
125
150
0-5 6-15 16-45 46-60 61-70 71+
Age RangesN=344

Gift of Life Donor Program
Number of Organs Coordinated 1974-2003
0
100
200
300
400
500
600
700
800
900
1000
1100
1200
1300
1400
1500
19741977
19801983
19861989
19921995
19982001
Total Organs Coordinated = 20,300
47123140 169179 218 216
253 272301
332
446
551 536601
557
718
837800 804778
1013
1178
1283 1268
1353
1251
1257
1457 KidneyKidney = 12,005 = 12,005
Liver = 3,674Liver = 3,674
Lung = 992Lung = 992
Heart/Lung = 147Heart/Lung = 147
Pancreas = 855 Pancreas = 855
Heart = 2,607Heart = 2,607
Small Bowel = 20Small Bowel = 20
1362
2003

Gift of Life Donor ProgramGift of Life Donor ProgramTissue Donors*Tissue Donors*
893
1012
925
1043
879
1026
11371118
1027
858
600
800
1000
1200
1993 1994 1995 1996 1997 1998 1999 2000 2001 2002 2003
674
PA Act 102PA Act 102Routine ReferralRoutine Referral
*Some patients may donate multiple tissues for transplantation

Tissue Donors
CORNEA 729
INTEGUMENTARY 30
MUSCULOSKELETAL 470
HEART VALVES 196
SAPHENOUS VEINS 110
OTHER 253
Gift of Life Donor Program Region Gift of Life Donor Program Region Tissue DonationTissue Donation
2003 2003

Donor Family SupportDonor Family Support
Framed remembranceFramed remembrance
Donor Family BookletDonor Family Booklet
Gift of Life MedalGift of Life Medal
Gravesite MarkerGravesite Marker
Donor Family Recognition Donor Family Recognition CeremoniesCeremonies
Workshops and ConferencesWorkshops and Conferences

Donor Family CommunicationDonor Family Communication
Family will receive letter from OPO Family will receive letter from OPO explaining how loved one helped others explaining how loved one helped others through donationthrough donation
Letter contains only basic information Letter contains only basic information about recipients (age, marital status, about recipients (age, marital status, hobbies, time on waiting list)hobbies, time on waiting list)
Donor families and recipients may Donor families and recipients may communicate anonymously through OPOcommunicate anonymously through OPO
OPO will arrange direct contact if family OPO will arrange direct contact if family and recipient mutually agreeand recipient mutually agree

The OpportunityThe Opportunity
42 percent of Pennsylvania drivers 42 percent of Pennsylvania drivers have placed the designation on the have placed the designation on the licenselicense
Percentage of registrants by Percentage of registrants by county:county: Centre (52.08%)Centre (52.08%)
Chester (51.23%)Chester (51.23%)
Warren (49.66%)Warren (49.66%)
Cumberland (48.23%)Cumberland (48.23%)
Erie (47.93%)Erie (47.93%)
Bucks (47.45%)Bucks (47.45%)
York (47.25%)York (47.25%)
Fayette (30.78%)Fayette (30.78%)
Philadelphia (29.23%)Philadelphia (29.23%)

16-20 year olds are the largest 16-20 year olds are the largest segment placing the designation on segment placing the designation on the licensethe license
Designation rates plummet from an Designation rates plummet from an average high of 47.3% of females ages average high of 47.3% of females ages 31-40 to less than 17% for individuals 31-40 to less than 17% for individuals 75 and older75 and older
Men are less likely to be registered as Men are less likely to be registered as donors, but most apt to die in donors, but most apt to die in situations in which they can be donorssituations in which they can be donors
The OpportunityThe Opportunity
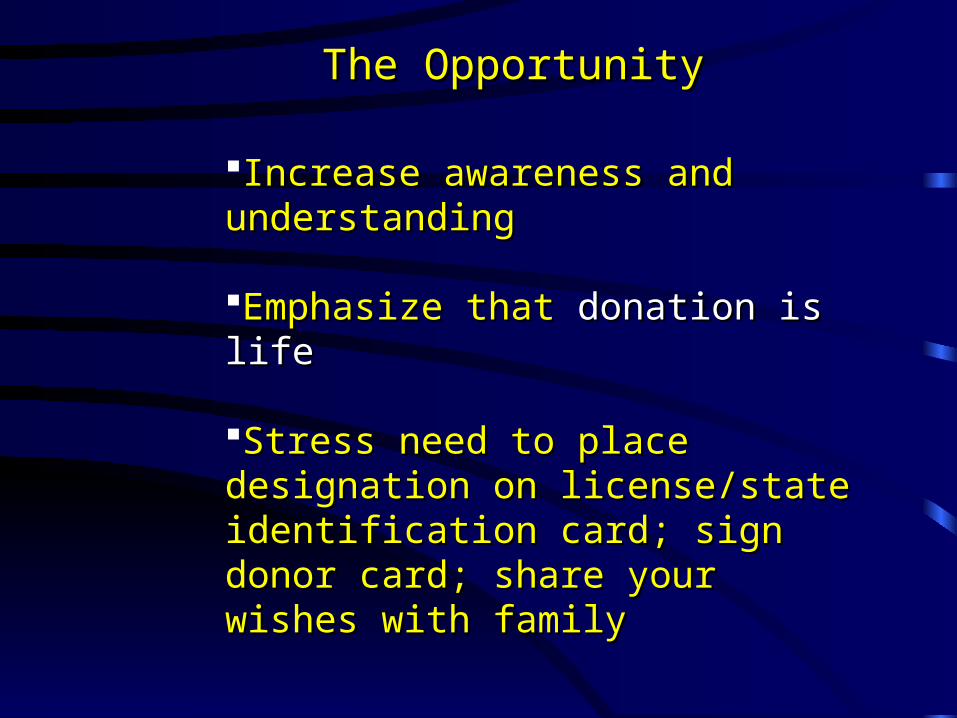
The OpportunityThe Opportunity
Increase awareness and Increase awareness and understandingunderstanding
Emphasize that Emphasize that donation is lifedonation is life
Stress need to place designation Stress need to place designation on license/state identification on license/state identification card; sign donor card; share your card; sign donor card; share your wishes with familywishes with family