
Bringing leaders together - cfwiwater.com
112
Transcript of Bringing leaders together - cfwiwater.com

The mission of the Urban Land Institute (ULI) is to provide leadership in the responsible use of land and in creating and sustaining thriving communities worldwide. Founded in 1936, ULI has over 30,000 members worldwide, representing the entire spectrum of land use and real estate development disciplines, working in private enterprise and public service. ULI is committed to:
Bringing leaders together
Fostering collaboration
Exploring land use and development issues
Advancing policies and practices
Sharing knowledge
Creating a global network with local impact
ULI Central Florida is ULI at the local level. Through District Council–sponsored educational forums and events, ULI Central Florida offers an unbiased, nonpartisan, and open exchange of ideas impacting land use and the quality of life in Central Florida.
Chair: Gregg T. Logan Managing Partner, RCLCO www.rclco.com CentralFlorida.uli.org
Established in 1999 and led by a group of public, private and civic leaders, myregion.org is encouraging unprecedented regional cooperation among community leaders to create a coordinated, comprehensive plan for Central Florida's future. By creating a shared 50-year vision for the region, myregion.org is ensuring Central Florida's place in the global economy and improving opportunities for generations to come.
President: Shelley Lauten myregion.org www.myregion.org Chair: Laura Boisvert Regional Vice President, Progress Energy progress-energy.com/
Congress of Regional Leaders. The ―Creating a Regional Water Strategy‖ project is being prepared on behalf of the Central Florida Congress of Regional Leaders. The Congress of Regional Leaders serves as the regional organization of
elected officials that will help encourage implementation of the Central Florida Regional Growth Vision by developing common policies and practices around the six Regional Principles of Growth adopted in the Regional Vision.
The Congress of Regional Leaders includes 16 elected officials representing city and county governments and the school boards of the seven Central Florida counties (Brevard, Lake, Orange, Osceola, Polk, Seminole, and Volusia).
Chair: The Honorable Gary Bruhn Town of Windermere
Past Chair: The Honorable Frank T. Bruno, Jr. Volusia County Council
The Honorable John F. Bush City of Winter Springs
The Honorable Welton G. Cadwell, Jr. Lake County Commission
The Honorable Melissa DeMarco City of Mount Dora
The Honorable Thomas Eschenberg Town of Malabar
The Honorable Cheryl Grieb City of Kissimmee
The Honorable Carlton D. Henley, Sr. Seminole County Commission
The Honorable Sam Johnson Polk County Commission
The Honorable Candace Lankford Volusia County Public Schools
The Honorable Chuck Nelson Brevard County Board of Commissioners
The Honorable John Q. Quiñones Osceola County Commission
The Honorable Linda Riner-Mizell Town of Dundee
The Honorable Nancy Robbinson Orange County Public Schools
The Honorable Bill Segal Orange County Commission
The Honorable Roland Via City of Holly Hill
Funding Partners. Funding for this project is provided by the following partners:
ULI Central Florida is grateful to the following individuals who supported this project by providing technical expertise, insight and perspective:
www.vhbmillersellen.com
ULI Vice Chair: James A. Sellen Principal, VHB MillerSellen
Duane E. De Freese, Ph.D. Aquafiber Technologies Corporation
Cain Diehl ECS – Florida
Steve Flanagan Land Advisors Organization
Steve Kintner Volusia County (retired)
Tara McCue East Central Florida Regional Planning Council
Randy Mejeur AECOM Design + Planning
Curt Ostrodka VHB MillerSellen
John Prowell VHB MillerSellen
Nicole Stalder Bowyer Singleton & Associates, Inc.
Joel Thomson Thomson Environmental Consulting
Diane Trees UCF Metropolitan Center for Regional Studies
Mark Loeb, LEED AP Manager, ULI Central Florida Urban Land Institute 964 Lake Baldwin Lane, Suite 100 Orlando, FL 32814 [email protected] CentralFlorida.uli.org ULI–the Urban Land Institute 1025 Thomas Jefferson Street, N.W. Suite 500 West Washington, D.C. 20007-5201
Vilma Quintana Vice President of Community Engagement myregion.org Project Advisor: Steve Seibert Senior Vice President for Strategic Visioning Collins Center for Public Policy www.collinscenter.org/

This Briefing Book serves as a compendium of information related to the Supply, Demand and Conservation phase of the Creating a Regional Water Strategy for Central Florida project. The Briefing Book is intended to collect the best currently available data related to the topic to inform stakeholders, experts and regional leaders in creating a regional water strategy for Central Florida. It is not intended to draw conclusions or make recommendations. A second Briefing Book will be created specifically for the second phase of the project. The data contained in the Briefing Book is drawn from publically available sources. Because data sources can vary in their methodology and conclusions, inconsistencies are inevitable. The Briefing Book attempts to address this where possible but does not eliminate them entirely. Website links are provided throughout the document for convenience. The presence of these links is not intended to imply endorsement of the websites or the organizations represented. Data sources and websites are subject to change. ULI, through its Advisory Services Program, assembles teams of experts who volunteer their time to provide objective advice on challenging land use and infrastructure issues. The interdisciplinary teams assembled by ULI provide an unbiased set of recommendations for strategic action. The team includes people and expertise that may not be available by any other means. Volunteers are not permitted to be engaged in activities that constitute a conflict of interest in order to achieve the goals of the project.
1.1. Creating a Regional Water Strategy Project Background 1.2. Stakeholder Process and Participants 1.3. Project Timeline 1.4. Problem Statement 1.5. Project Goals and Outcomes
2.1. County Stakeholder Meetings 2.2. Key Themes and Issues 2.3. Stakeholder Survey
3.1. A Brief Water History of Central Florida
3.1.1. Floridan Aquifer 3.2. History of Water Regulations 3.3. Water Management Districts 3.4. Consumptive Use Permits
3.4.1. Permit Overview 3.4.2. St. Johns River Water Management District 3.4.3. South Florida Water Management District 3.4.4. Southwest Florida Water Management District
3.5. Southern Water Use Caution Area 3.6. Land Use Planning
3.6.1. State, Regional and Local Comprehensive Planning 3.6.2. Concurrency and Level of Service Standards
3.7. Emerging Regulatory Requirements 3.7.1. Central Florida Coordination Area 3.7.2. CFCA Permit Cap 3.7.3. Total Maximum Daily Load
4.1. Trend Projections
4.1.1. Population 4.1.2. Tourism
4.2. Water Use 4.2.1. Projected Water Use 4.2.2. Major Permitted Users by County 4.2.3. Water Use by Source 4.2.4. Consumption (municipal, utility, agriculture, private wells, etc.)
4.3. Utility Service Areas and Agreements 4.4. Water Use by Source 4.5. Summary of Water Supply Conditions Today
4.5.1. What We Know 4.5.2. What We Do Not Know
4.6. Comparison between Projected Future Conditions and Available Supply
5.1. Project Area Structure/Rates
5.1.1. Revenue Requirements 5.1.2. Basic Rate Design 5.1.3. Rate Comparison 5.1.4. Rate Structures 5.1.5. Price Elasticity 5.1.6. Optimizing Water Rate Design 5.1.7. Drought Rates 5.1.8. Projected Customer Usage 5.1.9. Conclusions
5.2. Structure/Rates from other Areas
6.1. Hydrologic Cycle 6.2. Hydrologic Components
6.2.1. Rainfall in Central Florida 6.2.2. Comparison of Rainfall in Other Areas 6.2.3. Freshwater Discharges 6.2.4. Recharge Areas
6.3. Climate Change 6.3.1. Sea Level Rise Implications 6.3.2. Water Resource Implications
7.1. Conservation
7.1.1. Background 7.1.2. Water Conservation Programs and Information 7.1.3. Common Water Conservation Techniques 7.1.4. Incentives, Pricing and Cost Structure 7.1.5. Policy and Restrictions
7.2. Alternative Water Sources 7.2.1. Stormwater Reuse 7.2.2. Wastewater Reuse/Reclaimed Water 7.2.3. Desalination 7.2.4. Surface Water 7.2.5. Aquifer Storage and Recovery 7.2.6. Non-traditional Groundwater
7.3. Educational Programs 7.4. Estimated Cost of Water Supply Alternatives
A. Regional Water Strategy Steering Committee B. CFCA Planning Work Group Final Report C. ECFRPC Strategic Regional Policy Plan: Water D. Stakeholder Meeting Minutes E. Stakeholder Survey F. Additional Resources

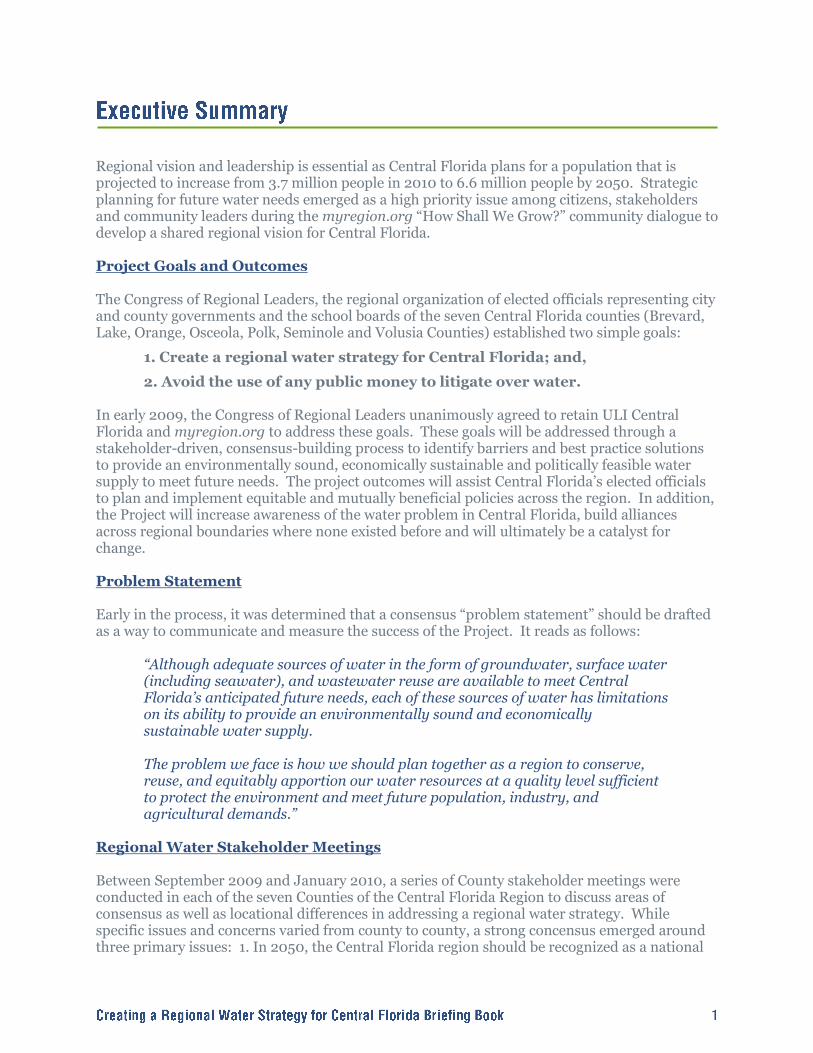
Regional vision and leadership is essential as Central Florida plans for a population that is projected to increase from 3.7 million people in 2010 to 6.6 million people by 2050. Strategic planning for future water needs emerged as a high priority issue among citizens, stakeholders and community leaders during the myregion.org ―How Shall We Grow?‖ community dialogue to develop a shared regional vision for Central Florida. Project Goals and Outcomes The Congress of Regional Leaders, the regional organization of elected officials representing city and county governments and the school boards of the seven Central Florida counties (Brevard, Lake, Orange, Osceola, Polk, Seminole and Volusia Counties) established two simple goals:
1. Create a regional water strategy for Central Florida; and,
2. Avoid the use of any public money to litigate over water. In early 2009, the Congress of Regional Leaders unanimously agreed to retain ULI Central Florida and myregion.org to address these goals. These goals will be addressed through a stakeholder-driven, consensus-building process to identify barriers and best practice solutions to provide an environmentally sound, economically sustainable and politically feasible water supply to meet future needs. The project outcomes will assist Central Florida‘s elected officials to plan and implement equitable and mutually beneficial policies across the region. In addition, the Project will increase awareness of the water problem in Central Florida, build alliances across regional boundaries where none existed before and will ultimately be a catalyst for change. Problem Statement Early in the process, it was determined that a consensus ―problem statement‖ should be drafted as a way to communicate and measure the success of the Project. It reads as follows:
“Although adequate sources of water in the form of groundwater, surface water (including seawater), and wastewater reuse are available to meet Central Florida’s anticipated future needs, each of these sources of water has limitations on its ability to provide an environmentally sound and economically sustainable water supply. The problem we face is how we should plan together as a region to conserve, reuse, and equitably apportion our water resources at a quality level sufficient to protect the environment and meet future population, industry, and agricultural demands.”
Regional Water Stakeholder Meetings Between September 2009 and January 2010, a series of County stakeholder meetings were conducted in each of the seven Counties of the Central Florida Region to discuss areas of consensus as well as locational differences in addressing a regional water strategy. While specific issues and concerns varied from county to county, a strong concensus emerged around three primary issues: 1. In 2050, the Central Florida region should be recognized as a national

and global leader for its management of regional water resources in an economically and environmentally sustainable way; 2. The best available science should drive planning and policy decisions; and 3. Identification and use of groundwater and alternative water supplies (including aggressive conservation efforts) can be coupled with innovative best management practices to ensure the availability of clean and affordable water fornfuture generations. Regulation of Water Use in Florida Water use and regulation have changed rapidly in Florida as the human population has grown and primary water sources shifted from surface waters to groundwater. A diverse range of public agencies (from local municipalities, counties, regional water management districts, regional planning councils, and state agencies like the Florida Department of Environmental Protection, Florida Department of Health and Florida Department of Agriculture and Consumer Services) oversee water planning and regulations in Florida. Florida is blessed with a diverse, dedicated and highly trained network of regulatory agencies, stakeholder associations and water utilities (public and private) that help to shape and enforce water policy and regulations in Florida. This diversity can also create challenges. While these agencies operate under the same state and federal laws, it is not uncommon to see regional and agency variations in both interpretation and enforcement of existing law. Water Demand and Consumption The Central Florida region‘s Water Management Districts have jointly concluded that the availability of sustainable quantities of groundwater in Central Florida is insufficient on a regional basis to meet future water demands and there is an immediate need to develop and implement alternative water supply (AWS) projects in addition to continued aggressive conservation and reuse of reclaimed water. The Central Florida Coordination Area (CFCA) report (2008), a study by the St Johns River, South Florida, and Southwest Florida Water Management Districts, found that current potable water consumption will reach an unsustainable level by the year 2013. Beyond the 2013 level of demand, AWS sources must be developed to meet future demands. Natural Conditions On average, Central Florida receives between 50 and 54 inches of rain annually with at least half of it occurring during the wet summer months. Intense afternoon thunderstorms accompanied by wind and lightning are frequent. These rains can be geographically localized and often of short duration. Extreme rainfall events can occur during tropical storms. While rainfall appears to be abundant, Central Florida experiences severe and prolonged periods of drought as well as episodes of intense rainfall and floods. Central Florida‘s high temporal and spatial variability in rainfall is typical and yet unpredictable. Understanding complex regional weather patterns in conjunction with long-term global climate factors will continue to be a challenge for Florida‘s water managers. On average, 70% of Florida‘s rainwater is lost as evapotranspiration to the atmosphere, 20% is lost as runoff into surface water bodies and 10% percolates into the ground to recharge wells and aquifers. The amount of rain water that infiltrates the ground and recharges aquifers is influenced by precipitation, soil infiltration rate, sediment characteristics, geology, relationship of surface water bodies to surficial sediments, and land use patterns. The majority of recharge to the Floridan aquifer system occurs in the areas where it is unconfined or semi-confined,

approximately 10-25 in/year, whereas in the areas of confinement the recharge is less than 1 in/year. Water Cost Structures and Rates Every water utility in Central Florida has a different customer mix and various economic conditions within its service area that can influence water cost structures, rates and usage habits from its customers. Without consideration of other outside variables that change a customer‘s water usage habits, it is assumed that as the price of water increases demand or consumption will decrease. If the price of water is set too high, there could be too few gallons consumed to recover the revenue requirement. This could lead to an upward pressure on rates and potential efforts to reduce variable expenses. However, the effect of reducing variable expenses is limited by the fact that in general, variable costs may represent only 15%-25% of the revenue requirement. The remaining 85%-75% are fixed costs that would be unaffected by reductions in water demand. The great challenge to water utilities and managers is to balance the desire to discourage waste and promote conservation and at the same time deliver affordable rates to the masses and especially for those who struggle to meet basic needs. Projected Future Conditions Florida water managers must address some emerging impacts to our water resources that compound the fundamental challenge to meet the water needs of a growing human population. These challenges include understanding complex issues that influence residential, industrial and agricultural water use trends; local and regional impacts to water resources from global climate change; global sea level rise and saltwater infiltration into groundwater and freshwater tributary surface waters; and water quality impacts from a growing list of water pollution issues from nutrient over-enrichment and harmful algal blooms to new industrial pollutants of emerging concern. Water Supply Alternatives To meet the anticipated water supply needs of a diverse and growing Central Florida population, alternative water sources (including conservation) have been identified to fully evaluate its feasibility. Alternatives include: water conservation, innovative rainwater capture techniques, stormwater reuse, wastewater reuse, desalination, surface waters, aquifer storage and recovery, and non-traditional groundwater supplies. Each water supply alternative has limitations on its ability to provide an environmentally sound and economically sustainable water supply to meet future needs. Communicating the need for problem-solving through education and outreach can be an effective technique.


1.1. Creating a Regional Water Strategy Project Background In 2006 and 2007, myregion.org asked nearly 20,000 Central Floridians the question, How Shall We Grow? Through a series of interactive community conversations, the message was clear: Central Floridians desire a future where the region consumes less land, preserves more precious environmental resources and natural countryside, creates more distinctive places to live in both rural and urban areas, and provides more choices for how people travel all while accommodating a population that is expected to increase from 3.7 million in 2010 to 6.6 million people by 2050. [BEBR Projections of Florida Population by County, 2009-2035 Volume 43, Bulletin 156, March 2010] The inexpensive groundwater that Central Florida has traditionally relied upon as a primary source of potable water will not be adequate to meet all future needs in the seven-county Central Florida region (Brevard, Lake, Orange, Osceola, Polk, Seminole and Volusia Counties) should current trends continue. Refer to Exhibit 1-1 for an illustration of the project area. As stipulated on Page 20 of How Shall We Grow? – A Shared Vision for Central Florida, availability of water to meet future growth while protecting the environment emerged as a critical issue. Preserving and enjoying natural resources is of upmost importance to citizens across the region and is the foundation of the Regional Growth Vision on water:
“Plan for future water needs. The region also should develop strategies for providing sufficient water and ensuring that water supply is in place to support new development. A regional water resources plan should include strategies for reducing consumption, sharing available water sources and developing alternative water sources.”
In addition, the three Water Management Districts with jurisdiction in the seven-county region (St. Johns River, South Florida and Southwest Florida) found similar conclusions as early as 2000 in their Regional Water Supply Plans. In 2006 as a part of a cooperative effort, jointly stated:
“the districts have jointly concluded that the availability of sustainable quantities of groundwater in Central Florida is insufficient on a regional basis to meet future water demands and there is an immediate need to develop and implement alternative water supply (AWS) projects in addition to continued aggressive conservation and reuse of reclaimed water…Beyond the 2013 level of demand, AWS sources must be developed to meet future demands. [Recommended Action Plan for the Central Florida Coordination Area, September 18, 2006]

With the threat of no new groundwater permits being issued to meet new water demands that occur beyond 2013 and no agreed-upon comprehensive regional strategy and implementation plan in place, the Congress of Regional Leaders, the regional organization of elected officials representing city and county governments and the school boards of Central Florida made water its top priority by adopting two overarching goals:
1. Create a regional water strategy for Central Florida; and,
2. Avoid the use of any public money to litigate over water. Spending money on litigation does not produce one drop of new water.
In early 2009, the Congress of Regional Leaders unanimously agreed to retain ULI Central Florida and myregion.org to address these goals through the stakeholder process and timetable described below. It is well understood that water resources do not respect political boundaries so only a regional approach will result in a meaningful outcome. Regional decision makers, stakeholders and experts will be engaged through partnerships, dialog, education, research and sharing of best practices.
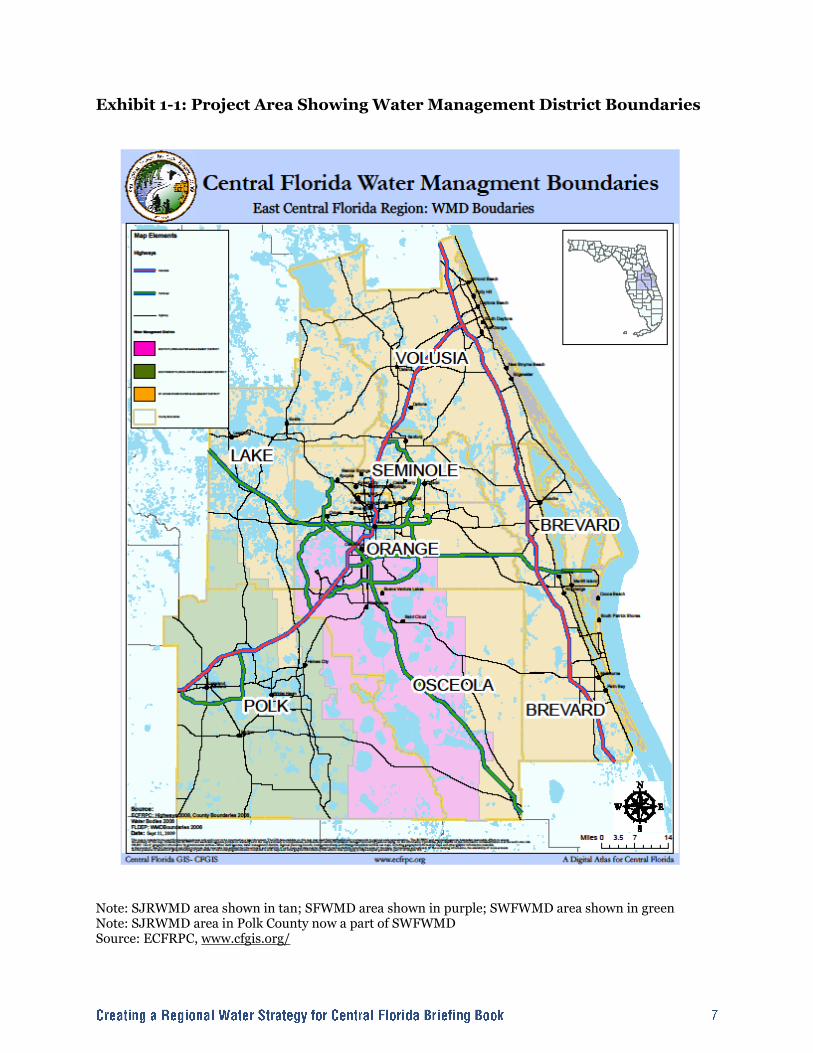
Exhibit 1-1: Project Area Showing Water Management District Boundaries
Note: SJRWMD area shown in tan; SFWMD area shown in purple; SWFWMD area shown in green Note: SJRWMD area in Polk County now a part of SWFWMD Source: ECFRPC, www.cfgis.org/

1.2. Stakeholder Process and Participants Creating a Regional Water Strategy for Central Florida (Project) seeks to develop a regional water strategy through a consensus-building process to identify barriers and best practice solutions to provide environmentally sound, economically sustainable and politically feasible water supply sources to meeting future needs. The Project is divided into three sequential phases:
1. Water Supply, Demand & Conservation: This phase examines practical and economical solutions to provide for future growth.
2. Water Governance: This phase examines regional partnerships, incentives and cooperative approaches to ensure an equitable distribution of regional water.
3. Regional Leadership Academy: This phase will ensure regional leaders have the tools and training needed to provide outreach to thousands of citizens
The Project is engaging a diverse group of stakeholders including water managers, utility providers, public officials, civic and business leaders, land owners, developers, environmental and agricultural interests, engineers, land planners, environmental engineers and hydrologists through a public process. A Regional Water Steering Committee drawn from the leadership within these disciplines was formed. Refer to the Appendix A for a list of members. The first two phases entail the following steps:
Identify Issues/Data Collection: Project issues will be identified through two means: Stakeholder meetings in all seven Counties designed to elicit regional solutions; and, through identification and compilation of existing data sources.
Prepare Briefing Book: A Briefing Book will be prepared to consolidate data and serve as a project reference for stakeholders.
Convene Workshop: A two-day workshop including statewide and national experts and regional stakeholders will be convened to review the issues and make recommendations.
Prepare White Paper: At the conclusion of the workshop, a written summary report in the form of a White Paper on the findings and recommendations will be completed for submittal to the Congress of Regional Leaders for consideration and implementation.
The third phase of the Project will entail a Regional Leadership Academy to educate and build consensus among executive-level elected and appointed public officials, business, and civic and environmental leaders on the issues and Project recommendations so they can then provide education and outreach to the public. In the spirit of How Shall We Grow? it is anticipated that the ―community conversations‖ will eventually reach between 10,000 and 20,000 citizens.
1.3. Project Timeline Phase I: Water Supply, Demand & Conservation
Regional Water Problem/Issues Identification: July 2009-January 2010
Briefing Book Preparation: February-June 2010
Water Supply, Demand & Conservation Workshop: July 2010
White Paper Preparation: July-August 2010
Presentation to Congress of Regional Leaders: Fall 2010 Phase II: Water Governance
Briefing Book Preparation: Fall 2010
Water Governance Workshop: Late 2010
White Paper Preparation: Early 2011
Presentation to Congress of Regional Leaders: Early 2011 Phase III: Regional Leadership Academy
To be determined
1.4. Problem Statement At its first meeting, the Regional Water Steering Committee determined that a consensus ―problem statement‖ should be drafted as a way to communicate and measure the success of the Project. The Problem Statement has been reviewed and updated throughout the process based on feedback from the Congress of Regional Leaders, myregion.org Board of Directors and County stakeholders. It reads as follows:
“Although adequate sources of water in the form of groundwater, surface water (including seawater), and wastewater reuse are available to meet Central Florida’s anticipated future needs, each of these sources of water has limitations on its ability to provide an environmentally sound and economically sustainable water supply. The problem we face is how we should plan together as a region to conserve, reuse, and equitably apportion our water resources at a quality level sufficient to protect the environment and meet future population, industry, and agricultural demands.”
1.5. Project Goals and Outcomes The goal of Creating a Regional Water Strategy for Central Florida is to create a strategy through a stakeholder-driven, consensus-building process to identify barriers and best practice solutions to provide an environmentally sound, economically sustainable and politically feasible water supply to meet future needs. The project outcomes will assist Central Florida‘s elected officials to plan and implement equitable and mutually beneficial policies across the region. In addition, the Project will increase awareness of the water problem in Central Florida, build alliances across regional boundaries where none existed before and will ultimately be a catalyst for change.

2.1. County Stakeholder Meetings Between September 2009 and January 2010, a series of County stakeholder meetings were conducted in each of the seven Counties to discuss areas of consensus as well as locational differences in creating a regional water strategy. Meetings were organized by County representatives who either served on the Regional Water Steering Committee and/or by representatives of the Congress of Regional Leaders. Attendees were selected by their County organizers to represent a cross-section of stakeholders involved in water issues including representatives from local utilities, public officials, civic leaders, environmental community, land owners, engineers, hydrologists, Water Management Districts and FDEP. Each meeting consisted of an introduction to the Project followed by a working exercise. The working exercise involved breaking-out attendees into groups to address the following:
Consider this: It‘s the year 2050 and Central Florida is recognized as international leaders managing its regional water supply in an environmentally and economically sustainable way.
Question 1. What did the region do to provide for an environmentally and economically sustainable supply of groundwater?
Question 2. What did the region do to provide for an environmentally and sustainable supply of surface water?
Question 3. What did the region do to provide for an environmentally and economically sustainable supply of reuse water to reduce overall demand?
Question 4. What did the region do to reduce demand for water in an environmentally and economically sustainable manner?
2.2. Key Themes and Issues For complete notes from each County Stakeholder meeting, please refer to Appenix D. Brevard County Meeting – Sept 28, 2009
Consensus needed on science and groundwater assumptions that underline problem statement
Consensus needed on withdrawal limits
Equitable development, cost, and distribution of water across region
Development of desalination. Lake County Meeting – November 4, 2009
Limit the issuance of Consumptive Use Permits by WMD‘s, WMD refocus on conservation first and permit for beneficial use.
WMD‘s uncertainty on water modeling
Education Barriers– Understandable water bills, conservation pricing, reuse value
Understand surface water sustainability (minimum lake levels and flows)
Stormwater use for irrigation
Reuse Storage
Existing home retrofits
Cost Barriers to AWS, cost sharing, cost of retrofits
Appropriate focus on industrial, commercial other and big users. Osceola County Meeting – November 5, 2009
Wells for drinking water only, monitoring of wells, well use regulation
AWS Storage Network – Surface water, reuse water
Need model of available water for environment and consumption
Public Education
Direct reuse water to biggest users for best efficiency.
Establish reuse water goals
Conservation measures, incentives and education. Regionally consistent governance.
Stormwater rules vs. water supply constraints Orange County Meeting – November 10, 2009
Incentivized technology at homeowner and infrastructure level that put in place technology for capturing and saving water.
Establish equitable demand ―allowances‖ for each user. Create ―cap and trade‖ method that allows for allocation and trade of water credits. Communities could then either sell or buy credits depending on how they manage their own water.
Advanced use of stormwater as an alternative source.
Need for incentives for encouraging reduced use (tax credits)
Also need to have pricing incentives. Polk County Meeting – December 8, 2009
Focus and develop surface water and groundwater storage strategies.
Need to take regional approach by including coastal communities, including Tampa area.
Land Use Transition - Agriculture demands are unique in Polk County and may not decrease at same rate as in the region.
Development of the Polk County Comprehensive Water Supply Plan is a great model for
developing a water strategy as it has brought local staff and the water management districts together with stakeholders and residents.
Seminole County Meeting – January 25, 2010
Avoid lawsuits (and costs) by having common understanding and Agreements between stakeholders
Focus on conservation through reduction in irrigation and improvement in landscape design
Private wells need better regulation
Protect recharge areas
Quantify excess surface water availability as top priority
Think regionally Volusia County Meeting – October 22, 2009
Purchase of environmentally sensitive recharge areas. Purchase watersheds to replenish our ground water.
Collection of rainwater, storm water runoff, river water high flow, etc. to reservoirs and cisterns
Submeter & charge individual wells
Tiered rate structure (more you use the more you pay)
Created Regional storage and distribution networks to collect all available resources. Network also was created on local and micro-scale to reduce infrastructure and transportation costs.
Expand reuse lines to the entire region and make it mandatory.
All cities and counties enacted green building ordinances that require water wise/low use plumbing fixtures.
Upon completion of the county stakeholder meetings, results were then tabulated into a matrix to compare responses based on frequency grouped within common categories (refer to Exhibit 2-1).
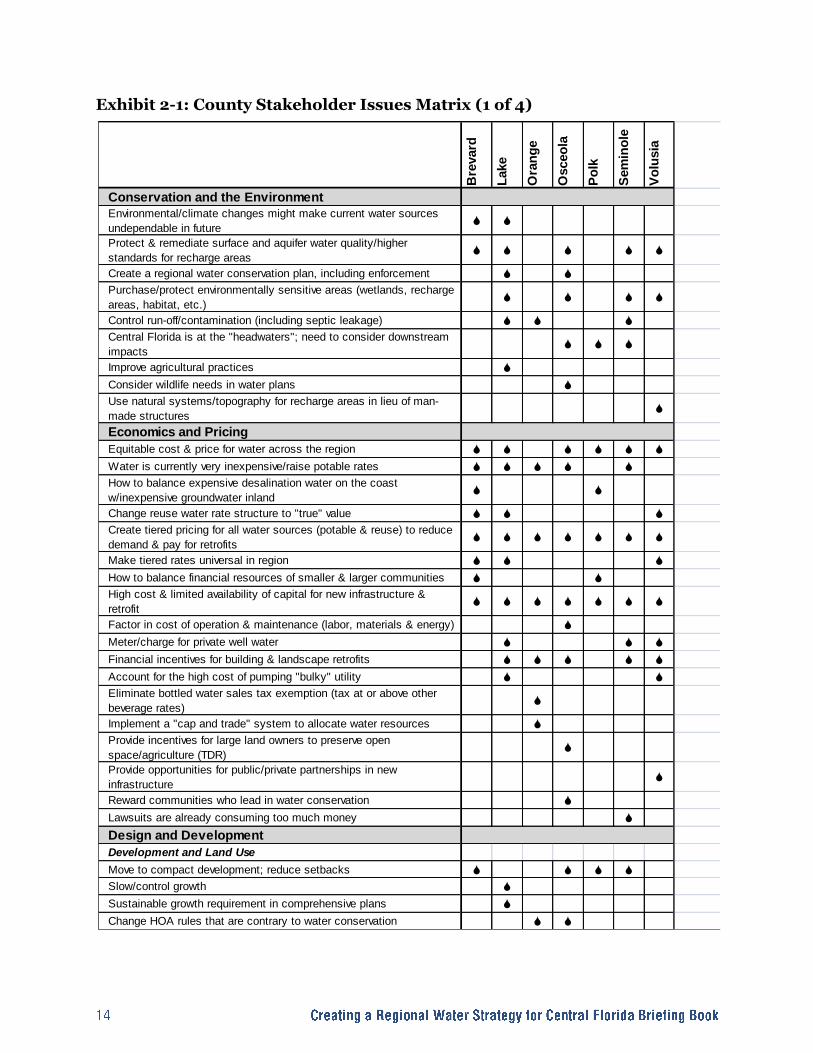
Exhibit 2-1: County Stakeholder Issues Matrix (1 of 4)
Bre
vard
Lake
Ora
ng
e
Osceo
la
Po
lk
Sem
ino
le
Vo
lusia
Conservation and the Environment
Environmental/climate changes might make current water sources
undependable in futureS S
Protect & remediate surface and aquifer water quality/higher
standards for recharge areasS S S S S
Create a regional water conservation plan, including enforcement S S
Purchase/protect environmentally sensitive areas (wetlands, recharge
areas, habitat, etc.)S S S S
Control run-off/contamination (including septic leakage) S S S
Central Florida is at the "headwaters"; need to consider downstream
impactsS S S
Improve agricultural practices S
Consider wildlife needs in water plans S
Use natural systems/topography for recharge areas in lieu of man-
made structuresS
Economics and Pricing
Equitable cost & price for water across the region S S S S S S
Water is currently very inexpensive/raise potable rates S S S S S
How to balance expensive desalination water on the coast
w/inexpensive groundwater inlandS S
Change reuse water rate structure to "true" value S S S
Create tiered pricing for all water sources (potable & reuse) to reduce
demand & pay for retrofitsS S S S S S S
Make tiered rates universal in region S S S
How to balance financial resources of smaller & larger communities S S
High cost & limited availability of capital for new infrastructure &
retrofitS S S S S S S
Factor in cost of operation & maintenance (labor, materials & energy) S
Meter/charge for private well water S S S
Financial incentives for building & landscape retrofits S S S S S
Account for the high cost of pumping "bulky" utility S S
Eliminate bottled water sales tax exemption (tax at or above other
beverage rates)S
Implement a "cap and trade" system to allocate water resources S
Provide incentives for large land owners to preserve open
space/agriculture (TDR)S
Provide opportunities for public/private partnerships in new
infrastructureS
Reward communities who lead in water conservation S
Lawsuits are already consuming too much money S
Design and Development
Development and Land Use
Move to compact development; reduce setbacks S S S S
Slow/control growth S
Sustainable growth requirement in comprehensive plans S
Change HOA rules that are contrary to water conservation S S
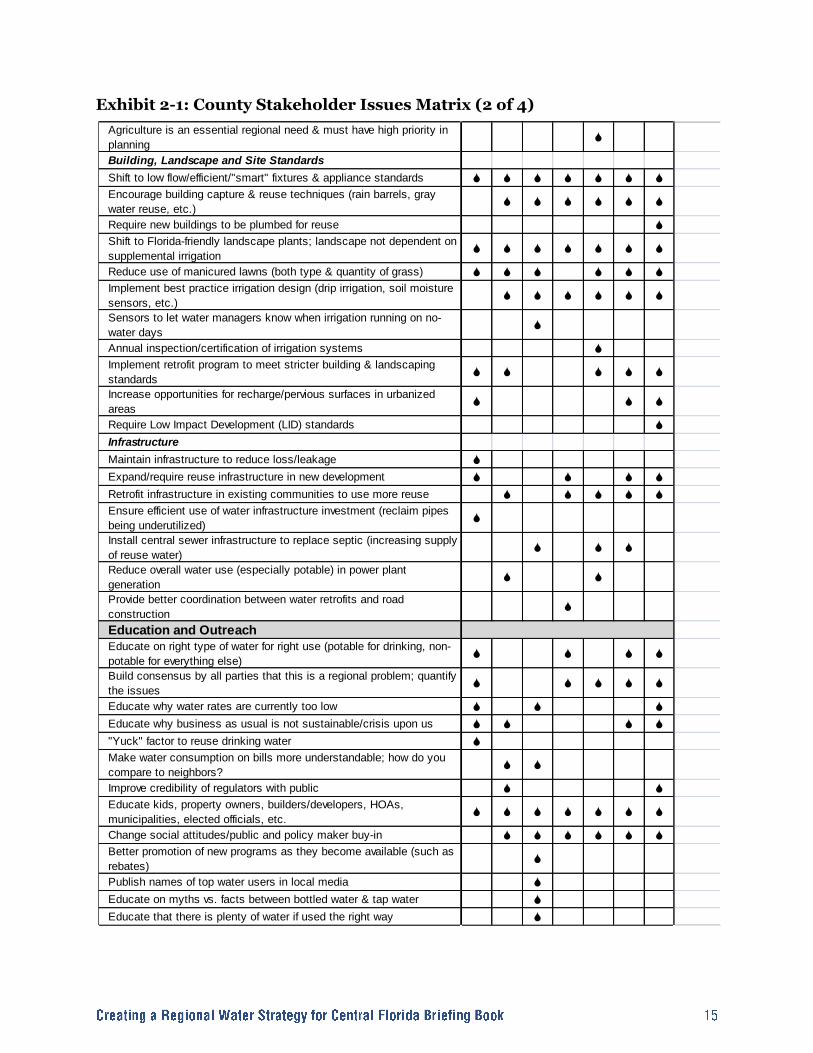
Exhibit 2-1: County Stakeholder Issues Matrix (2 of 4)
Agriculture is an essential regional need & must have high priority in
planningS
Building, Landscape and Site Standards
Shift to low flow/efficient/"smart" fixtures & appliance standards S S S S S S S
Encourage building capture & reuse techniques (rain barrels, gray
water reuse, etc.)S S S S S S
Require new buildings to be plumbed for reuse S
Shift to Florida-friendly landscape plants; landscape not dependent on
supplemental irrigationS S S S S S S
Reduce use of manicured lawns (both type & quantity of grass) S S S S S S
Implement best practice irrigation design (drip irrigation, soil moisture
sensors, etc.)S S S S S S
Sensors to let water managers know when irrigation running on no-
water daysS
Annual inspection/certification of irrigation systems S
Implement retrofit program to meet stricter building & landscaping
standardsS S S S S
Increase opportunities for recharge/pervious surfaces in urbanized
areasS S S
Require Low Impact Development (LID) standards S
Infrastructure
Maintain infrastructure to reduce loss/leakage S
Expand/require reuse infrastructure in new development S S S S
Retrofit infrastructure in existing communities to use more reuse S S S S S
Ensure efficient use of water infrastructure investment (reclaim pipes
being underutilized)S
Install central sewer infrastructure to replace septic (increasing supply
of reuse water)S S S
Reduce overall water use (especially potable) in power plant
generationS S
Provide better coordination between water retrofits and road
constructionS
Education and Outreach
Educate on right type of water for right use (potable for drinking, non-
potable for everything else)S S S S
Build consensus by all parties that this is a regional problem; quantify
the issuesS S S S S
Educate why water rates are currently too low S S S
Educate why business as usual is not sustainable/crisis upon us S S S S
"Yuck" factor to reuse drinking water S
Make water consumption on bills more understandable; how do you
compare to neighbors?S S
Improve credibility of regulators with public S S
Educate kids, property owners, builders/developers, HOAs,
municipalities, elected officials, etc.S S S S S S S
Change social attitudes/public and policy maker buy-in S S S S S S
Better promotion of new programs as they become available (such as
rebates)S
Publish names of top water users in local media S
Educate on myths vs. facts between bottled water & tap water S
Educate that there is plenty of water if used the right way S
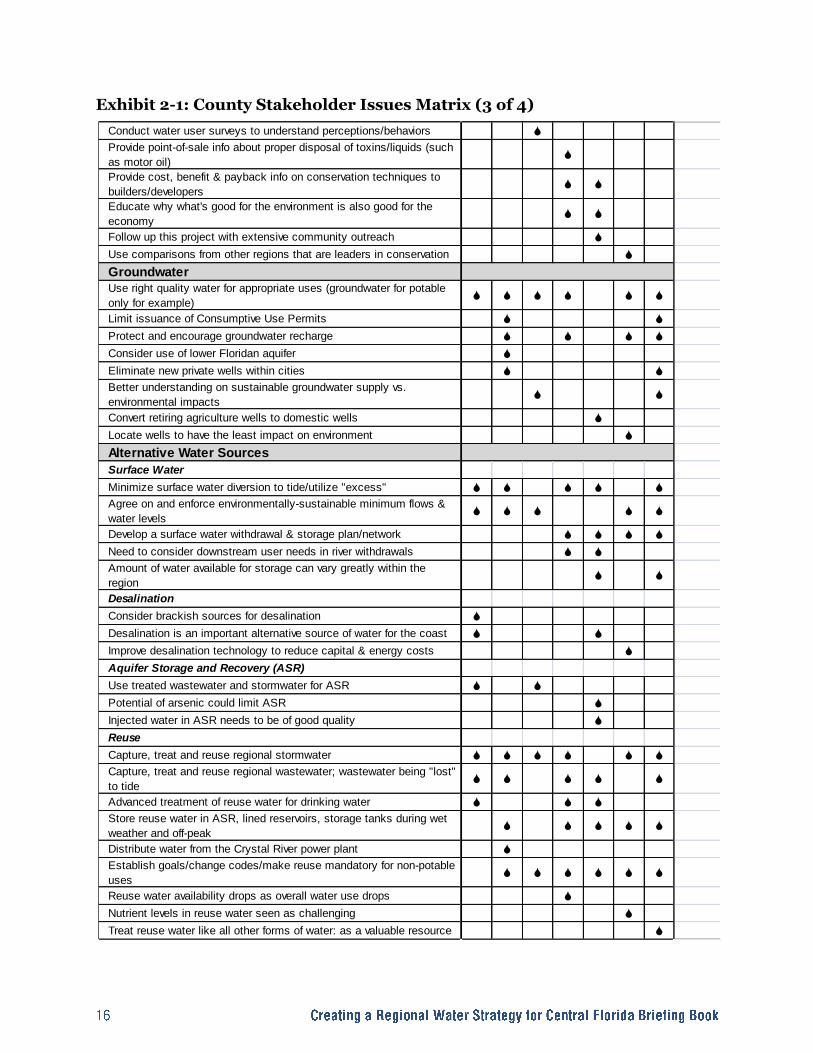
Exhibit 2-1: County Stakeholder Issues Matrix (3 of 4)
Conduct water user surveys to understand perceptions/behaviors S
Provide point-of-sale info about proper disposal of toxins/liquids (such
as motor oil)S
Provide cost, benefit & payback info on conservation techniques to
builders/developersS S
Educate why what's good for the environment is also good for the
economyS S
Follow up this project with extensive community outreach S
Use comparisons from other regions that are leaders in conservation S
Groundwater
Use right quality water for appropriate uses (groundwater for potable
only for example)S S S S S S
Limit issuance of Consumptive Use Permits S S
Protect and encourage groundwater recharge S S S S
Consider use of lower Floridan aquifer S
Eliminate new private wells within cities S S
Better understanding on sustainable groundwater supply vs.
environmental impactsS S
Convert retiring agriculture wells to domestic wells S
Locate wells to have the least impact on environment S
Alternative Water Sources
Surface Water
Minimize surface water diversion to tide/utilize "excess" S S S S S
Agree on and enforce environmentally-sustainable minimum flows &
water levelsS S S S S
Develop a surface water withdrawal & storage plan/network S S S S
Need to consider downstream user needs in river withdrawals S S
Amount of water available for storage can vary greatly within the
regionS S
Desalination
Consider brackish sources for desalination S
Desalination is an important alternative source of water for the coast S S
Improve desalination technology to reduce capital & energy costs S
Aquifer Storage and Recovery (ASR)
Use treated wastewater and stormwater for ASR S S
Potential of arsenic could limit ASR S
Injected water in ASR needs to be of good quality S
Reuse
Capture, treat and reuse regional stormwater S S S S S S
Capture, treat and reuse regional wastewater; wastewater being "lost"
to tideS S S S S
Advanced treatment of reuse water for drinking water S S S
Store reuse water in ASR, lined reservoirs, storage tanks during wet
weather and off-peakS S S S S
Distribute water from the Crystal River power plant S
Establish goals/change codes/make reuse mandatory for non-potable
usesS S S S S S
Reuse water availability drops as overall water use drops S
Nutrient levels in reuse water seen as challenging S
Treat reuse water like all other forms of water: as a valuable resource S
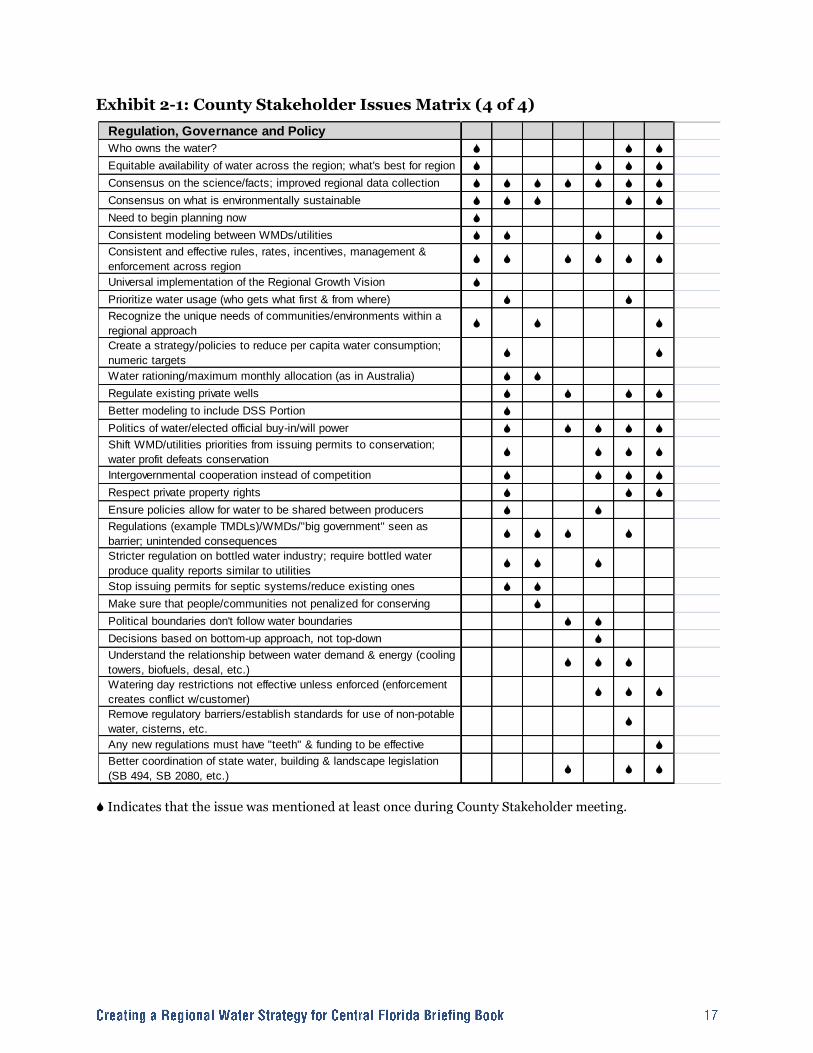
Exhibit 2-1: County Stakeholder Issues Matrix (4 of 4)
S Indicates that the issue was mentioned at least once during County Stakeholder meeting.
Regulation, Governance and Policy
Who owns the water? S S S
Equitable availability of water across the region; what's best for region S S S S
Consensus on the science/facts; improved regional data collection S S S S S S S
Consensus on what is environmentally sustainable S S S S S
Need to begin planning now S
Consistent modeling between WMDs/utilities S S S S
Consistent and effective rules, rates, incentives, management &
enforcement across regionS S S S S S
Universal implementation of the Regional Growth Vision S
Prioritize water usage (who gets what first & from where) S S
Recognize the unique needs of communities/environments within a
regional approachS S S
Create a strategy/policies to reduce per capita water consumption;
numeric targetsS S
Water rationing/maximum monthly allocation (as in Australia) S S
Regulate existing private wells S S S S
Better modeling to include DSS Portion S
Politics of water/elected official buy-in/will power S S S S S
Shift WMD/utilities priorities from issuing permits to conservation;
water profit defeats conservationS S S S
Intergovernmental cooperation instead of competition S S S S
Respect private property rights S S S
Ensure policies allow for water to be shared between producers S S
Regulations (example TMDLs)/WMDs/"big government" seen as
barrier; unintended consequencesS S S S
Stricter regulation on bottled water industry; require bottled water
produce quality reports similar to utilitiesS S S
Stop issuing permits for septic systems/reduce existing ones S S
Make sure that people/communities not penalized for conserving S
Political boundaries don't follow water boundaries S S
Decisions based on bottom-up approach, not top-down S
Understand the relationship between water demand & energy (cooling
towers, biofuels, desal, etc.)S S S
Watering day restrictions not effective unless enforced (enforcement
creates conflict w/customer)S S S
Remove regulatory barriers/establish standards for use of non-potable
water, cisterns, etc.S
Any new regulations must have "teeth" & funding to be effective S
Better coordination of state water, building & landscape legislation
(SB 494, SB 2080, etc.)S S S
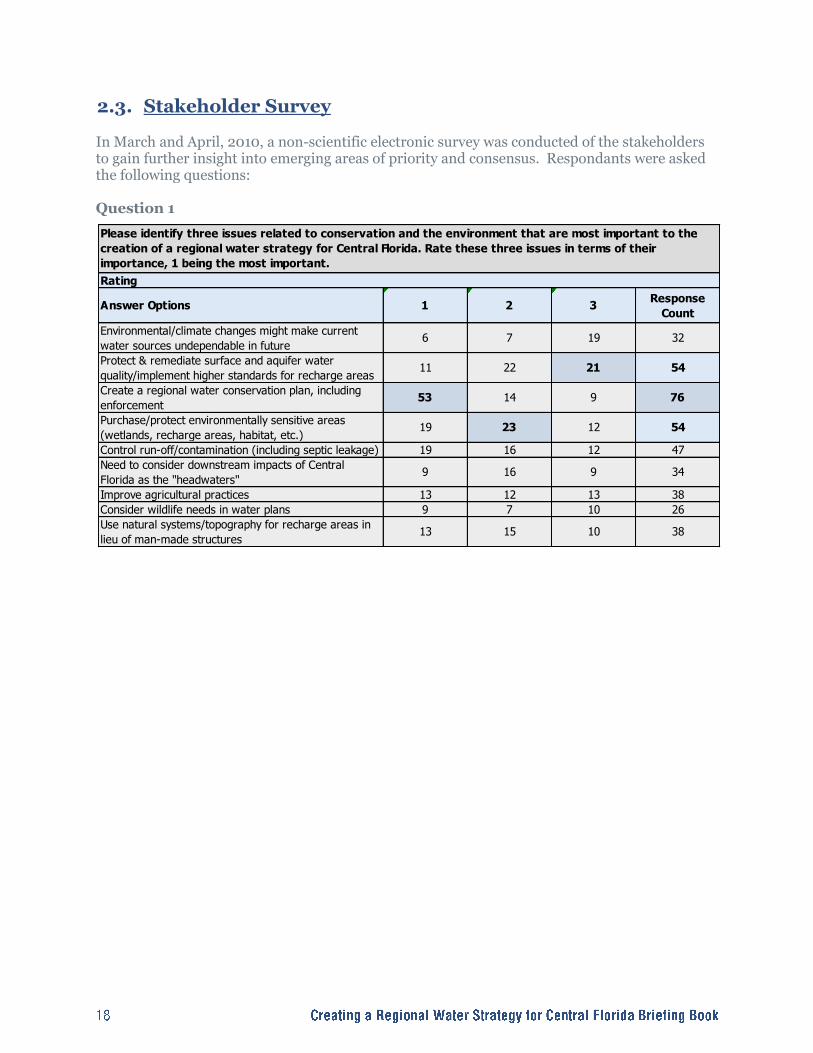
2.3. Stakeholder Survey In March and April, 2010, a non-scientific electronic survey was conducted of the stakeholders to gain further insight into emerging areas of priority and consensus. Respondants were asked the following questions: Question 1
1 2 3Response
Count
6 7 19 32
11 22 21 54
53 14 9 76
19 23 12 54
19 16 12 47
9 16 9 34
13 12 13 38
9 7 10 26
13 15 10 38
Need to consider downstream impacts of Central
Florida as the "headwaters"
Please identify three issues related to conservation and the environment that are most important to the
creation of a regional water strategy for Central Florida. Rate these three issues in terms of their
importance, 1 being the most important.
Create a regional water conservation plan, including
enforcement
Consider wildlife needs in water plans
Answer Options
Control run-off/contamination (including septic leakage)
Protect & remediate surface and aquifer water
quality/implement higher standards for recharge areas
Improve agricultural practices
Rating
Purchase/protect environmentally sensitive areas
(wetlands, recharge areas, habitat, etc.)
Use natural systems/topography for recharge areas in
lieu of man-made structures
Environmental/climate changes might make current
water sources undependable in future

Question 2
1 2 3Response
Count
18 9 10 37
10 15 9 34
20 7 6 33
13 15 4 32
26 14 8 48
12 11 9 32
10 8 3 21
14 10 6 30
14 4 6 24
8 9 11 28
11 12 13 36
3 9 8 20
16 7 10 33
2 6 14 22
11 14 7 32
12 10 9 31
22 6 3 31
20 6 1 27
Create an equitable cost & price structure for water
across the region
Implement a "cap and trade" system to allocate water
resources
Make tiered rates universal across the region
Please identify three issues related to economics and pricing that are most important to the creation of a
regional water strategy for Central Florida. Rate these three issues in terms of their importance, 1 being
the most important.
Provide financial incentives for building & landscape
retrofits
Plan for how to balance expensive desalination water
on the coast w/inexpensive groundwater inland
Provide opportunities for public/private partnerships in
new infrastructure
Consider the high cost & limited availability of capital
for new infrastructure & retrofit projects
Answer Options
Eliminate bottled water sales tax exemption (tax at or
above other beverage rates)
Create tiered/conservation pricing for all water sources
(potable & reuse) to reduce demand & pay for retrofits
Avoid costly lawsuits
Meter and charge for private well water
Raise potable rates; Water is currently very inexpensive
Provide financial incentives for large land owners to
preserve open space/agriculture (such as transfer of
development rights)
Balance the financial resources of smaller & larger
communities
Rating
Account for the high cost of pumping "bulky" utility
Change reuse water rate structure to "true" value
Reward communities that lead in water conservation
Factor in cost of operation & maintenance (labor,
materials & energy)

Question 3
Question 4
1 2 3Response
Count
7 19 20 46
19 10 14 43
36 17 13 66
29 20 14 63
13 16 16 45
Slow and/or control growth
Rating
Change HOA rules that are contrary to water
conservation
Move to compact development; reduce setbacks
Design and Development: Development and Land Use Please identify three issues related to development
and land use that are most important to the creation of a regional water strategy for Central Florida. Rate
these three issues in terms of their importance, 1 being the most important.
Enhance sustainable growth requirement in
comprehensive plans
Answer Options
Prioritize agriculture an essential regional need in
planning
1 2 3Response
Count
14 8 8 30
14 10 10 34
4 9 8 21
28 21 10 59
23 7 5 35
26 12 6 44
8 7 8 23
7 8 9 24
11 11 11 33
13 9 9 31
15 17 8 40
Rating
Require Florida native/friendly landscape plants;
landscape not dependent on supplemental irrigation
Implement retrofit program to meet stricter building &
landscaping standards
Increase opportunities for recharge/pervious surfaces
in urbanized areas
Encourage building capture & reuse techniques (rain
barrels, gray water reuse, etc.)
Install sensors to let water managers know when
irrigation running on no-water days
Implement stronger low flow/efficient/"smart" fixtures
& appliance standards
Implement best practice irrigation design (drip
irrigation, soil moisture sensors, etc.)
Design and Development: Building, Landscape and Site Standards Please identify three issues related to
building, landscape and site standards that are most important to the creation of a regional water strategy
for Central Florida. Rate these three issues in terms of their importance, 1 being the most important.
Require Low Impact Development (LID) standards
Require annual inspection/certification of irrigation
systems
Answer Options
Reduce use of manicured lawns (both type & quantity
of grass)
Require new buildings to be plumbed for reuse inside
the home
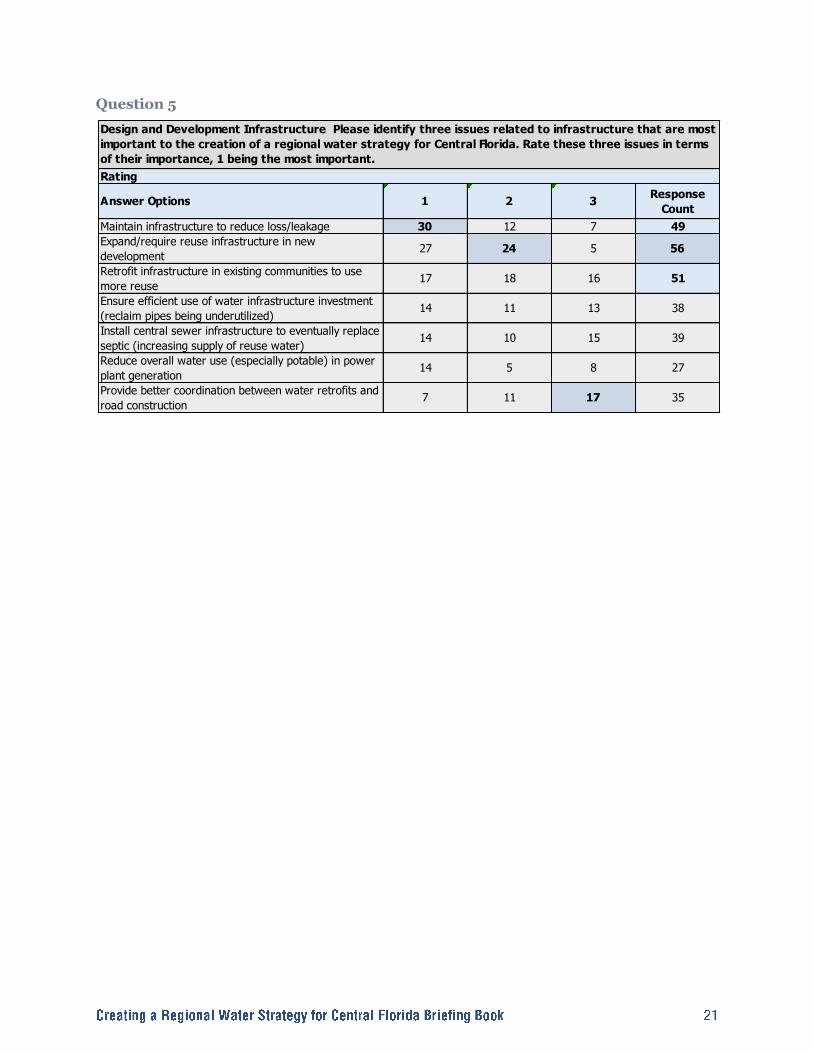
Question 5
1 2 3Response
Count
30 12 7 49
27 24 5 56
17 18 16 51
14 11 13 38
14 10 15 39
14 5 8 27
7 11 17 35
Design and Development Infrastructure Please identify three issues related to infrastructure that are most
important to the creation of a regional water strategy for Central Florida. Rate these three issues in terms
of their importance, 1 being the most important.
Retrofit infrastructure in existing communities to use
more reuse
Answer Options
Install central sewer infrastructure to eventually replace
septic (increasing supply of reuse water)
Expand/require reuse infrastructure in new
development
Provide better coordination between water retrofits and
road construction
Rating
Ensure efficient use of water infrastructure investment
(reclaim pipes being underutilized)
Maintain infrastructure to reduce loss/leakage
Reduce overall water use (especially potable) in power
plant generation
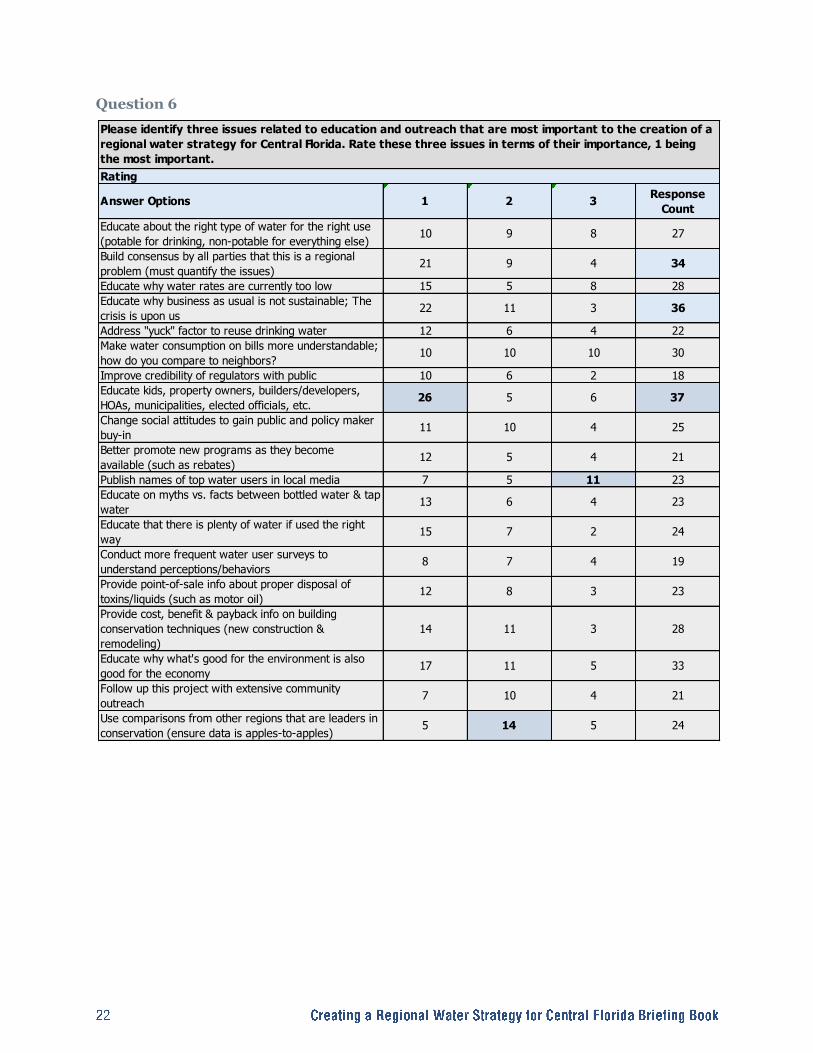
Question 6
1 2 3Response
Count
10 9 8 27
21 9 4 34
15 5 8 28
22 11 3 36
12 6 4 22
10 10 10 30
10 6 2 18
26 5 6 37
11 10 4 25
12 5 4 21
7 5 11 23
13 6 4 23
15 7 2 24
8 7 4 19
12 8 3 23
14 11 3 28
17 11 5 33
7 10 4 21
5 14 5 24
Educate about the right type of water for the right use
(potable for drinking, non-potable for everything else)
Conduct more frequent water user surveys to
understand perceptions/behaviors
Make water consumption on bills more understandable;
how do you compare to neighbors?
Use comparisons from other regions that are leaders in
conservation (ensure data is apples-to-apples)
Please identify three issues related to education and outreach that are most important to the creation of a
regional water strategy for Central Florida. Rate these three issues in terms of their importance, 1 being
the most important.
Publish names of top water users in local media
Educate why water rates are currently too low
Provide cost, benefit & payback info on building
conservation techniques (new construction &
remodeling)
Educate kids, property owners, builders/developers,
HOAs, municipalities, elected officials, etc.
Answer Options
Educate that there is plenty of water if used the right
way
Address "yuck" factor to reuse drinking water
Follow up this project with extensive community
outreach
Change social attitudes to gain public and policy maker
buy-in
Better promote new programs as they become
available (such as rebates)
Build consensus by all parties that this is a regional
problem (must quantify the issues)
Provide point-of-sale info about proper disposal of
toxins/liquids (such as motor oil)
Improve credibility of regulators with public
Rating
Educate on myths vs. facts between bottled water & tap
water
Educate why business as usual is not sustainable; The
crisis is upon us
Educate why what's good for the environment is also
good for the economy
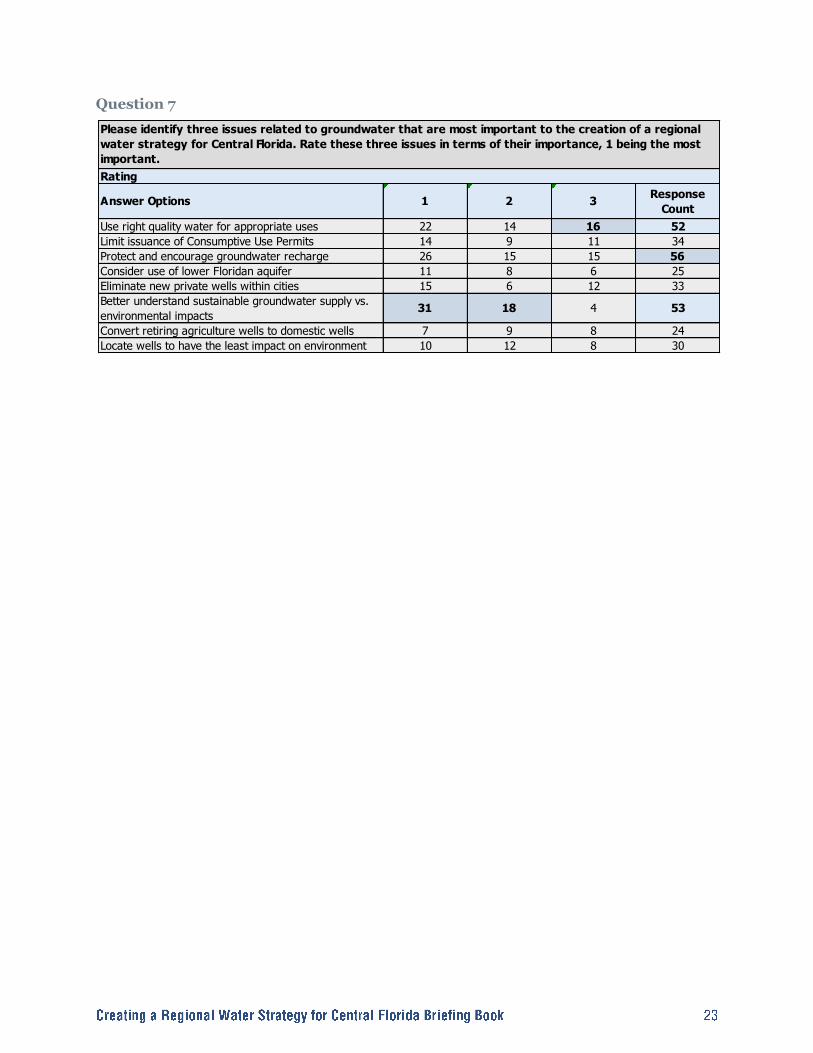
Question 7
1 2 3Response
Count
22 14 16 52
14 9 11 34
26 15 15 56
11 8 6 25
15 6 12 33
31 18 4 53
7 9 8 24
10 12 8 30
Please identify three issues related to groundwater that are most important to the creation of a regional
water strategy for Central Florida. Rate these three issues in terms of their importance, 1 being the most
important.
Protect and encourage groundwater recharge
Locate wells to have the least impact on environment
Answer Options
Eliminate new private wells within cities
Limit issuance of Consumptive Use Permits
Convert retiring agriculture wells to domestic wells
Rating
Consider use of lower Floridan aquifer
Use right quality water for appropriate uses
Better understand sustainable groundwater supply vs.
environmental impacts

Question 8
Note: Numbers represent the number of responses in survey.
Respondents were also provided the opportunity to share additional specific comments for each question as well as general comments related to Creating a Regional Water Strategy for Central Florida. A full listing of the survey results with responses is available in Appendix E.
1 2 3Response
Count
12 7 6 25
16 12 5 33
16 8 7 31
11 9 2 22
12 5 5 22
6 3 8 17
10 8 5 23
10 8 6 24
8 9 2 19
10 7 1 18
20 13 8 41
13 9 10 32
10 4 11 25
8 7 8 23
7 8 3 18
11 15 8 34
12 12 3 27
25 10 8 43
Ensure that injected water in ASR is of good quality
Minimize surface water diversion to tide/utilize "excess"
Store reuse water in ASR, lined reservoirs, storage
tanks during wet weather and off-peak
Consider brackish sources for desalination
Please identify three issues related to alternative water sources that are most important to the creation of
a regional water strategy for Central Florida. Rate these three issues in terms of their importance, 1 being
the most important.
Capture, treat and reuse regional stormwater
Develop a surface water withdrawal & storage
plan/network
Establish goals/change codes/make reuse mandatory
for non-potable uses
Rating
Capture, treat and reuse regional wastewater;
wastewater being "lost" to tide
Consider downstream user needs in river withdrawals
Understand new nutrient level standards; could affect
availability of reuse water
Use treated wastewater and stormwater for ASR
(potential of arsenic could limit ASR)
Answer Options
Pursue advanced treatment of reuse water for drinking
water
Study the amount of surface water available for storage
within the region (can vary)
Improve desalination technology to reduce capital &
energy costs
Agree on and enforce environmentally-sustainable
minimum surface water flows & water levels
Distribute water from the power plants as a reuse
source
Promote desalination as an important alternative source
of water (especially for the coast)
Treat reuse water like all other forms of water: as a
valuable resource

3.1. A Brief Water History of Central Florida ―Water, water everywhere, nor any drop to drink,‖ a line penned by Coleridge in the late 1700s could serve as a totem phrase for water and its use in Florida. 97.5% of Earth‘s water is saltwater and Florida is surrounded by it. Water is evident throughout the Central Florida region (defined as Brevard, Lake, Orange, Osceola, Polk, Seminole and Volusia Counties for the Project) in the adjacent Atlantic Ocean, the coursing rivers and streams, numerous lakes, productive natural springs, and low-lying wetlands. All of these water resources contribute to or are driven by an almost invisible body of water comprising the Floridan aquifer system that underlies the region. In addition, the 50 or so inches of rain per year received in Central Florida would make water appear to be readily available for the increasing diversity and number of uses within the region. And yet, each of these sources has limitations and tradeoffs that limit the viability and ease of access at the rates required to sustain the region.
The abundant water-related resources of Central Florida have long been utilized for water supply, fishing and transportation. Native American villages and other settlements were often located near water sources, such as springs or rivers, which were likely used as both water sources for drinking as well as for fish and shellfish food sources. [Milanich and Payne 1993] Similarly, settlement patterns until the late 1800s typically consisted of towns or villages growing adjacent to (or at least near) significant water sources. Due to relatively low population densities and generally high quality water sources, surface water comprised the primary source of water for drinking and bathing during much of this time. 3.1.1. Floridan Aquifer Water use changed rapidly as human population increased with the primary water source shifting from surface water to groundwater. The Floridan aquifer, first identified in 1936, is one of the highest producing aquifers in the world. It is found throughout Florida and extends into the southern portions of Alabama, Georgia and South Carolina (refer to Exhibit 3-1). This aquifer system is comprised of a sequence of limestone and dolomite, which thickens from about 250 feet in Georgia to about 3000 feet in south Florida. The Floridan aquifer system has been divided into an upper and lower aquifer separated by a unit of lower permeability. The upper Floridan aquifer is the principal source of water supply in most of north and central Florida. In the southern portion of the state, where it is deeper and contains brackish water, this aquifer has been used for the injection of sewage and industrial waste. Groundwater flow is generally from
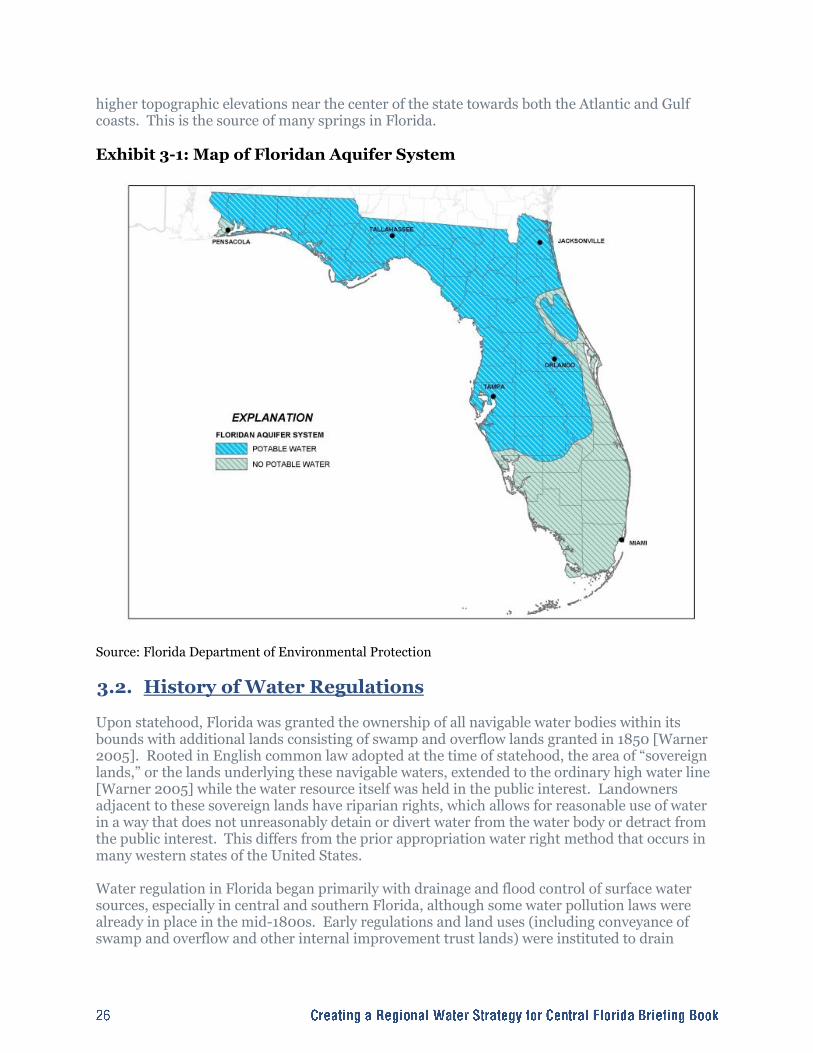
higher topographic elevations near the center of the state towards both the Atlantic and Gulf coasts. This is the source of many springs in Florida. Exhibit 3-1: Map of Floridan Aquifer System
Source: Florida Department of Environmental Protection
3.2. History of Water Regulations Upon statehood, Florida was granted the ownership of all navigable water bodies within its bounds with additional lands consisting of swamp and overflow lands granted in 1850 [Warner 2005]. Rooted in English common law adopted at the time of statehood, the area of ―sovereign lands,‖ or the lands underlying these navigable waters, extended to the ordinary high water line [Warner 2005] while the water resource itself was held in the public interest. Landowners adjacent to these sovereign lands have riparian rights, which allows for reasonable use of water in a way that does not unreasonably detain or divert water from the water body or detract from the public interest. This differs from the prior appropriation water right method that occurs in many western states of the United States. Water regulation in Florida began primarily with drainage and flood control of surface water sources, especially in central and southern Florida, although some water pollution laws were already in place in the mid-1800s. Early regulations and land uses (including conveyance of swamp and overflow and other internal improvement trust lands) were instituted to drain

surface waters to improve the state for human use. Various boards (such as the Board of Drainage Commissioners and Everglades Drainage District) were established by the Florida Legislature to promote excavation of canals and levees for water control. In 1949, the Legislature created the Central and Southern Florida Flood Control District (CSFFCD) to assume responsibility for an Army Corps of Engineers-led flood control project. A more comprehensive approach to water resources began with the Water Resources Act of 1957, which included recognition of the need for an overall evaluation of water resources within the State.
3.3. Water Management Districts The Florida Water Resources Act of 1972 established five regional Water Management Districts (WMD) including the St. Johns River Water Management District (SJRWMD) as well as a permit system for allocating water use (refer to Exhibit 3-2). The Southwest Florida Water Management District (SWFWMD) was established in 1961 to serve as a local sponsor of a major flood control project led by the US Army Corps of Engineers and became one of the initial WMDs. The South Florida Water Management District (SFWMD) was formed in 1975 from two of the original WMDs and was a successor to the CSFFCD. Regulation of water resources, including consumptive use permits for water withdrawals and permits for surface water (for stormwater and wetland impacts) were delegated to these WMDs in the 1970‘s and 1980‘s. These WMDs acquired the ability to levy ad valorem taxes as part of a constitutional amendment passed in 1976 and subsequent legislation. Over time, the programs of the WMDs expanded to address four broad areas of responsibility: water supply, flood protection, water quality and natural systems. The Central Florida region occurs within the jurisdiction of three water management districts: SJRWMD, SFWMD and SWFWMD (refer to Exhibit 1-1). WMD boundaries generally follow major drainage basins, not county or other political boundaries. The WMDs are each governed by a board of directors, consisting of citizens from a broad and diverse set of backgrounds and expertise, who are appointed by the Governor and ratified by the State Legislature. Governing board policy and direction are implemented by an Executive Director and a diverse set of professional staff, including scientists, engineers, hydrologists, planners, economists and attorneys. All WMDs operate under the Florida Department of Environmental Protection (FDEP) and follow the guidelines of Florida Statutes § 373. [http://www.leg.state.fl.us/statutes/index.cfm?App_mode=Display_Statute&URL=Ch0373/titl0373.htm] References: Milanich, J.T. , and C. Payne, eds. 1993. Florida Historical Contexts. Tallahassee, Florida. http://dhr.dos.state.fl.us/facts/reports/contexts/ Exploring Florida. 2010. ―Estimated Water Use in Florida 1965‖ http://fcit.usf.edu/florida/docs/w/wateruse.htm Marella, R. 2008. Water use in Florida, 2005 and Trends 1950-2005. USGS. St. Johns River Water Management District (SJRWMD). 2010. Florida Water Management History. http://www.sjrwmd.com/history/index.html USGS. 2005. http://water.usgs.gov/watuse/data/2005/index.html Warner, S. 2005. Down to the Waterline: Boundaries, Nature, and the Law in Florida. UGA Press
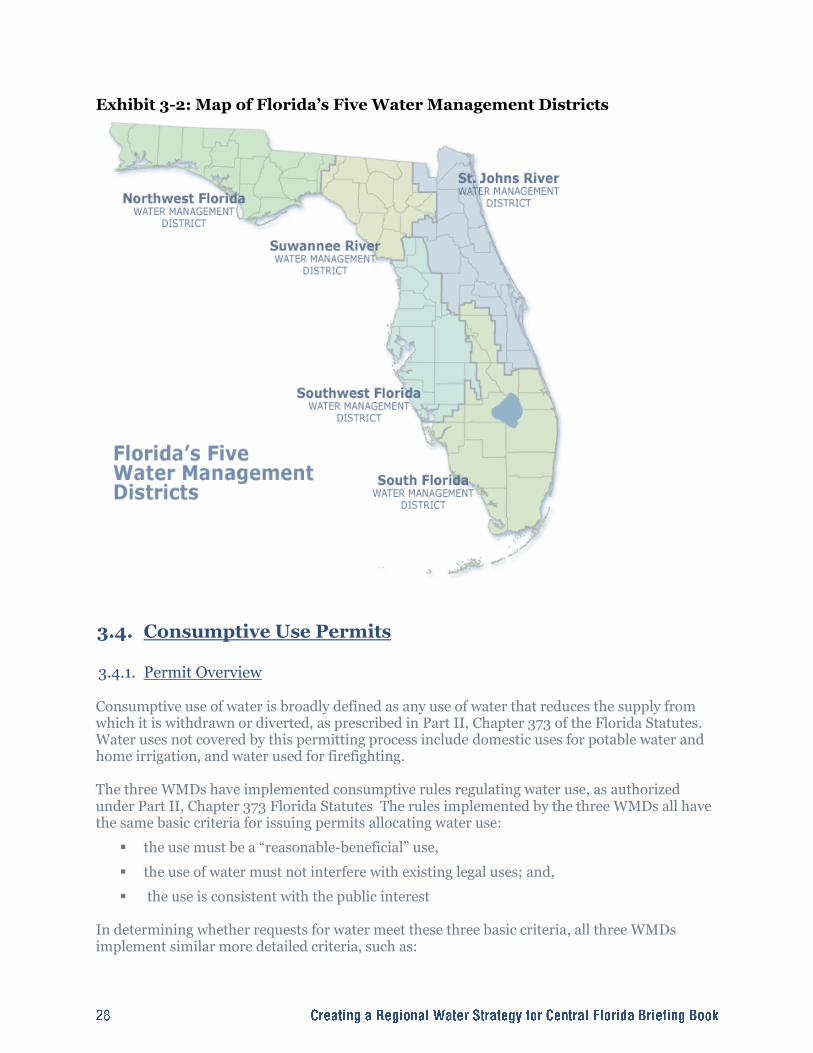
Exhibit 3-2: Map of Florida’s Five Water Management Districts
3.4. Consumptive Use Permits 3.4.1. Permit Overview Consumptive use of water is broadly defined as any use of water that reduces the supply from which it is withdrawn or diverted, as prescribed in Part II, Chapter 373 of the Florida Statutes. Water uses not covered by this permitting process include domestic uses for potable water and home irrigation, and water used for firefighting. The three WMDs have implemented consumptive rules regulating water use, as authorized under Part II, Chapter 373 Florida Statutes The rules implemented by the three WMDs all have the same basic criteria for issuing permits allocating water use:
the use must be a ―reasonable-beneficial‖ use,
the use of water must not interfere with existing legal uses; and,
the use is consistent with the public interest In determining whether requests for water meet these three basic criteria, all three WMDs implement similar more detailed criteria, such as:
demonstration by the applicant that the requested water use is needed,
all feasible water conservation has been implemented,
lower quality sources are being used when feasible,
the use will not cause environmental harm,
the use will not cause a minimum flow or level adopted under WMD rules to not be met,
the use will not cause saline water intrusion that is harmful; and,
the use will not interfere with existing legal uses that have been permitted already As discussed earlier, the three WMDs have adopted by rule the CFCA rule provisions into their respective rules that supplement the WMD rules within most of the CFCA. There are many other important similarities of all of the three WMD rules, including:
Permits are issued with specific allocations, for specific uses, and for limited duration, at which time water users must renew their permits. Permit durations typically vary depending of the specific facts on each water use, and typically vary from a few years up to 20 years.
Permit holders are required to submit water use data and other information, such as environmental monitoring, when needed to provide reasonable assurance that the use meets permitting criteria
For 20-year durations, permits often require a 5-year compliance reporting provisions. Other more frequent reporting is often required.
All water uses, except the very smallest that fall below the WMD specific permit thresholds, or other specifically exempt under Florida Statutes, such as domestic self supply wells, are permitted by either individual, standard general, or general permit by rule.
All three WMDs have permanent water conservation rules that restrict landscape irrigation to no more than the same two days a week year-round within the Central Planning region, with the exception of SJRWMD that further limits landscape irrigation to only 1 day per week during the winter months. Consumptive Use Permits (CUP) also known as Consumptive Water Use Permits and Water Use Permits (WUP) are obtained through an application process through the WMDs. CUPs are issued for a fixed period of time, with an expiration date. All Consumptive Water Use Permits must be renewed prior to the expiration date in order to continue using water. The SFWMD website discusses the following water uses that require CUPs:
dewatering
irrigating a golf course
irrigating crops with either well water or surface water
irrigating nursery stock
watering livestock from a well
irrigating residential landscaping from either wells or surface waters
withdrawing water for industrial use

withdrawing water for public water supply The Permit Application requires an evaluation of possible issues associated with the proposed water withdrawal. The SFWMD describes the following three questions that are evaluated during the application process:
Is the proposed use reasonable and beneficial as defined in Section 373.019 of the Florida Statutes?
Will it interfere with other water users in the vicinity?
Is it consistent with the public interest (including harm to the environment, saltwater intrusion, wetlands, movement of pollution, etc.)?
Groundwater and surface water modeling are commonly used tools for predicting the impacts of the proposed water withdrawal on nearby water users, surface waters, wetlands, pollution sources, etc. Most public water supply facilities that exceed a certain threshold of pumping (0.5 mgd in the SFWMD) are required to develop and implement a water conservation plan. More information on this requirement can be found in the SFWMD Basis of Review for Water Use Applications. The land use for the CUP application must be consistent with the land use in the Environmental Resource Permit application. For example, an owner cannot obtain a Water Use Permit with a citrus grove land use for a property that has an Environmental Resource Permit for a residential land use. In addition, the lowest quality water must be used. For example, if reclaimed water is available to a site, an owner must use the reclaimed water for landscape irrigation before using potable water or well water. An onsite well can be permitted as a 30-day backup for a shortage in reclaimed water supply. 3.4.2. St. Johns River Water Management District SJRWMD requires a CUP for every consumptive use of ground or surface water which:
Exceeds 100,000 gallons per day (estimated on an average annual basis); or
Is from a facility (wells, pumps, etc.) or facilities which are capable of withdrawing one million gallons of water per day or more; or
Is from a well in which the outside diameter of the largest permanent water bearing casing is six inches or greater. For purposes of this section, the diameter of the well at ground surface will be considered to be the diameter of the well for its entire length unless the well owner or well contractor can demonstrate that the well has a smaller diameter water bearing pipe below ground surface.
A general permit is for withdrawals not exceeding 500,000 gpd.
3.4.3. South Florida Water Management District SFWMD issues two major types of Consumptive Water Use Permits: General and Individual. Dewatering Permits are also issued as part of their consumptive use program. All CUPs must be renewed prior to the expiration date in order to continue using water.
Standard General <15 mgm (mill/gal/month) o Minor 3 mgm or less o Major >3 mgm and up to 15 mgm
Individual >15mgm, issued via Executive Director approval
No-Notice Short Term Dewatering General, <5 mg/day, max 100 mg total pumpage for <90 days dewatering
Dewatering General <10 mg/day, max 1800 mg total pumpage for < 1 year
Long-Term Dewatering Individual exceed thresholds and criteria of General o Standard Individual where all dewatering defined o Master Individual where long-term, multi-phased, and undefined
4 planning areas within SFWMD
20-year maximum duration for water use permits
Exempt from a CUP– private domestic, fire protection, sea water, reclaimed Many conservation programs are promoted and utilized within the district and they include: Best Management Practices for Business, Agriculture, & Utilities as well as Conservation grants for utilities. SFWMD requires conservation plans as a part of CUP process. Florida-Friendly Landscaping and rain sensors are also promoted. The SFWMD is monitoring water use and availability as well as alternative sources.
Utilizes a 5-year Water Resource Development Work Program, a 20-year forecast, and also prepares a yearly update as required by the state.
Most future water needs will be met by alternative sources – brackish groundwater, surface water and reclaimed.
Reasonable Beneficial Use – not interfere with existing legal water uses, consistent with public interest. 3.4.4. Southwest Florida Water Management District SWFWMD issues three types of WUPs:
Individual 500,000 gpd or more
General 100,000 – 500,000 gpd
Small General < 1000,000 gpd
Permit Time frames: 6-year is > 500,000 gpd, 10-year is < 500,000 gpd Water use is divided into the following five predominant uses:
Public supply
Industrial or commercial
Mining or dewatering
Recreation or aesthetic
Agriculture Exempt – seawater and reuse Time frames: 6 year is > 500,000 gpd, 10-year is < 500,000 gpd
3.5. Southern Water Use Caution Area The Southern Water Use Caution Area (SWUCA) is a 5,100-square-mile, eight-county area within the SWFWMD where depressed aquifer levels have caused saltwater to intrude into the aquifer along the coast, reducing water quality and contributing to reduced flows in the upper Peace River and lowered lake levels in portions of Polk and Highlands counties. The purpose of the Recovery Strategy is to provide a plan for reducing the rate of saltwater intrusion, restoring flows in the upper Peace River and lake levels while ensuring sufficient water supplies and protecting investments of existing water use permittees. The Strategy has six basic components: conservation, alternative supply development, resource recovery projects, land use transitions, permitting, and monitoring and reporting. Conservation Improving how efficiently we use our water resources increases the number of uses that can be met by our limited supplies. The District promotes conservation practices among all user types. For example, the District partners with the Florida Department of Agricultural Services to fund FARMS, a financial incentive program for the agricultural community to install best management practices for irrigation. Alternative Supply Development The primary water supply in the SWUCA area has been groundwater. Developing alternative water supplies from sources such as surface waters, reclaimed water and desalination will reduce demand for stressed groundwater sources while meeting growing water needs. Promoting conservation and alternative supply development are a continuation of longstanding District programs that, along with the Districts permitting program, have contributed to a trend of declining groundwater use in the SWUCA. Resource Recovery Projects In addition to conservation of existing water and development of new water supplies, the District is implementing resource recovery projects to enhance and restore existing water resources. For example, one project will raise the water level in Lake Hancock (which had been previously lowered through drainage), then release the excess water during the dry season to achieve minimum flows in the upper Peace River. Other projects under consideration include restoring mine lands and wetlands to store more water during wet seasons. To be successful, these conservation, alternative supply and resource recovery projects require funding. There is a need for about $673 million through the year 2025. The Strategy identifies about $559 million available through various sources, highlighting the need to maintain a budget capable of supporting these projects. Land Use Transitions Almost all of the property within the SWUCA has a water use permit associated with it. The trend in land use changes is for urban/suburban land uses to displace non-residential land uses that have depended on groundwater. Along the coastal communities in the SWUCA, the Strategy anticipates meeting the water needs of these new land uses through alternative supplies, which will help reduce groundwater withdrawals. In the inland counties, where alternative supplies such as surface waters are not as plentiful, it is anticipated that new uses can be met, in part, with groundwater from the displaced non-residential uses.
Permitting The District permitting program requires water use permit holders to be efficient through conservation measures and to use alternative water sources where they are economically, technology and environmentally practical. An applicant wanting to pump new quantities from the Floridan aquifer will have to demonstrate that the withdrawal will not impact an area where the water resources have already been designated as below a minimum flow or level (MFL). If the withdrawal would impact an MFL water body, the applicant will need to show at least a 10 percent improvement or net benefit to the water body. The net benefit can be achieved by showing the new use is actually less than an existing use being retired or displaced, or by participating in a mitigation or resource development project. Monitoring and Reporting The District will use an extensive monitoring network to look at actual versus anticipated trends in water levels, flows and saltwater intrusion. Projections of water demands and potential sources will be updated every five years as part of the Regional Water Supply Plan. The District will also have an ongoing cumulative impact analysis that will look at all factors affecting recovery. This comprehensive monitoring and analysis will allow the Governing Board to make any necessary midcourse corrections and ensure recovery is ultimately achieved. [Source: Southwest Florida Water Management District News Release, March 31, 2006]
3.6. Land Use Planning
3.6.1. State, Regional and Local Comprehensive Planning Since 1985, the State of Florida has regulated growth and development through the Growth Management Act. This unique regulatory framework provides another linkage between land use decisions and potable water supply. Each local government is required by Chapter 163, Part II, Florida Statutes, to adopt a Local Government Comprehensive Plan to guide growth and development of the community. Comprehensive Plans generally have a planning horizon of 10 to 20 years. The Comprehensive Plan includes the following elements, or chapters:
Future Land Use Element, including Future Land Use Map
Potable Water and Sewer Facilities Element
Traffic Circulation/Transportation Element
Conservation Element
Public Schools Facilities Element
Parks and Recreation Element
Capital Improvements Element
Housing Element
Intergovernmental Coordination Element
Economic Development Element (optional)
Coastal High Hazard (coastal communities)

Each Plan Element contains a series of Objectives and Policies that direct the community how to implement the long term Goals of the Comprehensive Plan. Future land use decisions must be coordinated with available or planned public infrastructure, such as potable water, schools, roadways, and wastewater facilities. Local governments may be subject to a WMD Regional Water Supply Plan (RWSP), which identify areas where water supply shortages are projected to occur within the next 20 years.1 The RWSP identifies alternative projects to be implemented by local governments in these areas, in order to supplement traditional sources of water to meet projected demand. Local governments subject to a RWSP are required to ensure that adequate water supplies will be available to meet future demand through a 10-year water supply facilities work plan that is incorporated into the Comprehensive Plan. These work plans may include alternative water supplies, water reuse and conservation programs. In addition, all local governments must address water supply in their concurrency management programs. Amendments to the Comprehensive Plan are permitted twice per year, with some exceptions such as small scale map amendments and Capital Improvements Programs. Amendments to change large scale future land use designations require an analysis of public infrastructure availability and capacity, including potable water supply, to determine if the proposed amendment will have adverse impacts on these facilities. Citizen participation is encouraged in the comprehensive planning process, as all amendments are available for public review and subject to approval at public hearings before elected and appointed officials. All Comprehensive Plans and plan amendments are reviewed by the Florida Department of Community Affairs (DCA) and other state regulatory agencies for compliance with the Growth Management Act and associated Florida Statutes and Rule. If a plan or plan amendment is found ―not in compliance‖, local governments may be subject to a moratorium from adopting future amendments and other penalties from the Administration Commission. In addition to review at the state level, the East Central Florida Regional Planning Council (ECFRPC) reviews all Comprehensive Plans and Comprehensive Plan Amendments for six of the seven Counties (not including Polk County) and provides advisory comments to DCA. The ECFRPC review process promotes intergovernmental coordination and adjacent land use compatibility. The ECFRPC is required to create a Strategic Regional Policy Plan to further guide intergovernmental coordination and resource use across the region. Chapter 9 of the Strategic Regional Policy Plan (also known as the East Central Florida 2060 Plan) describes potable water conditions in the East Central Florida Region and is included in Appendix C and at www.ecfrpc.org. 3.6.2. Concurrency and Level of Service Standards The availability and capacity of public infrastructure, including potable water supply, is monitored by local government concurrency management systems. These systems evaluate adopted level of service (LOS) standards and require that new or expanded facilities and services be available concurrent with the impacts of new development. A partial list of Potable Water LOS standards examples adopted by local governments in the Central Florida region is provided in Exhibit 3-3. This partial list demonstrates the variation of potable water planning standards that exists throughout the region.
1 http://www.dca.state.fl.us/fdcp/dcp/WaterSupplyPlanning/index.cfm

Exhibit 3-3: Potable Water Level of Service Standards Examples
Local Government Level of Service Standard - gallons per day (gpd) Unit
Osceola County 96 gpd Per capita, Residential
Seminole County 350 gpd Equivalent Residential Unit
City of Cocoa 122 gpd Per capita per Equivalent Residential Consumption
City of Lakeland 150 gpd Per capita
City of Melbourne 100 gpd Per capita
City of Orlando
325 gpd (without reclaimed water) Single Family Dwelling Unit
160 gpd (with reclaimed water) Single Family Dwelling Unit
200 gpd (with or without reclaimed water) Multi Family Dwelling Unit
If the projected population growth of a community exceeds available capacity and the adopted LOS standards, causing adverse impacts on public infrastructure, concurrency requires that capital improvements to mitigate these impacts must be programmed into the Capital Improvements Element of the Comprehensive Plan. These improvements must provide sufficient capacity to the affected public facilities in order to permit development to occur. Section 163.3180(2)(a), Florida Statutes, requires local governments to consult with water suppliers to ensure that adequate water supplies will be in place and available to serve new development no later than when the local government issues a certificate of occupancy or its functional equivalent.2
3.7. Emerging Regulatory Requirements 3.7.1. Central Florida Coordination Area In 2006, SJRWMD, SFWMD and SWFWMD agreed to develop a framework for coordinating their efforts in Central Florida which resulted in the establishment of the Central Florida Coordination Area (CFCA). The CFCA area includes Orange, Osceola and Seminole Counties and south Lake County within the SJRWMD; Orange, Osceola and Polk Counties within the SFWMD; and Polk County within the SWFWMD (refer to Exhibit 3-4). The WMDs jointly concluded in the 2006 Recommended Action Plan for the Central Florida Coordination Area that sustainable quantities of groundwater in Central Florida were insufficient to meet all future public water supply demands over the 20-year planning horizon and that an immediate need existed to develop and implement supplemental water supply.
2 http://www.dca.state.fl.us/fdcp/dcp/WaterSupplyPlanning/index.cfm
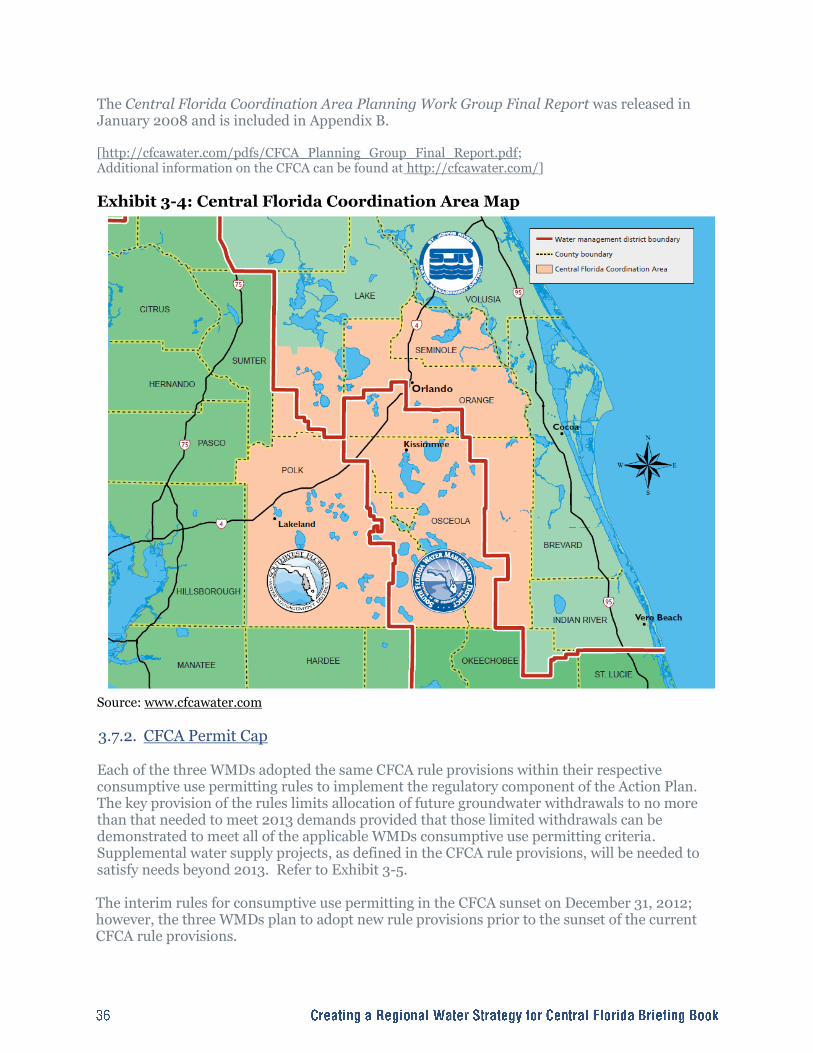
The Central Florida Coordination Area Planning Work Group Final Report was released in January 2008 and is included in Appendix B. [http://cfcawater.com/pdfs/CFCA_Planning_Group_Final_Report.pdf; Additional information on the CFCA can be found at http://cfcawater.com/]
Exhibit 3-4: Central Florida Coordination Area Map
Source: www.cfcawater.com
3.7.2. CFCA Permit Cap Each of the three WMDs adopted the same CFCA rule provisions within their respective consumptive use permitting rules to implement the regulatory component of the Action Plan. The key provision of the rules limits allocation of future groundwater withdrawals to no more than that needed to meet 2013 demands provided that those limited withdrawals can be demonstrated to meet all of the applicable WMDs consumptive use permitting criteria. Supplemental water supply projects, as defined in the CFCA rule provisions, will be needed to satisfy needs beyond 2013. Refer to Exhibit 3-5. The interim rules for consumptive use permitting in the CFCA sunset on December 31, 2012; however, the three WMDs plan to adopt new rule provisions prior to the sunset of the current CFCA rule provisions.

The CFCA has outlined initiatives and tools to assist in developing and implementing a long-term approach to public water supply system permit allocations and conditions to achieve their work plan goal over the long term. These initiatives include modeling and tools support, environmental assessment, stakeholder participation, long term CFCA rulemaking, alternative water source development and water supply plans. The CFCA is currently developing the modeling and tools support and environmental assessment initiatives and plans to begin the rulemaking process in 2010. Exhibit 3-5: CFCA Permit Cap
Although Polk County is included in the CFCA, nearly all of Polk County is also in the SWUCA. For the area of Polk County in the SWUCA, the SWUCA rules, rather than the CFCA rules apply. The purpose of this provision is that the eight-county area that encompasses the SWUCA (Charlotte, Desoto, Hardee, Highlands, Hillsborough, Manatee, Polk and Sarasota) is in a recovery strategy to address minimum flows and levels that have been exceeded. Unlike the CFCA rules that limit groundwater withdrawals to quantities no more than those anticipated in 2013, the SWUCA recovery strategy is designed to reduce groundwater withdrawals from the Floridan aquifer in the eight-county area from the historical use of 650 million gallons per day (mgd) to 600 mgd by 2025. The comprehensive recovery plan is available at http://www.swfwmd.state.fl.us/documents/.
Phase II of the CFCA initiative is currently underway, which will result in development of permitting rules implementing a long-term strategy to address concerns about water supplies and the sustainability of the resources. The planning component will focus on identification of supplemental water supply projects and project implementation strategies that will ultimately be included in future updates of each WMD‘s Regional Water Supply Plan and in the comprehensive plans of local governments in the CFCA. The computer modeling and predictive tools component will result in improved hydrologic modeling, statistical and analytical tools to better quantify sustainable groundwater and surface water availability in the CFCA. 3.7.3. Total Maximum Daily Load The Total Maximum Daily Load (TMDL) program identifies surface waters that do not meet their designated use and are therefore impaired. The Florida Department of Environmental Protection (FDEP) utilizes a stakeholder driven process to develop Basin Management Action Plans to accomplish watershed restoration and achievement of the TMDL for the impaired surface water. Most impaired surface waters in Florida have a nutrient impairment where concentrations of nitrogen and/or phosphorus are causing an imbalance in flora and fauna in the surface water body. The TMDL program is designed to address current impairment while future growth may contribute additional nutrients to the surface water that is being restored. To address the concern of nutrient loading from future development, and to address growing concerns about over-enrichment of Florida‘s surface waters, ground waters, and springs by nutrients, the FDEP and the WMDs are developing a statewide stormwater treatment rule. This rule represents a significant step forward in the control of nutrient loadings from stormwater discharges. A Technical Advisory Committee was established to assist FDEP and Water Management District staffs in developing the first versions of the draft rule and Applicant's Handbook. The rule development schedule as of May 11, 2010 is as follows:
Conduct public workshops prior to rule adoption – May 2011
Rule adoption - no sooner than July 1, 2011 In addition, the U.S. Environmental Protection Agency (EPA) in 2010 also proposed rules to establish numeric nutrient water quality criteria to protect aquatic life in lakes and flowing waters, including canals, within the State of Florida and is proposing regulations to establish a framework for Florida to develop ‗‗restoration standards‘‘ for impaired waters in lieu of the current narrative nutrient standards. The proposed concentrations for inland lakes and flowing streams have caused much concern for Florida stakeholders. The challenge of nutrient pollution has been a top priority for FDEP. Over the past decade or more, FDEP has spent over 20 million dollars collecting and analyzing data on the relationship between phosphorus, nitrogen, and nitrite-nitrate concentrations and the biological health of aquatic systems. Moreover, Florida is one of the few states to establish a comprehensive framework of accountability that applies to both point and nonpoint sources and provides the enforceable authority to address nutrient reductions in impaired waters based upon the establishment of site specific TMDLs. Despite FDEP‘s intensive efforts to diagnose and control nutrient pollution, substantial water quality degradation from nutrient over-enrichment remain a significant problem. On January 14, 2009, EPA made a determination under section 303(c)(4)(B) of the Clean Water Act (CWA) that numeric nutrient water quality criteria for lakes and flowing waters and for estuaries and

coastal waters are necessary for the State of Florida to meet the requirements of CWA section 303(c). Section 303(c)(4) of the CWA requires the administrator to promptly prepare and publish proposed regulations setting forth new or revised water quality standards (WQS) when the administrator, or an authorized delegate of the administrator, determines that such new or revised WQS are necessary to meet requirements of the CWA. This proposed rule fulfills EPA‘s obligation under section 303(c)(4) of the CWA to promptly propose criteria for Florida‘s lakes and flowing waters. The phased Consent Decree directs EPA to issue a final rule by October 15, 2010 for lakes and flowing water, and by October 15, 2011 for estuarine and coastal waters, unless Florida submits and EPA approves State numeric nutrient criteria before a final EPA action. [Source: Federal Register, Part III Environmental Protection Agency, 40 CFR Part 131, Water Quality Standards for the State of Florida‘s Lakes and Flowing Waters; Proposed Rule, January 26, 2010] http://www.epa.gov/waterscience/standards/rules/florida/

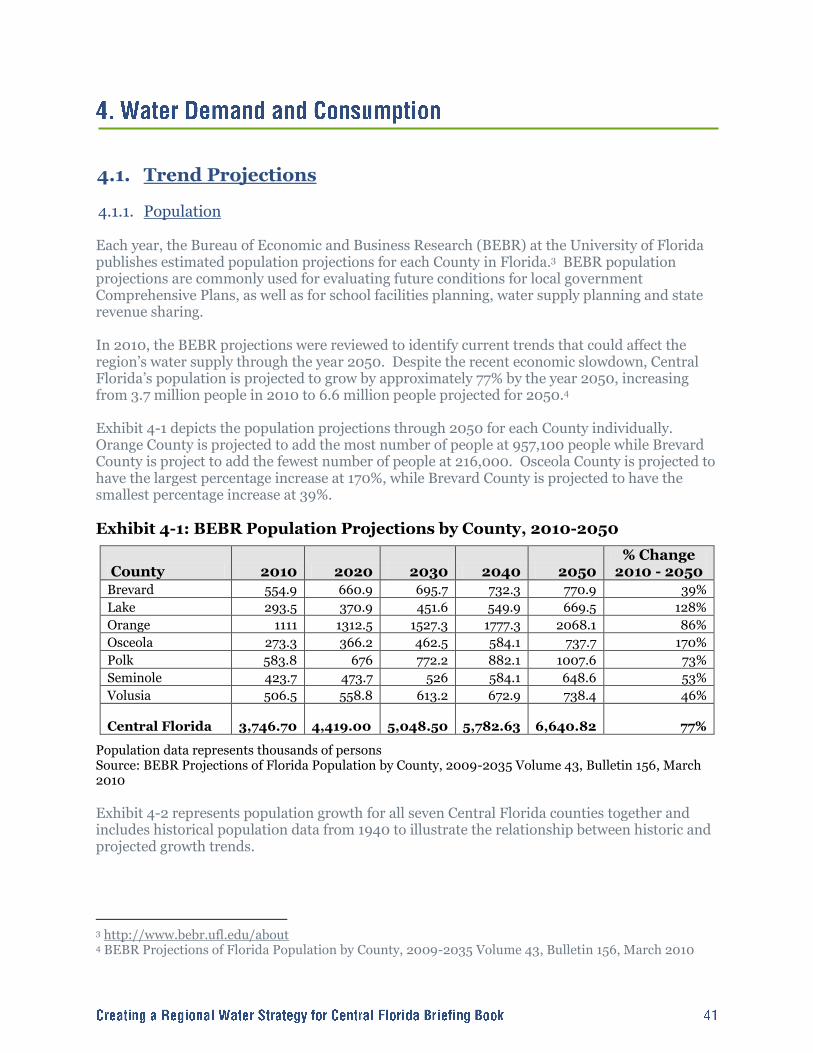
4.1. Trend Projections
4.1.1. Population Each year, the Bureau of Economic and Business Research (BEBR) at the University of Florida publishes estimated population projections for each County in Florida.3 BEBR population projections are commonly used for evaluating future conditions for local government Comprehensive Plans, as well as for school facilities planning, water supply planning and state revenue sharing. In 2010, the BEBR projections were reviewed to identify current trends that could affect the region‘s water supply through the year 2050. Despite the recent economic slowdown, Central Florida‘s population is projected to grow by approximately 77% by the year 2050, increasing from 3.7 million people in 2010 to 6.6 million people projected for 2050.4 Exhibit 4-1 depicts the population projections through 2050 for each County individually. Orange County is projected to add the most number of people at 957,100 people while Brevard County is project to add the fewest number of people at 216,000. Osceola County is projected to have the largest percentage increase at 170%, while Brevard County is projected to have the smallest percentage increase at 39%. Exhibit 4-1: BEBR Population Projections by County, 2010-2050
County 2010 2020 2030 2040 2050 % Change
2010 - 2050 Brevard 554.9 660.9 695.7 732.3 770.9 39%
Lake 293.5 370.9 451.6 549.9 669.5 128%
Orange 1111 1312.5 1527.3 1777.3 2068.1 86%
Osceola 273.3 366.2 462.5 584.1 737.7 170%
Polk 583.8 676 772.2 882.1 1007.6 73%
Seminole 423.7 473.7 526 584.1 648.6 53%
Volusia 506.5 558.8 613.2 672.9 738.4 46%
Central Florida 3,746.70
4,419.00
5,048.50
5,782.63
6,640.82 77%
Population data represents thousands of persons Source: BEBR Projections of Florida Population by County, 2009-2035 Volume 43, Bulletin 156, March 2010
Exhibit 4-2 represents population growth for all seven Central Florida counties together and includes historical population data from 1940 to illustrate the relationship between historic and projected growth trends.
3 http://www.bebr.ufl.edu/about 4 BEBR Projections of Florida Population by County, 2009-2035 Volume 43, Bulletin 156, March 2010
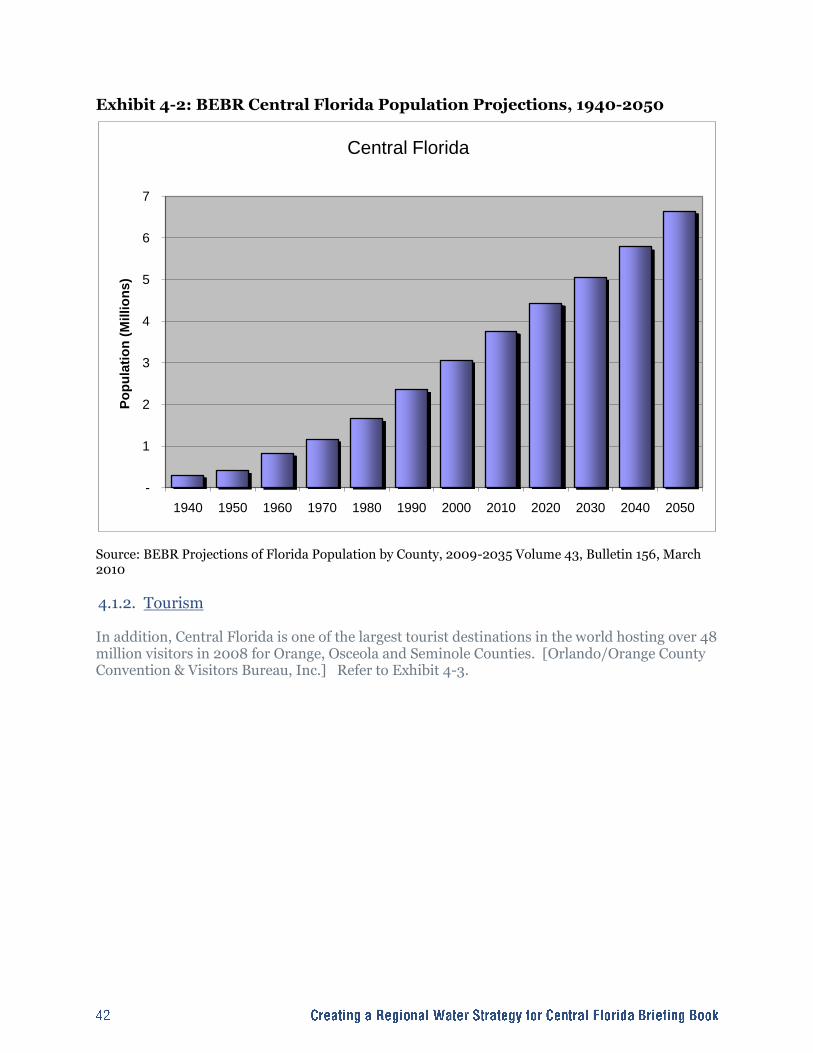
Exhibit 4-2: BEBR Central Florida Population Projections, 1940-2050
Source: BEBR Projections of Florida Population by County, 2009-2035 Volume 43, Bulletin 156, March 2010
4.1.2. Tourism In addition, Central Florida is one of the largest tourist destinations in the world hosting over 48 million visitors in 2008 for Orange, Osceola and Seminole Counties. [Orlando/Orange County Convention & Visitors Bureau, Inc.] Refer to Exhibit 4-3.
-
1
2
3
4
5
6
7
1940 1950 1960 1970 1980 1990 2000 2010 2020 2030 2040 2050
Po
pu
lati
on
(M
illio
ns)
Central Florida
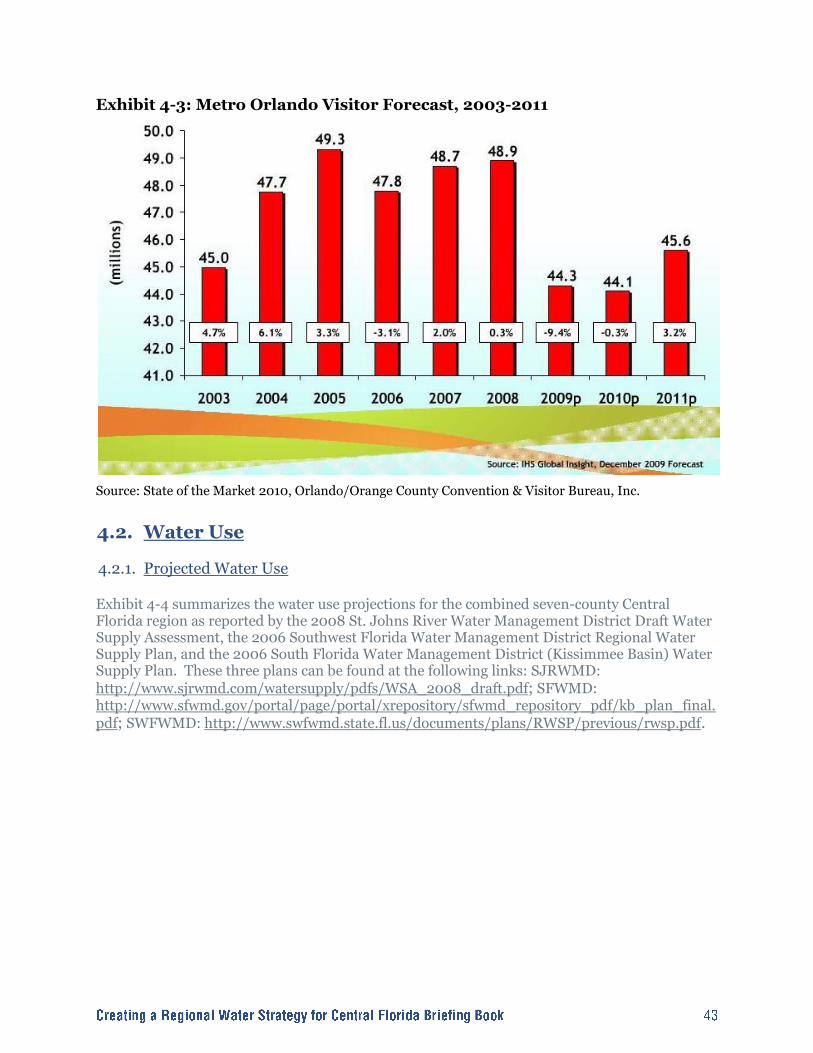
Exhibit 4-3: Metro Orlando Visitor Forecast, 2003-2011
Source: State of the Market 2010, Orlando/Orange County Convention & Visitor Bureau, Inc.
4.2. Water Use 4.2.1. Projected Water Use Exhibit 4-4 summarizes the water use projections for the combined seven-county Central Florida region as reported by the 2008 St. Johns River Water Management District Draft Water Supply Assessment, the 2006 Southwest Florida Water Management District Regional Water Supply Plan, and the 2006 South Florida Water Management District (Kissimmee Basin) Water Supply Plan. These three plans can be found at the following links: SJRWMD: http://www.sjrwmd.com/watersupply/pdfs/WSA_2008_draft.pdf; SFWMD: http://www.sfwmd.gov/portal/page/portal/xrepository/sfwmd_repository_pdf/kb_plan_final.pdf; SWFWMD: http://www.swfwmd.state.fl.us/documents/plans/RWSP/previous/rwsp.pdf.

Exhibit 4-4: Central Florida Projected Water Use by Class, 2005-2025
WATER USE (mgd)
Water Use Class 2005 2010 2015 2020 2025
Public Supply 564.49 690.95 771.61 843.07 902.31
Domestic Self-Supply 48.78 58.08 63.63 70.50 77.41
Agricultural Irrigation Self Supply 286.61 275.04 264.11 253.64 243.44
Commercial, Industrial & Institutional Self Supply
99.58 99.57 106.95 114.44 121.83
Recreation Self Supply 34.79 41.64 47.62 53.74 59.76
Thermoelectric Generation Self Supply 2.17 1.89 1.96 2.03 2.11
TOTAL 1036.42 1167.17 1255.88 1337.47 1406.86
Source: 2008 St. Johns River Water Management District Draft Water Supply Assessment, 2006 Southwest Florida Water Management District Regional Water Supply Plan, and 2006 South Florida Water Management District (Kissimmee Basin) Water Supply Plan
Exhibit 4-5 depicts similar information specifically within the CFCA. Public supply represents the largest class of water use and is projected to increase by the greatest amount. Exhibit 4-5: CFCA Projected Water Use by Class
Source: St. Johns River Water Management District
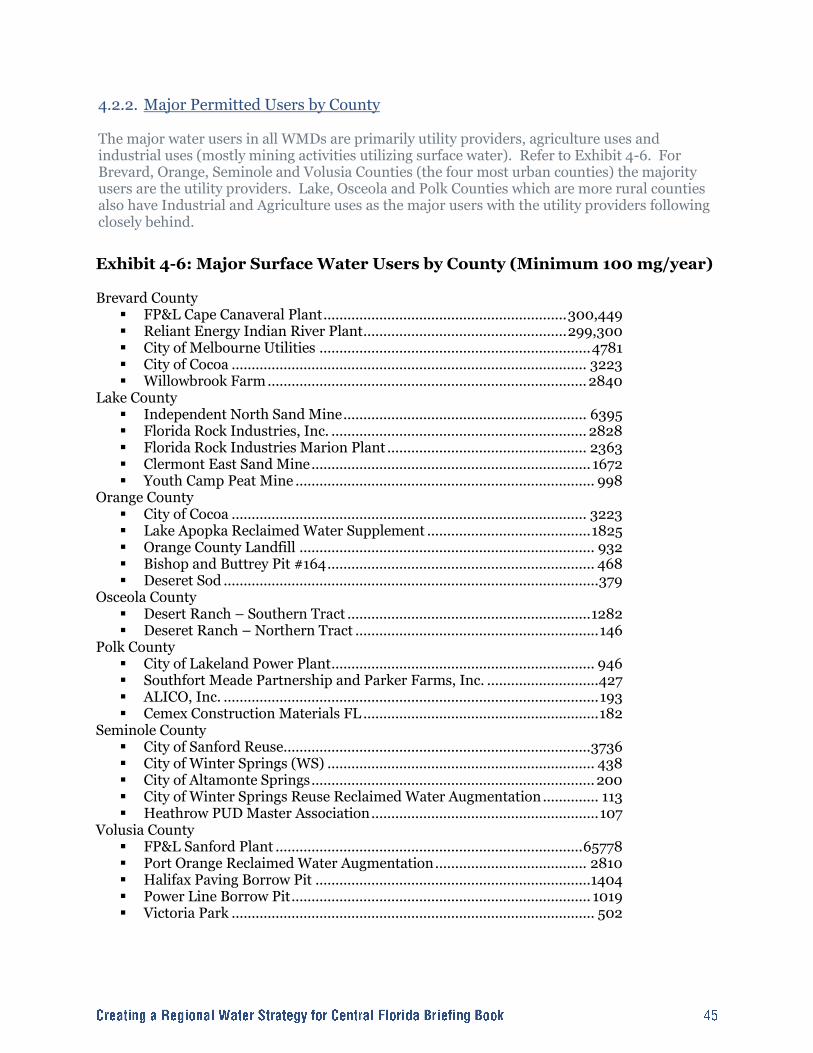
4.2.2. Major Permitted Users by County The major water users in all WMDs are primarily utility providers, agriculture uses and industrial uses (mostly mining activities utilizing surface water). Refer to Exhibit 4-6. For Brevard, Orange, Seminole and Volusia Counties (the four most urban counties) the majority users are the utility providers. Lake, Osceola and Polk Counties which are more rural counties also have Industrial and Agriculture uses as the major users with the utility providers following closely behind.
Exhibit 4-6: Major Surface Water Users by County (Minimum 100 mg/year) Brevard County
FP&L Cape Canaveral Plant ............................................................. 300,449 Reliant Energy Indian River Plant ................................................... 299,300 City of Melbourne Utilities .................................................................... 4781 City of Cocoa ......................................................................................... 3223 Willowbrook Farm ................................................................................ 2840
Lake County Independent North Sand Mine ............................................................. 6395 Florida Rock Industries, Inc. ................................................................ 2828 Florida Rock Industries Marion Plant .................................................. 2363 Clermont East Sand Mine ...................................................................... 1672 Youth Camp Peat Mine ........................................................................... 998
Orange County City of Cocoa ......................................................................................... 3223 Lake Apopka Reclaimed Water Supplement ......................................... 1825 Orange County Landfill .......................................................................... 932 Bishop and Buttrey Pit #164 ................................................................... 468 Deseret Sod .............................................................................................. 379
Osceola County Desert Ranch – Southern Tract ............................................................. 1282 Deseret Ranch – Northern Tract ............................................................. 146
Polk County City of Lakeland Power Plant .................................................................. 946 Southfort Meade Partnership and Parker Farms, Inc. ............................ 427 ALICO, Inc. .............................................................................................. 193 Cemex Construction Materials FL ........................................................... 182
Seminole County City of Sanford Reuse............................................................................. 3736 City of Winter Springs (WS) ................................................................... 438 City of Altamonte Springs ....................................................................... 200 City of Winter Springs Reuse Reclaimed Water Augmentation .............. 113 Heathrow PUD Master Association ......................................................... 107
Volusia County FP&L Sanford Plant ............................................................................. 65778 Port Orange Reclaimed Water Augmentation ...................................... 2810 Halifax Paving Borrow Pit ..................................................................... 1404 Power Line Borrow Pit ........................................................................... 1019 Victoria Park ........................................................................................... 502

4.2.3. Water Use by Source
The USGS summarized water use in Florida for 2005 as follows [Marella 2008]:
Public water supply systems in Florida served 16.1 million people an average of 158 gpd per person (about 2,541 mgd)
o The majority of this was supplied by groundwater sources (2,201 mgd for 14.3 million people)
o Surface water supplied a small amount of public supplies (340 mgd for 1.8 million people)
Domestic self-suppliers used 185 mgd, serving approximately 1.8 million people (little was supplied from surface water)
Irrigation was a significant use of water at 2,766 mgd for irrigating approximately 1.78 million acres. Approximately 53% of irrigation water was from surface water sources.
Industry used approximately 1,079 mgd of water with groundwater supplying approximately 75% of the total.
Central Florida displays similar trends of use historically with the rest of the state based on the USGS data. Almost all groundwater for Central Florida is derived from the Floridan aquifer.
Public water supply systems in Central Florida served approximately 3.22 million people approximately 498 mgd (approximately 155 gpd/person)
o The majority of this was supplied by groundwater sources (482 mgd for 3.08 million people)
o Surface water supply was primarily done only in Brevard County (16 mgd for 138,000 people)
Domestic self-suppliers used approximately 29 mgd of groundwater serving 300,000 people (no surface water uses were noted).
Irrigation drew upon approximately 339 mgd for irrigating approximately 233,000 acres of which approximately 14% was irrigated with surface water.
Industry used approximately 40 mgd of water with groundwater supplying approximately 96% of the total.
Today, it is estimated that ninety-three (93%) percent of Florida‘s potable water comes from groundwater. [Source: ECFRPC] 4.2.4. Consumption (municipal utility, agriculture, private wells, etc.) Exhibit 4-7 shows areas where a water use permit aka consumptive use permit has been applied for or approved by the SJRWMD, SFWMD or SWFWMD. The data are a compilation of active and inactive permits including those that have been submitted, approved, denied, proposed, inactive or withdrawn. Permit holders shown include agricultural, industrial, commercial, mining, dewatering, contamination clean-up, public supply and recreation/aesthetic users. Water uses that are exempt from the permitting process include domestic uses for potable and home irrigation and water used for fire fighting. In addition to Consumptive Use Permits, the Districts have been given the responsibility to permit water well construction activities. Water Use permit applications filed with the WMD are reviewed under administrative rule Chapters
40-2 and 40-20, F.A.C. Well construction requests are reviewed under Chapters 40-3 and 40-30, F.A.C. Detailed technical criteria are contained in a Basis of Review that is incorporated by reference in the above rules. Individual permits are issued for projects that exceed a monthly use of 15 million gallons per month (mgm). There are two types of General Permits (GP's): 1) minor GP's which use less than 3 mgm and 2) major GP's which use between 3 mgm and 15 mgm. All applications for water use are reviewed under a "three-pronged" test outlined in Chapter 373, Florida Statutes. The first "prong" deals with the nature of the proposed use. The applicant must demonstrate that the use is ―reasonable and beneficial". This standard requires the prevention of wasteful or excessive uses of water and a demonstration by the applicant requiring water conservation, urban demand management, and high-efficiency irrigation systems in addition to the use of the lowest quality of water for the intended purpose. The second "prong" requires the applicant to demonstrate that the use is consistent with the public interest. Under this provision, impacts to the resources of the State, including environmental, navigation, consistency with minimum flows and levels from the water source, and public recreation, must be evaluated. The third "prong" of the permit evaluation requires the applicant to assure that the use will not result in adverse impacts to existing legal users. Existing legal users are defined as those authorized under a valid permit or are otherwise exempt. Water Use Permits are issued for fixed durations, generally ranging from 1 year to 20 years, depending on the proposed use and resource considerations at the time of permitting. They must be renewed upon expiration to continue the use. This allows the District to consider and incorporate new rules or standards in existing permits at the time of renewal.

Exhibit 4-7: Central Florida Water Use Permit Areas
Source: SJRWMD (2009), SWFWMD (2009) or SFWMD (2009)
Ê
Ê
Ê
ÊÊ
ÊÊ
Florida's Turnpike
Florida's Turnpike
Beachline Expressway
§̈¦4
§̈¦95
§̈¦95
§̈¦4
§̈¦75
POLK
LAKE
OSCEOLA
VOLUSIA
ORANGE
BREVARD
SEMINOLE
Legend
Ê County Capital
Interstates
Toll Roads
County Boundary
Water Use Permits
4.3. Utility Service Areas and Agreements Exhibit 4-8 depicts a compilation of all water utility retail service boundaries within Central Florida. A public supply permit applicant must define the entire area proposed to be serviced by the public supply system during the term of the permit. This area includes both the service area in which the supplier has the ability and legal right to distribute water, as well as other areas where an entity purchases water wholesale from the applicant. Water use requests for areas proposed to be supplied must be supported with detailed demand information and plans of the supply system proposed to accomplish this service. In cases where the applicant does not have political control over a portion or portions of the area supplied (e.g., a county utility supplies a city), detailed demand information for the entire area will be required from the wholesaler. Wholesalers must provide the water management district with a written agreement from the water purchasers to abide by the conditions of the wholesaler's permit. Service areas are not considered to be under the control of the applicant in terms of consideration of off-site impacts. Where there is a potential for adverse impacts to existing legal users due to the applicant's withdrawals, whether within or outside the applicant's service area, the applicant shall submit a plan by which the potential impacts shall be monitored and mitigated if such impacts should occur. In addition, a public supply utility permit applicant must define the entire area proposed to be serviced by the public supply system or utility with potable water during the term of the permit. A public water supply utility may have separate, discreet service areas; however, if water is routinely transferred between service areas, the service areas are counted as one. An applicant's public supply service area is composed of the following, unless the applicant demonstrates that factors unique to its utility make one or more of these situations inapplicable to the determination of the applicant's service area:
The current and projected geographic retail area for which a public water supply utility intends to provide and bill for potable water for the duration of the permit.
The current and projected geographical retail areas of a public water supply utility that is not required to have a Wholesale Water Use Permit but which purchases water wholesale from the Applicant.
Areas where the Applicant bills for water use although another entity or utility has a Wholesale Water Use Permit for distribution of the water to the population.

Exhibit 4-8: Central Florida Water Utility Service Areas
Source: SJRWMD (2009), SWFWMD (2003) and SFWMD (2009)
Ê
Ê
Ê
ÊÊ
ÊÊ
Florida's Turnpike
Florida's Turnpike
Beachline Expressway
§̈¦4
§̈¦95
§̈¦95
§̈¦4
§̈¦75
POLK
LAKE
OSCEOLA
VOLUSIA
ORANGE
BREVARD
SEMINOLE
Legend
Ê County Capital
Interstates
Toll Roads
County Boundary
Water Utility Service Areas

4.4. Summary of Water Supply Conditions Today 4.4.1. What We Know
Central Florida must limit future increase in groundwater use for environmental protection.
Water Conservation is critical.
Central Florida must diversify its water sources.
4.4.2. What We Do Not Know
Poor understanding of submarine groundwater discharge.
Poor understanding of local and regional weather patterns (especially rainfall) that are affected by short-term ENSO events (El Niño and La Niña) and by longer-term global ocean phenomenon such as the Atlantic multidecadal oscillation (AMO). AMO is an ongoing series of periodic changes in the sea surface temperature of the North Atlantic Ocean, with cool and warm phases that may last for decades at a time. It has been associated with changes in the frequency of North American droughts and Atlantic hurricanes, and with rainfall increases in peninsular Florida during a warm phase. A warm phase has been in effect since the mid-1990s (NOAA 2005).
Poor understanding of climate change impacts to water quality and supply.
Poor understanding of direct and indirect effects of groundwater and surface water withdrawal on ecosystem health and sustainability.
Poor understanding of local and regional threats from saltwater intrusion.
Poor understanding of surface water quality trends and impacts to future supply options.
4.5. Comparison between Projected Future Conditions and Available Supply
The 77% increase of Central Florida‘s population by the year 2050 presents an obvious challenge for water service and utility providers, local governments and state regulatory agencies. According to the U.S. Geological Survey, the average Central Florida resident uses 148 gallons of water per day compared to 158 gallons of water per day statewide [USGS, Water Use in Florida, 2005 and Trends 1950-2005 http://pubs.usgs.gov/fs/2008/3080/]. While this usage is below the national average of 152 gallons per person per day, the projected population increase of 2.9 million people by the year 2050 would have a significant impact on existing potable water supply. In generalized terms, an additional 2.9 million people could result in a demand for 429 million gallons of potable water per day; this simple calculation does not include potable water demand associated with non-residential land uses that support the new population, such as employment centers, agriculture and industry, restaurants, and other services. This scenario assumes that current water consumption rates and patterns do not change, and is also known as a ―business as usual‖ trend.
Should this trend continue, the traditional source of potable water (primarily groundwater) in Central Florida would be significantly affected. The CFCA report (refer to Section 3.6.1) found that current potable water consumption will reach an unsustainable level by the year 2013.5 With these population and demand projections, the WMDs concluded that alternative water supply sources must be developed to meet increased demands in Central Florida beyond 2013. Alternative water supply sources, such as surface water, desalination, and reuse, as well as conservation practices, can increase the total amount of potable water potentially available to the Central Florida region, and represent a change from the business as usual scenario. General identification of potential alternatives is described in Section 7.
5 Central Florida Coordination Area Planning Work Group Final Report. January 2008. http://www.swfwmd.state.fl.us/files/database/site_file_sets/60/CFCA_Planning_Group_Final_Report.pdf
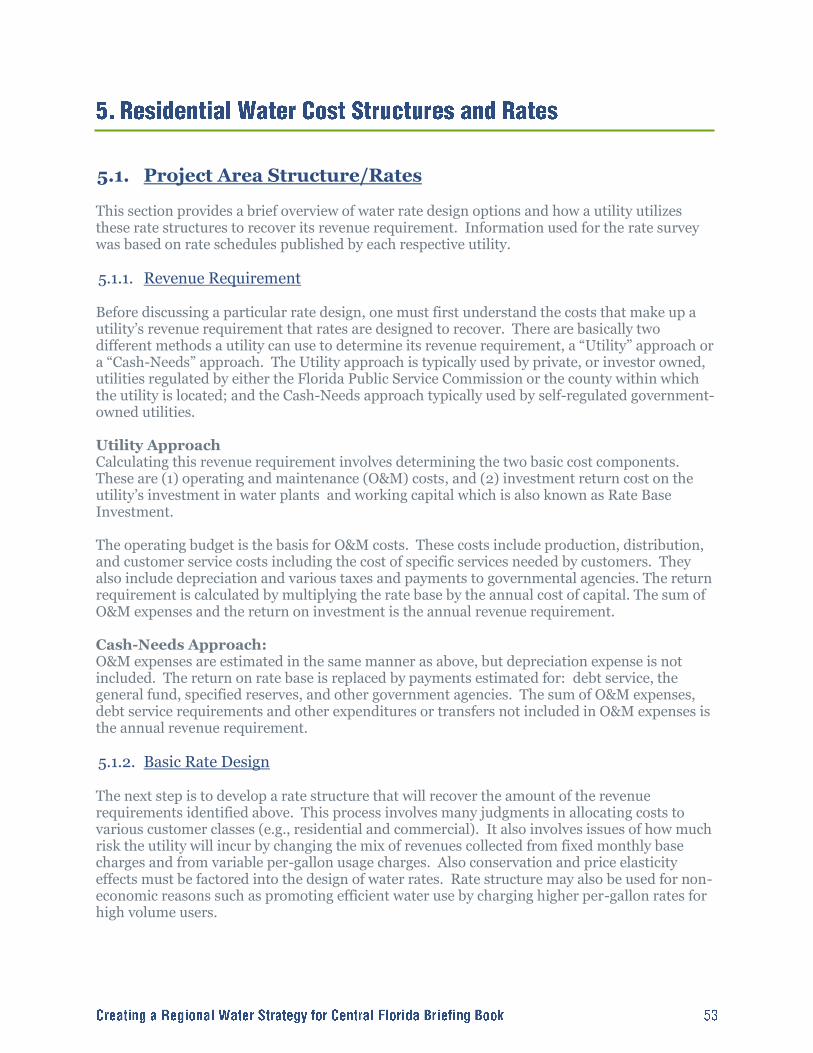
5.1. Project Area Structure/Rates This section provides a brief overview of water rate design options and how a utility utilizes these rate structures to recover its revenue requirement. Information used for the rate survey was based on rate schedules published by each respective utility. 5.1.1. Revenue Requirement Before discussing a particular rate design, one must first understand the costs that make up a utility‘s revenue requirement that rates are designed to recover. There are basically two different methods a utility can use to determine its revenue requirement, a ―Utility‖ approach or a ―Cash-Needs‖ approach. The Utility approach is typically used by private, or investor owned, utilities regulated by either the Florida Public Service Commission or the county within which the utility is located; and the Cash-Needs approach typically used by self-regulated government-owned utilities. Utility Approach Calculating this revenue requirement involves determining the two basic cost components. These are (1) operating and maintenance (O&M) costs, and (2) investment return cost on the utility‘s investment in water plants and working capital which is also known as Rate Base Investment. The operating budget is the basis for O&M costs. These costs include production, distribution, and customer service costs including the cost of specific services needed by customers. They also include depreciation and various taxes and payments to governmental agencies. The return requirement is calculated by multiplying the rate base by the annual cost of capital. The sum of O&M expenses and the return on investment is the annual revenue requirement. Cash-Needs Approach: O&M expenses are estimated in the same manner as above, but depreciation expense is not included. The return on rate base is replaced by payments estimated for: debt service, the general fund, specified reserves, and other government agencies. The sum of O&M expenses, debt service requirements and other expenditures or transfers not included in O&M expenses is the annual revenue requirement. 5.1.2. Basic Rate Design The next step is to develop a rate structure that will recover the amount of the revenue requirements identified above. This process involves many judgments in allocating costs to various customer classes (e.g., residential and commercial). It also involves issues of how much risk the utility will incur by changing the mix of revenues collected from fixed monthly base charges and from variable per-gallon usage charges. Also conservation and price elasticity effects must be factored into the design of water rates. Rate structure may also be used for non-economic reasons such as promoting efficient water use by charging higher per-gallon rates for high volume users.

5.1.3. Rate Comparisons As part of this briefing, a review of residential rate structures and bill comparisons of select utilities within Central Florida was developed. Monthly customer consumption at 3,000, 10,000 and 30,000 gallons was utilized to demonstrate the residential bill impact based on current rate structures. Refer to Exhibit 5-1 for a summary of the residential monthly bill for water and sewer at these various levels. The rates used in this comparison were obtained from each utility‘s web site. Exhibit 5-1: Rate Comparisons at 3,000, 10,000 and 30,000 Gallons
Water & Sewer @ 3 Kgal
$0 $10 $20 $30 $40 $50 $60 $70 $80
TOHO
Altamonte Springs
Sanlando Utlities
Fruitland Park
Sanford
Clermont
Apopka
Winter Haven
OUC
Orange County
Lakeland
Maitland
Mt Dora
Leesburg
Winter Park
St Cloud
N. Brevard County
Seminole County
Bartow
Deland
W. Volusia County
New Smyrna Beach
Melbourne
Oviedo
Titusville
E. Volusia County
Daytona Beach
Deltona
$/Month
Water Sewer
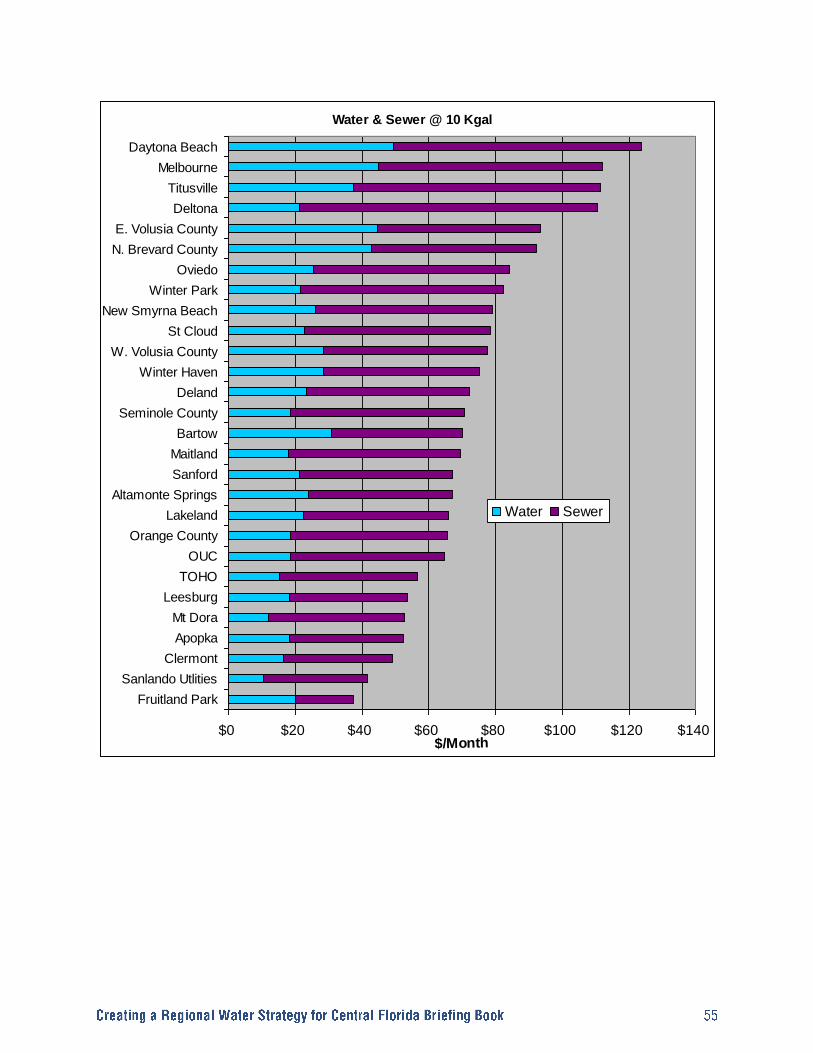
Water & Sewer @ 10 Kgal
$0 $20 $40 $60 $80 $100 $120 $140
Fruitland Park
Sanlando Utlities
Clermont
Apopka
Mt Dora
Leesburg
TOHO
OUC
Orange County
Lakeland
Altamonte Springs
Sanford
Maitland
Bartow
Seminole County
Deland
Winter Haven
W. Volusia County
St Cloud
New Smyrna Beach
Winter Park
Oviedo
N. Brevard County
E. Volusia County
Deltona
Titusville
Melbourne
Daytona Beach
$/Month
Water Sewer
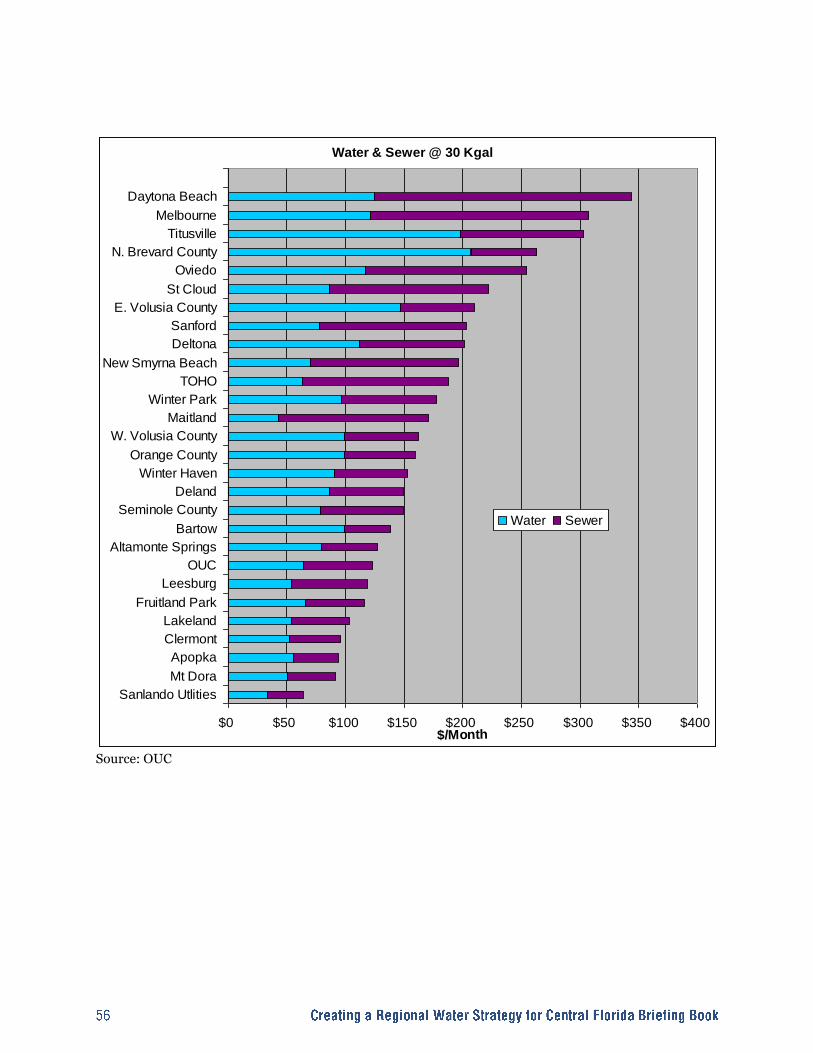
Water & Sewer @ 30 Kgal
$0 $50 $100 $150 $200 $250 $300 $350 $400
Sanlando Utlities
Mt Dora
Apopka
Clermont
Lakeland
Fruitland Park
Leesburg
OUC
Altamonte Springs
Bartow
Seminole County
Deland
Winter Haven
Orange County
W. Volusia County
Maitland
Winter Park
TOHO
New Smyrna Beach
Deltona
Sanford
E. Volusia County
St Cloud
Oviedo
N. Brevard County
Titusville
Melbourne
Daytona Beach
$/Month
Water Sewer
Source: OUC
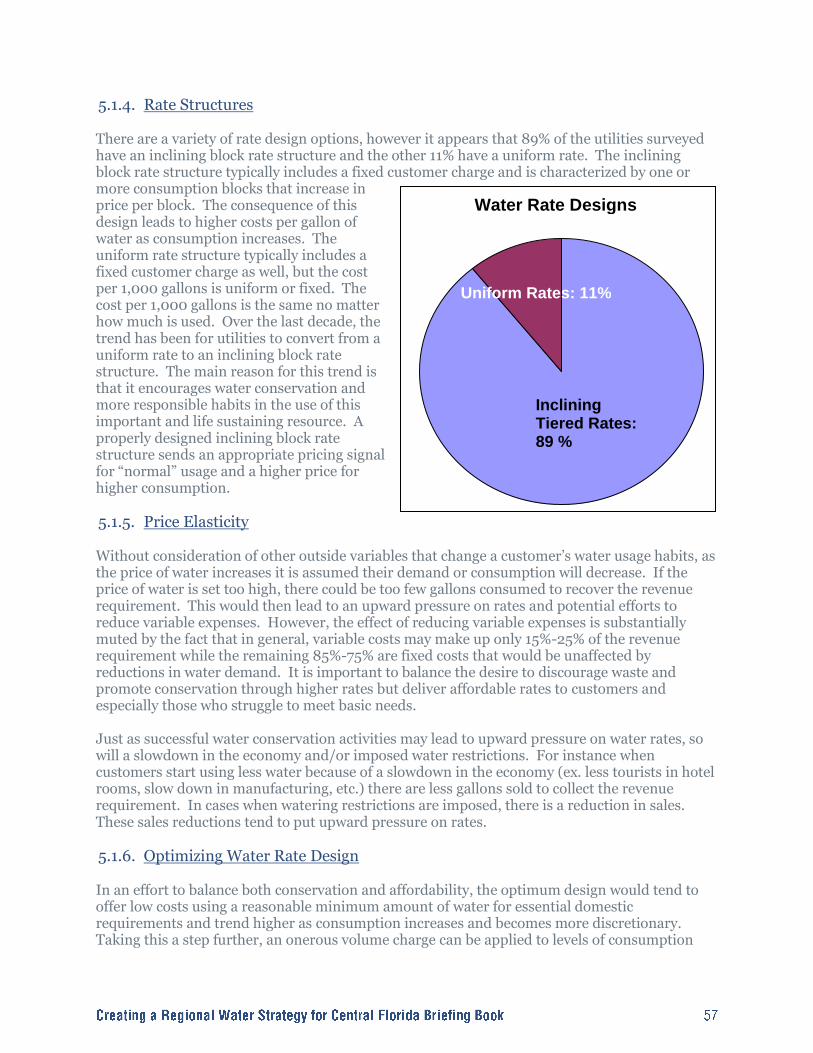
5.1.4. Rate Structures There are a variety of rate design options, however it appears that 89% of the utilities surveyed have an inclining block rate structure and the other 11% have a uniform rate. The inclining block rate structure typically includes a fixed customer charge and is characterized by one or more consumption blocks that increase in price per block. The consequence of this design leads to higher costs per gallon of water as consumption increases. The uniform rate structure typically includes a fixed customer charge as well, but the cost per 1,000 gallons is uniform or fixed. The cost per 1,000 gallons is the same no matter how much is used. Over the last decade, the trend has been for utilities to convert from a uniform rate to an inclining block rate structure. The main reason for this trend is that it encourages water conservation and more responsible habits in the use of this important and life sustaining resource. A properly designed inclining block rate structure sends an appropriate pricing signal for ―normal‖ usage and a higher price for higher consumption. 5.1.5. Price Elasticity Without consideration of other outside variables that change a customer‘s water usage habits, as the price of water increases it is assumed their demand or consumption will decrease. If the price of water is set too high, there could be too few gallons consumed to recover the revenue requirement. This would then lead to an upward pressure on rates and potential efforts to reduce variable expenses. However, the effect of reducing variable expenses is substantially muted by the fact that in general, variable costs may make up only 15%-25% of the revenue requirement while the remaining 85%-75% are fixed costs that would be unaffected by reductions in water demand. It is important to balance the desire to discourage waste and promote conservation through higher rates but deliver affordable rates to customers and especially those who struggle to meet basic needs. Just as successful water conservation activities may lead to upward pressure on water rates, so will a slowdown in the economy and/or imposed water restrictions. For instance when customers start using less water because of a slowdown in the economy (ex. less tourists in hotel rooms, slow down in manufacturing, etc.) there are less gallons sold to collect the revenue requirement. In cases when watering restrictions are imposed, there is a reduction in sales. These sales reductions tend to put upward pressure on rates. 5.1.6. Optimizing Water Rate Design In an effort to balance both conservation and affordability, the optimum design would tend to offer low costs using a reasonable minimum amount of water for essential domestic requirements and trend higher as consumption increases and becomes more discretionary. Taking this a step further, an onerous volume charge can be applied to levels of consumption
Water Rate Designs
Inclining Tiered Rates: 89 %
Uniform Rates: 11%

considered wasteful. Two examples of this type of a rate design are Orange County and Brevard County Utilities. Both utilities utilize an inclining block rate structure with a per thousand gallon charge in excess of $10 for such volumes.
5.1.7. Drought Rates Some communities have developed ―Drought Rates‖ or special surcharges that would be imposed during times of severe drought or emergency. A more detailed description of Drought Rates can be found on pages 21 – 23 of the Conserve Florida Water‘s publication, Conservation and Drought Water Rates: State of the art practices and their application, dated April 2009. As an example, Hernando County will impose a 50% surcharge to the last four blocks when SWFWMD declares a drought or emergency.
5.1.8. Projected Customer Usage Every utility has a different customer mix and various economic conditions within its service area that can all lend to varying usage habits from its customers. The table to the right is a summary of the 2010 projected gross per capita usage by utility within the SJRWMD jurisdictional area as provided in their draft Water Supply Assessment 2008. It should be noted that this per capita use is not limited to residential. It is taking the total utility system flows, residential and commercial, and dividing by the population for the service area. Not every utility was covered in this information. However, these examples illustrate the wide range of projected uses within the group of utilities.
5.1.9. Conclusion Each utility has a different level and makeup of revenue requirement, different customer mix, different economic situation and different rate schedules. However, each utility is faced with the ever increasing need to have its customers conserve water. The appropriate price signal sent from the rate design is one way to move in this direction.
5.2. Structure/Rates from other Areas A first of its kind survey of residential water use and prices in 30 metropolitan regions in the United States has found that some cities in rain-scarce regions have the lowest residential water rates and the highest level of water use. The survey, conducted by Circle of Blue (www.circleofblue.org), found that average daily residential water use ranged from a low of 41 gallons per person in Boston to a high of 211 gallons per person in Fresno, Calif.
Sanlando Utilities Corp. 30,120 307
Maitland, City of 10,842 273
Orlando Utilities Commission 236,526 237
Leesburg, City of 33,200 230
Clermont, City of 34,146 216
Toho Water Authority 947 201
Fruitland Park, City of 3,714 199
Mount Dora, City of 20,214 194
Winter Park, City of 57,664 187
Apopka, City of 59,036 182
Orange County Public Utilities 364,792 172
Utilities Commission of New Smyrna Beach 31,856 166
Deltona, City of 85,111 161
Volusia County Utilities 35,638 160
Daytona Beach, City of 93,475 148
Oviedo, City of 31,947 141
Seminole County Environmental Services 123,402 141
Sanford, City of 56,973 133
Brevard County Water Resources 11,602 115
DeLand, City of 56,857 108
Titusville, City of 50,410 100
Total of above Utilities 1,428,472 177
Utility
2010 Gross per
Capita Usage
(gal/day)
2010 Population
(SJRWMD
Jurisdiction)

While many factors contribute to water pricing, such as the energy used to pump water, the price of chemicals for treatment costs, recent infrastructure projects and operations efficiency–the difference in several Western cities can partly be explained by Federal government subsidy. The Circle of Blue survey includes data on water rates and water usage from the 20 largest U.S. cities, according to the 2000 Census, and ten regionally representative cities to gain a broad view of urban water pricing. The survey comes as municipal water departments and their customers across the country contend with the ironic and unintended consequence of the economic recession and water conservation. Though higher prices can lead residents to conserve, it can also bring financial instability to a water utility if price increases are poorly implemented. Many cities in the U.S. are facing revenue shortfalls because customers are conserving too much. A family of four using 100 gallons per person each day will pay on average $34.29 a month in Phoenix compared to $65.47 for the same amount in Boston. A family of four using 100 gallons per person each day will pay on average $32.93 a month in Las Vegas compared to $72.95 for the same amount in Atlanta, which has more than ten times the amount of average annual rainfall as Las Vegas, according to National Weather Service statistics. For the full results, refer to Exhibit 5-2. Note: Water rate information was gathered from the website of each city‘s water utility and based on single-family residential rates. It is current as of April 1, 2010. Average prices for cities with seasonal rates were calculated using seasonal weighting. For water use information, Circle of Blue asked water departments directly the daily per capita usage for single- and multi-family residential customers. [Source: Circle of Blue WaterNews, April 26, 2010]

Exhibit 5-2: Water Use Comparison of 30 U.S. Cities
Source: Circle of Blue WaterNews, April 26, 2010
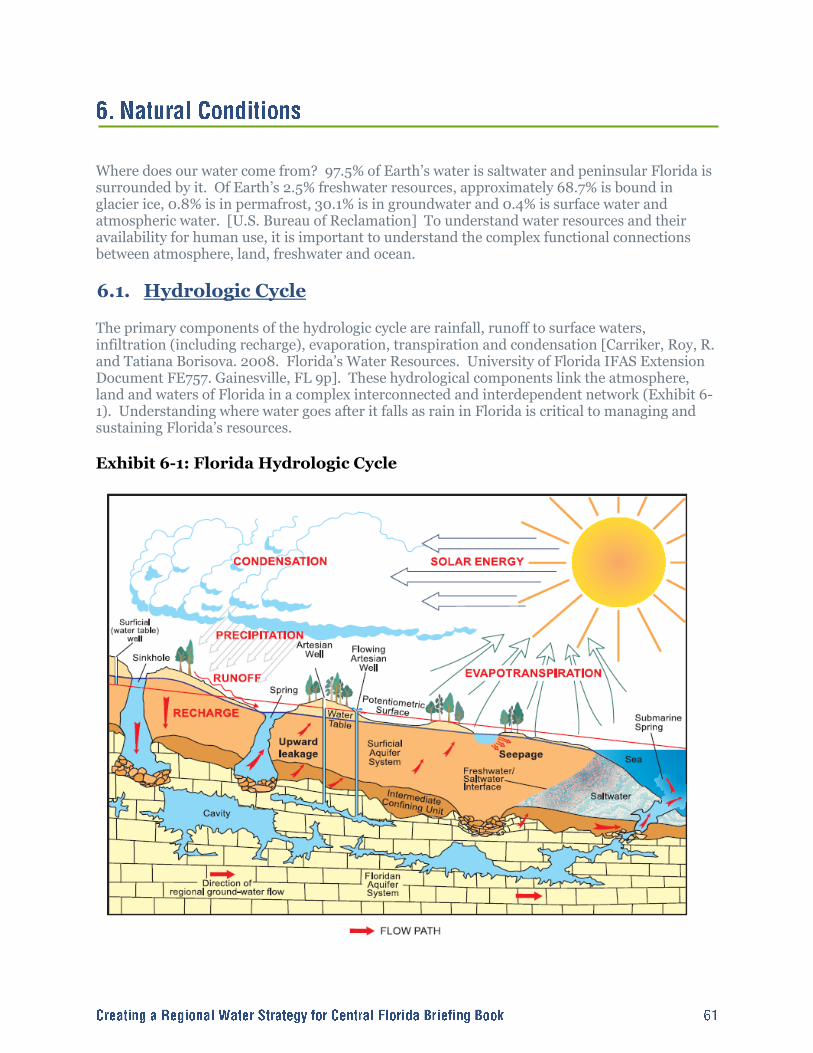
Where does our water come from? 97.5% of Earth‘s water is saltwater and peninsular Florida is surrounded by it. Of Earth‘s 2.5% freshwater resources, approximately 68.7% is bound in glacier ice, 0.8% is in permafrost, 30.1% is in groundwater and 0.4% is surface water and atmospheric water. [U.S. Bureau of Reclamation] To understand water resources and their availability for human use, it is important to understand the complex functional connections between atmosphere, land, freshwater and ocean.
6.1. Hydrologic Cycle The primary components of the hydrologic cycle are rainfall, runoff to surface waters, infiltration (including recharge), evaporation, transpiration and condensation [Carriker, Roy, R. and Tatiana Borisova. 2008. Florida‘s Water Resources. University of Florida IFAS Extension Document FE757. Gainesville, FL 9p]. These hydrological components link the atmosphere, land and waters of Florida in a complex interconnected and interdependent network (Exhibit 6-1). Understanding where water goes after it falls as rain in Florida is critical to managing and sustaining Florida‘s resources.
Exhibit 6-1: Florida Hydrologic Cycle

6.2. Hydrologic Components 6.2.1. Rainfall in Central Florida On average, Central Florida receives between 50 and 54 inches (130 and 140 cm) of rain annually (Exhibit 6-2) with at least half of it occurring during the wet summer months (Exhibit 6-3). Intense afternoon thunderstorms accompanied by wind and lightning are frequent. These rains can be geographically localized and often of short duration. While rainfall appears to be abundant, Central Florida experiences severe and prolonged periods of drought as well as episodes of intense rainfall and floods (Exhibit 6-4). Large, regional-scale climate oscillation patterns like El Niño Southern Oscillation events exert strong influences on rainfall trends in Florida. Extreme rainfall events can occur during tropical storms. As an example, in August 2008 Tropical Storm Fay deposited 16 inches (41 cm) of rain in a 5-day period, most of it located near Melbourne, FL. The St. Johns River near Geneva in Seminole County rose 7 feet (2.1 m) in four days, setting a record. The river near Sanford rose 3 feet (0.91 m) in 36 hours. Fay caused severe flooding in the middle basin of the St. Johns River due to both the extreme rainfall coupled with the flat slopes of the river. [Quillian, Wylie and Brett Whitin. 2009. An analysis of the hydrologic and hydraulic factors during flooding on the St. Johns River caused by Tropical Storm Fay, August 2008. Proceedings of the 2009 Georgia Water Resources Conference. April 27-29, 2009. University of Georgia. 5p.]
Exhibit 6-2: NOAA Mean Annual Total Precipitation, Normalized 1990 and 2000, and Daily High and Low for Central Florida County Seats
City Mean 2006 Normal 1990 Normal 2000 Low High
Bartow 53.67 49.88 50.58 0.00 21.62
DeLand 55.62 56.05 57.03 0.00 22.40
Eustis 48.35 46.07 48.63 0.00 20.00
Kissimmee 50.47 46.11 48.01 0.00 20.61
Orlando 51.00 48.11 48.35 0.00 19.57
Sanford 51.82 48.81 51.31 0.01 20.02
Titusville 54.65 54.07 52.79 0.00 20.75
Rainfall amounts are in inches.
Source: National Oceanographic and Atmospheric Administration (NOAA) and extrapolated by the SJRWMD
A number of major statewide or regional droughts occurred in recent decades, including the early 1970s, the early 1980s, 1989-1990, 1999-2002 and 2006-2009. During 1999-2001, Florida suffered through one of the worst droughts in the state's history. 1999-2000 were the driest back-to-back calendar years on record with Orlando experienced a rainfall deficit of 11.04 inches during the 2-year period. [Learning from the Drought: Annual Status Report on Regional Water Supply Planning. Florida Department of Environmental Protection, August 2008, http://www.dep.state.fl.us/water/waterpolicy/docs/learning-from-drought-final-report.pdf]

Central Florida‘s high temporal and spatial variability in rainfall is typical and yet unpredictable. Understanding complex regional weather patterns in conjunction with long-term global climate factors will continue to be a challenge for Florida‘s water managers. Exhibit 6-3: Average Monthly Precipitation and Temperature, Orlando, FL
Source: The Weather Channel; www.weather.com
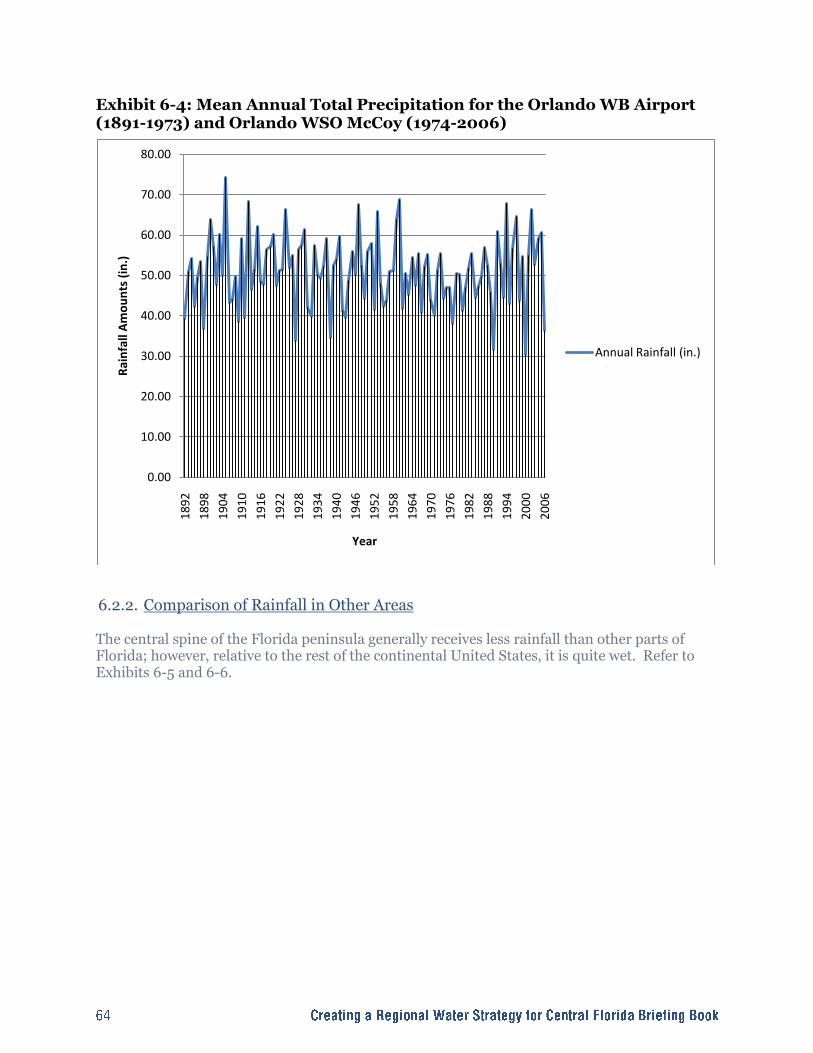
Exhibit 6-4: Mean Annual Total Precipitation for the Orlando WB Airport (1891-1973) and Orlando WSO McCoy (1974-2006)
6.2.2. Comparison of Rainfall in Other Areas The central spine of the Florida peninsula generally receives less rainfall than other parts of Florida; however, relative to the rest of the continental United States, it is quite wet. Refer to Exhibits 6-5 and 6-6.
0.00
10.00
20.00
30.00
40.00
50.00
60.00
70.00
80.00
18
92
18
98
19
04
19
10
19
16
19
22
19
28
19
34
19
40
19
46
19
52
19
58
19
64
19
70
19
76
19
82
19
88
19
94
20
00
20
06
Rai
nfa
ll A
mo
un
ts (
in.)
Year
Annual Rainfall (in.)
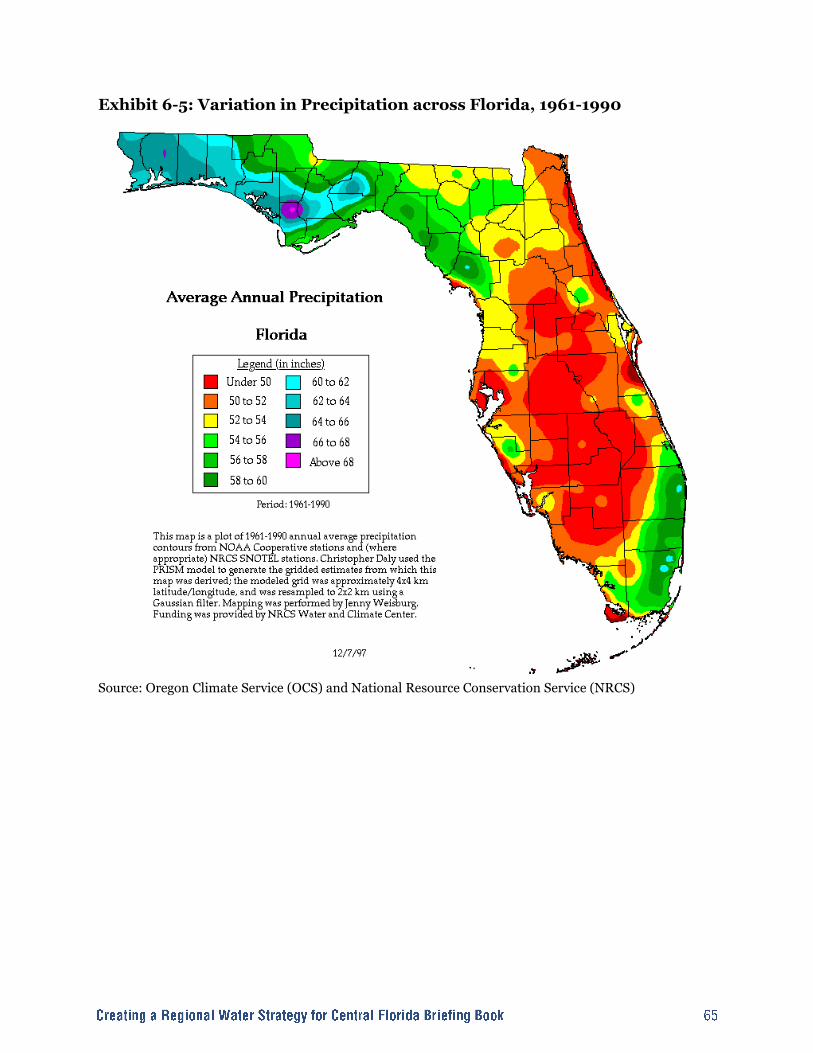
Exhibit 6-5: Variation in Precipitation across Florida, 1961-1990
Source: Oregon Climate Service (OCS) and National Resource Conservation Service (NRCS)

Exhibit 6-6: Mean Total Precipitation across the United States
Source: Internet Accuracy Project
6.2.3. Freshwater Discharges On average, 70% of Florida‘s rainwater is lost as evapotranspiration (i.e. the sum of evaporation and plant transpiration) from the Earth's land surface to the atmosphere, 20% is lost as runoff into surface water bodies and 10% percolates into the ground to recharge wells and aquifers
[University of Florida, IFAS. 2006. Florida‘s Water. Edited by Jack Tichenor for a Manatee County Extension Service Fact Sheet. http://manatee.ifas.ufl.edu/lawn_and_garden/water_wise/pdfs/FloridaWater.pdf)] As Evapotranspiration Evaporation is the process by which water vaporizes and escapes from the water surface rising into the atmosphere. Evaporation rates are affected by a complex association of atmospheric conditions (temperature, wind speed, humidity), water body characteristics (surface area and vegetation) and land conditions (soil permeability, vegetation). In plant transpiration, water is taken up by plants, physiologically processed and transpired (emitted as water vapor) to the atmosphere. The difference between rainfall and evapotranspiration is called ―outflow‖ (i.e. the total amount of water that is available as surface or groundwater flow from an area). Rates of evapotranspiration are influenced by aquatic vegetation and environmental factors (i.e. latitude - solar energy input, air and water temperatures, wind speed, relative humidity, plant growth phase, and nutrient availability). Evapotranspiration takes place mainly during the hours of 10 am to 6 pm.
Central Florida receives between 50 and 54 inches (130 and 140 cm) of rain annually. In the St. Johns River basin the rate of evapotranspiration corresponds to rainfall, ranging between 27 and 57 inches (69 and 140 cm) a year, most of it occurring in the summer. As an example, an open water lake in Orlando can lose as much as 58 inches to evaporation in a typical year exceeding the annual average rainfall. Daily losses range from 0.04 inches/day in January to 0.26 inches/day in May. [University of Florida IFAS; http://plants.ifas.ufl.edu/guide/evaptran.html]. The actual evaporation rate over a large region is considerably lower than the lake evaporation rate because the water is evaporating from land surfaces slower than lake evaporation [Schiffer, Donna, M. 1998. Hydrology of Central Florida Lakes – A Primer. U.S. Geological Survey Circular 1137. In cooperation with the SJRWMD and SFWMD. 38 p.]. To Surface Waters Runoff includes water that flows overland into streams, rivers, lakes, canals, ponds, estuaries and on to the Atlantic Ocean and Gulf of Mexico. Outflow also includes waters from underground aquifers that percolate up into surface water bodies, estuaries and even the nearshore Atlantic Ocean and Gulf of Mexico. Average runoff for most of Central Florida is between 10-20 inches per year [Carriker, Roy, R. and Tatiana Borisova. 2008]. As an example, the vast 8,840 square mile drainage basin of the St. Johns River delivers waters to the northward flowing river. Major tributaries, or smaller streams and rivers that flow into the St. Johns River, include the Wekiva River, the Econlockhatchee River and the Ocklawaha River. The 310 mile (500 km) long St. Johns River is a low elevation river. It drops in elevation from its headwaters to the mouth at Jacksonville at less than 30 feet (9.1 m), about one inch per mile. As a result, the St. Johns has a very slow flow rate at a third of a mile an hour (0.2 km/h). Even with a slow flow rate, the river transports large volumes of freshwater northward as it flows to the Atlantic Ocean. At its midpoint near DeLand, FL, the flow is about 3150 cubic feet per second (2,036 million gallons per day). [Carriker, Roy, R. and Tatiana Borisova. 2008]. As the St. Johns River approaches the sea, ocean tides and wind influence the discharge rate, making the system difficult to model. Saltwater enters the river at its mouth in Jacksonville. In periods of low water, tides may cause a reverse flow as far south as Lake Monroe — 161 miles upstream from the river‘s mouth. Natural aquifer discharge to streams and lakes occurs through springs or to the ocean through submarine groundwater discharge [Stewart, 1980]. There are over 700 springs in Florida, including 33 that are 1st magnitude sprigs with an average flow of over 100 cubic feet per second (64.6 million gallons per day) [Spechler and Schiffer, 1995]. There are a number of 1st, 2nd (10-100cfs), 3rd (1-10 cfs) and 4th (<1 cfs) magnitude springs in Central Florida. [for map, refer to Springs of Florida –FL Springs Task Force, 2000]. Infiltration to Aquifer The amount of rainwater that infiltrates the ground and recharges aquifers is influenced by precipitation, soil infiltration rate, sediment characteristics, geology, relationship of surface water bodies to surficial sediments, and land use patterns. The majority of recharge to the Floridan aquifer system occurs in the areas where it is unconfined or semi-confined, approximately 10-25 in. per year, whereas in the areas of most significant confinement the recharge is less than 1 in. per year. [Source: Bush and Johnston, 1988; Sepulveda, 2002]

6.2.4. Recharge Areas Exhibit 6-7 shows the generalized discharge and recharge to the Floridan aquifer system in Central Florida. These data were generated for the entire seven-county area by the Southwest Florida Water Management District in 2003. Rates are typically calculated as the product of hydraulic pressure (head) differences existing between the water bearing unit directly above the aquifer and the aquifer itself, and the leakance of the confining media. Recharge to the Floridan aquifer occurs in areas where the elevation of the water table within the surficial aquifer is higher than the elevation of the potentiometric surface displayed within the Floridan aquifer. In these areas, water moves from the surficial aquifer in a downward direction to the Floridan aquifer, moving through the upper confining media which separates the two. Recharge also occurs directly from infiltrating rainfall, within small scattered areas to the west - northwest, where the top of the aquifer approaches land surface. The excess precipitation coverage, defined as the difference between long-term average annual rainfall and actual evapotranspiration estimates, provides information regarding the amount of precipitation potentially available for recharge (ignoring surface-water drainage) to the Floridan aquifer in areas such as these. In contrast, discharge from the Floridan aquifer occurs in areas where the elevation of the potentiometric surface within the aquifer is higher than the elevation of the water table above. In these areas, water moves from the Floridan aquifer in an upward direction, passing through the upper confining media to the overlying surficial aquifer. Some of these discharge areas, especially those located to the south where the elevation of the potentiometric surface exceeds that of the land surface, contain free-flowing artesian wells.
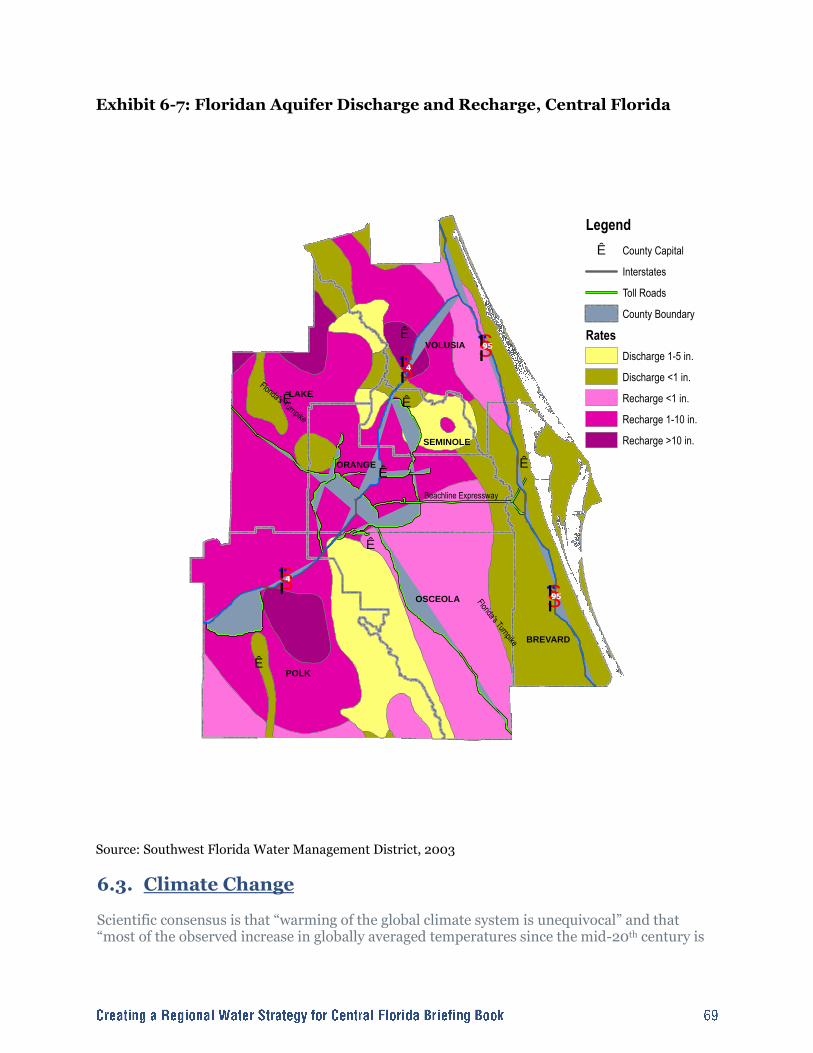
Exhibit 6-7: Floridan Aquifer Discharge and Recharge, Central Florida
Source: Southwest Florida Water Management District, 2003
6.3. Climate Change Scientific consensus is that ―warming of the global climate system is unequivocal‖ and that ―most of the observed increase in globally averaged temperatures since the mid-20th century is
Ê
Ê
Ê
ÊÊ
ÊÊ
Florida's Turnpike
Florida's Turnpike
Beachline Expressway
§̈¦4
§̈¦95
§̈¦95
§̈¦4
§̈¦75
POLK
LAKE
OSCEOLA
VOLUSIA
ORANGE
BREVARD
SEMINOLE
Legend
Ê County Capital
Interstates
Toll Roads
County Boundary
Rates
Discharge 1-5 in.
Discharge <1 in.
Recharge <1 in.
Recharge 1-10 in.
Recharge >10 in.

very likely due to the observed increase in anthropogenic greenhouse gas concentrations.‖ [Source: Fourth Assessment Report of the United Nations Intergovernmental Panel on Climate Change, updated September 5, 2007]. Refer to Exhibit 6-8 for global land and ocean temperature change. Exhibit 6-8: Global Temperature Anomalies 1880-2008
Source: NOAA National Climate Data Center, U.S. Department of Commerce, April 2010
Since publication of the Intergovernmental Panel on Climate Change (IPCC) report, scientific evidence continues to support and expand the primary conclusions of the IPCC [www.ipcc.ch]. On May 7, 2010, 255 scientists, all members of the U.S. National Academy of Sciences, published an essay in the journal Science. These scientists reconfirmed the following fundamental conclusions about climate change:
Warming the planet will cause many other climatic patterns to change at speeds unprecedented in modern times, including increasing rates of sea level rise and alterations in the hydrologic cycle. Rising concentrations of carbon dioxide are making the oceans more acidic.
The combination of these complex climate changes threatens coastal communities and cities, our food and water supplies, marine and freshwater ecosystems, forests, high mountain environments, and far more.
Consequently, global climate change is expected to pose a significant risk to Florida. As noted earlier, Florida already is addressing many water resource management challenges including shortages due to increasing demand, decreasing availability of groundwater sources, drought,

flooding, saltwater intrusion and deterioration of water quality. Climate change is expected to directly or indirectly influence the severity of all of these stressors. In 2009, the U.S. Committee on Strategic Advice on the U.S. Climate Change Science Program, National Research Council, stated that progress in understanding and predicting climate change has improved more at global, continental, and ocean basin scales than at regional and local scales; and, that discovery science and understanding of the climate system are proceeding well, but use of that knowledge to support decision-making and to manage risks and opportunities of climate change is proceeding slowly. This statement represent the fundamental challenge that water resource managers face as they begin to develop both mitigative and adaptive strategies for projected climate change impacts at regional and local levels. 6.3.1. Sea Level Rise Implications One area of climate change science that has received significant revisions since the 2007 IPCC Report as a result of new research is global predictions for sea level rise (SLR). The IPCC report focused on SLR predictions based primarily on ocean thermal expansion. At the time of publication, the rate of increased ice flow melt from land-based ice (especially glaciers in Greenland and Antarctica) had not been measured sufficiently for inclusion in the models. Similarly, the report left out the thawing of the Arctic permafrost, which many scientists now agree is accelerating, with high probabilities for significant emissions of carbon dioxide and methane. One complicating feature is that most scientists believe that climate, ice sheets and sea level may not respond linearly or gradually to stresses. Once stressed and destabilized, these and other ecological systems may reach a tipping point and undergo rapid change. The IPCC and many other early climate and sea level forecasts assume gradual linear responses and changes (Exhibit 6-9) - not sudden tipping points, switches to new states, rapidly reinforcing feedbacks and rapid rises. These projections assumed a gradual linear response of climate, ice melt, and sea level. [Source: Harold R. Wanless; University of Miami, Keeping our Heads above Water: Surviving the Challenges of Sea Level Rise in Florida, January 13, 2010] Therefore, predictions for the rate and timing of global warming and SLR may have high levels of uncertainty.
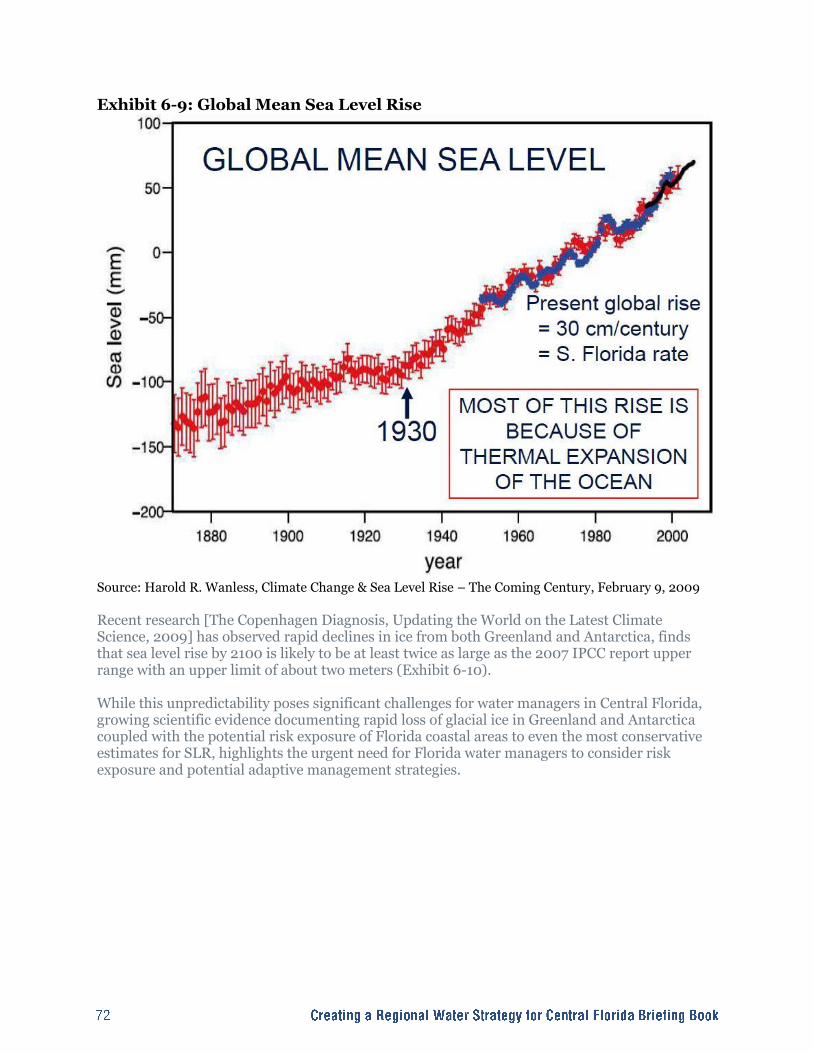
Exhibit 6-9: Global Mean Sea Level Rise
Source: Harold R. Wanless, Climate Change & Sea Level Rise – The Coming Century, February 9, 2009
Recent research [The Copenhagen Diagnosis, Updating the World on the Latest Climate Science, 2009] has observed rapid declines in ice from both Greenland and Antarctica, finds that sea level rise by 2100 is likely to be at least twice as large as the 2007 IPCC report upper range with an upper limit of about two meters (Exhibit 6-10). While this unpredictability poses significant challenges for water managers in Central Florida, growing scientific evidence documenting rapid loss of glacial ice in Greenland and Antarctica coupled with the potential risk exposure of Florida coastal areas to even the most conservative estimates for SLR, highlights the urgent need for Florida water managers to consider risk exposure and potential adaptive management strategies.
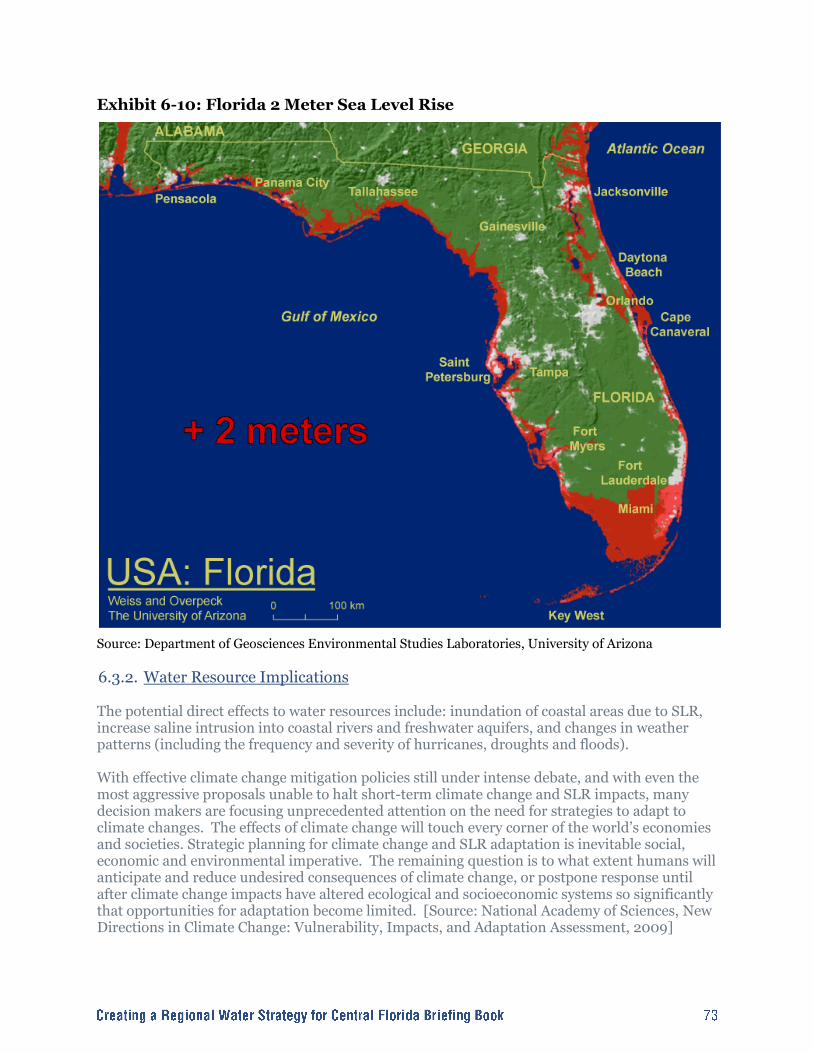
Exhibit 6-10: Florida 2 Meter Sea Level Rise
Source: Department of Geosciences Environmental Studies Laboratories, University of Arizona
6.3.2. Water Resource Implications The potential direct effects to water resources include: inundation of coastal areas due to SLR, increase saline intrusion into coastal rivers and freshwater aquifers, and changes in weather patterns (including the frequency and severity of hurricanes, droughts and floods). With effective climate change mitigation policies still under intense debate, and with even the most aggressive proposals unable to halt short-term climate change and SLR impacts, many decision makers are focusing unprecedented attention on the need for strategies to adapt to climate changes. The effects of climate change will touch every corner of the world‘s economies and societies. Strategic planning for climate change and SLR adaptation is inevitable social, economic and environmental imperative. The remaining question is to what extent humans will anticipate and reduce undesired consequences of climate change, or postpone response until after climate change impacts have altered ecological and socioeconomic systems so significantly that opportunities for adaptation become limited. [Source: National Academy of Sciences, New Directions in Climate Change: Vulnerability, Impacts, and Adaptation Assessment, 2009]
Climate change will impact the hydrological cycle and water availability in complex ways. There are many uncertainties associated with models that predict future changes in regional precipitation patterns. This will complicate predictions for long-term regional changes in stream flows and groundwater recharge.
Higher atmospheric temperatures coupled with decreased precipitation can lead to decreased water supplies and increased water demands.
Changes in the timing, intensity and duration of precipitation can have significant effects on water quality. Increased precipitation and stormwater runoff can lead to increased nutrient and pollutant loads, increased sedimentation and promote harmful algal blooms.
Higher water temperatures can reduce dissolved oxygen levels, increase thermal stress in both plants and animals and favor the growth of unwanted species (High temperatures favor cyanobacteria.) High water temperatures (over 80 F) favor the growth of Naegleria fowleri (the cause of fatal amoebic encephalitis contracted in some of Florida’s muddy lakes, ponds and stormwater retention areas).
Climate change has the potential to alter the frequency and severity of extreme weather events such as heat waves, cold waves, storms, floods and droughts.
There is growing scientific evidence to suggest that climate change and warming of sea surface temperatures may increase the intensity and frequency of tropical cyclones (hurricanes). While this prediction is still receiving much scientific and meteorological debate, Florida and its water resources are highly vulnerable to the seasonal impacts of hurricanes.
Global climate change is likely to influence complicated large-scale regional patterns that influence Florida‘s weather. Phenomenon such as El Niño Southern Oscillation events need to be better understood at both global and regional spatial and temporal scales. El Niño events are characterized by unusually warm sea surface temperatures (SST‘s) in the equatorial Pacific Ocean. La Niña events are characterized by unusually cold SST‘s in the equatorial Pacific Ocean. Both can exert strong influence on Florida‘s weather and precipitation patterns. Longer-term ocean oscillation events, such as the Atlantic multidecadal oscillation (AMO), are also thought to be important drivers of regional weather and water patterns. AMO is an ongoing series of periodic changes in the sea surface temperature of the North Atlantic Ocean. Cool and warm phases may last for decades at a time. AMO has been associated with changes in the frequency of North American droughts, Atlantic hurricanes, and with rainfall increases in peninsular Florida during a warm phase. As an example, AMO-related rainfall variability has immediate practical implications for Florida water management policies. Research has shown that during the positive phase of the AMO (1930-1964), net average annual inflow to Lake Okeechobee was about double that during the ensuing negative phase (1965-1994). [Source: Enfield, David B., A.M. Mestas-Nuñez, and P.J. Trimble. 2001. The Atlantic multidecadal oscillation and its relation to rainfall and river flows in the continental U.S. Geophysical Research Letters. 28(10): 2077-208]
Salt water intrusion into Florida freshwater resources is already occurring in many coastal areas of the state. SLR will increase salt water intrusion, change water quality and over time could transform both surface and groundwater quality into estuarine and marine systems.

SLR and salt water intrusion have the potential to compromise on-site sewage treatment & disposal systems (septic systems) in coastal and low elevation properties vulnerable to flooding and SLR. Large scale septic system failures could lead to serious water quality impacts. There are approximately 2.3 million septic systems in Florida serving 30% of the population. In Brevard County alone, approximately 13,000 septic system approvals occurred between 2001-2009. Many are in flood prone coastal areas. [De Freese presentation ―Climate Change Adaptation: Preparing Local Communities for Climate Change and Sea Level Rise - A Florida Perspective.‖ NASA/USACE climate change symposium at NASA Headquarters Auditorium, Washington DC. April 21, 2009]
SLR impacts to developing nations and island nations in the Bahamas, Caribbean Basin and Mexico represents a potential impact that could influence future immigration and population growth trends in Florida.
In 2007, Elizabeth A. Stanton and Frank Ackerman (Tufts University) published a report, ―Florida and Climate Change: The Costs of Inaction‖. Under a ―business as usual scenario‖ they identified a SLR ―vulnerable zone‖ in Florida that included real estate valued at $130 billion, half of Florida‘s beaches, 99% of its mangroves and significant developed properties with water-related infrastructure that included 2 nuclear reactors, 115 solid waste disposal sites, 140 water treatment facilities, and 341 hazardous material clean-up sites (including 5 Superfund sites).


To meet future water supply needs of a growing population, a number of alternatives are available to Central Florida including conservation, alternative water sources and education. This section explores each alternative as well as a discussion on the cost of alternatives.
7.1. Conservation 7.1.1. Background It is estimated that in Central Florida, 70 gallons of water is used indoors, and the remaining 120 gallons is used for outdoor use, mainly lawn irrigation. Base assumptions for a normal home with 2.3 people:
Indoor use, 161 gallons per day, 4,830 gallons per month, or 58,765 gallons per year
Outdoor use, 276 gallons per day, 8,280 gallons per month, or 100,740 gallons per year
Combined use, 437 gallons per day, 13,100 gallons per month, or 159,505 gallons per year
Through upgrading of indoor fixtures to meet current plumbing standards, a savings of 30% or 21 GPDC can be achieved. This could result in a household savings of 1,449 gallons per month or 17,629 gallons per year just for indoor conservation. Because many homeowners over water their lawns, water savings outdoors can be significantly greater. A properly designed irrigation system can also achieve saving of 30% or more by replacing older irrigation heads with low pressure heads, repairing leaks, adjusting the timer, and making sure irrigation coverage is properly set. How much water does a lawn take? The University of Florida recommends no more that 30 inches of supplemental water per year. This is in addition to the average of 52 inches of water provided by nature in the form of rain. Thirty inches is equivalent to 54 gallons of water per day per 1,000 sq. ft. of irrigated area or 1,620 gallons per month per 1000 sq. ft. Assuming a 10,000 sq. ft. lot with 70% impervious area and 3,000 sq. ft. of irrigated area, a single family home can be expected to use 162 gallons of water per day, 4,860 gallons per month, or 59,130 gallons per year. Unfortunately, overwatering by many homeowners results in the use of two to three times this much water for irrigation. Replacing sod with drought-tolerant plants can reduce outdoor water consumption significantly beyond the 30 % achieved by good design. Once established, drought-tolerant plants should not normally require any supplemental water. Based on this evaluation, an overall savings of 30% for single-family homes is a reasonable goal.
7.1.2. Water Conservation Programs and Information There are many tools available to help the homeowner achieve the over-all goal of a 30% reduction in water use. These include incentives, regulations, price and education. Florida Water Star
Florida Water StarSM is a voluntary certification program for new and existing residential and commercial developments that encourages water efficiency in household appliances, plumbing fixtures, irrigation systems, and landscapes. http://sjr.state.fl.us/floridawaterstar/index.html
Florida-Friendly Landscaping
Florida Statute § 373.185(1)(b) defines Florida-Friendly Landscaping as quality landscapes that conserve water, protect the environment, are adaptable to local conditions and are drought-tolerant. The principles of such landscaping include: planting the right plant in the right place, efficient watering, appropriate fertilization, mulching, attraction of wildlife, responsible management of yard pests, recycling yard waste, reduction of stormwater runoff and waterfront protection. Additional components include practices such as landscape planning and design, soil analysis, the appropriate use of solid waste compost, minimizing the use of irrigation and proper maintenance. Guide to Florida-Friendly Landscaping http://edis.ifas.ufl.edu/pdffiles/EP/EP07900.pdf Florida Yards and Neighborhoods, Florida-Friendly Landscaping http://www.floridayards.org/index.php Florida-Friendly Landscape Guidance Models for Ordinances, Covenants, and Restrictions http://www.dep.state.fl.us/water/nonpoint/docs/nonpoint/ffl-mo-ccr-1-09.pdf
EPA WaterSense Program
WaterSense is an easy-to-identify labeling program to help consumers find water-efficient products and services through the U.S. Environmental Protection Agency (EPA). http://www.epa.gov/watersense/
Rebate Programs Many utilities provide rebate programs to encourage homeowners to adopt water- efficient methods. The Southwest Florida Water Management District offers a Water Conservation Calculator to help determine cost effectiveness of various water conservation methods; http://www.swfwmd.state.fl.us/conservation/wcm/
Other notable programs include:
Conserve FL/Clearinghouse/EZ Guide
Cooperative Funding Programs offered by SJRWMD, SWFWMD, and SFWMD
WaterCHAMP (Water Conservation Hotel And Motel Program)
7.1.3. Common Water Conservation Techniques Some of the most popular methods of water conservation are listed below.
Rain and Soil Moisture Sensors are devices that work with the automatic timer on lawn irrigation systems to turn off the irrigation system when the moisture needs of an irrigated area have been met. Both rain and moisture sensors can significantly reduce the need for supplemental irrigation. Low Flow Toilets, Low Flow Showerheads, can dramatically reduce indoor water use. An older toilet may use 5 to 6 gallons of water per flush compared to a modern toilet that uses 1.28 to 1.6 gallons per flush. New Water-Conserving Appliances such as dishwashers and washing machines use significantly less water than comparable older models. An older washing machine can use 40 gallons of water per load compared to a water-conserving model that use 14 gallons per load. Sod Replacement is a program that encourages homeowners to replace sod with drought-tolerant plants. Because outdoor irrigation accounts for at least half the water used by single-family homes, sod replacement can significantly reduce water use. Each 1,000 square feet of sod replaced can save almost 20,000 gallons of water per year. Rain Barrels and Cisterns work by capturing and storing rain from the roofs of buildings. One inch of rainfall on a 1000 square foot roof will yield approximately 600 gallons. A 2,000 square foot roof will produce 62,400 gallons of water in a normal rainfall year in Central Florida. This would approximately meet the supplemental irrigation needs of 3,000 square feet of irrigated turf. Rain Gardens are another way to utilize rain from a rooftop to supply water to a garden area. With a rain garden, the roof drains are directed toward an excavated garden area planted with plants that can thrive under both wet and dry conditions.
7.1.4. Incentives, Pricing and Cost Structure A conservation rate structure (inverse block rate) has been shown to significantly reduce water consumption when compared to a volumetric rate structure. For detailed information on the various rate structures see the University of Florida‘s publication, Conservation and Drought Water Rates: State-of-the-Art Practices and their Application, April 2009 provides details on the various types of rate structures and their effectiveness. http://waterinstitute.ufl.edu/news/downloads/WI%20Synthesis%20Paper%205-7-09.pdf A study of 7,200 homes in Florida confirms the effectiveness of conservation rates in reducing water consumption. http://www.swfwmd.state.fl.us/documents/reports/water_rate_report.pdf 7.1.5. Policy and Restrictions Water use is regulated in a number of different ways, from regulating the days and hours that irrigation can occur to regulating the types of plants that can be used and the type of irrigation equipment that can be installed. All of these methods have proven to be effective in reducing the amount of water being used for irrigation. These methods can be used alone or in combination.
Watering Days and Hours Each of the Water Management Districts may have different watering restrictions that can vary from year to year and season to season, but each of the programs limits the number of days and hours when irrigation can occur. St. Johns River Water Management District‘s Water Conservation Program http://www.sjrwmd.com/wateringrestrictions/ South Florida Water Management District‘s Water Conservation Program http://www.sfwmd.gov/portal/page/portal/levelthree/water%20conservation Southwest Florida Water Management District‘s Water Conservation Program http://www.swfwmd.state.fl.us/conservation/ If enforced, limiting the days and hours that watering occurs has proven to be an effective way to reduce water use. Homeowners tend to use significantly more water than needed by the landscape. Frequently Asked Questions about Landscape Irrigation for Florida-Friendly Landscaping Ordinances http://edis.ifas.ufl.edu/wq142
Landscape Regulations A Florida-Friendly lawn with reduced turf grass and increased use of native drought- tolerant plants has been found to use 39% less water than a more traditional turf lawn. Here are a number of different models that maybe of use: Florida-Friendly Landscape Guidance Models for Ordinances, Covenants, and Restrictions http://www.dep.state.fl.us/water/nonpoint/docs/nonpoint/ffl-mo-ccr-1-09.pdf Home Irrigation and Landscape Combinations for Water Conservation in Florida http://edis.ifas.ufl.edu/ae287 Model Native Plant Landscape Ordinance Handbook -Florida Native Plant Society http://www.fnps.org/committees/fnps/pdfs/fnpsfnps_landscape_ord_0224071.pdf
Water Conservation Resources St. Johns River Water Management Districts – Water Conservation Program http://floridaswater.com/waterconservation/index.html Southwest Florida Water Management District‘s Water Conservation Program http://www.swfwmd.state.fl.us/conservation/ Conserve Florida Water Clearinghouse http://www.conservefloridawater.org/ University of Florida Electronic Data Information Source (edis) contains a wealth of information on water conservation. http://edis.ifas.ufl.edu/ Specific publications by Michael D. Dukes may be very helpful in the design of water conservation programs. http://edis.ifas.ufl.edu/topic_a63769910
The U.S. Environmental Protection Agency‘s WaterSense Program http://www.epa.gov/watersense/ University of Florida‘s Water Conservation Resource Directory http://waterconservation.ifas.ufl.edu/ Water conservation links provided by the SWFWMD http://www.swfwmd.state.fl.us/conservation/links/ The American Water Works Association, Water Wiser, Water Efficiency Clearinghouse http://www.awwa.org/Resources/Waterwiser.cfm?navItemNumber=1516 FDEP, Recommendations for a Drought Resistant Florida http://www.dep.state.fl.us/Drought/files/drought_smart_report.pdf Coping with Drought in the Landscape http://edis.ifas.ufl.edu/mg026
7.2. Alternative Water Sources
7.2.1. Stormwater Reuse Stormwater reuse is the collection and storage of stormwater runoff, primarily in ponds, for the purpose of utilizing that water at a future time for non-potable needs such as irrigation, fire protection and stormwater storage enhancement. Common examples of stormwater reuse facilities include community detention ponds, wells, lakes and canals. University of Florida‘s Florida Field Guide to Low Impact Development simply states that, ―the philosophy behind the practice is that the lowest quality water should be used for the lowest quality need.‖ 1 The principle concepts of stormwater reuse have been in practice in Florida for several decades. The most common example has been the use of stormwater reuse through local ponds in the irrigation of golf courses. One example of a recent stormwater reuse project in Central Florida is Lake Concord in Casselberry, FL. An online presentation of the design techniques, layout and estimated costs can be found at: http://www.casselberry.org/documents/Presentations/12082008%20Anniversary%20Park%20Lake%20Concord%20Stormwater%20Park%20Presentation.PDF
The SWFWMD is interested in stormwater reuse as a way of increasing the treatment efficiency
of detention systems. Their current design calls for storing the first inch of runoff and draining
the pond over a five-day period. They are considering going to an average residence time of 14
days to improve performance from removal rates of 50 to 70% with a five-day drawdown time.
Reusing stormwater would give them 100% treatment efficiency. Operation and maintenance of stormwater reuse should be relatively low. Irrigation pumps, pipes and drainage structures should be checked and repaired as needed. Exhibit 7-1 is from a Stormwater Reuse Presentation given by Gerald C. Hartman, PE, BCEE, ASA and Marty Wanielista, P.E., PhD. 2 on stormwater reuse costs.
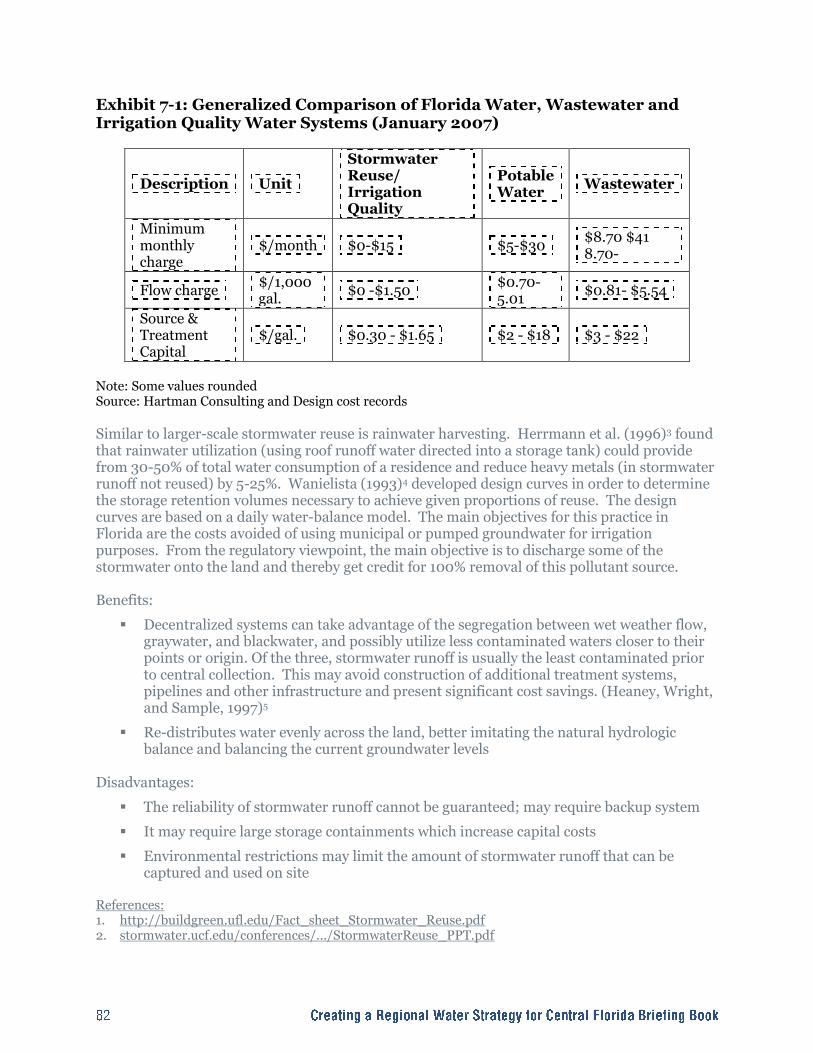
Exhibit 7-1: Generalized Comparison of Florida Water, Wastewater and Irrigation Quality Water Systems (January 2007)
Description
Unit
Stormwater Reuse/ Irrigation Quality
Potable Water
Wastewater
Minimum monthly charge
$/month
$0-$15
$5-$30
$8.70 $41 8.70-
Flow charge
$/1,000 gal.
$0 -$1.50
$0.70-5.01
$0.81- $5.54
Source & Treatment Capital
$/gal.
$0.30 - $1.65
$2 - $18
$3 - $22
Note: Some values rounded Source: Hartman Consulting and Design cost records
Similar to larger-scale stormwater reuse is rainwater harvesting. Herrmann et al. (1996)3 found that rainwater utilization (using roof runoff water directed into a storage tank) could provide from 30-50% of total water consumption of a residence and reduce heavy metals (in stormwater runoff not reused) by 5-25%. Wanielista (1993)4 developed design curves in order to determine the storage retention volumes necessary to achieve given proportions of reuse. The design curves are based on a daily water-balance model. The main objectives for this practice in Florida are the costs avoided of using municipal or pumped groundwater for irrigation purposes. From the regulatory viewpoint, the main objective is to discharge some of the stormwater onto the land and thereby get credit for 100% removal of this pollutant source. Benefits:
Decentralized systems can take advantage of the segregation between wet weather flow, graywater, and blackwater, and possibly utilize less contaminated waters closer to their points or origin. Of the three, stormwater runoff is usually the least contaminated prior to central collection. This may avoid construction of additional treatment systems, pipelines and other infrastructure and present significant cost savings. (Heaney, Wright, and Sample, 1997)5
Re-distributes water evenly across the land, better imitating the natural hydrologic balance and balancing the current groundwater levels
Disadvantages:
The reliability of stormwater runoff cannot be guaranteed; may require backup system
It may require large storage containments which increase capital costs
Environmental restrictions may limit the amount of stormwater runoff that can be captured and used on site
References: 1. http://buildgreen.ufl.edu/Fact_sheet_Stormwater_Reuse.pdf 2. stormwater.ucf.edu/conferences/.../StormwaterReuse_PPT.pdf
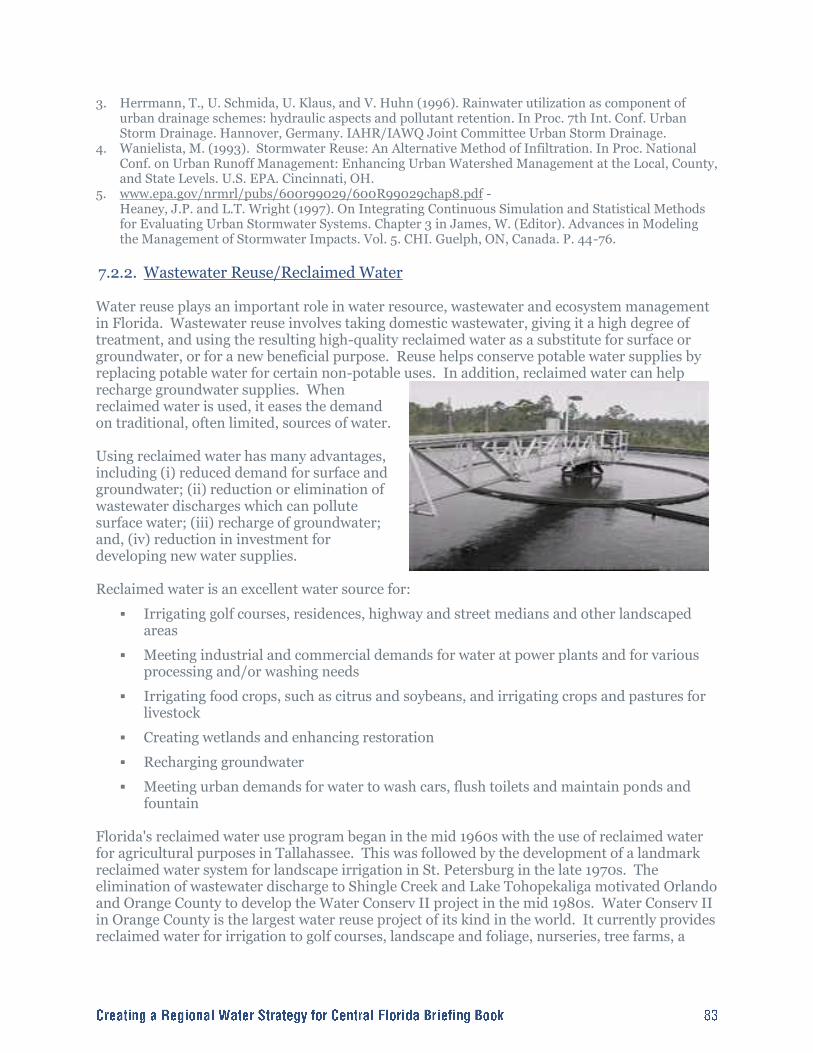
3. Herrmann, T., U. Schmida, U. Klaus, and V. Huhn (1996). Rainwater utilization as component of urban drainage schemes: hydraulic aspects and pollutant retention. In Proc. 7th Int. Conf. Urban Storm Drainage. Hannover, Germany. IAHR/IAWQ Joint Committee Urban Storm Drainage.
4. Wanielista, M. (1993). Stormwater Reuse: An Alternative Method of Infiltration. In Proc. National Conf. on Urban Runoff Management: Enhancing Urban Watershed Management at the Local, County, and State Levels. U.S. EPA. Cincinnati, OH.
5. www.epa.gov/nrmrl/pubs/600r99029/600R99029chap8.pdf - Heaney, J.P. and L.T. Wright (1997). On Integrating Continuous Simulation and Statistical Methods for Evaluating Urban Stormwater Systems. Chapter 3 in James, W. (Editor). Advances in Modeling the Management of Stormwater Impacts. Vol. 5. CHI. Guelph, ON, Canada. P. 44-76.
7.2.2. Wastewater Reuse/Reclaimed Water Water reuse plays an important role in water resource, wastewater and ecosystem management in Florida. Wastewater reuse involves taking domestic wastewater, giving it a high degree of treatment, and using the resulting high-quality reclaimed water as a substitute for surface or groundwater, or for a new beneficial purpose. Reuse helps conserve potable water supplies by replacing potable water for certain non-potable uses. In addition, reclaimed water can help recharge groundwater supplies. When reclaimed water is used, it eases the demand on traditional, often limited, sources of water. Using reclaimed water has many advantages, including (i) reduced demand for surface and groundwater; (ii) reduction or elimination of wastewater discharges which can pollute surface water; (iii) recharge of groundwater; and, (iv) reduction in investment for developing new water supplies. Reclaimed water is an excellent water source for:
Irrigating golf courses, residences, highway and street medians and other landscaped areas
Meeting industrial and commercial demands for water at power plants and for various processing and/or washing needs
Irrigating food crops, such as citrus and soybeans, and irrigating crops and pastures for livestock
Creating wetlands and enhancing restoration
Recharging groundwater
Meeting urban demands for water to wash cars, flush toilets and maintain ponds and fountain
Florida's reclaimed water use program began in the mid 1960s with the use of reclaimed water for agricultural purposes in Tallahassee. This was followed by the development of a landmark reclaimed water system for landscape irrigation in St. Petersburg in the late 1970s. The elimination of wastewater discharge to Shingle Creek and Lake Tohopekaliga motivated Orlando and Orange County to develop the Water Conserv II project in the mid 1980s. Water Conserv II in Orange County is the largest water reuse project of its kind in the world. It currently provides reclaimed water for irrigation to golf courses, landscape and foliage, nurseries, tree farms, a

fernery, six residential neighborhoods, and 3,200 acres of citrus groves. It also provides reclaimed water to 3,725 acres of rapid infiltration basins for recharge of the Floridan aquifer. Faced with increased water quality concerns and seeing the benefits of reclaimed water use, several other utilities, like Altamonte Springs and the Loxahatchee River Environmental Control District, initiated projects to use reclaimed water in the 1980‘s. In 2006, Florida's Water Reuse Program was the first recipient of the U.S. Environmental Protection Agency Water Efficiency Leader Award. In 2007, Florida led the nation in reuse, using about 664 mgd of reclaimed water for a beneficial purpose. A total of 475 large domestic wastewater treatment facilities made reclaimed water available for reuse. These facilities served 432 reuse systems. The major beneficial uses in 2008 were:
Public Access Areas (golf course irrigation, residential irrigation, other public access areas (55%)
Industrial Uses (14%)
Groundwater Recharge (13%)
Agricultural Irrigation (12%)
Other (6%) However, Florida realizes only a fraction of reuse opportunities. In 2007, a total of 76 large domestic wastewater treatment facilities did not provide reuse of any kind. These unused capacities have the potential to expand the availability of reclaimed water in the state. The 2008 Legislature enacted legislation that prohibits ocean discharge of treated wastewater by 2025 except as a back-up to a reuse system. Sixty percent of the water currently being discharged in ocean outfalls will have to be reused for a beneficial purpose, increasing reclaimed water use by at least 180 mgd by 2025. FDEP and the WMDs are committed to promoting efficient and effective water management to help conserve the State‘s natural resources. For instance, water resource caution areas (WRCAs) are areas identified by the WMDs that have critical water supply problems or are projected to have critical water supply problems within the next 20 years. Originally, water reuse was required only within these water resource caution areas, unless such reuse is not economically, environmentally, or technically feasible as determined by a reuse feasibility study. Currently, Chapter 62-40, F.A.C., requires use of reclaimed water statewide. Domestic wastewater facilities located within, discharging within or serving a population within designated water resource caution areas are required to prepare reuse feasibility studies before receiving a domestic wastewater permit. According to the 2007 Reuse Inventory conducted by FDEP, the following statistics apply to reuse flow with regard to domestic wastewater treatment facilities with permitted capacities of 0.1 mgd or above that make reclaimed water available for reuse. Exhibit 7-2 presents total reuse flow per county and the ratio with regard to total flows, and Exhibit 7-3 presents the cost per month per county for the use or reclaimed water, both a flat per connection rate and a usage rate (calculated per 1000 gallons). Utilities recoup costs associated with the reuse system through rate recovery. Reuse costs can be allocated among wastewater customers, water users and reclaimed water users.
Exhibit 7-2: 2008 Total WWTP Flow and Reuse Flow per County
County Total WWTP Flow (mgd)(a)
Reuse Flow (mgd)
Flow Ratio(b)
Brevard 39.14 24.72 0.63
Lake 12.47 12.23 0.98
Orange 90.56 92.91 1.03
Osceola 23.77 25.37 1.07
Polk 29.51 19.73 0.67
Seminole 44.29 35.24 0.80
Volusia 33.44 21.53 0.64
ENTIRE STATE 1,587.6 666.8 0.42
Source: FDEP 2008 Reuse Inventory, May 2010 (a) Total includes wastewater treatment plant (WWTP) flow of facilities over 0.1 million gallons per day (mgd) that do not provide reuse. (b) Flow Ratio = Reuse Flow/Total WWTP Flow, such that flow ratios greater than 1.0 indicate that reuse may include supplemental water supplies, reclaimed water recovered from aquifer storage wells, or reclaimed water that is reused at the treatment plant and then reused again offsite.
Exhibit 7-3: Average Usage Rates per County for Residential and Nonresidential Uses
County Charge Category(a)
Average $ Charge / Month/Connection(b)
Average $ Charge/1000 gal(b)
Brevard NRES (14) 12.48 (4) 0.11 (11) RESD (14) 5.93 (2) 0.03 (12)
Lake NRES (3) 3.33 (2) 0.49 (0) RESD (3) 4.75 (1) 0.54 (1)
Orange NRES (6) 15.72 (4) 1.16 (0) RESD (6) 3.02 (2) 1.21 (0)
Osceola NRES (5) 96.93 (0) 0.88 (0) RESD (6) 3.52 (1) 0.81 (0)
Polk NRES (5) 400.00 (4) 0.14 (1) RESD (3) 0.00 (3) 0.25 (0)
Seminole NRES (6) 4.81 (3) 0.77 (0) RESD (9) 5.25 (2) 0.37 (2)
Volusia NRES (9) 139.18 (5) 0.22 (1) RESD (7) 6.96 (2) 0.28 (3)
ENTIRE STATE - 40.88 0.45
(a) NRES = Nonresidential, RESD = Residential, number in parentheses following the charge category indicates the total number of facilities. (b) Number in parentheses following average monthly charge per connection indicates the number of facilities with no charge.

7.2.3. Desalination Desalination removes dissolved salts in water to make it fit for human consumption as well as for irrigation, industrial use and other purposes.6 Reverse osmosis is the most commonly used technology in Florida for treating saline water. This process uses high pressure to force saltwater through long, tube-like membranes.7 Several layers of material located in the membranes remove salt as the water passes through, leaving behind only the salty concentrate. Exhibit 7-4: Desalination by Reverse Osmosis
Source: http://www.swfwmd.state.fl.us/publications/files/waterweb-conservation.pdf
Electrodialysis is another desalination method. Electrodialysis (ED) uses an electrical current to separate out salt and impurities through the use of a semi-permeable, ion-selective membrane.8 ED is typically used to desalt brackish water at the municipal scale but has been used for seawater. Thermal distillation is the oldest known method of desalinating seawater. In the thermal process, seawater is heated to generate water vapor. The vapor is condensed to liquid form containing very little of the original salt. Sources
Sources of saline water include brackish groundwater from the Floridan aquifer system and the Biscayne aquifer system, and seawater from the Atlantic Ocean and Gulf of
6 http://www.sfwmd.gov/portal/page/portal/xweb%20-%20release%203%20water%20supply/desalination 7 http://www.swfwmd.state.fl.us/education/conservation/grades_6-12.pdf 8 http://coquinacoastdesal.org/desalting_process.php
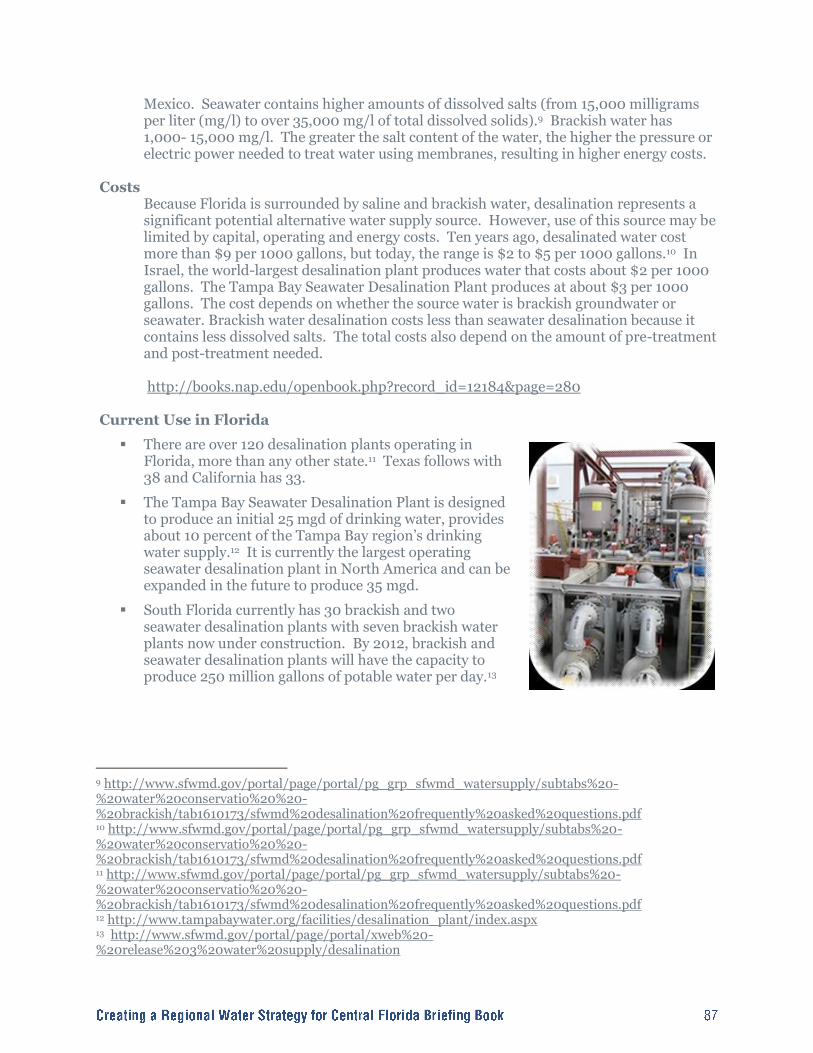
Mexico. Seawater contains higher amounts of dissolved salts (from 15,000 milligrams per liter (mg/l) to over 35,000 mg/l of total dissolved solids).9 Brackish water has 1,000- 15,000 mg/l. The greater the salt content of the water, the higher the pressure or electric power needed to treat water using membranes, resulting in higher energy costs.
Costs Because Florida is surrounded by saline and brackish water, desalination represents a significant potential alternative water supply source. However, use of this source may be limited by capital, operating and energy costs. Ten years ago, desalinated water cost more than $9 per 1000 gallons, but today, the range is $2 to $5 per 1000 gallons.10 In Israel, the world-largest desalination plant produces water that costs about $2 per 1000 gallons. The Tampa Bay Seawater Desalination Plant produces at about $3 per 1000 gallons. The cost depends on whether the source water is brackish groundwater or seawater. Brackish water desalination costs less than seawater desalination because it contains less dissolved salts. The total costs also depend on the amount of pre-treatment and post-treatment needed. http://books.nap.edu/openbook.php?record_id=12184&page=280
Current Use in Florida
There are over 120 desalination plants operating in Florida, more than any other state.11 Texas follows with 38 and California has 33.
The Tampa Bay Seawater Desalination Plant is designed to produce an initial 25 mgd of drinking water, provides about 10 percent of the Tampa Bay region‘s drinking water supply.12 It is currently the largest operating seawater desalination plant in North America and can be expanded in the future to produce 35 mgd.
South Florida currently has 30 brackish and two seawater desalination plants with seven brackish water plants now under construction. By 2012, brackish and seawater desalination plants will have the capacity to produce 250 million gallons of potable water per day.13
9 http://www.sfwmd.gov/portal/page/portal/pg_grp_sfwmd_watersupply/subtabs%20-%20water%20conservatio%20%20-%20brackish/tab1610173/sfwmd%20desalination%20frequently%20asked%20questions.pdf 10 http://www.sfwmd.gov/portal/page/portal/pg_grp_sfwmd_watersupply/subtabs%20-%20water%20conservatio%20%20-%20brackish/tab1610173/sfwmd%20desalination%20frequently%20asked%20questions.pdf 11 http://www.sfwmd.gov/portal/page/portal/pg_grp_sfwmd_watersupply/subtabs%20-%20water%20conservatio%20%20-%20brackish/tab1610173/sfwmd%20desalination%20frequently%20asked%20questions.pdf 12 http://www.tampabaywater.org/facilities/desalination_plant/index.aspx 13 http://www.sfwmd.gov/portal/page/portal/xweb%20-%20release%203%20water%20supply/desalination

Planned Use in Florida
Coquina Coast Seawater Desalination Project. To be located in Volusia, St Johns, or Flagler County. 25 mgd, expandable to 50 mgd.14
North-Central Osceola County Brackish Wellfield and Treatment Facility. 15.0 mgd capacity.15
South Central Osceola County Wellfield (brackish). 30.0 mgd capacity 7.2.4. Surface Water Innovative ways to capture rainwater are being put to use in places like Tampa Bay Water‘s 15 billion gallon Bill Young Reservoir near Brandon (at right). During times of high flow on the Alafia, Hillsborough and other rivers, some river water is diverted to the reservoir for use in dry times. St. Johns River Water Management District
The SJRWMD has identified the following potential surface water projects:
St. Johns River near State Road 50
St. Johns River near Deland
St. Johns River/Taylor Creek Reservoir Water Supply
Sanford ASR Well for Surface Potable Water Storage
Sanford Surface Water Treatment Plan on Lake Monroe
St. Johns River near State Road 46
St. Johns River near Yankee Lake
Taylor Creek Project Description: Taylor Creek Reservoir located in Orange and Osceola counties near the St. Johns River and State Road 520 is an example of surface water storage use. The reservoir was designed to provide flood control and water supply in the upper St. Johns River drainage basin. The reservoir receives drainage inflow from about 60 square miles of watershed. Water from the reservoir then flows into Taylor Creek, which empties into the St. Johns River about 4.3 miles downstream. The city of Cocoa began using the reservoir for water supply in 1999, withdrawing approximately 10 million gallons per day (mgd) from the reservoir to supplement its groundwater sources. Water Supply Opportunity Expanding the city of Cocoa‘s existing water supply system was identified in 2004 as an option for helping to meet future water supply needs in east Central Florida. Many times during the year, additional storage space is available in the reservoir. The opportunity exists to capitalize on this available storage space by holding water at a higher level in the reservoir and diverting water from the St. Johns River into the reservoir. These
14 http://www.sjrwmd.com/coquinacoast/index.html; http://coquinacoastdesal.org/project_details.php 15 Appendix B – Alternative Water Supply Development Projects. Central Florida Coordination Area Planning Work Group Final Report. January 2008
measures could increase the amount of water available to be withdrawn for water supply by 40 mgd or more. Water would only be diverted from the St. Johns River during periods of moderate to high flow when enough water is present to ensure the water quality is high and to maintain downstream minimum flows and levels. Upper St. Johns River Basin Project: The SJRWMD is also investigating ways to optimize the Upper St. Johns River Basin Project — a project to restore and enhance more than 150,000 acres of marshes in Indian River and Brevard Counties — in such a way that will maintain flood control and environmental restoration goals and will maximize the amount of water available from the St. Johns River for the Taylor Creek project. Project Participants Six water suppliers and two water management districts have signed a Memorandum of Agreement to work together to plan and prepare a preliminary design for this alternative water supply project. Project participants are the cities of Cocoa and Titusville, Orange County, Orlando Utilities Commission, Tohopekaliga Water Authority, East Central Florida Services Inc., and the St. Johns River and South Florida Water Management Districts. The city of Cocoa is managing the first phase of the project. While nine other local governments (Brevard and Lake Counties, the cities of Clermont, Groveland, Mascotte, Melbourne, Minneola and Orlando and the Reedy Creek Improvement District) expressed early interest, safe reliable yield limits make it unlikely that they will participate in design, construction and ownership/operation of the project. Project Description As currently envisioned, the project will include the design and construction of a complete water supply system, including diversion facilities, such as a pumping station and pipeline, so that water withdrawn from the St. Johns River can be transported to the reservoir and/or directly to the treatment facility. Only freshwater will be diverted from the river, therefore, only conventional surface water treatment facilities will be required. Treatment will meet or exceed all primary and secondary drinking water standards. In addition to river water diversion and surface water treatment facilities, treated water storage, such as aquifer storage and recovery (ASR), may provide storage for system reliability and seasonal peaking capacity. New and upgraded transmission systems will also be needed. [Source: SJRWMD publications]
South Florida Water Management District
The SFWMD has identified the following potential surface water projects in the Kissimmee Basin Water Supply Plan: Excerpts from Appendix I (SFWMD Kissimmee Basin Water Supply Plan): A Preliminary Evaluation of the Available Surface Water in East Lake Tohopekaliga and Lake Tohopekaliga:

Executive Summary An analysis performed as part of the 2000 Kissimmee Basin Water Supply Plan (2000 KB Plan) identified possible risks that may result from future groundwater withdrawals in Central Florida. The 2000 KB Plan recommended developing alternative water sources that would reduce future dependence on the Floridan aquifer in areas contributing to the projected resource harm. Surface water was identified as one of the possible alternative sources. Recommendation 3.1 of the 2000 KB Plan suggested performing a water availability study to evaluate the surface water systems in the Upper Kissimmee Basin. The District conducted studies of East Lake Tohopekaliga (East Lake Toho), Lake Tohopekaliga (Lake Toho) and major tributaries including Boggy and Shingle Creeks to evaluate surface water availability in the Upper Kissimmee Basin. This technical memorandum summarizes the purpose, analysis and results of the Lake Toho and East Lake Toho study and should be reviewed with the companion report, A Preliminary Evaluation of Available Surface Water in Boggy and Shingle Creeks [Cai 2005]. The purpose of this evaluation is to identify the potential availability of water from the upper basin surface water system, to identify environmental considerations to address in withdrawing water and to characterize the technical issues associated with such a withdrawal. In conducting this evaluation, it was assumed that water above current flood control regulation schedules for Lake Tohopekaliga and East Lake Tohopekaliga is available for water supply uses without harm to in-lake resources. This study reviews a test case of withdrawing a maximum of 50 mgd from Lake Toho and East Lake Toho (separately) and then evaluates the potential effects on lake levels and downstream releases. In addition, a 100 mgd regulation schedule controlled scenario and a 50 mgd historical stage controlled scenario were simulated to compare the affects of increasing diversions and altering the withdrawal control method on lake levels and downstream discharges. The withdrawal scenarios were simulated using two water balance models developed for the District. These models include the Upper Kissimmee Chain of Lakes Routing Model (UKISS Model) originally developed for the Headwater Revitalization Project and Lake Istokpoga Operation System Model (LIOS Model), a tool initially developed to review operational system changes on Lake Istokpoga. The later of these two was modified for use in this evaluation. Results of the modeling were evaluated based on in-lake changes and changes in downstream flow south of the S-65 Structure. Results of this evaluation suggest that a reliability of 65 percent or less can be achieved, while withdrawing water from the lakes under the maximum diversion of 50 mgd scenario. The total diverted amount of water can vary greatly from year to year and could include extended periods of restricted withdrawals lasting several weeks. This withdrawal pattern is also expected to impact flow patterns below the S-65 Structure by increasing the number of no-flow events by 25 percent and the maximum duration event by 7 percent. Historic, staged based withdrawal scenarios showed an improvement in the withdrawal reliability curve over regulation-controlled scenarios, but still caused an increase of 16 percent in the number of no-flow days in downstream releases. Increasing the withdrawal rates to 100 mgd caused only slight changes in the reliability curve and scenario. This study did not try to find the optimum withdrawal scenario to maximize withdrawals, but characterized the magnitude of potential water supply availability from
this surface water system. Future evaluations of water availability for the Kissimmee Chain of Lakes system should rely on modeling tools that allow for the simultaneous simulation of lake levels and system flow discharges. This will provide a more accurate solution, while allowing flexibility in solution development. Results of the modeling effort suggest that storage will need to be addressed in any diversion system proposed for the lakes. Storage options include reservoirs, underground storage (aquifer storage and recovery) and storage within the Chain of Lakes themselves by altering the regulation schedules. Under a separate analysis, the WMD evaluated the reservoir storage needed to improve system reliability to over 90 percent. This evaluation estimates that a reservoir storage requirement of 9,000 acre-feet and a reduction of withdrawals to 25 mgd would produce a 95 percent reliable system. A Preliminary Evaluation of Available Surface Water in Boggy and Shingle Creeks: Executive Summary Analyses performed as part of the 2000 Kissimmee Basin Water Supply Plan (2000 KB Plan) identified possible risks that may result from future groundwater withdrawals in Central Florida. The 2000 KB Plan recommended developing alternative water sources that would reduce future dependence on the Floridan aquifer in areas of greatest projected drawdown. Surface water, reclaimed water, storm water and brackish groundwater were identified as possible alternative sources. Recommendation 3.1 of the KB Plan suggested performing research to evaluate the surface water systems in the Upper Kissimmee Basin. The South Florida Water Management District (SFWMD or District) has conducted studies of East Lake Tohopekaliga (East Lake Toho), Lake Tohopekaliga (Lake Toho) and the major tributaries including Boggy and Shingle Creeks, to evaluate surface water availability within the Upper Kissimmee Basin. This technical memorandum summarizes the purpose, analysis and results of the Boggy and Shingle Creeks study and should be reviewed with the companion report, A Preliminary Evaluation of Available Surface Water in Lake Tohopekaliga and East Lake Tohopekaliga [Cai 2005]. Much of the storm water generated in southern Orange County and northern Osceola County drains towards one of three basins: Boggy Creek, Shingle Creek and Reedy Creek basins. This study represents a planning-level evaluation of the surface water resources from Boggy Creek and Shingle Creek basins to identify potential water supply availability. This investigation does not include an evaluation of the Reedy Creek Basin, as the environmental information in this basin was not available at the time of the study. This study also identifies environmental concerns to address in developing these two surface water resources and characterizes the technical issues associated with potential withdrawal. The study does not try to identify withdrawal scenarios to maximize the quantity of water available from the system. Instead, the study evaluates system availability under historic flow conditions and the impacts these withdrawals may have on matters, such as storage, supply dependability and ecosystem restoration. This study involved the collection of climatic and hydrologic data, identification of environmental issues, field reconnaissance of local wetland systems, tool development and identification of engineering issues needed to improve withdrawals. To conduct this

evaluation, the SFWMD made assumptions about the manner in which withdrawals might occur and the way environmental issues might be addressed. Evaluating water availability in these creeks was done using statistical methods and a preexisting model, originally developed to evaluate management alternatives for the Kissimmee Chain of Lakes as part of the Kissimmee River Restoration. These tools were used to simulate 32 years of historic climatic and operational conditions. Two separate calculations evaluated environmental impacts, one for in-basin concerns and the other addressing downstream lake levels and restoration efforts. The results of this evaluation, while preliminary, suggest that significant volumes of water might be withdrawn from Boggy and Shingle Creeks, while causing minor changes to the environmental health. This suggests the need for further investigation of these surface water resources. Available surface water for withdrawal from Boggy and Shingle creeks is estimated at 2 and 6 mgd respectively. The evaluation also demonstrated however, that the withdrawal reliability was in question. The evaluation showed that over the 32-year demonstration period, the withdrawals was at best 85 percent during the wet season and was reduced to 50 percent or less during the dry season. Restoring hydrologic conditions in these wetlands may lead to improved water availability in the creeks during the wet season. Water availability in Boggy and Shingle Creeks during the dry season is limited by ecosystem health concerns in the downstream environment. Incorporating elements of storage is expected to improve system reliability. Evaluating alternative withdrawal options for the Kissimmee Chain of Lakes withdrawals may improve dry season reliability. The results of this evaluation should be considered in combination with the sister study, A Preliminary Evaluation of Surface Water Availability in East Lake Tohopekaliga and Lake Tohopekaliga [Cai 2005]. Withdrawals that might occur from these lakes may have an impact on the availability of supplies within Boggy and Shingle Creeks. The concerns identified in this study are not the only limiting resource matters to consider in making a final determination of water availability. Any system devised for withdrawing water from these surface water sources will need to review environmental, economic, navigational and water quality concerns within and downstream of the basin. The water for Boggy and Shingle Creeks, the Kissimmee Chain of Lakes, the Kissimmee River and their connection with Lake Okeechobee is a complex hydrologic system. Its management is a balance of many objectives. The SFWMD is developing a long-term management plan for the Kissimmee Chain of Lakes and its tributaries to arrive at a strategy to address these varied concerns. Recommended is a full evaluation of the surface water supply potential for the Upper Kissimmee Basin in union with efforts of the Kissimmee Chain of Lakes Long-Term management Plan [SFWMD 2004], currently under development.
Southwest Florida Water Management District SWFWMD has identified the following potential surface water projects located in Polk County in their Water Supply Plan (see pages 172-178):
Kissimmee River – Average Annual Yield – 35 mgd
IMC Clay Settling Ponds – Average Annual Yield – 3 mgd
Peace Creek Canal – Average Annual Yield – 8.5 mgd
Stormwater Industry – Average Annual Yield – 6.8 mgd
Upper Peace River – Average Annual Yield – 10 mgd
Upper Peace River Industry – Average Annual Yield – 2.15 mgd
Upper Saddle Creek – Average Annual Yield – 2.9 mgd 7.2.5. Aquifer Storage and Recovery Aquifer storage and recovery (ASR) is a mechanism for storing water underground through an injection well to be withdrawn in the future, through the same well, for beneficial purposes. Typically, water is stored during times of excess supply for use when supplies are limited. ASR wells are capable of storing treated drinking water as well as treated or raw surface or groundwater. However, whether treated or not, water injected into ASR wells must meet Florida's drinking water quality standards. The level of treatment required after storage depends on the use of the water, whether for public consumption, surface water augmentation, wetlands enhancement, irrigation, saltwater intrusion barrier, etc. Because ASR provides for the storage of water that would otherwise be lost to tide or evaporation, it represents a potential water supply management strategy for Florida‘s future.16 ASR wells are Class 5 injection wells regulated by the Underground Injection Control Program of FDEP. Twenty-six ASR facilities are in operation in Florida and more than 15 sites are under development. Some of the sites include reclaimed water ASR facilities, which are also cost-effective solutions to local water shortages. Projects involving ASR with other than treated drinking water can be very controversial and have a ways to go to achieve public acceptance. The FGS is working with the FDEP Underground Injection Control Program, the University of South Florida, SFWMD, SWFWMD and consulting firms to characterize water-rock geochemistry during ASR at the bench scale and in the field to resolve issues with arsenic release into the groundwater and subsequent exceedances of the drinking water standards.17
16 http://www.dep.state.fl.us/water/uic/ 17 http://www.dep.state.fl.us/geology/programs/hydrogeology/aquifer_storage.htm

Exhibit 7-5: Aquifer Storage and Recovery Illustration
7.2.6. Non-traditional Groundwater Deep wells are typically used for injection of non-hazardous fluids such as brine waste from the desalination process or secondary-treated effluent from domestic wastewater treatment plants. Groundwater recovered from deep wells is typically high in total dissolved solids due to natural geologic processes. Therefore, it is not generally acceptable for consumption or irrigation. A significant cost is associated with treating water withdrawn from deep wells to acceptable standards.
7.3. Educational Programs Educational efforts have been going on since the 1970‘s starting with the creation of the EPA and the drinking water regulations. Typically, educational programs have been started and run by local utilities or governments. With increasing technological advances, there have been more alternatives to aid in the conservation of fresh drinking water. In addition, the methods in which water conservation educational programs have been presented to the community have multiplied. Throughout Florida, local utilities, governments and advocacy groups have utilized both traditional and non-traditional ways to promote their goals. In addition, the EPA and each of the WMDs have their own resources to assist in the effort. The two main strategies for curbing water demand have been through educating the public on the effects of unsustainable water demand on the local environment and the cost savings of reducing water demand. The first strategy is usually geared more towards children and
environmentally sensitive adults, while the second strategy is focused on grabbing the attention of the rest of the general public. An example of the first strategy can be seen in this website hosted by the SJRWMD, http://www.sjrwmd.com/education/index.html. The second strategy can be seen through this website hosted by the SWFWMD, http://www.swfwmd.state.fl.us/conservation/waterwork/. A report of case studies published by the EPA on the success of water conservation programs in reducing water demand highlights the City of Tampa‘s restrictions, incentives, and educational programs as being a success. (http://www.epa.gov/watersense/docs/utilityconservation_508.pdf) Tampa‘s education website (http://www.tampagov.net/dept_Water/information_resources/saving_water/) provides detailed cost saving information, such as savings calculators and online surveys, to inform the public of their impact on saving water. In addition, links to other conservation programs and informative websites have been listed to enhance the quantity and quality of the information being provided. Besides the local utilities and governments, the general public is exposed to water conservation education and techniques through area attractions, such as the Florida Aquarium in Tampa. The Florida Aquarium uses design techniques and signage within their parking lot and main entrance to visually illustrate how water can be conserved as well as offering fun facts and helpful tips. http://www.sustainablesites.org/large/20081125143315.jpg Overall, there are an abundance of sources promoting water conservation programs throughout Florida. While the strategy in educating the public may differ from program to program, the main objective has remained the same. For a sample of educational websites available, please see the references below: http://www.fwea.org/dynamics.asp?id=79 (Florida Water Environment Association – multiple links) http://www.sfwmd.gov/portal/page/portal/levelthree/water%20conservation (SFWMD) http://www.epa.gov/ow/kids/waterforkids.html (EPA) http://www.melbourneflorida.org/watercon/consv.htm (City of Melbourne, FL) http://www.titusville.com/Page.asp?NavID=144 (City of Titusville Awards) http://www.treeo.ufl.edu/WCT/ (UF TEEO Training) - 8 courses for water conservation practitioners The Great Water Odyssey – a teacher education program (SFWMD website)
7.4. Estimated Cost of Water Supply Alternatives A brief analysis of the cost for finished water per thousand gallons for various types of water supply was prepared by the SJRWMD. Water supply unit production costs for intake and treatment only (no transmission) in dollars per thousand gallons are as follows:
Fresh Surface Water or Groundwater - $0.60 - $2.50 (lower range for shallow wells with disinfection only, higher for surface water)
Brackish Water (surface water or groundwater) - $2.00 - $4.00 (higher range for surface water)
Seawater - $3.50 - $4.50 (the energy alone is $1.20 - $1.45 per kgal at $0.08/kWh)
Tampa Bay Water Desalination Facility - $3.38

Exhibit 7-5 below provides a detailed analysis for specific facilities. Additional information is available in the 2005 District Water Supply Plan Addendum 4. [http://www.floridaswater.com/technicalreports/pdfs/TP/SJ2006-2Addendum4.pdf]

Exhibit 7-5: Quantities and Costs of Alternative Water Supply


“In an age when man has forgotten his origins and is blind even to his most essential needs for survival, water along with other resources has
become the victim of his indifference.” – Rachel Carson