Bringing Internet Video to Prime Time Aditya Ganjam Vice President of Engineering Conviva.
40
Bringing Internet Video to Prime Time Aditya Ganjam Vice President of Engineering Conviva
-
Upload
erica-york -
Category
Documents
-
view
216 -
download
0
Transcript of Bringing Internet Video to Prime Time Aditya Ganjam Vice President of Engineering Conviva.

Bringing Internet Video to Prime TimeAditya GanjamVice President of EngineeringConviva
Background
Aditya Ganjam – Vice President of Engineering at Conviva
Conviva Startup founded by Hui Zhang (Prof. at CMU) and Ion Stoica in 2006Conviva optimizes video quality for premium content properties such as HBO, ESPN, ABC, Disney, and Turner through network wide real-time visibility and real-time actions. Conviva's technology has powered some of the world's largest on-line events such as Olympics, FIFA World Cup, NCAA College Basketball March Madness, Major League Baseball, and Academy Awards.

2005: Beginning of the Internet Video Era
Launch of YouTube100M streams first year
Premium Sports Webcast on Line
Live8 concert online
First popular mobile video device

2006 – 2011: Internet Video Going Prime Time
2006 2007 2008 2009 2010 2011

2011 Internet Traffic Distribution
Source: Akamai
66% Internet Traffic is Video
IPTV VODInternet VideoP2P Video CallingWeb, email, dataFile transferOnline gamingVoIPBusiness InternetBusiness Intranet
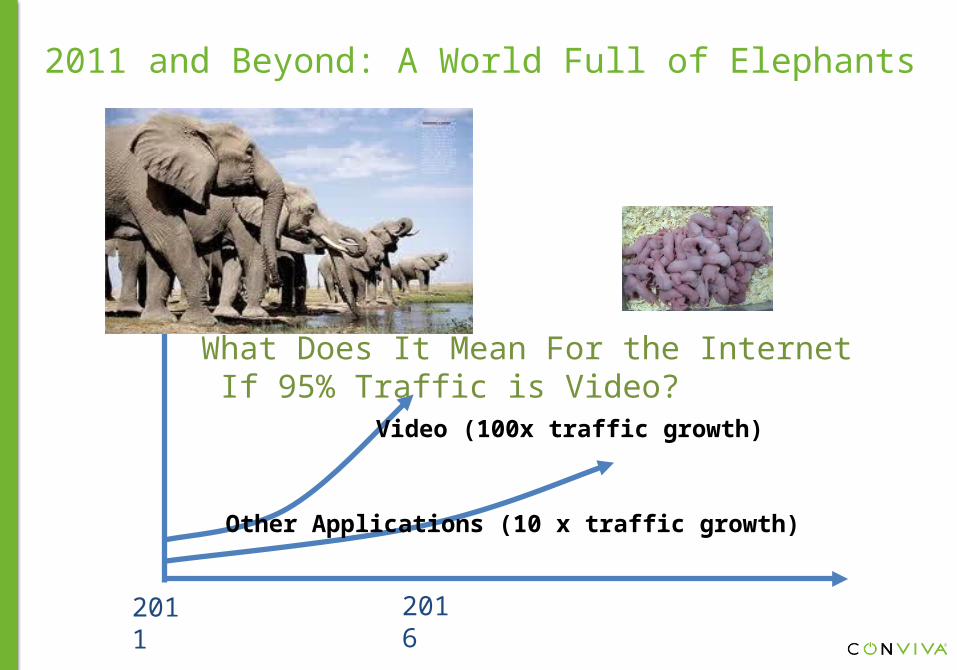
2011 and Beyond: A World Full of Elephants
Video (100x traffic growth)
Other Applications (10 x traffic growth)
2011
What Does It Mean For the Internet If 95% Traffic is Video?
2016

Macro Changes in Internet Video Technology and Business
Technology enablers in placeBroadband penetration Standard software & hardware platforms
Real business model emergingPremium content (ESPN, HBO)
Advertising & subscription (mlb.com, netflix, Hulu)
Online audiences rival broadcast for major eventsOlympics, Inauguration, Michael Jackson, World Cup
Convergence of TV, Internet, MobileInternet connected TVs (Xbox, Playstation, AppleTV, Roku, Sony, Samsung)
Internet connected smart mobile devices (iPad, iPhone, Android)
“TV Everywhere” over the top (HBO, ESPN, Turner, Comcast)
This Talk
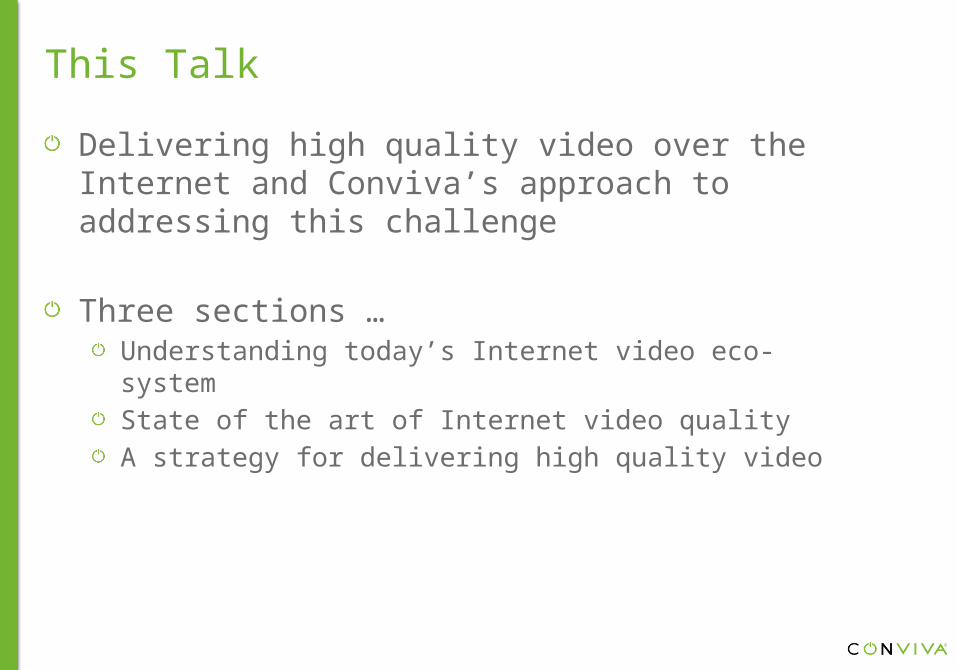
Delivering high quality video over the Internet and Conviva’s approach to addressing this challenge
Three sections …Understanding today’s Internet video eco-systemState of the art of Internet video qualityA strategy for delivering high quality video

Understanding Today’s Internet Video Eco-system

Internet Video Ecosystem : Video Data-plane
Video Source
Encoders & Video Servers
CMS and Hosting Content Delivery
Networks (CDN)
ISP & Home Net
Screen
Video Player
Key components: Video Player & CDN

Content Delivery Networks
Video Player
Content Origin
- Major CDNs are Akamai, Limelight, and Level3- Many ISPs are also building their own CDNs
Edge Servers
How a CDN works …- A CDN is a large distributed content cache acting as an overlay multicast network- Data flows from the content origin through mid-tier servers to edge servers - Content is cached along the way to achieve scale- Many CDNs use DNS to abstract away the complexity of server selection
DNS

Video Uses CDNs A Little Differently
Screen
Video Player
500Kbps
800Kbps
1Mbps
1.5Mbps
2Mbps
3Mbps
Live streamingMulti-bitrate streamingMulti-CDN streaming

Player & Device Eco-System
PC Mobile Game Consoles Set-top Boxes Connected TVs
Significant adoption, especially Flash
Rapid growth in market share
Rapid growth and significant market share
Moderate growth Moderate growth, but will pick up quickly

Sophistication of the Video Player3rd Party Ad Networks
CDN Verification
23
CDN
45
6 7
8
1
Targeting – ie.
Ad CDN
Video CDN
Tokenization / License
server
CMS
11
12
9
10
13
14
Ad Proxy Video Player

What is the quality of Internet video today ?
What is high video quality?Prevent video startup failuresStart the video quicklyPlay the video smoothly and without interruptionsPlay the video at the highest bit rate possible
What is the best way to measure Internet video quality?Claim: Collecting statistics from the video player is the best way to measure video quality
Reason 1: The video player interacts with multiple services owned by multiple companies and is the only single point that has state across all interactionsReason 2: With multi-bit rate and multi-CDN technologies, a single server or CDN does not have the complete quality information for a client
.

Video Player Monitoring : Player Model
JoinTime (JT)BufferingRatio(BR)RateOfBuffering(RB)
AvgBitrate(AB)
RenderingQuality(RQ)

Video Player Monitoring : Data Collection
Automatic Monitoring
• Automatic and consistent monitoring of default streaming modules– Flash: NetStream, VideoElement– Silverlight: MediaElement, SmoothStreamingMediaElement– iOS: MPMoviePlayerController
Streaming Module
UI Controller
Content Manager
Messaging & Serialization
Player Insight
Tobackend
HTTPS
Play
er A
pplic
ation

Video Player Monitoring : Cross-platform Challenges
ActionScript
JavaScript
Objective C
C++
NetStream, …
<video/>, <audio/>
MPMoviePlayerController
SmoothStreaming, …
Flash
HTML5
iOS
Silverlight
Platform Independent Platform Specific
• Consistency in metric computation across languages and platforms• Benefit from stronger type checking from C#• Readable output: preserve comments, white space, formatting• Provides control for language-specific fragments• Compiles real code and unit tests• Uniform tracing and debugging
Comm. Timer StorageC#
Comm. Timer Storage
Comm. Timer Storage
Comm. Timer Storage
Language Translator

Video Player Monitoring : Data Model

State of The Art of Internet Video Quality

We’ve seen patterns across many sites … and billions of streams

Example Video Site Quality Summary
31.68% of views had quality issues
32.2% of viewers had recurring quality issues
Viewers with good quality watched 1.5X more video than viewers with poor quality
Good video quality for all viewers can add 10.9% more minutes of viewed video
Good video quality can add $120K more revenue per month*
68.3
25.3
5.70.68
Total Views
video did not start
video buffered
video had low resolution
video had good quality
67.8
32.2
0 20 40 60 80 100 120
100.9
62.2
Minutes per Viewer
Poor Quality Viewers Good Quality Viewers
* Assumes $30 CPM ad every 8 minutes
Total Views = 66,44,79,19Total Viewers = 3,291,204Total Minutes Viewed = 290,260,395

Example Video Site Quality Summary
31.68% of views had quality issues
32.2% of viewers had recurring quality issues
Viewers with good quality watched 1.5X more video than viewers with poor quality
Good video quality for all viewers can add 10.9% more minutes of viewed video
Good video quality can add $120K more revenue per month*
68.3
25.3
5.70.68
Total Views
video did not start
video buffered
video had low resolution
video had good quality
0 20 40 60 80 100 120
100.9
62.2
Minutes per Viewer
Poor Quality Viewers Good Quality Viewers
* Assumes $30 CPM ad every 8 minutes
Total Views = 66,44,79,19Total Viewers = 3,291,204Total Minutes Viewed = 290,260,395
1 2 3 4 5 6 7 8 90
10
20
30
40
50
Poor experience on 9 different sites

Opportunity of Going Higher Speed
<100 100-300 300-500 500-700 700-1000 1000-1600 1600-2200 2200-3000 >3000
Actual Bit Rate Consumed
Available Bandwidth
Untapped Brand Enhancement and Viewer Experience
Actual Bit Rate Consumed
Available Bandwidth
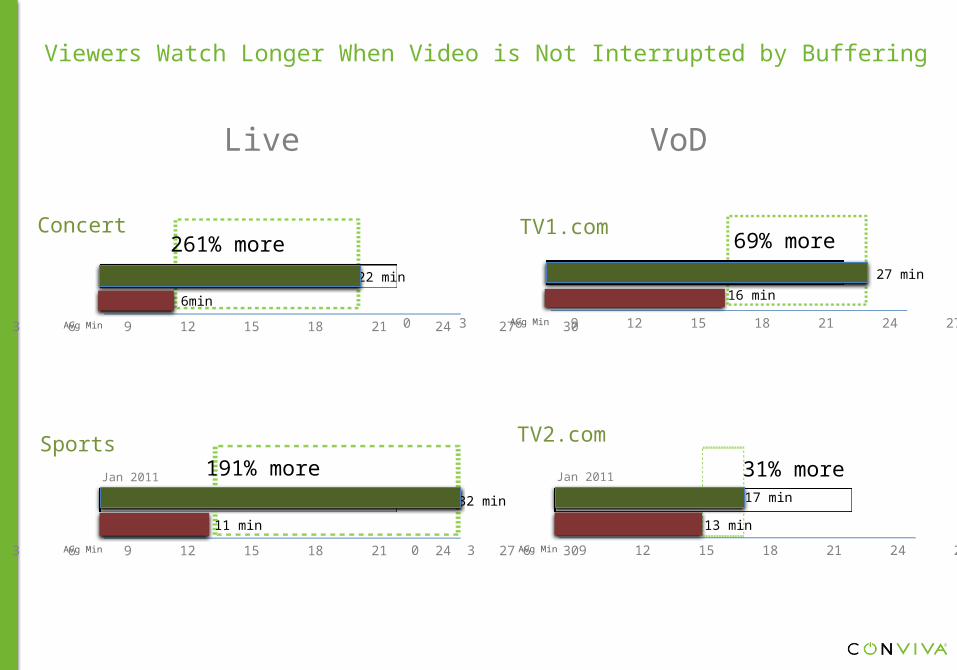
Viewers Watch Longer When Video is Not Interrupted by Buffering
Live VoD
Good Views
Impacted
Avg Min
6min
22 min
261% more
0 3 6 9 12 15 18 21 24 27 30
Good Views
Impacted
Avg Min
11 min
32 min
191% more
0 3 6 9 12 15 18 21 24 27 30
Jan 2011
Concert
Sports
TV1.com
TV2.com
Good Views
Impacted
Avg Min
16 min
27 min
69% more
0 3 6 9 12 15 18 21 24 27 30
Good Views
Impacted
Avg Min
13 min
17 min
31% more
0 3 6 9 12 15 18 21 24 27 30
Jan 2011

Viewers Return More When Video Is Not Interrupted by Buffering
Even 1% increase in buffering leads to more than 60% loss in audience
1% difference in buffering between two ISPs
68% monthly loss in uniques for ISPwith poor performance
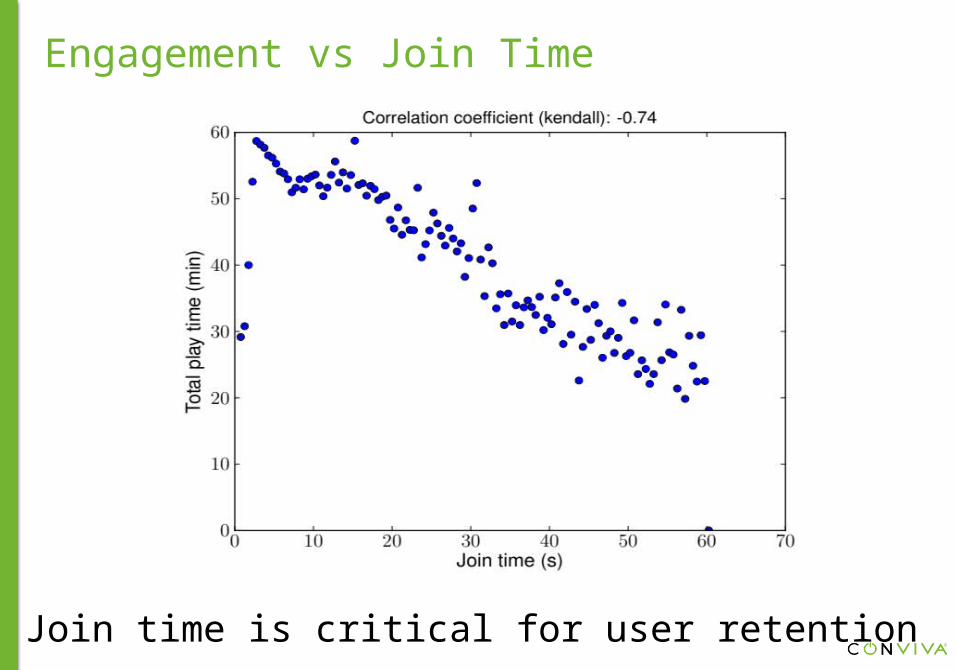
Engagement vs Join Time
Join time is critical for user retention

Engagement vs Buffering Ratio
1% increase in buffering reduces engagement by 3 minutes

CDNs Vary in Performance over Geographies and Time
• Used one month aggregated data-set
• Considered 31,744 DMA-ASN-hours with > 100 views in each CDN
25%
50%
25%
There is no single best CDN across geographies, networks, and time

CDNs Vary in Performance over Geographies and Time
0.0%
10.0%
20.0%
30.0%
40.0%
50.0%
60.0%
70.0%
80.0%
90.0%
100.0%

CDN Streaming Failures Are Common Events

Summary of Results
On most sites 15-30% of viewers do not get an uninterrupted high quality streamQuality has a substantial impact on viewer engagement
Buffering ratio is most critical across genres (for live event: 1% increase in buffering reduces 3min play time)Join time impacts engagement at viewer level
CDN performance varies minute by minute and region by region

A Strategy for Delivering High Quality Video Over the Internet

Refresh: What is high quality?
Prevent startup failuresStart the video quicklyPlay the video smoothly and without interruptionsPlay the video at the highest bit rate possible

Three Concepts for High Quality Video Delivery
Continuous measurement and optimization using a control infrastructure decoupled from the delivery infrastructureMulti-bit rate streams delivered using multiple CDNs Optimization algorithms based on individual client and aggregate statistics working at multiple time scales
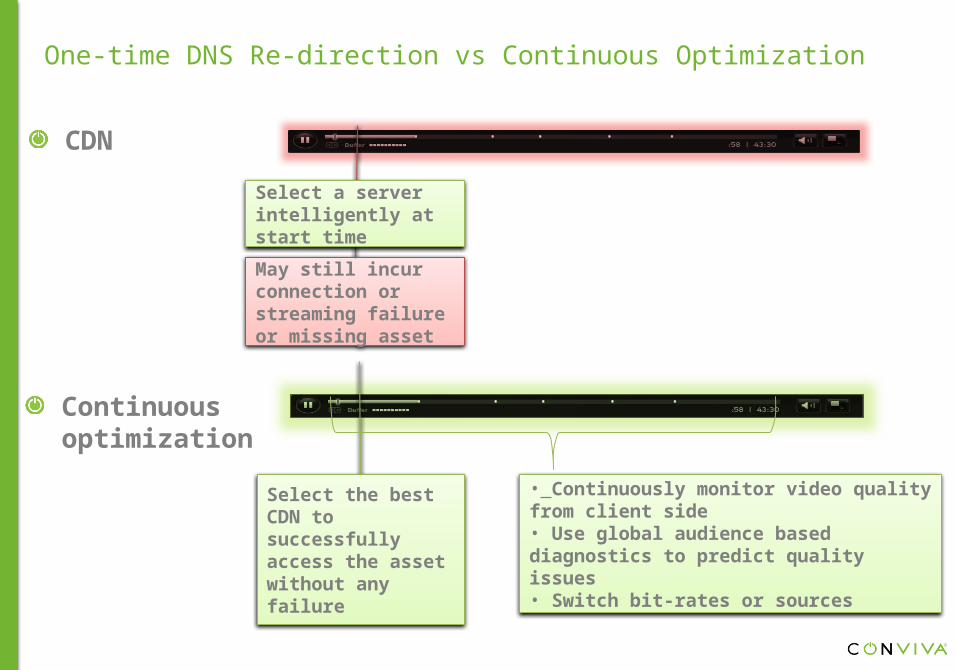
One-time DNS Re-direction vs Continuous Optimization
May still incur connection or streaming failure or missing asset
Select a server intelligently at start time
Select the best CDN to successfully access the asset without any failure
• Continuously monitor video quality from client side• Use global audience based diagnostics to predict quality issues• Switch bit-rates or sources
CDN
Continuous optimization
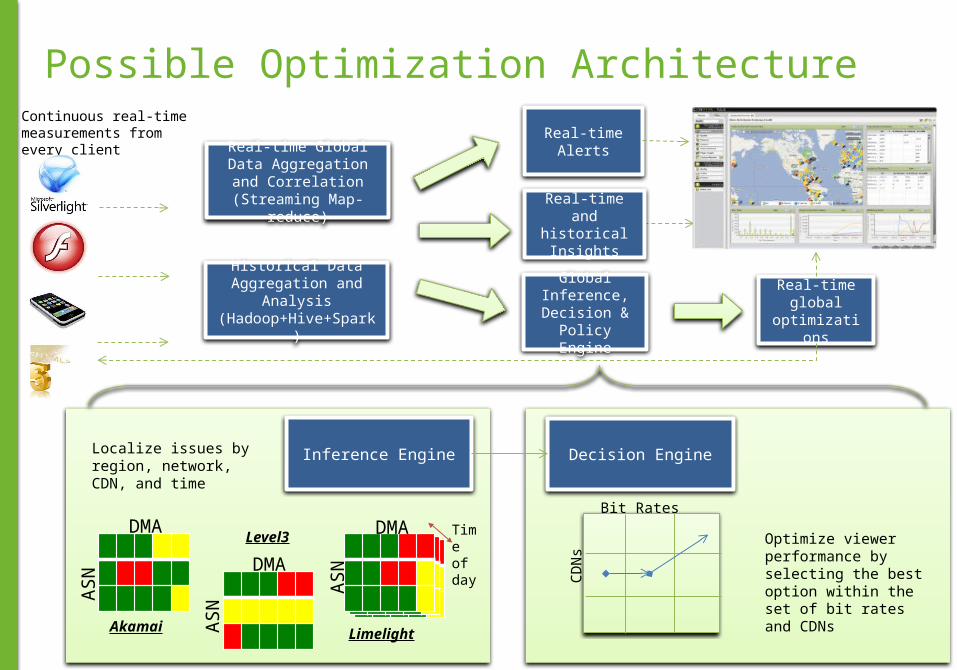
Possible Optimization Architecture
Real-time Alerts
Continuous real-time measurements from every client
Real-time and historical Insights
Real-time global
optimizations
Inference Engine
Bit Rates
CDN
s
Decision Engine
Optimize viewer performance by selecting the best option within the set of bit rates and CDNs
Akamai
DMA
ASN
DMA
ASNDMA
ASN
Limelight
Level3 Time of day
Localize issues by region, network, CDN, and time
Real-time Global Data Aggregation and
Correlation(Streaming Map-reduce)
Historical Data Aggregation and Analysis
(Hadoop+Hive+Spark)
Global Inference, Decision & Policy
Engine

Example Optimization Using Aggregate Statistics
Akamai Geo
ASN
Geo
ASN
Geo
ASN
Limelight
Level3
This ASN/Geo is saturated on all three CDNs Don’t switch CDN. Reduce bit rates and maintain
0 5000 10000 15000 20000 25000 30000 3500005
10152025303540
0 2000 4000 6000 8000 10000 12000 14000 16000 18000 200000
102030405060708090
100
Band
wid
th F
luct
uatio
nBa
ndw
idth
Flu
ctua
tion
Peak Concurrent Viewers
Peak Concurrent Viewers
Network Saturation Point
Unsaturated Network

Conviva Optimization in the Wild
… increased average bit-rate from 1.7 Mbps to 2.1 Mbps…
Reduced views impacted by buffering from 16.13% to 5.56% …
… and raised engagement by 36%
0.00%
5.00%
10.00%
15.00%
20.00%
25.00%
1600
1700
1800
1900
2000
2100
2200
Views Impacted by Buffering
Average Bit Rate

Concluding Remarks
All indications show that we are in the middle of a key transition of main-stream video to the Internet
Video quality presents opportunity and challengeFollow the traffic: 60% Internet traffic today, will be more than 95% in the next 2-3 yearsPremium video will be consumed by lean-back experience on big screens zero tolerance for poor quality
Video player continuous monitoring and optimization driven by player-level and global algorithms has the best chance of delivering high quality video