Bringing alive a billion dreams No Limits · hWcf[Z kf je ) c_bb_ed jedd[i _d ) o[Whi$ Chile Iron...
124
No Limits Annual Report 2010-11 www.jsw.in speed technology expertise environment lasting Steel Bringing alive a billion dreams
Transcript of Bringing alive a billion dreams No Limits · hWcf[Z kf je ) c_bb_ed jedd[i _d ) o[Whi$ Chile Iron...

No LimitsAnnual Report 2010-11
www.jsw.in
speed
technology
expertise
environment
lasting
SteelBringing alive a billion dreams

Aspiration and Belief
Vision
Global recognition for size, culture and quality, while nurturing nature and society.
Supporting the nation’s growth in power and steel with speed and innovation.
Mission Values
Vision, Mission, and Core Values
Content Recognition
JSW Steel Limited
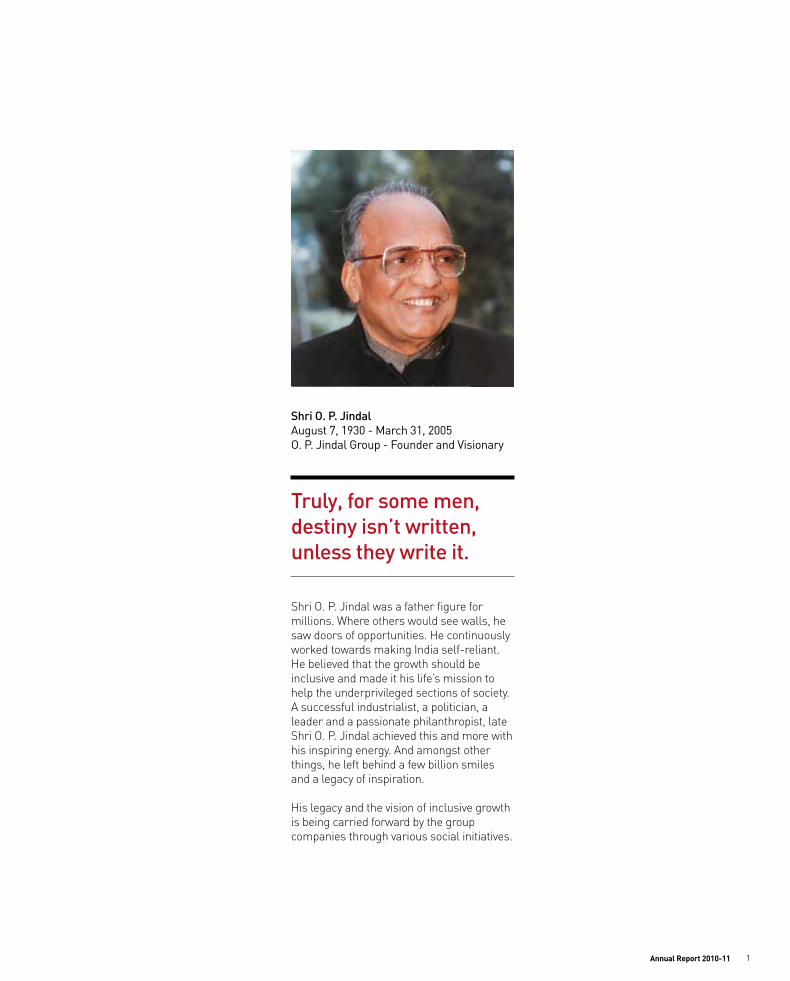
Shri O. P. JindalAugust 7, 1930 - March 31, 2005O. P. Jindal Group - Founder and Visionary
saw doors of opportunities. He continuously
He believed that the growth should be
help the underprivileged sections of society.
leader and a passionate philanthropist, late
and a legacy of inspiration.
His legacy and the vision of inclusive growth is being carried forward by the group
Truly, for some men, destiny isn’t written,unless they write it.
Annual Report 2010-11 1

Message from the Vice Chairman and Managing Director
“At JSW, change is the only constant, accelerating the value-creation momentum.”Sajjan Jindal,
Dear Shareholders,
Strategic Collaboration with JFE – The Game Changer
including energy control and savings.
Backward Integration – Strengthening Sustainability
capacities or acquiring natural resources.
creation of additional capacities on the one hand and investing in enhancing resource linkages.
US Coking coal Mines:
Chile Iron ore:are ready to supply output to international
Changing the dynamics of the Indian Steel Industry – Ispat Acquisition
can develop healthy synergies with ispat
pelletising plant and power plant, resulting
A new chapter was written in the history of Indian Steel Industry when your company acquired 45.53% majority stake in Ispat Industries. The new entity that has a capacity of 3.3 mtpa and is scalable to 5 mtpa with relatively less investment.
JSW Steel Limited2

financially strong, healthy and stable to pursue our growth plans.
turbulence will be the order of the day;
to assure shareholders that as a policy, we
the world.
the quality of life of all stakeholders through
Our Gratitude
and appreciation to our shareholders,
and all other stake holders for their consistent support and trust.
in the world will take its rightful place
create huge opportunities for growth over
our position as one of the lowest cost steel producers in the world leading to a
Warm regards,
Sajjan Jindal
Another Step in Forward Integration – JV for Building Structure
will address the fast growing needs of the
leading to structurally effective and
Growth Strategy- Fine Tuned
for the last few years, we have further
geographies. However, the prolonged delay
processing destinations.
to sustain over the decade due to increasing
growing urbanization and rising working population.
Horizontal Expansion
will begin the construction of the plant in
we have decided to increase the capacity by
Investment in Technology – Towards Lowest Cost Steel producer
a strategy to achieve significant cost reduction by investing in new technologies.
in the feed which will further increase the productivity of our blast furnaces and reduce
increase the energy efficiency of steel
Speed and stability – hand in hand
Annual Report 2010-11 3

Highlights 2010-11 (Standalone)
Highlights 2010-11 (Standalone)
`
`
`
`
`
`
`
Contribution to Government & Society (` in crores)
2008-09 2009-10 2010-11Direct Taxes 383 589 726Indirect Taxes 992 1,081 1,693CSR initiatives 15 13 15TOTAL 1,390 1,683 2,434*
2006-2007 9,297
12,629 2007-2008
15,179 2008-2009
19,457 2009-2010
25,131 2010-2011
2006-2007 2,922
3,502 2007-2008
3,088 2008-2009
4,802 2009-2010
4,856 2010-2011
2006-2007 33.6%
30.3%2007-2008
21.8%2008-2009
26.2%2009-2010
20.8%2010-2011
2006-2007 78.88
94.18 2007-2008
22.70 2008-2009
105.94 2009-2010
96.33 2010-2011
Gross Sales (` in crores)
EBIDTA ( in crores)
EBIDTA Margin (%)
Earning Per Share-Diluted (`)
5 years CAGR 29.87%
5 years CAGR 17.88 %
*45% growth in contribution to Government & Society
Net Debt Equity Ratio
0
3600
7200
10800
14400
18000
2010-11 2009-10 2008-09 2007-08 2006-07 0.00
0.36
0.72
1.08
1.44
1.80
Net DebtNet Worth Incl. Pref. Shares
Net Debt Equity Ratio
0.68
0.91
1.36
1.14
0.57
3,818
5,594
7,6777,959
9,706
17,225
6,992
10,850
11,091
9,797
JSW Steel Limited4

Annual Report 2010-11
Mrs. SAVITRI DEVI JINDALChairperson
Mr. SAJJAN JINDALVice Chairman & Managing Director
Mr. SESHAGIRI RAO M.V.SJt. Managing Director & Group CFO
Dr. VINOD NOWALDirector & CEO
Mr. JAYANT ACHARYADirector (Commercial & Marketing)
Mr. M. MAHESHWAR RAO, I.A.S.Nominee Director of KSIIDC
Mr. YASUSHI KUROKAWANominee Director of JFE Steel Corporation, Japan.
Mrs. ZARIN DARUWALANominee Director of ICICI Bank Limited
Dr. S. K. GUPTADirector
Mr. ANTHONY PAUL PEDDERDirector
Dr. VIJAY KELKARDirector
Mr. UDAY M. CHITALEDirector
Mr. SUDIPTO SARKARDirector
Mr. KANNAN VIJAYARAGHAVANDirector
BOARD OF DIRECTORS COMPANY SECRETARYMr. Lancy Varghese
STATUTORY AUDITORSM/s. Deloitte Haskins & SellsChartered Accountants
BANKERSAllahabad BankBank of BarodaBank of IndiaICICI Bank LimitedIDBI Bank LimitedIndian BankIndian Overseas BankPunjab National BankState Bank of IndiaState Bank of MysoreState Bank of PatialaUnion Bank of IndiaVijaya Bank
REGISTERED OFFICEJindal Mansion5A, Dr. G. Deshmukh Marg,Mumbai - 400 026.Tel: 022 - 23513000 Fax: 022 - 23526400 Website: www.jsw.in
WORKSVijayanagar WorksP.O. Vidyanagar, Toranagallu Village,Sandur Taluk, Bellary District, Karnataka - 583 275.Tel: 08395 - 250120 to 30 Fax: 08395 - 250138/250665
Vasind WorksShahapur Taluk,Thane District, Maharashtra - 421 604. Tel: 02527 - 220022 to 025 Fax: 02527 - 220020/84/92
Tarapur WorksMIDC Boisar, Thane District,Maharashtra - 401 506. Tel: 02525 - 270147 / 270149Fax: 02525 - 270148
Salem WorksPottaneri, M. Kalipatti Village,Mecheri Post, Mettur Taluk,Salem District, Tamil Nadu - 636 453.Tel: 04298 - 278400 to 404Fax: 04298 - 278618
REGISTRARS & SHARE TRANSFER AGENTSKarvy Computershare Private LimitedPlot No.17 to 24, Vittalrao Nagar,Madhapur, Hyderabad - 500 081.Tel.: 040 - 23420815-8241-800-3454001 (Toll free)Fax: 040 - 23420814E-mail: [email protected]: www.karvy.com

6
JSW Steel Limited
NOTICE is hereby given that the SEVENTEENTH ANNUAL GENERAL MEETING of the Shareholders of JSW STEEL LIMITED will be held on Monday, the 25th July, 2011 at 11.00 a.m. at Birla Matushri Sabhagar, 19, New Marine Lines, Mumbai - 400 020, to transact the following business:
ORDINARY BUSINESS:
1. To receive, consider and adopt the Audited Balance Sheet as at
on that date, together with the Reports of the Board of Directors and the Auditors thereon.
2. To declare dividend on 10% Cumulative Redeemable Preference shares.
3. To declare dividend on Equity Shares.
4. To appoint a Director in place of Mr. Seshagiri Rao M.V.S, who retires by rotation and being eligible, offers himself for re-appointment.
5. To appoint a Director in place of Mr. Sudipto Sarkar, who retires by rotation and being eligible, offers himself for re-appointment.
6. To appoint a Director in place of Mr. Jayant Acharya, who retires by rotation and being eligible, offers himself for re-appointment.
7. To appoint a Director in place of Mr. Kannan Vijayaraghavan, who retires by rotation and being eligible, offers himself for re-appointment.
8. To appoint M/s. Deloitte Haskins & Sells, Chartered Accountants, as
of this Annual General Meeting until the conclusion of the next Annual
SPECIAL BUSINESS:
the following resolution as an Ordinary Resolution:
“RESOLVED THATat the Fifteenth Annual General Meeting of the Company held on 06.07.2009 and subject to the provisions of Sections 198, 269, 309 and 310 read with Schedule XIII and other applicable provisions, if any, of the Companies Act, 1956, the Company hereby approves the increase in the ceiling on Remuneration payable to Mr. Seshagiri Rao M.V.S w.e.f. 01.04.2011, for the remainder of his tenure i.e upto 05.04.2014, from ̀ 28,00,000/- per month to ̀ 50,00,000/- per month,
alter or vary the remuneration within the said ceiling of ̀ 50,00,000/-per month, as may be agreed to between the Board of Directors and Mr. Seshagiri Rao M.V.S.”
the following resolution as an Ordinary Resolution:
“RESOLVED THATat the Extra-Ordinary General Meeting of the Company held on 26.08.2010 and subject to the provisions of Sections 198, 269, 309 and 310 read with Schedule XIII and other applicable provisions, if any, of the Companies Act, 1956, the Company hereby approves the increase in the ceiling on Remuneration payable to Dr. Vinod Nowal w.e.f. 01.04.2011, for the remainder of his tenure i.e upto 29.04.2012, from ̀ 25,00,000/- per month to ̀
the remuneration within the said ceiling of ` 50,00,000/- per month, as may be agreed to between the Board of Directors and Dr. Vinod Nowal.”
the following resolution as an Ordinary Resolution:
Notice“RESOLVED THATat the Fifteenth Annual General Meeting of the Company held on 06.07.2009 and subject to the provisions of Sections 198, 269, 309 and 310 read with Schedule XIII and other applicable provisions, if any, of the Companies Act, 1956, the Company hereby approves the increase in the ceiling on Remuneration payable to Mr. Jayant Acharya w.e.f. 01.04.2011, for the remainder of his tenure i.e upto 06.05.2014, from ̀ 18,00,000/- per month to ̀ 50,00,000/- per month,
alter or vary the remuneration within the said ceiling of ̀ 50,00,000/- per month, as may be agreed to between the Board of Directors and Mr. Jayant Acharya.”
By Order of the BoardFor JSW STEEL LIMITED
Place : Mumbai Lancy VargheseDate : May 16, 2011 Company Secretary
NOTES:
1. The relative explanatory statement pursuant to Section 173(2) of the Companies Act, 1956, in respect of the business under Item No. 9 to 11 set out above and the details under Clause 49 of the Listing Agreement with Stock Exchanges in respect of Directors proposed to be appointed/ re-appointed at the Annual General Meeting, is annexed hereto.
2. A MEMBER ENTITLED TO ATTEND AND VOTE AT THE MEETING IS ENTITLED TO APPOINT A PROXY TO ATTEND AND VOTE INSTEAD OF HIMSELF/HERSELF AND SUCH PROXY NEED NOT BE A MEMBER OF THE COMPANY.
3. The instrument(s) appointing the proxy, if any, shall be deposited
Deshmukh Marg, Mumbai - 400 026 not less than forty eight (48) hours before the commencement of the Meeting and in default, the instrument of proxy shall be treated as invalid. Proxies shall not have any right to speak at the meeting.
4. The Register of Members and Share Transfer Books of the Company will remain closed from 13.07.2011 to 15.07.2011 (both days inclusive).
5. In order to provide protection against fraudulent encashment of Dividend Warrants, shareholders holding shares in physical form are requested to intimate the Company under the signature of the Sole/First joint holder, the following information which will be used by the Company for Dividend payments:
i) Name of Sole/First joint holder and Folio No.
ii) Particulars of Bank Account viz.:
(CA)
In case of Shareholders holding shares in electronic form, Bank account details provided by the Depositories will be used by the Company for printing on dividend warrants. Shareholders who wish to change such bank accounts may advise their Depository Participants (DPs) about such change with complete details of Bank Account including MICR Code.
7
Annual Report 2010-11
Annexure to Notice
Shareholders residing at the centers where National Electronic Clearing Service (NECS) facility is available are advised to avail of the option to collect Dividend by way of NECS.
Equity shareholders holding shares in physical form are requested to send their NECS Mandate Form in the format available for
the Registrars and Share Transfer Agent of the Company - Karvy Computershare Pvt. Ltd. In case of Equity Shareholders holding shares in Electronic form, the NECS Mandate Form will have to be sent to the concerned Depository Participants (DPs) directly.
6. The amounts of the unclaimed dividend declared by the erstwhile
ended 31.03.1995 have been transferred to the General Revenue Account of the Central Government in terms of Section 205A of the Companies Act, 1956. Shareholders who have not yet encashed their Dividend Warrants for the said period are requested to forward their claims in Form No. II prescribed under The Companies Unpaid Dividend (Transfer to General Revenue Account of the Central Government) Rules, 1978, to the Registrar of Companies, Maharashtra, Hakoba Compound, 2nd Floor, Fancy Corpn. Ltd. Estate, Dattaram Lad Marg, Kalachowkie, Mumbai - 400 033.
Consequent upon amendment to Section 205A of the Companies Act, 1956 and introduction of Section 205C by the Companies (Amendment) Act, 1999, the amount of dividend for the subsequent years remaining unpaid or unclaimed for a period of seven years from the date of transfer to Unpaid Dividend Account of the Company shall be transferred to the Investor Education and Protection Fund (IEPF) set up by the Government of India and no payments shall be made in respect of any such claims, by the Fund. Accordingly, all unclaimed/
unpaid dividends of erstwhile Jindal Iron & Steel Company Ltd. (now
to 2002-03 has been transferred to IEPF.
7. Members are requested to intimate the Registrar and Share Transfer Agent of the Company – Karvy Computershare Pvt. Ltd., Plot No.17 to 24, Vittalrao Nagar, Madhapur, Hyderabad - 500 081, immediately of any change in their mailing address or email address in respect of equity shares held in physical mode and to their Depository Participants (DPs) in respect of equity shares held in dematerialised form.
in the same order of name are requested to apply for consolidation
and Share Transfer Agents of the Company.
9. Members desirous of having any information regarding Accounts are
date of the meeting, so that the requisite information can be made available at the meeting.
10. All the Documents referred to in the accompanying Notice and Explanatory Statement are open for inspection at the Company’s
Mumbai - 400 013 on all working days of the Company, between 10.00 a.m. and 1.00 p.m. upto the date of the Annual General Meeting.
11. Members/Proxies are requested to bring the attendance slip duly
12. Copies of Annual Report will not be distributed at the Annual General Meeting. Members are requested to bring their copies to the meeting.
EXPLANATORY STATEMENT:
The Explanatory Statement pursuant to Section 173 (2) of the Companies Act, 1956 of the accompanying notice is as under:
Items No. 9 to 11
The Members of the Company had in their 15th Annual General Meeting held on 6th July, 2009 re-appointed Mr. Seshagiri Rao M.V.S as a Whole-time Director of the Company, with the designation Jt. Managing Director & Group CFO for a period of 5 years commencing from 6th April, 2009 and also the remuneration payable to him within an overall ceiling of ` 28,00,000/- p.m.
Dr. Vinod Nowal’s appointment as Director (Commercial) of the Company for a period of 5 years commencing from 30th April 2007 was approved by the members in their 13th Annual General Meeting held on 13th June 2007. His re-designation as “Director & CEO” & increase in the ceiling limit on the remuneration payable to him upto ` 25,00,000/- per month was subsequently approved by the members in the Extra-Ordinary General Meeting held on 26th August, 2010.
The appointment of Mr. Jayant Acharya as Director (Sales & Marketing) of the Company for a period of 5 years commencing from 7th May, 2009 and the remuneration payable to him within a overall ceiling of ` 18,00,000/- p.m was also approved by the Members in their 15th Annual General Meeting held on 6th July, 2009. The re-designation of Mr. Acharya as the Director (Commercial & Marketing) with effect from 1st April, 2010 was subsequently approved by the members in the Extra-Ordinary General Meeting held on 26th August, 2010.
The remuneration of Mr. Seshagiri Rao M.V.S, Dr. Vinod Nowal and
to time, such that the Salary and the aggregate value of all perquisites and allowances like furnished accommodation or house rent allowance in lieu thereof; house maintenance allowance together with reimbursement of expenses or allowances for utilities such as gas, electricity, water, furnishings and repairs; Bonus; Performance Incentive; ESOPs; medical reimbursement; club fees and leave travel concession for self and family; medical insurance and such other perquisites and allowances in accordance with the rules of the Company or as may be agreed to by the Board of Directors and Mr. Seshagiri Rao M.V.S/Dr. Vinod Nowal/ Mr. Jayant Acharya, shall not exceed the overall ceiling on remuneration approved by the members in General Meeting.
To retain the services of the Company’s key management executives and in view of the highly competitive employment market which currently prevails, your Directors felt desirable that the compensation paid to the aforesaid Whole-time Directors of the Company be revised w.e.f. 01.04.2011, more or less in line with the remuneration drawn by their counterparts in the country.
In view of the same, the Remuneration Committee and the Board of Directors have approved an uniform increase in the ceiling limit on remuneration payable to Mr. Seshagiri Rao M.V.S, Dr. Vinod Nowal and Mr. Jayant Acharya, to ` 50,00,000/- per month
The following perquisites shall not be included in the computation of the

8
JSW Steel Limited
a) Contribution to Provident Fund, Superannuation Fund or Annuity Fund to the extent these either singly or put together are not taxable under the Income Tax Act, 1961;
b) Gratuity as per rules of the Company (which shall not exceed one half month’s Salary for each completed year of Service); and
c) Earned leave with full pay or encashment as per rules of the Company.
For the purposes of calculating the above ceiling, perquisites shall be evaluated as per Income-tax Rules, wherever applicable.
shall not be included in the computation of perquisites for the purpose of calculating the said ceiling.
Mr. Seshagiri Rao M.V.S, Dr. Vinod Nowal & Mr. Jayant Acharya, shall be
subject to the approval of the Central Government, if required.
Mr. Seshagiri Rao M.V.S, Dr. Vinod Nowal and Mr. Jayant Acharya shall not be eligible for any sitting fees for attending the Company’s Board or Committee Meetings.
The Board may, in its absolute discretion pay to the above mentioned Whole-time Directors, lower remuneration than the maximum remuneration herein above stipulated and revise the same from time to time within the maximum limit stipulated by these resolutions.
Approval of the Members is now being sought for the said increase in the ceiling on remuneration w.e.f. 01.04.2011.
The proposed increase in ceiling on remuneration is within the limits prescribed under Part II of Section I of Schedule XIII of the Companies Act, 1956.
All other terms and conditions of appointment of the aforesaid Whole-time Directors as approved by the Members remain unchanged.
in the terms of appointment of the aforesaid Whole-time Directors, under Section 302 of the Companies Act, 1956.
No Supplementary Amendment Agreements are proposed to be entered into with Mr. Seshagiri Rao M.V.S, Dr. Vinod Nowal or with Mr. Jayant Acharya since the Principal Agreements entered into with them warrants no change.
None of the Directors other than Mr. Seshagiri Rao M.V.S, Dr. Vinod Nowal and Mr. Jayant Acharya is concerned or interested in the proposed resolutions.
Your Directors recommend the resolutions as at Item Nos. 9 to 11 for your approval.
By Order of the BoardFor JSW STEEL LIMITED
Place : Mumbai Lancy VargheseDate : May 16, 2011 Company Secretary
IMPORTANT COMMUNICATION TO MEMBERS
In an effort to make the earth a better place to live, the green movement has been sweeping over the Globe. Not only are individuals doing things to help the environment, companies & governments are as well. The Ministry of Corporate Affairs (MCA) has taken a “Green Initiative in Corporate Governance” by allowing paperless compliance by Companies through electronic mode and has issued recently a circular bearing no.17/2011 dated April 21, 2011 stating that service of documents by a Company to its Members can be made through electronic mode. The move of the ministry allows public at large to contribute to the green movement. To support this green initiative of the Government in full measure, members who have not registered their e-mail addresses, so far, are requested to register their e-mail addresses, in respect of electronic holdings with the Depository through their concerned Depository
provided in this Annual Report and register the same with Karvy Computershare Private Limited.

9
Annual Report 2010-11D
etai
ls o
f D
irec
tors
see
kin
g a
pp
oin
tmen
t/re
-ap
po
intm
ent
at t
he
fort
hco
min
g A
nn
ual
Gen
eral
Mee
tin
g[P
urs
uan
t to
Cla
use
49
of
the
Lis
tin
g A
gre
emen
ts e
nte
red
into
wit
h t
he
Sto
ck E
xch
ang
es]
Nam
e o
f th
e D
irec
tor
Mr.
Ses
hag
iri R
ao M
.V.S
Mr.
Su
dip
to S
arka
rM
r. J
ayan
t A
char
yaM
r. K
ann
an V
ijaya
rag
hav
an
Dat
e o
f B
irth
15
.01.
1958
21.0
3.19
4625
.01.
1963
04.0
5.19
59
Dat
e o
f A
pp
oin
tmen
t 06
.04.
1999
09.0
5.20
0507
.05.
2009
16.0
6.20
08
AIC
WA
,LC
S,C
AIIB
, Dip
lom
a in
Bus
ines
s F
inan
ce.
B.S
c. (
Mat
hs -
Hon
s), B
A (
Law
T
ripos
), L
LM (
Inte
rnat
iona
l Law
), M
A
(Law
) B
arris
ter,
Gra
y's
Inn,
Lon
don.
BE
(Che
mic
al),
M.S
c (P
hysi
cs),
MB
A
(M
arke
ting)
.F
ello
w M
em
be
r o
f th
e I
nst
itu
te o
f C
ha
rte
red
Ac
co
un
tan
ts o
f In
dia
,
Fel
low
of
the
Inst
itute
of
Man
agem
ent
Con
sulta
nts.
fun
ctio
nal
are
aM
r. S
esh
ag
iri
Ra
o
MV
S j
oin
ed
th
e C
ompa
ny i
n 19
97 a
s C
hief
Fin
anci
al
the
grow
th s
trat
egie
s of
the
Com
pany
.
Pri
or
to j
oin
ing
th
e C
om
pa
ny
he
ha
s w
ork
ed
wit
h v
ari
ou
s re
pu
ted
org
an
isa
tio
ns
like
VS
T i
nd
ust
rie
s,
And
hra
Ban
k, E
SS
AR
Ste
el L
td.
and
Nic
hola
s P
iram
al In
dia
Lim
ited
in v
ario
us
Cap
aciti
es.
He
poss
esse
s ric
h ex
perie
nce
spa
nnin
g o
ver
thre
e d
eca
de
s in
th
e a
rea
s o
f C
orpo
rate
Fin
ance
and
Ban
king
.
In h
is p
rese
nt c
apac
ity a
s Jo
int M
anag
ing
Dir
ect
or
& G
rou
p C
FO
, M
r. R
ao
is
resp
onsi
ble
for
the
over
all
Ope
ratio
ns
of t
he C
ompa
ny,
Str
ateg
ic i
nitia
tives
re
late
d t
o b
usi
ne
ss d
eve
lop
me
nt,
ex
pans
ion
of e
xist
ing
busi
ness
es,
join
t ve
ntur
es, m
erge
rs a
nd a
cqui
sitio
ns a
nd
cost
man
agem
ent.
He
is p
rese
ntly
pra
ctic
ing
as a
sen
ior
advo
cate
in th
e C
alcu
tta H
igh
Cou
rt a
nd
has
wid
e ex
perie
nce
in C
omm
erci
al L
aw
part
icul
arly
Com
pany
Law
, In
telle
ctua
l P
rop
ert
y a
nd
Sh
ipp
ing
La
ws.
He
is a
B.S
c. (
Ma
the
ma
tics
) fr
om
th
e P
resi
denc
y C
olle
ge,
Kol
kata
, B
A (
Law
T
ripos
) LL
.M.
(Int
erna
tiona
l Law
), M
.A.
(La
w),
Un
ive
rsity
of
Ca
mb
rid
ge
an
d B
arris
ter,
Gra
y’s
Inn,
Lon
don.
He
also
ha
s se
vera
l pu
blic
atio
ns t
o hi
s cr
edit
and
is t
he c
olla
bora
ting
edito
r of
the
R
amai
ya’s
Gui
de to
the
Com
pani
es A
ct
and
cont
ribut
or t
o se
vera
l vo
lum
es o
f In
tern
atio
nal L
aw R
epor
ts (C
ambr
idge
).
Mr.
Ja
yan
t A
cha
rya
is
a C
he
mic
al
En
gin
ee
r w
ith a
Ma
ste
rs i
n P
hys
ics
from
BIT
S,
Pila
ni in
the
yea
r 19
86.
He
has
done
his
MB
A in
Mar
ketin
g fr
om th
e In
dore
Uni
vers
ity.
Mr.
Ach
arya
has
24
year
s of
exp
erie
nce
in th
e st
eel i
ndus
try
span
ning
the
entir
e
has
wor
ked
in v
ario
us c
apac
ities
and
lo
catio
ns in
Indi
a.
His
ext
en
sive
exp
eri
en
ce i
ncl
ud
es
star
tup
oper
atio
ns,
deve
lopm
ent
and
exec
utio
n of
str
ateg
ies
for
pene
trat
ing
new
mar
kets
and
cus
tom
ers,
cre
atio
n of
st
rong
bra
nd e
quity
for
the
Com
pany
in
the
dom
estic
and
inte
rnat
iona
l mar
kets
an
d in
trod
uctio
n of
inno
vativ
e m
arke
ting
conc
epts
.
Mr.
Ka
nn
an
Vij
aya
rag
ha
van
, is
a
Fe
llow
Me
mb
er
of
the
In
stit
ute
of
Ch
art
ere
d A
cco
un
tan
ts o
f In
dia
, a
a F
ello
w o
f the
Inst
itute
of M
anag
emen
t C
onsu
ltant
s.
He
is
the
Dir
ect
or
an
d f
ou
nd
er
of
Sat
hgur
u M
anag
emen
t Con
sulta
nts
Pvt
. Lt
d.,
Hyd
erab
ad,
a la
rge
cons
ulta
ncy
year
198
5. H
e is
als
o P
artn
er o
f D
FK
In
tern
ati
on
al,
a w
orl
dw
ide
fir
m o
f ac
coun
tant
s an
d bu
sine
ss a
dvis
ors,
a
Vis
iting
Fel
low
and
Fac
ulty
, E
xecu
tive
Edu
catio
n, C
orne
ll U
nive
rsity
, It
haca
, N
Y a
nd
a R
eg
ion
al
Co
ord
ina
tor
for
Cor
nell
Uni
vers
ity R
esea
rch
Pro
gram
s in
S
outh
Asi
an/ S
outh
Eas
t Asi
an R
egio
n.
Ove
r th
e la
st t
wen
ty s
ix y
ears
, he
has
ha
ndle
d ov
er 3
00 a
ssig
nmen
ts i
n th
e a
rea
of
Str
ate
gic
Pla
nn
ing
, M
erg
ers
a
nd
Acq
uis
itio
ns
an
d O
rga
nis
atio
na
l G
row
th i
n E
me
rgin
g M
ark
et
Re
late
d E
nv
iro
nm
en
t. H
e a
lso
ha
s w
ide
exp
osu
re t
o o
vers
ea
s e
nvi
ron
me
nt
wit
h C
on
sult
ing
exp
osu
re t
o l
arg
e M
ulti
na
tion
al
an
d E
me
rgin
g N
atio
na
l co
mpa
nies
. Glo
bal c
ompa
nies
con
sulte
d in
clu
de
20
Fo
rtu
ne
50
0 c
om
pa
nie
s,
ab
ou
t 1
00
Mid
Ca
p E
nte
rpri
ses
an
d N
AS
DA
Q li
sted
com
pani
es.

10
JSW Steel LimitedD
etai
ls o
f D
irec
tors
see
kin
g a
pp
oin
tmen
t/re
app
oin
tmen
t at
th
e fo
rth
com
ing
An
nu
al G
ener
al M
eeti
ng
[Pu
rsu
ant
to C
lau
se 4
9 o
f th
e L
isti
ng
Ag
reem
ents
en
tere
d in
to w
ith
th
e S
tock
Exc
han
ges
]
Nam
e o
f th
e D
irec
tor
Mr.
Ses
hag
iri R
ao M
.V.S
Mr.
Su
dip
to S
arka
rM
r. J
ayan
t A
char
yaM
r. K
ann
an V
ijaya
rag
hav
an
Dir
ecto
rsh
ip in
oth
er In
dia
n
Pu
blic
Lim
ited
Co
mp
anie
s as
o
n 3
1.03
.201
1
Ispa
t Ind
ustr
ies
Ltd.
Ves
uviu
s In
dia
Ltd.
Bom
bay
Sto
ck E
xcha
nge
Ltd.
EIH
Ass
ocia
ted
Hot
els
Ltd.
Des
con
Ltd.
B &
A L
td.
Eve
read
y In
dust
ries
Indi
a Lt
d.
Isla
nd H
otel
Mah
araj
Ltd
.
B&
A P
acka
ging
Indi
a Lt
d.
JSW
Ste
el P
roce
ssin
g C
entr
es L
td.
JSW
Bui
ldin
g S
yste
ms
Ltd.
JSW
Str
uctu
ral M
etal
Dec
king
Ltd
.
-
Ch
airm
an/ M
emb
ersh
ip o
f C
om
mit
tees
in o
ther
Ind
ian
P
ub
lic L
imit
ed C
om
pan
ies
as
on
31.
03.2
011.
*
(C =
Ch
airm
an;
M =
Mem
ber
)
-A
ud
it C
om
mit
tee:
Ves
uviu
s In
dia
Ltd.
(M
)
EIH
Ass
ocia
ted
Hot
els
Ltd.
(M
)
Eve
read
y In
dust
ries
Indi
a Lt
d. (
M)
Sha
reho
lder
s/In
vest
ors
Grie
vanc
e C
omm
ittee
:
Ves
uviu
s In
dia
Ltd.
(M
)
EIH
Ass
ocia
ted
Hot
els
Ltd.
(M
)
Au
dit
Co
mm
itte
e:
JSW
Ste
el P
roce
ssin
g C
entr
es L
td. (
M)
-
No
. of
Sh
ares
hel
d in
th
e C
om
pan
y22
,318
Nil
11,2
06N
il
*onl
y tw
o C
omm
ittee
s na
mel
y, A
udit
Com
mitt
ee a
nd S
hare
hold
ers/
Inve
stor
s G
rieva
nce
Com
mitt
ee h
ave
been
con
side
red.

11
Annual Report 2010-11
To the Members ofJSW STEEL LIMITED,
Your Directors take pleasure in presenting the Seventeenth Annual Report of your Company, together with the Standalone and Consolidated Audited Statement of Financial Accounts for the year ended March 31, 2011.
1. FINANCIAL RESULTS(` in crores)
Particulars Standalone Consolidated
F.Y.2010-11
F.Y.2009-10
F.Y.2010-11
F.Y.2009-10
Gross Turnover 25,130.76 19,456.64 25,867.80 20,211.33Less: Excise duty 1,967.52 1,254.16 1,967.56 1,254.16Net Turnover 23,163.24 18,202.48 23,900.24 18,957.17Other Income 282.64 529.08 284.03 532.16Total Revenue 23,445.88 18,731.56 24,184.27 19,489.33
Interest,Depreciation, &Taxation (EBIDTA) 4,856.17 4,801.98 4,946.77 4,602.83Net Finance Charges 695.18 858.92 945.41 1,104.17Depreciation and amortisation 1,378.71 1,123.41 1,559.71 1,298.66
Taxation (PBT) 2,782.28 2,819.65 2,441.65 2,200.00Tax including Deferred Tax 771.61 796.91 782.27 646.71
but before minorityinterest and share of
2,010.67 2,022.74 1,659.38 1,553.29Share of Losses of Minority – – (23.87) (33.21)
Associates (Net) – – 70.73 11.05
(PAT) 2,010.67 2,022.74 1,753.98 1,597.55
from previous year 5,327.78 3,883.15 4,695.46 3,676.02Amount available for Appropriation 7,338.45 5,905.89 6,449.44 5,273.57AppropriationsTransfer to DebentureRedemption Reserve – (125.00) – (125.00)Transfer to Capital Redemption Reserve – (9.90) – (9.90)Dividend on Preference Shares (27.90) (28.92) (27.90) (28.92)Proposed Final Dividend on Equity Shares (273.32) (177.70) (273.32) (177.70)Corporate Dividend Tax (48.87) (34.31) (48.87) (34.31)Transfer to General Reserve (4,200.00) (202.28) (4,200.00) (202.28)Total (4,550.09) (578.11) (4,550.09) (578.11)
Balance carried to Balance Sheet 2,788.36 5,327.78 1,899.35 4,695.46
The Company achieved a favourable product mix during the year, mainly due to increase in rolled products, with the rolling of most of the available cast products. This helped in reducing the sale of semis (cast products) in the overall product mix to around 6% (vis-à-vis 22% in last year) which in turn helped in improvement in blended sales realization compared to that of with previous year.
The Company achieved a volume growth over previous year of 7% in crude steel production during the current year. It had achieved crude steel production of 6.427 Million tonnes (the overall production was 6.506 Million tonnes, considering trial run production from the expansion project) and volume of sales of 6.099 million tonnes.
The interest cost has come down due to prepayment and repayment of high cost debt out of proceeds of equity investment by strategic investor JFE Corporation, Japan.
The Gross Turnover and Net Turnover for the year stood at ` 25,130.76 crores and ` 23,163.24 crores, respectively, showing a growth of 29% and 27% over the previous year mainly driven by growth in volumes and improved product mix and increase in blended sales realizations.
The EBIDTA for the year was ` 4,856.17 crores and EBIDTA margin for the year was 20.8%. Your Company posted PAT of ` 2,010.67 crores.
Pursuant to Accounting Standard AS-21 issued by the Institute of
subsidiaries. In the context of globalising Indian economy and the increase in the number of subsidiaries, the Ministry of Corporate Affairs, vide its General Circular No. 2/2011 dated 08.02.2011 has granted General Exemption to all companies from attaching the
subsidiary companies to the Balance Sheet of the Company subject
documents/details upon request by any member or investor of the Company/subsidiary companies. Further, the Annual Accounts of the subsidiary companies will be kept open for inspection by any
subsidiary companies.
associates as per Accounting Standard (AS) – 23 on “Accounting for Investments in Associates in Consolidated Financial Statements” and proportionate share of interest in Joint Venture as per Accounting Standard (AS) – 27 on “Financial Reporting of Interests in Joint Ventures”.
As per the Consolidated Financial Statements, the Gross Turnover, Net Turnover, EBIDTA and PAT of the Company are ` 25,867.80 crores, ` 23,900.24 crores, ` 4,946.77 crores and ` 1,753.98 crores, respectively. The PAT on consolidated basis
subsidiaries attributable to slow recovery from global meltdown.
2. DIVIDEND
The Board has, subject to the approval of the Members at the ensuing Annual General Meeting, recommended dividend at the stipulated rate of ` 1.00 per Share on the 27,90,34,907, 10% Cumulative Redeemable Preference Shares of ` 10 each of the Company, for the year ended March 31, 2011.
The Board has also, considering the Company’s performance
a dividend of ` 12.25 per Equity Share (122.5%) on the
Directors’ Report

12
JSW Steel Limited
22,31,17,200 Equity Shares of ` 10/- each of the Company, for the year ended March 31, 2011, subject to the approval of the Members at the ensuing Annual General Meeting.
of Equity dividend will be ` 317.66 crores, vis-à-vis ` 207.21 crores
3. PROSPECTS
Advanced Market Economies (AME’s) showed a mix of higher volatility and moderate recovery while Unemployment, Debt and
Chinese Economic growth remained robust @ 10.3% in 2010 fuelled by rising investments (+23.8%). Global Steel Production grew by 15% at 1,414 MnT, while China’s steel production was up by 9.3% to 627 MnT.
Economic recovery is expected to continue its positive momentum across most of the economies. China, with its 12th Five Year Plan to commence from 2011 onwards, is slated to shift focus from growth
Reduction, Resource Conservation and Social aspects. China is also expected to intensify its focus on exploring domestic demand and
and marginal capacities. Rest of the world is also expected to witness improved growth led by expanding Investments and consumption
that most of emerging economies needs to address while keeping the growth momentum intact. Overall the Steel sector is expected to see a good demand and higher price realization driven mainly by restocking and surging input cost.
4. PROJECTS AND EXPANSION PLANS
The status of progress made on various Projects of the Company was as follows:
Vijayanagar Works
(a) Projects commissioned during FY 2010-11
(i) The implementation of the state-of-the art new Hot Strip Mill with a capacity of 5 mtpa was taken up in two phases. Phase-I with a capacity of 3.5 mtpa was successfully commissioned on March 28, 2010. After successful trial runs, the Mill commenced commercial operations on April 10, 2010. Phase II implementation is progressing well.
(ii) The 3.2 mtpa expansion project at Vijayanagar Works is progressing in full swing. The overall crude steel capacity of the Company will go upto 11 mtpa on completion of this project. The following facilities were commissioned / part commissioned during the year:
Ladle Heating Furnace-3&4, Converter-3&4 and Caster-3&4 were commissioned in phases by March 2011.
Sinter plant 3 (5.75 mtpa capacity) was commissioned in February 2011 – the largest such facility in India.
300MW captive power plant (CPP 3) was commissioned in September 2010.
Two of the four batteries (Battery A&B) of coke oven 4 (1.95 mtpa capacity) were commissioned in December 2010. Battery C was commissioned in the month of April 2011 while heating of Battery D is underway.
(iii) First phase of the 20 mtpa beneficiation plant was commissioned in phases in April 2011.
(b) Projects under Progress
Following projects are under different stages of implementation:
The balance units of 3.2 mtpa expansion project viz, Blast Furnace 4, Lime plant, Water pipeline will be commissioned by June 2011.
Second phase (capacity of 1.5 mtpa) of the new HSM, taking the rolling capacity of this facility to 5 mtpa by September 2012.
Pellet plant 2 (capacity 4.2 mtpa) expected to be commenced by June 2011.
300 MW Captive Power Plant (CPP4) at Vijayanagar, to be commissioned by December 2011.
(c) Projects proposed
New Cold Rolling Mill Complex:
The Company has decided to set-up a new Cold Rolling Mill Complex of 2.3 mtpa in two phases at its Vijayanagar Works, considering the growing demand from consumer durable and automobile segment for CRCA products. The proposed complex will have 2.3 mtpa of Pickling cum coupled tandem Cold Rolling Mill, 1.9 mtpa (two lines of 0.95 mtpa each) of State of the art Continuous Annealing lines and 0.4 mtpa of Galvanising cum Galvannealing line.
Total investment is about ̀ 4,025 crores, and is proposed to be funded by a debt equity ratio of 2:1. The target date of completion is Q1 2013-14 for Phase-I and Q1 2014-15 for Phase-II.
Augmenting crude steel capacity from 10 mtpa to 12 mtpa at Vijayanagar works:
The Company has made assessment of the existing facilities
decided to increase the capacity by an additional 2 mtpa.
The proposed project cost is about ` 2,695 crores and is to be ` 945 crores and the balance
by debt and is expected to be commissioned by June 2013.
Salem Works
(a) Projects commissioned during FY 2010-11
Phase I of the Blooming Mill (capacity 0.25 mtpa) was commissioned in September 2010.
(b) Projects under progress
Phase II of the Blooming Mill (capacity 0.25 mtpa) is in progress and the same is expected to be commissioned by September 2011. On completion of phase II the Company will have matching rolling capacity for cast product at Salem unit.
Vasind Works
Projects under progress
Railway siding project is in an advanced stage of completion.
Project RLNG to replace expensive fuel usage, is expected to be completed by June 2011.
5. SUBSIDIARY, JOINT VENTURE AND ASSOCIATE COMPANIES
A. Indian Subsidiaries
1. JSW Bengal Steel Limited (JSW Bengal), its Subsidiaries Barbil Beneficiation Company Limited, JSW Natural Resources India Limited and its Associate JSW Energy (Bengal) Limited (JSWEBL)

13
Annual Report 2010-11
JSW Bengal Steel Limited was incorporated for setting up an Integrated Steel Plant in the State of West Bengal. The Company has already acquired and is in possession of Land required for this project. Boundary wall work at Salboni site has been completed to a major extent. The Company has also started construction of a residential complex by the name “Ankur” for the employees stay during construction of the plant. All the major survey work has already been completed at site. Power as well as water for construction is already tied up. Drilling and 3 Dimensional High Resolution Seismic Survey (3 DHRSS) are in progress at Kulti-Sitarampur Coal block by JSW Natural Resources India Ltd.
JSW Bengal is planning to invest ` 16,000 crores in phase I of this project. The Company is drawing up plans for
2. JSW Jharkhand Steel Limited
JSW Jharkhand Steel Limited was incorporated for setting up a steel plant in the State of Jharkhand. Approvals for setting up the project are being pursued.
3. JSW Steel Processing Centres Limited (JSWSPCL)
JSWSPCL is a 100% subsidiary of the Company. The subsidiary company was set up as Steel Service Centre consisting of HR/CR Slitter and cut to length facility with annual slitting capacity of 5,00,000 tonnes. The Company processed 4,97,112 tonnes of steel during the FY 2010-11, as compared to 3,04,718 tonnes in the previous year.
During the previous year, JSWSPCL purchased 3 Slitting Lines and 1 Multi Strand Blanking lines from its fellow subsidiary JSW Steel Service Centre (UK) Limited.
4. JSW Building Systems Limited (JSWBSL)
JSWBSL, a 100% subsidiary, was incorporated with its main object as to design, make, prepare, develop, create, alter, replace, repair pre-fabricated building systems and technologies.
B. Overseas Subsidiaries
1. JSW Steel (Netherlands) B.V. (JSW Netherlands)
JSW Netherlands is a holding Company for USA, UK and Chile based subsidiaries. It has participation in 49% equity of Georgia based Geo Steel LLC, incorporated under the laws of Georgia. The Company has also invested in plate and pipe mill in USA, Coal mining assets in USA, iron ore mining concessions in Chile and Service Centres (since shutdown) at UK through the following step down subsidiaries.
(a) JSW Steel Holding (USA) Inc. and its subsidiaries viz. JSW Steel (USA) Inc – Plate and Pipe Mill Operation and Periama Holdings LLC and its subsidiaries – West Virginia, USA based Coal Mining Operation.
Plate and Pipe Mill operation
For the year 2010-11, the Subsidiary Company produced 119,887 net tonnes of Plates and 42,148 net tonnes of Pipes and achieved capacity utilization of 11% and 8% respectively.Considering the signs of improvement in US economy, it is expected that plate and pipe mills performance should improve during FY 2011-12.
Coal Mining operation
During the previous year, JSW Steel Holding (USA) Inc. acquired 100% equity interest in West virginia, USA based coal mining concessions along with barge load out facility.
Out of the total seven mines acquired, one mine is currently operational. For other mines, process of getting statutory clearance/permits is at an advanced stage of approval.
It is expected to produce approximately 0.50 million tonnes of Coal in the FY 2011-12 subject to receipt of requisite permits, which is planned to be ramped up to 3 million tonnes in over 3 years.
(b) JSW Steel (UK) Limited and its Subsidiaries namely Argent Independent Steel (Holdings) Limited and JSW Steel Service Centre (UK) Limited
While the European economy is still struggling to come out of recessionary condition, there is growth of Auto and Consumer Durables Industry in India and there is a logical growth of ‘Steel Stockholding and Service Centre Industry’ in India. In these circumstances, Plant & Machinery of UK Service Centre consisting of 3 Slitting Lines and 1 Multi Strand Blanking lines was sold to JSW Steel Processing Centres Limited, a subsidiary of the Company for relocation and use in India.
(c) JSW Panama Holdings Corporation and its Chilean subsidiaries namely Inversiones Eurosh Limitada (IEL), Santa Fe Mining (SFM) and Santa Fe Puerto S.A (SFP)
mining activity through dry process route with a capacity of
April 2011.
Work on putting up a wet beneficiation plant of 2.5 mtpa is currently being examined and necessary statutory and environmental approvals are being applied for.
SFP, a subsidiary of SFM received maritime concession in April 2011 for developing a cape size port in North Caldera. The environmental and other regulatory approvals are applied for and are in progress.
2. JSW Natural Resources Limited (JSWNRL) and its Subsidiaries JSW Natural Resources Mozambique Lda (JSWNRML), JSW ADMS Carvão Lda
JSW Natural Resources Limited was incorporated in Mauritius to pursue acquiring coal assets/other assets relating to steel business.
JSW Natural Resources Limited formed a wholly owned subsidiary – JSW Natural Resources Mozambique Lda in Mozambique to acquire Coal assets and engaging in the business of prospecting and exploration of Coal, Iron Ore and Manganese.
In one of the mining concession where coal is found, Company has started with detailed drilling activities to establish JORC compliant reserve estimates.
JSW Natural Resources Mozambique Lda incorporated JSW ADMS Carvão Lda on October 8, 2010 wherein 85% stake is owned by JSWNRML and remaining 15% stake is with minority shareholder. It has a mining concession in Zumbo District Tete Province. The Company has initiated drilling activities to prove
C. Joint Venture Companies
1. Geo Steel LLC
Georgia based Joint Venture Geo Steel LLC in which your Company holds 49% equity through JSW Steel (Netherlands) B.V, has set up a steel rolling mill in Georgia with annual production capacity of 175,000 tonnes across 13.50 hectares

14
JSW Steel Limited
in the industrial area of Rustavi in Georgia. The plant became operational during year 2009-10. It is designed to produce rebar through hot rolling process by using steel billets produced through the Electric Arc Furnace Route.
Geo Steel produced 85,449 tonnes of Rebar and 95,901 tonnes of Billets during the FY 2010-11.
2. Rohne Coal Company Private Limited
Your Company holds 49% equity in Rohne Coal Company Pvt. Ltd. (JSW group is holding 69.01%, including that of the Company), which is a Joint Venture with three other partners (two partners from outside the Group). Forest clearance and Mining lease proposal is being pursued with Government authorities.
3. MJSJ Coal Limited
In terms of the Joint Venture Agreement to develop Utkal – A and Gopal Prasad (West) thermal coal block in Orissa, your Company agreed to participate in the 11% equity of newly formed MJSJ Coal Limited, Orissa along with four other partners. The Government of India has decided to allot 1,522 acres of Gopal Prasad west area to MJSJ Coal Limited. Mahanadi
Land acquisition process is under progress.
4. Gourangdih Coal Limited
Gourangdih Coal Ltd (GCL) is a 50:50 Joint Venture between JSW Steel Limited and Himachal EMTA Power Corporation Ltd (HEPL) incorporated for development and mining of coal from Gourangdih ABC Thermal coal block in the state of West Bengal. It is currently progressing on pre mining activities.
5. Toshiba JSW Turbine and Generator Private Limited
Toshiba JSW Turbine and Generator Pvt. Ltd. has been incorporated with a shareholding of 75% by Toshiba Corporation Ltd., Japan, 20% by JSW Energy Ltd. and 5% by the Company, to design, manufacture, marketing and maintenance services of mid to large sized Supercritical Steam Turbines & Generators of size 500 MW to 1,000 MW.
Trial production of blades started on March 2011. The construction and erection of main plant equipment erection is progressing well.
6. Vijayanagar Minerals Private Limited (VMPL)
tonnes of Iron Ore from Thimmappanagudi Iron Ore Mines, vis-à-vis 1.76 million tonnes in the last FY 2009-10. VMPL has planned to supply 3.00 million tonnes during the next FY 2011-12.
Structural Metal Decking Limited
project for design, fabrication and erection of structural steelwork and ancillaries, including decking for construction projects with a total plant Capacity of 35,000 tonnes per annum at Bellary in
line commenced in November 2010 and the second fabrication line was commissioned in March 2011. The Company has produced a total of 3425 tonnes during the year. The order book of the Company stood at ̀ 120 crores (8370 tonnes) as on March 31, 2011.
JSW Structural Metal Decking Limited (JSWSMD), a subsidiary company of JSSL is engaged in business of the design, roll forming and installation of structural metal decking and ancillaries, including shear connectors, for construction projects with a total plant capacity of 10,000 tonnes per annum at Bellary in the
State of Karnataka and started its commercial production in October 2010.
D. Associate Companies
(a) Jindal Praxair Oxygen Company Private Limited (JPOCPL)
The oxygen plants of JPOCPL have been working satisfactorily primarily to meet the requirement of the steel plant operations at
production of the oxygen plant module #1 and module # 2 of JPOCPL was: Gaseous oxygen – 1003.17 million Nm3; Gaseous nitrogen – 361.26 million Nm3; Liquid oxygen – 23.06 million Nm3; Liquid nitrogen – 30.25 million Nm3 and Argon – 11.01 million Nm3.
(b) Ispat Industries Limited (IIL)
IIL re-started its operations in December 2010. It produced 0.729 million tonnes of HR Coils during the Quarter January to March 2011, and capacity utilization achieved was 88%. The volume of sales including downstream products improved to 0.712 million tonnes with an EBIDTA of `
` 70 crores.
The Board of Directors have taken note of the matters to which the Auditors of IIL have drawn attention in their report, regarding overdue sundry debtors amounting to ` 571.60 crores, non-reconciliation of credit balances of ` 118.69 crores and raw material in-transit amounting to ` 104.83 crores.
and relying on this, no provisioning has been considered necessary by the Board in respect of these items.
6. CREDIT RATING
The credit rating of your Company for the Long Term Debt/Facilities/Non Convertible Debentures has been upgraded to “AA” (Double A) from AA- (Double A minus) by credit rating agency Credit Analysis & Research Ltd. (CARE). The Short Term Debt /Facilities continue to be rated at the highest rating of “PR1+” (PR one plus).
The revision in the long term rating takes into account the improved
Corporation, Japan and the promoters.
The rating continues to derive strength from your Company’s
“AA” rating by CARE indicates a high safety for timely servicing of debt obligations and very low credit risk.
“PR1+” rating is the highest rating in the category and indicates a strong capacity for timely payment of short term debt obligations and lowest credit risk.
7. FIXED DEPOSITS
and is therefore not required to furnish information in respect of outstanding deposits under Non Banking Non Financial Companies (Reserve Bank) Directions, 1966 and Companies (Acceptance of Deposits) Rules, 1975.
8. SHARE CAPITAL
Pursuant to the decisions taken in the Board meeting held on July 27, 2010 and the Extra Ordinary General Meeting held on August 26, 2010, and in terms of the Subscription Agreement entered into

15
Annual Report 2010-11
by the Company with JFE Steel Corporation, Japan (JFE) on July 27, 2010, the Share Allotment Committee of the Board of Directors in its meeting held on September 08, 2010 had allotted 1 (one) Fully and Compulsorily Convertible Debenture of face value of ` 48,007,197,458 (‘FCD’) to JFE.
Upon the mandatory and automatic conversion on October 07, 2010 of the aforesaid ‘FCD’ held by JFE, the Share Allotment Committee of Directors of the Company in its meeting held on October 08, 2010 allotted 32,004,798 (thirty two million four thousand seven hundred ninety eight) Equity Shares of the Company, of face value of ` 10/- each, fully paid up, to JFE, in accordance with the terms and conditions of the FCD.
Further, pursuant to the decisions taken by the Board of Directors in its meeting held on October 26,2010 and by the Members by way of a Postal Ballot, and in terms of the Subscription Agreement entered into by the Company with JFE, on July 27, 2010, the Share Allotment Committee of Directors of the Company in its meeting held on December 14, 2010 allotted:
a) 9,77,906 (Nine lakhs seventy seven thousand nine hundred and six) Equity Shares of the Company, of face value of ` 10/- each, fully paid up, to JFE, on a preferential basis at a price of ` 1,500/- per Equity Share; and
and fourteen) Equity Shares of ` 10 each, in favour of the local custodian of the Depository i.e. Citibank N.A., underlying equivalent number of non-voting, non-transferable Global Depository Receipts (GDRs) issued to JFE Steel Corporation, Japan.
Accordingly, during the year under review, your Company's paid up equity share capital has increased from ̀ 187,04,86,820 (comprising 18,70,48,682 equity shares of ` 10 each) to ` 223,11,72,000 (comprising 22,31,17,200 equity shares of `10 each).
9. WARRANTS ISSUED TO SAPPHIRE TECHNOLOGIES LIMITED, A PROMOTER GROUP ENTITY ON A PREFERENTIAL BASIS
Pursuant to the decisions taken in the Board meeting held on May 03, 2010 and the Extra Ordinary General Meeting held on June 02, 2010, the Share Allotment Committee of Directors of the Company in its meeting held on June 16, 2010 allotted 1,75,00,000 (One crore
Promoter Group Company, on a preferential basis.
Each warrant entitles the holder to apply for and be allotted one equity share of the Company of par value of ` 10/- each, at a price of ` 1,210/- per equity share, at any time within 18 months from the date of allotment of the warrants, i.e. within December 15, 2011.
During the year under review, the Warrant holder did not exercise the option to convert any of the warrants held by it into equity shares of the Company.
10. TECHNICAL COLLABORATION WITH JFE STEEL CORPORATION, JAPAN
In continuation of the Strategic Collaboration Agreement entered into on November 19, 2009, between the Company and JFE Steel
which represent the next phase of the multi-faceted collaboration plan consistent with the long-term vision of both the parties for future growth were concluded on July 27, 2010.
Pursuant to the execution of the aforesaid agreements on July 27, 2010 between the Company and JFE for the supply of certain technology and the provision of certain technical assistance to the Company, including foreign collaboration agreements, technical assistance agreement for automotive steel and general technical
assistance agreement for plant performance improvement, JFE has become a foreign collaborator of the Company.
This collaboration would help the Company to achieve operational excellence and also move up in the value chain with access to cutting edge technology.
Through this unique collaboration, your Company gains:
Access to cutting edge technologies.
Access to fast-growing automotive market.
Lower cost of production through operational excellence; and
Deleveraged balance sheet to fuel next phase of growth.
11. ACQUISITION OF MAJORITY STAKE IN ISPAT INDUSTRIES LIMITED
Ispat Industries Limited (IIL), with a production capacity of 3.3 mtpa, is inherently seen as a pioneering company that brought new technologies into India like the Twin Shell ConArc furnace and Thin Slab Casting facility. The Twin Shell ConArc furnace provides
the state-of-the-art Compact Strip Mill, Ispat also has an in-house jetty, with a cargo handling capacity of 12 mtpa, which gives it an added advantage.
IIL has been incurring losses constrained by inadequate working capital, lack of integration and expensive debt and has been looking for a strategic investor to carry forward the business and growth of the Company. The Company in turn has been looking at growth opportunities/expansions to reach 34 mtpa by 2020 and has plans to further expand steelmaking capacity in West Bengal and Jharkhand
announced and MOUs executed, however due to challenges towards land acquisition, environmental and various other Government
operations in the near future.
dialogue with the management of IIL for strategic collaboration and arrived at a proposal whereby the Company would acquire a majority stake in IIL.
Accordingly, in accordance with the Subscription cum Shareholders Agreement dated December 20, 2010, the Company has acquired 1,08,66,49,874 equity shares of Ispat Industries Ltd. (IIL) on January 24, 2011 (aggregating to 45.53% of the equity share capital of IIL as on date).
In view of the above, the Company also made a mandatory open offer for the shares of IIL (“Open Offer”) under Regulations 10 and 12 of the Securities & Exchange Board of India (Substantial Acquisition of Shares & Takeovers) Regulations, 1997 (“Takeover Regulations”). The Open Offer was made to the shareholders of IIL to acquire 64,72,38,458 Equity Shares of IIL of face value of ` 10each representing in the aggregate 20% of the Fully Diluted Equity Share Capital of IIL at a price of ` 20.54 (Rupees twenty and paise
to `paid up equity share on March 24, 2011.
The Offer was open from March 17, 2011 to April 05, 2011 during which time the Company received valid applications for sale of 8,99,40,890 equity shares from the shareholders of IIL. The Company has accepted all such valid applications and transferred the full amount of the purchase consideration to the Special Account opened for payment to the successful applicants on April 8, 2011.
Post the above acquisition, the Company holds 1,17,65,90,764 shares representing 49.30% of the total paid-up capital of Ispat Industries Limited as on that date.
16
JSW Steel Limited
Your Company has also put in a systematic plan to turnaround Ispat Industries by developing synergies in the competitive steel market. The Company will also facilitate sourcing of key inputs like coke, pellet and power which will bring down the cost of production substantially. The Company’s extensive Pan India Network will provide IIL with
will reduce the cost of production.
12. SEARCH AND SEIZURE OPERATIONS BY INCOME TAX AUTHORITIES
The Income-tax Authorities carried out a search and seizure operations at certain locations of the Company in March 2011. The Company co-operated with the authorities and various statements were recorded during the course of these operations. The Company has also informed the stock exchanges about the search and seizure operations by the Income-tax Authorities.
The Company has not received any communication from the Income-tax Authorities till date regarding documents seized during the search
the Company. No notice has been received from the Income-tax Authorities till date. The Income-tax Authorities are yet to conclude the search and seizure proceedings on the Company.
13. FOREIGN CURRENCY CONVERTIBLE BONDS (FCCBs)
During the F.Y 2007-2008, your Company had issued 3250 Zero Coupon Foreign Currency Convertible Bonds (FCCBs) of US$ 1,00,000 each due 2012 (ISIN XS0302937031), aggregating to
expenditure programme of the Company. Each Bond is convertible into equity shares of the face value of ` 10 each of the Company at a conversion price of ` 953.40 per share, at any time on or after August 7, 2007 until the close of business on June 21, 2012, unless previously redeemed, converted or purchased and cancelled. The Bonds, which are not redeemed, converted or purchased and cancelled, are redeemable on June 28, 2012 at an amount equal to the principal amount of the Bonds multiplied by 142.801 per cent.
Out of the aforesaid 3,250 Bonds issued, 8 bonds were converted into 33,799 equity shares which were allotted on 4 January 2008.
The Company repurchased and cancelled 15.36% of its remaining outstanding Zero Coupon Foreign Currency Convertible Bonds of US$ 1,00,000 each, aggregating to US$ 49.80 million (US$ 47.80 million in March 2009 and US$ 2 million in April 2009) in accordance with the A.P. (DIR Series) Circular No. 39 dated December 8, 2008 issued by the Reserve Bank of India.
The principal amount of Bonds outstanding after this repurchase and cancellation is US$ 274.40 million.
14. DIRECTORS
Mr. Seshagiri Rao M.V.S, Mr. Sudipto Sarkar, Mr. Jayant Acharya and Mr. Kannan Vijayaraghavan, Directors, retire by rotation at the forthcoming Annual General Meeting and being eligible, offer themselves for re-appointment.
The proposals regarding the re-appointment of the aforesaid Directors are placed for your approval.
Other changes in the Board of Directors of your Company during the year under review are as follows:
JFE Steel Corporation nominated Mr. Shigeru Ogura as its nominee on the Board of your Company w.e.f. September 08, 2010. Subsequently, JFE nominated Mr. Yasushi Kurokawa as its nominee on the Board of the Company, in place of Mr. Ogura w.e.f. May 16, 2011.
Karnataka State Industrial Investment and Development Corporation Limited (KSIIDC) nominated Mr. M. Maheshwar Rao, IAS as its nominee on the Board of your Company in place of Mrs. Vandita Sharma, IAS w.e.f. February 04, 2011.
Your Directors place on record their deep appreciation of the valuable services rendered by Mr. Shigeru Ogura and Mrs. Vandita Sharma, IAS during their tenure as Directors of the Company.
15. AUDITORS
M/s. Deloitte Haskins & Sells, Chartered Accountants, auditors of the Company, retire at the conclusion of the ensuing Annual General Meeting and have expressed their willingness to act as auditors of
appointment would be in conformity with the provisions of Section 224 (1B) of the Act.
16. PARTICULARS REGARDING CONSERVATION OF ENERGY AND TECHNOLOGY ABSORPTION
Information in accordance with the provisions of Section 217(1)(e) of the Companies Act, 1956 read with Companies (Disclosure of Particulars in the Report of the Board of Directors) Rules, 1988 regarding conservation of energy, technology absorption and foreign exchange earnings and outgo is given in the statement annexed (Annexure “A”) hereto forming part of the report.
17. ENVIRONMENTAL INITIATIVES
The Company has undertaken various measures to address environmental issues at its Plant Locations:
Environment Control Laboratories have been developed for carrying out monitoring of water, waste-water and air pollutants. The monitoring carried out includes ambient air, stack and in-
Every effort is made to prevent pollution by recycling solid wastes and liquid treated waste-water for reuse in the premises.
18. PARTICULARS OF EMPLOYEES
The information required under Section 217(2A) of the Companies Act, 1956 read with the Companies (Particulars of Employees) Rules, 1975 is set out in the Annexure to the Directors’ Report. Having regard to the provisions of Section 219(1)(b)(iv) of the said Act, the Annual Report excluding the aforesaid information is being sent to all the members of the Company and others entitled thereto. Any member interested in obtaining such particulars may write to the Company Secretary for a copy.
19. AWARDS AND ACCOLADES
Your Company and its employees received the following awards during the year:
1. PM’s Trophy Award: (Runners-up Trophy known as Steel Minister’s Trophy) for the best performing integrated Steel Plant in the country for the year 2007-08, awarded on July 31, 2010.
2. National Award for Excellence in Energy Management 2010:Award for Excellence in Energy Management 2010 conducted by CII – Godrej GBC on September 1 & 2, 2010 at Chennai Trade Centre, Chennai.
3. National Sustainability Award 2010: First Prize amongst the Integrated Steel Plants Category. The award was presented at 48th National Metallurgists’ Day Celebrations and 64th Annual Technical Meeting of Indian Institute of Metals, on November 14, 2010 at Bangalore.
17
Annual Report 2010-11
4. CII-EXIM Award 2010: Achievement” for Business Excellence by Confederation of Indian Industries, on November 14, 2010 at Bangalore.
5. National Award for Excellence in Water Management 2010:
for Excellence in Water Management 2010 conducted by CII, on December 10 & 11, 2010 at Hyderabad.
6. IMC Ramkrishna Bajaj National Quality Award 2010:
March 16, 2011 at Mumbai.
7. Global HR Excellence Award 2010 for Innovative HRPractices3, 2010 at Bangalore.
8. Best Practices in Talent Management Award at Talent 2010 hosted by Osney Media Ltd on November 10 & 11, 2010 at London.
9. “Institution Building Award” at Global HR Excellence Awards World HR hosted by World HR Congress on February 11, 2011 at Taj Lands End, Mumbai.
Individual and Team Recognitions:
1. Mr. Seshagiri Rao M.V.S, Jt. Managing Director & Group CFO was awarded ‘the Best Performing CFO in Metals & Commodities Sector’ by CNBC TV18 at a glittering ceremony in Mumbai on October 27, 2010.
2. Ms. Sharmila Bannerjee, Vice President- Corporate Communication, was awarded ‘WILLS Womens Choice Award’ in Mumbai on October 28, 2010.
3. Mr Prachethan Kumar, Manager (R&D and SS), was conferred with 'Young Metallurgist of the Year Award - 2010' at the 48th National Metallurgists' Day Celebrations held on November 14, 2010 at Bangalore.
20. CORPORATE GOVERNANCE
Your Company has complied with the requirements of Clause 49 of the Listing Agreement regarding Corporate Governance. A report
compliance of mandatory requirements thereof and Management Discussion and Analysis are given as an annexure to this report.
21. DIRECTORS' RESPONSIBILITY STATEMENT
Pursuant to the requirements under Section 217 (2AA) of the
(i) in the preparation of the annual accounts, the applicable accounting standards have been followed along with proper explanation relating to material departures;
(ii) they have selected such accounting policies and applied them consistently and made judgements and estimates that are reasonable and prudent so as to give a true and fair view of the
adequate accounting records in accordance with the provisions of this Act for safeguarding the assets of the Company and for preventing and detecting fraud and other irregularities;
(iv) they have prepared the annual accounts on a going concern basis.
22. APPRECIATION
Your Directors take this opportunity to express their appreciation for the cooperation and assistance received from the Government of India, Republic of Chile, Central Government of Mozambique, USA and UK; the Government of Karnataka, Maharashtra, Tamil Nadu,
as the shareholders and debenture holders during the year under review. The Directors also wish to place on record their appreciation of the devoted and dedicated services rendered by all employees of the Company.
Date: May 16, 2011
For and on behalf of the Board of Directors
Savitri Devi JindalChairperson
18
JSW Steel Limited
PARTICULARS REQUIRED UNDER THE COMPANIES (DISCLOSURE OF PARTICULARS IN THE REPORT OF BOARD OF DIRECTORS) RULES, 1988.
A. CONSERVATION OF ENERGY
The company has taken up various initiatives to conserve energy across all locations during the year under review.
Energy conservation initiatives at Vijayanagar:
system – a server-based technology – which balanced generation with consumption and allowed simulation of all possibilities of islanding – resulting in proactive alarms for disturbances, facilitating immediate remedial measures.
ID Fan at the top of the converter with a variable voltage and variable frequency fan, reducing fan speed when there was no blowing of oxygen into the converter.
transformer to prevent damage of electronic equipment of the users attached to the busbar, the Company has developed an
energy to the neutral earth transformer in the event of a massive
plant by reducing idle heating hours in the pellet plant through improved energy management practices.
pass electrical actuator with hydraulic high capacity actuator, facilitating 94% of BF gas to pass through to the turbine installed at the top of BF3.
rate.
2009-10 to 99.45 MW.
increase of Corex gas utilisation from 97.75% in 2009-10 to 98.92% during the previous year.
unit, improving coke oven gas utilisation.
which facilitates real-time monitoring of gas generation and consumption, enabling optimisation of gas consumption across the plant.
Annexure ‘A’ to Directors’ Report
3.8 mtpa iron-making zone with additional coke oven gas (with the commissioning of coke oven 4).
Energy conservation initiatives at Salem:
Blast Furnace-II to monitor the gas distribution through temperature
saving in energy by altering the material distribution during charging.
coke saving & energy saving.
bed permeability.
Energy conservation initiatives at Vasind/ Tarapur:
process units. This has a saving potential of ` 0.74 crore annually.
B. TECHNOLOGY ABSORPTION, ADOPTION AND INNOVATION
Efforts made in Technology Absorption are given in Form ‘B’.
C. FOREIGN EXCHANGE EARNINGS AND OUTGO
a) Activities relating to exports, initiatives taken to increase exports, development of new export markets for products and services and export plans:
Exports have always been a strategic move of the Company with a clear focus on Value-Addition, Customization and expanded geographical reach. In spite of demand contraction
exported 0.891 million tonnes expanding its reach to five continents.
b) Total foreign exchange used and earned:(` in crores)
FY 2010-11 FY 2009-10
i) Foreign Exchange earned 3,412.68 2,772.02
ii) Foreign Exchange used 11,095.74 8,897.74

19
Annual Report 2010-11
FORM ‘A’FORM FOR DISCLOSURE OF PARTICULARS WITH RESPECT TO
CONSERVATION OF ENERGY
A POWER & FUEL CONSUMPTION
Particulars 2010-11 2009-101. Electricity
a) PurchasedUnit (kwh) (in Lacs) 9092.11 17435.20Total Amount (` in crores) 355.22 614.45Rate/Unit (`) 3.91 3.52
b) Own Generationi) Through Captive power plant
Unit (kwh) (in Lacs) 31778.45 22049.70Total Amount (` in crores) 1,028.42 578.50Cost/Unit (`) 3.24 2.62
ii) Through diesel generatorUnit (kwh) (in Lacs) 259.61 562.59Unit per ltrs of diesel 0.98 2.55 Total Amount (` in crores) 16.35 29.91 Cost/Unit (`) 6.30 5.32
iii) Through Top Recovery Turbine Units (kwh) (in lacs) 735.86 68.63 Total Amount (` in crores) 2.63 0.44 Cost/Unit (`) 0.36 0.64
2. Coal + Coke Quantity (tonnes) 74,46,195 t 68,47,016 t
of Coal of Coal+ +
3,57,169 t of Coke
5,37,727 t of Coke
Total Amount (` in crores) 8,328.21 6,230.90 Coal Rate (`/t) 10196 7996Coke Rate (`/t) 20606 14056
3. Furnace OilQuantity (K.Ltrs ) 7508 12625Total Amount (` in crores) 20.63 32.60 Average Rate (`/Ltrs) 27.48 25.82
4. LPGQuantity (tonnes) 24077 24218Total Amount (` in crores) 98.61 80.90
Average Rate (`/t) 40956 33405
B CONSUMPTION PER UNIT OF PRODUCTION
Particulars 2010-11 2009-10
1. Crude Steel
Electricity (kwh/t) 495 510
LPG (Kg/t) 0.8 1.0
2. Hot Rolled Coils/Steel plates/ sheets:
Electricity (kwh/t) 105 80
3. Rolled Products – Long
Electricity (kwh/t) 153 181
4. Galvanised Coils/Sheets:
Electricity (kwh/t) 195 198
LPG (Kg/t) 17 18
Form ‘B’FORM OF DISCLOSURE OF PARTICULARS WITH RESPECT TO
TECHNOLOGY ABSORPTION
RESEARCH AND DEVELOPMENT (R&D)
Company:
Research and Development activities were focused towards Plant Performance Improvement (PPI), Development of new Processes, Development of new Products, Energy Conservation and Waste
locations at JSW, R&D sub-centers have been created at Vasind, Tarapur and Salem.
R&D initiatives towards PPI covered the entire spectrum of processing
ore, Iron Making in Corex and Blast Furnace, Steel Making, Hot and Cold Rolling. New processes were developed aiming at recycling of
agglomerating it into briquettes. Another important milestone in waste utilization was achieved by developing use of BOF slag in cement making. Several new products were developed to create additional market for JSW Steels.
R&D was also carried out for development of value added products in
in various sectors, including:Automotive grade steels for external and internal applications.Silicon steel – non oriented.Line pipe steels, including API X-70, X-80.Corten steel.Micro alloyed and Structural grades.
Reduction in fuel rate and slag rate in Corex by 30 kg/thm and 27 kg/thm respectively and increase in melting rate by 3 tph by adopting high alumina slag practice.
45% to 46.6% resulting in reduction in fuel rate by 1.9 kg/thm.
Improvement in service life of back-up rolls at Hot Strip Mill-1 by reducing the grinding losses by 10%.
consistently achieve coke CSR of 65 and above.
productivity and availability of Corex furnace, besides reduction in fuel consumption.
Process development furnace for usage of coal-tar-pitch as a replacement of water for coal-cake preparation. This has potential for improvement in coke CSR by 2-3 points, increase in gas and power generation and savings of water.
Optimization of coal-blend characteristics for safe oven-wall-pressure operation. It is possible to increase MMR of coals from present limit of 1.12 to 1.15, thereby enhancement in choice of coals for coke-making.
Improvement in steel quality by developing a Model for sulphur prediction at Hot Metal De-sulphurization station.
Improvement in pelletizing disk yield from 80% to 88% through optimization of disk angle, speed and water distribution.
Improvement in quality of pellet, such as CCS and RDI, by way of
increase in pellet size from 11.2 to 12 mm in the hearth-layer.

20
JSW Steel Limited
Process development for briquetting of iron-bearing wastes, such as mill-scale, BOF-sludge, slime, etc. for value added application in steel making.
Development of mathematical models for prediction of
Irregularities in the Blast Furnace 2, such as channeling
Silicon in hot metal at BF-2
3. Plan of action for 2011-12
of low grade iron ore and BHQ, agglomeration through Sintering, Pelletizing and Extrusion, water modeling for steel making, vacuum induction melting system, advanced characterization, etc. Plant performance initiatives include improvement in roll cooling system for HSM, process development for utilization of wastes, accelerated cooling system, etc. The plan covers development of products for automobile applications, line pipe steels, etc.
4. Expenditure on R&D (2010-11)(` in crores)
Vijayanagar Salem Vasind/Tarapur Total
Capital 41.72(7.11)
-(-)
0.72(0.31)
42.44(7.41)
Recurring 3.85(3.23)
1.88(1.94)
1.51(0.77)
7.24(5.94)
TOTAL 45.57(10.34)
1.88(1.94)
2.23(1.08)
49.68(13.35)
Technology Absorption, Adoption and Innovation
1. Vijayanagar:
in recovery at Beneficiation Plant 1. The technology was provided by M/S Ingwenia Private Ltd, Bangalore.
2. Vasind and Tarapur:
wide GC sheets has been commissioned. This machine is
with variable speed, automatic roller type stacker arrangement which can cut up to 16 ft. length sheet, 4 ft GC product has tremendous future market potential. The main advantage of the
In hot rolling plate mill, plate’s length measuring device designed, manufactured and installed. This enables better length accuracy
Permanent electro-magnet installed in two cranes of Hot Rolling Plate mill. This upgrades the safety level in the plant.
New Belt wrapper assembly commissioned in Galvanizing line for good surface quality and yield improvement of GI products.
Auto soot blowing system developed and installed in one of the
3. Imported Technologies
Innovation/Technology Year of Import/
Absorption
Status of Implementation
Slag granulation in SMS 1 & 2. Technology provided by Bao Steel, China
2010 Commissioned
Ladle Heating Furnace (LHF) No. 5 of SMS-2, supplied by SMS Siemag
2010 Commissioned
Technology provided by Metso Minerals, Germany
2010 Commissioned
Captive Power Plant (CPP) No. 3. Technology provided by Shanghai Electric Co., China
2010 Commissioned
Sinter Plant 3. Technology provided by Outo tech, Germany
2011 Commissioned
Lime Calcination Kiln No. 8. Technology provided by Cimprogetti, Italy
2011 Commissioned
Coke Oven 4 – Battery A and B. Technology supplied by M/S Sino Steel/MECC, China
2011 Commissioned
Slab Caster No. 4 in SMS 2, supplied by SMS Siemag, Germany
2011 Commissioned
Gas holder for SMS-2, supplied by SMS Siemag, Germany
2011 Commissioned
BOF Converter ‘F’. Technology supplied by SMS Siemag, Germany
2011 Commissioned
Pot Sinter Testing Lab for R&D. Supplied by M/S East Sea Corporation, Korea
2011 Commissioned
Coal Briquetting Plant for Corex. Technology supplied by M/S East Sea Corporation, Korea
2011 UnderCommissioning

21
Annual Report 2010-11
Management Discussion and Analysis(A) ECONOMY AND STEEL SECTOR
(1) Global Economy
Overview
The global economy expanded by 5.0% in 2010 as against 0.5% in 2009. This recovery was characterised by:
1) Moderate growth in advanced economies, spurred by stimulus measures. Private consumption which fell sharply during the crisis picked up.
2) Growth in emerging and developing economies remained robust buoyed
domestic demand.
3) Global liquidity improved, credit spreads narrowed, equity and debt capital markets opening up enabling several corporations to raise capital to meet funding requirements.
Challenges
Pockets of vulnerability persisted; real-estate markets and household incomes remained weak in some major advanced economies. Volatility and uncertainty re-emerged in Euro area.
crisis in Ireland, Spain, Greece and Portugal led to unprecedented widening of credit spreads for these countries.
The turmoil in mid-2010 in the Euro zone led to a spike in global risk aversion and scaling back of capital allocation by fund managers to emerging markets.
primarily to the periphery of the Euro area. Quantitative easing and stimulus
and started pursuing a hawkish monetary policy by raising reserve ratios and hiking policy rates.
economic growth. Floods, earthquakes and drought among others took a massive toll on human life, resulting in wealth erosion.
GDP Growth
2009 2010Global (0.50)% 5.0%
Advanced economies (3.40)% 3.0%
Emerging economies 2.70% 7.3%
Size of the global economy (US$ tr) 57.90 62.90
Source: IMF
Estimates for 2011
The global economy is on a recovery path while Advanced economies are expected to pick up growth momentum. The emerging economies will
rather then pursuing growth.
Advanced economies:packages passed in late 2010 in the US and Japan will boost economic growth in 2011. Although growth in the periphery of the euro area is marked down for 2011, this will offset by an upward revision in economic growth in Germany, owing to stronger domestic demand.
Emerging and developing economies: In 2011, growth in emerging and developing economies is expected to be at 6.5%, a modest drop from 7.30% registered in 2010. Developing Asia will continue with its rapid growth. Other emerging regions are expected to continue their strong rebound; notably, growth in sub-Saharan Africa – projected at 5.5% in 2011 – higher than the economic growth in all other regions, except developing Asia.
(2) Global Steel Industry
Snapshot (2010)
Capacity Production Trade (approx.) Consumption
1,906MnT
1,414MnT
380MnT
1,283MnT
+6% +15% +15% +13.1%
Source: World Steel Association/ISSB
The CY 2010 could be rated as the year of ‘broad based recovery’, in terms of economic revival, steel production, trade and consumption, except the threat of sovereign defaults in parts of Europe. Besides, weather extremities namely,
also causes of concern.
The Global Steel Industry reached a new high in 2010 after a disastrous 2008. The global demand growth was at 13% after a steep fall in 2008. Asia was the leading steel producer with a 64% share in the global crude steel production.
crude steel production.
The steel demand in advanced economies recovered, stimulated from social spending by governments, the demand in rest of the world, including China continued to expand.
CY 2007 CY 2008 CY 2009 CY 2010
Modest Excitement Panic Pain Recovery
900
1000
1100
1200
1300
1400
1500
Jan-11OctJul
Apr
Jan-10OctJul
Apr
Jan-09OctJul
Apr
Jan-08OctJul
Apr
Jan-07
1346-MnT 1327-MnT 1229-MnT 1414-MnT
+7.9% (1.4%) (7.4%) +15%
Source: World Steel Association
The contribution of emerging economies to the growth in world steel production and consumption is evident as stated hereunder:
World crude steel production : +184 MnT (+15% YoY) with advanced market economies contributing ~45% while emerging market economies excl. China at 26% and China at 29%.
market economies contributing 41% while emerging market economies excl. China at 40% and China at 19%.
Surplus production from China and advanced economies was absorbed by growing imports from rest of the emerging world.
Production
In 2010, global steel production grew 15%, to 1,414 MnT. The growth is
in the last quarter of 2008 (due to the global economic crisis). The growth in 2010 exceeded the previous record set in 2007. Interestingly, the most
it had contracted the maximum in 2008 and 2009, namely North America, Europe and Japan. Despite the considerable rebound, steel production in these nations remained below the pre-crisis levels.
Region 2009 (MnT) 2010 (MnT) Variance (%)EU-27 138.8 172.9 24.6%Europe (others) 29.1 33.5 15%CIS 97.6 108.5 11.2%North America 82.4 111.8 35.7%South America 37.8 43.8 15.9%Africa 15.2 17.5 15.4%Middle East 17.7 19.6 11.0%Asia 804.9 897.9 11.6%Oceania 6.1 8.1 35.5World 1,229 1,414 15.0%China 573.6 626.6 9.3%World-China 655.4 787.4 20.1%
Source: World Steel Association

22
JSW Steel Limited
Consumption
consumption in emerging and advanced economies grew 9.1% and 25% respectively in 2010.
Region 2009 (MnT) 2010 (MnT) Variance (%)
EU-27 119.5 144.8 21.2%
Europe (others) 23.9 29.6 23.8%
CIS 36.1 48.5 34.3%
North America 82.9 110.3 33.0%
South America 33.6 45.8 36.4%
Africa 26.8 25.9 (3.6)%
Middle East 42.2 45.3 7.2%
Asia 763.1 825.1 8.1%
Oceania 6.1 7.3 24.2%
World 1,134 1,283 13.1%
China 548 576 5.1%
World-China 586 707 20.6%
Source: World Steel Association
Global Steel Trade
diagram below -- EU-27, Asia, NAFTA had the highest internal trade at 71%,
of steel trade across the globe due to restrictive trade practices being followed by certain countries.
Changing power concentration
In 1980, four among the world’s top ten producers of steel were the Japanese cumulatively accounting for 10% share of global steel production. In 1999, a Chinese steel manufacturer ranked in the top ten. Today, six of the world’s top ten steelmakers are Chinese with 16% share of global steel production.
(3) China
China following the global crisis shifted focus towards domestic demand reducing the dependency on exports Consequently, the national economy showed good momentum. Preliminary estimates suggest that GDP grew by 10.3% in 2010, 110 bps higher than previous year’s benchmark.
Growth in every quarter
Q1/2010 Q2/2010 Q3/2010 Q4/2010GDP growth (%) 11.9 10.3 9.6 9.8
There was an overall improvement in the Chinese economy with all sectors making sizeable contribution to the economic growth.
Industry growth: Industrial production grew over 15.7% in 2010 against 11% in 2009.
Per capita income: In 2010, the per capita income of urban households was 21,033 yuan, an increase of 11.5% over the previous year. Of this total, the per capita disposable income of urban residents was 19,109 yuan, up by 11.3%. The per capita net income of rural residents was 5,919 yuan, up by 14.9% over the previous year.
6
8
10
12
14
6
8
10
12
14
20112010200920082007
CHINA GDP GROWTH RATE13
12.6
11.5
Annual GDP Growth Adjusted by Inflation
11.210.6
10.1
9
6.86.2
9.1
10.7
11.9
10.39.6 9.8
7.9
Source: Trading economics.com (NBS)
Estimates for 2011
Being an export-dependent economy, China focused on strengthening domestic demand to sustain its growth – evident from the Twelfth Plan recently announced by the government.
Eleventh Plan Twelfth Plan guidanceReformation aimed at national economic growth
Reformation aimed at enhancing people’s prosperity
Capitalised consumption of AME’s for economic growth
Leverage domestic demand for economic growth
Quantitative approach Qualitative approach
Global integration Domestic regional integration
a challenge for emerging economies worldwide. The Government is working
innovation in the manufacturing sectors. The government is also focused on increasing private sector participation in all service sectors. This is expected to marginally impact the nation’s GDP growth in the short term, ensuring long-term economic prosperity – Estimates suggest China’s GDP to grow at 9% in 2011.
Housing the economically weaker sections
In 2011, the Government plans to build 10 million affordable homes, compared to 5.9 million started in 2010.
China’s Steel Sector
Snapshot (2010)
Capacity Production Import Export Net export Consumption788 MnT 627 MnT 17.0 MnT 42.7 MnT 25.7 MnT 576 MnT
+6% +9% (38%) +22% – +5%
Source: World Steel Association/ MySteel
From the late 90’s, China, through its market and social reform programmes, emerged on the world steel map and has since graduated to the largest steel player in the world. The previous decade was the game changer for the Chinese steel industry, with crude steel production growing at 17% CAGR against the world average of 5% CAGR over the same period. China’s dominance in the world steel production increased from 15% of the global market in 2000 to a commanding 44% in 2010.
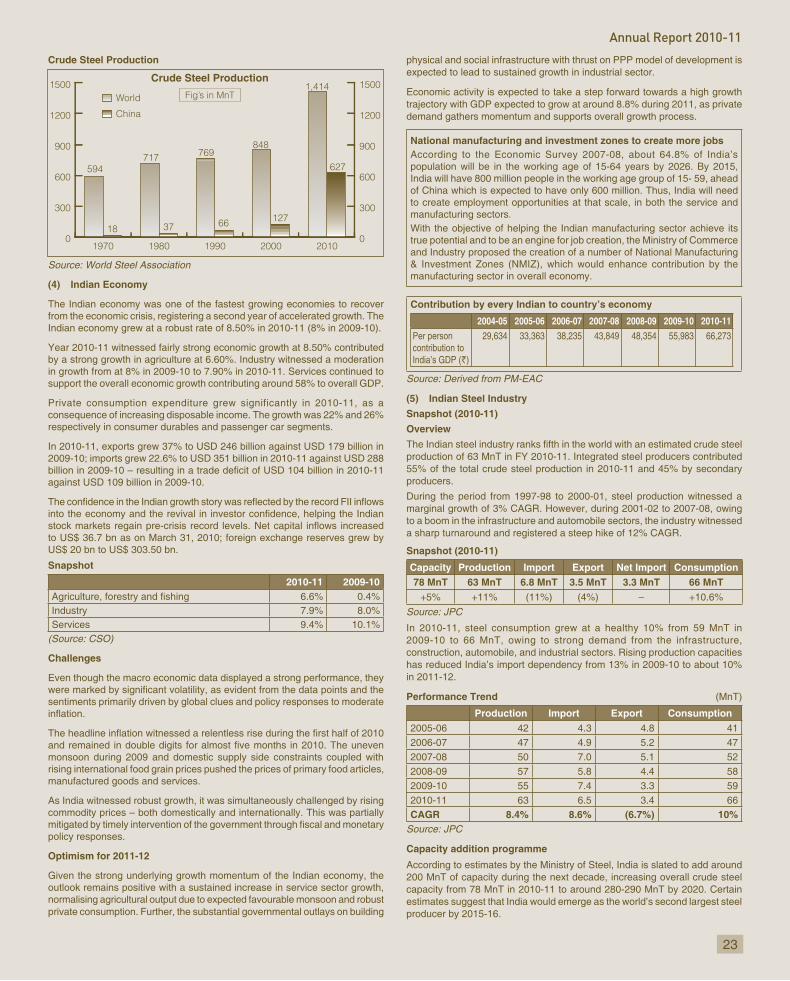
23
Annual Report 2010-11
Crude Steel Production
0
300
600
900
1200
1500
0
300
600
900
1200
1500
20102000199019801970
594
World
China
18 37 66 127
627717
Crude Steel Production
Fig’s in MnT
769848
1,414
Source: World Steel Association
(4) Indian Economy
The Indian economy was one of the fastest growing economies to recover from the economic crisis, registering a second year of accelerated growth. The Indian economy grew at a robust rate of 8.50% in 2010-11 (8% in 2009-10).
Year 2010-11 witnessed fairly strong economic growth at 8.50% contributed by a strong growth in agriculture at 6.60%. Industry witnessed a moderation in growth from at 8% in 2009-10 to 7.90% in 2010-11. Services continued to support the overall economic growth contributing around 58% to overall GDP.
Private consumption expenditure grew significantly in 2010-11, as a consequence of increasing disposable income. The growth was 22% and 26% respectively in consumer durables and passenger car segments.
In 2010-11, exports grew 37% to USD 246 billion against USD 179 billion in 2009-10; imports grew 22.6% to USD 351 billion in 2010-11 against USD 288
against USD 109 billion in 2009-10.
to US$ 36.7 bn as on March 31, 2010; foreign exchange reserves grew by US$ 20 bn to US$ 303.50 bn.
Snapshot
2010-11 2009-106.6% 0.4%
Industry 7.9% 8.0%Services 9.4% 10.1%
(Source: CSO)
Challenges
Even though the macro economic data displayed a strong performance, they
sentiments primarily driven by global clues and policy responses to moderate
monsoon during 2009 and domestic supply side constraints coupled with rising international food grain prices pushed the prices of primary food articles, manufactured goods and services.
As India witnessed robust growth, it was simultaneously challenged by rising commodity prices – both domestically and internationally. This was partially
policy responses.
Optimism for 2011-12
Given the strong underlying growth momentum of the Indian economy, the outlook remains positive with a sustained increase in service sector growth, normalising agricultural output due to expected favourable monsoon and robust private consumption. Further, the substantial governmental outlays on building
physical and social infrastructure with thrust on PPP model of development is expected to lead to sustained growth in industrial sector.
Economic activity is expected to take a step forward towards a high growth trajectory with GDP expected to grow at around 8.8% during 2011, as private demand gathers momentum and supports overall growth process.
National manufacturing and investment zones to create more jobsAccording to the Economic Survey 2007-08, about 64.8% of India’s population will be in the working age of 15-64 years by 2026. By 2015, India will have 800 million people in the working age group of 15- 59, ahead of China which is expected to have only 600 million. Thus, India will need to create employment opportunities at that scale, in both the service and manufacturing sectors.
With the objective of helping the Indian manufacturing sector achieve its true potential and to be an engine for job creation, the Ministry of Commerce and Industry proposed the creation of a number of National Manufacturing & Investment Zones (NMIZ), which would enhance contribution by the manufacturing sector in overall economy.
Contribution by every Indian to country’s economy
2004-05 2005-06 2006-07 2007-08 2008-09 2009-10 2010-11Per person contribution to India’s GDP (`)
29,634 33,363 38,235 43,849 48,354 55,983 66,273
Source: Derived from PM-EAC
(5) Indian Steel Industry
Snapshot (2010-11)
Overview
production of 63 MnT in FY 2010-11. Integrated steel producers contributed 55% of the total crude steel production in 2010-11 and 45% by secondary producers.
During the period from 1997-98 to 2000-01, steel production witnessed a marginal growth of 3% CAGR. However, during 2001-02 to 2007-08, owing to a boom in the infrastructure and automobile sectors, the industry witnessed a sharp turnaround and registered a steep hike of 12% CAGR.
Snapshot (2010-11)
Capacity Production Import Export Net Import Consumption78 MnT 63 MnT 6.8 MnT 3.5 MnT 3.3 MnT 66 MnT
+5% +11% (11%) (4%) – +10.6%
Source: JPC
In 2010-11, steel consumption grew at a healthy 10% from 59 MnT in 2009-10 to 66 MnT, owing to strong demand from the infrastructure, construction, automobile, and industrial sectors. Rising production capacities has reduced India’s import dependency from 13% in 2009-10 to about 10% in 2011-12.
Performance Trend (MnT)
Production Import Export Consumption2005-06 42 4.3 4.8 41
2006-07 47 4.9 5.2 47
2007-08 50 7.0 5.1 52
2008-09 57 5.8 4.4 58
2009-10 55 7.4 3.3 59
2010-11 63 6.5 3.4 66
CAGR 8.4% 8.6% (6.7%) 10%Source: JPC
Capacity addition programme
According to estimates by the Ministry of Steel, India is slated to add around 200 MnT of capacity during the next decade, increasing overall crude steel capacity from 78 MnT in 2010-11 to around 280-290 MnT by 2020. Certain estimates suggest that India would emerge as the world’s second largest steel producer by 2015-16.

24
JSW Steel Limited
Capacity Build-Up
Sate MoU’s Capacity (MnT)
Orissa 49 75.66
Jharkhand 65 104.23
Chattisgarh 74 56.61
West Bengal 12 21.00
Others 22 18.20
Total 222 275.20
Source: Ministry of Steel
Per Capita Consumption
consumption of 54 kg, compared with 430 kg in China and 187 kg globally. Interestingly, India’s per capita steel consumption in rural locations is only 13 kg, with 70% of Indians residing in these areas. The government is making efforts to leave adequate income in the hands of the rural masses through attractive procurement prices for agricultural produce and NREGA scheme. Rural markets are expected to emerge as a huge opportunity for increasing steel consumption in the coming years.
India’s Per Capita apparent steel consumption comparison C.Y. 2010/FY 2010-11
(Kgs)
China Japan The US Brazil Russia India430 502 259 132 256 54
Demand guidance
66 MnT2010-11
120 MnT2015-16
200 MnT2020-21
+13% +11%
Demand drivers for steel in India
Others6%
Construction & Infrastructure
62%Auto & Auto Components
10%
Capital Goods12%
White Goods5%
Packging5%
Source: E&Y
i) Construction and Infrastructure
Infrastructure is the key to sustain India’s economic growth. The challenge of successfully leaping over the “double digit growth barrier”, can be overcome only through higher investment in infrastructure.
The Eleventh Five Year Plan emphasised the importance of investment in infrastructure for achieving a sustainable growth of 9 to 10% in GDP over the next decade. In this context, it envisaged an increase in investment in physical infrastructure from about 5% of GDP witnessed during the Tenth Plan to about 9% of GDP by 2011-12 (terminal year of the Eleventh Plan). This requires an estimated investment of ̀ 20,56,150 crores (US$ 514 bn) during the Eleventh Plan period as compared to an estimated investment of ` 8,71,445 crores (US$ 218 bn) during the Tenth Plan period. An ambitious target of ̀ 40,99,240 crores (US$ 1,025 bn) has been set for the Twelfth Five Year Plan.
well exceeded the target of ` 9,81,119 crores. The actual investment was `10,65,828 crores, which is 7.1% of the GDP and 9% over the planned expenditure. Investments in the power, telecommunications, irrigation and Oil and Gas pipelines have exceeded the target during this period.
0
100000
200000
300000
400000
500000
600000
2011-122010-112009-102008-092007-085.0
5.5
6.0
6.5
7.0
7.5
8.0
8.5
9.0
Investment (` Cr.) % GDP
The total bank lending to infrastructure has gone up from 12.5% of total non-food credit at end-March 2010 to 14.4% by end-Feb, 2011, registering an impressive growth of 34%.
ii) Capital Goods
The development of a strong and vibrant engineering and capital goods sector has been at the core of the industrial strategy in India, since the planning process was initiated in 1951. The emphasis that this sector received was
led industrialisation, by developing the core engineering and capital goods sector. Following the liberalization of Indian economy in 1991, private sector participation increased manifold in this sector thus accelerating the strong momentum.
India has a strong engineering and capital goods base today. The Indian capital goods sector is characterised by a large range of products (almost all major capital goods are domestically manufactured) – a legacy of the import substitution policy. Even nations with technologically advanced capital goods sectors do not produce the entire range of capital goods, but instead focus on segments, or sub segments.
The engineering sector employs about 2.6 million people directly, which accounts for 29% of the total workforce engaged in the organised sector. The industry is largely dominated by organised players, as the sector demands a high level of investment.
India’s contribution to engineering exports constitute only 0.8% of the world. Total exports of engineering products grew from about US$ 13.2 billion in 2004-05 to US$ 60.15 billion constituting around 25% of total exports from India registering a growth of 29%. A target of US$ 125 billion for engineering exports was set by the Ministry of commerce for the year 2013-14.
The growing industrialisation and demand from the various infrastructure sectors synergised the growth of the capital goods industry. The capital goods sector in the country registered a growth of 15% in 2010-11.
100
120
140
160
180
200
220
240
260
280
300
2010-112009-102008-092007-082006-072005-06
Index of Capital Goods v/s IIP
IIPCapital Goods
Source: CSO
Since 100% FDI is permitted through the automatic route and considering the growth potential in India, several international players entered the Indian engineering sector, thereby increasing the competitiveness of the industry.
iii) Auto and Auto Components
In India, there are 100 people per vehicle, compared to 82 in China. The Indian automobile industry is expected to achieve mass motorisation status by 2014-15.

25
Annual Report 2010-11
The brilliant performance of the automotive sector is attributed to improving
the emergence of India as a manufacturing hub for the automotive industry. Some of the unique features of the Indian automobile Industry are as under:
capacities.
cars.
OEM’s.
Germany, Korea and Brazil.
Subsequent to liberalisation, the automobile sector has been aptly described as the ‘sunrise sector’ of the Indian economy since it has witnessed tremendous growth. At present 100% FDI is permissible under automatic route in this
billion during 2010-11 (Apr-Feb). Since 1991, the number of manufacturing facilities in the automobile sector in India has grown progressively in line with the growing demand in the country. The auto manufacturers are investing to increase manufacturing capacity from present 3.6 Mn units to 4.5 Mn units.
Company Capacity (‘000 No’s) % Share
2010-11 2011-12 2010-11 2011-12
Maruti Suzuki 1,000 1,250 28.1% 27.6%
Hyundai Motors 600 700 16.9% 15.5%
Tata Motors 620 620 17.4% 13.7%
General Motors 225 225 6.3% 5.0%
Ford India 200 200 5.6% 4.4%
FIAT 100 100 2.8% 2.2%
Honda Siel 160 240 4.5% 5.3%
M&M 200 500 5.6% 11.1%
Nissan 200 400 5.6% 8.8%
Others 254 287 7.1% 6.3%
Total 3,559 4,522 100% 100%
The domestic sales of auto industry achieved a growth of 26% during 2010-11. Exports constitute around 12% of total sales, registering a growth of 30% in 2010-11. The trend in production and sales growth of the automobile industry is as under:
0
4
8
12
16
20
2010-112009-102008-092007-082006-072005-060.0
0.5
1.0
1.5
2.0
2.5
Production Dom. Sales Export Sales
Figures in Millon Units
Pro
duc
tion
& S
ales
Exp
ort S
ales
Source: SIAM
Challenges
Iron ore: Although, India has the world’s 8th largest reserve of iron ore and is the 4th largest iron ore producer globally, it exports about 54% of its production to other steel making nations – draining the nation of this precious natural resource and simultaneously importing steel from other countries. Since iron ore mines are not alloted to steel producers or approval for mining leases are delayed inordinately for value addition, no meaningful investment on the ground in the steel sector is happening to add new steel capacities.
Coking coal: A primary ingredient for steel making, is in short supply. It accounts for only 12% of India’s total coal reserves. Further, government delays in allotting coal blocks for captive consumption by steel manufacturers is severely impacting the competitive edge of the Indian steel sector. India’s coking coal imports surged 39% between 2009-10 to 2010-11. This refelects the import dependency of 62% in 2010-11. The import of coking coal is expected to go up to 42 MnT by 2011-12 from the current level of 32 MnT. As an alternative solution, Indian steel producers acquired or on the lookout to acquire coal assets globally. As the operationalization of these assets takes considerable time, steel producers are beset with the problem of shortage of coking coal and they are constrained to import most of this coking coal requirement at exhorbitant prices.
Water: 1 tonne of steel production requires around 2.6 cubic metres of water,
Logistics:
is of immense importance for the Indian steel sector for a number of reasons 1) raw material needs to be met largely through imports, 2) steel consumption
to consumption locations and 3) high logistics costs make transportation a huge challenge. The Indian railway network is inadequate; rakes are in short supply and port infrastructure is unable to cope up with increased volumes. Increasing fuel prices makes road transport costs prohibitive.
Expansion clearances: Land allocation, Mining leases, Environment and Forest
the major challenges impacting the creation of new capacities.
Product development: India’s steel industry expenditure in R&D is still below 1% of its total turnover. As the economy matures there is a growing need for special grades of steel like Boiler quality, API, Auto grade, requiring greater attention on technology and R & D.
Based on the recommendations of the Working Group on Steel Industry, a new scheme i.e.,Scheme for Promotion of R&D in Iron and Steel Sector has begun with an outlay of ` 118 crores for the 11th Five Year plan. Under this scheme, R&D is being pursued in three major areas namely:
coal.
route.
Environment:an important benchmark for assessing any sector or company performance, both globally and in India. The Ministry of Steel through various schemes and regulations by the government is facilitating reduction in energy consumption and emission levels.
JSW has taken steps in each of these areas to remain competitive as explained in the following sections.
(B) STEEL MAKING AT JSW
Operational Performance
JSW Steel is India’s leading steel manufacturer, with a steel manufacturing capacity of 7.8 mtpa.(which will increase to 11 mtpa by Q1 2011-12). The Company has four manufacturing facilities at the following locations: Vijayanagar (6.8 mtpa integrated steel facility), known as the upstream unit,
facilities and Salem (1 mtpa integrated steel facility for long products of high

26
JSW Steel Limited
value and special steels). The Company is among the few coveted integrated
longs segment, and offers a variety of product basket.
JSW’S VALUE CHAINFLAT PRODUCT LONG PRODUCT
HR coils CRFH coils GalvanisedProducts
Wire rods
HR sheets CRCA products Galvalume products TMT bars
HR plates Colour coated products
Merchant Bars
Special Steel
Performance, 2010-11
an increase in output – hot metal production increased by 8.5%, crude steel production increased by 7.4% and HR coil/sheets production increased by 41%. New facilities were commissioned, capacity was added, new products and new customers were introduced.
At Vijayanagar, ore availability improved from captive mines. As a result of stabilisation of operations at HSM 2, the volume of HR products has increased
following the commissioning of a blooming mill. Products from these units received approvals from a number of global OEMs. The downstream (Tarapur
in increase for coated products from the automotive and white goods sectors. A new 300 MW power generation facility was commissioned in 2010-11 at Vijayanagar.
The production performance during FY 2010-11 was as under:
(Mn Tonnes)
Location Product FY 2010-11 FY 2009-10
VijayanagarWorks
Slabs/BilletsHR CoilsCRGalvanizedRolled Long
5.7744.7880.8700.0390.763
5.2233.3990.7350.0340.595
Salem Works Billets & BloomsRolled Long
0.6520.371
0.7630.363
Vasind & Tarapur Works
HR PlatesGalvanized/GalvalumeColour Coated
0.1520.8700.160
0.3100.8710.148
Total Crude Steel ProductionTotal Saleable Steel Sales
6.4276.099
5.9875.720
(1) Vijayanagar Works
of 6.8 mtpa which will increase to 10 mtpa in Q1 2011-12. It is Karnataka’s only integrated steel facility and is widely acknowledged as a centre of steel making innovation.
This state-of-the-art facility is driven by a simple philosophy: ‘Question every convention, replace the often quoted ‘why’ with the bolder ‘why not’’. The facility possesses contemporary technologies, has produced 5.77 million tonnes of
Different league
The Vijayanagar Works is the only landlocked integrated steel plant in the world with an annual capacity of 6.8 mtpa (will become 10 mtpa by Q1 2011-12). It is the largest steel manufacturing facility at a single location in India. The
plant, zero discharge and extensive greenary that has increased local rainfall.
Preparatory section
Considering declining raw material volumes from any one vendor and
in upgrading the inferior iron ore to superior feed for iron making units.
Highlights, 2010-11
million tonnes in 2009-10 to 2.70 million tonnes, reducing dependancy on high-cost imported coke.
quality and productivity.
to 3.62 million tonnes in 2010-11.
to 5.24 million tonnes; sinter quality improved considerably.
Key initiatives, 2010-11
The preparatory segment undertook a number of initiatives:
productivity.
cake; reduced losses from the cake’s core (not completely coked), improving coke yield and coke quality.
station.
yield.
the pellet making process – a positive impact on the environment.
achieved a capacity utilisation of 66% within six weeks of commissioning.
waste volume in sinter, reducing cost.
management.
Road ahead, 2011-12
plant II, enabling it to upgrade iron ore quality.
Iron making zone
This segment constitutes the largest cost component in steel manufacture and its criticality lies in maximising the plant availability and optimising costs.
Highlights, 2010-11
tonnes in 2009-10 to 6.19 million tonnes in 2010-11.
2.12 million tonnes (1.93 million tonnes in 2009-10).
of 9018 TPD (March 2011), which is higher than the rated capacity.
(both taps functional 24 hours and some additional time of simultaneous operation); plant availability increased from 90% in 2009-10 to 97.5% in 2010-11.
steel (for pipe manufacturing) to domestic and international markets.
Key initiatives, 2010-11
The team undertook a number of productivity enhancement and cost optimisation initiatives:
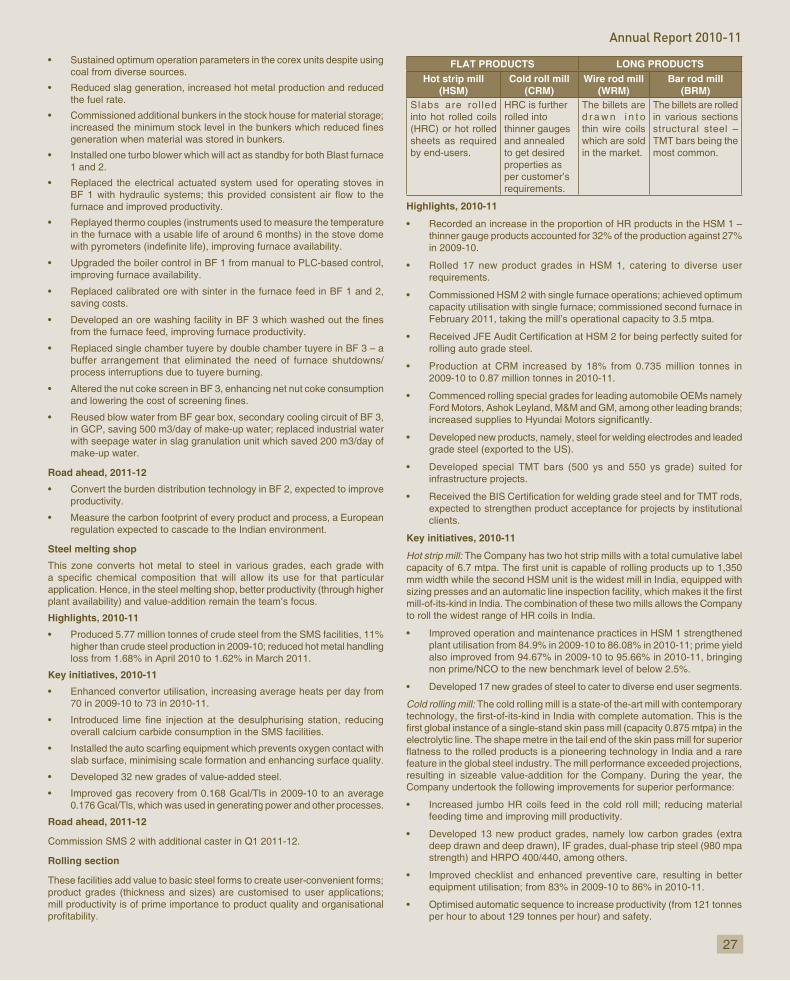
27
Annual Report 2010-11
coal from diverse sources.
the fuel rate.
generation when material was stored in bunkers.
1 and 2.
furnace and improved productivity.
in the furnace with a usable life of around 6 months) in the stove dome
improving furnace availability.
saving costs.
from the furnace feed, improving furnace productivity.
buffer arrangement that eliminated the need of furnace shutdowns/process interruptions due to tuyere burning.
in GCP, saving 500 m3/day of make-up water; replaced industrial water with seepage water in slag granulation unit which saved 200 m3/day of make-up water.
Road ahead, 2011-12
productivity.
regulation expected to cascade to the Indian environment.
Steel melting shop
This zone converts hot metal to steel in various grades, each grade with
application. Hence, in the steel melting shop, better productivity (through higher plant availability) and value-addition remain the team’s focus.
Highlights, 2010-11
higher than crude steel production in 2009-10; reduced hot metal handling loss from 1.68% in April 2010 to 1.62% in March 2011.
Key initiatives, 2010-11
70 in 2009-10 to 73 in 2010-11.
overall calcium carbide consumption in the SMS facilities.
slab surface, minimising scale formation and enhancing surface quality.
0.176 Gcal/Tls, which was used in generating power and other processes.
Road ahead, 2011-12
Commission SMS 2 with additional caster in Q1 2011-12.
Rolling section
These facilities add value to basic steel forms to create user-convenient forms; product grades (thickness and sizes) are customised to user applications; mill productivity is of prime importance to product quality and organisational
FLAT PRODUCTS LONG PRODUCTSHot strip mill
(HSM)Cold roll mill
(CRM)Wire rod mill
(WRM)Bar rod mill
(BRM)Slabs are rol led into hot rolled coils (HRC) or hot rolled sheets as required by end-users.
HRC is further rolled into thinner gauges and annealed to get desired properties as per customer’s requirements.
The billets are d r a w n i n t o thin wire coils which are sold in the market.
The billets are rolled in various sections structural steel – TMT bars being the most common.
Highlights, 2010-11
thinner gauge products accounted for 32% of the production against 27% in 2009-10.
requirements.
capacity utilisation with single furnace; commissioned second furnace in February 2011, taking the mill’s operational capacity to 3.5 mtpa.
rolling auto grade steel.
2009-10 to 0.87 million tonnes in 2010-11.
Ford Motors, Ashok Leyland, M&M and GM, among other leading brands;
grade steel (exported to the US).
infrastructure projects.
expected to strengthen product acceptance for projects by institutional clients.
Key initiatives, 2010-11
Hot strip mill: The Company has two hot strip mills with a total cumulative label
mm width while the second HSM unit is the widest mill in India, equipped with
mill-of-its-kind in India. The combination of these two mills allows the Company to roll the widest range of HR coils in India.
plant utilisation from 84.9% in 2009-10 to 86.08% in 2010-11; prime yield also improved from 94.67% in 2009-10 to 95.66% in 2010-11, bringing non prime/NCO to the new benchmark level of below 2.5%.
d 17 new grades of steel to cater to diverse end user segments.
Cold rolling mill: The cold rolling mill is a state-of the-art mill with contemporary
electrolytic line. The shape metre in the tail end of the skin pass mill for superior
feature in the global steel industry. The mill performance exceeded projections, resulting in sizeable value-addition for the Company. During the year, the Company undertook the following improvements for superior performance:
feeding time and improving mill productivity.
deep drawn and deep drawn), IF grades, dual-phase trip steel (980 mpa strength) and HRPO 400/440, among others.
equipment utilisation; from 83% in 2009-10 to 86% in 2010-11.
per hour to about 129 tonnes per hour) and safety.

28
JSW Steel Limited
Achieved crane centre marking; eliminating operational delay and enhancing productivity.
Wire rod mill: The Company’s wire rod mill is the fastest of its kind in India (drawing wire at 110m/sec); developing the largest product range (5.5 mm – 22 mm) and providing the maximum yield. It is also the only mill in India with an air cooling conveyor, allowing it to roll high carbon steel seamlessly. The team undertook the following improvements:
and arresting minor problem areas in the mill.
temperature in line with the product thickness being rolled (low thickness products would imply low temperature in the furnace); it also reduced scaling on the billet.
maintenance of the equipment.
the furnace exit door back into the furnace on the detection of a cobble.
Bar rod mill: This is the highest speed and widest range bar rod mill in India, capable of manufacturing a wide product mix (TMT, angle, square, engineered rounds, square round corners) and in multiple sizes (from 8mm to 40mm). The versatility extends to the product strength – the mill can develop products up to a maximum strength capability of 1150 mpa. In 2010-11, the team implemented a number of mill improvement measures for improving the value-proposition from this facility:
500 grade TMT products (earlier about 75% was the 415 grade TMT).
improvements, increasing yield from 93.5% in 2009-10 to about 96% in January 2011 and reducing the conversion cost in the bar rod mill.
Road ahead, 2011-12
The road ahead for the rolling mills would be towards productivity enhancement, developing superior product grades and optimising operational expenses:
In the hot rolling section, the team is working to ramp up the operations of the recently commissioned HSM 2 unit which will primarily roll high strength steel to be used in niche automotive applications.
The blueprint for the cold rolling section encompasses the following measures, enabling the Company to scale the value chain and cater to quality-stringent customers:
catering to MNC automobile clients.
of global automotive players.
demanded by the automotive sector, namely dual-phase steel and strip steel.
The wire rod mill expects to enhance capacity utilisation, which was impacted in 2010-11 owing to the non-availability of billets. The bar rod mill is working on upgrading TMT production to 100% 500D grade from the present 500 grade, strengthening realisations. As a branding exercise, the team expects to add equipment which will engrave the JSW brand and grade on the TMT product.
(2) Salem, India’s largest special steel plant
India’s largest single location dedicated special steel facility is at the bottom of
growth.
Achievements, 2010-11
Operations
which was replaced with special steels completely.
the blast furnace in October 2010.
Products and markets
Key Initiative, 2010-11
more waste heat to be recovered for onward power generation.
percentage chargeable to the blast furnace from 90% in 2009-10 to 91.5% in 2010-11.
blends, resulting in superior coke manufacture.
in the sinter plant. These improvements enhanced sinter productivity from 2,800 tonnes per day in Q3 2010-11 to about 3,100 tonnes per day in Q4 2010-11.
average 57% in 2009-10 to an average 62% in 2010-11, reducing the use of coke and calibrated ore in the blast furnace which optimised production costs.
silica variations in the hot metal and improving productivity in the steel
prone areas – example, hot metal zones, crane cabins, resulting in improved working conditions and productivity.
monitoring complete combustion of the blast furnace burden) at a third of the prevailing cost.
parameters in the ladle furnace, reducing oxygen in steel by 3 ppm and nitrogen by 8 ppm. This helped develop a larger number of grades and guarantee steel with an oxygen content <12 ppm (an international benchmark).
wire rod and bar mills. This initiative minimised billet shortfall in Vijayanagar and what was sold as billets was now marketed as rolled products.
cost effective replacement for iron ore without impacting product quality.
Products and clients
Developed more than 100 product grades for diverse customer requirements, largely focused on the automotive and auto-component sectors; each grade
Road ahead, 2011-12
ovens for cost-effective power generation.
which is expected to reduce testing time.
reducing steel consumption and increasing fuel consumption per vehicle.
being imported.

29
Annual Report 2010-11
operator bias for OEM.
Environment management at Salem
manufacture, which improved cement productivity for the cement company and dispose a process waste for the steel maker.
(3) Downstream units focused on brand building
JSW’s Tarapur and Vasind facilities focus on value-addition, providing a wide product range (HR Pickled & Oiled coils, HR plates, CRCA products, galvanised, plain and corrugated products and colour-coated products) for multi-sectoral applications.
JSW possesses India’s largest galvanised steel capacity; it has the prestigious
offers more than 200 shades of colour-coated galvanised products; it provides any shade of material on-demand within three weeks.
JSW Vishwas JSW Vishwas Plus
JSW Colouron JSW Colouron Plus
Galvanisedcorrugatedsheets
Galvalume plain sheets
Colour-coatedgalvanisedproducts
Colour-coatedgalvalumeproducts
Highlights, 2010-11
JSW Vishwas Plus to strengthen the JSW recall.
the newly commissioned 30 MW power plant at Tarapur.
0.20 mm) at Tarapur for export.
Maharashtra and Gujarat.
product.
Key initiatives, 2010-11
the labeled capacity is only the start to great achievements. The ability to see things differently and draw more from equipment is what sets JSW apart from other players in the Indian steel industry. In keeping with this passion, the teams operating the downstream units undertook a number of
Tarapur
of power per tonne and reducing breakdowns.
lines from 10 tonnes per coil to 25 tonnes, resulting into productivity and yield improvement.
DM water consumption in the power plant by 40%.
from stack remains within the permissible incase of non-functioning of the ESP – an important environment management initiative.
control coal and ash dust emissions.
setting with proper protection coordination for the successful islanding of the power plant against disturbances in the 132KV state power grid.
Vasind
speed and automatic roller type stacker arrangement which can cut up to 16 ft length sheets. This equipment generates scratch-free sheets with
rejections.
mill for secure material lifting, enhancing the safety quotient in the plant.
reduced the scratches in the tail end of the coil, maintained coil tension right throughout winding, resulting in superior surface quality and improved yield of galvanised products.
recovery boiler for superior operations.
Product development
Product End Application Location Status
HR plate
En 10215 355 - J2, in 63 mm and below thickness
StructuralApplication
Vasind Developed
Galvanised coating
EN 10327 DX 52 DYS = 300 Mpa max; TS = 420 Mpa max; El = 26% (80 GL)
Cold Forming Application
Vasind and Tarapur
Developed
EN 10327 DX 53 D with low carbon steelYS = 260 Mpa max; TS = 350 Mpa max; El = 30% (80 GL)
Cold Forming Application
Vasind Developed
ASTM A 653 SS Grade 50 Class I with 95 grade HRC
StructuralApplication
Vasind Developed
ASTM A 653 SS Grade 50 Class 4 and Class 4 with MC16PG grade of JSW Ispat
StructuralApplication
Vasind and Tarapur
Developed
Pre-painted GI/GL
Extra Flexible Paint - 1T Bend Forming grade material
Tarapur Developed
0.22 mm TCTP PPGIApplication
Tarapur Developed
PPGI with 20μ PVDF coating on each side
Enhanced product life
Tarapur Developed
ApplicationTarapur Developed
Road map, 2011-12
The downstream unit teams will draw up blueprints comprising, capacity
units.
Tarapur
CR > 0.25 mm); install Thyristor drive in the mill, entry tension reel, delivery tension reel and pay-off reel.
boosting production by around 2,900 tonnes a month.
line (CCL1) to reduce LPG consumption.
16.5 TPH, permitting the team to develop new product grades.
job working.

30
JSW Steel Limited
Vasind
gas); the gas pipeline is being routed by GAIL. The fuel conversion will be at the HR plate mill (furnace oil to natural gas) and the galvanising facility (from LPG to natural gas).
product basket namely, galvanised products (EDD grades) for automobile and appliances and colour-coated sheets for structural application and appliances.
value-added in new coating lines.
(C) OTHER CRITICAL FUNCTIONS
(1) Material Procurement
A tonne of steel consumes about four tonnes of natural resources (coal and iron ore), making adequate, proximate and economic availability critical to
JSW’s iron ore is sourced from the Bellary belt, 20 km from its site. The
the only steel unit in the state to utilise all iron ore grades.
The Company imports its entire coking coal; corex coal, (low grade coking coal used for iron making in the corex units) and thermal coal (for power generation) are procured from global destinations.
A. Iron ore
Highlights, 2010-11
Bellary.
Key initiatives, 2010-11
capacity that will become operational in Q1 2011-12.
Road ahead, 2011-12
in a huge cost saving.
B. Coal
Highlights, 2010-11
Key initiatives, 2010-11
Canada.
Africa.
Road ahead, 2011-12
Australia, Newzealand and South Africa.
(2) Raw Material Handling
At JSW Steel, competent raw material management is critical on account of the sheer volume to be handled daily – At 11 mtpa stage, the daily receipt would be around 28,000 tonnes of coal, 60,000 tonnes of iron ore and
15,000 tonnesbe sourced from various geographies. The team needs to optimise the process,
Highlights, 2010-11
December 2010 the monthly highest during the year. Rake handling was maintained at 15 rakes/day on average.
synchronised the working of screens with vibro-feeders, increasing base daily production from 9,000 tonnes to 14,000 tonnes.
Key initiatives, 2010-11
skirt board arrangement and support structure of the conveyor, critical for BF3 material feeding; reduced belt replacement time from 14 hours to six hours, increasing plant availability.
for the box fabrication and provided additional stiffeners for better strength
harrow trolley from the rolled to fabricated section.
corex and blast furnace units.
breakdowns in the conveyor drive.
Road ahead, 2011-12
(3) Logistics Management
At JSW, 1.3 lacs tonnes of material needs to be managed and moved daily; a
At 11 mtpa steel production capacity, JSW will need to move more than 46 million tonnes of material annually (inward and outward) in addition to material transfers between its operating units.
The required logistics management is similar to regulating train movements at a busy station; manage 33 rakes and 600 trucks, moving 26,000 tonnes of hot metal in torpedoes, ladles internally – every day!
The Company created an adequate logisitics management infrastructure:
to unload 12 rakes: 42,000 tonnes per day
mill, wire rod and bar mills for both road and rail
Moreover, the in-facility logistics infrastructure comprises 165 km railway line, 41 locomotives and 15 wagons used for internal material transfer.
The Company’s imports are managed across the four ports in Goa, Krishnapatnam, Chennai and Karaikal. The majority of imports are routed through Goa (around 6 million tonnes) and transported to the Vijayanagar facility through the rail route. The Karaikal port feeds the Salem facility while the other two ports import for both facilities.
Highlights, 2010-11
2009-10, a 16% increase over the previous year.
` 76.58 crores in additional logistics management infrastructure.

31
Annual Report 2010-11
Karaikal port in Q2 (recognised by the Port Trust).
Rake availability at Goa increased from 3-4 rakes per day to about 5-6 rakes per day, increasing rail material handling by 1 million tonnes.
Key initiatives, 2010-11
maintain owned locomotives, optimising costs.
2011; introduced bottom discharge rakes introduced in the iron ore circuit.
safety at the raw material receipt yard to track and track and control the overall movement of trains inside JSW.
tonnes despatched during the year under review.
monthly which would increase to 4,500 wagons per month.
through single software system.
from 12-13 rakes to 15-16 rakes per day.
Road ahead, 2011-12
with railway system proposed in two phases:
Phase I – Raw material receipt yard and track hopper
Phase II – Steel despatch yard and hot metal yards
and stabilise the rakes with 12 lines.
for export.
exports.
handle increased volumes.
(4) Energy Management
JSW’s energy management comprises the successful reduction of fossil fuel consumption in power generation, practices to transform waste to wealth and
In doing so, the team minimises pollution, sustains resources longer (utilising waste gases in the operational process, replacing fossil fuel) and builds the nation (manufacturing steel, the infrastructure backbone).
Highlights, 2010-11
2009-10 to 6.193 gcal per tonne of steel, despite the commissioning of a number of ancillary units of 3.2 mtpa expansion project which necessitated higher power consumption.
the third successive time.
to 6.8 mtpa; replaced the power drawn from JSW Energy.
Power generation: JSW Steel (Vijayanagar) is among the few integrated Indian Steel Plants where a large percentage (64.30% as on March 31, 2011) of power generation utilises waste heat, processed gas and solid waste. At 6.8 mtpa, the Vijayanagar unit requires 369.78 MW to sustain operations across all facilities; its own generation stood at 334.40 MW, the balance was drawn
is establishing a 300 MW power generation unit, expected to commence operations by December 2012. The captive power generation at Vijayanagar Works is managed by JSW Energy Limited.
Own power generation
Non-fossil fuel power generation
Estimated coal saving
2010-11 2010-11 2010-11
334.40 MW 206.6 MW 598,796.50 tonnes
Power distribution: The seamless distribution of power to all operating and ancillary units is monitored by a specialised power distribution cell. The
drop in productivity and sizeable time to ramp up to the standard operations
of initiatives to ensure continuous and fault-free power distribution to all units.
Key initiatives, 2010-11
plant grid. The Company installed ‘CLIMS’, an intelligent, real-time load management system – a server-based technology – to balance generation with consumption and allow the simulation of all ‘islanding’ possibilities, resulting in proactive alarms for disturbances leading to immediate remedial action.
voltage and variable frequency fan, reducing fan speed when there is no oxygen blowing into the converter (hence, no hot air coming out of the converter) and reducing SMS power requirement.
to the neutral earth transformer in the event of a massive energy fault.
preventing equipment damage.
Gas and heat utilisation: The Company generates processed gases from
and generating power. The energy management team maximises the utilisation of these waste gases, minimising power requirement.
Key initiatives, 2010-11
consumption.
actuator, facilitating 94% of BF gas to pass to the turbine installed at the top of BF III.
increasing the injection of coal dust.
shutdowns, enhancing power generation at CPP-1 from 93.59 MW in 2009-10 to 99.45 MW.
97.75% in 2009-10 to 98.92% in 2010-11.
gas utilisation.
facilitated a real-time monitoring of gas generation and consumption, optimising gas consumption.
for power generation; generated 103.84 MW by utilising BF gas.
zone with additional coke oven gas (with the commissioning of coke oven 4).
Blueprint, 2011-12
of other process-generated gases.
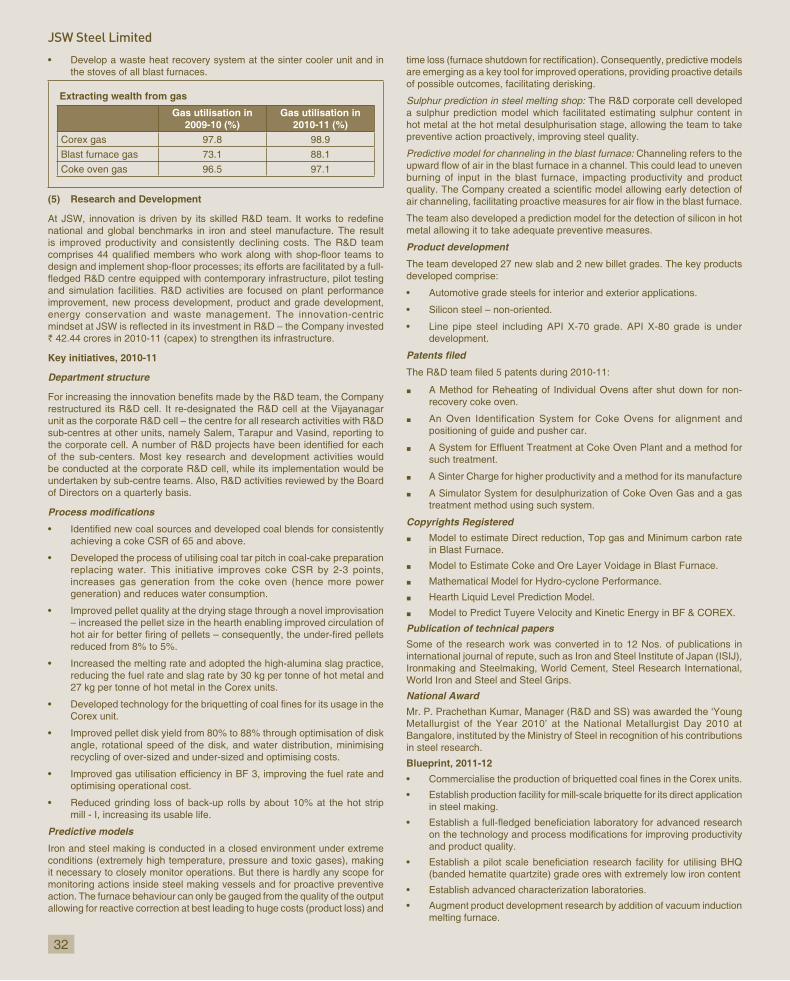
32
JSW Steel Limited
the stoves of all blast furnaces.
Extracting wealth from gas
Gas utilisation in 2009-10 (%)
Gas utilisation in 2010-11 (%)
Corex gas 97.8 98.9
Blast furnace gas 73.1 88.1
Coke oven gas 96.5 97.1
(5) Research and Development
national and global benchmarks in iron and steel manufacture. The result is improved productivity and consistently declining costs. The R&D team
and simulation facilities. R&D activities are focused on plant performance improvement, new process development, product and grade development, energy conservation and waste management. The innovation-centric
` 42.44 crores in 2010-11 (capex) to strengthen its infrastructure.
Key initiatives, 2010-11
Department structure
restructured its R&D cell. It re-designated the R&D cell at the Vijayanagar unit as the corporate R&D cell – the centre for all research activities with R&D sub-centres at other units, namely Salem, Tarapur and Vasind, reporting to
of the sub-centers. Most key research and development activities would be conducted at the corporate R&D cell, while its implementation would be undertaken by sub-centre teams. Also, R&D activities reviewed by the Board of Directors on a quarterly basis.
achieving a coke CSR of 65 and above.
replacing water. This initiative improves coke CSR by 2-3 points, increases gas generation from the coke oven (hence more power generation) and reduces water consumption.
– increased the pellet size in the hearth enabling improved circulation of
reduced from 8% to 5%.
reducing the fuel rate and slag rate by 30 kg per tonne of hot metal and 27 kg per tonne of hot metal in the Corex units.
Corex unit.
angle, rotational speed of the disk, and water distribution, minimising recycling of over-sized and under-sized and optimising costs.
optimising operational cost.
mill - I, increasing its usable life.
Predictive models
Iron and steel making is conducted in a closed environment under extreme conditions (extremely high temperature, pressure and toxic gases), making it necessary to closely monitor operations. But there is hardly any scope for monitoring actions inside steel making vessels and for proactive preventive action. The furnace behaviour can only be gauged from the quality of the output allowing for reactive correction at best leading to huge costs (product loss) and
are emerging as a key tool for improved operations, providing proactive details of possible outcomes, facilitating derisking.
Sulphur prediction in steel melting shop: The R&D corporate cell developed a sulphur prediction model which facilitated estimating sulphur content in hot metal at the hot metal desulphurisation stage, allowing the team to take preventive action proactively, improving steel quality.
Predictive model for channeling in the blast furnace: Channeling refers to the
burning of input in the blast furnace, impacting productivity and product
The team also developed a prediction model for the detection of silicon in hot metal allowing it to take adequate preventive measures.
Product development
The team developed 27 new slab and 2 new billet grades. The key products developed comprise:
development.
A Method for Reheating of Individual Ovens after shut down for non-recovery coke oven.
An Oven Identification System for Coke Ovens for alignment and positioning of guide and pusher car.
such treatment.
A Sinter Charge for higher productivity and a method for its manufacture
A Simulator System for desulphurization of Coke Oven Gas and a gas treatment method using such system.
Copyrights Registered
Model to estimate Direct reduction, Top gas and Minimum carbon rate in Blast Furnace.
Model to Estimate Coke and Ore Layer Voidage in Blast Furnace.
Mathematical Model for Hydro-cyclone Performance.
Hearth Liquid Level Prediction Model.
Model to Predict Tuyere Velocity and Kinetic Energy in BF & COREX.
Publication of technical papers
Some of the research work was converted in to 12 Nos. of publications in international journal of repute, such as Iron and Steel Institute of Japan (ISIJ), Ironmaking and Steelmaking, World Cement, Steel Research International, World Iron and Steel and Steel Grips.
National Award
Mr. P. Prachethan Kumar, Manager (R&D and SS) was awarded the ‘Young Metallurgist of the Year 2010’ at the National Metallurgist Day 2010 at Bangalore, instituted by the Ministry of Steel in recognition of his contributions in steel research.
Blueprint, 2011-12
in steel making.
and product quality.
(banded hematite quartzite) grade ores with extremely low iron content
melting furnace.

33
Annual Report 2010-11
Coal briquetting technology
The Company used high-cost, imported coal as feed for its Corex units.
making hot metal.
To meet this challenge, the R&D team developed the coal briquetting
Besides, it would improve plant availability and productivity and reduce
working capital blocked in importing such high-cost coals.
The Company is establishing a 0.6 million tonne briquetting facility at Vijayanagar Works, which is under commissioning.
(6) Project Management
JSW Steel has been the most aggressive capacity creator in India’s steel industry, simultaneously executing multiple capital-intensive projects at any given time.
In 2010-11, the team executed more than ̀ 50 billion projects at the Company’s various locations. The uniqueness of the Company’s project management is
cost, timely implementation, leveraging resident knowledge.
members from diverse departments bring diverse skills and capabilities to supplement the core project management team.
projects are available in-house.
operating and managing the facility.
benchmarks in terms of time taken to commission projects and stabilise operations.
Timely execution
project management team along with the project team responsible for the particular project.
management; undertook in-depth gap analysis between the budgeted progress and actual performance; drew from organisational resources to accelerate projects.
expansion Project in addition to hiring new cross-departmental members.
strengthening commercials and optimising capital expenditure.
Achievements, 2010-11
Two of the four batteries (1.95 mtpa capacity) of coke oven 4 were commissioned in December 2010.
Sinter plant 3 (5.75 mtpa capacity) was commissioned in February 2011 – the largest such facility in India.
300 MW captive power plant (CPP 3) was commissioned in September 2010.
Ladle Heating Furnace-3 & 4, Converter-3 & 4 and Caster-3 & 4 were commissioned in phases by March 2011.
Lime calcination plant - Kiln 8 (capacity 300 TPD) commissioned.
phases by April 2011.
Road map, 2011-12
The Company plans to commission the following:
in Q1 2011-12, taking the total operational crude steel making capacity to 10 mtpa at Vijayanagar.
to 5 mtpa.
total capacity of this unit to 20 mtpa.
market by July 2011.
July 2011.
is completed; project to be completed by June 2011.
The Company plans to undertake a number of capital-intensive projects at its Salem facility:
develop high-value steel grades.
steel.
band cutting saws for faster sample making.
associated equipment to facilitate a faster rake turnaround and reduce demurrage charges.
with a 32 TPH waste heat recovery boiler; achieve a safety mandate and generate low cost power.
enhance productivity by about 130 TPD.
melting shop, increasing productivity.
(by 3,000 tonnes per month) and quality.
for better environment management.
90 days ahead of schedule
the second battery of the same unit was commissioned in December 2010, three months ahead of schedule, saving the Company’s cost, difference between procurement and own production.
(7) Marketing
At JSW, saleable volumes have grown multi-fold. Consider this: in just four years, saleable steel volumes more than doubled. The Company’s unique marketing policy – sell then make – accelerated sustainable growth. To strengthen its focus on diverse various segments, JSW Steel restructured its marketing set up.
Highlights, 2010-11
M/s. Ashok Leyland, M/s. Kalyani Lemmerz, M/s. Toyota Motors, M/s. Bharat Forge, M/s. Tata Motors and many others.
high carbon steels, high tensile and HSLA grades for auto sector, API Grade steels for oil and gas sector, forging quality steels for auto application among others.

34
JSW Steel Limited
6.10 million tones in 2010-11.
Flat products
Highlights, 2010-11
2010-11.
6% and longs at 16%.
engineering and Retail.
to increasing sales to OEM’s.
presence in rural/semi-urban area.
Long products
The Company’s long product spans the entire value chain spectrum – TMT products, Wire Rod coils, bars, rounds and structurals. The thrust on special steels altered the sales mix in favour of value-added grades. The team seeded new markets for existing products, introduced new products developed at its plants and worked with leading corporates for product approvals which would result in increased volumes from the current year.
Highlights 2010-11
used for forging crankshafts; received approvals from leading Indian OEMs namely, Ashok Leyland, M&M, Wipro Fuilds, among others.
forgings which are exported to international destinations.
grades for diverse critical applications.
with customer requirements.
in the TMT sales mix increased from 55% in 2009-10 to about 65%.
Retail sales
outlets as on March 31, 2011, in more than 136 districts of India, with more than 49% of the outlets in semi-urban and rural locations.
JSW Shoppe is an honest attempt to market quality steel products to the steel consumer in these locations by educating the consumer of product usage – allowing them to make informed decisions. It is a one-stop shop, showcasing all JSW products; the outlets have the ambience of a mini-departmental store, resulting in enhanced product branding and customer education.
In three years of its existence, JSW Shoppe has emerged as an aspiration for entrepreneurs in semi-urban and rural locations – word of mouth emerging as an effective branding and network expansion tool.
Highlights, 2010-11
Sales through the JSW Shoppe increased 77% from 0.64 milliontonne in 2009-10 to 1.12 million tonnes
Number of outlets increased from 174 as on March 31, 2010 to 280 as on March 31, 2011.
Organised the JSW Shoppe on wheels across numerous locations for growing awareness of the product and the brand.
Created a second distribution level under the JSW Shoppe umbrella – created retail outlets for very small quantities as it requires a complete different mindset to manage these customers.
Ltd – NPCIL
– MMRDA
construction
Branding and Advertisement
JSW Vishwas – “Pehchaan Nayi, Vishwas Wahi” campaign launched.
JSW TMT Plus launched at regional locations.
JSW Pragati launched in colour-coated product segment.
Roof India – Chennai.
Global Investor’s Meet – Bangalore.
ACETECH in Mumbai and New Delhi.
novel scheme – “Shoppe on Wheels”.
Road ahead, 2011-12
Increase the reach of JSW Shoppe by strengthening the network to 400+ by March 31, 2012.
Cost-effective initiatives to strengthen the recall of the JSW Shoppe through simple and effective branding initiatives – electronic, bus panels, hoardings, paintings, among others.
from OEM customers for various products which are under various stages of approval.
Vision 2015
About 600 Shoppes by 2015 and an average monthly sales volume of 1,000 tonnes per Shoppe, cumulating to about 7.2 mn tonnes of steel annually (post-2015 when all 600 Shoppes are operational).
(8) Human Resource
Counter-convention, determination and stretch achievements is what JSW is all about – built solely on the passion of its employees who dare-to-dream and persevere-to-perform – delivering possibly the most unbelievable results.
Consider this: a team size of 8,925 members are responsible for the manufacture and marketing of 11 mtpa of crude steel, predictably the smallest team size per tonne manufactured in India’s growing steel sector. Interestingly, at JSW, the labour cost per tonne of steel is the lowest globally!

35
Annual Report 2010-11
Mindset
Holistic personality development is what the corporate aspires to give its
but competence is not just about domain knowledge, but an aptitude for multitasking. This organisational belief inspired a culture of multifaceted capability, accelerating individual development and empowering a team. The organisation provides a plethora of opportunities to the individual and the entire family, resulting in huge recognition for the brand, an immediate willingness
of employees rejoining.
Recruitment
The irony is that skilled people resources are getting exceedingly scarce in the
is becoming increasingly challenging in India. The same holds true for JSW.
Building the JSW team rapidly is of critical importance for important reasons:
planned in existing locations.
opportunities need to be streamlined to the JSW standard.
The Company recruits graduate, diploma engineers and management students from leading engineering and management colleges. In 2010-11, the Company participated in campus recruitment for management graduates from IIMs and engineers from NITs. The Company held walk-in interviews for recruiting prospective employees. The Company’s lateral recruitment of experienced professionals is driven through references, connections, advertisements and placement agencies.
Mentoring young trainees
To groom fresh recruits into the JSW culture and to enable them to make a meaningful contribution to the organisation, the team launched a mentoring programme. Seniors from the same department partnered fresh recruits for facilitating them in learning the ropes with ease and to seamlessly adapt to the culture and practices of the organisation with speed.
The HR team organised development initiatives for grooming mentee’s like Input Seeking Session by Thomas International, Mumbai One day workshop on “Achieving Personal & Professional Excellence”, was organised to get mentees clarity on aligning personal goals with the organisational goal. They were provided individual feedback reports outlining their strengths and development areas to help formulate their individual development plan.
JSW Steel’s 8,925 employees comprise a rich pool of MBAs, CAs, CSs, ICWAs, ITIs, engineers, graduates, postgraduates and diploma holders as on March 31, 2011.
PercentageDiploma holders 33.5
Engineers 25.3
Graduates and post graduates 13.1
ITI 8.1
Post Graduate (CA/CS/ICWA/ MBA) 3.7
Others 16.3
Even as the average experience of the senior management is over 20 years, the Company’s average employee age is about 33 years, a prudent mix of energy and experience.
Employee Welfare
for the organisation. Honest and sincere efforts are made whereby employee
Employee Benevolence Scheme
of the deceased employee to a large extent. However, death due to sudden/prolonged illness such as heart attack, internal organ failures or permanent
assistance to the family of the employee in case of his/her death/permanent total disability due to sudden/prolonged illness, while in service. It covers all death/permanent total disability due to reasons other than accident, which is covered under GPA. All permanent employees of JSW Group companies,
scheme.
Township
The Company has set up townships, spanning a total residential population of over 1546 families. These townships are supported with sound infrastructure and amenities (24x7 electricity, water supply, ATMs of major banks and shops). Weekly car service (for car owners at subsidised costs) and weekly auto exhibitions (for local car dealers) are organised in the township. In December 2010, the Company launched Wi-Fi facility at Vijaynagar township for the employees; 4,000 new houses have been planned for the coming year in the following townships:
Medical Assistance
A 75 bed, multi-speciality hospital (Jindal Sanjivani Hospital) spread across 27,000 sq. ft. was set up in 2003 in Toranagallu to provide exceptional medical
and Medical Trust.
Fitness and Recreation facilities
In order to create a healthy working environment, the Company encourages
billiards, swimming, football, cricket, volleyball and gymnasium at a state-of-the-art sports club. It also provides movie theatres and subsidised food at its in-house restaurant.
Knowledge Centre
JSW maintains the following schools for the children of employees at Vijayanagar
facilities.
at the Shankar Gouda colony.
Scholarships
The Company granted scholarships to the meritorious children of employees to pursue professional degree courses like engineering, medicine, management, architecture, and chartered accountancy, among others.
Transportation
The Company provides transportation facilities to employees through its 19 buses and 42 cars.It provides transportation for people commuting from Bellary, Hospet, Vidyanagar township, V.V Nagar township, and Shankar Gudda colony.
Canteen
A total of 13 independent canteen facilities are provided, catering to every department in the plant. Healthy food at affordable prices is provided to employees. Further, 10 restaurants catering different cuisines are maintained in the townships.
Employee Communication
A communication exercise was undertaken across the plant for all employees to voice their opinions, issues and suggestions to the top management. The platform for employees was “SAMPARK” and “SAMOOH”.

36
JSW Steel Limited
Management Review Forum
EC Meetings
SAMPARK/ SAMOOH
Interactive forum
Cordial family bonding
Responsive top management
Employee get together
CEO interaction
Voice of the people
Brainstorming session
Employee satisfaction Survey
HOD Meetings
The Sound Board
COMMUNICATION
Rewards and Recognition
JSW culture comprises rewards and recognition. The performance-based reward system facilitates the Company in pursuing its strategic goals and objectives. JSW’s effective employee recognition system is uncomplicated to attain the desired outcome and improve employee performance retention.
The employees are rewarded and recognised by the following:
Type of Reward Rationale
Best Employee Award For consistent good performance, concern for safety, creativity, excellent interpersonal skills, communication skills, mental alertness and judgement, Company’s image building activities and high level of discipline
Exemplary work For all-round exemplary work
Best suggestion award To reward innovation and creativity
Best Safety man Award For practicing highest standards in safety
Bravery and Courage Award For exhibiting outstanding bravery and courage
Best Quality circle For innovative themes selected for QC competitions that bring fame to the Company
Intellectual property rights For registering copyrights, patents and international publications
Best Contractor For providing excellent services with high quality of work
Mentorship Development Programme: An attempt to facilitate learning in a smoother and non-practical environment, whereby attempts are made to identify factors to contribute for success of the ‘mentoring initiative’. This programme was launched in 14 departments, whereby a complete brief was given about the role of mentor and process of mentoring.
* Employee Survey: Conducted a survey by McKinsey seeking employee views through a standard questionnaire. The employees’ views then served
* Engagement Survey: Commissioned a study by Assess People, a pioneer in workforce assessments, to elicit the opinions of employees to gauge responses
shared with the employee and their views considered for the improvement plan.
Performance Management and Reward System
JSW Steel’s functional meritocracy is based on individual performances. The Company’s performance management and review system evaluates employee performance across multiple KPIs (targets and achievements; working style and culture; business/domain knowledge and personal growth; organisational initiatives).
Besides, the Company promotes talent from within, offering members the scope to grow in their roles, coupled with an opportunity for cross-functional movement. The Company’s compensation package is linked to performance and benchmarked to better-than-industry standards. As an extension, the Company introduced ESOPs for senior executives. About 2,855 executives are now proud partners in the Company’s growth. This initiative has gone a long way in integrating the individual with the organisation.
360 Degree Feedback – 360 Degree Feedback process has been launched in JSW for GM and above levels across the group, covering around 270 employees. The objective of 360 Degree Feedback Process is to enable leaders to get feedback on their leadership style as perceived by others and enable individuals to develop leadership potential by helping them to capitalize on their strengths. In this process, participants (GM and above) will get the feedback from their superior(s), peers/colleagues and direct reportees/juniors on their leadership effectiveness. The entire process will be conducted online by T.V. Rao Learning System Ltd., Ahmedabad. After the feedback process gets over, participants will be given individual feedback report which will be based on all the responses received from the feedback providers and they will be encouraged to formulate their Individual Development Plan (IDP).
Highlights, 2010-11
coaching and mentoring for them to enable them adapt to the JSW Culture quickly.
across levels with knowledge and skill. Also, strengthened various learning platforms to intensify learning and development through initiatives such as – e-learning modules and saturday learning forums among others.
hundred high potential employees, across levels to build internal talent
developmental inputs. Strengthened the succession planning exercise;
to the fast track growth mechanism to groom them for assuming larger responsibilities.
of action plan to raise employee engagement level.
seeking the views of the team on various issues which served as a base for further improvement.
and values of the Company.
the women employees which focused on managing challenges faced by working women in today’s world. It also catered to the art of balancing career and family, role of women in leadership, management talent and developing personal competencies, among other topics.
Accolades and Awards for HR Excellence
JSW has won prestigious awards during the year for HR excellence.
“Innovative HR Practices”. The award was handed
“The Award for Institution Building” at World HR Congress held on February 11, 2011.
“Best Practices in Talent Management Award” in London on November 10, 2010. The grand event was hosted by Osney Media, London.
Road ahead, 2011-12
consequent to the complete commissioning of 3.2 expansion project.
the team.
critical issues as per the survey report.

37
Annual Report 2010-11
(9) Corporate Communications
The corporate communications team at JSW Steel manages and orchestrates
consistent to its size, stature and performance, manage perceptions among media and stakeholders about Company’s business strategy and future prospects, and strengthen the Company’s brand image.
Strategy
and opinion leaders.
identify communication opportunities and issues related to JSW Steel and other verticals.
community about the Company’s business strategy and future prospects.
investor relations, public affairs and crisis management.
constituencies.
Reputation Management
Social
Responsibility
Supports Good Causes
Environmental
Responsibility
Community
Responsibility
Vision & LeadershipMarket OpportunitiesExcellent LeadershipClear Vision for the
Future
Product & ServicesHight QualityInnovative
Value for MoneySands Behind
Financial Performance
Low Risk InvestmentGrowth Prospects
Outperforms Competitors
EmotionalAppealFeel Good About
Admire and RespectTrust
Workplace Environment
Good Place to workGood Employees
Rewards Employees Fairly
Reputation
Major Achievements
Bangalore-based journalists
coverage.
Media Relations
Media relations is a bridge building exercise between the Company and the media, a task crucial for correct and factual information, dissemination and creating the right Company image for the outside world. It is important for the Company to create platforms from where relevant information can be effectively passed on for positive impact. The corporate communications team conducted
Organised more than seven press conferences regularly through 2010-11 to announce quarterly results, strategic issues and key business decisions.
Organised a media visit to Vijayanagar in August 2010 to announce commissioning of new state-of-the-art hot strip mill. A similar exercise was
Structures Ltd facility at Vijayanagar in November 2010.
Crisis Management
The corporate communication team possesses skills and techniques to identify,
occurs to the point when recovery procedures start. Crisis management helps identify potential risks and makes changes to hedge against the crisis.
Financial Communications
professionals. The corporate communication team organised:
Analyst meet at every quarter end.
Special analyst meet to inform about the Ispat alliance.
Branding
JSW’s branding strategy is aimed at nurturing the JSW brand and managing stakeholders’ perception to maximise business value. Branding, in the JSW has an integrated marketing approach with business solutions which create a uniform message for all stakeholders.
The Company has followed the policy of sustained branding as any other large corporate primarily using Out-Of-Home as the reminder medium. The branding activity includes use of outdoors.We are present at all major airports and locations across major cities based on research and analysis. Prominent branding mediums are ‘Neon Signage’ at Nariman Point, AC buses branding and railway stations’ branding.
At JSW, strategy goes through the following cyclical process:
investors, customers and the community.
perception research on various brand-related parameters to get an idea of the Company’s position compared with competitors.
an idea about the JSW brand’s position with respect to a timeframe.
Messaging
Our branding is focused on people and community development services. We position ourselves as a responsible corporate citizen.
During the year, corporate communication undertook a survey in Mumbai, Delhi, Bangalore, Hyderabad, Chennai and Kolkata to understand the OOH and TV campaign’s brand awareness recall. The total awareness was more than 102%, using aided and non-aided recall methods. The branding initiative and messaging generated over 10 million footfalls according to TAM rating across India. Sports branding is also gaining momentum.
Prominent initiatives
JSW Squash World Cup 2011
As part of new initiatives, the Company entered into sports promotion in a major way. JSW Steel sponsored ‘World Squash Cup 2011’ in Chennai. Further, the company undertook a special promotion of the event. The result was a huge recall for brand JSW. Matches were shown on ESPN and reached millions of people.
Outdoor branding during ICC Cricket World Cup
season, e.g. using sports promotion. At the time of the Cricket World Cup, outdoor branding campaigns were undertaken using Indian cricketers’ images. As a part of topical branding, electronic media was used like NDTV, Times Now, ET Now and BBC for presentation during Union Budget 2011.
Internal communication
JSW gives due importance to internal communication to promote employee-management relationship and interaction. The Company provides several mediums to employees to communicate with the management.
Website management
Today’s dynamic business environment requires continuous updating of information. The Company proactively updates its website with the help of a team to provide the factual information to its stakeholders at all times. As an environment-friendly initiative, the corporate communication team introduced
(10) Information Technology
JSW Steel continues to leverage technology in its continuing pursuit of aken

38
JSW Steel Limited
a very important initative to have a comprehensive relook at business processes and usher in best practices, This is aimed to enhance the capability to take informed decisions based on accurate information driven by robust IT system.
preliminary work on this was done during the year, leading to key decisions. During 2010-11, several strategic initiatives were taken up, including:
and act as Disaster Recovery Center for the Datacenter at Bengaluru.
locations, including branches and Stockyards.
performance.
system will ensure improved planning and inventory management cycles. Also, the system will also act as an Early Warning system in case of delay in unloading of the cargo at various ports therefore intimating plants of the delay in the logistics of the supply and also allow for provisioning of demurrages.
this release, the entire inventory tracking system is now fully automated
goods, from raw material entry to issue of gate pass thereby ensuring availability of data.
Vijayanagar, aimed at better planning of production schedules, ensuring a faster turnaround time from order to delivery.
activity on real-time basis including the relay of technical parameters.The system will be implemented across plants shortly.
systems, thereby enabling employees across locations to access a standard user interface that will enable them to perform self service
customer and item masters.
(11) Internal Control and Audit
Internal Control
The Company has a proper and adequate system of internal control commensurate with the size and nature of its business. Internal control systems
internal control system are:
procedures covering all the Company’s important functions.
internal procedures and systems
any loss.
recording and reporting of all transactions.
functions.
audit findings, adequacy of internal controls and compliance with Accounting Standards, among others.
of IT Systems.
The internal control systems and procedures are designed to assist in the
compliance as well as an enhanced control consciousness.
Internal Audit
The Company has an internal audit function that inculcates global best standards and practices of international majors into Indian operations. The Company has a strong internal audit department comprising of more than 25 executives reporting to Audit Committee comprising of Independent/Nominee
The Company integrated the COSO (Committee of Sponsoring Organisations of the Treadway Commission) framework with its audit process to strengthen
governance.
The Company extensively practices delegation of authority across its team, which creates effective checks and balances within the system to arrest all possible gaps within the system. The internal audit team has access to all organisational information, facilitated by its ERP implementation.
Audit plan and execution
The Company’s Internal Audit Department prepared a risk-based audit plan. The audit frequency is decided by risk ratings of areas/functions and the audit plan is carried out by its internal team.
Addition to the audit plan: The audit plan is periodically reviewed to include
and aggressive corporate growth. Moreover, the Audit Committee relies on internal customer feedback and external events for inclusion of areas into the audit plan.
(12) Risk Management
JSW follows the Committee of Sponsoring Organizations’ (COSO) framework of Enterprise Risk Management to anticipate and address risks while being aligned with ISO 31000:2009 standards that deal with risk management guidelines.
to understand interdependencies, prioritise and respond proactively; ongoing supervision of this function by a sub-committee of Directors consisting of Executive and Independent Directors.
Top risks relating to investments, projects, markets, infrastructure, logistics, materials, technology, operations, performance, processes, environment, health and safety are discussed actively. These activities are coordinated by
(D) LOOKING INTO THE FINANCIAL STATEMENTS (STANDALONE)
Highlights 2010-11(` in crores)
2010-11 2009-10 Growth (%)
Gross Turnover 25,131 19,457 29%
Net Turnover 23,163 18,202 27%
EBIDTA 4,856 4,802 1%
PAT 2,011 2,023 -1%
Earnings per share (diluted) (`) 96.33 105.94 -9%
ROCE (%) 12.7% 16.8%
RONW (%) 15.0% 23.3%
EBIDTA margin (%) 20.8% 26.2%
Net Debt gearing ratio 0.57 1.14
The Gross Turnover and Net Turnover for the year stood at ` 25,131 crores and ̀ 23,163 crores, respectively, with a growth of 29% and 27% respectively, over the previous year, mainly driven by better product-mix and volumes.
The EBIDTA for the year was ` 4,856 crores and the EBIDTA margin was 20.8%. The Company posted a PAT of ` 2,011 crores.
The Company’s total net debt gearing was at 0.57 (as against 1.14, as on 31.03.2010). The weighted average interest cost of Debt was lower at 7.58% (as against 8.08% as on 31.03.2010).
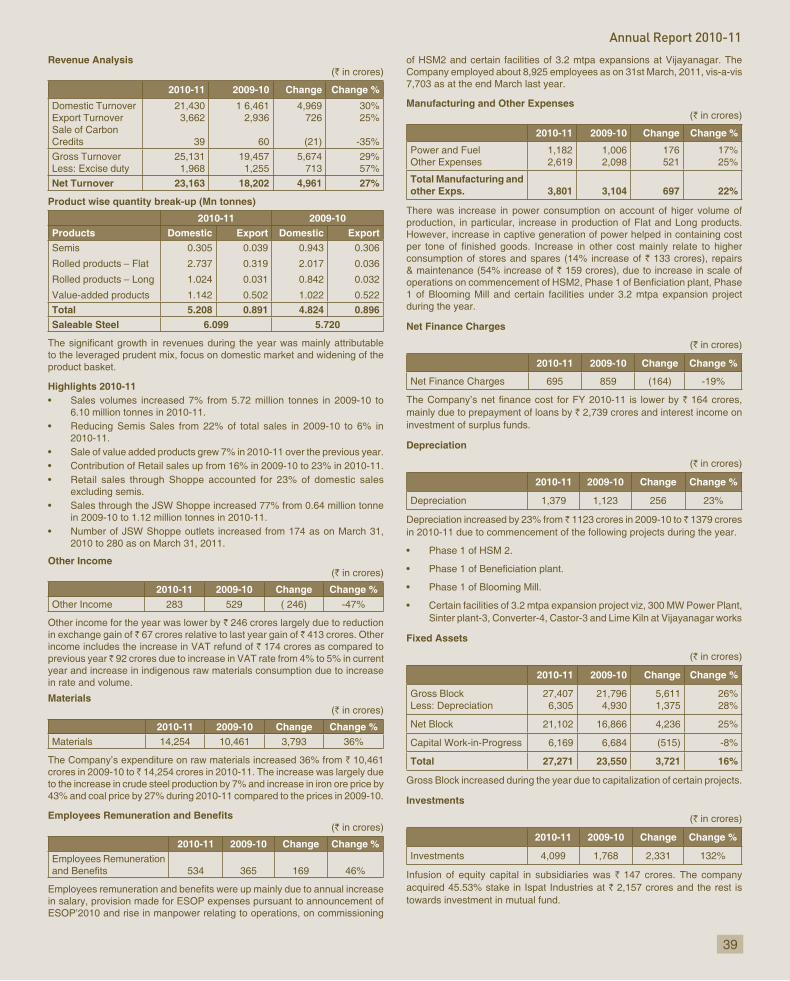
39
Annual Report 2010-11
Revenue Analysis(` in crores)
2010-11 2009-10 Change Change %
Domestic TurnoverExport TurnoverSale of CarbonCredits
21,4303,662
39
1 6,4612,936
60
4,969726
(21)
30%25%
-35%
Gross TurnoverLess: Excise duty
25,1311,968
19,4571,255
5,674713
29%57%
Net Turnover 23,163 18,202 4,961 27%
Product wise quantity break-up (Mn tonnes)
2010-11 2009-10Products Domestic Export Domestic ExportSemis
Rolled products – Flat
Rolled products – Long
Value-added products
0.305
2.737
1.024
1.142
0.039
0.319
0.031
0.502
0.943
2.017
0.842
1.022
0.306
0.036
0.032
0.522
Total 5.208 0.891 4.824 0.896Saleable Steel 6.099 5.720
to the leveraged prudent mix, focus on domestic market and widening of the product basket.
Highlights 2010-11
6.10 million tonnes in 2010-11.
2010-11.
excluding semis.
in 2009-10 to 1.12 million tonnes in 2010-11.
2010 to 280 as on March 31, 2011.
Other Income(` in crores)
2010-11 2009-10 Change Change %Other Income 283 529 ( 246) -47%
Other income for the year was lower by ` 246 crores largely due to reduction in exchange gain of ̀ 67 crores relative to last year gain of ̀ 413 crores. Other income includes the increase in VAT refund of ` 174 crores as compared to previous year ̀ 92 crores due to increase in VAT rate from 4% to 5% in current year and increase in indigenous raw materials consumption due to increase in rate and volume.
Materials(` in crores)
2010-11 2009-10 Change Change %Materials 14,254 10,461 3,793 36%
The Company’s expenditure on raw materials increased 36% from ` 10,461crores in 2009-10 to ̀ 14,254 crores in 2010-11. The increase was largely due to the increase in crude steel production by 7% and increase in iron ore price by 43% and coal price by 27% during 2010-11 compared to the prices in 2009-10.
(` in crores)
2010-11 2009-10 Change Change %Employees Remuneration
534 365 169 46%
in salary, provision made for ESOP expenses pursuant to announcement of ESOP’2010 and rise in manpower relating to operations, on commissioning
of HSM2 and certain facilities of 3.2 mtpa expansions at Vijayanagar. The Company employed about 8,925 employees as on 31st March, 2011, vis-a-vis 7,703 as at the end March last year.
Manufacturing and Other Expenses(` in crores)
2010-11 2009-10 Change Change %
Power and Fuel Other Expenses
1,1822,619
1,0062,098
176521
17%25%
Total Manufacturing and other Exps. 3,801 3,104 697 22%
There was increase in power consumption on account of higer volume of production, in particular, increase in production of Flat and Long products. However, increase in captive generation of power helped in containing cost
consumption of stores and spares (14% increase of ` 133 crores), repairs & maintenance (54% increase of ` 159 crores), due to increase in scale of
1 of Blooming Mill and certain facilities under 3.2 mtpa expansion project during the year.
Net Finance Charges
(` in crores)
2010-11 2009-10 Change Change %
Net Finance Charges 695 859 (164) -19%
` 164 crores, mainly due to prepayment of loans by ` 2,739 crores and interest income on investment of surplus funds.
Depreciation
(` in crores)
2010-11 2009-10 Change Change %
Depreciation 1,379 1,123 256 23%
Depreciation increased by 23% from ̀ 1123 crores in 2009-10 to ̀ 1379 crores in 2010-11 due to commencement of the following projects during the year.
Sinter plant-3, Converter-4, Castor-3 and Lime Kiln at Vijayanagar works
Fixed Assets
(` in crores)
2010-11 2009-10 Change Change %
Gross BlockLess: Depreciation
27,4076,305
21,7964,930
5,6111,375
26%28%
Net Block 21,102 16,866 4,236 25%
Capital Work-in-Progress 6,169 6,684 (515) -8%
Total 27,271 23,550 3,721 16%
Gross Block increased during the year due to capitalization of certain projects.
Investments
(` in crores)
2010-11 2009-10 Change Change %
Investments 4,099 1,768 2,331 132%
Infusion of equity capital in subsidiaries was ` 147 crores. The company acquired 45.53% stake in Ispat Industries at ` 2,157 crores and the rest is towards investment in mutual fund.

40
JSW Steel Limited
Inventories
(` in crores)
2010-11 2009-10 Change Change %
Raw Materials
Production Consumablesand Stores and Spares
Work-in-Progress
Semi Finished/FinishedGoods
1,896
600
264
1,379
1,279
411
114
782
617
189
150
597
48%
46%
132%
76%
Total 4,139 2,586 1,553 60%
The average inventory holding in terms of number of days as on 31st March, 2011 was 81 days vis-a-vis 68 as on 31st March, 2010. Higher inventory of raw materials and spares was mainly due to prepone commencement of 3.2 mtpa expansion project for which inventory buildup was planned. Higher value
Sundry Debtors
(` in crores)
2010-11 2009-10 Change Change %
Total DebtorsLess: Provision forDoubtful debts
855
(16)
581
(18)
274
2
47%
-11%
839 563 276 49%
The average debtors i.e. collection period, in terms of number of days as on 31st March 2011 was 12 days, compared to 11 days as on 31st March, 2010.
Loans and Advances
(` in crores)
2010-11 2009-10 Change Change %
Loans and Advances 3,324 2,123 1,201 57%
Loans and Advances increased from ` 2,123 crores in 2009-10 to ` 3,324crores in 2010-11. The increase was mainly due to addtion of:
a) Loans and advance given to subsidiaries amounting to ` 641 crores.
b) Minimum Alternative Tax credit entitlement of ` 198 crores.
Current Liabilities
(` in crores)
2010-11 2009-10 Change Change %
LiabilitiesProvisions
9,667397
7,358 264
2,309133
31%50%
Total 10,064 7,622 2,442 32%
The current liabilities increased by ` 2,442 crores from ` 7,622 crores in 2009-10 to ̀ 10,064 crores in 2010-11. The increase was mainly due to increase in the level of activity and increase in value of purchase/services for the 3.2 mtpa expansion project.
Secured and Unsecured Loans
(` in crores)
2010-11 2009-10 Change Change %
Secured LoansUnsecured Loans
7,6764,276
8,9872,598
(1,311)1,678
-15%65%
Total 11,952 11,585 367 3%
The Company’s net long-term debt equity ratio declined from 1.14 as on 31st March, 2010 to 0.57 as on 31st March, 2011, as the Company met its entire repayment schedule in 2010-11.
Secured debt is reduced from ` 8,987 crores in 2009-10 to ` 7,676 crores in 2010-11. The decrease was mainly due to utilization of ̀ 2,739 crores received from JFE to pre-pay high-cost debt.
(` in crores)
2010-11 2009-10
Loan repayment 666 988
2010-11 2009-10
Prepayment of Loan 2,739 Nil
Capital Employed
Total capital employed increased by 37% from ` 23,256 crores as on 31st March, 2010 to ` 31,494 crores as on 31st March, 2011.
Return on capital employed declined from 16.8% in 2009-10 to 12.7% in
in scale of operations and funds invested in expansion of ongoing projects would start generating returns from next year.
Own Funds
Net worth increased from ` 9,427 crores as on 31st March, 2010 to ` 16,946crores as on 31st March, 2011 due to plough-back of operational surplus into the business and equity infusion by JFE/Promoters to fund the Company’s future growth initiatives. Return on networth was lower at 15% in 2010-11. The book value improved from ` 504 as on 31st March, 2010 to ` 736 as on 31st March, 2011.
Reserves: Reserves and surplus increased from ` 9,179 crores as on 31st March, 2010 to ` 16,133 crores as on 31st March, 2011. This is a zero cost fund which strengthens the ability of the Company to undertake growth initiatives.
(E) LOOKING INTO THE FINANCIAL STATEMENTS (CONSOLIDATED)
The Company’s consolidated financial statements include the financial performance of the following Subsidiaries, Joint Ventures and Associates.
Subsidiaries:
i. JSW Steel (Netherlands) B.V.
ii. JSW Steel (UK) Limited
iii. Argent Independent Steel (Holdings) Limited
iv. JSW Steel Service Centre (UK) Limited
v. JSW Steel Holding (USA) Inc.
vi. JSW Steel (USA) Inc.
vii. JSW Panama Holdings Corporation
viii. Inversiones Eroush Limitada
ix. Santa Fe Mining
x. Santa Fe Puerto S.A.
xi. JSW Natural Resources Limited
xii. JSW Natural Resources Mozambique Limitada
xiii. JSW Steel Processing Centres Limited
xiv. JSW Bengal Steel Limited
xv JSW Natural Resorces India Limited
xvii. JSW Jharkhand Steel Limited
xviii. JSW Building Systems Limited
xix. JSW ADMS Carvo Lda
xx. Periama Holdings, LLC
xxi. Planck Holdings, LLC

41
Annual Report 2010-11
xxii. Purest Energy, LLC
xxiii. Prime Coal, LLC
xxiv. Lower Hutchinson Minerals, LLC
xxv. Caretta Minerals, LLC
xxvi. Periama Handling, LLC
xxvii. Rolling S Augering, LLC
xxviii. Meadow Creek Minerals, LLC
xxix. Hutchinson Minerals, LLC
xxx. R.C. Minerals, LLC
xxxi. Keenan Minerals, LLC
xxxii. Peace Leasing, LLC
Joint Ventures:
i. Vijayanagar Minerals Private Limited
ii. Rohne Coal Company Private Limited
iii. Geo Steel LLC
v. JSW Structural Metal Decking Limited
vi. Gourangdih Coal Limited
Associates:
i. Jindal Praxair Oxygen Company Private Limited
ii. JSW Energy (Bengal) Limited
iii. Ispat Industries Limited
The Company has reported a Consolidated Gross Turnover, Net Turnover, EBIDTA and PAT of the Company of ` 25,868 crores, ` 23,900 crores, ` 4,947 crores and ̀
lower mainly due to losses attributable to US Plate and Pipe Mill operation. The consolidated net worth and net debt was ` 16,765 crores and ` 14,156 crores respectively. The consolidated debt gearing was at 0.84 as on 31.03.2011.
(F) OUTLOOK
On macro scale, 2011 could be viewed as the year continuing to witness economic recovery, revival, resurgence, challenge of surging commodity
projected Global Economic growth rate to marginally slow down from 5% in 2010 to 4.4% in quantitative terms the world output is estimated to grow by US $ 5.7 trillion. Advanced world as well as the Emerging and the Developing world are slated to witness a marginal reduction in economic growth rates at 2.4% and 6.5% respectively.
The year commenced with an unprecedented wrath of the natural calamities including the historic 3/11 catastrophe in Japan leading to a supply shortage in comodities as well as inputs for automobile and few downstream industries.
economic expansion, is slated to show growth both in production and demand. However there is expected to be a marginal imbalance between the production rate vis-à-vis demand. China, with its 12th Five Year Plan activated, plans to focus on its domestic consumption with increasing emphasis on restructuring and development.
World Steel Association has projected the World Steel Demand growing by 77-MnT / 6% to 1360-MnT, while China is expected to continue its Global dominance at 44% while growing at 5% to 605-MnT. Advanced World is slated to witness demand growth at 5.3% while the Emerging and Developing world at 6.3%.
Indian Steel will see capacity additions to meet the accelerating domestic demand led by rising investments and consumption supplemented by growing export opportunities for value-added engineering products. As per the projection of worldsteel, Indian steel demand is estimated to grow on a strong footage @ 13.3% in CY 2011, while witnessing a growth of 10.6% in production to 66-MnT in FY 2010-11.
Major challenges for Global Steel Industry in near term shall be sustainability of
margins. On the other hand, the bigger challenge going forward for the Global Steel Producers shall be to explore innovative technologies and processes for iron and steel making adapting alternate energy solutions with improved
Forward looking and Cautionary Statements:
Certain statements in the Management Discussion and Analysis concerning our future growth prospects are forward looking statements, which involve a number of risks, and uncertainties that could cause actual results to differ materially from those in such forward looking statements. The risks and uncertainties relating to these statements include, but are not limited to, risks
growth, intense competition within Steel Industry including those factors which may affect our cost advantage, wage increases in India, our ability to attract and retain highly skilled professionals, time and cost overruns on
immigration, our ability to manage our internal operations, reduced demand for steel, our ability to successfully complete and integrate potential acquisitions, liability for damages on our service contracts, the success of the companies
incentives, political instability, legal restrictions on raising capital or acquiring companies outside India, unauthorized use of our intellectual property and general economic conditions affecting our industry. The Company does not undertake to update any forward looking statements that may be made from time to time by or on behalf of the Company.

42
JSW Steel Limited
Report on Corporate Governance for the year 2010-11(Pursuant to Clause 49 of the Listing Agreements entered into with the Stock Exchanges)
1. COMPANY’S GOVERNANCE PHILOSOPHY:
Corporate Governance at JSW Steel Limited has been a continuous journey and the business goals of the Company are aimed at the overall wellbeing and welfare of all the constituents of the system. The Company has laid a strong foundation for making Corporate Governance a way of life by constituting a Board with a balanced mix of experts of eminence and integrity, forming a core group of top level executives, inducting competent professionals across the organization and putting in place best systems, process and technology. The Company combines leading edge technology and innovation with superior application and customer service skills.
At the heart of Company’s Corporate Governance policy is the ideology of transparency and openness in the effective working of the management and Board. It is believed that the imperative for good Corporate Governance lies not merely in drafting a code of Corporate Governance but in practicing it.
as contained in Clause 49 of the Listing Agreement, the details of which are given below:
2. BOARD OF DIRECTORS:
2.1 Appointment and Tenure
The Directors of the Company (except Nominee Directors) are appointed by the shareholders at General Meetings. All Directors except Nominee Directors are subject to retirement by rotation and at every Annual General Meeting 1/3rd of such Directors as are liable to retire by rotation, if eligible, generally offer themselves for re-election, in accordance with the provisions of Section 256 and 257 of the Companies Act, 1956 and that of the Articles of Association of the Company.
The Executive Directors on the Board serve in accordance with the terms of their contracts of service with the Company.
2.2 Composition, Meetings and attendance record of each Director:
The Company has a balanced mix of Executive and Non-Executive Independent Directors. As at 31.03.2011, the Board of Directors comprises of 14 Directors, of which 10 are Non-Executive. The Chairperson is Non-Executive and a Promoter of the Company. The number of Independent Directors is 7 which is in compliance with the stipulated one half of the total number of Directors. All Independent Directors are persons of eminence and bring a wide range of expertise and experience to the Board thereby ensuring the best interest of stakeholders and the Company.
No Director is related to any other Director on the Board in terms
except Mrs. Savitri Devi Jindal & Mr. Sajjan Jindal.
None of the Directors on the Board is a member of more than 10
in Clause 49 of the Listing Agreement) across all the Companies in which he /she is a Director. The necessary disclosures regarding committee positions have been made by the Directors.
The information as required under Annexure1A to Clause 49 of the Listing Agreement is being made available to the Board.
The details of composition of the Board as at 31.03.2011, the attendance record of the Directors at the Board Meetings held during
Meeting (AGM), as also the number of Directorships, Committee Chairmanships and Memberships held by them in other Companies are given here below:
Category Name of Director Position Date of Joining the
Board
No. of Board
Meetingsheld
No. of Board
Meetingsattended
Atten-danceat last AGM
No. of Directorships
in other Indian Public Limited Cos.
No. of Chairmanship(s)/Membership(s) of
Committees in other Indian Public Ltd.
Cos.**Chair-
manship (s)Member-ship(s)
ExecutiveDirectors
Mr. Sajjan Jindal Vice Chairman & Managing Director
15.03.1994 6 6 Yes 7 Nil Nil
Mr. Seshagiri Rao M.V.S. Jt. Managing Director & Group CFO
06.04.1999 6 6 Yes 1 Nil Nil
Dr. Vinod Nowal Director & CEO 30.04.2007 6 6 Yes 2 Nil Nil
Mr. Jayant Acharya Director(Commercial & Marketing)
07.05.2009 6 6 Yes 4 Nil 2
Non-ExecutiveNon-Independent Directors
Mrs. Savitri Devi Jindal Chairperson 18.04.2005 6 None No 8 Nil Nil
Non-ExecutiveIndependentDirectors
Mr. Uday M. Chitale Director 20.10.2005 6 5 Yes 5 2 1
Mr. Anthony Paul Pedder Director 18.04.2005 6 5 Yes Nil Nil Nil
Mr. Sudipto Sarkar Director 09.05.2005 6 4 Yes 8 Nil 5
Dr. S. K. Gupta Director 25.04.1994 6 6 Yes 6 2 5
Mr. K. Vijayaraghavan Director 16.06.2008 6 5 Yes Nil Nil Nil
Dr. Vijay Kelkar Director 20.01.2010 6 5 Yes 7 Nil 2
NomineeDirector
Mrs. Zarin Daruwala Nominee of ICICI Bank Limited (Lender)
13.12.2005 6 4 No 1 Nil Nil
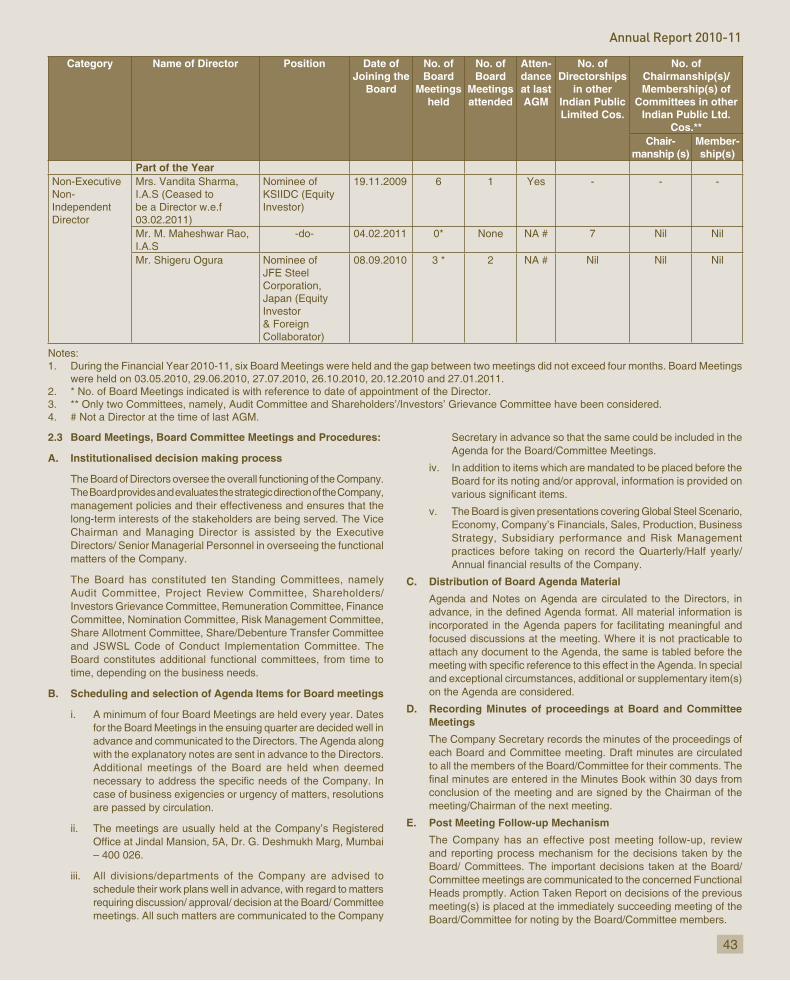
43
Annual Report 2010-11
Category Name of Director Position Date of Joining the
Board
No. of Board
Meetingsheld
No. of Board
Meetingsattended
Atten-danceat last AGM
No. of Directorships
in other Indian Public Limited Cos.
No. of Chairmanship(s)/Membership(s) of
Committees in other Indian Public Ltd.
Cos.**Chair-
manship (s)Member-ship(s)
Part of the Year Non-ExecutiveNon-IndependentDirector
Mrs. Vandita Sharma, I.A.S (Ceased to be a Director w.e.f 03.02.2011)
Nominee of KSIIDC (Equity Investor)
19.11.2009 6 1 Yes - - -
Mr. M. Maheshwar Rao, I.A.S
-do- 04.02.2011 0* None NA # 7 Nil Nil
Mr. Shigeru Ogura Nominee of JFE Steel Corporation,Japan (Equity Investor& Foreign Collaborator)
08.09.2010 3 * 2 NA # Nil Nil Nil
Notes:1. During the Financial Year 2010-11, six Board Meetings were held and the gap between two meetings did not exceed four months. Board Meetings
were held on 03.05.2010, 29.06.2010, 27.07.2010, 26.10.2010, 20.12.2010 and 27.01.2011.2. * No. of Board Meetings indicated is with reference to date of appointment of the Director.3. ** Only two Committees, namely, Audit Committee and Shareholders’/Investors’ Grievance Committee have been considered.4. # Not a Director at the time of last AGM.
2.3 Board Meetings, Board Committee Meetings and Procedures:
A. Institutionalised decision making process
The Board of Directors oversee the overall functioning of the Company. The Board provides and evaluates the strategic direction of the Company, management policies and their effectiveness and ensures that the long-term interests of the stakeholders are being served. The Vice Chairman and Managing Director is assisted by the Executive Directors/ Senior Managerial Personnel in overseeing the functional matters of the Company.
The Board has constituted ten Standing Committees, namely Audit Committee, Project Review Committee, Shareholders/Investors Grievance Committee, Remuneration Committee, Finance Committee, Nomination Committee, Risk Management Committee, Share Allotment Committee, Share/Debenture Transfer Committee and JSWSL Code of Conduct Implementation Committee. The Board constitutes additional functional committees, from time to time, depending on the business needs.
B. Scheduling and selection of Agenda Items for Board meetings
i. A minimum of four Board Meetings are held every year. Dates for the Board Meetings in the ensuing quarter are decided well in advance and communicated to the Directors. The Agenda along with the explanatory notes are sent in advance to the Directors. Additional meetings of the Board are held when deemed
case of business exigencies or urgency of matters, resolutions are passed by circulation.
ii. The meetings are usually held at the Company’s Registered
– 400 026.
iii. All divisions/departments of the Company are advised to schedule their work plans well in advance, with regard to matters requiring discussion/ approval/ decision at the Board/ Committee meetings. All such matters are communicated to the Company
Secretary in advance so that the same could be included in the Agenda for the Board/Committee Meetings.
iv. In addition to items which are mandated to be placed before the Board for its noting and/or approval, information is provided on
v. The Board is given presentations covering Global Steel Scenario, Economy, Company’s Financials, Sales, Production, Business Strategy, Subsidiary performance and Risk Management practices before taking on record the Quarterly/Half yearly/
C. Distribution of Board Agenda Material
Agenda and Notes on Agenda are circulated to the Directors, in
incorporated in the Agenda papers for facilitating meaningful and focused discussions at the meeting. Where it is not practicable to attach any document to the Agenda, the same is tabled before the
and exceptional circumstances, additional or supplementary item(s) on the Agenda are considered.
D. Recording Minutes of proceedings at Board and Committee Meetings
The Company Secretary records the minutes of the proceedings of each Board and Committee meeting. Draft minutes are circulated to all the members of the Board/Committee for their comments. The
conclusion of the meeting and are signed by the Chairman of the meeting/Chairman of the next meeting.
E. Post Meeting Follow-up Mechanism
The Company has an effective post meeting follow-up, review and reporting process mechanism for the decisions taken by the Board/ Committees. The important decisions taken at the Board/Committee meetings are communicated to the concerned Functional Heads promptly. Action Taken Report on decisions of the previous meeting(s) is placed at the immediately succeeding meeting of the Board/Committee for noting by the Board/Committee members.

44
JSW Steel Limited
F. Compliance
While preparing the Agenda, Notes on Agenda, Minutes etc. of the meeting(s), adequate care is taken to ensure adherence to all applicable laws and regulations including the Companies Act, 1956 read with the Rules made thereunder.
2.4 Meetings of Independent Directors:
The Independent Directors of the Company meet at such intervals as they deem appropriate without the presence of Executive Directors or management personnel. These meetings are conducted in an
to discuss matters pertaining to the affairs of the Company and put forth their views to the Vice Chairman and Managing Director.
2.5 Training of Board Members:
The Company believes that the Board be continuously empowered with the knowledge of the latest developments in the Company’s business and the external environment affecting the industry as a whole. To this end, the Directors were given presentations on the global business environment, as well as all business areas of the Company including business strategy, risks opportunities. Monthly updates on performance/developments giving highlights of performance of the Company during each month including the developments/events having impact on the business of the Company are also sent to all the Directors.
3. AUDIT COMMITTEE:
The Audit Committee comprises of four Non-Executive Directors, all of whom are Independent Directors. Mr. Uday M. Chitale is the Chairman of the Audit Committee. The Members possess adequate knowledge of Accounts, Audit, Finance, etc. The composition of the Audit Committee meets with the requirements of Section 292A of the Companies Act, 1956 and of Clause 49 of the Listing Agreement.
The broad terms and reference of Audit Committee are:
Board;b. To review reports of the Management Auditors and Internal
Auditors;c. To review the weaknesses in internal controls reported by
Internal and Statutory Auditors;d. To review the remuneration of Chief Internal Auditor;
f. In addition, the powers and role of the Audit Committee are as laid down under clause 49 II C and D of the Listing Agreement and Section 292A of the Companies Act, 1956.
year 2010-11, as against the minimum requirement of four meetings. The details are as follows:
Sl.No.
Date CommitteeStrength
No. of Members Present
1 03rd May, 2010 4 42 21st July, 2010 4 33 26th July, 2010 4 34 24th September, 2010 4 35 25th October, 2010 4 46 10th December, 2010 4 37 27th January, 2011 4 4
The Constitution of the Committee as at 31.03.2011 and the attendance of each Member are as given below:
Sl.No.
Name of the Members
Category No. of MeetingsAttended
1 Mr. Uday M. Chitale Chairman
Non-ExecutiveIndependent Director
7
2 Dr. S. K. GuptaMember
Non-ExecutiveIndependent Director
7
Sl.No.
Name of the Members
Category No. of MeetingsAttended
3 Mr. Sudipto Sarkar Member
Non-ExecutiveIndependent Director
3
4. Mr. K. VijayaraghavanMember
Non-ExecutiveIndependent Director
7
The Jt. Managing Director & Group CFO, Director & CEO, Director
of each Unit, Vice President (Internal Audit), the Company Secretary and the representatives of the Statutory Auditors attend the Audit Committee Meetings. The representatives of Management Auditors attend the Audit Committee Meeting whenever matters relating to management audit are considered. The Company Secretary is the Secretary of the Audit Committee.
Mr. Uday M. Chitale, Chairman of the Audit Committee was present at the last Annual General Meeting held on 29.06.2010.
4. REMUNERATION COMMITTEE:
The Remuneration Committee, which is a non-mandatory requirement of Clause 49, was constituted on 27.03.2002.
The terms of reference of the committee are as follows:
i. To determine on behalf of the Board and on behalf of the
packages for Executive Directors including pension rights and any compensation payment.
ii. To approve the payment of remuneration to Managerial Personnel as per the Policy laid down by the Committee.
One meeting of the Remuneration Committee was held during the
The composition of the Remuneration Committee as at 31.03.2011 and attendance of each member at the committee meetings are as given below:
Sl.No.
Name of the Members Category No. of Meetings
held
No. of MeetingsAttended
1 Dr. S. K. Gupta Chairman
Non-ExecutiveIndependentDirector
1 1
2 Mr. Uday M Chitale Member
Non-ExecutiveIndependentDirector
1 1
3 Mr. Anthony Paul PedderMember
Non-ExecutiveIndependentDirector
1 1
4 Mr. K. Vijayaraghavan Member
Non-ExecutiveIndependentDirector
1 1
The Company has complied with the non-mandatory requirement of Clause 49 regarding the Remuneration Committee.
4.1 Remuneration Policy and Details of Remuneration paid to Directors:
The Remuneration Committee recommends the remuneration package for the Executive Directors of the Board. In framing the remuneration policy, the Committee takes into consideration the remuneration practices of Companies of similar size and stature, the Industry Standards and competitive circumstances of each business so as to attract and retain quality talent and leverage performance

45
Annual Report 2010-11
The Directors’ compensation is based on the appraisal system wherein their individual goals are linked to the organizational goals. Executive Directors (ED) are paid compensation as per the agreements entered into between them and the Company, subject to the approval of the Board and of the members in General Meeting and such other approvals, as may be necessary.
The present remuneration structure of ED comprises of salary, perquisites, allowances, performance linked incentive, ESOPs and contributions to PF and Gratuity.
The Non-Executive Directors are paid remuneration by way of Commission and Sitting fees. The commission payable to the Non-Executive Directors is based on the number of meetings of the Board attended by them and their Chairmanship/Membership of Audit Committee during the year subject to an overall ceiling of 1%
sitting fees at the rate of ` 20,000/- for each meeting of the Board and sub-committees attended by them.
The details of commission paid/payable to the Non-Executive
Sr.No
Name From To CommissionPayable
(` in crores)1 Mrs. Savitri Devi Jindal 1-Apr-10 31-Mar-11 0.082 Dr. S. K. Gupta 1-Apr-10 31-Mar-11 0.133 Mr. Uday M. Chitale 1-Apr-10 31-Mar-11 0.144 Dr. Vijay Kelkar 1-Apr-10 31-Mar-11 0.125 Mr. Anthony Paul Pedder 1-Apr-10 31-Mar-11 0.13
6 Mr. Sudipto Sarkar 1-Apr-10 31-Mar-11 0.117 Mr. K. Vijayaraghavan 1-Apr-10 31-Mar-11 0.138 Mrs. Zarin Daruwala
(Nominee ICICI Bank Limited)*
1-Apr-10 31-Mar-11 0.11
9 Mrs. Vandita Sharma I.A.S andMr. M. Maheshwar Rao, I.A.S (Nominee KSIIDC)*
1-Apr-10 31-Mar-11 0.09
10 Mr. Shigeru Ogura (Nominee JFE Steel Corporation)*
8-Sep-10 31-Mar-11 0.06
* Payable to the respective Institutions/Organisation they represent.
The Details of Remuneration paid /payable to the Whole-time Directors
Name of Director
Salary(` in
crores)
Perks(` in
crores)Commission(` in crores)
Period of Contract
NoticePeriod
Mr. Sajjan JindalViceChairman & ManagingDirector
5.83 0.61 14.36 From07.07.2007
to06.07.2012
NA
Mr. Seshagiri Rao M.V.S Jt. Managing Director & Group CFO
3.13 0.13 – From06.04.2009
to05.04.2014
3 months from either
side or salary in lieu
thereof.Dr. Vinod NowalDirector & CEO
2.26 0.09 – From30.04.2007
to29.04.2012
3 months from either
side or salary in lieu
thereof.Mr. Jayant AcharyaDirector(Commercial& Marketing)
1.91 0.09 – From07.05.2009
to06.05.2014
3 months from either
side or salary in lieu
thereof.TOTAL 13.13 0.92 14.36
Note: The abcontribution to the approved Group Gratuity Fund, which are actuarially determined for the Company as a whole.
Shareholding of the Non-Executive Directors in the Company as on 31.03.2011:
None of the Non-Executive Directors other than those named below hold any shares in the Company:
Sl. No. Director No. of Equity Shares of ` 10/- each held1 Mrs. Savitri Devi
Jindal7530
2 Dr. S. K. Gupta 4000
5. SHAREHOLDERS/INVESTORS GRIEVANCE COMMITTEE:
The Shareholders/Investors Grievance Committee comprises of 3 Non-Executive Directors all of whom are Independent Directors.
The terms of reference of the Committee are as follows:
a) Review the reports submitted by the Registrars and Share Transfer Agents of the Company at half yearly intervals.
b) Periodically interact with the Registrars and Share Transfer Agents to ascertain and look into the quality of the Company’s Shareholders/ Investors grievance redressal system and to review the report on the functioning of the Investor grievances redressal system.
c) Follow-up on the implementation of suggestions for improvement, if any.
d) Periodically report to the Board about serious concerns, if any.
The Shareholders /Investors Grievance Committee met twice during
constitution of the committee and the details of the meetings attended by the Members are as given below:
Sl.No.
Name of the Director Category No. of Meetings
held
No. of MeetingsAttended
1 Mr. K. VijayaraghavanChairman
Non-ExecutiveIndependentDirector
2 1
2 Dr. S. K. GuptaMember
Non-ExecutiveIndependentDirector
2 2
3 Mr. Uday M. ChitaleMember
Non-ExecutiveIndependentDirector
2 2
Mr. Lancy Varghese, the Company Secretary is the Compliance cer for complying with the requirements of SEBI Regulations
and the Listing Agreement with the Stock Exchanges in India. His address and contact details are as given below:Address: Victoria House, Pandurang Budhkar Marg, Lower Parel
(W), Mumbai - 400 013Phone: 022-24927000 / 43437800Fax: 022-24917933Email: [email protected]
Investor Grievance RedressalNumber of complaints received and resolved to the satisfaction of Shareholders/Investors during the year under review and their break-up is as under:
No. of Shareholders’ Complaints received during the year ended 31.03.2011
: 769
Number not solved to the satisfaction of Shareholders : NilNo. of pending Complaints as on 31.03.2011 : NilNo. of pending Share Transfers as on 31.03.2011 : 114*
*There were no share transfers pending for registration for more than 15 days as on the said date.

46
JSW Steel Limited
5002500450065008500
1050012500145001650018500
2010-112009-102008-092007-082006-072005-062004-052003-04
No. of Complaints Received
Note: Complaints pertaining to the years subsequent to 2004-05 include investor complaints received from shareholders of Jindal Iron & Steel Co. Limited and Southern Iron & Steel Co. Limited upon its merger with the
258
241
Non-receipt of Share Certificates
Type of Complaints Received
Non-receipt of Dividend Warrants
SEBI Complaints, Stock ExchangesComplaints/DOCA,Court/Advocate notices etc.
270
6. OTHER MAJOR COMMITTEES OF DIRECTORS:
In addition to the above referred Committees which are constituted pursuant to the Corporate Governance Code, the Board has constituted the following major Committees of Directors and delegated
Time schedule for holding the meetings of such Functional Committees
Sl.No.
Name of the Committee
Composition Terms of Reference Frequency of Meetings
01 ProjectReviewCommittee
1. Mr. Anthony Paul Pedder (Chairman), Non-Executive Independent Director
2. Dr. Vinod Nowal,Executive Director
3. Dr. S. K. Gupta,Non-Executive Independent Director
4. Mr. K. Vijayaraghavan,Non-Executive Independent Director
5. Mr. Shigeru Ogura, Nominee Director,
JFE Steel Corporation, Japan
1. To closely monitor the progress of Large Projects, in addition to ensuring a proper and effective co-ordination amongst the various project modules essentially with the objective of timely project completion within the budgeted project outlay.
2. To review new strategic initiatives.
Quarterly
Four meetings were held on 02.05.2010, 26.07.2010, 27.10.2010 and 28.01.2011.
02 RiskManagementCommittee *
1. Dr. S. K. Gupta (Chairman),Non-Executive Independent Director
2. Mr. Seshagiri Rao M.V.S.,Executive Director
3. Mr. Jayant Acharya,Executive Director
4. Mr. Uday M. ChitaleNon-Executive Independent Director
5. Mr. K. Vijayaraghavan,Non-Executive Independent Director
1. To periodically review risk assessment and minimisation procedures to ensure that, Executive Management controls risk through
2. To review major risks and proposed action plan.
Quarterly
Three Meetings were held on 21.07.2010, 24.09.2010 and 10.12.2010.
03 NominationCommittee
1. Mr. Sajjan Jindal (Chairman), Executive Director
2. Mr. Uday M. Chitale,Non-Executive Independent Director
3. Mr. Anthony Paul Pedder,Non-Executive Independent Director
1. To consider Nomination of persons to be inducted on the Board
Need based
One Meeting was held on 27.07.2010.
04 FinanceCommittee
1. Mr. Sajjan Jindal (Chairman),Executive Director
2. Mr. Seshagiri Rao M.V.S., Executive Director
3. Dr. Vinod Nowal, Executive Director
4. Mr. Jayant Acharya,Executive Director
of any description from Banks/Financial Institutions/ Bodies Corporate within the limits approved by the Board.
2. To approve investments and dealings with any monies of the Company upon such security or without security in such manner as the ‘said
to vary or realise such investments within the framework of the guidelines laid down by the Board.
Need based
Meetings were held on 14.04.2010, 16.04.2010, 19.04.2010, 03.05.2010, 10.05.2010, 20.05.2010, 25.05.2010, 22.06.2010, 30.06.2020, 13.07.2010, 23.07.2010, 30.07.2010, 13.08.2010, 16.09.2010, 22.09.2010, 01.10.2010,

47
Annual Report 2010-11
Sl.No.
Name of the Committee
Composition Terms of Reference Frequency of Meetings
to declare the same as such under Section 2(9) of the Companies Act, 1956 and to authorise personnel by way of Power of Attorney or otherwise, to register the aforesaid branches and to deal with various authorities such as the Central Excise, Profession Tax, Commercial Tax, State & Central Sales Tax, VAT Authorities and other Local Authorities.
4. To make loans to Individuals/Bodies Corporate and/or to place deposits with other Companies/Firms upon such security or without security in
within the limits approved by the Board.
5. To open Current Account(s), Collection Account(s), Operation Account(s), or any other Account(s) with Banks and also to close such accounts, which the ‘said Committee’ may consider necessary and expedient.
28.10.2010, 08.11.2010, 25.11.2010, 13.12.2010, 20.12.2010, 30.12.2010, 07.01.2011, 01.02.2011, 07.03.2011 and 23.03.2011.
*The Risk Management Committee, a sub-committee of the Board has further constituted:i. “Capex Risk Evaluation Committee” to evaluate the risks associated with capex proposals including mergers and acquisitions.ii. Locational Committees namely (a) Corporate Locational Committee (b) Upstream Locational Committee (c) Downstream Locational Committee
and (d) Salem Locational Committee to further review risk assessment at Locational Level.
7. GENERAL BODY MEETINGS:
A. Annual General Meetings:
The details of date and time of the Annual General Meetings (AGMs) of the Company held during the preceding three years, at Birla Matushri Sabhagar,19, New Marine Lines, Mumbai 400 020 and the Special Resolutions passed there at are as under:
AGM Date Time Special Resolutions Passed
14th AGM 16.06.2008 11.00 a.m. Nil
15th AGM 06.07.2009 11.00 a.m. 1. To issue, offer and allot Equity Shares and/or Securities other than Warrants, which are convertible
for an aggregate amount not exceeding US$ 1 Billion and/or2. To offer, issue, and allot in one or more tranches, Foreign Currency Convertible Bonds (FCCBs)/
Global Depository Receipts (GDRs)/American Depository Receipts (ADRs)/Warrants and/or other Instruments convertible into Equity shares not exceeding US$ 1 Billion in the aggregate.(Such that the total amount to be raised vide both of the above proposed issues would not in the aggregate exceed a sum of US $ 1 Billion or its Indian Rupee equivalent, inclusive of such premium as may be determined by the Board).
16th AGM 29.06.2010 11.00 a.m.
from 1st April, 2010, in addition to the sitting fees and reimbursement of expenses incurred.
B. Extra Ordinary General Meetings:
The details of date, time and venue of the Extra General Meetings (EGMs) of the Company held during the preceding three years and the Special Resolutions passed there at are as under:
EGM – Date & Time Venue Special Resolutions Passed
02.06.201011.00 a.m.
Birla Matushri Sabhagar,19 Marine Lines, Mumbai - 400 020
To approve the issue of upto 1,75,00,000 Warrants convertible into Equity Shares of the Company to Sapphire Technologies Limited, a promoter group company on a preferential basis.
26.08.201011.00 a.m.
Patkar Convocation Hall of S.N.D.T Women’s University, 1, Nathibai Thackersey Road, New Marine Lines, Mumbai - 400 020
To create, offer, issue and allot either Equity Shares or a Fully Convertible Debenture of the Company representing not more than 14.99% of the paid-up equity share capital of the Company to JFE Steel Corporation, Japan, on a preferential basis.

48
JSW Steel Limited
C. Special Resolutions passed through Postal Ballot during 2010-11:
Pursuant to Section 81(1A) of the Companies Act,1956 read with the Companies (Passing of Resolutions by Postal Ballot) Rules, 2001, a Notice dated October 26, 2010 was sent to the Shareholders seeking their consent for the following:
1. Issue of 977,906 Equity Shares on a preferential basis to JFE Steel Corporation, Japan.
2. Issue of 3,085,814 Global Depository Receipts (GDRs) on a preferential basis to JFE Steel Corporation, Japan.
The ballot forms were returnable by December 04, 2010, The results
Company at Jindal Mansion, 5A Dr. G. Deshmukh Marg, Mumbai 400 026.
Mr. Prem Rajani of Rajani Associates, Advocates & Solicitors, Mumbai, was appointed as Scrutinizer to receive and scrutinize the completed postal ballot papers received from the Members and for conducting the Postal Ballot process in a fair and transparent manner.
The results of the voting conducted through Postal Ballot are as given below:
Reso-lutionNo.
Particulars No. of valid votes cast
Votes cast in favour of the resolu-
tion
Votescast
againstthe
resolu-tion
1. Issue of 977,906 Equity Shares on a preferential basis to JFE Steel Corpora-tion, Japan
13,13,30,202 13,12,84,501 45,701
2 Issue of 3,085,814Global Deposi-tory Receipts (GDRs) on a preferential ba-sis to JFE Steel Corporation,Japan
13,13,25,612 13,12,76,395 49,217
None of the businesses proposed to be transacted in the ensuing Annual General Meeting require passing a special resolution through Postal Ballot.
8. DISCLOSURES:
i.e. transactions of the Company of material nature with its Promoters, Directors or the Management, their relatives or
Company.
ii. No penalties or strictures have been imposed on the Company by the Stock Exchanges or SEBI or any Statutory Authority on any matter related to capital markets during the last three years.
iii. The Company has laid down procedures to inform Board members about the risk assessment and minimisation procedures, which are periodically reviewed.
9. WHISTLE BLOWER POLICY:
The Whistle Blower Policy (WBP) adopted by the Company in line with Clause 7 of Annexure 1D to Clause 49 of the Listing Agreement, which is a non-mandatory requirement, encourages all employees,
and intends to investigate any good faith reports of violations. The
for reporting unethical behavior, actual or suspected fraud or violation of the Company’s Code of Conduct or ethics policy or any other unethical or improper activity including misuse or improper use of accounting policies and procedures resulting in misrepresentation
WBP also provides safeguards against victimization or unfair treatment of the employees who avail of the mechanism and no personnel has been denied access to the Audit Committee.
10. SUBSIDIARY MONITORING FRAMEWORK:
All the Subsidiary Companies of the Company are Board managed with their Boards having the right and obligations to manage such companies in the best interest of their stakeholders. As a majority shareholder, the Company nominates its representatives on the Boards of subsidiary companies and monitors the performance of such companies, inter alia, by the following means:
a) A copy of the Minutes of the Meetings of the Board of Directors of the Company’s subsidiaries along with Exception Reports and
tabled before the Company’s Board, quarterly.
b) A summary of the Minutes of the Meetings of the Board of Directors of the Company’s subsidiaries are circulated to the Company’s Board, quarterly.
c) A statement containing all significant transactions and arrangements entered into by the unlisted subsidiary companies is placed before the Company’s Board.
11. MEANS OF COMMUNICATION:
Timely disclosure of consistent, comparable, relevant and reliable
governance. Towards this end:
a) Quarterly/ Half Yearly/ Annual Results: The Quarterly, Half Yearly and Annual Results of the Company are sent to the Stock Exchanges immediately after they are approved by the Board.
b) Publication of Quarterly/ Half Yearly/ Annual Results: The Quarterly, Half Yearly and Annual Results of the Company are published in the prescribed proforma within 48 hours of the conclusion of the meeting of the Board in which they are considered, at least in one English newspaper circulating in the whole or substantially the whole of India and in one Vernacular newspaper of the State of Maharashtra where the Registered
e of the Company is situated.
published as detailed below:
Quarter(F.Y. 2010-11)
Date of Board
Meeting
Date of publication
Name of the Newspapers
1 27.07.2010 28.07.2010 The Financial Express and Navshakti
2 26.10.2010 27.10.2010 The Financial Express and Navshakti
3 27.01.2011 28.01.2011 The Financial Express and Navshakti
c) To
other press releases are sent to the Stock Exchanges as well as displayed on the Company’s website before it is released to the media.
d) Website: The Company’s website www.jsw.in contains a separate dedicated section “Investor Zone” where information for shareholders is available. The Quarterly/Annually Financial Results, annual reports, analysts presentations, investor forms, stock exchange information, shareholding pattern, corporate
posted on the
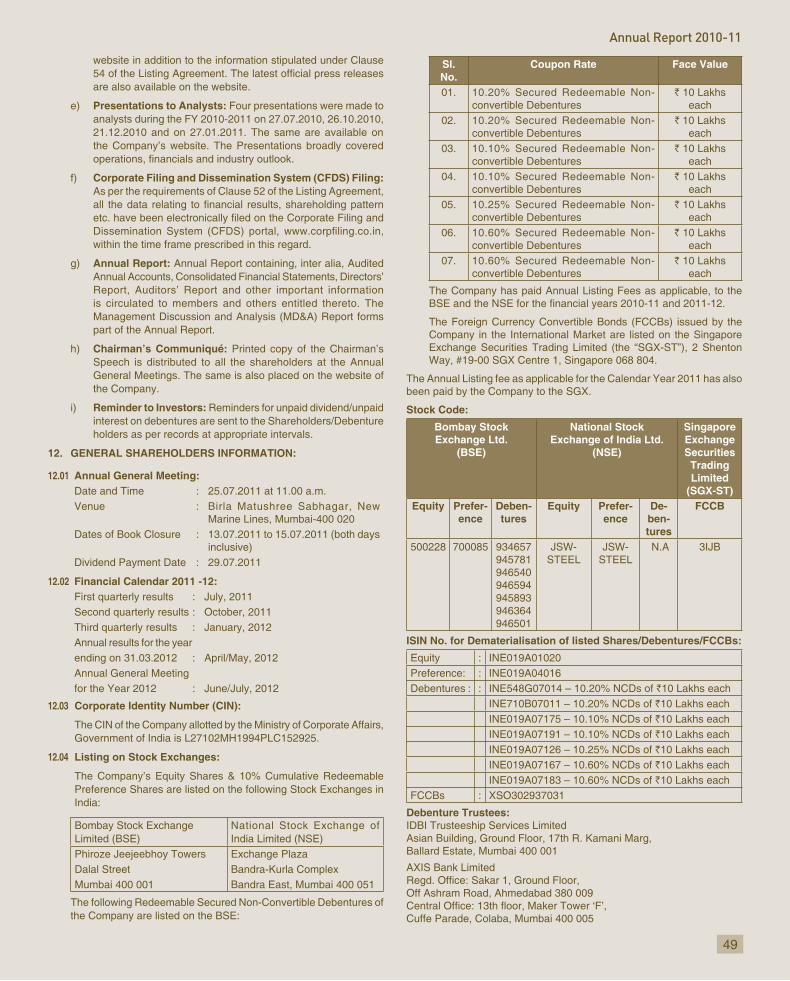
49
Annual Report 2010-11
website in addition to the information stipulated under Clause
are also available on the website.
e) Presentations to Analysts: Four presentations were made to analysts during the FY 2010-2011 on 27.07.2010, 26.10.2010, 21.12.2010 and on 27.01.2011. The same are available on the Company’s website. The Presentations broadly covered
f) Corporate Filing and Dissemination System (CFDS) Filing: As per the requirements of Clause 52 of the Listing Agreement,
within the time frame prescribed in this regard.
g) Annual Report: Annual Report containing, inter alia, Audited Annual Accounts, Consolidated Financial Statements, Directors’ Report, Auditors’ Report and other important information is circulated to members and others entitled thereto. The Management Discussion and Analysis (MD&A) Report forms part of the Annual Report.
h) Chairman’s Communiqué: Printed copy of the Chairman’s Speech is distributed to all the shareholders at the Annual General Meetings. The same is also placed on the website of the Company.
i) Reminder to Investors: Reminders for unpaid dividend/unpaid interest on debentures are sent to the Shareholders/Debenture holders as per records at appropriate intervals.
12. GENERAL SHAREHOLDERS INFORMATION:
12.01 Annual General Meeting:Date and Time : 25.07.2011 at 11.00 a.m.Venue : Birla Matushree Sabhagar, New
Marine Lines, Mumbai-400 020Dates of Book Closure : 13.07.2011 to 15.07.2011 (both days
inclusive)Dividend Payment Date : 29.07.2011
12.02 Financial Calendar 2011 -12:First quarterly results : July, 2011Second quarterly results : October, 2011Third quarterly results : January, 2012Annual results for the yearending on 31.03.2012 : April/May, 2012Annual General Meetingfor the Year 2012 : June/July, 2012
12.03 Corporate Identity Number (CIN):
The CIN of the Company allotted by the Ministry of Corporate Affairs, Government of India is L27102MH1994PLC152925.
12.04 Listing on Stock Exchanges:
The Company’s Equity Shares & 10% Cumulative Redeemable Preference Shares are listed on the following Stock Exchanges in India:
Bombay Stock Exchange Limited (BSE)
National Stock Exchange of India Limited (NSE)
Phiroze Jeejeebhoy Towers Exchange PlazaDalal Street Bandra-Kurla ComplexMumbai 400 001 Bandra East, Mumbai 400 051
The following Redeemable Secured Non-Convertible Debentures of the Company are listed on the BSE:
Sl.No.
Coupon Rate Face Value
01. 10.20% Secured Redeemable Non-convertible Debentures
` 10 Lakhs each
02. 10.20% Secured Redeemable Non-convertible Debentures
` 10 Lakhs each
03. 10.10% Secured Redeemable Non-convertible Debentures
` 10 Lakhs each
04. 10.10% Secured Redeemable Non-convertible Debentures
` 10 Lakhs each
05. 10.25% Secured Redeemable Non-convertible Debentures
` 10 Lakhs each
06. 10.60% Secured Redeemable Non-convertible Debentures
` 10 Lakhs each
07. 10.60% Secured Redeemable Non-convertible Debentures
` 10 Lakhs each
The Company has paid Annual Listing Fees as applicable, to the
The Foreign Currency Convertible Bonds (FCCBs) issued by the Company in the International Market are listed on the Singapore Exchange Securities Trading Limited (the “SGX-ST”), 2 Shenton Way, #19-00 SGX Centre 1, Singapore 068 804.
The Annual Listing fee as applicable for the Calendar Year 2011 has also been paid by the Company to the SGX.
Stock Code:
Bombay Stock Exchange Ltd.
(BSE)
National Stock Exchange of India Ltd.
(NSE)
SingaporeExchangeSecurities
TradingLimited
(SGX-ST)Equity Prefer-
enceDeben-tures
Equity Prefer-ence
De-ben-tures
FCCB
500228 700085 934657945781946540946594945893946364946501
JSW-STEEL
JSW-STEEL
N.A 3IJB
ISIN No. for Dematerialisation of listed Shares/Debentures/FCCBs:
Equity : INE019A01020Preference: : INE019A04016Debentures : : INE548G07014 – 10.20% NCDs of `10 Lakhs each
INE710B07011 – 10.20% NCDs of `10 Lakhs eachINE019A07175 – 10.10% NCDs of `10 Lakhs eachINE019A07191 – 10.10% NCDs of `10 Lakhs eachINE019A07126 – 10.25% NCDs of `10 Lakhs eachINE019A07167 – 10.60% NCDs of `10 Lakhs eachINE019A07183 – 10.60% NCDs of `10 Lakhs each
FCCBs : XSO302937031
Debenture Trustees:IDBI Trusteeship Services LimitedAsian Building, Ground Floor, 17th R. Kamani Marg, Ballard Estate, Mumbai 400 001
AXIS Bank Limited
Off Ashram Road, Ahmedabad 380 009
Cuffe Parade, Colaba, Mumbai 400 005

50
JSW Steel Limited
FCCB Trustees:CITIBANK N.ALondon Branch, 14th Floor, Citigroup Centre, Canada Square, Canary Wharf, London - E14 5LB
12.05 Market Price Data
The monthly high/low market price of the shares and the quantities traded during the year 2010-11 at the Bombay and National Stock Exchanges are as under:
Month Bombay Stock Exchange Ltd. National Stock Exchange of India Ltd.
High (In ` Pershare)
Low (In ` Per share)
No. of sharestraded
High (In ` Per share)
Low (In ` Per share)
No. of sharestraded
Apl’ 2010 1300.00 1170.5 52,94,949 1301.90 1170.00 2,55,84,476May 2010 1274.00 984.95 1,32,73,087 1271.00 983.20 4,95,68,618Jun’ 2010 1118.30 1000.00 91,19,418 1118.35 1001.00 3,92,82,194Jul’ 2010 1231.00 1020.00 93,62,316 1230.50 1020.00 3,57,94,315Aug’ 2010 1169.80 1085.00 43,93,460 1169.95 1083.60 1,97,33,045Sept’ 2010 1344.20 1132.10 48,68,151 1347.00 1133.15 2,38,76,461Oct’ 2010 1400.00 1212.00 39,97,146 1400.00 1212.35 2,58,55,558Nov’ 2010 1363.40 1095.00 15,34,851 1365.85 1093.60 94,96,215Dec’ 2010 1240.00 1033.35 37,85,149 1239.70 1031.00 2,15,83,054Jan’ 2011 1212.50 851.55 69,85,429 1213.80 860.10 3,69,44,417Feb’ 2011 945.95 752.00 1,00,81,314 945.00 750.85 4,03,80,052Mar’ 2011 972.50 831.35 97,15,439 972.40 858.50 3,83,40,241
12.06 Performance of Share Price in comparison to BSE Sensex:
12.09Registrar & Share Transfer Agents:Karvy Computershare Private LimitedPlot No.17 to 24, Vittalrao Nagar, Madhapur, Hyderabad 500 081Ph: 040 - 23420815-824 (10 lines)Fax: 040 - 23420814E-mail: [email protected]: www.karvy.com
12.10Share Transfer System:
Transfer of Shares held in physical form can be lodged with Karvy Computershare Private Limited at the above mentioned address. The transfer requests are normally processed within 15 days of receipt of the documents, if documents are found in order. Shares under objection are returned within two weeks.
The Board has delegated the authority for approving transfers, transmissions etc. of the Company’s securities to the Share/Debenture Transfer Committee. The decisions of Share/Debenture Transfer Committee are placed at the Next Board Meeting. The Company obtains from a Company Secretary in Practice, a half
as required under Clause 47(c) of the Listing Agreement with
Exchanges.
12.11Distribution of Shareholding:
The distribution of shareholding by size as on 31.03.2011 is given below:
Sl.No.
No. of Equity Shares
No. ofShareholders
% ofShareholders
No. of Shares held
% of Share-holding
1 1-500 543514 99.33 12362074 5.542 501-1000 1968 0.36 1408787 0.633 1001-2000 783 0.14 1111256 0.504 2001-3000 219 0.04 535852 0.245 3001-4000 100 0.02 354481 0.166 4001-5000 74 0.01 339317 0.157 5001-10000 154 0.03 1076556 0.488 10001-20000 92 0.02 1322005 0.599 20001 and
above293 0.05 204606872 91.70
Total 547197 100.00 223117200 100.00
12.12 Shareholding Pattern:
As on 31.03.2011 As on 31.03.2010Category No. of
HoldersNo. of Shares
% of holding
No. of Holders
No. of Shares
% of holding
Promoters 111 84143661 37.71 112 84175673 45NRI 11478 3111779 1.39 11630 3101605 1.66FII 274 54740502 24.53 319 59591549 31.86OCB 7 40712 0.02 7 40712 0.02FBC 3 41201389 18.47 2 8218685 4.39IFI 11 8202236 3.68 5 5818696 3.11IMF 83 1354265 0.61 71 1701778 0.91Banks 30 1358165 0.61 24 2032832 1.09Employees 2039 96247 0.04 2239 62706 0.03
BodiesCorporate
2902 8981353 4.03 2683 7572699 4.05
Public 527660 15308532 6.86 521338 13642278 7.29
Trust 13 1120268 0.50 11 833140 0.45
HUF 2584 371081 0.17 2164 255133 0.14
GDR 1 3085814 1.38 0 0 0
Transit A/C 1 1196 0.00 1 1196 0
Total 547197 223117200 100.00 540606 187048682 100
12.07 Performance of Share Price in comparison to S & P CNX Nifty:
15000
16000
17000
18000
19000
20000
21000
22000
Mar
-11
Feb
-11
Jan-
11
Dec
-10
Nov
-10
Oct
-10
Sep
t-10
Aug
-10
Jul-1
0
Jun-
10
May
-10
Apr
-10 500
600
700
800
900
1000
1100
1200
1300
1400
BS
E S
ense
x
Sha
re P
rice
BSE Sensex JSW Share Price
5000510052005300540055005600570058005900600061006200
Mar
-11
Feb
-11
Jan-
11
Dec
-10
Nov
-10
Oct
-10
Sep
t-10
Aug
-10
Jul-1
0
Jun-
10
May
-10
Apr
-10 700
800
900
1000
1100
1200
1300
1400
S &
P C
NX
Nift
y
Sha
re P
rice
S & P CNX Nifty JSW Share Price
12.08 Percentage change in comparison to Broad Based indices – Sensex and Nifty as on March 31, 2011 :
FinancialYear
JSW Share Price %
Sensex%
JSW Share Price %
Nifty %
2010-11 78 111 77 1112009-10 533 181 530 1742008-09 -71.17 -38.44 -71.57 -36.132007-08 65.99 18.21 66.18 23.882006-07 63.01 13.22 62.78 12.312005-06 -16.04 42.33 -16.45 67.14

51
Annual Report 2010-11
12.13 Top 10 Shareholders as on 31.03.2011:
Sl. No. Name Shares %
1 JFE Steel Corporation 32982704 14.78
2 Jindal South West Holdings Limited 17284923 7.75
3 JSW Energy Investments Private Limited 13764364 6.17
4 JSW Investments Private Limited 7858165 3.52
5 JSW Power Trading Company Limited 7003835 3.14
6 Janus Contrarian Fund 6549160 2.94
7 Duferco Coke Investments Limited 5035241 2.26
8 Nalwa Sons Investments Limited 4548537 2.04
9 Mavi Investment Fund Limited 4417000 1.98
10 Life Insurance Corporation of India 4175363 1.87
12.14 Geographical Distribution of Shareholders as on 31.03.2011:
Sl.No.
Name of the City
Electronic Physical Total
No. ofShareholders
No. ofShares
% of totalShareholding
No. ofShareholders
No. of Shares
% of totalShareholding
No. ofShareholders
No. of Shares
% of totalShareholding
1 Mumbai 38629 173220442 77.64 31011 874253 0.39 69640 174094695 78.03
2 New Delhi 18011 14381469 6.45 29249 393198 0.18 47260 14774667 6.62
3 Ahmedabad 10377 714131 0.32 11247 137266 0.06 21624 851397 0.38
4 Calcutta 9725 1023917 0.46 9410 143242 0.06 19135 1167159 0.52
5 Bangalore 8650 1385546 0.62 8653 569183 0.26 17303 1954729 0.88
6 Chennai 7113 2206240 0.99 7241 115994 0.05 14354 2322234 1.04
7 Pune 4885 231919 0.10 3529 57144 0.03 8414 289063 0.13
8 Hyderabad 4536 284594 0.13 5147 75556 0.03 9683 360150 0.16
9 Vadodara 5050 178545 0.08 5855 51387 0.02 10905 229932 0.10
10 Agra 1078 31763 0.01 2134 17372 0.01 3212 49135 0.02
11 Chandigarh 1489 59138 0.03 2401 23189 0.01 3890 82327 0.04
12 Coimbatore 3544 613617 0.28 5827 176980 0.08 9371 790597 0.35
13 Gandhi Nagar 2675 59584 0.03 4224 30933 0.01 6899 90517 0.04
14 Ghaziabad 1246 39742 0.02 1779 16848 0.01 3025 56590 0.03
15 Hissar 1371 4658751 2.09 3579 55690 0.02 4950 4714441 2.11
16 Howrah 1552 54492 0.02 1524 20931 0.01 3076 75423 0.03
17 Indore 1723 63614 0.03 2592 23411 0.01 4315 87025 0.04
18 Jaipur 3459 109235 0.05 4982 42282 0.02 8441 151517 0.07
19 Jamnagar 1164 21309 0.01 2273 16215 0.01 3437 37524 0.02
20 Kanpur 2000 171853 0.08 3577 35000 0.02 5577 206853 0.09
21 Lucknow 1834 53375 0.02 2466 25551 0.01 4300 78926 0.04
22 Mehsana 1573 41218 0.02 3010 19036 0.01 4583 60254 0.03
23 Patna 1075 39856 0.02 2006 25065 0.01 3081 64921 0.03
24 Rajkot 2202 126016 0.06 3674 30479 0.01 5876 156495 0.07
25 Surat 4089 147933 0.07 5070 41281 0.02 9159 189214 0.08
26 Thane 3662 200938 0.09 2970 54832 0.02 6632 255770 0.11
27 Others 91365 17669283 7.92 147690 2256362 1.01 239055 19925645 8.93
Total 234077 217788520 97.61 313120 5328680 2.39 547197 223117200 100.00

52
JSW Steel Limited
12.15
Year2009-10 29.06.2010 95 (Final Dividend)2008-09 06.07.2009 10 (Final Dividend)2007-08 16.06.2008 140 (Final Dividend)2006-07 13.03.2007/13.06.2007 125 (Interim cum Final Dividend)2005-06 25.07.2006 80 (Final Dividend)2004-05 10.02.2005 30 (Interim Dividend)
13.06.2005 80 (Final Dividend Including Interim Dividend)
Note – Dates indicated above are date of declaration by the Board in case of Interim Dividend and by Members in case of Final Dividend.
Year
on 31.03.2011
Per-
IEPF
2006-2007(InterimCum Final Dividend)
13.03.2007 2,16,51,460.14 125% 19.04.2014
2007-2008(FinalDividend)
16.06.2008 2,65,86,798.01 140% 23.07.2015
2008-2009(FinalDividend)
06.07.2009 30,32,175.00 10% 12.08.2016
2009-2010(FinalDividend)
29.06.2010 2,16,57,373.00 95% 05.08.2017
Members who have not encashed their dividend warrants pertaining to the aforesaid years may approach the Company or its Registrar, for obtaining payments thereof atleast 20 days before they are due for transfer to the said fund.
12.16
pertaining to 42,128 Shareholders are lying undelivered with the Company’s R & T Agents as at March 31, 2011. The Company after sending three reminders to the registered address of the
to a Demat Suspense Account to be opened by the Company for this purpose with one of the Depository Participants, if no response
on such shares viz. bonus shares, split etc., shall be credited to the said Demat Suspense Account. The voting rights on these shares shall also remain frozen till the rightful owner of such shares claims the shares.
As and when the rightful owner of such shares approaches the Company at later date, the Company shall to the extent of his/her entitlement, arrange to deliver the shares from the said account to
12.17
The Company has arrangements with both National Securities Depository Limited (NSDL) and Central Depository Services
held in dematerialised form as on 31.03.2011 of which 96.20%
in CDSL as on 31.03. 2011.
CDSL 1.40%Physical 2.40%
NSDL 96.20%
Under the Companies Act, 1956, dividends that are unclaimed for a period of seven years, are to be transferred statutorily to
by the Central Government and thereafter cannot be claimed by the investors. To ensure maximum disbursement of unclaimed dividend, the Company sends reminders to the concerned investors at appropriate intervals.
31.03.1995 had been transferred to the General Revenue Account of the Central Government. The Members, who have not claimed their dividend for the said period till date, may claim the amount from the Registrar of Companies- Mumbai. Apart from the above, the Company has transferred the unpaid
Pursuant to Section 205A(5) of the Companies Act, 1956 the
follows:
Year
on 31.03.2011
Per-
IEPF
2004-2005(InterimDividend)
10.02.2005 1,26,86,136.00 30% 19.03.2012
2004-2005(FinalDividend)
13.06.2005 1,18,36,388.57 50% 20.07.2012
2005-2006(FinalDividend)
25.07.2006 1,53,99,964.88 80% 31.08.2013
0
30
60
90
120
150
2009-102008-092007-082006-072005-062004-05
The Dividend History of the Company
13.06.05
10.02.05
25.07.06
13.03.07
16.06.08
50%
30%
80%
125%
140%
10%
95%
06.07.09
29.06.10
Interim Dividend Final Dividend

53
Annual Report 2010-11
12.18 Physical Share Purchase Scheme:
in disposing of their shares held in physical form and to mitigate the hardship caused to them, the Company has, along with Karvy Computershare Private Limited (Karvy), formulated a Physical Share Purchase Scheme in 2005-06.
The Equity Shares in physical mode tendered by the shareholders under the scheme are sold by Karvy at the prevailing market price and the net sale proceeds thereof are distributed to the concerned
scheme may kindly contact Karvy.
12.19 National Electronic Clearing Service (NECS):
As per the directive from Securities and Exchange Board of India (SEBI), all Companies used to use Electronic Clearing Service (ECS) facility, introduced by Reserve Bank of India (RBI), for distributing
In this system, the investor’s bank account is credited with the dividend amount using the services of a Clearing House, based on the information provided by the Company, under advice to the investor.
As per RBI notification, with effect from October 1, 2009, the remittance of the money through centralised ECS is replaced by National Electronic Clearing Service (NECS) and banks have been instructed to move to the NECS platform with immediate effect. The advantages of NECS over ECS include faster credit of remittance
of operations for remitting agencies.
NECS essentially operates on the new and unique bank account number, allotted by banks post implementation of Core Banking Solutions (CBS) for centralized processing of inward instructions
The Company will remit the dividend payment through National Electronic Clearing Service (NECS) to the shareholders having accounts with Branches of Banks covered under CBS (Core Banking Solution).
Equity Shareholders holding shares in physical form, who wish to avail the NECS facility, may send their NECS mandate in the format attached to the Company’s R & T Agents, in the event they have not done so earlier. Equity Shareholders holding shares in electronic mode may furnish their new Bank Account Number allotted to them by their bank after implementation of CBS, alongwith a photocopy of a cheque pertaining to the concerned account, or the NECS mandate to their Depositary Participant (DP), at the earliest.
12.20Green Initiative for Paperless Communications:
The Ministry of Corporate Affairs (MCA) has taken a “Green Initiative in Corporate Governance” by allowing paperless compliance by Companies through electronic mode and has issued recently a circular bearing no.17/2011 dated April 21, 2011 stating that service of documents by a Company to its Members can be made through electronic mode. The move of the ministry allows public at large to contribute to the green movement.
Keeping in view the underlying theme and the circular issued by MCA, the Company proposes to send various communications and
statements, directors’ report, auditor’s report etc., henceforth, in electronic form, to the e-mail address provided by the Members to the Depositories or to the Company.
This is also a golden opportunity for every shareholder of JSW Steel Limited to contribute to this Corporate Social Responsibility initiative of the Company. To support this green initiative in full measure, members who have not registered their e-mail addresses, so far, are requested to register their e-mail addresses, in respect of electronic holdings with the Depository through their concerned Depository Participant. Members who hold shares in physical form are requested
Registrar Karvy Computershare Private Limited or downloaded from the Company’s website www.jsw.in under the section ‘Shareholder’s Information’, and register the same with the Company’s Registrar.
12.21 Nomination Facility:
Pursuant to the provisions of Section 109A of the Companies Act, 1956, members are entitled to make nominations in respect of shares held by them. Members holding shares in physical form and intending to make/change the nomination in respect of their shares in the Company may submit their requests in Form No. 2B to Company’s Registrar, Karvy Computershare Private Limited. Members holding shares in electronic form may submit their nomination requests to their respective Depository Participants directly. Form No. 2B can be obtained from Company’s Registrar Karvy Computershare Private Limited or downloaded from the Company’s website www.jsw.in under the section ‘Shareholder’s Information’.
12.22 Outstanding GDRs/ADRs or Warrants or any Convertible Instrument, conversion dates and likely impact on Equity:
(a) FCCBs:
The Company had issued 3,250 Foreign Currency Convertible
2007-08. As per the option attached to the FCCBs, each Bond is convertible into Equity Shares of face value of ` 10/- each of the Company at a conversion price of ` 953.40 per share, at any time on or after 07.08.2007 until the close of business on 21.03.2012, unless previously redeemed, converted or purchased and cancelled and except during a closed period.
In the Financial Year 2007-08, one of the Bond Holders i.e. Deutsche Bank AG London, had opted for the conversion of 8 Bonds into Equity Shares on 31.12.2007 and accordingly the Company had issued 33,799 Equity Shares of face value of `10/- each of the Company to Deutsche Bank AG London.
The Board of Directors at its meeting held on 28.01.2009, resolved to explore opportunities to buy back a portion of the Company’s outstanding Foreign Currency Convertible Bonds (FCCBs). In the Financial year 2008-09, 14.74% of the Company’s outstanding Zero Coupon Foreign Currency Convertible Bonds of US $ 1,00,000 each due on 2012 (ISIN XS0302937031), aggregating to US $ 47.80 million were repurchased in accordance with the A.P. (DIR Series) Circular No. 39 dated 08.12.2008 issued by the Reserve Bank of India and subsequently cancelled.
The principal amount of FCCBs outstanding as at 31.03.2011 after the above conversion, repurchase and cancellation is US $ 274.40 million.
(b) Equity Warrants:
June 16, 2010 to Sapphire Technologies Limited, a Promoter Group Company, on a preferential basis.
Each warrant entitles the holder to apply for and be allotted one equity share of the Company of par value of ` 10/- each, at a price of ` 1,210/- per equity share, at any time within 18 months from the date of allotment of the warrants, i.e. within December 15, 2011.
54
JSW Steel Limited
(c) Global Depository Receipts (GDRs):
Pursuant to the Subscription Agreement entered into by the Company with JFE Steel Corporation on 27.07.2010, 3,085,814 non-voting, non-transferable Global Depository Receipts representing 3,085,814 underlying shares of the Company i.e. 1.38% of the issued and subscribed share capital, are outstanding as on March 31, 2011. The GDRs are not listed on any Exchange.
12.23Jindal Mansion, 5A, Dr. G. Deshmukh Marg, Mumbai - 400 026.
12.24Plant Locations:
Vijayanagar : P.O. Vidyanagar, Toranagallu Village, Sandur Taluk, Bellary Dist., Karnataka - 583 275.
Vasind : Shahapur Taluk, Thane District, Maharashtra - 421 604.Tarapur : MIDC Boisar, Thane, Maharashtra - 401 506. Salem : Pottaneri, M Kalipatti Village, Mecheri Post, Mettur
Taluk, Salem Dist., Tamil Nadu - 636 453.
12.25 Address for Investor Correspondence:
I. Retail Investors
a) For Securities held in Physical formRegistrar & Share Transfer AgentsKarvy Computershare Private LimitedPlot No.17 to 24, Vittalrao Nagar,Madhapur, Hyderabad - 500 081Tel. No.: 040 - 23420815-824 (10 lines)Fax No.: 040 - 23420814E-mail: [email protected]: www.karvy.com
b) For Securities held in Demat formThe investors’ Depository Participant(s) and/or Karvy Computershare Private Limited
c) JSW Steel Limited - Investor Relation CenterVictoria House, Pandurang Budhkar Marg,Lower Parel (W), Mumbai - 400 013Tel. No.: 022-24917930/31/94 Fax No.: 022-24917933Email: [email protected]
II. Institutional InvestorsMr. Rajesh AsherSr. Vice President (Finance & Investor Relations),Jindal Mansion,5A, Dr. G. Deshmukh Marg,Mumbai 400 026Tel. No.: 022-23513000Fax No.: 022-23526400
III. Designated exclusive E-mail-id for Investor servicing: [email protected]
IV. Toll Free Number of R & T Agent’s exclusive Call Centre: 1-800-3454001
V. Web-based Query Redressal System
A new facility has been extended by the Registrar and Share Transfer Agents for redressal of Shareholders’ queries. The Shareholder can visit http://karisma.karvy.com and click on “investors” option for query registration after free identity registration.
After logging in, Shareholders can submit their query in the “QUERIES option provided on the website, which would generate a grievance registration number. For accessing the status/response to their query,
the same number can be used at the option “VIEW/ REPLY” after 24 hours. The Shareholders can continue to put additional queries
13. CORPORATE ETHICS:
The Company adheres to the highest standards of business ethics, compliance with statutory and legal requirements and commitment to transparency in business dealings. A Code of Conduct for Board Members and Senior Management and a Code of Conduct for Prevention of Insider Trading has been adopted pursuant to clause 49 (D) of the Listing Agreement and the Securities & Exchange Board of India (Prohibition of Insider Trading) Regulations, 1992 (as amended), respectively, besides other measures taken as detailed below:
a) Code of Conduct for Board Members and Senior Management:
The Board of Directors of the Company adopted the Code of Conduct for its members and Senior Management at their meeting held on 20.10.2005. The Code highlights Corporate Governance as the cornerstone for sustained management performance, for serving all the stakeholders and for instilling pride of association.
amended Code of Conduct was adopted by the Board in its meeting held on 24.10.2008
The Code is applicable to all Directors and specified Senior Management Executives. The Code impresses upon Directors and Senior Management Executives to uphold the interest of the
which the code is based is that the Directors and Senior Management Executives shall act in accordance with the highest standards of honesty, integrity, fairness and ethical conduct and shall exercise utmost good faith, due care and integrity in performing their duties. The Code has been posted on the website of the Company www.jsw.in.
as Senior Management Executives regarding compliance of the Code of Conduct during the year under review.
A declaration by the Joint Managing Director and Group CFO
Personnel to the Code is also annexed herewith.
b) Code of Conduct for Prevention of Insider Trading:
The Company has adopted a Code of Conduct for Prevention of Insider Trading for its Management, Staff and Directors. The Code lays down guidelines and procedures to be followed and disclosures to be made by Directors, Top Level Executives and Staff whilst dealing in shares of the Company.
Prevention of Insider Trading” in line with the amendments made to the “Securities and Exchange Board of India (Prohibition of Insider Trading) (Amendment) Regulations, 2008, by SEBI. The amended code was adopted by the Board in its meeting held on 07.05.2009.
The policy and the procedures are periodically communicated to the employees who are considered as insiders of the Company. Trading window closure is intimated to all employees in advance, whenever required.
The Company Secretary has been appointed as the Compliance

55
Annual Report 2010-11
c) Reconciliation of Share Capital Audit Report:
SEBI has vide its Circular No. CIR/MRD/DP/30/2010 dated 06.09.2010 renamed the ‘Secretarial Audit Report’ as the ‘Reconciliation of Share Capital Audit Report’.
Reconciliation of Share Capital Audit Report in terms of SEBI Directive
the total issued capital of the Company is in agreement with the total number of shares in physical form and the total number of dematerialized shares held with National Securities Depository Limited and Central Depository Services (India) Limited, is placed before the Board on a quarterly basis and is also submitted to the Stock Exchanges where the shares of the Company are listed.
d) Internal Checks and Balances:
Wide use of technology in the Company’s financial reporting processes ensures robustness and integrity. The Company deploys a robust system of internal controls to allow optimal use and protection
statements and management reports and ensure compliance with statutory laws, regulations and Company policies. The Company has both external and internal audit systems in place. Auditors have access to all records and information of the Company. The
recommendations of the auditors and take necessary corrective actions whenever necessary. The Board recognises the work of the auditors as an independent check on the information received from the management on the operations and performance of the Company.
e) Legal Compliance of the Company’s Subsidiaries:
Periodical Management audit ensures that the Company‘s Subsidiaries conducts its business with high standards of legal, statutory and regulatory compliances. As per the report of the Management Auditors, there has been no material non compliance with the applicable statutory requirements by the Company and its subsidiaries.
f) Human Rights Policy:
Human rights are the Standards of Treatment to which all people are entitled. On December 10, 1948 the General Assembly of the
United Nations adopted and proclaimed the Universal Declaration of
of Human Rights. The Declaration represents a contract between governments and their people, who have a right to demand that
the inherent human dignity and worth of every person in the world, without distinction of any kind.
Although human rights are principally the responsibility of national governments, this has become an increasingly important issue for business.
In line with JSW’s heritage as a responsible corporate citizen and its commitment to respecting the economic, social, cultural, political and civil rights of individuals involved in and impacted by its operations, the Board of Directors in its meeting held on 20.01.2010 has approved a Formal Human Rights Policy for adoption by the Company and all its Subsidiaries as part of its global personnel policies, in line with the practice followed internationally by Companies of Repute.
regarding compliance of conditions of Corporate Governance as stipulated in Clause 49 which is annexed herewith.
DECLARATION AFFIRMING COMPLIANCE OF CODE OF CONDUCT
As provided under Clause 49 of the Listing Agreement with the Stock Exchanges, the Board Members and the Senior Management Personnel
31.03.2011.
For JSW Steel Limited
Place: Mumbai Seshagiri Rao M.V.SDate: May 16, 2011. Joint Managing Director & Group CFO

56
JSW Steel Limited
AUDITOR’S CERTIFICATE ON COMPLIANCE OF CONDITIONS OF CORPORATE GOVERNANCE:
We have examined the compliance of the conditions of Corporate Governance by JSW Steel Limited for the year ended 31.03.2011, as stipulated in Clause 49 of the Listing Agreement of the said Company with Stock Exchanges in India.
The compliance of conditions of Corporate Governance is the responsibility of the management. Our examination was limited to the procedures and implementation thereof, adopted by the Company for ensuring the compliance of the conditions of Corporate Governance. It is neither an audit nor
In our opinion and to the best of our information and according to the explanations given to us, we certify that the Company has complied with the conditions of Corporate Governance as stipulated in the above mentioned Listing Agreement.
management has conducted the affairs of the Company.
For Deloitte Haskins & SellsChartered Accountants
Registration No. 117366W
P. B. PARDIWALLA Place: Mumbai PartnerDate: May 16, 2011. Membership No. 40005
FINANCIALS

58
JSW Steel Limited
Auditor’s Report to the Members of JSW Steel Limited
Annexure to the Auditor’s Report(Referred to in paragraph 3 of our report of even date)
To the Members of JSW Steel Limited
1. We have audited the attached Balance Sheet of JSW Steel Limited
and the Cash Flow Statement of the Company for the year ended
the responsibility of the Company’s Management. Our responsibility
audit.
2. We conducted our audit in accordance with the auditing standards generally accepted in India. Those Standards require that we plan and perform the audit to obtain reasonable assurance about whether
audit includes examining, on a test basis, evidence supporting the
estimates made by the Management, as well as evaluating the overall
a reasonable basis for our opinion.
above, we report as follows:
(a) we have obtained all the information and explanations which to the best of our knowledge and belief were necessary for the purposes of our audit;
(b) in our opinion, proper books of account as required by law have been kept by the Company so far as it appears from our examination of those books;
Flow Statement dealt with by this report are in agreement with the books of account;
and the Cash Flow Statement dealt with by this report are in
(e) in our opinion and to the best of our information and according to the explanations given to us, the said accounts give the
so required and give a true and fair view in conformity with the accounting principles generally accepted in India:
(i) in the case of the Balance Sheet, of the state of affairs of the Company as at 31st March, 2011;
the Company for the year ended on that date and
of the Company for the year ended on that date.
5. On the basis of the written representations received from the Directors as on 31st March, 2011 taken on record by the Board of Directors,
being appointed as a director in terms of Section 274(1)(g) of the
For Deloitte Haskins & Sells
P. B. PardiwallaPlace: Mumbai Partner
1. Having regard to the nature of the Company’s business/activity,
are not applicable to the Company.
a) The Company has maintained proper records showing full
assets.
year by the management in accordance with a programme of
the information and explanations given to us, no material
3. In respect of its inventories:
the year by the management at reasonable intervals, except
been received.
bulk materials such as coal, coke, pellets etc. requiring technical
thereof, the Company has hired independent agencies for
according to the information and explanation furnished to us,
the management are reasonable and adequate in relation to the size of the Company and the nature of its business.
c) In our opinion and according to the information and explanations given to us, the Company has maintained proper records of its inventories and no material discrepancies were noticed on
4. In our opinion and according to the information and explanations given to us, having regard to the explanations that some of the items purchased/ sold are of special nature and suitable alternate sources for obtaining comparable quotations are not readily available, there are adequate internal control systems commensurate with the size of the Company and the nature of its business for the purchase of
course of our audit we have not observed any major weaknesses in such internal controls.
5. In respect of contracts or arrangements entered in the register
and according to the information and explanations given to us:
a) The particulars of the contracts or arrangements referred to in Section 301 that needed to be entered into the register, maintained under the said section have been so entered.
b) Where each of such transaction is in excess of ̀ 5 lacs in respect of any party, the transactions have been made at prices which are prima facie reasonable having regard to the prevailing market prices at the relevant time.
commensurate with the size and the nature of its business.
7. We have broadly reviewed the books of account and records maintained by the Company pursuant to the rules made by the

Annual Report 2010-11
Central Government for the maintenance of cost records under
steel products and electricity and are of the opinion that prima facie the prescribed accounts and records have been made and maintained. We have, however, not made a detailed examination of the records with a view to determining whether they are accurate or complete. To the best of our knowledge and according to the information and explanations given to us, the Central Government has not prescribed the maintenance of cost records for any other product of the Company.
of its statutory dues:
a) The Company has generally been regular in depositing undisputed dues, including Provident Fund, Income-tax, Wealth-tax, Sales-tax, Service tax, Custom duty, Excise duty, Cess, Investor Education and Protection Fund and any other material statutory dues applicable to it with the appropriate authorities.
b) There were no undisputed amounts payable in respect of Income-tax, Wealth Tax, Customs Duty, Excise Duty, Cess and other material statutory dues in arrears as at 31st March, 2011 for a period of more than six months from the date they became payable.
c) Details of dues of Income Tax, Sales Tax, Wealth Tax, Service Tax, Customs Duty, Excise Duty and Cess which have not been deposited as on 31st March, 2011 on account of disputes are given below :
` in crores
Name of Statute Nature of the dues
Amount Period to which the amount relates
Forum where dispute is pending
Income Tax Act, 1961
Income Tax 0.49 2002 – 2003 Commissioner of Income Tax (Appeal)
The Bombay Sales Tax Act, 1959
Sales Tax 14.27 2000 – 2002, 2003 – 2005
The Joint Commissioner of Sales Tax (Appeals), Thane
Chapter V of the Finance Act, 1994
Service Tax 18.90 2005 – 2009 Customs, Excise and Service Tax Appellate Tribunal
Chapter V of the Finance Act, 1994
Service Tax 0.31 2005 – 2006 The Commissioner of Central Excise (Appeals), Mangalore
The Custom Act,1962
CustomsDuty
2.14 2004 – 2005 Supreme Court of India.
The Custom Act,1962
CustomsDuty
43.71 2001 – 2002 High Court of Karnataka
The Custom Act,1962
CustomsDuty
13.01 2001 – 2002, 2008 – 2011
Customs, Excise and Service Tax Appellate Tribunal
The Custom Act,1962
CustomsDuty
1.89 2009 – 2010 Commissioner of Custom, Guntur
Name of Statute Nature of the dues
Amount Period to which the amount relates
Forum where dispute is pending
The Central Excise Act,1944
Excise Duty 40.79 2000 – 2008 Customs, Excise and Service Tax Appellate Tribunal.
The Central Excise Act,1944
Excise Duty 49.34 2000 – 2010 Customs, Excise and Service Tax Appellate Tribunal
The Central Excise Act,1944
Excise Duty 0.35 2007 – 2008, 2009 – 2010
The Commissioner of Central Excise (Appeals), Mumbai
The Central Excise Act,1944
Excise Duty 5.97 2009 – 2010 The Commissioner of Central Excise, Dadar
The Central Excise Act,1944
Excise Duty 0.19 2004 – 2005 The Commissioner of Central Excise, Thane
The Central Excise Act,1944
Excise Duty 0.19 2005 – 2007 AdditionalCommissioner, Salem
given to us, the Company has not defaulted in the repayment of
10. In our opinion and according to the information and explanations given to us, the terms and conditions of the guarantees given by the Company for loans taken by subsidiaries (including step down subsidiaries) from banks are prima facie not prejudicial to the interests of the Company.
11. To the best of our knowledge and belief and according to the information and explanations given to us, in our opinion, term loans availed by the Company were, prima facie, applied by the Company during the year for the purposes for which the loans were obtained, other than temporary deployment pending application.
an overall examination of the balance sheet of the Company, funds raised on short-term basis have, prima facie, not been used during the year for long-term investment.
records examined by us, securities/charges have been created in respect of the debentures issued.
14. To the best of our knowledge and belief and according to the information and explanations given to us, no material fraud on or by the Company was noticed or reported during the year.
For Deloitte Haskins & Sells
P. B. PardiwallaPlace: Mumbai Partner
` in crores

JSW Steel Limited
Balance Sheet as at 31st March, 2011` in crores
ScheduleNo.
As at 31.03.2011 31.03.2010
SOURCES OF FUNDS
Shareholders’ Funds:
Share Capital 1 563.18 527.11
Share Warrants (refer note B-3 of schedule 18) 529.38 –
Reserves and Surplus 2 16,132.71
17,225.27
Loan Funds:
Secured Loans 3 7,675.82
Unsecured Loans 4 4,275.52
11,951.34 11,585.10
Deferred Tax Liability (refer note B-14(b) of schedule 18) 2,317.04
Total: 31,493.65
APPLICATION OF FUNDS
Fixed Assets: 5
Gross Block 27,407.35
Less: Depreciation 6,305.20
Net Block 21,102.15
6,169.05
27,271.20 23,550.41
Investments 4,098.81
Current Assets, Loans and Advances:
Inventories 7 4,138.41 2,585.77
Sundry Debtors 8 838.65
Cash and Bank Balances 1,886.88 287.11
10 3,324.43
10,188.37
Less: Current Liabilities and Provisions:
Liabilities 11 9,667.33
Provisions 12 397.40
10,064.73
Net Current Assets/(Liabilities) 123.64
Total 31,493.65
Schedules referred to above form an integral part of the Financial Statements
18
For DELOITTE HASKINS & SELLS
SAJJAN JINDAL Vice Chairman & Managing Director
P. B. PARDIWALLA LANCY VARGHESE RAJEEV PAI SESHAGIRI RAO M.V.S.
Place: Mumbai
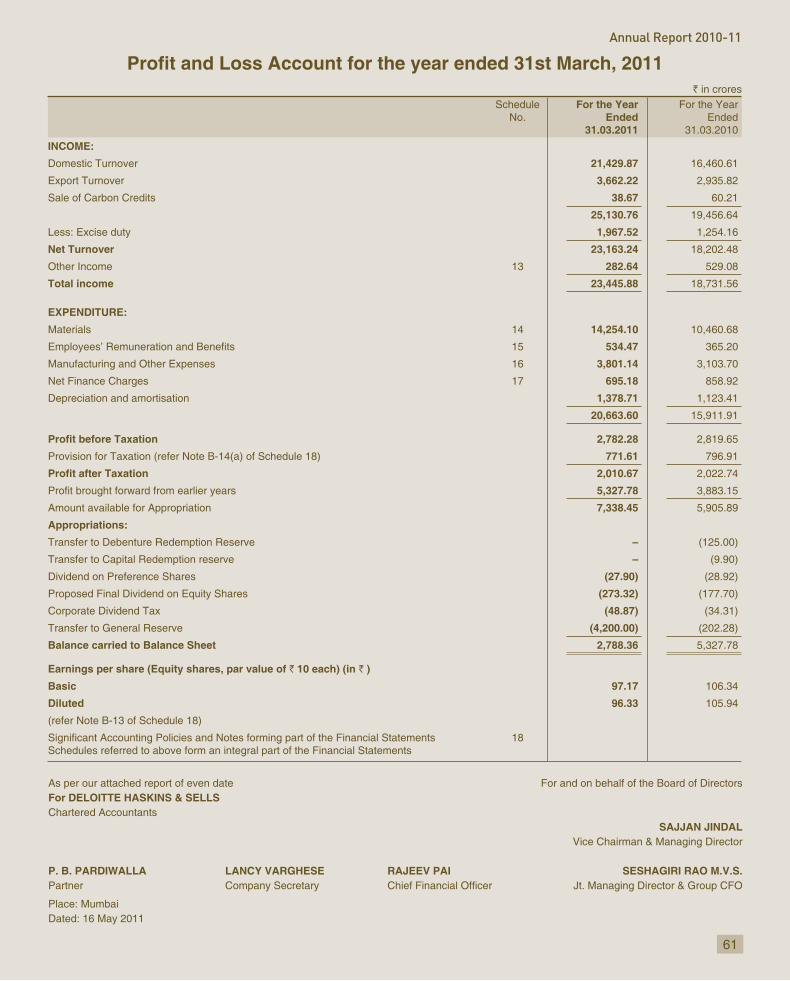
Annual Report 2010-11
` in crores Schedule
No. For the Year
Ended31.03.2011
For the Year Ended
31.03.2010
INCOME:
Domestic Turnover 21,429.87
Export Turnover 3,662.22
Sale of Carbon Credits 38.67
25,130.76
Less: Excise duty 1,967.52
Net Turnover 23,163.24 18,202.48
Other Income 13 282.64
Total income 23,445.88
EXPENDITURE:
Materials 14 14,254.10
15 534.47
Manufacturing and Other Expenses 3,801.14 3,103.70
Net Finance Charges 17 695.18
Depreciation and amortisation 1,378.71 1,123.41
20,663.60
2,782.28
Provision for Taxation (refer Note B-14(a) of Schedule 18) 771.61
2,010.67 2,022.74
5,327.78 3,883.15
7,338.45
Appropriations:
Transfer to Debenture Redemption Reserve – (125.00)
Transfer to Capital Redemption reserve –
Dividend on Preference Shares (27.90)
Proposed Final Dividend on Equity Shares (273.32) (177.70)
Corporate Dividend Tax (48.87) (34.31)
Transfer to General Reserve (4,200.00) (202.28)
Balance carried to Balance Sheet 2,788.36 5,327.78
Earnings per share (Equity shares, par value of ` 10 each) (in ` )
Basic 97.17
Diluted 96.33
(refer Note B-13 of Schedule 18)
Schedules referred to above form an integral part of the Financial Statements 18
For DELOITTE HASKINS & SELLS
SAJJAN JINDAL Vice Chairman & Managing Director
P. B. PARDIWALLA LANCY VARGHESE RAJEEV PAI SESHAGIRI RAO M.V.S.
Place: Mumbai

JSW Steel Limited
Cash Flow Statement for the year ended 31st March, 2011` in crores
For the Year Ended 31.03.2011
For the Year Ended 31.03.2010
A. CASH FLOW FROM OPERATING ACTIVITIESNET PROFIT BEFORE TAX 2,782.28 Adjustments for :Depreciation and amortisation 1,378.71 1,123.41
0.98 Income from Current Investments (32.05)Interest Income (123.69) (37.58)Dividend Income (9.92)Interest Expenses 573.67 Unrealised exchange gain (95.83)
7.55 4.02 Provision for Diminution in Value of Investments 62.12 –
1,761.54 4,543.82
Adjustments for :Increase in Inventories (1,552.64) (534.35)
(2,878.39) (301.13)Increase in Current Liabilities and Provisions 2,351.04 100.18
(2,079.99) (735.30) 2,463.83
Direct Taxes Paid (420.85)NET CASH GENERATED FROM OPERATING ACTIVITIES 2,042.98
B. CASH FLOW FROM INVESTING ACTIVITIES (4,911.65)
Investment in subsidiaries, associates and Joint Ventures (2,330.57) (313.50)Purchase of other Long Term Investments (2.50) – Purchase/Sale of Current Investments (Net) (27.46)
2.71 7.01 – 17.24
Interest received 99.24 Dividend received 9.92 NET CASH USED IN INVESTING ACTIVITIES (7,160.31) (3,147.78)
C. CASH FLOW FROM FINANCING ACTIVITIESProceeds from Issue of Equity Share Capital/Share Warrants 5,935.62 – Repayment of Preference Share Capital – Proceeds from Long Term Borrowings 3,009.90 1,874.30 Repayment of Long Term Borrowings (3,404.72)Short term borrowings 816.22 (138.75)Interest Paid (837.89)Dividend Paid (including Corporate Dividend Tax) (239.74) (57.00)NET CASH GENERATED / (USED IN) FROM FINANCING ACTIVITIES 5,279.39 NET INCREASE / (DECREASE ) IN CASH AND CASH EQUIVALENTS(A+B+C) 162.06 (111.80)CASH AND CASH EQUIVALENTS - OPENING BALANCE 264.81 CASH AND CASH EQUIVALENTS - CLOSING BALANCE 426.87
1,441.94 4.71 18.07
CASH AND BANK BALANCE (As per Schedule 9) 1,886.88 287.11 NOTE:Cash and cash equivalents include effect of exchange rate changes in respect of Bank balance held in foreign currency. * 0.13 * Value less than ` 1,00,000
For DELOITTE HASKINS & SELLS
SAJJAN JINDAL Vice Chairman & Managing Director
P. B. PARDIWALLA LANCY VARGHESE RAJEEV PAI SESHAGIRI RAO M.V.S.
Place: Mumbai

Annual Report 2010-11
Schedules forming part of the Balance Sheet as at 31st March, 2011` in crores
As at 31.03.2011
As at 31.03.2010
SCHEDULE 1
SHARE CAPITAL
Authorised :
2,00,00,00,000 Equity Shares of ` 10 each 2,000.00 2,000.00
1,00,00,00,000 Preference Shares of ` 10 each 1,000.00 1,000.00
3,000.00 3,000.00
Issued and Subscribed:
22,31,17,200 Equity Shares of` 10 each fully paid-up 223.12 187.05
originally paid-up) 61.03
10% Cumulative
Preference Shares of ` 10 each fully paid-up 279.03
Total: 563.18 527.11
Notes :
being received in cash as follows:
Iron and Steel Company Limited.
Ikon Iron and Steel Private Limited.
Coke and Energy Private Limited.
Power Limited.
e) 1,50,35,712 equity shares to the shareholders of erstwhile Southern Iron and Steel Company Limited.
2 30,85,814 equity shares represent the shares underlying outstanding Global Depository Receipts (GDRs). Each GDR represents 1 underlying equity share.
3 The 10% Cumulative Redeemable Preference Shares are redeemable at par in four equal quarterly installments commencing 15th December, 2017.
` in crores
As at 31.03.2011
As at 31.03.2010
SCHEDULE 2
RESERVES AND SURPLUS:
Securities Premium Account:
368.89 424.51
Reversal of premium on FCCB Buyback –
Received on issue of Equity Shares/GDRs 5,374.21 –
5,743.10 425.40
Less : FCCB/Preferential issue expenses (4.04) (0.05)
Provision for premium on redemption of FCCB (71.53)
5,667.53
Debenture Redemption Reserve:
129.04 4.04
: Transfer from Profit and – 125.00
129.04
Capital Redemption Reserve:
9.90
General Reserve:
3,326.34
Transfer from Shares Options 12.68 –
4,200.00 202.28
7,539.02
Hedging Reserve Account:
5.52
Movement during the year (13.86)
(8.34) 5.52
Share Options Outstanding Account:
Share Options Outstanding 23.57 13.54
Less: Deferred Compensation (16.37) (1.78)
7.20
2,788.36 5,327.78
Total: 16,132.71

JSW Steel Limited
` in crores
As at 31.03.2011
As at 31.03.2010
SCHEDULE 3
SECURED LOANS
Debentures
7.10% Non Convertible Debentures of ` 10 lacs each 500.00 –
8% Non Convertible Debentures of ` 10 lacs each – 250.00
8.10% Non Convertible Debentures of ` 10 lacs each – 250.00
10.10% Non Convertible Debentures of ` 10 lacs each 1,000.00 1,000.00
10.20% Non Convertible Debentures of ` 10 lacs each 40.95 48.75
10.20% Non Convertible Debentures of ` 10 lacs each 31.41
10.25% Non Convertible Debentures of ` 10 lacs each 500.00 500.00
% Non Convertible Debentures of ` 10 lacs each 350.00 350.00
2,422.36 2,438.53
From Banks
Rupee Term Loans 3,041.92
Foreign Currency Term Loans 1,825.78
4,867.70
From Financial Institutions
Rupee Term Loans 51.52
51.52
Working Capital Loans from Banks 334.24 58.28
Total: 7,675.82
Notes:1. Terms of Redemption:
(i) The 7.10% Redeemable Secured NCDs of ` 10 lacs each aggregating ` 500 crores are redeemable as under :
- ` 250 crores on 15.04.2011. - ` 250 crores on 18.04.2011.
(ii) The 10.10% Redeemable Secured NCDs of ` 10 lacs each aggregating ` quarterly installments of ` 31.25 crores each from 04.02.2014
of `
(iii) The 10.20% Redeemable Secured NCDs of ` 10 lacs each aggregating ` installments of `
(iv) The 10.20% Redeemable Secured NCDs of ` 10 lacs each aggregating ` 31.41 crores are redeemable in 15 quarterly installments of ` 01.01.2015.
(v) The 10.25% Redeemable Secured NCDs of ` 10 lacs each aggregating ` 500 crores are redeemable in 3 equal annual installments of ` 17.02.2018.
` 10 lacs each aggregating ` 350 crores are partly redeemable in 8 half yearly installments of `
of `
2. Details of Security:
(a) The 7.10% NCDs aggregating ̀ 500 crores are secured by pari
the State of Gujarat.
(b) The 10.10% NCDs aggregating ` 1,000 crores are secured/ to be secured by:
- pari passu first charge by way of legal mortgage on all immovable properties both present and future located at Tarapur Works and Vasind Works in the State of Maharashtra.
assets both present and future located at Salem Works in the State of Tamil Nadu.
(c) The 10.20% NCDs aggregating `
situated at Mumbai, in the State of Maharashtra.
Company’s immovable properties relating to the 100MW and 130MW Power Plants at Toranagallu village in the State of Karnataka.
(d) The 10.20% NCDs aggregating ` 31.41 crores are secured by:
- First charge on land situated in the State of Gujarat.
the state of Tamil Nadu.
(e) The 10.25% NCDs aggregating ̀ 500 crores are secured by way of mortgage in respect of all immovable and movable properties both present and future located at Tarapur Works and Vasind Works in the State of Maharashtra.
` 350 crores are secured/to be secured by:
situated in the State of Gujarat.
assets of the new 5 mtpa Hot Strip Mill at Toranagallu village in the State of Karnataka.
(g) The Rupee Term Loans from Banks aggregating ` 75.38
` 3.82 crores and Foreign Currency Term Loans from Banks aggregating `
of immovable properties of Upstream Division situated at Vaddu, Kurekuppe and Toranagallu villages in the State of Karnataka and
properties of Upstream Division both present and future excluding inventories and book debts.
(h) The Rupee Term Loans from banks aggregating ̀and Foreign Currency Term Loans from banks aggregating ` an equitable/registered Mortgage of movable and immovable properties and assets situated at Salem Works in the state of Tamil Nadu and a second pari passu charge on the current assets at Salem Works.
(i) Rupee Term Loans from Banks/Foreign Currency Term Loan from Bank are secured/to be secured as under:
- Rupee Term Loans aggregating ` 271.75 crores and Foreign Currency Term Loans aggregating ̀
movable and immovable properties of Cold Rolling Mill Complex at Toranagallu village in the State of Karnataka.
- Rupee Term Loans aggregating `Currency Term Loans aggregating ̀

Annual Report 2010-11
movable and immovable properties both present and future of 2.8 mtpa expansion project at Toranagallu village, in the State of Karnataka.
- Foreign Currency Term Loans aggregating ̀ 781.38 crores by
of all movable and immovable properties of Hot Strips Mill at Toranagallu village in the State of Karnataka.
- Rupee Term Loans aggregating ` 23.35 crores by pari passu
in the State of Karnataka.
- Rupee Term Loan aggregating `mortgage and charge on all movable and immovable properties
of the 300 MW Power Plant - CPP IV at Toranagallu village in the State of Karnataka.
- Rupee Term Loan aggregating `and charge of all immovable properties both present and future,
x 500 tph) and Pellet Plant (4.2 mtpa) at Toranagallu village in the State of Karnataka.
(j) Foreign Currency Term Loans from Bank aggregating ` 12.25crores are secured by way of equitable mortgage in respect of all immovable and movable properties both present and future located at Tarapur Works and Vasind Works, in the State of Maharashtra.
(k) Rupee Term Loan from Financial Institution aggregating `hypothecation of Bombardier Challenger 300 aircraft.
(l) Working capital loans aggregating ` 334.24 crores by:
Raw Materials, Finished Goods, Work-in-Process, Consumable Stores and Spares and Book Debts/Receivables of the Company, both present and future.
- pari passu second charge on movable properties and immovable properties forming part of the Fixed/Blocked assets of the Company, both present and future except such properties
(m) Certain Working capital loans are collaterally secured by pari passu second charge on the immovable property of a third party.
3. Out of the above, Foreign Currency Term Loan from Banks aggregating ̀ 12.25 crores along with interest there on are personally guaranteed by the Vice Chairman & Managing Director of the Company.
` in crores
As at 31.03.2011
As at 31.03.2010
SCHEDULE 4
UNSECURED LOANS
2,744 Zero Coupon Foreign Currency Convertible Bonds (FCCB) of USD 1,00,000 each (see note below) 1,225.20
Customer 559.53
(Repayable within a year ` 203.13 crores (Previous year ̀
Term Loan from Banks 1,200.00 510.00
(Repayable within a year Nil (Previous year ` 510 crores))
Foreign Currency Loans from Banks 1,179.14 108.41
(Repayable within a year ` (Previous year ` 18.13 crores))
Sales Tax Deferral 111.65
Total: 4,275.52
Note: The FCCB’s are convertible into Equity Shares at the option of the
of business on 21 June, 2012 at a ` 40.28 = 1 US $.
SCHEDULE 5 FIXED ASSETS ` in crores
Particulars Gross Block (at cost) Depreciation and amortisation Net Block
As at 01.04.2010
Additions Deductions As at 31.03.2011
As at 01.04.2010
For the year Deductions As at 31.03.2011
As at 31.03.2011
As at 31.03.2010
Tangibles
Freehold Land 164.96 2.42 – 167.38 18.48 – – 18.48 148.90 146.48
Leasehold Land 81.15 0.10 – 81.25 0.43 0.13 – 0.56 80.69 80.72
Buildings 3,175.57 588.86 0.26 3,764.17 457.50 108.83 0.03 566.30 3,197.87 2,718.07
Plant & Machinery@ 18,112.10 5,001.11 0.93 23,112.28 4,379.85 1,247.89 0.90 5,626.84 17,485.44 13,732.25
Furniture & Fixtures 71.30 12.25 0.01 83.54 29.55 4.77 – 34.32 49.22 41.75
Vehicles & Aircrafts 159.25 9.45 5.44 163.26 27.10 10.79 2.02 35.87 127.39 132.15
Intangibles
Software 31.25 4.22 – 35.47 16.53 6.30 – 22.83 12.64 14.72
Total 21,795.58 5,618.41 6.64 27,407.35 4,929.44 1,378.71 2.95 6,305.20 21,102.15 16,866.14
Previous Year 16,896.75 4,910.78 11.95 21,795.58 3,810.31 1,123.41 4.28 4,929.44 16,866.14
@ Includes proportionate share of assets jointly owned
Plant & Machinery 32.71 – – 32.71 17.40 1.30 – 18.70 14.01 15.31
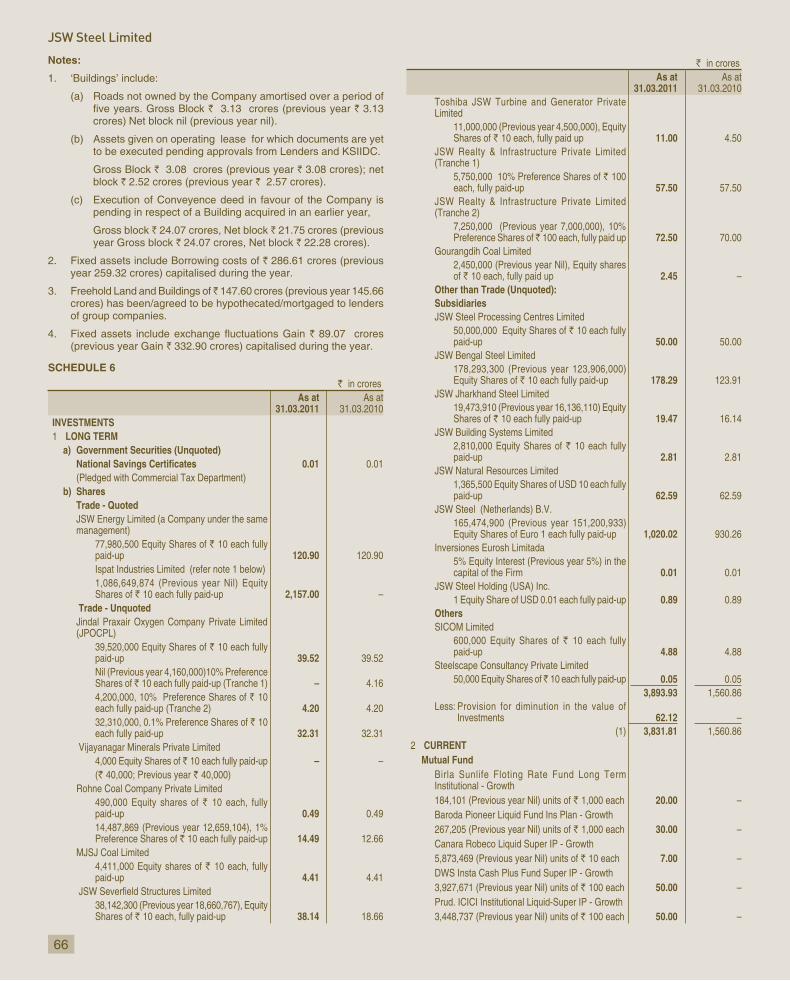
JSW Steel Limited
Notes:
1. ‘Buildings’ include:
(a) Roads not owned by the Company amortised over a period of ` 3.13 crores (previous year ` 3.13
crores) Net block nil (previous year nil).
to be executed pending approvals from Lenders and KSIIDC.
Gross Block ` 3.08 crores (previous year ` 3.08 crores); net block ` 2.52 crores (previous year ` 2.57 crores).
(c) Execution of Conveyence deed in favour of the Company is pending in respect of a Building acquired in an earlier year,
Gross block ` 24.07 crores, Net block ` 21.75 crores (previous year Gross block ` 24.07 crores, Net block ` 22.28 crores).
2. Fixed assets include Borrowing costs of `
3. Freehold Land and Buildings of ̀ crores) has been/agreed to be hypothecated/mortgaged to lenders of group companies.
`(previous year Gain `
SCHEDULE 6
` in crores As at
31.03.2011 As at
31.03.2010INVESTMENTS
1 LONG TERM a) Government Securities (Unquoted)
0.01 0.01(Pledged with Commercial Tax Department)
b) SharesTrade - Quoted JSW Energy Limited (a Company under the same management)
77,980,500 Equity Shares of ` 10 each fully paid-up 120.90 120.90 Ispat Industries Limited (refer note 1 below) 1,086,649,874 (Previous year Nil) Equity Shares of ` 10 each fully paid-up 2,157.00 –
Trade - Unquoted Jindal Praxair Oxygen Company Private Limited (JPOCPL)
39,520,000 Equity Shares of ` 10 each fully paid-up 39.52 39.52Nil (Previous year 4,160,000)10% Preference Shares of ̀ 10 each fully paid-up (Tranche 1) – 4.164,200,000, 10% Preference Shares of ` 10each fully paid-up (Tranche 2) 4.20 4.2032,310,000, 0.1% Preference Shares of ` 10each fully paid-up 32.31 32.31
Vijayanagar Minerals Private Limited 4,000 Equity Shares of ` 10 each fully paid-up – –(` 40,000; Previous year ` 40,000)
Rohne Coal Company Private Limited 490,000 Equity shares of ` 10 each, fully paid-up 0.49 0.49 14,487,869 (Previous year 12,659,104), 1% Preference Shares of ` 10 each fully paid-up 14.49 12.66
MJSJ Coal Limited 4,411,000 Equity shares of ` 10 each, fully paid-up 4.41 4.41
38,142,300 (Previous year 18,660,767), Equity Shares of ` 10 each, fully paid-up 38.14 18.66
` in crores As at
31.03.2011 As at
31.03.2010Toshiba JSW Turbine and Generator Private Limited
11,000,000 (Previous year 4,500,000), Equity Shares of ` 10 each, fully paid up 11.00 4.50
JSW Realty & Infrastructure Private Limited (Tranche 1)
5,750,000 10% Preference Shares of ` 100each, fully paid-up 57.50 57.50
JSW Realty & Infrastructure Private Limited (Tranche 2)
7,250,000 (Previous year 7,000,000), 10% Preference Shares of ̀ 100 each, fully paid up 72.50 70.00
Gourangdih Coal Limited 2,450,000 (Previous year Nil), Equity shares of ` 10 each, fully paid up 2.45 –
Other than Trade (Unquoted):SubsidiariesJSW Steel Processing Centres Limited
50,000,000 Equity Shares of ` 10 each fully paid-up 50.00 50.00
JSW Bengal Steel Limited 178,293,300 (Previous year 123,906,000) Equity Shares of ` 10 each fully paid-up 178.29 123.91
JSW Jharkhand Steel Limited 19,473,910 (Previous year 16,136,110) Equity Shares of ` 10 each fully paid-up 19.47 16.14
JSW Building Systems Limited 2,810,000 Equity Shares of ` 10 each fully paid-up 2.81 2.81
JSW Natural Resources Limited 1,365,500 Equity Shares of USD 10 each fully paid-up 62.59 62.59
JSW Steel (Netherlands) B.V. 165,474,900 (Previous year 151,200,933) Equity Shares of Euro 1 each fully paid-up 1,020.02 930.26
Inversiones Eurosh Limitada 5% Equity Interest (Previous year 5%) in the capital of the Firm 0.01 0.01
JSW Steel Holding (USA) Inc. 1 Equity Share of USD 0.01 each fully paid-up 0.89 0.89
OthersSICOM Limited
600,000 Equity Shares of ` 10 each fully paid-up 4.88 4.88
Steelscape Consultancy Private Limited 50,000 Equity Shares of ̀ 10 each fully paid-up 0.05 0.05
3,893.93 1,560.86Less: Provision for diminution in the value of
Investments 62.12 – (1) 3,831.81 1,560.86
2 CURRENT Mutual Fund
Birla Sunlife Floting Rate Fund Long Term Institutional - Growth184,101 (Previous year Nil) units of ` 1,000 each 20.00 – Baroda Pioneer Liquid Fund Ins Plan - Growth 267,205 (Previous year Nil) units of ` 1,000 each 30.00 –Canara Robeco Liquid Super IP - Growth 5,873,469 (Previous year Nil) units of ` 10 each 7.00 –DWS Insta Cash Plus Fund Super IP - Growth 3,927,671 (Previous year Nil) units of ` 100 each 50.00 –Prud. ICICI Institutional Liquid-Super IP - Growth 3,448,737 (Previous year Nil) units of ` 100 each 50.00 –

Annual Report 2010-11
` in crores As at
31.03.2011 As at
31.03.2010Reliance Liquidity Fund - Growth 33,867,996 (Previous year Nil) units of ` 10 each 50.00 –Religare liquid Fund -Super IP - Growth 74,260 (Previous year Nil) units of ` 1,000 each 10.00 – SBI Premiur Liquid Fund Super IP - Growth 32,435,729 (Previous year Nil) units of ` 10 each 50.00 –Baroda Pioneer Treasury Advantage Fund - Institutional Growth Plan Nil (Previous year 9,640,505.548) units of ` 10 each – 10.00 Birla Sun Life Saving Fund - Institutional Growth Nil (Previous year 4,112,888.193) units of ̀ 10 each – 7.21 Birla Sunlife Floating Rate Fund Long Term Institutional-GrowthNil (Previous year 13,909,575.052) units of ` 10 each – 15.05 Birla Sunlife Medium Term Plan GrowthNil (Previous year 14,731,781.783) units of ` 10 each – 15.12 Birla Sun Life Short Opportunity Fund - Institutional 'GrowthNil (Previous year 14,412,183.979) units of ` 10 each – 15.08 HDFC Principle FR Fund FMP - Insti.-Option Growth Plan Nil (Previous year 9,563,337.987) units of ` 10 each – 15.00 LICMF Liquid Fund Growth Plan Nil (Previous year 8,895,161.625) units of ` 10 each – 15.00 LICMF Income Plus Fund Growth Plan Nil (Previous year 12,138,409.848) units of ` 10 each – 15.00 LICMF Saving Plus Fund Growth Plan Nil (Previous year 10,256,627.833) units of ` 10 each – 15.01 PRINCIPAL Floating Rate Fund - FMP - Growth Nil (Previous year 10,291,665.809) units of ` 10 each – 15.00 ICICI Prudenial Liquid Super Institutional Plan Nil (Previous year 583,883.985) units of ̀ 10 each – 10.00 Reliance Medium Term Fund - Retail Plan- Growth Plan-Growth Option Nil (Previous year 7,863,259.071) units of ` 10 each – 15.00 Reliance Money Manager Fund - Institutional Option - Growth Plan Nil (Previous year 119,625.156) units of ̀ 10 each – 15.01 SBI Magnum Insta Cash Fund - Cash Option Nil (Previous year 7,339,772.761) units of ` 10 each – 15.00 SBI Premiur Liquid Fund Super Institutional-Growth Nil (Previous year 10,370,575.221) units of ` 10 each – 15.01
(2) 267.00 207.49 Total (1) + (2) 4,098.81 1,768.35
SUMMARYQuoted
Aggregate of book value 2,277.90 120.90 Aggregate of market value 2,992.83 872.21
UnquotedAggregate of book value
Mutual Funds 267.00 207.49 Others 1,553.91 1,439.96 Aggregate Repurchase Value Mutual Funds 267.07 207.49
Notes :1.2. Mode of Valuation - refer note A(4) of Schedule 18.3. Units of Mutual Fund purchased and sold during the year:
Name of the Scheme No. of UnitsAxis Liquid Fund Institutional Plan 681,829 Axis Treasury Advantage Fund 680,244 Baroda Pioneer Liquid Fund Institutional Plan 238,913,013Birla Sunlife Cash Plus - Institutional Premium Plan 517,291,018Birla Sunlife Medium Term Plan 14,731,782 Birla Sunlife Short Opportunity Fund - Institutional Premium Plan 14,412,184 Birla Sunlife Short Term Fmp 50,027,032 DSP Black Rock Short Term Fund 9,495,513 DSP Black Rock Fmp-3M -Series-22 40,000,000 Dws Cash Opportunities Fund Institutional Plan 12,643,804 Fortis Overnight Fund Institutional Premium Plan 55,155,900 HDFC- FRIF- SFT - WP 103,419,955HDFC Cash Management Fund -Treasury Advantage Plan- Wp 31,915,558 HDFC Cash Mgmt Fund - Savings Plan 15,567,703 HDFC Liquid Fund - Premium Plan 122,873,255IDFC Fixed Maturity Plan - Monthly Series 27 25,000,000 IDFC Money Manager - Treasury Plan - Plan C 44,777,022 IDFC Ultra Short Term Fund 30,617,593 JM High Liquidity - Super I P 436,490,055JP Morgan India Liquid Fund 159,495,351Kotak Flexi Debt Scheme Ins 36,102,740 Kotak Floater Fund-Lt 44,768,819 Kotak Floater Fund-St 179,467,664Kotak Liquid Insti Prem Plan 239,301,217Kotak Quarterly Interval Plan Series 8 12,776,239 LIC Liquid Mutual Fund 331,820,602LIC MF Floating Rate Fund 47,940,077 LIC MF Income Plus Fund 24,258,467 LIC MF Monthly Interval Fund Series-I 84,528,878 LIC Mutual Fund Saving Plus Fund 108,440,427Prudential ICICI Flexible Income Plan-Premium 32,869,270 Prudential ICICI FRF Plan D 10,793,951 Prudential ICICI FRF Plan D 723,267 Prudential ICICI Institutional Ultra Short Term Plan Super Premuim 47,838,431 Reliance Liquid Fund Cash Plan 112,041,396Reliance Liquidity Fund 601,985,726Reliance Medium Term Fund 167,052,186Reliance Monthly Interval Fund Series I Ins 8,036,644 Reliance Monthly Interval Fund Series-I 78,365,607 Reliance Monthly Interval Fund Series II 19,333,427 SBI Magnum Insta Cash - Cash Plan 104,036,115SBI SDF - 90 Days 50,008,721 SBI SHDF Ultra Short Term Fund 60,197,095 SBI-SHF Ultra Short Term Fund - Institutional Plan 40,376,652 Tata Fixed Income Portfolio A3 Institutional Plan 24,591,535 Templeton Frif Long Term 3,956,280 UTI Fixed Income Interval Fund - Quarterly Interval Plan IV - Institutional 49,175,813 ICICI Prudential Liquid Fund - Super Institutional Plan 62,895,621 ICICI Prudential Ultra Short Term Plan - Super Premium 62,975,175 UTI Fixed Income Interval Fund - Monthly Interval Plan II - Institutional 97,938,250 Baroda Pioneer Treasury Advantage Fund - Institutional Plan 93,596,785 Birla Sun Life Saving Fund - Institutional Plan 88,096,050 Birla Sunlife Floating Rate Fund Ltp - Institutional Plan 27,851,741 Birla Sunlife Ultra Short Term Fund - Institutional Premium Plan 58,961,942 DWS Ultra Short Term Fund Institutional Plan 186,402,677JM Money Manager Fund Super Institutional Plan 93,956,116 JP Morgan India Treasury Fund Super Institutional Plan 126,811,071Religare Ultra Short Term Fund - Institutional Plan 98,252,772 Tata Floater Fund - Institutional Plan 100,070,979UTI Money Market - Institutional Plan 2,231,667 Reliance Money Manager Fund - Institutional Plan 633,010 SBI Premiur Liquid Fund Super Institutional Plan 219,500,028Principal Institutional Planal Cash Mgmt Fund Co - Institutional Premium Plan 141,269,958Principal Institutional Planal Floating Rate Fund Fmp - Ins 37,537,937 Prudential ICICI Institutional Liquid-Super Institutional Plan 91,298,804 Baroda Pioneer Treasury Advantage Fund Institutional Plan 58,115,260 Religare Liquid Fund - Super Institutional Plan 246,895,141Kotak Flexi Debt Fund Super Institutional Plan 56,896,763 Canara Robeco Liquid Super Institutional Plan 342,979,025

JSW Steel Limited
Canara Robeco Treasury Advantage Fund Super Institutional Plan 106,961,177Tata Liquid Fund - Sh Institutional Plan 956,285 Tata Treasury Manager Fund - Sh Institutional Plan 238,206 Fortis Money Plus Institutional Plan Fund 42,904,273 Taurus Liquid Fund - Super Institutional Plan 792,859 Taurus Ultra Short Term Bond Fund - Super Institutional Plan 736,519 Templeton India Tma - Super Institutional Plan 3,156,024 UTI Floating Rate Fund - Stp - Institutional Plan 2,032,599 Fidelity Cash Fund Super Institutional Plan 11,928,714 Fidelity Ultra Short Term Debt Fund Super Institutional Plan 12,556,735 IDFC Cash Fund Plan C Super Institutional Plan 172,816,547IDFC Money Manager Fund Treasury Plan Super Institutional Plan Plan C 13,703,050 DWS Insta Cash Plus Fund Super Institutional Plan 357,062,039Sundaram Bnp Paribas Money Fund Super Institutional Plan 10,251,441 Sundaram Bnp Paribas Ultra Short Term Fund Super Institutional Plan 16,000,173 UTI Treasury Advantage Fund - Institutional Plan 1,111,193 Prudential ICICI Ultra Short Term Plan Premium Plus Institutional Plan 14,529,711 Reliance Liquid Fund - Tp - Institutional Plan 13,327,499 DSP Black Rock Liquidity Fund-Institutional Plan 2,193,870 L&T Liquid Fund - Super Institutional Plan 113,269,511L&T FI STF Institutional Plan 57,068,205 DSP Black Rock Floating Rate Fund - Institutional Plan 112,845 Templeton India Ultra Short Bond Fund - Super Institutional Plan 184,643,793UTI Liquid Fund - Cash Plan Institutional Plan 1,367,317 SBI Premiur Liquid Fund Institutional Plan 16,890,637 Axis Liquid Fund Institutional Plan 2,843,625 Peerless Liquid Fund Super Institutional Plan 9,816,625 DSP Blackrock Floating Rate Fund - Institutional Plan 922,101 DSP Blackrock Money Manager Fund Institutional Plan 954,066 Prudential ICICI Blended Fund Institutional Plan 247,598,297Birla Cash Manager Institutional Plan 59,415,859 Baroda Pioneer Liquid Fund - Institutional Plan 113,837,370Principal Institutional Planal PNB Fixed Maturity Plan - 91 Days - Series XVY 25,004,910 Sundaram Money Fund Super Institutional Plan 24,599,641
` in crores
As at 31.03.2011
As at 31.03.2010
SCHEDULE 7INVENTORIESRaw Materials 1,895.59 1,278.87 Production Consumables and Stores & Spares 600.31 411.22 Work-in-Progress 263.74 114.20 Semi Finished/Finished Goods 1,378.77 781.35 Traded Goods – 0.13 Total: 4,138.41 2,585.77
Note:
` in crores
As at 31.03.2011
As at 31.03.2010
Note : Limited (a company under the same management)
16.97
during the year 140.87
SCHEDULE 9CASH AND BANK BALANCESCash on hand 0.48 0.34 Balances with Scheduled Banks:
135.78 In Margin Money/Term Deposit
1,750.62 Total: 1,886.88 287.11
SCHEDULE 10LOANS AND ADVANCES (Unsecured, considered good unless otherwise stated)
1,346.31 705.78 Advances recoverable in cash or in kind or for value to be received
253.29
Excise duty refund on exports 129.37 83.23
Trusts 83.82 Premises and Other deposits 108.22 108.22
capital 6.54 21.04 Prepayments and Others 597.74
(9.40) 2,515.89 1,514.52
Excise Balances 256.56
source (net) – 152.55
entitlement 551.98 353.83 Loans to Bodies Corporate 9.10 Less: Provision for Doubtful Loans (9.10)Total: 3,324.43
SCHEDULE 11CURRENT LIABILITIES
6,816.22 5,047.75 Dues to Subsidiaries 21.84 13.24 Sundry Creditors
Total outstanding dues of micro enterprises and small enterprises 15.92 38.15 Total outstanding dues of creditors other than micro enterprises and small enterprises 2,014.73 1,551.20
Rent and other Deposits 42.81 158.56 180.38 64.14
` in crores
As at 31.03.2011
As at 31.03.2010
SCHEDULE 8SUNDRY DEBTORSUnsecuredOutstanding for a period exceeding six months Considered Good 2.01 10.17 Considered Doubtful 15.73 Less: Provision for Doubtful debts (15.73)
2.01 10.17 Other DebtsConsidered Good 836.64 553.08 Total: 838.65
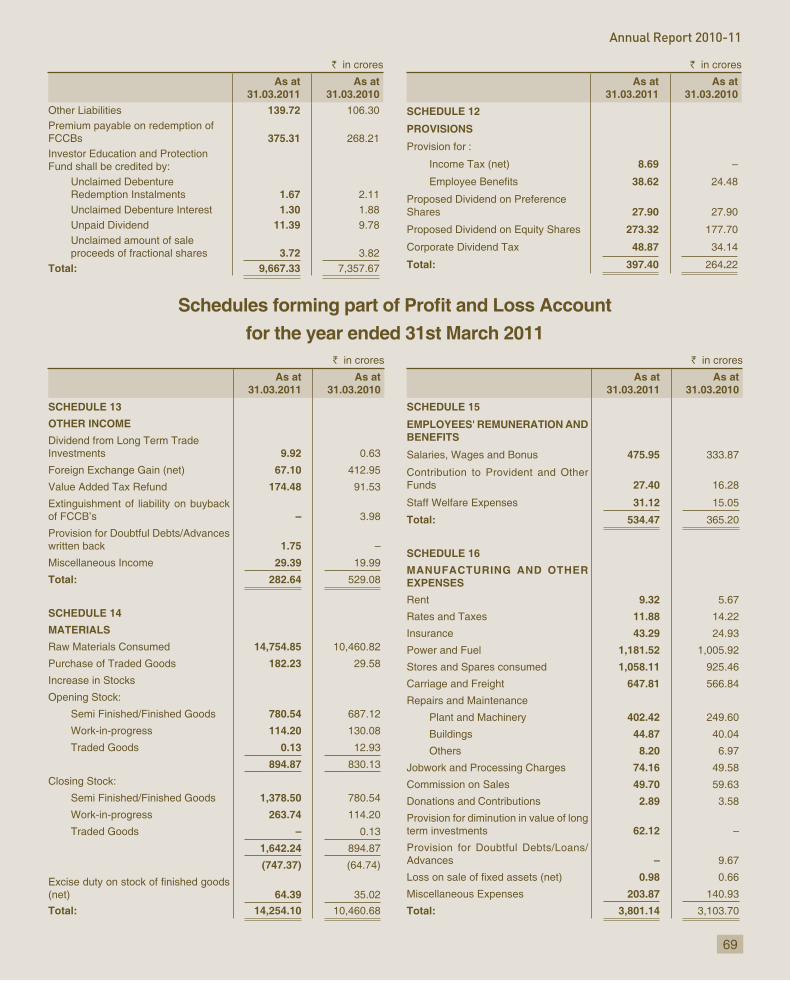
Annual Report 2010-11
for the year ended 31st March 2011
` in crores
As at 31.03.2011
As at 31.03.2010
Other Liabilities 139.72 Premium payable on redemption of FCCBs 375.31 Investor Education and Protection Fund shall be credited by:
Unclaimed Debenture Redemption Instalments 1.67 2.11 Unclaimed Debenture Interest 1.30 1.88 Unpaid Dividend 11.39 Unclaimed amount of sale proceeds of fractional shares 3.72 3.82
Total: 9,667.33
` in crores
As at 31.03.2011
As at 31.03.2010
SCHEDULE 12
PROVISIONS
Provision for :
Income Tax (net) 8.69 –
38.62 24.48
Proposed Dividend on Preference Shares 27.90
Proposed Dividend on Equity Shares 273.32 177.70
Corporate Dividend Tax 48.87 34.14
Total: 397.40 .22
` in crores
As at 31.03.2011
As at 31.03.2010
SCHEDULE 13
OTHER INCOME
Dividend from Long Term Trade Investments 9.92
Foreign Exchange Gain (net) 67.10
174.48
Extinguishment of liability on buyback of FCCB’s –
written back 1.75 –
Miscellaneous Income 29.39
Total: 282.64
SCHEDULE 14
MATERIALS
Raw Materials Consumed 14,754.85
Purchase of Traded Goods 182.23
Increase in Stocks
Opening Stock:
Semi Finished/Finished Goods 780.54
Work-in-progress 114.20 130.08
Traded Goods 0.13
894.87 830.13
Closing Stock:
Semi Finished/Finished Goods 1,378.50 780.54
Work-in-progress 263.74 114.20
Traded Goods – 0.13
1,642.24
(747.37)
(net) 64.39 35.02
Total: 14,254.10
` in crores
As at 31.03.2011
As at 31.03.2010
SCHEDULE 15
EMPLOYEES' REMUNERATION AND BENEFITS
Salaries, Wages and Bonus 475.95 333.87
Contribution to Provident and Other Funds 27.40
Staff Welfare Expenses 31.12 15.05
Total: 534.47
SCHEDULE 16
MANUFACTURING AND OTHER EXPENSES
Rent 9.32
Rates and Taxes 11.88 14.22
Insurance 43.29
Power and Fuel 1,181.52
Stores and Spares consumed 1,058.11
Carriage and Freight 647.81
Repairs and Maintenance
Plant and Machinery 402.42
Buildings 44.87 40.04
Others 8.20
Jobwork and Processing Charges 74.16
Commission on Sales 49.70
Donations and Contributions 2.89 3.58
Provision for diminution in value of long term investments 62.12 –
Provision for Doubtful Debts/Loans/–
0.98
Miscellaneous Expenses 203.87
Total: 3,801.14 3,103.70

70
JSW Steel Limited
` in crores
As at 31.03.2011
As at 31.03.2010
SCHEDULE 17NET FINANCE CHARGES Interest on:
Debentures and Fixed Loans 586.05 Others 184.25
Other Finance Charges 80.62 57.13 850.92
Less: Interest Income from Banks (62.99) (2.48)from Others (60.70) (35.10)
(Tax deducted at source ` 7.32 crores, (Previous year `
(123.69) (37.58)Less:
Investments (32.05) –Dividend Income on Current Investments –
(32.05)Total: 695.18
SCHEDULE 18:
SIGNIFICANT ACCOUNTING POLICIES AND NOTES TO ACCOUNTS
A. SIGNIFICANT ACCOUNTING POLICIES
1. Basis of Accounting
under the historical cost convention, in accordance with Indian
2. Use of Estimates
and assumptions to be made that affect the reported amounts of assets and liabilities and disclosure of contingent liabilities
results could differ from these estimates and differences between actual results and estimates are recognized in the periods in which the results are known/materialize.
3. Fixed Assets and Depreciation
less accumulated depreciation and impairment losses.
Costs of acquisition comprise all costs incurred to bring the assets to their location and working condition up to the date the assets are put to use. Costs of construction are composed
that are attributable to the construction activity in general and
put to use.
Depreciation on assets is provided, pro-rata for the period of use, by the Straight Line Method (SLM) at the SLM rates prescribed
balance sheet date there are indications of impairment and the carrying amount of the asset, or where applicable the cash generating unit to which the asset belongs, exceeds its recoverable amount (i.e. the higher of the asset’s net selling
price and value in use). The carrying amount is reduced to the recoverable amount and the reduction is recognized as an
For the purpose of determining the appropriate depreciation rates to be applied to plant and machinery, continuous process
assessment made by the Company.
Leasehold land is amortized over the period of the lease, except where the lease is convertible to freehold land under lease agreements at future dates at no additional cost.
The Company capitalizes software where it is reasonably estimated that the software has an enduring useful life. Software is depreciated over an estimated useful life of 3 to 5 years.
In respect of mining projects, the Company capitalizes cost of acquisition of mining concessions and all costs incurred till mining reserves are proved, such as license fees, direct exploration costs and indirect incidental costs. Once the determination of mining reserves is made, the following conditions must be met in order for these costs to remain capitalized;
a. The economic and operating viability of the project is
to justify further capitalized expenditure for commercial exploration of the reserves, and
b. Further exploration and development activity is under way
These will be amortized once the mine commences commercial
4. Investments
Current investments are stated at lower of cost and fair value.
Long term investments are stated at cost. Provision for diminution is made to recognize a decline, other than temporary, in the value of such investments.
5. Revenue Recognition
uncertainty exists as to its realization or collection.
Revenue from sale of goods is recognized on delivery of the
the customers and no effective ownership is retained. Sales
a reduction from gross turnover.
as income on sale of CER’s.
6. Inventories
Inventories are valued at the lower of cost and net realizable value. Cost of inventories comprise all costs of purchase, costs of conversion and other costs incurred in bringing the inventories to their present location and condition. Cost is determined by the weighted average cost method.
Materials (Schedule 14).
7. Borrowing Costs
Borrowing costs attributable to the acquisition or construction

71
Annual Report 2010-11
“Borrowing Costs” are capitalized as part of the cost of such asset up to the date when the asset is ready for its intended use. Other borrowing costs are expensed as incurred.
Interest income earned is disclosed separately, and reduced from Net Finance charges (Schedule 17).
such as provident and other funds, which fall due for payment within a period of twelve months after rendering service, are
in which the service is rendered.
Employee Benefits under defined benefit plans, such as compensated absences and gratuity which fall due for payment after a period of twelve months from rendering service or after completion of employment, are measured by the projected unit credit method, on the basis of actuarial valuations carried out by third party actuaries at each balance sheet date. The Company’s obligations recognized in the balance sheet represents the present value of obligations as reduced by the fair value of plan assets, where applicable.
9. Foreign Currency Transactions
Foreign currency transactions are recorded at the exchange rates prevailing on the date of the transaction.
Monetary foreign currency assets and liabilities (monetary items) are reported at the exchange rate prevailing on the balance sheet date. Exchange differences relating to long term monetary items are dealt with in the following manner:
i. Exchange differences relating to long-term monetary items, arising during the year, in so far as they relate to the acquisition of a depreciable capital asset are added to/deducted from the cost of the asset and depreciated over the balance life of the asset.
ii. In other cases such differences are accumulated in a “Foreign Currency Monetary Item Translation Difference
the balance life of the long-term monetary item, however that the period of amortization does not extend beyond 31 March 2011.
loss account.
Non-monetary items such as investments are carried at historical cost using the exchange rates on the date of the transaction-
10. Derivative Financial Instruments
as foreign exchange forward contracts, interest rate swaps and currency options to manage its exposure to interest rate and foreign exchange risks.
Derivatives are initially recognized at fair value at the date a derivative contract is entered into and are subsequently re-measured to their fair value at each balance sheet date.
The Company designates certain derivatives as either hedges of the fair value of recognised assets or liabilities (fair value hedges) or hedges of highly probable forecast transactions or
hedges). The Company does not enter into derivative contracts for trading or speculative purposes.
(Schedule 11).
Changes in the fair value of derivatives that are designated
loss account immediately, together with any changes in the fair value of the hedged item that are attributable to the hedged risk. The change in the fair value of the hedging instrument and the change in the hedged item attributable to the hedged risk
relating to the hedged item.
Changes in the fair value of derivatives that are designated and
the hedged item.
Hedge accounting is discontinued when the Company revokes the hedging relationship, the hedging instrument expires or is
accounting. In case of fair value hedges the adjustment to the carrying amount of the hedged item arising from the hedged
is recognized when the forecast transaction is ultimately
transaction is no longer expected to occur, the cumulative gain
and loss account.
11. Income Tax
comprise both current and deferred tax.
Current tax is measured at the amount expected to be paid/ recovered from the revenue authorities, using the applicable
credit will be available for discharge of future normal tax liability.
The tax effect of the timing differences that result between taxable income and accounting income and are capable of reversal in one or more subsequent periods are recorded as a deferred tax asset or deferred tax liability. Deferred tax assets and liabilities are recognized for future tax consequences attributable to timing differences. They are measured using the substantively enacted tax rates and tax laws.
each balance sheet date is reduced to the extent that it is no
will be available against which the assets can be realized.
Where certain expenses or credits which are otherwise required
to reserves in accordance with a court order or as permitted
or charge, arising from the admissibility or taxability of such expenses or income for tax purpose is also recognized in the reserves.
Tax on distributed profits payable in accordance with the
12. Earnings Per Share
The Company reports basic and diluted Earnings per share

72
JSW Steel Limited
per Share”. Basic or loss for the year attributable to equity shareholders by the weighted average number of equity shares outstanding during
or loss for the year attributable to equity shareholders by the weighted average number of equity shares outstanding during the year as adjusted for the effects of all dilutive potential equity shares, except where the results are anti-dilutive.
13. Operating Leases
Operating lease receipts and payments are recognized
straight-line basis over the lease term.
14. Cash Flow Statement
The Cash Flow Statement is prepared by the “indirect method”
activities of the Company.
Cash and Cash equivalents presented in the Cash Flow Statement consist of cash on hand and unencumbered, highly liquid bank balances.
15. Securities’ Expenses
Expenses on issue of securities are written off to the Securities
Premium payable on redemption of bonds is provided for over
in providing for premium on redemption in accordance with
provision for the redemption premium is reversed.
16. Stock Based Compensation
The compensation cost of stock options granted to employees is calculated using the intrinsic value of the stock options. The compensation expense is amortized uniformly over the vesting period of the option.
17. Contingent Liabilities
disclosed by way of notes to the accounts. Disclosure is not
B. NOTES TO ACCOUNTS:
1. Contingent Liabilities not provided for in respect of:
a) Bills Discounted ` ` 1,275.88 crores).
b) Guarantees provided to banks on behalf of subsidiaries (including step down subsidiaries) and others ̀(Previous year ` 1,818.24 crores).
c) Disputed statutory claims/levies including those pending in Courts (excluding interest, if any), in respect of:
(i) Excise Duty ̀ crores (Previous year ̀
(ii) Customs Duty ` 242.87 crores (Previous year ` 108.07 crores);
(iii) Income Tax ` 12.47 crores (Previous year ` 12.47 crores);
(iv) Sales Tax / Special Entry tax ̀` 0.35 crores);
(v) Service Tax ̀ 45.18 crores (Previous year ̀
(vi) Miscellaneous ` 0.05 crore (Previous year ` 0.05 crore); and
(vii) Levies by local authorities ` 3.04 crores (Previous year ` 3.04 crores).
d) Claims by Suppliers and other third parties not acknowledged as debts ` 207.41 crores (Previous year `
2. Estimated amount of contracts remaining to be executed on capital account and not provided for (net of advances) `(Previous year `
3. During the year, the Company issued 1,75,00,000 optional convertible warrants on a preferential basis, convertible into 1,75,00,000 equity shares at the option of the holder on or before 15 December 2011.
paid by the holders in accordance with the terms of the issue.
4. Details of utilization of funds received on preferential allotment:
(a) Issue of Convertible Warrants
` in crores
CurrentYear
PreviousYear
Net issue proceeds 529.38 NilLess: Utilization Debt Repayment/Reduction 220.00 Nil Working Capital 309.38 NilBalance Nil Nil
(b) Issue of Fully Convertible Debenture
` in crores
CurrentYear
PreviousYear
Net issue proceeds 4,800.72 NilLess: Utilization Debt Repayment/Reduction 2,864.70 Nil Investment in Ispat Industries Limited 540.00 Nil Working Capital 366.02 Nil Capital Expenditure 20.00 NilBalance held in Fixed deposits with banks pending utilization 1,010.00 Nil
(c) Issue of Equity Shares
` in crores
CurrentYear
PreviousYear
Net issue proceeds 146.69 NilLess: Utilization Debt Repayment/Reduction 146.69 NilBalance Nil Nil
5.(including interest receivable):
` in crores
Name of Company Current Year Previous YearMaximumamount
outstandingduring the
year
Amountoutstanding
Maximumamount
outstandingduring the
year
Amountoutstanding
JSW Steel (Netherlands) B.V. 689.85 632.09 664.34 598.61JSW Natural Resources Limited 5.82 5.68 1.71 1.67Inversiones Eurosh Limitada 321.57 314.89 79.19 77.10JSW Steel Holding (USA) Inc. 432.44 391.18 18.86 18.86

73
Annual Report 2010-11
6. Employee Share based Payment Plans:
a) The Company operates four employee share-based payments plans, which are described below:
ESOP 2007 ESOP 2010
Particulars Scheme 1 (General
Manager & Above)
Scheme 2 (Junior
Managerto General Manager)
Scheme 3 (Associate
VicePresident &
Above)
Scheme 1 (Junior
Manger & Above)
Date of grant 1-Apr-07 1-Oct-07 1-Oct-07 1-Oct-10
Outstanding as on 01.04.2010 60,840 2,05,690 1,54,280 –
Granted during the year – – – 1,734,334
Forfeited during the year – 7,638 17,350 41,385
Exercised during the year 60,840 198,052 136,930 –
Outstanding as on 31.03.2011 – – – 1,692,949
Vesting Period 3 years service
3 years service
3 years service
Gradedvesting over 3
years
Method of settlement Cash Cash Cash Cash
Exercise Price 600 800 900 1100
b) Expenses arising from employee’s share- based payment plans - ` 8.12 crores (Previous year ` 4.03 crores).
7. Derivatives:
a) The Company uses foreign currency forward contracts to hedge
to certain firm commitments and highly probable forecast transactions. The use of foreign currency forward contracts is governed by the Company’s strategy approved by the Board of Directors, which provide principles on the use of such forward contracts consistent with the Company’s Risk Management Policy.
The Forward Exchange Contracts entered into by the Company and outstanding are as under:
As at No. of Contracts
Type US$ Equivalent (Million)
INR Equivalent (crores)
31.03.2011 79 Buy 311.66 1,391.55
22 Sell 119.95 535.58
31.03.2010 21 Buy 109.24 493.11
35 Sell 90.24 407.35
b) The Company also uses derivative contracts other than forward contracts to hedge the interest rate and currency risk on capital account. Such transactions are governed by the strategy approved by the Board of Directors, which provide principles on the use of these instruments, consistent with the Company’s Risk Management Policy. The Company does not use these contracts for speculative purposes.
Notional value of Interest Rate Swaps (IRS) to hedge against
As at No. of Contracts US$ Equivalent of notional value
(Million)
MTM of IRS (INR crores)
31.03.2011 2 50 (5.33)
31.03.2010 2 10 (0.24)
c) The year end foreign currency exposures that have not been hedged by a derivative instrument or otherwise are given below:
i)following:
Current Year Previous Year
US$equivalent
(Million)
INREquivalent
(crores)
US$equivalent(Million)
INREquivalent
(crores)
Debtors 9.32 41.61 16.93 76.44
Balances with banks
- in Fixed Deposit Account 10.01 44.68 0.01 0.03
- in Current Account 0.03 0.12 0.29 1.32
Advances/Loans to Subsidiaries 300.97 1,343.83 155.85 703.43
following:
Current Year Previous Year
US$equivalent
(Million)
INREquivalent
(crores)
US$equivalent(Million)
INREquivalent
(crores)
Acceptances 1,225.20 5,470.53 959.20 4,329.82
Creditors 85.61 382.24 103.93 469.17
Loans payable 947.39 4,230.11 741.32 3,346.31
Redemption premium payable on FCCB’s 84.06 375.31 59.42 268.21
8. Research and Development Activities:
recognised facility as under:-
` in crores
Particulars Buildings Plant and Machinery
Total
Gross Block at the beginning of the year
Current Year Previous Year
1.47 0.28
14.48 10.73
15.95 11.01
Additions during the year Current Year Previous Year
– 1.19
13.05 3.75
13.05 4.94
Gross Block at the end of the year
Current Year Previous Year
1.47 1.47
27.53 14.48
29.00 15.95
Capital Work-in-Progress Current Year Previous Year
2.68 –
33.29 7.30
35.97 7.30
Capital Expenditure incurred during the year (including CWIP)
Current Year Previous Year
2.68 1.19
39.04 5.92
41.72 7.11
b) The manufacturing and other expenses and depreciation include ` 3.85 crores (previous year ` 3.23 crores) and ` 1.38 crores (Previous Year ` 0.83 crore), respectively, in respect of Research and Development activities undertaken during the year.
Company’s contribution to Provident Fund ` 17.05 crores. (previous year `

74
JSW Steel Limited
` in crores
Current Year Previous Yeara) Liability recognized in the Balance Sheet
i) Present value of obligation Opening Balance 36.91 31.22 Service Cost 3.75 3.82 Interest Cost 3.17 2.67 Actuarial loss on obligation 7.71 0.32
(1.94) (1.12) Closing Balance 49.60 36.91
Less:ii) Fair Value of Plan Assets
Opening Balance 33.66 26.14 Expected Return on Plan assets less
loss on investments2.93 2.53
Actuarial (loss)/gain on Plan Assets (0.46) 0.08 Employers' Contribution 3.91 6.03
(1.94) (1.12) Closing Balance 38.10 33.66Amount recognized in Balance Sheet 11.50 3.25b) Expenses during the year(included
in Schedule 15 under Contribution to Provident and Other Funds)Service cost 3.75 3.82Interest cost 3.17 2.67Expected Return on Plan assets (2.93) (2.53)Actuarial Loss 8.17 0.24Transferred to pre-operative expenses (0.81) (0.24)Total 11.35 3.96
c) Actual Return on plan assets 2.47 2.61d) Break up of Plan Assets:
(i) ICICI Prudential Life Insurance Co. Ltd. Balanced Fund 3.18 2.96 Debt Fund 1.18 1.11 Short Term Debt Fund 3.82 5.11
(ii) HDFC Standard Life Insurance Co. Ltd. Defensive Managed Fund 0.99 0.93 Stable Managed Fund 10.55 8.45
(iii) SBI Life Insurance Co. Ltd. – Cap Assured Fund
11.93 9.47
(iv) LIC of India – Insurer Managed Fund 6.45 5.63
` in crores
Current Year Previous Year
e) Principal actuarial assumptions
Rate of Discounting 8% p.a. 8% p.a.
Expected Return on Plan Assets 8% p.a. 8% p.a.
Rate of increase in salaries 6% p.a. 6% p.a.
Attrition Rate 2% p.a. 2% p.a.
The Company expects to contribute ` 12.22 crores to its Gratuity Plan for the next year.
In assessing the Company’s Post Retirement Liabilities, the Company monitors mortality assumptions and uses up-to-date mortality tables, the
Expected return on plan assets is based on expectation of the average long term rate of return expected on investments of the fund during the estimated term of the obligations.
The estimates of future salary increase, considered in actuarial valuation,
such as supply and demand in the employment market.
Other disclosures:
` in crores
Particulars 2010-11 2007-08
49.60 31.22 25.42
38.10 21.42
(11.50) (3.25) (5.08) (4.00)
Plan Liabilities – Loss 7.71 1.44 1.42 1.78
(0.46) 0.08 (1.22) (0.27)
10. Segment Reporting:
The Company is primarily engaged in the business of manufacture
primary business segments, namely Steel and Power (used mainly for
17 on “Segment Reporting” constitute reportable segments.
Information about Primary Business Segments
` in crores
Current Year 31.03.2011 Previous Year 31.03.2010Particulars Steel Power Eliminations Total Steel Power Eliminations TotalINCOMEExternal Sales 23,057.90 105.34 23,163.24 18,077.71 124.77 18,202.48Inter Segment Revenue 651.87 988.73 (1,640.60) – 490.97 843.41 (1,334.38) –Total Revenue 23,709.77 1,094.07 (1,640.60) 23,163.24 18,568.68 968.18 (1,334.38) 18,202.48
Segment ResultsSegment/Operating Results 3,185.40 344.26 3,529.66 3,288.10 389.84 3,677.94Un-allocated Items:(Expenses)/Income (52.20) 0.63Net Finance Charges (695.18) (858.92)Provision for Taxation (771.61) (796.91)
2,010.67 2,022.74

75
Annual Report 2010-11
` in crores
Current Year 31.03.2011 Previous Year 31.03.2010Particulars Steel Power Eliminations Total Steel Power Eliminations TotalOther InformationSegment Assets 33,276.08 1,844.96 35,121.04 27,279.78 1,272.83 28,552.61Un-allocated Assets 6,437.34 2,325.67Total Assets 41,558.38 30,878.28
Segment Liabilities 9,569.70 33.49 9,603.19 7,225.66 55.81 7,281.47Un-allocated Liabilities and Provisions 14,729.92 13,890.47Total Liabilities 24,333.11 21,171.94
Depreciation 1,341.00 37.71 1,378.71 1,088.74 34.67 1,123.41
Total Cost incurred during the year to acquire Segment Assets 3,928.93 1,174.26 5,103.19 2,335.03 17.96 2,352.99
Notes:1. Inter Segment transfer from the power segment is measured at the rate at which power is purchased/sold from/to the respective Electricity Board.2. Inter Segment transfer from the steel segment is measured on the basis of fuel cost.
11. Related Parties disclosure as per Accounting Standard (AS)-18:
A. List of Related Parties
Parties with whom the Company has entered into transactions during the period where control exists :
1. SubsidiariesJSW Steel (UK) LimitedJSW Steel Service Centre (UK) Limited
JSW Natural Resources LimitedJSW Natural Resources Mozambique LimitadaJSW Steel (Netherlands) B.V.
Periama Holdings LLC (West Virginia LLC) (w.e.f. 3.05.2010)Planck Holdings LLC (w.e.f. 3.05.2010)
Carreta Minerals LLC (w.e.f. 3.05.2010)Periama Handling LLC (w.e.f. 3.05.2010)Lower Hutchinson Minerals LLC (w.e.f. 3.05.2010)Purest Energy LLC (w.e.f. 3.05.2010)Meadow Creek Minerals LLC (w.e.f. 3.05.2010)Keenan Minerals LLC (w.e.f. 3.05.2010)Hutchinson Minerals LLC (w.e.f. 3.05.2010)RC Minerals LLC (w.e.f. 3.05.2010)Peace Leasing LLC (w.e.f. 3.05.2010)Prime Coal LLCJSW Panama Holdings CorporationInversiones Eurosh LimitadaSanta Fe Mining
JSW Steel Processing Centres LimitedJSW Jharkhand Steel LimitedJSW Bengal Steel Limited
JSW Building Systems LimitedJSW Natural Resources India Limited
2. AssociatesJindal Praxair Oxygen Company Private Limited JSW Energy (Bengal) LimitedIspat Industries Limited (w.e.f. 24.01.2011)
3. Joint VenturesVijayanagar Minerals Private Limited Rohne Coal Company Private Limited
Gourangdih Coal LimitedToshiba JSW Turbine and Generator Private LimitedMJSJ Coal Limited
4. Key Management Personnel (KMP)Mr. Sajjan JindalMr. Seshagiri Rao M V SDr. Vinod Nowal
5. Relatives of Key Management PersonnelMrs. Savitri Devi Jindal
6. Enterprises over which Key Management Personnel and
JSW Energy Limited JSL Limited JSW Realty & Infrastructure Private LimitedJindal Saw LimitedJindal Steel & Power Limited Jindal South West Holdings LimitedJSOFT Solutions LimitedJindal Industries LimitedJSW Energy (Ratnagiri) LimitedJSW Cement LimitedJSW Jaigarh Port LimitedNalwa Sons & Investments LimitedJSW Investments Private LimitedReynold Traders Private LimitedRaj West Power LimitedJSW Power Trading Company Limited
O P Jindal FoundationJSW Infrastructure & Logistic LimitedSouth West Port Limited JSW Techno Projects Management LimitedSapphire Technologies Limited

JSW Steel Limited
` in crores Particulars Subsidiaries Associates Joint
Ventures Key
ManagementPersonnel
Relatives of Key
ManagementPersonnel
Enterprises over which KMP and relatives of
such personnel exercise
Total
B.Transactions with related partiesParty's NamePurchase of Goods/Power & Fuel / ServicesJSW Energy Limited – – – – – 430.01 430.01
– – – – – 572.76 572.76Jindal Praxair Oxygen Company Private Limited
– 130.77 – – – – 130.77
– 120.62 – – – – 120.62Ispat Industries Limited – 568.90 – – – – 568.90
– – – – – – –Others 59.10 – 50.61 – – 151.74 261.45
90.94 – 48.56 – – 106.22 245.72Total 59.10 699.67 50.61 – – 581.75 1,391.13
90.94 120.62 48.56 – – 678.98 939.10Reimbursement of Expenses incurred on our behalf by Jindal South West Holdings Limited – – – – – 0.13 0.13
– – – – – – –JSW Energy Limited – – – – – – –
– – – – – 2.73 2.73Others – – – – – – –
– – – – – 0.11 0.11Total – – – – – 0.13 0.13
– – – – – 2.84 2.84Sales of Goods/Power & FuelJSW Energy Limited – – – – – 771.23 771.23
– – – – – 727.38 727.38Jindal Industriers Limited – – – – – 214.28 214.28
– – – – – 202.38 202.38Ispat Industries Limited – 325.85 – – – – 325.85
– – – – – – –Others 58.49 5.76 5.12 – – 313.67 383.04
44.81 3.95 0.70 – – 301.88 351.34Total 58.49 331.61 5.12 – – 1,299.18 1,694.40
44.81 3.95 0.70 – – 1,231.64 1,281.10Other Income /Interest incomeJSW Steel (Netherlands) B.V. 25.78 – – – – – 25.78
25.94 – – – – – 25.94JSW Energy Limited – – – – – 6.01 6.01
– – – – – 0.57 0.57Inversiones Eurosh Limitada 9.50 – – – – – 9.50
1.67 – – – – – 1.67JSW Steel Holding (USA) Inc. 8.69 – – – – – 8.69
– – – – – – –Others 0.97 3.86 0.40 – – 2.36 7.59
0.43 0.01 0.62 – – 6.17 7.23Total 44.94 3.86 0.40 – – 8.37 57.57
28.04 0.01 0.62 – – 6.74 35.41Purchase of AssetsJindal Steel & Power Limited – – – – – 250.01 250.01
– – – – – 48.89 48.89Jindal Saw Limited – – – – – 7.47 7.47
– – – – – 8.95 8.95JSW Energy Limited – – – – – 95.07 95.07
– – – – – – –Others – – 6.10 – – 19.56 25.66
5.29 – – – – 3.68 8.97Total – – 6.10 – – 372.11 378.21
5.29 – – – – 61.52 66.81

77
Annual Report 2010-11
` in crores Particulars Subsidiaries Associates Joint
Ventures Key
ManagementPersonnel
Relatives of Key
ManagementPersonnel
Enterprises over which KMP and relatives of
such personnel exercise
Total
Sale of AssetsJSW Techno Project Management Limited – – – – – 0.07 0.07
– – – – – – –JSW Investments Private Limited – – – – – 0.16 0.16
– – – – – – –JSW Energy (Ratnagiri) Limited – – – – – –
– – – – – 3.35 3.35JSW Energy Limited – – – – – 0.04 0.04
– – – – – 0.89 0.89Jsoft Solutions Limited – – – – – – –
– – – – – 0.07 0.07Total – – – – – 0.27 0.27
– – – – – 4.31 4.31Lease & Other deposits given JSW Energy (Ratnagiri) Limited – – – – – – –
– – – – – 0.07 0.07JSW Jaigarh Port Limited – – – – – – –
– – – – – 3.50 3.50– – – – – – –– – 13.00 – – – 13.00
Jindal Saw Limited – – – – – 2.50 2.50– – – – – 2.50 2.50
Total – – – – – 2.50 2.50– – 13.00 – – 6.07 19.07
Lease & Other deposits refundedJSW Power Trading Company Limited – – – – – 20.00 20.00
– – – – – – –Total – – – – – 20.00 20.00
– – – – – – –Advance given JSW Building System Limited – – – – – – –
0.20 – – – – – 0.20Total – – – – – – –
0.20 – – – – – 0.20Advance given Received back JSW Building System Limited – – – – – – –
0.20 – – – – – 0.20Total – – – – – – –
0.20 – – – – – 0.20Loan given Received back JSW Steel (Netherlands) B.V. 23.30 – – – – – 23.30
101.86 – – – – – 101.86JSW Steel Holding (USA) Inc. 391.29 – – – – – 391.29
– – – – – – –Inversiones Eurosh Limitada 23.77 – – – – – 23.77
– – – – – – –Total 438.36 – – – – – 438.36
101.86 – – – – – 101.86Loan givenJSW Steel (Netherlands) B.V. 90.05 – – – – – 90.05
101.86 – – – – – 101.86JSW Natural Resources Limited 3.92 – – – – – 3.92
0.35 – – – – – 0.35
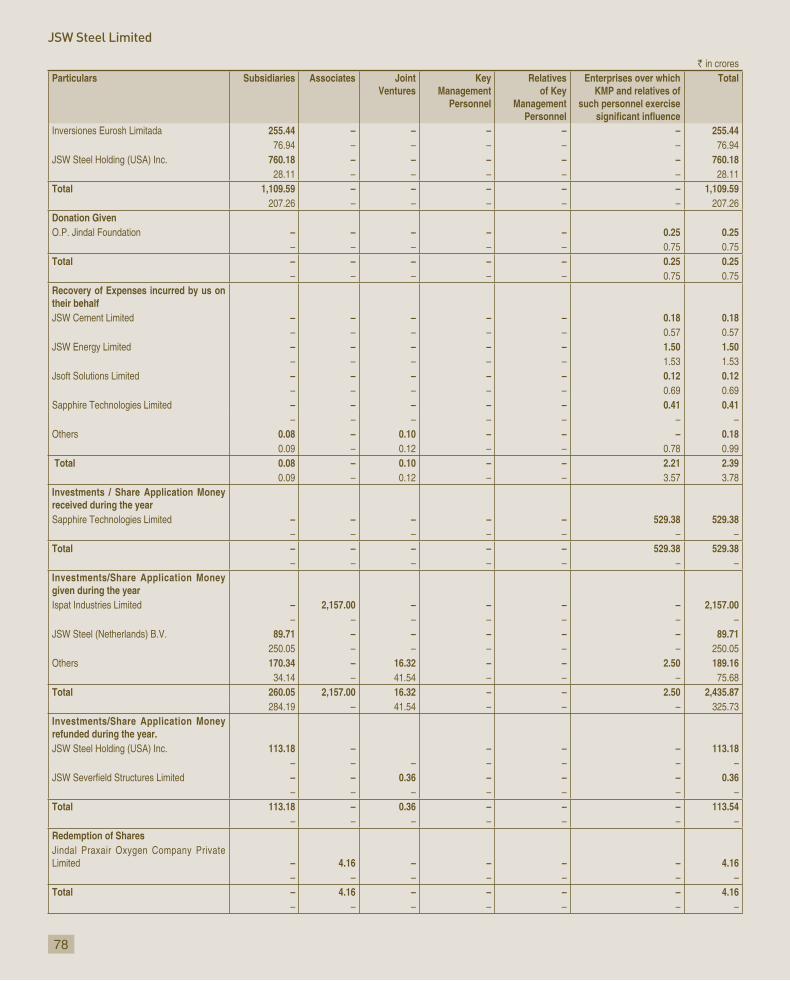
78
JSW Steel Limited
` in crores Particulars Subsidiaries Associates Joint
Ventures Key
ManagementPersonnel
Relatives of Key
ManagementPersonnel
Enterprises over which KMP and relatives of
such personnel exercise
Total
Inversiones Eurosh Limitada 255.44 – – – – – 255.4476.94 – – – – – 76.94
JSW Steel Holding (USA) Inc. 760.18 – – – – – 760.1828.11 – – – – – 28.11
Total 1,109.59 – – – – – 1,109.59207.26 – – – – – 207.26
Donation Given O.P. Jindal Foundation – – – – – 0.25 0.25
– – – – – 0.75 0.75Total – – – – – 0.25 0.25
– – – – – 0.75 0.75Recovery of Expenses incurred by us on their behalfJSW Cement Limited – – – – – 0.18 0.18
– – – – – 0.57 0.57JSW Energy Limited – – – – – 1.50 1.50
– – – – – 1.53 1.53Jsoft Solutions Limited – – – – – 0.12 0.12
– – – – – 0.69 0.69Sapphire Technologies Limited – – – – – 0.41 0.41
– – – – – – –Others 0.08 – 0.10 – – – 0.18
0.09 – 0.12 – – 0.78 0.99 Total 0.08 – 0.10 – – 2.21 2.39
0.09 – 0.12 – – 3.57 3.78Investments / Share Application Money received during the yearSapphire Technologies Limited – – – – – 529.38 529.38
– – – – – – –Total – – – – – 529.38 529.38
– – – – – – –Investments/Share Application Money given during the yearIspat Industries Limited – 2,157.00 – – – – 2,157.00
– – – – – – –JSW Steel (Netherlands) B.V. 89.71 – – – – – 89.71
250.05 – – – – – 250.05Others 170.34 – 16.32 – – 2.50 189.16
34.14 – 41.54 – – – 75.68Total 260.05 2,157.00 16.32 – – 2.50 2,435.87
284.19 – 41.54 – – – 325.73Investments/Share Application Money refunded during the year.JSW Steel Holding (USA) Inc. 113.18 – – – – 113.18
– – – – – – –– – 0.36 – – – 0.36– – – – – – –
Total 113.18 – 0.36 – – – 113.54– – – – – – –
Redemption of SharesJindal Praxair Oxygen Company Private Limited – 4.16 – – – – 4.16
– – – – – – –Total – 4.16 – – – – 4.16
– – – – – – –

Annual Report 2010-11
` in crores Particulars Subsidiaries Associates Joint
Ventures Key
ManagementPersonnel
Relatives of Key
ManagementPersonnel
Enterprises over which KMP and relatives of
such personnel exercise
Total
RemunerationMrs. Savitri Devi Jindal – – – – 0.08 – 0.08
– – – – 0.08 – 0.08Mr. Sajjan Jindal – – – 20.80 – – 20.80
– – – 14.25 – – 14.25Mr. Seshagiri Rao M V S – – – 3.26 – – 3.26
– – – 2.91 – – 2.91Mr. Y Siva Sagar Rao – – – – – – –
– – – 0.35 – – 0.35Dr. Vinod Nowal – – – 2.35 – – 2.35
– – – 1.83 – – 1.83Mr. Jayant Acharya – – – 2.00 – – 2.00
– – – 1.04 – – 1.04Total – – – 28.41 0.08 – 28.49
– – – 20.38 0.08 – 20.46Guarantees and collaterals provided by the Company on behalf ofJSW Steel Holding (USA) Inc. 267.90 – – – – – 267.90
1,228.01 – – – – – 1,228.01JSW Steel (Netherlands) B.V. – – – – – – –
532.91 – – – – – 532.91JSW Steel Processing Centres Limited 8.73 – – – – – 8.73
– – – – – – –Total 276.63 – – – – – 276.63
1,760.92 – – – – – 1,760.92
Guarantees and collaterals released
JSW Steel (Netherlands) B.V. 1,963.59 – – – – – 1,963.59
561.72 – – – – – 561.72
JSW Steel (USA) Inc. 270.84 – – – – – 270.84
– – – – – – –
Others – 39.52 89.85 – – 75.00 204.37
– – – – – – –
Total 2,234.43 39.52 89.85 – – 75.00 2,438.80
561.72 – – – – – 561.72
C. Closing balance of related parties
Trade payables
Jindal Praxair Oxygen Company Private Limited – 11.69 – – – – 11.69
– 10.38 – – – – 10.38
South West Port Limited – – – – – 20.73 20.73
– – – – – 17.03 17.03
JSW Steel Processing Centres Limited 20.37 – – – – – 20.37
11.88 – – – – – 11.88
Jindal Steel & Power Limited – – – – – 8.66 8.66
– – – – – – –
Vijayanagar Minerals Private Limited – – 12.50 – – – 12.50
– – 10.81 – – – 10.81
Others 1.47 – 0.69 – – 6.37 8.53
1.35 – – – – 5.71 7.06
Total 21.84 11.69 13.19 – – 35.76 82.48
13.23 10.38 10.81 – – 22.74 57.16

80
JSW Steel Limited
` in crores Particulars Subsidiaries Associates Joint
Ventures Key
ManagementPersonnel
Relatives of Key
ManagementPersonnel
Enterprises over which KMP and relatives of
such personnel exercise
Total
Advance received from CustomersJSW Jaigarh Port Limited – – – – – 0.83 0.83
– – – – – 0.04 0.04Jindal Saw Limited – – – – – – –
– – – – – 0.22 0.22JSW Energy (Ratnagiri) Limited – – – – – 0.97 0.97
– – – – – – –Raj west Power Limited – – – – – 6.49 6.49
– – – – – 1.27 1.27Total – – – – – 8.29 8.29
– – – – – 1.53 1.53Lease & Other deposit receivedJindal Praxair Oxygen Company Private Limited – 3.83 – – – – 3.83
– 3.83 – – – – 3.83JSW Energy Limited – – – – – 6.49 6.49
– – – – – 6.49 6.49JSW Energy (Ratnagiri) Limited – – – – – 3.71 3.71
– – – – – 3.71 3.71JSW Power Trading Company Limited – – – – – – –
– – – – – 20.00 20.00JSW Jaigarh Port Limited – – – – – 3.50 3.50
– – – – – 3.50 3.50Jindal Saw Limited – – – – – 5.00 5.00
– – – – – 2.50 2.50– – 13.00 – – – 13.00– – – – – 13.00 13.00
Total – 3.83 13.00 – – 18.70 35.53– 3.83 – – – 49.20 53.03
Trade receivablesJSW Energy Limited – – – – – 16.97 16.97
– – – – – 69.80 69.80JSW Cement Limited – – – – – 28.07 28.07
– – – – – 18.84 18.84JSW Power Trading Company Limited – – – – – 56.64 56.64
– – – – – 20.16 20.16Ispat Industries Limited – 210.67 – – – – 210.67
– – – – – – –Others – – – – – 19.63 19.63
– – – – – 11.46 11.46Total – 210.67 – – – 121.31 331.98
– – – – – 120.26 120.26Share Application Money GivenVijayanagar Minerals Private Limited – – 4.05 – – – 4.05
– – 4.05 – – – 4.05– – – – – – –– – 7.30 – – – 7.30
Toshiba JSW Turbine Power Generator Private Limited
– – – – – – –
– – 6.50 – – – 6.50Gourangdih Coal Limited – – 0.05 – – – 0.05
– – 2.50 – – – 2.50Rohne Coal Company Limited – – 2.33 – – – 2.33
– – 0.02 – – – 0.02Others 0.10 – – – – – 0.10
0.67 – – – – – 0.67Total 0.10 – 6.43 – – – 6.53
0.67 – 20.37 – – – 21.04

81
Annual Report 2010-11
` in crores Particulars Subsidiaries Associates Joint
Ventures Key
ManagementPersonnel
Relatives of Key
ManagementPersonnel
Enterprises over which KMP and relatives of
such personnel exercise
Total
Share Application Money ReceivedSapphire Technologies Limited – – – – – 529.38 529.38
– – – – – – –Total – – – – – 529.38 529.38
– – – – – – –Capital /Revenue Advances Jindal Steel & Power Limited – – – – – – –
– – – – – 13.66 13.66Jindal Saw Limited – – – – – – –
– – – – – 0.14 0.14Total – – – – – – –
– – – – – 13.80 13.80Loan and Advances givenJSW Steel (Netherlands) B.V. 632.09 – – – – – 632.09
598.61 – – – – – 598.61JSW Steel Holding (USA) Inc. 391.18 – – – – – 391.18
18.86 – – – – – 18.86Inversiones Eurosh Limitada 314.89 – – – – – 314.89
77.10 – – – – – 77.10Others 8.06 – 0.08 – – 0.17 8.31
11.21 – 0.18 – – 0.42 11.81Total 1,346.22 – 0.08 – – 0.17 1,346.47
705.78 – 0.18 – – 0.42 706.38Investments held by the CompanyJSW Steel (Netherlands) B.V. 1,020.02 – – – – – 1,020.02
930.26 – – – – – 930.26Ispat Industries Limited – 2,157.00 – – – – 2,157.00
– – – – – – –Others 314.06 76.03 70.98 – – 250.90 711.97
256.35 80.19 40.72 – – 248.40 625.66Total 1,334.08 2,233.03 70.98 – – 250.90 3,888.99
1,186.61 80.19 40.72 – – 248.40 1,555.92Guarantees and collaterals provided by the Company on behalf:JSW Steel (Netherlands) B.V. and it's subsidiaries for USA and Chile acquisition 1,611.78 – – – – – 1,611.78
1,489.62 – – – – – 1,489.62JSW Steel (USA) Inc. – – – – – – –
163.77 – – – – – 163.77Others 8.73 – – – – – 8.73
– 39.52 89.85 – – 75.00 204.37Total 1,620.51 – – – – – 1,620.51
1,653.39 39.52 89.85 – – 75.00 1,857.76
Figures in bold represents current year numbers.

82
JSW Steel Limited
12. Operating Lease
a) As Lessor:
i. The Company has entered into lease arrangements, for renting :
square feet) at the rate of ` 100/- per house per annum, for a period of 180 months.
square feet) at the rate of ` 24/- per square feet per
– 1 house at the rate of ` 0.72 lacs per annum, for a period of 11 months.
feet) at the rate of ` 40/- per square feet per month
The agreements are renewable at the option of the lessee after the end of the lease term.
ii. Disclosure in respect of assets given on operating lease :
` in croresCurrent
YearPrevious
Year 170.76
18.04 13.31Depreciation for the year 3.08 2.31
b) As Lessee:
Lease Rentals charged to revenue for right to use following assets are:
` in croresParticualrs Current
YearPrevious
Year 8.74
Total: 8.74
a renewable clause and also provide for termination at will by either party giving a prior notice period of 1 to 3 months.
13. Earnings Per Share (EPS):
CurrentYear
PreviousYear
` in crs. 2,010.67 2,022.74
Less: Dividend on preference shares (Including corporate dividend tax) ` in crs. 32.43 33.73
share holders (Numerator)- ` in crs. 1,978.24
Weighted average number of equity shares for Basic EPS (denominator) (B) Nos. 203,595,864
Weighted average number of equity shares for Diluted EPS (denominator) (C) Nos. 205,363,404
Earning per share – Basic ` 97.17
Earning per share – Diluted ` 96.33
Nominal value per share ` 10 10
14. Income Tax:
a) Provision for Taxation includes:
` in crores
CurrentYear
PreviousYear
Income Tax :
Current Tax 569.00
Deferred Tax 387.67
MinimCredit enti t lement ( including ` 18.52 crores (Previous year - ` Nil) pertaining to earlier years) (198.15) (258.53)
Tax adjustment of earlier years 12.59 (0.52)
Wealth Tax 0.50 0.50
Total 771.61
b) Deferred Tax Liability comprises of timing differences on account of:
` in croresCurrent
YearPrevious
YearDepreciation 2,417.51Expenses allowable on payment basis (18.77) (13.88)Provision for doubtful debts/ advances (36.56) (37.24)Others (45.14) (41.54)Deferred Tax Liability 2,317.04
15. The Company has the following Joint venture interest in India as at 31 March 2011:
Interest as Venturer
Vijayanagar Minerals Private Limited: Percentage of holding - 40% (Previous year 40%)
%)
50%(Previous Year 50%)
Gaurangdih Coal Limited : Percentage of holding – 50% (Previous Year 50%)
Interest as Investor
MJSJ Coal Limited: Percentage of holding – 11% (Previous year 11%)
Toshiba JSW Turbine and Generator Private Limited – 5% (Previous year 5%)
The proportionate share of assets, liabilities, income and expenditure of the jointly controlled entities are as under:
` in crores Current Year
(Audited/Based
information/estimates
made by the management)
Previous Year
information/estimates
made by the management)
I. Assets
CWIP) 106.98
Investments 2.76 –
0.03 –
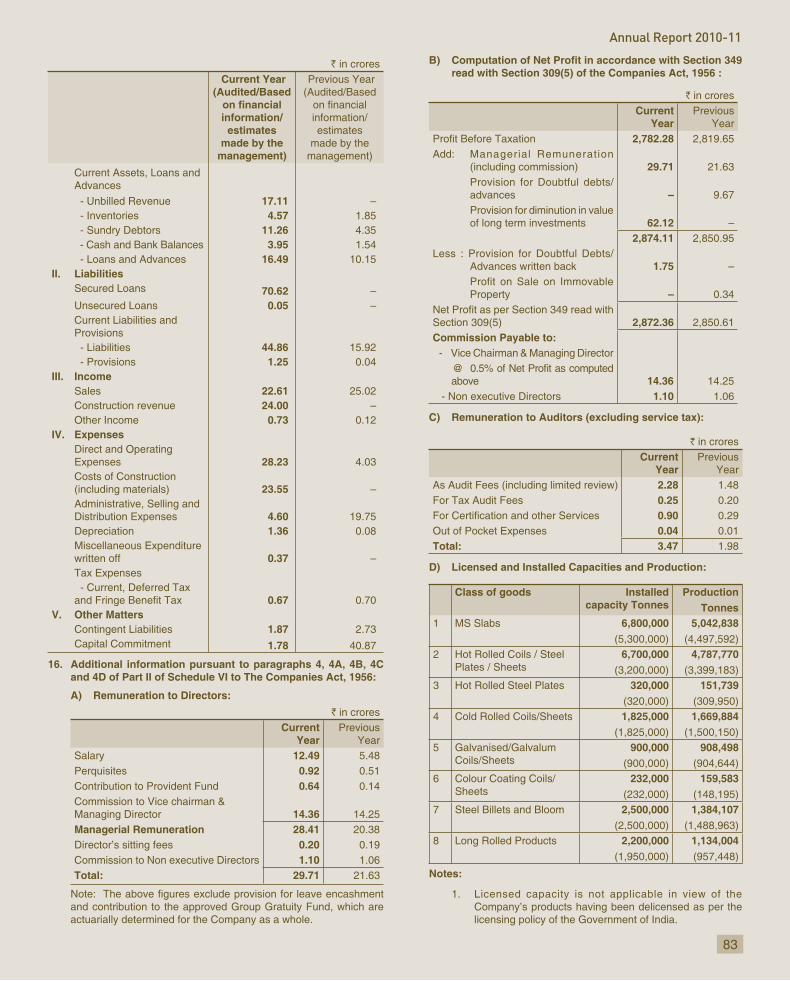
83
Annual Report 2010-11
` in crores Current Year
(Audited/Based
information/estimates
made by the management)
Previous Year
information/estimates
made by the management)
- Unbilled Revenue 17.11 – - Inventories 4.57 1.85 - Sundry Debtors 11.26 4.35 - Cash and Bank Balances 3.95 1.54
16.49 10.15 II. Liabilities
Secured Loans 70.62 – Unsecured Loans 0.05 – Current Liabilities and Provisions - Liabilities 44.86 - Provisions 1.25 0.04
III. IncomeSales 22.61 25.02 Construction revenue 24.00 – Other Income 0.73 0.12
IV. ExpensesDirect and Operating Expenses 28.23 4.03 Costs of Construction (including materials) 23.55 –
Distribution Expenses 4.60 Depreciation 1.36 0.08 Miscellaneous Expenditure written off 0.37 – Tax Expenses - Current, Deferred Tax
0.67 0.70 V. Other Matters
Contingent Liabilities 1.87 2.73 Capital Commitment 1.78 40.87
16. Additional information pursuant to paragraphs 4, 4A, 4B, 4C and 4D of Part II of Schedule VI to The Companies Act, 1956:
A) Remuneration to Directors:
` in croresCurrent
YearPrevious
YearSalary 12.49 5.48Perquisites 0.92 0.51Contribution to Provident Fund 0.64 0.14Commission to Vice chairman & Managing Director 14.36 14.25Managerial Remuneration 28.41 20.38 Director’s sitting fees 0.20 Commission to Non executive Directors 1.10 Total: 29.71
Note:and contribution to the approved Group Gratuity Fund, which are actuarially determined for the Company as a whole.
read with Section 309(5) of the Companies Act, 1956 :
` in croresCurrent
YearPrevious
Year2,782.28
(including commission) 29.71Provision for Doubtful debts/ advances – Provision for diminution in value of long term investments 62.12 –
2,874.11Less : Provision for Doubtful Debts/
1.75 –
Property – 0.34
2,872.36Commission Payable to: - Vice Chairman & Managing Director
above 14.36 14.25 - Non executive Directors 1.10
C) Remuneration to Auditors (excluding service tax):
` in croresCurrent
YearPrevious
Year2.28 1.480.25 0.20
0.90 Out of Pocket Expenses 0.04 0.01Total: 3.47
D) Licensed and Installed Capacities and Production:
Class of goods Installedcapacity Tonnes
ProductionTonnes
1 MS Slabs 6,800,000(5,300,000)
5,042,838
2 Hot Rolled Coils / Steel Plates / Sheets
6,700,000 (3,200,000)
4,787,770
3 Hot Rolled Steel Plates 320,000 (320,000)
151,739
4 Cold Rolled Coils/Sheets 1,825,000 (1,825,000)
1,669,884 (1,500,150)
5 Galvanised/GalvalumCoils/Sheets
900,000 908,498
Colour Coating Coils/ Sheets
232,000 (232,000)
159,583
7 Steel Billets and Bloom 2,500,000 (2,500,000)
1,384,107
8 Long Rolled Products 2,200,000 1,134,004
Notes:
1. Licensed capacity is not applicable in view of the Company’s products having been delicensed as per the licensing policy of the Government of India.

84
JSW Steel Limited
accepted by auditors, being a technical matter.
3. Production of Galvanized/Galvalume Coils/Sheets includes
parties on a job work basis.
E) Opening Stock, Sales and Closing Stock:
i) Manufactured Goods
Class of goods Opening Stock Sales Closing Stock
Tonnes ̀incrores
Tonnes ̀in crores Tonnes ` incrores
1 MS Slabs 64,817(37,550)
134.12(76.29)
138,177(716,847)
511.08(1,816.53)
32,073(64,817)
76.93(134.12)
2 Hot Rolled Coils/SteelPlates/Sheets
58,351(70,073)
133.59(154.27)
2,922,933(1,750,055)
10,486.33(5,414.70)
138,090(58,351)
384.42(133.59)
3 GalvanizedCoils/Sheets
36,453(61,307)
118.72(183.05)
709,851(770,690)
3,348.04(3,065.07)
61,489(36,453)
273.28(118.72)
4 Cold Rolled Coils/Sheets
50,793(37,443)
128.40(90.00)
782,543(624,030)
3,319.60(2,153.50)
74,816(50,793)
236.00(128.40)
5 Hot Rolled Steel Plates
8,912(17,563)
23.62(45.31)
132,386(293,177)
503.29(956.56)
4,855(8,912)
14.39(23.62)
6 Colour Coating Coils/Sheets
6,413(10,171)
25.98(38.59)
152,307(149,532)
870.41(695.44)
10,918(6,413)
60.07(25.98)
7 Steel Billets and Blooms
16,914(15,951)
40.05(38.56)
205,613(527,097)
687.88(1,253.11)
28,737(16,914)
84.21(40.05)
8 Long Rolled Products
55,030(7,049)
138.86(21.23)
1,055,236(873,863)
3769.24(2,724.77)
59,990(55,030)
202.74(138.86)
9 Sale of Carbon Credits
38.67(60.21)
10 Others 37.20(39.82)
1,394.78(1,278.04)
46.46(37.20)
Total: 780.54(687.12)
24,929.32(19,417.93)
1,378.50(780.54)
ii) Traded Goods
DescriptionCurrent Year Previous Year
QuantityTonnes
` in crores QuantityTonnes
` in crores
Opening StockHot Rolled Plates 42 0.13 5,555Others – – – –
Total: 42 0.13 5,555Purchases
Hot Rolled Plates – – 12,114Others 1,301 182.23 – –
Total: 1,301 182.23 12,114Sales
Hot Rolled Plates 42 0.14 38.71Others 1,301 201.29 – –
Total: 1,343 201.43 38.71Closing Stock
Hot Rolled Plates – – 42 0.13 Others – – – –
Total: – – 42 0.13
tonnes)
F) Consumption of Materials:
Description Current Year Previous YearQuantityTonnes
` in crores QuantityTonnes
` in crores
12,972,111 3,707.80Coal/Coke 7,803,364 8,328.21 7,384,743Hot Rolled Coils 158,138 563.11 22,135 58.27M S Slabs 29,128 75.44 25,258 47.80
41,152 446.33Others 2,121.87Sub Total: 15,242.76Less: captive consumption 487.91 231.77Total: 14,754.85
G) Value of Consumption of directly imported and indigenously obtained raw materials and stores and spares and the percentage of each to total consumption:
` in croresDescription Current Year Previous Year
Value` in crores
% of Total
Value
Value` in crores
% of Total
ValueRAW MATERIALSImported 9,375.83 63.54Indigenous 5,379.02 36.46 33.24Total: 14,754.85 100.00 100.00STORES AND SPARESImported 174.07 16.45Indigenous 884.04 83.55 777.07Total: 1,058.11 100.00 100.00
H) C.I.F. Value of Imports:
` in croresDescription Current Year Previous YearCapital Goods 1,482.99 Raw Materials 8,732.64 Stores and Spare Parts 278.44 172.82
I) Expenditure in Foreign Currency:
` in crores
Description Current Year Previous Year
Interest and Finance charges 218.28
Ocean Freight 179.41 131.73
Power and Fuel 141.84 70.74
Commission on sales 36.70 45.81
Legal and Professional Fees 4.08
Others 21.36 7.57
J) Earnings in Foreign Currency:
` in crores
Description Current Year Previous Year
F.O.B. Value of Exports 3,328.25
Sale of Carbon Credits 38.67
Interest Income 45.76 28.03

85
Annual Report 2010-11
K) Remittance in Foreign Currency on Account of Dividend:
a) Dividend to Equity Shareholders:
Description Current Year Previous Year
Year to which the Dividend relates 2009-10
Number of Non-resident Shareholders 4,395
Number of Equity Shares held by them 14,228,602 14,244,744
` in crores) 13.52 1.42
b) Dividend to Preference Shareholder:
Description Current Year Previous Year
Year to which the Dividend relates NA
Number of Non-resident Shareholders NA 1 1
Number of Preference Shares held by them NA
` in crores) NA 1.02*
* (Up to the date of Redemption that is 8.03.2010)
17 Disclosure pertaining to Micro, Small and Medium Enterprises (as per information available with the Company):
` in croresDescription Current
YearPrevious
YearPrincipal amount due outstanding as at end of the year 15.92 38.15 Interest due on (1) above and unpaid as at end of the year 0.56 0.32 Interest paid to the supplier – – Payments made to the supplier beyond the appointed day during the period – – Interest due and payable for the period of delay – – Interest accrued and remaining unpaid as at end of the year 1.21
payable in succeeding year 1.21
18. Comparative financial information (i.e. the amounts and other disclosure for the preceding year) presented above, is included as
be read in relation to the amounts and other disclosures relating to the current year. Figures of the previous year are regrouped and
current year.
For DELOITTE HASKINS & SELLS
SAJJAN JINDAL Vice Chairman & Managing Director
P. B. PARDIWALLA LANCY VARGHESE RAJEEV PAI SESHAGIRI RAO M.V.S.
Place: Mumbai

JSW Steel Limited
I. Registration No. 152925 State Code 11
Balance Sheet Date 31-3-2011
II. Capital raised during the year ` in thousands):
Public Issue Nil
Rights Issue Nil
Bonus Issue Nil
Private Placement
Others Nil
III. Position of Mobilisation and Deployment of Funds ` in thousands):
Total Liabilities 415,583,831
415,583,831
Sources of Funds
Paid-up Capital
Share Warrants
Reserves and Surplus
Secured Loans
Unsecured Loans 42,755,228
Net Deferred Tax Liability
Application of Funds
272,712,013
Investments
Miscellaneous Expenditure Nil
Nil
IV. Performance of Company ` in thousands) :
Turnover 254,134,003
Total Expenditure
Earning per share in ` (Basic)
Earning per share in ` (Diluted)
Dividend (`) 12.25
V. Generic Names of Three Principal Products/Services of Company (as per monetary terms) :
Item Code No. (ITC Code) 72.08
Product Description Hot Rolled Steel Strips/ Sheets/ Plates
Item Code No. (ITC Code)
Product Description MS Cold Rolled Coils/ Sheets
Item Code No. (ITC Code) 72.1
Product Description MS Galvanised Plain/ Corrugated/ Colour coated Coils/ Sheet
Item Code No. (ITC Code)
Product Description Steel Billet
Item Code No. (ITC Code)
Product Description Bar & Rods
Item Code No. (ITC Code)
Product Description Power

87
Annual Report 2010-11
Auditor’s Report on the Consolidated Financial Statement
To The Board of DirectorsJSW Steel Limited
1. We have audited the attached group Consolidated Balance Sheet of JSW Steel Limited (the Company) as at 31 March 2011, the group
Cash Flow Statement for the year ended on that date annexed
audit.
2. We conducted our audit in accordance with the auditing standards generally accepted in India. Those Standards require that we plan
namely:
` 5,543.34 crores
of ` 677.78 crores for the year ended on that date and net ` 142.96 crores for the year ended
` 58.39 crores for the year
other auditors.
Without qualifying our opinion, attention is invited to the following matters of emphasis included in the report of the other auditor of one of the Company’s associates namely, Ispat Industries Limited.:
` 255.61 crores, which are overdue from Peddar Realty Private Limited towards sale consideration of landed property along with interest thereon and have
view of the market value of the underlying assets of the
` 315.99 crores which have
` 118.69 crores relating to a party towards raw material supplies: The management does not expect any material impact on the
completion of the reconciliation.
Metallurgical Coke’ valuing ̀ 104.83 crores, lying overseas with a stevedoring agent since March 2010 for onward
share of total assets of ` 154.86 crores as at 31 March 2011, ` 123.36 crores for
` 0.64 crores for the year ended on that date and associates whose
` 12.34 crores
fair view in conformity with the accounting principles generally accepted in India:
i) in the case of the Consolidated Balance Sheet, of the state of affairs of the group as at 31 March 2011;
and
iii) in the case of the Consolidated Cash Flow Statement, of ate.
For Deloitte Haskins & Sells
Registration No. 117366W
P. B. PardiwallaPartner
Date: 16 May 2011

88
JSW Steel Limited
Consolidated Balance Sheet as at 31st March, 2011` in crores
ScheduleNo.
As at31.03.2011 31.03.2010
SOURCES OF FUNDS Shareholders’ Funds:
Share Capital 1 563.18 527.11Share Warrants (refer Note C-3 of Schedule 18) 529.38 – Reserves and Surplus 2 15,436.77 8,730.04
16,529.33 9,257.15
Minority Interest 235.83 218.65 Loan Funds:
Secured Loans 3 12,172.76 13,454.07Unsecured Loans 4 4,301.60 2,718.97
16,474.36 16,173.04
Deferred Tax Liability (refer Note C-13(b) of Schedule 18) 2,325.63 1,964.95 Total 35,565.15 27,613.79
APPLICATION OF FUNDS Fixed Assets: 5
32,683.89 26,792.05 Less: Depreciation 6,873.23 5,339.26 Net Block 25,810.66 21,452.79
6,507.68 6,956.18 32,318.34 28,408.97
Goodwill on Consolidation 1,093.20 899.19
Investments 6 2,913.83 628.20
Deferred Tax Asset (refer Note C-13(b) of Schedule 18) 276.23 280.17
Current Assets, Loans and Advances: 17.11 –
Inventories 7 4,409.70 2,866.748 933.30 696.39
Cash and Bank Balances 9 2,048.00 303.0410 2,156.82 1,603.79
9,564.93 5,469.96 Less: Current Liabilities and Provisions:
11 10,201.93 7,807.83Provisions 12 399.45 264.87
10,601.38 8,072.70 Net Current Assets/(Liabilities) (1,036.45) (2,602.74)
Total 35,565.15 27,613.79
18
For DELOITTE HASKINS & SELLS
SAJJAN JINDAL
P. B. PARDIWALLA LANCY VARGHESE RAJEEV PAI SESHAGIRI RAO M.V.S.
Dated: 16 May 2011

89
Annual Report 2010-11
` in crores Schedule
No For the Year
ended31.03.2011
For the Year ended
31.03.2010 INCOME: Domestic Turnover 22,190.88 17,202.35 Export Turnover 3,617.30 2,948.77 Contract Revenue 20.95 –
38.67 60.21 25,867.80 20,211.33
Less: Excise duty 1,967.56 1,254.16 Net Turnover 23,900.24 18,957.17
13 284.03 532.16 Total income 24,184.27 19,489.33
EXPENDITURE: Materials 14 14,685.05 11,231.24 Cost of Construction 20.21 –
15 636.75 479.5416 3,895.49 3,175.72
Net Finance Charges 17 945.41 1,104.17 Depreciation and amortisation 1,559.71 1,298.66
21,742.62 17,289.33
2,441.65 2,200.00 Provision for Taxation (refer Note C13 (a) of Schedule 18) 782.27 646.71
1,659.38 1,553.29 Share of Losses of Minority (23.87) (33.21)
70.73 11.05 1,753.98 1,597.55 4,695.46 3,676.02 6,449.44 5,273.57
Appropriations: – (125.00)
Transfer to Capital Redemption Reserve – (9.90) Dividend on Preference Shares (27.90) (28.92) Proposed Final Dividend on Equity Shares (273.32) (177.70) Corporate Dividend Tax (48.87) (34.31)
(4,200.00) (202.28) Balance carried to Balance Sheet 1,899.35 4,695.46 Earnings per share (Equity shares, par value of ` 10 each) (in `) Basic 84.56 83.61 Diluted 83.83 83.29 (refer Note C-12 of Schedule 18)
Notes forming part of the Financial Statements 18
For DELOITTE HASKINS & SELLS
SAJJAN JINDAL
P. B. PARDIWALLA LANCY VARGHESE RAJEEV PAI SESHAGIRI RAO M.V.S.
Dated: 16 May 2011

90
JSW Steel Limited
Cash Flow Statement for the year ended 31st March, 2011` in crores
For the Year Ended 31.03.2011
For the Year Ended 31.03.2010
A. CASH FLOW FROM OPERATING ACTIVITIESNET PROFIT BEFORE TAX 2,441.65 2,200.00 Adjustments for:
1,559.71 1,298.66 1.21 (3.76)
Income from current investments (32.29) (3.84)Interest Income (79.24) (6.90)Dividend Income (5.88) (0.03)Interest Expenses 732.47 836.11
(54.43) (47.81) 7.62 4.02
2,129.18 2,076.45 4,570.83 4,276.45
Adjustments for: (1,542.96) 57.82 (2,210.57) (425.01)
2,439.86 (103.77) (1,313.67) (470.96)
3,257.16 3,805.49 Direct Taxes Paid (426.92) (459.35)NET CASH GENERATED FROM OPERATING ACTIVITIES 2,830.24 3,346.14
B. CASH FLOW FROM INVESTING ACTIVITIES (5,314.39) (2,753.66) (2,156.03) (9.53)
Purchase of other Long Term Investments (2.50) – (203.73) – (24.08) (207.18)
15.02 11.90 – 17.24
Interest received 46.69 8.93 Dividend received 5.88 0.03 NET CASH USED IN INVESTING ACTIVITIES (7,633.14) (2,932.27)
C. CASH FLOW FROM FINANCING ACTIVITIES 5,935.62 –
Repayment of Preference Share Capital – (9.90)Proceeds from Long Term Borrowings 4,498.30 1,931.46 Repayment of Long Term Borrowings (5,140.65) (809.20)
1,043.19 (483.03)Interest Paid (1,000.65) (1,133.34)Dividend Paid (239.74) (57.00)NET CASH GENERATED/ (USED IN) FROM FINANCING ACTIVITIES 5,096.06 (561.01)NET INCREASE/(DECREASE) IN CASH AND CASH EQUIVALENTS (A+B+C) 293.16 (147.14)CASH AND CASH EQUIVALENTS - OPENING BALANCE 279.73 426.87 CASH AND CASH EQUIVALENTS - CLOSING BALANCE 572.89 279.73
1,459.77 5.72 18.07 17.59 (2.73) –
CASH AND BANK BALANCE (As per Schedule 9) 2,048.00 303.04 NOTE:Cash and cash equivalents include effect of exchange rate changes in
* 0.13 ` 1,00,000
For DELOITTE HASKINS & SELLS
SAJJAN JINDAL
P. B. PARDIWALLA LANCY VARGHESE RAJEEV PAI SESHAGIRI RAO M.V.S.
Dated: 16 May 2011
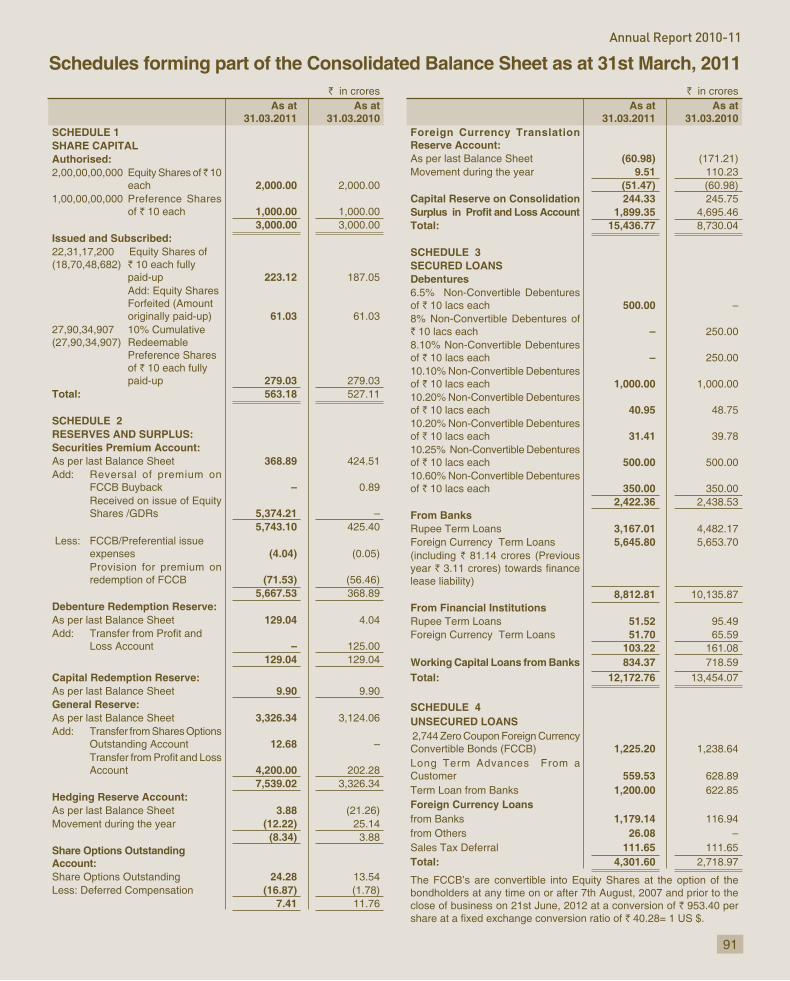
91
Annual Report 2010-11
Schedules forming part of the Consolidated Balance Sheet as at 31st March, 2011` in crores
As at 31.03.2011
As at 31.03.2010
SCHEDULE 1SHARE CAPITALAuthorised:2,00,00,00,000 Equity Shares of ̀ 10
each 2,000.00 2,000.00 1,00,00,00,000 Preference Shares
of ` 10 each 1,000.00 1,000.00 3,000.00 3,000.00
Issued and Subscribed: 22,31,17,200 Equity Shares of (18,70,48,682) ` 10 each fully
paid-up 223.12 187.05
originally paid-up) 61.03 61.03 27,90,34,907 10% Cumulative
Preference Shares of ` 10 each fully paid-up 279.03 279.03
Total: 563.18 527.11
SCHEDULE 2 RESERVES AND SURPLUS: Securities Premium Account:
368.89 424.51
– 0.89 Received on issue of Equity
5,374.21 –5,743.10 425.40
expenses (4.04) (0.05)Provision for premium on redemption of FCCB (71.53) (56.46)
5,667.53 368.89Debenture Redemption Reserve:
129.04 4.04
– 125.00 129.04 129.04
Capital Redemption Reserve: 9.90 9.90
General Reserve: 3,326.34 3,124.06
12.68 –
4,200.00 202.28 7,539.02 3,326.34
Hedging Reserve Account: 3.88 (21.26)
Movement during the year (12.22) 25.14 (8.34) 3.88
Share Options Outstanding Account:
24.28 13.54 Less: Deferred Compensation (16.87) (1.78)
7.41 11.76
` in crores As at
31.03.2011 As at
31.03.2010 Foreign Currency Translation Reserve Account:
(60.98) (171.21)Movement during the year 9.51 110.23
(51.47) (60.98)Capital Reserve on Consolidation 244.33 245.75
1,899.35 4,695.46Total: 15,436.77 8,730.04
SCHEDULE 3 SECURED LOANS Debentures
of ` 10 lacs each 500.00 –
` 10 lacs each – 250.00
of ` 10 lacs each – 250.00
of ` 10 lacs each 1,000.00 1,000.00
of ` 10 lacs each 40.95 48.75
of ` 10 lacs each 31.41 39.78
of ` 10 lacs each 500.00 500.00
of ` 10 lacs each 350.00 350.00 2,422.36 2,438.53
From Banks Rupee Term Loans 3,167.01 4,482.17 Foreign Currency Term Loans 5,645.80 5,653.70 (including ` 81.14 crores (Previous year `
8,812.81 10,135.87From Financial Institutions Rupee Term Loans 51.52 95.49 Foreign Currency Term Loans 51.70 65.59
103.22 161.08Working Capital Loans from Banks 834.37 718.59 Total: 12,172.76 13,454.07
SCHEDULE 4 UNSECURED LOANS 2,744 Zero Coupon Foreign Currency
1,225.20 1,238.64
Customer 559.53 628.89 Term Loan from Banks 1,200.00 622.85 Foreign Currency Loansfrom Banks 1,179.14 116.94
26.08 – Sales Tax Deferral 111.65 111.65 Total: 4,301.60 2,718.97
` 953.40 per ` 40.28= 1 US $.

92
JSW Steel Limited
` in crores As at
31.03.2011 As at
31.03.2010
SCHEDULE 7
INVENTORIES
Raw Materials 1,943.82 1,287.76
and Spares 659.69 474.63
Work-in-Progress 280.38 142.42
1,480.36 961.80
40.88 0.13
Construction Material 4.57 –
Total: 4,409.70 2,866.74
Note:B(7) of Schedule 18.
SCHEDULE 8
SUNDRY DEBTORS (net of provision) 933.30 696.39
Note:
3.70 –
- Unsecured 929.60 696.39
23.27 27.42
(23.27) (27.42)
SCHEDULE 5FIXED ASSETS
` in croresParticulars Gross Block (at cost) Depreciation and amortisation Net Block
As at 01.04.2010
Additions Deductions TranslationAdjustment
As at 31.03.2011
As at 01.04.2010
For the year
Deductions TranslationAdjustment
As at 31.03.2011
As at 31.03.2011
As at 31.03.2010
TangiblesFreehold Land 197.65 8.07 – (0.09) 205.63 18.48 0.33 – – 18.81 186.82 179.17Leasehold Land 154.64 0.20 2.55 (0.01) 152.28 1.94 0.79 – – 2.73 149.55 152.70Buildings 4,068.50 623.63 0.26 (4.40) 4,687.47 524.39 138.48 0.03 (0.97) 661.87 4,025.60 3,544.11Plant & Machinery@ (refer note C-9 of Schedule 18)
21,851.83 5,187.13 31.48 (38.00) 26,969.48 4,714.13 1,393.17 21.62 (4.79) 6,080.89 20,888.59 17,137.70
Furniture & Fixtures 84.08 13.91 0.07 0.22 98.14 33.94 10.46 0.05 0.03 44.38 53.76 50.14Vehicles & Aircrafts 164.48 10.68 6.05 (0.01) 169.10 29.85 11.55 2.48 (0.02) 38.90 130.20 134.63IntangiblesSoftware 32.22 4.76 – 4.36 41.34 16.53 6.44 – – 22.97 18.37 15.69Mining Concessions 237.67 123.88 – (2.19) 359.36 – 2.74 – (0.06) 2.68 356.68 237.67Port Concessions 0.98 0.13 – (0.02) 1.09 – – – – – 1.09 0.98Total: 26,792.05 5,972.39 40.41 (40.14) 32,683.89 5,339.26 1,563.96 24.18 (5.81) 6,873.23 25,810.66 21,452.79 Previous Year 22,388.91 5,024.45 13.30 (608.01) 26,792.05 4,079.75 1,301.56 5.15 (36.90) 5,339.26 21,452.79
Notes:
(1) ‘Buildings’ include:
` 3.13 crores (previous year `
` 3.08 crores (previous year ` 3.08 crores); ` 2.52 crores (previous year ` 2.57 crores).
(c) Execution of Conveyence deed in favour of the Company
is pending in respect of a Building acquired in an earlier ` ` 21.75 crores
` ` 22.28 crores)
(2) Fixed assets include Borrowing costs of ` 289.36 crores (previous year ` 259.32 crores) capitalised during the year.
(3) Freehold Land and Buildings of ` 147.60 crores (previous year `lenders of group companies.
` 89.07 crores ` 332.90 crores) capitalised during the year.
` in croresAs at
31.03.2011 As at
31.03.2010
SCHEDULE 6
INVESTMENTS
(Unquoted)
1. LONG TERM
a) In Associates
Cost of Investments in equity shares (refer note
2,196.53 39.53
135.06 68.17
Preference Shares 36.51 2,368.10 40.67 148.37
b) In Joint Ventures
Equity Shares 15.41 8.91
Preference Shares 4.20 19.61 3.67 12.58
c) Others
Equity Shares 125.97 125.97
Preference Shares 130.00 127.50
0.01 255.98 0.01 253.48
2. CURRENT
Mutual Funds 270.14 213.77
Total: 2,913.83 628.20
` 2,295.34 crores (previous year ` 0.15crore)

93
Annual Report 2010-11
` in crores As at
31.03.2011 As at
31.03.2010
SCHEDULE 9
CASH AND BANK BALANCES
Cash on hand 0.57 0.39
Balances with Scheduled Banks:
278.97 131.93
1,768.46 170.72
Total: 2,048.00 303.04
SCHEDULE 10
LOANS AND ADVANCES
(Unsecured, considered good unless otherwise stated)
Advances recoverable in cash or in kind or for value to be received
266.90 290.41
Export duty refund on exports 129.37 83.23
Trusts 83.82 45.06
112.34 122.16
Preference capital 3.64 13.27
801.85 446.74
(61.15) (8.91)
1,336.77 991.96
Excise Balances 260.90 103.79
source (net) 0.70 153.34
entitlement 558.45 354.70
Loans to Bodies Corporate 9.10 9.10
(9.10) (9.10)
Total: 2,156.82 1,603.79
` in crores As at
31.03.2011 As at
31.03.2010
SCHEDULE 11
CURRENT LIABILITIES
6,826.26 5,049.79
Sundry Creditors 2,487.43 1,706.28
Rent and other deposits 36.31 52.15
180.12 182.09
128.35 144.37
150.07 387.35
FCCBs 375.31 268.21
Investor Education and Protection
Redemption Installments 1.67 2.11
1.30 1.88
Unpaid Dividend 11.39 9.78
Unclaimed amount of sale proceeds of fractional shares 3.72 3.82
Total: 10,201.93 7,807.83
SCHEDULE 12
PROVISIONS
Provision for:
Income Tax (net) 9.67 –
39.69 25.13
Proposed Dividend on Preference Shares 27.90 27.90
Proposed Dividend on Equity Shares 273.32 177.70
Corporate Dividend Tax 48.87 34.14
Total: 399.45 264.87

94
JSW Steel Limited
for the year ended 31st March, 2011
` in crores As at
31.03.2011 As at
31.03.2010
SCHEDULE 13
OTHER INCOME
Dividend from Long Term Investments 5.88 0.03
62.30 407.79
– 3.76
174.48 91.53
of FCCB’s – 3.98
Miscellaneous Income 41.37 25.07
Total: 284.03 532.16
SCHEDULE 14
MATERIALS
Raw Materials Consumed 15,094.46 11,183.68
223.97 29.61
Increase in Stocks
960.99 922.27
Work-in-progress 142.42 151.27
0.13 12.93
1,103.54 1,086.47
Closing Stock:
1,480.09 960.99
Work-in-progress 280.38 142.42
40.88 0.13
1,801.35 1,103.54
(697.81) (17.07)
Excise duty on Stock of finished goods (net) 64.43 35.02
Total: 14,685.05 11,231.24
SCHEDULE 15
EMPLOYEES' REMUNERATION AND BENEFITS
Salaries, Wages and Bonus 565.37 428.74
Funds 28.56 17.34
Staff Welfare Expenses 42.82 33.46
Total: 636.75 479.54
` in crores As at
31.03.2011 As at
31.03.2010
SCHEDULE 16
MANUFACTURING AND OTHER EXPENSES
Rent 13.02 11.99
Rates and Taxes 20.03 14.73
Insurance 56.15 38.51
Power and Fuel 1,206.71 1,038.63
Stores and Spares consumed 1,072.58 942.60
Carriage and Freight 646.60 569.10
Repairs and Maintenance
Plant and Machinery 418.27 264.51
Buildings 44.87 40.04
9.04 10.20
20.18 16.39
Commission on Sales 51.49 59.85
2.93 3.60
53.09 13.70
investments (net) 1.21 –
Miscellaneous Expenses 279.32 151.87
Total: 3,895.49 3,175.72
SCHEDULE 17
NET FINANCE CHARGES
Interest on:
745.15 851.27
193.28 153.88
118.51 109.76
1,056.94 1,114.91
Less: Interest Income
from Banks (63.35) (1.02)
(15.89) (5.88)
(79.24) (6.90)
investments (32.29) –
Dividend Income on currentinvestments – (3.84)
(32.29) (3.84)
Total: 945.41 1,104.17

95
Annual Report 2010-11
SCHEDULE 18
SIGNIFICANT ACCOUNTING POLICIES AND NOTES FORMING PART OF THE CONSOLIDATED FINANCIAL STATEMENTS
A. BACKGROUND
The Consolidated Financial Statements of the group – JSW Steel Limited (‘JSW’ or ‘the Company’) the parent Company and all its
incorporated on March 15, 1994.
The following components are included in the Consolidation:
Subsidiary Companies:
Name of the Company
Country of incorporation
Share holding at year end
either directly or through
subsidiaries
Nature of operations
(commenced / planned)
JSW Steel (Netherlands)
Netherlands 100%(100%) investment in steel
related and steel
and trading in steel products
JSW Steel United 100%(100%)
Investment in steel related and steel
IndependentSteel (Holdings) Limited
United 100%(100%)
Holding Company of JSW Steel Service Centre
JSW Steel Service Centre
United 100%(100%)
Steel Service Centre
JSW Steel
Inc.
United States 100%(100%)
Holding Company
Inc. and Periama Holdings, LLC
Inc.United States 90%
(90%)ManufacturingPlates, Pipes and
PeriamaHoldings, LLC(w.e.f. May 3, 2010)
United States 100%(–)
Mining Company
Purest Energy, LLC (w.e.f. May 3, 2010)
United States 100%(–)
Mining Company
Meadow Creek Minerals, LLC(w.e.f. May 3, 2010)
United States 100%(–)
Mining Company
HutchinsonMinerals, LLC(w.e.f. May 3, 2010)
United States 100%(–)
Mining Company
R.C. Minerals, LLC (w.e.f. May 3, 2010)
United States 100%(–)
Mining Company
Minerals, LLC(w.e.f. May 3, 2010)
United States 100%(–)
Mining Company
Peace Leasing, LLC (w.e.f. May 3, 2010)
United States 100%(–)
Mining Company
Name of the Company
Country of incorporation
Share holding at year end
either directly or through
subsidiaries
Nature of operations
(commenced / planned)
Prime Coal, LLC (w.e.f. May 3, 2010)
United States 100%(–)
Mining Company
Planck Holdings, LLC (w.e.f. May 3, 2010)
United States 100%(–)
Mining Company
Rolling S
(w.e.f. May 3, 2010)
United States 100%(–)
Mining Company
PeriamaHandling, LLC(w.e.f. May 3, 2010)
United States 100%(–)
Mining Company
LowerHutchinsonMinerals, LLC(w.e.f. May 3, 2010)
United States 100%(–)
Mining Company
CarettaMinerals, LLC(w.e.f. May 3, 2010)
United States 100%(–)
Mining Company
JSW Panama HoldingsCorporation
Panama100%
(100%)Holding Company
Companies and
InversionesEroush Limitada
Chile 100%(100%)
Holding Company (LLP) of Santa Fe Mining
Santa Fe Mining Chile 70%(70%)
Mining Company
Santa Fe Puerto Chile 70%(70%)
Port Company
JSW Natural ResourcesLimited
Mauritius100%
(100%)Holding Company of JSW Natural Resources
JSW Natural Resources
Limitada
100%(100%)
Mining Company
Carvo Lda
8, 2010)
85%(–)
Mining Company
JSW Steel ProcessingCentres Limited
India 100%(100%)
Steel Service Center
JSW Bengal Steel Limited
India 96.74%(99.20%)
Steel plant
JSW Natural Resources India Limited
India 100%(100%)
Steel Plant
CompanyLimited
India 100%(100%)
JSW Jharkhand Steel Limited
India 100%(100%)
Steel Plant and Mining
JSW Building Systems Limited
India 100%(100%)
and technologies
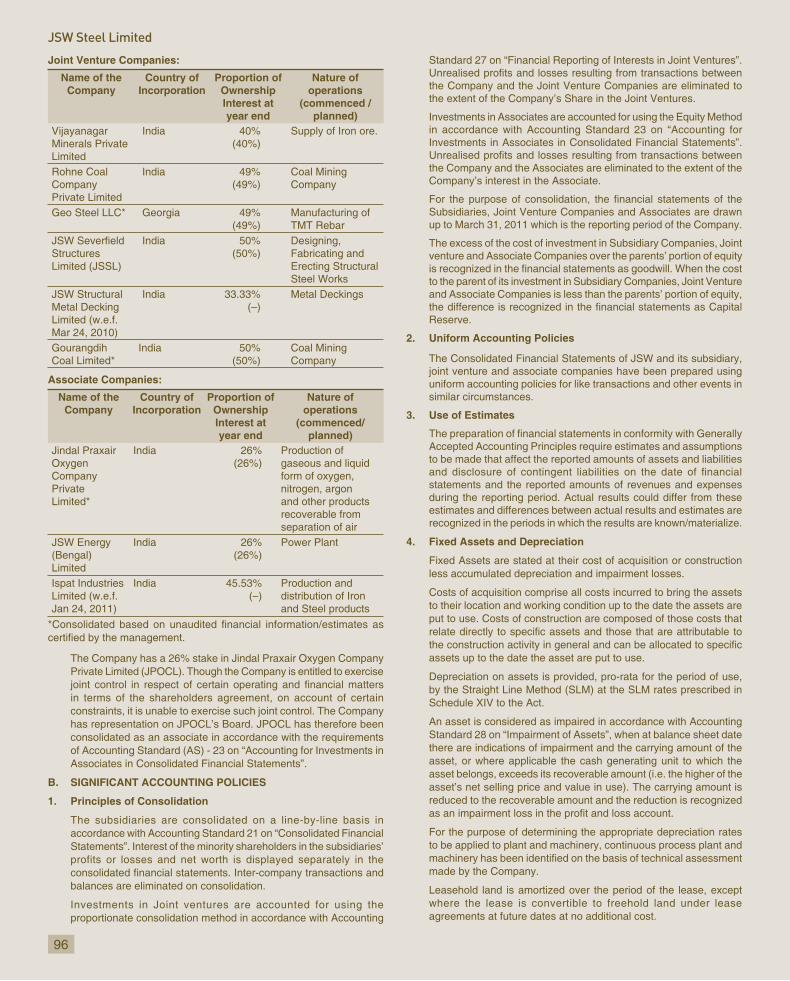
96
JSW Steel Limited
Joint Venture Companies:
Name of the Company
Country of Incorporation
Proportion of OwnershipInterest at year end
Nature of operations
(commenced / planned)
Minerals Private Limited
India 40%(40%)
Supply of Iron ore.
Rohne Coal CompanyPrivate Limited
India 49%(49%)
Coal Mining Company
49%(49%)
Manufacturing of
StructuresLimited (JSSL)
India 50%(50%)
Designing,
Erecting Structural Steel Works
JSW Structural Metal Decking Limited (w.e.f. Mar 24, 2010)
India 33.33%(–)
Metal Deckings
Coal Limited*India 50%
(50%)Coal Mining Company
Associate Companies:
Name of the Company
Country of Incorporation
Proportion of OwnershipInterest at year end
Nature of operations
(commenced/planned)
Jindal Praxair
CompanyPrivateLimited*
India 26%(26%)
Production of gaseous and liquid form of oxygen, nitrogen, argon and other products
separation of airJSW Energy (Bengal)Limited
India 26%(26%)
Power Plant
Ispat Industries Limited (w.e.f. Jan 24, 2011)
India 45.53%(–)
Production and
and Steel products
in terms of the shareholders agreement, on account of certain
consolidated as an associate in accordance with the requirements
B. SIGNIFICANT ACCOUNTING POLICIES
1. Principles of Consolidation
profits or losses and net worth is displayed separately in the
Investments in Joint ventures are accounted for using the
up to March 31, 2011 which is the reporting period of the Company.
Reserve.
2. Uniform Accounting Policies
uniform accounting policies for like transactions and other events in similar circumstances.
3. Use of Estimates
statements and the reported amounts of revenues and expenses
4. Fixed Assets and Depreciation
less accumulated depreciation and impairment losses.
to their location and working condition up to the date the assets are put to use. Costs of construction are composed of those costs that
assets up to the date the asset are put to use.
Depreciation on assets is provided, pro-rata for the period of use,
there are indications of impairment and the carrying amount of the
asset’s net selling price and value in use). The carrying amount is
For the purpose of determining the appropriate depreciation rates
Leasehold land is amortized over the period of the lease, except
agreements at future dates at no additional cost.

97
Annual Report 2010-11
that the software has an enduring useful life. Software is depreciated over an estimated useful life of 3 to 5 years.
acquisition of mining concessions and all costs incurred till mining reserves are proved, such as license fees, direct exploration costs
these costs to remain capitalized;
capitalized expenditure for commercial exploration of the reserves, and
B. Further exploration and development activity is underway or
5. Investments
reduction in the carrying amount and any reversals of such reductions
Long term investments are stated at cost. Provision for diminution is made to recognize a decline, other than temporary, in the value of such investments.
6. Revenue Recognition
Revenue is recognized when it is earned and no significant uncertainty exists as to its realization or collection.
Revenue from sale of goods is recognized on delivery of the products,
and rewards of ownership are transferred to the customers and no
duty recovered is presented as a reduction from gross turnover.
income on sale of CER’s.
Contract costs are recognized as expenses in the period in which they
contract and costs that relate to the contract activity in general and
work, claims and incentive payments are included in revenue to the
revenue and related cost as contract activity progresses. When it is
cost as contract activity progresses.
7. Inventories
value. Cost of inventories comprise all costs of purchase, costs of
average cost method.
(Schedule 14).
8. Borrowing Costs
Interest income earned is disclosed separately, and reduced from Net Finance charges (Schedule 17).
such as provident and other funds, which fall due for payment within a period of twelve months after rendering service, are charged as
service is rendered.
of twelve months from rendering service or after completion of
10. Foreign Currency Transactions
Foreign currency transactions are recorded at the exchange rates prevailing on the date of the transaction.
Exchange differences relating to long term monetary items are dealt with in the following manner:
i. Exchange differences relating to long-term monetary items, arising during the year, in so far as they relate to the acquisition
asset.
of the long term monetary item, however that the period of
account.
Non-monetary items such as investments are carried at historical cost using the exchange rates on the date of the transaction.
non-integral foreign operations, for incorporation in the consolidated
monetary, are translated at the closing rate, the income and expense
and all resulting exchange differences are accumulated in a foreign currency translation reserve until the disposal of the net investment.
11. Derivative Instruments and Hedge Accounting
foreign exchange forward contracts, interest rate swaps and currency

98
JSW Steel Limited
options to manage its exposure to interest rate and foreign exchange risks.
Derivatives are initially recognized at fair value at the date a derivative
The Company designates certain derivatives as either hedges of
does not enter into derivative contracts for trading or speculative purposes.
Changes in the fair value of derivatives that are designated and
immediately, together with any changes in the fair value of the hedged
value of the hedging instrument and the change in the hedged item
Changes in the fair value of derivatives that are designated and
account in the periods when the hedged item is recognized in the
Hedge accounting is discontinued when the Company revokes the hedging relationship, the hedging instrument expires or is sold,
that time is retained and is recognized when the forecast transaction
forecast transaction is no longer expected to occur, the cumulative
and loss account.
12. Income Tax
Where certain expenses or credits which are otherwise required to
for tax purpose is also recognized in the reserves.
13. Earnings Per Share
dilutive potential equity shares, except where the results are anti-dilutive.
14. Leases
the lease term.
15. Cash Flow Statement
Company.
Cash and Cash equivalents presented in the Cash Flow Statement
16. Securities’ Expenses
Expenses on issue of securities are written off to the Securities
providing for premium on redemption in accordance with Section
the redemption premium is reverzed.
17. Stock Based Compensation
The compensation cost of stock options granted to employees is calculated using the intrinsic value of the stock options. The compensation expense is amortised uniformly over the vesting period of the option.
18. Contingent liabilities
C. NOTES TO ACCOUNTS:
1. Contingent Liabilities not provided for in respect of:
a) Bills Discounted ` 2,792.87 crores (Previous year ` 1,275.88 crores).
` 87.12 crores (Previous year ` 164.85 crores).
courts (excluding interest, if any), in respect of:

99
Annual Report 2010-11
(i) Excise Duty ̀ 181.58 crores (Previous year ̀ 96.67 crores);
(ii) Custom Duty ` 243.01 crores (Previous year ` 108.07 crores);
(iii) Income Tax ̀ 14.23 crores (Previous year ̀ 12.47 crores);
` 73.10 crores (Previous year ` 0.35 crores);
(v) Service Tax ̀ 45.18 crores (Previous year ̀ 24.46 crores);
(vi) Miscellaneous ̀ 0.05 crores (Previous year ̀ 0.05 crores); and
` 3.04 crores (Previous year ` 3.04 crore).
` 215.24 crores (Previous year ` 7.10 crores).
Preference Shares ` 363.06 crores (Previous year nil).
2.account and not provided for (net of advances) ` 3,997.60 crores (Previous year ` 3,691.52 crores).
3.
4.mining of iron ore and coal which presently are at different stages of prospecting and exploration ranging from precursor activities to
exploitation) and other related activities to develop the property after
of proved reserves have not yet commenced, other than nominal
` 1,089.59 crores (Previous year `concessions) include ̀ 360.45 crores (Previous year ̀ 242.89 crores)
stage. (Refer Note B (4)).
5. Derivatives:
a) The Company uses foreign currency forward contracts to hedge
transactions. The use of foreign currency forward contracts is
Directors, which provide principles on the use of such forward contracts consistent with the Company’s Risk Management Policy.
outstanding are as under:
As at No. of Contracts
Type US$ Equivalent INR Equivalent (crores)(Million)
31.03.2011 86 Buy 314.01 1,402.04
22 Sell 119.95 535.58
31.03.2010 47 Buy 121.29 547.50
35 Sell 90.24 407.35
contracts to hedge the interest rate and currency risk on capital
on the use of these instruments, consistent with the Company’s Risk Management Policy. The Company does not use these contracts for speculative purposes.
Notional value of Interest Rate Swaps (IRS) to hedge against
As at No. of Contracts
US$ equivalent of notional value (Million)
MTM of IRS (INR crores)
31.03.2011 4 54.50 (5.33)31.03.2010 2 10.00 (0.24)
c)
Current Year Previous YearUS$
equivalent(Million)
INRequivalent
(crores)
US$equivalent
(Million)
INRequivalent
(crores) 9.32 41.61 16.93 76.44
Balances with banks- in Fixed Deposit
10.01 44.68 0.01 0.03 0.03 0.12 0.29 1.32
– – 11.62 52.43
Current Year Previous YearUS$
equivalent(Million)
INREquivalent
(crores)
US$equivalent
(Million)
INREquivalent
(crores) 1,225.25 5,470.73 959.20 4,329.82
Creditors 88.74 396.21 106.35 480.09 1,000.42 4,466.85 824.43 3,403.72
Redemption
on FCCB’s 84.06 375.31 59.42 268.21 0.09 0.41 0.16 0.73
` 17.91 crores (Previous year ` 13.19 crores).
` in crores
CurrentYear
PreviousYear
a) Liability recognized in the Balance Sheet
37.23 31.39 Service Cost 3.84 3.92 Interest Cost 3.20 2.69
7.82 0.39(1.96) (1.17)
Closing Balance 50.14 37.22Less:
33.66 26.14

100
JSW Steel Limited
CurrentYear
PreviousYear
Expected Return on Plan assets less loss on investments
2.93 2.53
(0.46) 0.08
3.96 6.03
(1.94) (1.12)
Closing Balance 38.15 33.66
Amount recognized in Balance Sheet 11.99 3.56
b) Expenses during the year
Service cost 3.84 3.92
Interest cost 3.20 2.69
Expected Return on Plan assets (2.87) (2.53)
8.22 0.31
Transferred to preoperative expenses (0.81) –
Total 11.58 4.39
c) Actual Return on plan assets 2.47 2.61
d) Break up of Plan Assets :
(i) ICICI Prudential Life Insurance Co. Ltd.
Balanced Fund 3.18 2.96
1.18 1.11
3.82 5.11
(ii) HDFC Standard Life Insurance Co. Ltd.
Defensive Managed Fund 1.04 0.93
10.55 8.45
(iii) SBI Life Insurance Co. Ltd. – Cap 11.93 9.47
(iv) LIC of India – Insurer Managed Fund 6.45 5.63
CurrentYear
PreviousYear
e) Principal actuarial assumptionsRate of Discounting 8% to
8.5% p.a.8% p.a.
8% p.a. 8% p.a.Rate of increase in salaries 6% p.a. 6% p.a.
2% p.a. 2% p.a.
`the next year.
long term rate of return expected on investments of the fund during the
The estimates of future salary increase, considered in actuarial valuation,
such as supply and demand in the employment market.
Other disclosures:` in crores
Particulars Current Year 2009-10 2008-09 2007-08
50.14 37.22 31.39 25.4538.15 33.66 26.14 21.42
(11.99) (3.56) (5.25) (4.03)
7. Segment Reporting:
I) Information about Primary Business Segments` in crores
Particulars Current Year 31.03.2011 Previous Year 31.03.2010Steel Power Other Elimina-
tionsTotal Steel Power Elimina-
tionsTotal
INCOME:External Sales 23,763.12 105.34 31.78 23,900.24 18,832.40 1 24.77 – 18,957.17Inter Segment Sales 651.87 988.73 22.62 (1,663.22) – 4 90.97 8 43.41 25.02 (1,359.40) –Total Income 24,414.99 1,094.07 54.40 (1,663.22) 23,900.24 19,323.37 9 68.18 25.02 (1,359.40) 18,957.17SEGMENT RESULTS
3,211.99 344.26 (80.47) 3,475.78 2,957.58 389.84 0.98 3,348.40Un-allocated Items:Income 5.88 0.03Net Finance Charges (945.41) (1,104.17)Provision for Taxation (782.27) (646.71)
1,753.98 1,597.55OTHER INFORMATION
36,599.90 1,844.96 1,095.61 39,540.47 31,527.83 1,272.83 527.06 33,327.726,626.06 2,358.77
Total Assets 46,166.53 35,686.499,844.51 33.49 195.58 10,073.58 7,582.25 55.81 25.40 7,663.46
Provisions 19,327.79 18,547.23Total Liabilities 29,401.37 26,210.69Depreciation 1,516.65 37.71 5.35 1,559.71 1,263.94 34.67 0.05 1,298.66Total Cost incurred duringthe year to acquire Segment
3,996.51 1,174.26 353.12 5,523.89 2,344.04 17.96 33.45 2,395.45

101
Annual Report 2010-11
1. Inter Segment transfer from the power segment is measured at
Electricity Board.
2. Inter Segment transfer from the steel segment is measured on the
activities.
II) Information about Secondary Segment- Geographical Segment
` in crores
Year ended 31.03.2011 Year ended 31.03.2010Particulars India
entitiesForeignentities
Total Indiaentities
Foreignentities
Total
SegmentRevenue 23,121.72 778.52 23,900.24 18,089.65 867.52 18,957.17Segmentassets 40,352.99 5,813.54 46,166.53 29,365.65 6,320.84 35,686.49Capitalexpenditureincurred 5,377.22 146.67 5,523.89 2,332.75 62.70 2,395.458. Related parties disclosure as per Accounting Standard
(AS) – 18:
A) List of Related Parties:
Parties with whom the Company has entered into transactions during the year/where control exists :
1. Associates
JSW Energy (Bengal) Limited Ispat Industries Limited (w.e.f. 24.01.2011)
2. Joint Ventures
Rohne Coal Company Private Limited
MJSJ Coal Limited
3. Key Management Personnel
Mr. Y. Siva Sagar Rao (Upto 15.05.2009)
4. Relatives of Key Management PersonnelMrs. Savitri Devi Jindal
5. Enterprises over which Key Management Personnel and
JSW Energy Limited JSL Limited
Jindal Saw Limited
Jindal South West Holdings Limited
Jindal Industries LimitedJSW Energy (Ratnagiri) LimitedJSW Cement LimitedJSW Jaigarh Port Limited
JSW Investments Private LimitedReynold Traders Private Limited
JSW Power Trading Company Limited
South West Port Limited
Sapphire Technologies LimitedSt. James Investment Limited
Particulars Associates JointVentures
KeyManagement
Personnel
Relativesof Key
Management Personnel
Enterprisesover which KMP and relatives of such personnel
Total
B. Transactions with related partiesParty's NamePurchase of Goods/Power & Fuel/ServicesJSW Energy Limited – – – – 430.01 430.01
– – – – 572.76 572.76130.77 – – – – 130.77120.62 – – – – 120.62
Ispat Industries Limited 568.90 – – – – 568.90– – – – – –– 30.29 – – 151.74 182.03– 29.14 – – 107.23 136.37
Total 699.67 30.29 – – 581.75 1,311.71120.62 29.14 – – 679.99 829.75
Reimbursement of Expenses incurred on our behalf by Jindal South West Holdings Limited – – – – 0.13 0.13
– – – – – –

102
JSW Steel Limited
Particulars Associates JointVentures
KeyManagement
Personnel
Relativesof Key
Management Personnel
Enterprisesover which KMP and relatives of such personnel
Total
JSW Energy Limited – – – – – –– – – – 2.73 2.73– – – – – –– – – – 0.11 0.11
Total – – – – 0.13 0.13– – – – 2.84 2.84
Interest Expenses St. James Investment Limited – – – – 6.66 6.66
– – – – 8.64 8.64Total – – – – 6.66 6.66
– – – – 8.64 8.64Sales of Goods/Power & Fuel/ Other IncomeJSW Energy Limited – – – – 771.23 771.23
– – – – 727.38 727.38Jindal Industriers Limited – – – – 214.28 214.28
– – – – 202.38 202.38Ispat Industries Limited 325.85 – – – – 325.85
– – – – – –5.76 2.56 – – 313.67 321.993.95 0.35 – – 301.88 306.18
Total 331.61 2.56 – – 1,299.18 1,633.353.95 0.35 – – 1,231.64 1,235.94
Other IncomeJSW Investments Private Limited – – – – – –
– – – – 2.07 2.07– – – – 1.75 1.75– – – – 3.50 3.50
JSW Energy Limited – – – – 6.01 6.01– – – – 0.57 0.57
3.86 – – – – 3.860.01 – – – – 0.01
– 0.10 – – 0.61 0.71– 0.01 – – 0.60 0.61
Total 3.86 0.10 – – 8.37 12.330.01 0.01 – – 6.74 6.76
Purchase of Assets– – – – 250.01 250.01– – – – 48.89 48.89
Jindal Saw Limited – – – – 7.47 7.47– – – – 8.95 8.95
JSW Energy Limited – – – – 95.07 95.07– – – – – –– 3.05 – – 19.56 22.61– – – – 3.68 3.68
Total – 3.05 – – 372.11 375.16– – – – 61.52 61.52
Sale of Assets– – – – 0.07 0.07– – – – – –
JSW Investments Private Limited – – – – 0.16 0.16– – – – – –
JSW Energy (Ratnagiri) Limited – – – – – –– – – – 3.35 3.35
JSW Energy Limited – – – – 0.04 0.04– – – – 0.89 0.89– – – – – –– – – – 0.17 0.17
Total – – – – 0.27 0.27– – – – 4.41 4.41

103
Annual Report 2010-11
Particulars Associates JointVentures
KeyManagement
Personnel
Relativesof Key
Management Personnel
Enterprisesover which KMP and relatives of such personnel
Total
Donation Given – – – – 0.25 0.25– – – – 0.75 0.75
Total – – – – 0.25 0.25– – – – 0.75 0.75
Recovery of Expenses incurred by us on their behalf
JSW Energy Limited – – – – 1.50 1.50– – – – 1.53 1.53
Sapphire Technologies Limited – – – – 0.41 0.41– – – – – –
JSW Cement Limited – – – – 0.18 0.18– – – – 0.57 0.57
Jsoft Solutions Limited – – – – 0.12 0.12– – – – 0.69 0.69– 0.05 – – – 0.05– 0.31 – – 0.78 1.09
Total – 0.05 – – 2.21 2.26– 0.31 – – 3.57 3.88
Investments / Share Application Money given during the yearIspat Industries Limited 2,157.00 – – – – 2,157.00
– – – – – –
Limited – – – – – –– – – – 11.00 11.00– – – – 2.50 2.50
0.01 – – – – 0.01Total 2,157.00 – – – 2.50 2,159.50
0.01 – – – 11.00 11.01Lease and Other deposits given JSW Energy (Ratnagiri) Limited – – – – – –
– – – – 0.06 0.06JSW Jaigarh Port Limited – – – – – –
– – – – 3.50 3.50– – – – – –– 6.50 – – – 6.50
Jindal Saw Limited – – – – 2.50 2.50– – – – 2.50 2.50
JSW Realty and Infrastructure Private Limited – – – – – –– – – – 0.27 0.27
Total – – – – 2.50 2.50– 6.50 – – 6.33 12.83
Lease and Other deposits refundedJSW Power Trading Company Limited – – – – 20.00 20.00
– – – – – –Total – – – – 20.00 20.00
– – – – – –Share Application Money ReceivedSapphire Technologies Limited – – – – 529.38 529.38
– – – – – –Total – – – – 529.38 529.38
– – – – – –Proceeds of Redemption of Pref Shares
4.16 – – – – 4.16– – – – – –
Total 4.16 – – – – 4.16– – – – – –

104
JSW Steel Limited
Particulars Associates JointVentures
KeyManagement
Personnel
Relativesof Key
Management Personnel
Enterprisesover which KMP and relatives of such personnel
Total
RemunerationMrs. Savitri Devi Jindal – – – 0.08 – 0.08
– – – 0.08 – 0.08– – 20.80 – – 20.80– – 14.25 – – 14.25– – 3.26 – – 3.26– – 2.91 – – 2.91– – 2.35 – – 2.35– – 1.83 – – 1.83
Mr.Y Siva Sagar Rao – – – – – –– – 0.35 – – 0.35– – 2.00 – – 2.00– – 1.04 – – 1.04
Total – – 28.41 0.08 – 28.49– – 20.38 0.08 – 20.46
Guarantees and collaterals releasedRohne Coal Company Private Limited – 45.82 – – – 45.82
– – – – – –JSW Cement Limited – – – – 75.00 75.00
– – – – – –39.52 – – – – 39.52
– – – – – –Total 39.52 45.82 – – 75.00 160.34
– – – – – –C. Closing balance of related partiesTrade payables
11.69 – – – – 11.6910.38 – – – – 10.38
South West Port Limited – – – – 20.73 20.73– – – – 17.03 17.03
St . James Investment Limited – – – – 19.15 19.15– – – – 12.76 12.76– 7.50 – – – 7.50– 6.49 – – – 6.49– – – – 8.66 8.66– – – – – –– 0.35 – – 6.36 6.71– – – – 7.06 7.06
Total 11.69 7.85 – – 54.90 74.4410.38 6.49 – – 36.85 53.72
Notes Payable St. James Investment Limited – – – – 192.00 192.00
– – – – 194.10 194.10Total – – – – 192.00 192.00
– – – – 194.10 194.10Advance received from CustomersJindal Saw Limited – – – – – –
– – – – 0.22 0.22– – – – 6.49 6.49– – – – 1.27 1.27
JSW Energy (Ratnagiri) Limited – – – – 0.97 0.97– – – – – –
JSW Jaigarh Port Limited – – – – 0.83 0.83– – – – 0.04 0.04
Total – – – – 8.29 8.29– – – – 1.53 1.53

105
Annual Report 2010-11
Particulars Associates JointVentures
KeyManagement
Personnel
Relativesof Key
Management Personnel
Enterprisesover which KMP and relatives of such personnel
Total
Lease and Other deposit received3.83 – – – – 3.833.83 – – – – 3.83
JSW Energy Limited – – – – 6.49 6.49– – – – 6.49 6.49
JSW Energy (Ratnagiri) Limited – – – – 3.71 3.71– – – – 3.71 3.71
JSW Power Trading Company Limited – – – – – –– – – – 20.00 20.00– 6.50 – – – 6.50– 6.50 – – – 6.50
Jindal Saw Limited – – – – 5.00 5.00– – – – 2.50 2.50
JSW Jaigarh Port Limited – – – – 3.50 3.50– – – – 3.50 3.50– – – – – –– – – – 0.27 0.27
Total 3.83 6.50 – – 18.70 29.033.83 6.50 – – 36.47 46.80
Trade receivablesJSW Energy Limited – – – – 16.97 16.97
– – – – 69.80 69.80JSW Cement Limited – – – – 28.07 28.07
– – – – 18.84 18.84Ispat Industries Limited 210.67 – – – – 210.67
– – – – – –Jindal Power Trading Company Limited – – – – 56.64 56.64
– – – – 20.16 20.16– – – – 19.63 19.63– – – – 11.97 11.97
Total 210.67 – – – 121.31 331.98– – – – 120.77 120.77
Capital/Revenue Advances Given– – – – – –– – – – 13.66 13.66
Jindal Saw Limited – – – – – –– – – – 0.14 0.14
JSW Cement Limited – – – – – –– – – – 1.98 1.98
Total – – – – – –– – – – 15.78 15.78
Share Application Money– 2.42 – – – 2.42– 2.43 – – – 2.43
Limited – – – – – –– – – – 6.50 6.50
Rohne Coal Company Private Limited – 1.19 – – – 1.19– – – – – –– 0.02 – – – 0.02– – – – – –
Total – 3.63 – – – 3.63– 2.43 – – 6.50 8.93
Share Application Money ReceivedSapphire Technologies Limited – – – – 529.38 529.38
– – – – – –Total – – – – 529.38 529.38
– – – – – –

106
JSW Steel Limited
Particulars Associates JointVentures
KeyManagement
Personnel
Relativesof Key
Management Personnel
Enterprisesover which KMP and relatives of such personnel
Total
Other advances given– – – – – –– 1.36 – – – 1.36– – – – 0.17 0.17– – – – 0.42 0.42– 0.04 – – – 0.04– – – – – –– – – – – –– 0.04 – – – 0.04
Total – 0.04 – – 0.17 0.21– 1.40 – – 0.42 1.82
Investments held by the Company76.03 – – – – 76.0380.19 – – – – 80.19
JSW Energy Limited – – – – 120.90 120.90– – – – 120.90 120.90– – – – 130.00 130.00– – – – 127.50 127.50
Ispat Industries Limited 2,157.00 – – – – 2,157.00– – – – – –– 19.61 – – – 19.61– 8.17 – – – 8.17
Total 2,233.03 19.61 – – 250.90 2,503.5480.19 8.17 – – 248.40 336.76
Guarantees and collaterals provided by the Company on behalf:
– – – – – –39.52 – – – – 39.52
JSW Cement Limited – – – – – –– – – – 75.00 75.00
Rohne Coal Company Private Limited – – – – – –– 45.82 – – – 45.82
Total – – – – – –39.52 45.82 – – 75.00 160.34
9. Finance Lease
As Lessee:
i. The Company has acquired equipments for ` 87.09 crores
with last lease maturing in 2016. The amount of depreciation
` ` 83.51 crores.
ii. The Minimum Lease Payments as at March 31, 2011 and the present value as at March 31, 2011 of minimum lease payments
follows:(` in crores)
Particulars Minimum Lease Payments
Present Value of Minimum
Lease PaymentsAs at
31.03.11As at
31.03.10As at
31.03.11As at
31.03.1020.71 1.36 15.36 1.18
not later than 5 years 74.58 2.05 65.78 1.93– – – –
Total 94.75 3.41 81.14 3.11Less: Future Finance
Charges 13.61 0.30Present Value of Minimum Lease Payments 81.14 3.11 – –
10. Operating Lease
a) As Lessor:
i. The Company has entered into lease arrangements, for renting :
2,279 houses (admeasuring approximately 1,410,997 square feet) at the rate of `for a period of 180 months.
662 houses (admeasuring approximately 330,453 square feet) at the rate of `period of 36 to 60 months.
1 house at the rate of ` 0.72 lacs per annum, for a period of 11 months.
9 houses (admeasuring approximately 645.15 square feet) at the rate of `for a period of 60 months.
after the end of the lease term.
ii. Disclosure in respect of assets given on operating lease:
` in crores
Current Year Previous Year
170.76 154.89
18.04 13.31
Depreciation for the year 3.08 2.31

107
Annual Report 2010-11
b) As Lessee:
Lease Rentals charged to revenue for right to use following assets are:
` in crores
Particulars Current Year Previous Year
Plant and Machinery – 5.04
37.96 6.91
Total 37.96 11.95
The agreements are executed for a period of 11 to 60 months with
party giving a prior notice period of 1 to 3 months.
Future minimum lease rental payable under operating lease for each of the following Years as under:
` in crores
Particulars Current Year Previous YearNot later than one year – 0.13
– 0.01Total – 0.14
11.
` in crores
Acquisition
FUNDS EMPLOYED
Share Capital 65.98
Reserves and Surplus (26.96)
Secured Loans 221.75
104.58
APPLICATION OF FUNDS
Net Block (including Capital Work-in-Progress) 126.96
203.73
Inventories 1.63
Cash and Bank Balances 12.76
20.27
INCOME
Income 10.83
0.05
EXPENDITURE
Manufacturing and other Expenses 24.13
1.91
Depreciation 4.00
Net Finance Charges 6.43
LOSS FOR THE YEAR (25.59)
12. Earnings Per Share (EPS):
CurrentYear
PreviousYear
` in crs 1,753.98 1,597.55
Less: Dividend on preference shares (Including corporate dividend tax) ` in crs 32.43 33.73
` in crs 1,721.55 1,563.82
holders (Numerator)-Diluted ` in crs 1,721.55 1,563.82
equity shares for Basic EPS (denominator) (B) Nos. 203,595,864 187,048,682
equity shares for Diluted EPS (denominator) (C) Nos. 205,363,404 187,746,815
Earning per share – Basic ` 84.56 83.61
Earning per share – Diluted ` 83.83 83.29
Nominal value per share ` 10 10
13. a) Provision for Taxation includes:
` in crores
Current Year Previous Year
Income Tax:
Current Tax 576.14 487.97
Deferred Tax 396.79 418.16
Credit entitlement (203.75) (259.40)
12.59 (0.52)
Wealth Tax 0.50 0.50
Total 782.27 646.71
` in crores
Current Year Previous Year
Depreciation 2,426.51 2,066.88
(67.70) (63.22)
(39.83) (40.55)
(269.58) (278.33)
Deferred Tax Liability (net) 2,049.40 1,684.78

108
JSW Steel Limited
` in
cro
res
Nam
e of
the
Subs
idia
ryJS
W S
teel
(N
ethe
rland
s)
B.V.
JSW
Stee
l(U
K)Li
mite
d
Arge
ntIn
depe
nden
tSt
eel
(Hol
ding
s)Li
mite
d
JSW
Ste
el
Serv
ice
Cent
re(U
K)Li
mite
d
JSW
Stee
lHo
ldin
gs(U
SA)
Inc.
JSW
Ste
el
(USA
) Inc
.Pe
riam
aHo
ldin
gs LLC
Prim
eCo
alLL
C
Plan
ckHo
ldin
gs LLC
Rolli
ng S
Au
gerin
gLL
C
Peria
ma
Hand
ling
LLC
Care
ttaM
iner
als
LLC
Low
erHu
tchi
nson
M
iner
als
LLC
Mea
dow
Cree
kM
iner
als
LLC
Keen
anM
iner
als
LLC
Hutc
hins
onM
iner
als
LLC
A.Sh
are
Capi
tal
1,0
52.7
3 5
1.47
–
5
3.45
8
21.6
9 2
,098
.55
64.
07
0.4
7 5
7.72
1
9.70
1
7.87
3
61.8
7 7
.24
18.
14
2.4
0 2
2.80
B.
Rese
rves
(178
.60)
(3.2
7) 0
.26
1.8
7 (1
80.6
3) (6
66.9
7) 6
2.40
(6
.49)
(1.4
3) (0
.06)
(4.0
0) –
(0
.10)
(9.7
0) –
(0
.01)
C.To
tal L
iabi
litie
s 1
,019
.48
0.0
6 1
0.13
1
.30
2,0
20.1
8 3
,821
.02
431
.01
26.
30
91.
75
7.8
0 1
6.51
1
5.91
3
.87
21.
01
2.2
2 6
.11
D.To
tal A
sset
s 1
,893
.61
48.
26
10.
39
56.
62
2,66
1.24
5
,252
.60
557
.48
20.
28
148
.04
27.
44
30.
38
377
.78
11.
01
29.
45
4.6
2 2
8.90
E.
Inve
stm
ent i
nclu
ded
in to
tal
Asse
ts (E
xcep
t for
Inve
stm
ent
in S
ubsi
diai
res)
–
–
–
–
–
–
–
–
–
–
–
–
–
–
–
–
F.Tu
rnov
er –
–
–
0
.45
–
631
.02
–
–
–
–
–
–
–
10.
62
–
–
G. (4
7.49
) (1
.38)
–
15.
38
(73.
48)
(223
.25)
(7.7
1) (3
.59)
–
(0.0
3) (3
.99)
–
(0.1
0) (9
.60)
–
(0.0
1)H.
Prov
isio
n fo
r Tax
atio
n –
–
–
–
(2
3.45
) (7
6.00
) (8
.76)
–
–
–
–
–
–
–
–
–
I. (4
7.49
) (1
.38)
–
15.
38
(50.
03)
(147
.25)
1.0
5 (3
.59)
–
(0.0
3) (3
.99)
–
(0.1
0) (9
.60)
–
(0.0
1)J.
Prop
osed
Div
iden
d –
–
–
–
–
–
–
–
–
–
–
–
–
–
–
–
` in
cro
res
Nam
e of
the
Subs
idia
ryPe
ace
Leas
ing
LLC
R.C.
Min
eral
s LL
C
Pure
stEn
ergy
LL
C
JSW
Pana
ma
hold
ing
Corp
orat
ion
Inve
rsio
nes
Euro
shLi
mita
da
Sant
a FeM
inin
g
Sant
a FePu
erto
S.A.
JSW
Natu
ral
Reso
urce
sLt
d
JSW
Nat
ural
Re
sour
ces
Moz
ambi
que
Lda
JSW
ADM
S Ca
rvo
Lda
JSW
Ste
el
Proc
essi
ng
Cent
res
Lim
ited
JSW
Beng
alSt
eel
Lim
ited
Barb
il
Com
pany
Lim
ited
JSW
Natu
ral
Reas
ourc
es
Indi
aLi
mite
d
JSW
Jhar
khan
dSt
eel
Lim
ited
JSW
Build
ing
Syst
emLi
mite
d
A.Sh
are
Capi
tal
–
34.
50
55.
14
0.4
5 0
.20
8.7
8 0
.22
60.
97
26.
11
–
50.
00
198
.27
0.0
5 37
.58
19.
57
2.8
1 B.
Rese
rves
0.0
3 (0
.02)
–
12.
70
(7.1
7) (8
.73)
0.0
2 (0
.69)
(54.
38)
–
17.
78
(4.8
5) (0
.01)
(0.1
9) (0
.62)
(0.1
8)C.
Tota
l Lia
bilit
ies
0.0
2 6
.37
40.
98
0.0
1 3
28.6
7 33
3.55
0.6
7 5
.70
39.
85
5.8
6 1
05.1
9 2
9.63
–
4
.69
0.1
3 –
D.To
tal A
sset
s 0
.05
40.
85
96.
12
13.
16
321
.70
333.
60 0
.91
65.
98
11.
58
5.8
6 1
72.9
7 2
23.0
5 0
.04
42.0
8 1
9.08
2
.63
E.In
vest
men
t inc
lude
d in
tota
l As
sets
(Exc
ept f
or In
vest
men
t in
Sub
sidi
aire
s)
–
–
–
–
–
0.1
1 –
–
–
–
–
–
–
–
–
2
.60
F.Tu
rnov
er –
–
–
–
–
–
–
–
–
–
5
3.58
–
–
–
–
–
G.
0.0
3 (0
.02)
–
(0.4
3) (1
.37)
(2.0
0) 0
.04
(0.2
4) (5
1.26
) –
2
8.12
(1
.74)
–
(0.1
8) (0
.04)
(0.0
8)H.
Prov
isio
n fo
r Tax
atio
n –
–
–
–
–
–
–
–
–
–
9
.30
0.0
2 –
–
–
–
I.
0.0
3 (0
.02)
–
(0.4
3) (1
.37)
(2.0
0) 0
.04
(0.2
4) (5
1.26
) –
1
8.82
(1
.76)
–
(0.1
8) (0
.04)
(0.0
8)J.
Prop
osed
Div
iden
d –
–
–
–
–
–
–
–
–
–
–
–
–
–
–
–
14.
Info
rmat
ion
of
Su
bsi
dia
ries
as
req
uir
ed u
nd
er s
ecti
on
212
of
the
Co
mp
anie
s A
ct, 1
956
15.
Fo
r D
EL
OIT
TE
HA
SK
INS
& S
EL
LS
SA
JJA
N J
IND
AL
P. B
. PA
RD
IWA
LL
AL
AN
CY
VA
RG
HE
SE
RA
JEE
V P
AI
SE
SH
AG
IRI R
AO
M.V
.S.
Dat
ed: 1
6 M
ay 2
011

E-COMMUNICATION REGISTRATION FORM
To,
Unit: JSW Steel Limited
Green Initiative in Corporate Governance
Notes:
under the section ‘Shareholder’s information’.
is any change in the e-mail address.


NATIONAL ELECTRONIC CLEARING SERVICES (NECS)MANDATE FORM
To, To,JSW Steel Limited The Depository Participant concerned
(In case of physical holding)
DP ID* I NECSRef. No.
Bank Name
Branch Name
Branch code
Savings Current Cash Credit(Please Tick (
Place : _________________
Date: __________________ _________________________
Notes :
1. Whenever the Shares in the given folio are entirely dematerialised, then this NECS mandate form if given to the Company will stand rescinded.


ATTENDANCE SLIP
PROXY FORM
Regd. Folio No...................................... ** D.P. I.D.......................................
** Client I.D.....................................
SEVENTEENTH ANNUAL GENERAL MEETING - 25TH JULY, 2011
Seventeenth Annual General Meeting of the Company held on Monday, 25th July, 2011 at
Note :
* Strike out whichever is not applicable.
....................................................................................................Tear Here ................................................................................................
Regd. Folio No...................................... ** D.P. I.D.......................................
** Client I.D.....................................
SEVENTEENTH ANNUAL GENERAL MEETING - 25TH JULY, 2011
of .................................................................................................................................................................................................................
.................................................................................................. of ..............................................................................................................
of .................................................................................................................................................................................................................
Seventeenth Annual General Meeting
Signed this ..................................................................................... day of .........................................................................................2011
Note :-
2. Proxy form, complete in all respects, should reach the Company’s
the meeting.
Signature RevenueStamp
✂ ✂
✂✂


Notes

Notes

Cost and Profit as a percentage of Total Income (Standalone)
FY 2010-2011
FY 2009-2010
Segment (` in crores) %
Raw Material 14,254 61%
Power & Fuel 1,182 5%
Employee Cost 534 2%
Manufacturing & Other Expenses 2,620 11%
Interest 695 3%
Depreciation 1,379 6%
Provision for Taxation 771 3%
Profit after Tax 2,011 9%
Segment (` in crores) %
Raw Material 10,461 56%
Power & Fuel 1,006 5%
Employee Cost 365 2%
Manufacturing & Other Expenses 2,098 11%
Interest 859 5%
Depreciation 1,123 6%
Provision for Taxation 797 4%
Profit after Tax 2,023 11%
Annual Report 2010-11 107

Piecing together, value and growth
Blast Furnace 3 & 4 at JSW Steel, Vijayanagar


Financial Highlights (Standalone)
2006-07 2007-08 2008-09 2009-10 2010-11
REVENUE ACCOUNTS (` in crores)
Gross Turnover 9,297.26 12,628.91 15,179.29 19,456.64 25,130.76
Net Turnover 8,554.36 11,420.00 14,001.25 18,202.48 23,163.24
EBIDTA 2,921.69 3,501.73 3,088.21 4,801.98 4,856.17
Depreciation and Amortization 498.23 687.18 827.66 1,123.41 1,378.71
Net Finance Charges 399.26 435.32 792.79 858.92 695.18
PBT 1,915.18 2,484.12 677.63 2,819.65 2,782.28
Provision for Taxation 623.18 755.93 219.13 796.91 771.61
PAT 1,292.00 1,728.19 458.50 2,022.74 2,010.67
CAPITAL ACCOUNTS (` in crores)
Gross Block 10,512.76 13,952.32 16,896.75 21,795.58 27,407.35
Net Block 8,189.10 10,955.49 13,086.44 16,866.14 21,102.15
Capital Work in Progress 2,002.93 5,612.43 9,242.06 6,684.27 6,169.05
Debt 4,173.03 7,546.53 11,272.63 11,585.10 11,951.34
Net Debt 3,818.17 6,991.56 10,849.92 11,090.50 9,797.46
Equity Capital 163.98 187.05 187.05 187.05 223.12
Reserves & Surplus 5,068.25 7,140.24 7,422.24 9,179.23 16,132.71
Shareholders’ Funds 5,594.05 7,677.25 7,959.25 9,706.34 17,225.27
RATIOS
Book Value Per Share (`) 312.24 394.99 410.07 504.00 735.80
Market price Per Share (`) 493.45 819.10 231.85 1,235.90 916.30
Earning per Share (Diluted) (`) 78.88 94.18 22.70 105.94 96.33
Market Capitalisation (` in crores) 8,091.53 15,321.15 4,336.72 23,117.35 20,444.23
Equity Dividend per Share (`) 12.50 14.00 1.00 9.50 12.25
Fixed Assets Turnover Ratio 1.04 1.04 1.07 1.08 1.10
EBIDTA Margin 33.6% 30.3% 21.8% 26.2% 20.8%
Interest Coverage 5.80 6.40 2.84 4.27 5.00
Net Debt Equity Ratio 0.68 0.91 1.36 1.14 0.57
Net Debt to EBIDTA 1.31 2.00 3.63 2.53 2.05
JSW Steel Limited110

Financial Highlights (Consolidated)
2006-07 2007-08 2008-09 2009-10 2010-11
REVENUE ACCOUNTS (` in crores)
Gross Turnover 9,297.26 13,665.56 17,112.88 20,211.33 25,867.80
Net Turnover 8,554.36 12,456.65 15,934.84 18,957.17 23,900.24
EBIDTA 2,922.38 3,626.62 3,249.04 4,602.83 4,946.77
Depreciation and Amortization 498.25 741.94 987.77 1,298.66 1,559.71
Net Finance Charges 399.31 567.88 1,151.16 1,104.17 945.41
PBT 1,915.18 2,424.25 315.33 2,200.00 2,441.65
Provision for Taxation 623.25 765.78 72.60 646.71 782.27
PAT 1,303.89 1,640.04 274.91 1,597.55 1,753.98
CAPITAL ACCOUNTS ( ` in crores)
Gross Block 10,513.39 18,105.12 22,388.91 26,792.05 32,683.89
Net Block 8,189.49 15,030.87 18,309.16 21,452.79 25,810.66
Capital Work in Progress 2,012.47 5,770.80 9,585.18 6,956.18 6,507.68
Debt 4,173.03 12,136.22 16,550.22 16,173.04 16,474.36
Net Debt 3,816.51 11,448.99 16,038.17 15,656.23 14,156.22
Equity Capital 163.98 187.05 187.05 187.05 223.12
Reserves & Surplus 5,133.02 7,351.83 7,266.94 8,730.04 15,436.77
Shareholders’ Funds 5,658.82 7,888.84 7,803.95 9,257.15 16,529.33
RATIOS
Book Value Per Share (`) 316.19 406.31 401.77 479.99 704.60
Market price Per Share (`) 493.45 819.10 231.85 1,235.90 916.30
Earning per Share (Diluted) (`) 79.62 89.26 12.88 83.29 83.83
Market Capitalisation (` in crores) 8,091.53 15,321.15 4,336.72 23,117.35 20,444.23
Equity Dividend per Share (`) 12.50 14.00 1.00 9.50 12.25
Fixed Assets Turnover Ratio 1.04 0.83 0.87 0.88 0.93
EBIDTA Margin 33.6% 28.8% 20.2% 24.1% 20.5%
Interest Coverage 5.80 5.08 1.96 2.99 3.58
Net Debt Equity Ratio 0.67 1.42 1.99 1.65 0.84
Net Debt to EBIDTA 1.31 3.16 5.09 3.74 2.90
Annual Report 2010-11 111

If undeliverred please return to: Victoria House, Pandurang Budhkar Marg, Lower Parel (W), Mumbai - 400 013. Tel: +91-22-2492 7000
Steel Limited
BOOK POST
Map for graphical representation purposes only. Not to scale.
Global Presence
Plant
Mining ResourceCorporate Office


![Guía para la remineralización (rev3) › media › publicaciones › guia_para_la... · =k W fWhW bW h[c_d[hWb_pWY_ d Z[ bWi W]kWi Z[iWbWZWi (° [Z_Y_ d (dZ [Z_j_ed=k_Z[b_d[ \eh](https://static.fdocuments.us/doc/165x107/5f0c48597e708231d434a17e/gua-para-la-remineralizacin-rev3-a-media-a-publicaciones-a-guiaparala.jpg)