Brine-in-Crude-Oil Emulsions at the Strategic Petroleum ...Brine-in-Crude-Oil Emulsions at the...
73
SANDIA REPORT SAND2013-8834 Unlimited Release Printed October 2013 Brine-in-Crude-Oil Emulsions at the Strategic Petroleum Reserve Martin B. Nemer, David L. Lord, Terry L. MacDonald Prepared by Sandia National Laboratories Albuquerque, New Mexico 87185 and Livermore, California 94550 Sandia National Laboratories is a multi-program laboratory managed and operated by Sandia Corporation, a wholly owned subsidiary of Lockheed Martin Corporation, for the U.S. Department of Energy's National Nuclear Security Administration under contract DE-AC04-94AL85000. Approved for public release; further dissemination unlimited.
Transcript of Brine-in-Crude-Oil Emulsions at the Strategic Petroleum ...Brine-in-Crude-Oil Emulsions at the...

SANDIA REPORT SAND2013-8834 Unlimited Release Printed October 2013
Brine-in-Crude-Oil Emulsions at the Strategic Petroleum Reserve
Martin B. Nemer, David L. Lord, Terry L. MacDonald
Prepared by Sandia National Laboratories Albuquerque, New Mexico 87185 and Livermore, California 94550
Sandia National Laboratories is a multi-program laboratory managed and operated by Sandia Corporation, a wholly owned subsidiary of Lockheed Martin Corporation, for the U.S. Department of Energy's National Nuclear Security Administration under contract DE-AC04-94AL85000. Approved for public release; further dissemination unlimited.

2
Issued by Sandia National Laboratories, operated for the United States Department of Energy
by Sandia Corporation.
NOTICE: This report was prepared as an account of work sponsored by an agency of the
United States Government. Neither the United States Government, nor any agency thereof,
nor any of their employees, nor any of their contractors, subcontractors, or their employees,
make any warranty, express or implied, or assume any legal liability or responsibility for the
accuracy, completeness, or usefulness of any information, apparatus, product, or process
disclosed, or represent that its use would not infringe privately owned rights. Reference herein
to any specific commercial product, process, or service by trade name, trademark,
manufacturer, or otherwise, does not necessarily constitute or imply its endorsement,
recommendation, or favoring by the United States Government, any agency thereof, or any of
their contractors or subcontractors. The views and opinions expressed herein do not
necessarily state or reflect those of the United States Government, any agency thereof, or any
of their contractors.
Printed in the United States of America. This report has been reproduced directly from the best
available copy.
Available to DOE and DOE contractors from
U.S. Department of Energy
Office of Scientific and Technical Information
P.O. Box 62
Oak Ridge, TN 37831
Telephone: (865) 576-8401
Facsimile: (865) 576-5728
E-Mail: [email protected]
Online ordering: http://www.osti.gov/bridge
Available to the public from
U.S. Department of Commerce
National Technical Information Service
5285 Port Royal Rd.
Springfield, VA 22161
Telephone: (800) 553-6847
Facsimile: (703) 605-6900
E-Mail: [email protected]
Online order: http://www.ntis.gov/help/ordermethods.asp?loc=7-4-0#online

3
SAND2013-8834
Unlimited Release
Printed October 2013
Brine-in-Crude-Oil Emulsions at the Strategic Petroleum Reserve
Martin B. Nemer
Thermal Fluid Experimental Sciences Department
David L. Lord
Geotechnology and Engineering Department
Terry L. Macdonald
Repository Performance
Sandia National Laboratories
P.O. Box 5800
Albuquerque, New Mexico 87185-0346
Abstract
Metastable water-in-crude-oil emulsion formation could occur in a Strategic
Petroleum Reserve (SPR) cavern if water were to flow into the crude-oil layer at a
sufficient rate. Such a situation could arise during a drawdown from a cavern with a
broken-hanging brine string. A high asphaltene content (> 1.5 wt %) of the crude oil
provides the strongest predictor of whether a metastable water-in-crude-oil emulsion
will form. However there are many crude oils with an asphaltene content > 1.5 wt %
that don’t form stable emulsions, but few with a low asphaltene content that do form
stable emulsions. Most of the oils that form stable emulsions are “sour” by SPR
standards indicating they contain total sulfur > 0.50 wt %.

4
ACKNOWLEDGMENTS
Thanks to Patrick V. Brady for performing a review of this work. Thanks to Collins Lanier,
Lisa, Eldredge, and Pat Milhalik for their support of this work over the years.

5
CONTENTS
Acknowledgments........................................................................................................................... 4
Contents .......................................................................................................................................... 5
Figures............................................................................................................................................. 6
1 Introduction ............................................................................................................................... 9
1.1 Background on Problem ................................................................................................. 9
1.2 Literature Review.......................................................................................................... 10
1.2.1 Causes of Emulsion Stability – Asphaltenes, Resins, and Waxes .................. 10
1.2.2 Use of Bottle Tests .......................................................................................... 10
2 Initial Experiments on Big Hill Crude Samples ..................................................................... 11
3 Characterization ...................................................................................................................... 13
3.1 Crude Oil and Water Characterization .......................................................................... 13
3.2 Emulsion Characterization ............................................................................................ 14
3.2.1 Emulsion Type ................................................................................................ 14
4 Impacts of Emulsion Formation .............................................................................................. 15
4.1 Emulsion Rheology ....................................................................................................... 15
4.2 Roof Dissolution ........................................................................................................... 16
5 Causes of Stability .................................................................................................................. 19
5.1 Polar Silica Test ............................................................................................................ 19
5.2 Asphaltene Solubility as a function of Temperature ..................................................... 20
6 Treatment Options .................................................................................................................. 23
6.1 Oil Based Emulsion Breaking Compounds .................................................................. 23
6.2 Water Based Emulsion Breaking Compounds .............................................................. 24
6.3 Oil Blending .................................................................................................................. 27
7 Flow Conditions Required to Form Stable Emulsion ............................................................. 29
7.1 Well-Head Sampled BH106 Crude Oil Experiments in the Small-Scale SPR Tank .... 29
7.1.1 Experimental Methodology ............................................................................ 32
7.1.2 Runs Performed .............................................................................................. 36
7.1.3 Results ............................................................................................................. 37
7.2 Recovery Times and Stable Emulsion Formation ........................................................ 38
8 Bottle Tests on All SPR Oils .................................................................................................. 40
9 Conclusions ............................................................................................................................. 45
References ..................................................................................................................................... 47
Appendix A. Complete Oil Blending Experimental Data ........................................................... 49
Appendix B: Full downhole-Sampled Crude oil Bottle Test Results with Time ........................ 52
Appendix C: New Mexico Tech Report ....................................................................................... 66
Samples ......................................................................................................................................... 66

6
Experimental Methods .................................................................................................................. 66
Physical Properties .................................................................................................................. 66
Chemical Characteristics ........................................................................................................ 67
Interfacial Tensions ................................................................................................................. 67
Results ........................................................................................................................................... 67
References ..................................................................................................................................... 70
Distribution ................................................................................................................................... 71
FIGURES
Figure 1. Schematic of normal and broken string configurations. ................................................. 9
Figure 2. Confocal microscope image of a stable raw-water-in-crude-oil emulsion). ................ 14
Figure 3. Stable BH112 emulsion obtained at two different Reynolds numbers. ........................ 16
Figure 4. Image of the mother emulsion used for the salt-dissolution experiments. ................... 17
Figure 5. Image of a bottle containing 5 g of halite and 30 g of emulsion. ................................. 18
Figure 6. Bottle tests of Big Hill Cavern 112 well-head-sampled oil. ......................................... 20
Figure 7. Cross-Polarized images of BH101, and BH112 + nonane at temperature. .................. 21
Figure 8. Stable emulsion formed from well-head-sampled BH112 oil. ..................................... 23
Figure 9. Separated SPR crude-oil emulsion using Nalco Ultrion 8186 .................................... 25
Figure 10. Gas Chromatograph of gases flashed off aqueous portion of separated emulsion. .... 26
Figure 11. Series of blended oil experiments using.. ................................................................... 28
Figure 12. Schematic of the small-scale SPR tank setup. ............................................................ 30
Figure 13. Image of small-scale-tank setup ................................................................................. 31
Figure 14. Drop-size (diameter) distribution for a stable emulsion ............................................. 33
Figure 15. Sequence of steps in a SPR small-tank experiment.................................................... 35
Figure 16. Image of stable-brine-in-crude-oil emulsion from small-tank experiment. ............... 37
Figure 17. Fraction of brine that becomes entrained in the crude oil during flow of brine into the
crude oil. ....................................................................................................................................... 38
Figure 18. Time required for the unstable black-brine-in-oil interface to return to its original
height............................................................................................................................................. 39
Figure 19. Asphaltene wt % versus volwater %.. ........................................................................... 41

7
TABLES
Table 1. Big-Hill Well-Head Oil Sample Lab Emulsion Stability Tests. .................................... 11
Table 2. Well-Head Big Hill Crude Oil Physical Properties ....................................................... 13
Table 3. Well-Head Big Hill Crude Oil Chemical Properties ..................................................... 13
Table 4. Viscosity of two well-head-sampled BH112 stable emulsions ..................................... 15
Table 5. Asphaltene Dissolution Test Results ............................................................................. 20
Table 6. Summary of blended oil experiments. ........................................................................... 27
Table 7. Parameter values used in this report. ............................................................................. 33
Table 8. Comparison of experimental flow parameters to those applicable to SPR. ................... 34
Table 9. List of runs performed using the small-scale SPR tank.. ............................................... 36
Table 10. Bottle test results for downhole-sampled SPR oils. ..................................................... 42
Table 11. List of caverns that do not have a bottle test result. ..................................................... 43
Table 12. Raw data from the blended oil experiments. ............................................................... 49

8
NOMENCLATURE
dB decibel
DOE Department of Energy
SNL Sandia National Laboratories
Re Reynolds number
NMT-PRRC New Mexico Tech Petroleum Research and Recovery Center
SPR Strategic Petroleum Reserve
API American Petroleum Institute gravity
cP centi-poise
RI refractive index

9
1 INTRODUCTION
1.1 Background on Problem
This study addresses whether raw-water1 injection through a broken hanging string will cause a
stable emulsion to form, and what will be the impact on SPR. A schematic drawing of the
normal and broken string configurations are shown in Figure 1. Water injection through the
broken hanging string would expose the oil to a high-volume-flow-rate jet of raw water, through
a distance from the end of the hanging string to the brine layer below. This energetic
commingling of immiscible phases in the presence of natural surfactants from the oil has the
potential to form stable dispersions of water in oil, which is called an emulsion. The presence of
the “sludge” layers in SPR caverns is a realization of the potential to form such stable
configurations, although it is unclear how existing sludge layers formed. Emulsions have the
potential to adversely affect oil quality by introducing water into the oil at a concentration
greater than delivery requirements. The viscosity of the emulsion is too high to flow up through
the oil string.
Figure 1. Schematic of normal and broken string configurations.
When two immiscible fluids are mixed together in a shearing flow, one phase will become the
continuous phase and the other will become the dispersed phase. When drops of the disperse
phase undergo shear flow, the strain component of the shear flow stretches the drops in the strain
direction. If this straining stress is greater than the surface-tension restoring stress on the drop,
the drop will break into two or more smaller drops. This continues until the drops are small
enough so that the straining stress is less than the surface-tension stress.
1 Raw water in the context of the Strategic Petroleum Reserve is surface water, fresh or brackish, that is picked up
by the raw water intake structure, and used to displace oil from a cavern during a drawdown operation.
Normal string
configurationBroken string
configuration
oil
brine
Normal string
configurationBroken string
configuration
oil
brine

10
1.2 Literature Review
1.2.1 Causes of Emulsion Stability – Asphaltenes, Resins, and Waxes It is known that small solid-like particles of asphaltene, resin, and wax can stabilize water-in-
crude-oil emulsions (Lee, 1999, Sjoblom, et al., 1992, McLean and Kilpatrick, 1997, Spiecker, et
al., 2003) by sterically preventing drop coalescence. However it is also possible that the
equilibrium concentration of asphaltene absorbed onto the water-oil interface determines
emulsion stability (Kilpatrick, 2012). In either case, determining the total fraction of asphaltene,
resin, and wax in an oil sample is not thermodynamically sufficient to predict whether the oil
will form a stable emulsion (Eley, et al., 1988), because one needs to know how much asphaltene
is precipitated as a solid and how much will absorb to the water-oil interface (Gafonova and
Yarranton, 2001). Further complicating the picture, asphaltenes are not a monolithic block of
compounds; some stabilize emulsions and some destabilize emulsions (Kilpatrick, 2012). These
compounds exist over a wide spectrum of molecular structures, and thus chemical analyses of
their individual concentrations are difficult if not impossible.
1.2.2 Use of Bottle Tests Emulsion bottle tests are performed by pouring equal amounts of water and oil into a small bottle
and then shaking the mixture vigorously. If the two immiscible fluids separate within a
reasonable amount of time (few days), then it is concluded that the system does not form a stable
emulsion. If the two fluids do not separate, it is concluded that the system is capable of forming
a stable emulsion. Although the test is simple in execution, it remains the industry standard.
Poindexter et al. (2005) of Nalco Chemical Co. used emulsion bottle tests to correlate crude-oil
emulsion stability to asphaltene, solids, resins, and wax content in the crude oil. Pena et al.
(2005) of Rice University used emulsion bottle tests to examine the efficacy of commercial
emulsion-breaking compounds on crude-oil emulsions. Thompson et al. (1985) of BP used
emulsion bottle tests to examine at the effect of waxes on crude-oil emulsion stability. Goldszal
and Bourrel (2000) of ELF France used emulsion bottle tests to optimize the amount emulsion-
breaking compounds needed to breakup crude-oil emulsions. Fan et al. (2009) of the Norwegian
University of Science and Technology used bottle tests to examine the use of nonionic
surfactants as emulsion-breaking compounds for treating crude-oil emulsions.

11
2 INITIAL EXPERIMENTS ON BIG HILL CRUDE SAMPLES
Initial bottle tests were performed by Sandia on crude-raw water samples from 13 caverns at Big
Hill. In each bottle 15 mL of crude oil was mixed with 15 mL of raw water. The bottles were
then shaken by hand vigorously for 1 minute. When a stable emulsion formed, the water content
of the emulsion was on the order of 50 vol % which exceeds the SPR oil quality requirements of
1.75 vol % (U. S. Department of Energy, 2004). The crude oil and brines for these tests were
obtained from the Big Hill well heads. Bottle tests on downhole-sampled SPR cavern oils were
performed by DynMcDermott as discussed in Section 8, however there are differences between
the two sets of results; in particular the Sandia results showed that BH111 and BH112 form a
stable emulsion, whereas the results obtained from DynMcDermott did not show a stable
emulsion.
Table 1 shows the results of the bottle tests on well-head Big Hill oils including whether an oil
formed a stable emulsion, previous asphaltene testing by DynMcDermott, and asphaltene testing
by the New Mexico Tech – Petroleum Resource Research Center (NMT-PRRC, see Section 3.1).
As can be seen from Table 1, the formation of a stable emulsion was highly correlated with the
asphaltene testing performed by NMT-PRRC, i.e. higher asphaltene content (~ 3 wt %) lead to
stable emulsions. Table 1 also shows that the SPR asphaltene testing is consistently below that
of NMT-PRRC for every sample tested, although the two results are highly correlated (R2 =
0.96).
Table 1. Big-Hill Well-Head Oil Sample Lab Emulsion Stability Tests.
Cavern Stable Emulsion Formed in Lab
n-C6 Asphaltenes2
(wt %)
Asphaltenes previous analysis4
(wt %)
101 1.2 0.33 102 1.7 1.1 103 0.9 0.26 104 1.2 0.35 105 1.1 0.54 106 X 3.1 2.1 107 X 3.4 2 108 X3 3.1 1.9 109 NA 110 NA 111 X 2.4 1.57 112 X1 3.0 1.79 113 1.77 114 0.37
_____________ 1. In one test the sample separated slightly, in a second test it did not separate. 2. Measured by NMT-PRRC see Section 3.1 3. Partially separated. 4. Taken from SPR Crude Oil Comprehensive Analyses performed by Dyne McDermott.

12

13
3 CHARACTERIZATION
3.1 Crude Oil and Water Characterization
Sandia contracted with New Mexico Tech Petroleum Recovery Research Center (NMT-PRRC)
to analyze 10 well-head-sampled Big Hill crude-oil samples, cavern brines, and Big Hill raw
intake water. A full copy of the report is included in Appendix B. Here we only summarize the
most salient features of the report. Table 2 shows the density, viscosity and refractive index of
well-head Big Hill oils. Table 3 shows the acid and base numbers, and the weight percent of
saturates, aromatics, resins, and asphaltenes, also known as a SARA analysis. The sour oils have
viscosities and asphaltene concentrations that are generally double those of the sweet oils.
Table 2. Well-Head Big Hill Crude Oil Physical Properties (Table 2. in NMT-PRRC report)
Oil density at 20ºC (g/cm3) °API viscosity at 20ºC (cP) RI Sweet/Sour
101 0.8385 36.6 5.23 1.4707 Sweet
102 0.8457 35.2 5.82 1.4748 Sour
103 0.8408 36.2 5.23 1.4717 Sweet
104 0.8349 37.4 5.20 1.4693 Sweet
105 0.8344 38.1 4.96 1.4693 Sweet
106 0.8618 32.7 10.06 1.4867 Sour
107 0.8597 32.5 9.93 1.4858 Sour
108 0.8621 32.0 10.17 1.4870 Sour
111 0.8535 33.7 7.95 1.4804 Sour
112 0.8707 30.4 14.23 1.4911 Sour
Table 3. Well-Head Big Hill Crude Oil Chemical Properties (Table 3. in NMT-PRRC report)
Oil Acid # Base # Saturates Aromatics Resins n-C6 Asphaltenes
mg KOH/g oil wt %
101 0.30 1.56 66.3 19.9 12.6 1.2
102 0.49 2.55 62.2 19.4 16.7 1.7
103 0.43 1.71 64.3 21.4 13.5 0.9
104 0.19 1.47 64.0 21.9 13.0 1.2
105 0.20 1.47 64.5 20.5 13.9 1.1
106 0.28 1.44 59.5 21.3 16.2 3.1
107 0.28 1.46 58.2 21.6 16.8 3.4
108 0.29 1.50 58.3 21.6 17.0 3.1
111 0.43 1.57 59.7 23.8 14.1 2.4
112 0.30 1.65 56.3 21.8 18.9 3.0

14
3.2 Emulsion Characterization
3.2.1 Emulsion Type To determine whether the metastable emulsions formed are water-in-oil or oil-in-water type,
emulsions of well-head-sampled Big Hill crude oil and raw intake water were prepared and
imaged using an Olympus petrographic microscope under transmitted light. We also wanted to
determine whether significant quantities of air were being entrained as small bubbles in our
experiments. Entrained air would have been an experimental artifact since we do not anticipate a
gas phase around a broken brine string hanging in the oil phase. In this experiment we placed
equal amounts (15mL) of well-head-sampled Big Hill cavern 112 oil into a small bottle. The
aqueous phase was dyed with methylene blue (60 mg dye to 15mL water); methylene blue is not
soluble in the oil phase. The bottle was then shaken vigorously. A small sample of the emulsion
was taken, placed on a glass slide and imaged, as shown in Figure 2. Given the blue dispersed
phase and the dark brown continuous phase it is reasonable to conclude that this emulsion is a
water-in oil type, although a small fraction of the dispersed phase does appear clear. Particulate
can be seen in some blue drops, this is un-dissolved methylene blue. The drop radii are ~ 3 –
250 μm.
Figure 2. Confocal microscope image of a stable raw-water-in-crude-oil emulsion prepared from Big Hill raw intake water and cavern-107 well-head-sampled Big-Hill oil. The water phase was dyed with a blue dye (methylene blue).
15
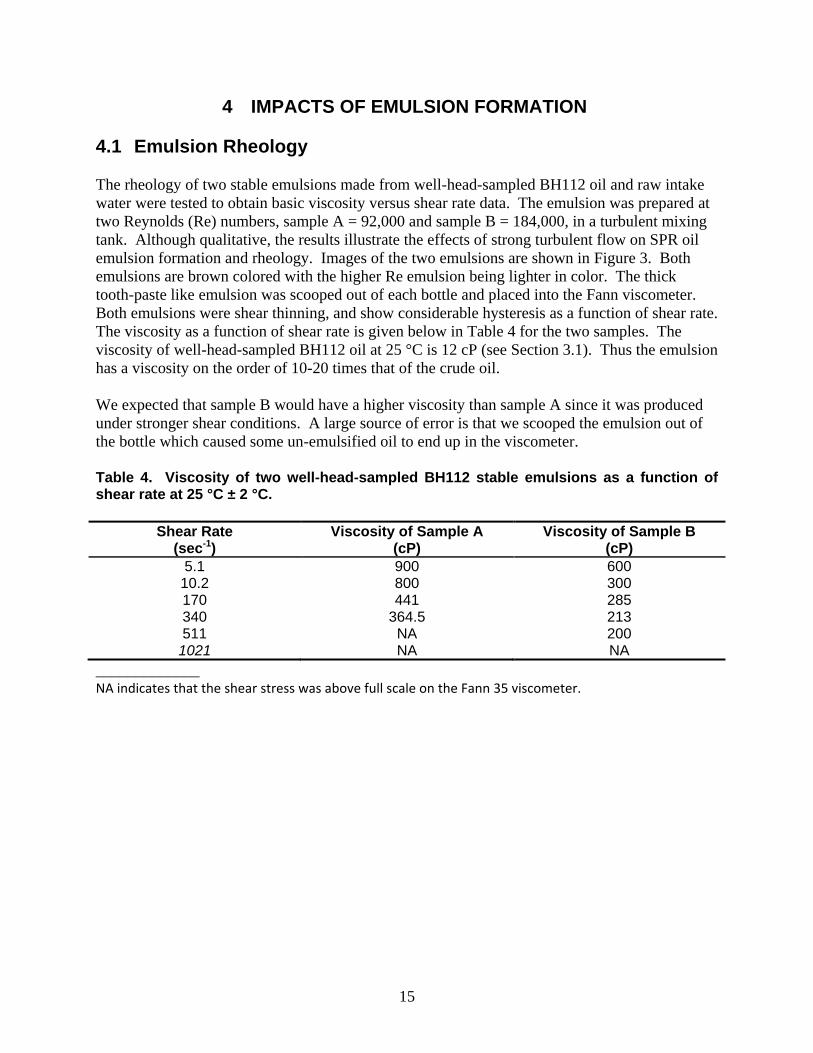
4 IMPACTS OF EMULSION FORMATION
4.1 Emulsion Rheology
The rheology of two stable emulsions made from well-head-sampled BH112 oil and raw intake
water were tested to obtain basic viscosity versus shear rate data. The emulsion was prepared at
two Reynolds (Re) numbers, sample A = 92,000 and sample B = 184,000, in a turbulent mixing
tank. Although qualitative, the results illustrate the effects of strong turbulent flow on SPR oil
emulsion formation and rheology. Images of the two emulsions are shown in Figure 3. Both
emulsions are brown colored with the higher Re emulsion being lighter in color. The thick
tooth-paste like emulsion was scooped out of each bottle and placed into the Fann viscometer.
Both emulsions were shear thinning, and show considerable hysteresis as a function of shear rate.
The viscosity as a function of shear rate is given below in Table 4 for the two samples. The
viscosity of well-head-sampled BH112 oil at 25 °C is 12 cP (see Section 3.1). Thus the emulsion
has a viscosity on the order of 10-20 times that of the crude oil.
We expected that sample B would have a higher viscosity than sample A since it was produced
under stronger shear conditions. A large source of error is that we scooped the emulsion out of
the bottle which caused some un-emulsified oil to end up in the viscometer.
Table 4. Viscosity of two well-head-sampled BH112 stable emulsions as a function of shear rate at 25 °C ± 2 °C.
Shear Rate (sec-1)
Viscosity of Sample A (cP)
Viscosity of Sample B (cP)
5.1 900 600 10.2 800 300 170 441 285 340 364.5 213 511 NA 200
1021 NA NA
_____________ NA indicates that the shear stress was above full scale on the Fann 35 viscometer.

16
Figure 3. Stable BH112 emulsion obtained at two different Reynolds numbers, (a) Sample A: Re = 92,000, (b) Sample B: Re = 184,000. Notice that the color of (b) is a lighter than (a), indicating a smaller drop size.
4.2 Roof Dissolution
A set of experiments was conducted to investigate the ability of an unsaturated brine-in-crude-oil
emulsion to dissolve roof halite; to determine whether an emulsion layer is capable of dissolving
the roof of a cavern. In these experiments we began by forming a stable water-in-crude oil
emulsion using equal parts de-ionized water (DI, 125 ml) and well-head-sampled crude oil (125
ml) from Big Hill cavern 111, and shaking together in a 250 ml bottle for two minutes. Figure 4
shows a picture of this emulsion taken on 9/21/2008 (i.e. at the end of the experiment). Next 30
grams (approximately 30 ml) of this emulsion was poured into smaller 40 mL bottles, each
containing 5 grams of previously-weighed pure-dry halite (NaCl, Fisher ACS grade). The
bottles were closed and put onto a shelf where they were not shaken or otherwise disturbed (on
9/3/2008). Eighteen days (9/21/2008) later the bottle containing the stock emulsion and the
bottle containing the emulsion plus salt were photographed, as shown in Figure 4 - Figure 5.
What is clear from Figure 4 - Figure 5 is that that little to no water has separated out of the stock
emulsion, while it appears that the salt drew water out of the emulsion, causing salt dissolution.
We were unable to determine the mass of halite that dissolved. The halite layer contains oil and
tar that stuck to it, which was difficult to wash off with hydrocarbon solvents. In the oven, upon
drying at ≈ 100 °C, the salt decrepitated and much of the mass escaped the crucible and wasn’t
recoverable. Another interesting observation was that a small layer of crude oil remained
trapped between the brine and the emulsion. The hydrostatic head may be insufficient for this oil
to flow through the plateau borders separating the water droplets, i.e. not enough pressure to
push the oil back to the top of the bottle.
(a) (b)

17
Figure 4. Image of the mother emulsion used for the salt-dissolution experiments, taken on 9/21/2008; the emulsion was prepared on 9/3/08 and remained stable throughout the experiment. There is a visible layer of free oil at the top of the liquid that has been squeezed out of the emulsion by capillary pressure and gravity.

18
Figure 5. Image of a bottle containing 5 g of halite (NaCl, Fisher ACS grade), and 30 g of emulsion (shown in Figure 4) created from Big Hill cavern 111 well-head-sampled oil and DI water. The emulsion has separated in the vicinity of the halite causing local halite dissolution, leaving a local layer of oil “trapped” between the brine and the emulsion.
location of
water-emulsion
interface

19
5 CAUSES OF STABILITY
5.1 Polar Silica Test
It is well known that asphaltenes and other polar compounds that naturally occur in crude oil are
often primarily the cause of problem emulsions in the oil field (Fingas and FieldHouse, 2003).
Asphaltenes are more polar than alkanes and tend to stick to the oil-water interface. Because of
their large molecular size asphaltenes sterically inhibit drop coalescence, either by sterically
inhibiting drops from getting close enough to coalesce or by making the drop interface rigid
(incompressible surface) such that coalescence is not favorable. Sjoblom et al. (1992) developed
a simple test to determine whether polar compounds in the oil are the cause of emulsion stability
in water-in-crude emulsions. In this test the asphaltenes and other polar compounds are
chemically removed from the oil by absorbing them onto polar silica. The oil is then re-tested to
determine whether it can form a stable emulsion.
In this experiment, five grams of silica beads (US Silica cat# MIN-U-SIL 5B) were added to a
beaker. Ten ml of well-head sampled BH112 crude oil was added and n-hexane (Acros ECD
grade) was added to dilute to 100 ml. The beaker was gently stirred and then the liquid was
filtered with Whatman #42 filter paper. The silica was discarded and the procedure repeated
until the silica beads no longer appeared brown. The liquid was then filtered using a 0.45 μm
syringe filter into a clean beaker and heated to evaporate off the hexane and return the oil to its
original 10 ml volume. The reduced oil was then mixed with 10 ml of brine and shaken for one
minute. No stable emulsion was formed from the treated oil, whereas untreated well-head-
sampled BH112 oil formed the most stable emulsions of the well-head-sampled Big Hill cavern
oils tested. This is illustrated in Figure 6; the final condensed oil is still a dark brown color,
although slightly lighter in color than the original oil.

20
Figure 6. Bottle tests of Big Hill Cavern 112 well-head-sampled oil; (a) bottle test using BH112 oil after removing the asphaltenes and other polar compounds from the oil (several minutes after mixing); (b) bottle test on un-treated BH112 oil (several days after mixing). The white line represents where the oil-brine interface should be upon complete separation.
5.2 Asphaltene Solubility as a function of Temperature
Because the typical SPR cavern temperature is roughly 50 °C, one question that has been asked
is whether room-temperature lab experiments are relevant, given that the asphaltene solubility in
the oil increases with temperature. The idea is that the asphaltene is thermodynamically less
driven to the water-oil interface as its solubility increases in the oil phase. To test this
hypothesis, NMT-PRRC tested two Big Hill well-head-sampled oils, BH101 and BH112, to
determine the asphaltene solubility in the crude oil as a function of temperature. In this test
nonane (C9H20) was first added to the crude oil until solids were seen to precipitate out of
solution, as viewed on a heated microscope stage under cross-polarized light. Next the sample
was heated to view the temperature at which the asphaltene solids dissolve back into solution.
The results are shown in Table 5. The sequence of images used to determine the dissolution
temperatures are shown in Figure 7. Consequently a sample of BH112 emulsion made from
BH112 oil and brine was heated to 60 °C for several hours to see if it would separate; no
evidence of separation was observed.
Table 5. Asphaltene Dissolution Test Results
Sample Oil to nonane
(vol/vol)
Dissolution temperature
(°C)
BH101 52/48 60
BH112 68/32 60
Oil-H2O
interface
(a) (b)

21
Figure 7. Cross-Polarized images of BH101 (left), and BH112 (right) + nonane (volumes given in Table 5) at 20 °C, 50 °C and 60 °C.
20 °C
50 °C
60 °C

22
[This page intentionally left blank]

23
6 TREATMENT OPTIONS
6.1 Oil Based Emulsion Breaking Compounds
Experiments were performed to determine whether commercial oilfield de-emulsifying
chemicals (Nalco) might be able to either prevent or break a stable SPR crude-raw water
emulsion. One of the Nalco de-emulsifying chemicals was tested on a stable emulsion, prepared
from well-head-sampled BH112 oil, shown in Figure 8a. Nalco de-emulsifying compound
EC2063A was added to the stable emulsion to a final concentration of 3000 ppm (as per Nalco
instructions). Within 5 hours the emulsion had separated considerably, as shown in Figure 8b
but also induced considerable cloudiness of the water phase in Figure 8b. This is likely due to
colloidal organic micelles suspended in solution composed of the de-emulsifying compound and
heavy aromatics. In oilfield applications, the brine is normally disposed of in existing wells or
reused, unlike SPR where the brine is typically discharged. Thus the use of these chemicals
could generate a discharge-permit issue.
Figure 8. Stable emulsion formed from well-head-sampled BH112 oil (a) before adding de-emulsifying compound, (b) five hours after adding 0.1 mL of Nalco de-emulsifier EC2063A.
In a separate experiment, Nalco EC2063A was added to well-head-sampled BH112 oil prior to
emulsification, to determine whether a significant reduction in separation time could be
achieved, relative to the experiment described in the previous paragraph. We did not observe a
significant reduction in the separation time compared to the experiment explained in the
paragraph above. In this later experiment, a cloudy colloidal water layer after separation was
also observed.
(a) (b)

24
6.2 Water Based Emulsion Breaking Compounds
Nalco Chemical Co. was given a sample of raw-water-in-crude-oil emulsion that was prepared in
our lab. This was accomplished by mixing roughly equal parts of Big Hill Cavern 112 well-
head-sampled oil with Big Hill raw-intake water. The total volume was about 1 liter. The bottle
was shaken vigorously for several minutes and allowed to sit. Over the next few days the bottle
was repeatedly shaken for several minutes to ensure that the sample sent to Nalco would be
sufficiently difficult to separate. Nalco then added their emulsion breaking compound, Ultrion
8186, at a concentration of 20 parts per million. The sample was then centrifuged which caused
to the emulsion to separate with a clear aqueous later, as shown in Figure 9. Nalco also ran a
qualitative analysis of the separated water which is shown in Figure 10. Aromatics and other
regulated compounds are present, but the concentrations of these compounds in the aqueous
phase would have to be compared with the equilibrium concentrations between the crude oil and
raw water, i.e. their presence may not be related to the emulsion-breaking compound. Further
testing and quantitative brine analysis by a certified laboratory should be performed to be able to
show that the brine meets disposal requirements. Further testing and quantitative analysis of the
oil would also be required to ensure that the compound doesn’t affect oil quality requirements.

25
Figure 9. Separated SPR crude-oil emulsion (BH112 well-head oil and BH raw-intake water) using Nalco Ultrion 8186 at a concentration of 20 ppm. This experiment was performed by Nalco chemical company using an emulsion that SNL prepared. The resulting aqueous layer appears clear unlike that obtained using oil-based emulsion breaking compounds.

26
Figure 10. Gas Chromatograph of gases flashed off aqueous portion of separated emulsion shown in Figure 9.

27
6.3 Oil Blending
We investigated the idea of blending oils from two separate caverns with a high and low
asphaltene concentration to produce a new oil that would not form a stable emulsion. In this
experiment, the two oils were mixed for a total volume of 15 mL, and adding the mixture to 15
mL of raw-intake water (saline but not saturated brine) in a bottle. The bottles were then hand
shaken vigorously for two minutes and re-shaken in some cases. All of the oils were well-head
Big-hill samples. The results of this experiment are shown in Table 6. In Table 6, the yellow
columns give the cavern id, the volume and the wt % asphaltene for the high-asphaltene oils
used, and the turquoise columns gives the same information for the low-asphaltene oils used.
The volume of oil A in Table 6 is the minimum volume of oil A required to form a fully-stable
emulsion, i.e. little or no water had separated from these systems after mixing. The resulting
asphaltene concentration of the mixture is shown in the white column, calculated by volume
averaging the asphaltene wt % of oils A and B. The average and standard deviation of the
calculated asphaltene concentration of the stable systems is also given. According to Table 6,
any blend that has an asphaltene content above ~ 1.7 wt % had a high potential for forming
stable water-in-crude emulsions. Thus, for example, down-blending cavern 112 with cavern 101
to an asphaltene content of 1.5 wt % (at which we would expect little emulsion to form) would
require the volumetric oil makeup of the final cavern to be 83 % from cavern 101 and 17 % from
cavern 112.
Table 6. Summary of blended oil experiments showing asphaltene concentration (wt %) required to fully stabilize the emulsion.
Oil A Oil B Oil A + Oil B Sample
ID Vol
(mL) Asphaltene
(wt %) Sample
ID Vol
(mL) Asphaltene
(wt %) Asphaltene
(wt %)
CAV106 A 3.5 3.1 CAV101A 11.5 1.2 1.64
CAV106 A 5 3.1 CAV105A 10 1.1 1.77
CAV108A 6 3.1 CAV103A 9 0.9 1.78
CAV111A 8 2.4 CAV103A 7 0.9 1.70
Average: 1.72
Standard deviation:
0.07
__________
Table 6 is subjective because many oils show a “grey” area where the system is partially
emulsified with some free water at the bottom; the full set of experimental observations is given
in Appendix A, Table 12. Figure 11 illustrates this “grey” behavior and the difficulties that we
have encountered in interpreting these experiments and in interpreting the mixing experiments.
In the figure, well-head-sampled oils from Big Hill caverns 108 and 102 were blended together
in various ratios (given in the figure). Instead of a sharp cut off between stable and unstable
emulsification, we see a gradation in the amount of water that has separated as a function of the
net asphaltene content of the oil. This is not surprising given that cavern 102 has an asphaltene
wt % of 1.7 which is close to the emulsion stability boundary given in Table 6. A more useful
metric might be the amount of free oil (i.e. oil that doesn’t contain a significant amount of water)
that separates at the top of the mixture after a known amount of time.

28
Figure 11. Series of blended oil experiments using well-head-sampled oils from Big Hill caverns 108 and 102. In each bottle in the figure the top number (i.e. 5 mL for the leftmost bottle) is the volume of oil from cavern 108, and the lower number is the volume from cavern 102. The amount of free water visible in the bottom of the bottles (white bar marks the oil-brine interface) decreases as the amount of cavern 108 oil is increased (which increases the asphaltene concentration of the oil). In the first two left-hand bottles the free (separated) oil has been removed and weighed, hence the headspace at the top of the bottles.
location of
oil water
interface

29
7 FLOW CONDITIONS REQUIRED TO FORM STABLE EMULSION
7.1 Well-Head Sampled BH106 Crude Oil Experiments in the Small-Scale SPR Tank
A bench-scale mockup of an SPR cavern was built to examine the effects of geometry on brine-
in-crude-oil emulsion formation at SPR. The idea of these experiments was to flow brine
through a jet pointing downward into the upper portion of the tank containing crude oil and/or an
oil surrogate. The goal was to determine the flow rates required to form a stable emulsion due to
the brine jet and scale these up to SPR conditions using standard dimensional analysis
(Barenblatt, 1996).
A schematic of the small-scale tank is shown below in Figure 12. In this design a 4-inch-inner-
diameter 23-inch-long acrylic tube is connected to two end caps. Drilled through the center of
the top end cap is a ¾ inch diameter port through which a ¾ inch diameter stainless-steel tube
runs. The stainless-steel tube represents the hanging brine string. The tube height is adjustable
from close to the bottom to the top of the tank. At the bottom of the stainless-steel tube is a jet
orifice. The available jet diameters are 1/8 in, 1/4 in, 3/8 in, 1/2 in, and 3/4 in. At the bottom of
the tank is a 3/4 inch drain that connects to a pump. The pump (Iwaki Magnetic Pump, model
MD-70RLZ7, max flow rate 11.4 gal/min, max head 66 ft) is connected to a flow meter (Endress
+ Hauser Promag P, model 50P15-EL0A1AA0B4AD) and a one-way valve for shutting off the
flow. A rheostat (Staco Energy Prod. Co., 0-140 V, 10 Amp, model 3PN1010B) controls the
flow rate by altering the voltage to the pump. The top cap of the small-scale tank contains a
second port for sampling the emulsion and for sending logging tools into our small-scale cavern.
A yellow tape measure is affixed to the outside of the tank for recording the oil-brine interface
height versus time. A JVC Everio HD video camera is used to record video of each flow test. A
photograph of the setup containing 5 m NaCl and Big Hill (BH) cavern 106 crude oil is shown in
Figure 13.
The results of this study indicate that the critical velocity needed to produce a stable emulsion
decreases with increasing jet diameter, as was expected. For a 3/8 inch nozzle diameter the
critical velocity needed to form a stable emulsion was ≈ 12.3 ft/sec (3.7 m/sec), which is very
close to a drawdown velocity encountered at SPR 11.7 ft/s (3.6 m/sec) (i.e. 95,000 bbl/day
through a 9.85 in pipe). Based on these results, we believe it is unlikely that an operationally-
relevant flow rate could be found that would prevent permanent emulsification in a real SPR
cavern, if brine (or brackish water) were to flow through a crude-oil layer that is susceptible to
emulsion formation.

30
Figure 12. Schematic of the small-scale SPR tank setup.

31
Figure 13. Image of small-scale-tank setup containing well-head-sampled Big Hill cavern 106 crude oil and 5 m NaCl. In the image the flow meter, valve, and pump are on the left and the rheostat is on the right.
Flow
meter
Brine
Pump
Rheostat
controls
brine pump
Valve to
shut off
brine flow

32
7.1.1 Experimental Methodology
7.1.1.1 Parameterization of the problem
The parameters that have been varied in this experiment include: the velocity exiting the jet
nozzle, and the jet-nozzle diameter. The dimensionless groups corresponding to these
parameters are the jet Reynolds number,
Re bJet
b
vd
, (1)
and the jet Weber number based on the jet diameter,
2
bJet
v dWe
. (2)
Here ρb is the density of the brine phase (g/L), v is the velocity at the nozzle exit (m/sec), d is the
nozzle diameter (m), µb is the viscosity of the brine phase (cP), σ is the oil-brine interfacial
tension (N/m), and amax is the largest stable drop size (m) in the stable brine-in-crude-oil
emulsion (probably oil dependent). For the drop-scale Weber number we have assumed amax ~
100 µm, based on the drop-size distribution given in Figure 14. Figure 14 was obtained from
analyzing a stable emulsion produced from a test using a 1/8 in nozzle and a flow rate of 2.1
gal/min (8 L/min). Drop diameters were measured using a confocal microscope (Olympus
BX60), a calibrated reticule (Graticules LTD model SC 467), and the ImageJ image-analysis
software. A small drop of emulsion was placed on a glass slide and imaged using the
microscope without a coverslip or other disturbance.
Table 7 shows the parameter values used in calculating the dimensionless groups in equations (1)
– (2). Table 8 shows the range of ReJet and WeJet, explored in this experiment and SPR relevant
values for comparison.

33
Table 7. Parameter values used in this report.
Sample Specific Gravity1
(dimensionless)
µb2
(cP)
σ3
(N/m)
5m NaCl 1.18 1.3 0.028
SPR Raw Intake water 1.00 1 0.028
1. Based on measurements of 5 m NaCl and Bryan Mound raw water using a pipette,
deionized water at 72-77 °F (22-25 °C) and a high-precision balance.
2. Based on viscosity measurements of 5 m NaCl and BM raw water using a Fann
viscometer (accurate to 1 – 2 significant figures).
3. Based on data from NMT between BH raw water and BH cavern 106 crude oil, see
Table 5 in Appendix B.
Figure 14. Drop-size (diameter) distribution for a stable emulsion obtained from the 1/8 in jet-nozzle test at a flow rate of 2.1 gal/min (8 L/min).
0
0.05
0.1
0.15
0.2
0.25
0.3
0.35
0.4
12 26 40 54 69 83 97 111 125 139 153 167 More
Frac
tio
n (D
ime
nsi
on
less
)
Bin (µm)

34
Table 8. Comparison of experimental flow parameters to those applicable to SPR.
Velocity, v
(m/sec or ft/sec)
ReJet
(dimensionless)
WeJet
(dimensionless)
This report 0.92 – 55 ft/sec (0.3-
17 m/sec)
2300-47,000 30-38,000
SPR1 11.7 ft/sec
(3.6 m/sec)
106 10
5
1. Based on a drawdown of 95,000 bbl/day through a 9.85 in pipe.
7.1.1.2 Procedure
The experimental procedure is depicted in Figure 15 and was as follows:
1) Put a jet nozzle with known orifice diameter onto the brine string.
2) Record the at-rest oil-brine interface height from the tape measure affixed to the outside
of the small-scale SPR tank.
3) Move the brine string such that the nozzle exit is located in the brine layer. Turn on the
pump, set the flow rate to a desired value, Figure 15a.
4) Close brine valve, move the brine string up such that the jet nozzle exit is located at the
top of the oil column, Figure 15b.
5) Begin recording video using JVC camera.
6) Open the brine valve to allow brine to flow into the crude oil layer. Record flow rate
(liters/sec) from the flow meter, Figure 15c.
7) Close the brine valve when the black-brine-in-oil-mixture interface height reaches the
bottom of the tank, specifically at 20 inches as read by the tape measure. Record total
flow (liters) from flow meter, Figure 15d.
8) Continue recording video of the interface location versus time, Figure 15e-f.
For most nozzle diameters and flow rates, at least two runs were performed. An exception to this
was when a stable emulsion was formed. We have explored velocities from 0.92 ft/sec (0.3
m/sec) up to 55 ft/sec (17 m/sec) and nozzle diameters from 1/8 in (3 x 10⁻³
m) up to 3/8 in (9 x
10-3
m).
For each run, 5 molal (m) NaCl brine (23 wt %) was used as the aqueous phase. Based on
experience and the literature, we believe it is more difficult to form a stable emulsion with a
nearly saturated brine than with brackish water (SPR raw water), because of the salting-out
effect. Thus if we form a stable emulsion with 5 m NaCl at a given flow condition, we believe it
is even more likely to happen for brackish or fresh water.

35
The crude oil used was from the well-head of Big Hill cavern 106. Jim Perry of DynMcDermott
was gracious in sending us 16 liters of crude oil. As discussed in Subsection 4.2 of Nemer and
Lord (2008), Big Hill cavern 106 oil has been found to form stable emulsions. All tests were
performed at room temperature 72-77 °F (22-25 °C) and atmospheric pressure.
Figure 15. Sequence of steps in a SPR small-tank experiment: (a) place brine string (white arrow points to string, white line points to oil-brine interface) into the brine layer and set the flow rate to desired value; (b) close the brine valve, move brine string (arrow points to string) up such that the brine-jet orifice is at the top of the oil column; (c) open valve to allow brine to flow into the crude oil layer at the prescribed rate; (d) close valve when the black oil-brine mixture interface (white line) descends to a depth just above the inlet to the brine pump (20 inches on the tape measure); (e)-(f) record the interface height (white line) versus time as the emulsion breaks up into brine and crude oil.
(a) (b) (c)
(d) (e) (f)

36
7.1.2 Runs Performed Table 9 contains a list of all runs performed to date using the small-scale SPR tank, BH 106
crude oil and 5 m NaCl brine. For each nozzle size a series of runs were performed in increasing
flow rate. A photo of a stable brine-in-crude emulsion extracted from Run # 7 (Table 9) is
shown in Figure 16.
Table 9. List of runs performed using the small-scale SPR tank. Note that Re and We are dimensionless.
Run Number Jet Nozzle
Diameter
(in)
Flow Rate
(gal/min)
Nozzle
Velocity
(ft/sec)
ReJet
WeJet
1 0.125 0.1 3.6 3 x 10³ 2 x 10
2
2 0.125 0.3 6.9 6 x 10³ 6 x 10
2
3 0.125 0.3 6.9 6 x 10³ 6 x 10
2
4 0.125 0.3 6.9 6 x 10³
6 x 10²
5 0.125 0.3 6.9 6 x 10³
6 x 10²
6 0.125 0.8 21 2 x 10⁴
6 x 10³
7 0.125 2.1 55 5 x 10⁴
4 x 10⁴
8 0.25 1.1 6.9 1 x 10⁴
1 x 10³
9 0.25 1.1 7.4 1 x 10⁴
1 x 10³
10 0.25 2.1 14 2 x 10⁴
5 x 10³
11 0.25 2.2 14 2 x 10⁴
5 x 10³
12 0.25 2.6 17 3 x 10⁴
7 x 10³
13 0.375 0.3 0.92 2 x 10³
3 x 101
14 0.375 0.4 1.1 3 x 10³
5 x 101
15 0.375 0.4 1.3 3 x 10³
6 x 101
16 0.375 0.5 1.4 3 x 10³
7 x 101
17 0.375 0.5 1.6 4 x 10³
9 x 101
18 0.375 1.0 2.9 7 x 10³
3 x 10²
19 0.375 1.0 3.0 8 x 10³
3 x 10²
20 0.375 1.1 3.1 8 x 10³
3 x 10²
21 0.375 1.1 3.2 8 x 10³
4 x 10²
22 0.375 2.1 6.2 2 x 10⁴
1 x 10³
23 0.375 2.1 6.2 2 x 10⁴
1 x 10³
24 0.375 2.1 6.2 2 x 10⁴
1 x 10³
25 0.375 4.2 12 3 x 10⁴
6 x 10³

37
Figure 16. Image of stable-brine-in-crude-oil emulsion obtained from the 1/8 inch jet nozzle at a flow rate of 2.1 gal/min (8 L/min). The lower fluid is brine that has separated. Oil has also separated on top of the emulsion. The white line marks the emulsion-brine interface, and the black line approximately marks the oil-emulsion interface.
7.1.3 Results
The main result of the work in the small-scale SPR tank is that for any operationally relevant
flow rate (ReJet > 103) of brine into the crude-oil layer, brine does not flow straight through the
crude-oil layer into the brine layer but instead becomes entrained as an emulsion in the crude oil
which takes time to separate, if it separates at all (see Figure 15c-d). This result is shown
quantitatively in Figure 17, which plots the fraction of brine entrained in the crude oil once the
pump is turned off. At ReJet ~ 104, all of the brine that has been flowed into the crude oil has
been held up, temporarily for un-stable emulsions and permanently for stable emulsions.

38
Figure 17. Fraction of brine that becomes entrained in the crude oil during flow of brine into the crude oil. The different symbols correspond to different nozzle sizes: 1/8 in, 1/4 in, and 3/8 in. See Table 8 for scaling to SPR conditions.
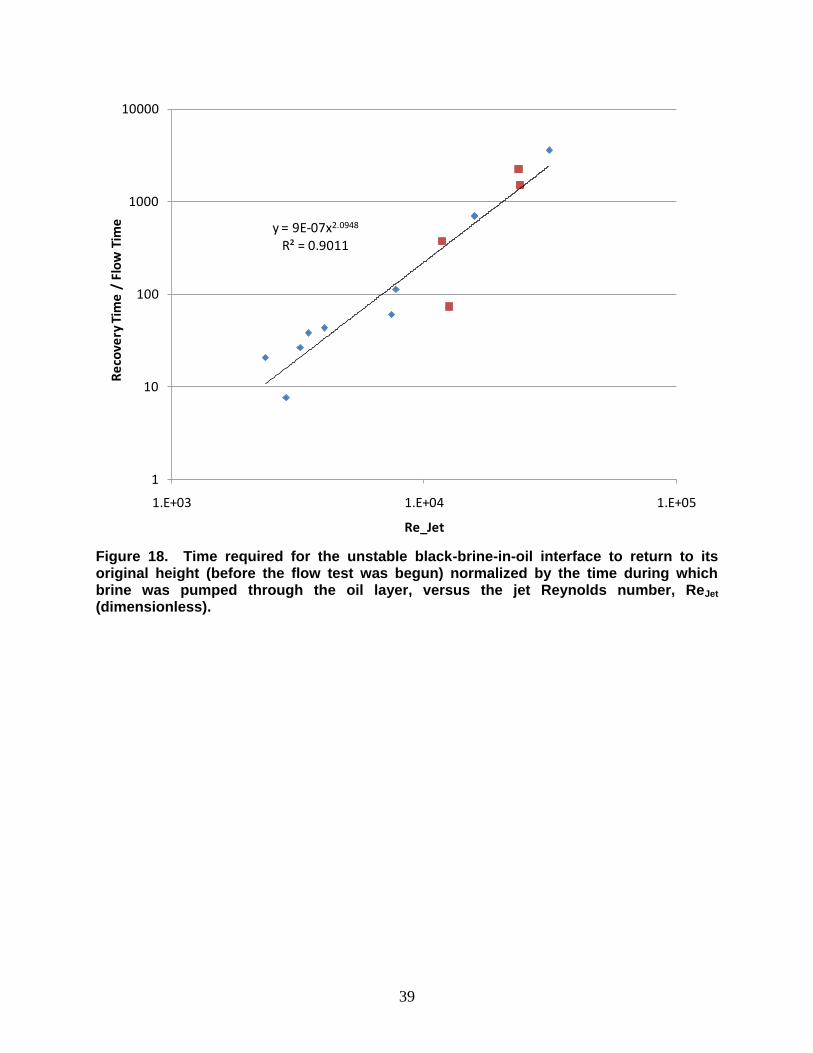
7.2 Recovery Times and Stable Emulsion Formation The recovery time is the amount of time required for the unstable black-brine-in-oil interface to
return to its original height (before the flow test was begun) determined from the recorded video,
as a function of the flow conditions used to prepare that emulsion. A limitation of this
observational method is that we can only approach flow rates that produce a stable emulsion,
since the recovery time becomes meaningless when a permanent brine-in-crude-oil emulsion is
produced. Figure 18 shows the recovery time normalized by the amount of time that the brine
pump was on versus the jet-scale Reynolds number. Figure 18 shows the recovery time in
minutes versus ReJet. It is clear that the time required for the emulsion to break increases with
increasing ReJet.
y = 0.0018x0.6497
R² = 0.8796
0
0.2
0.4
0.6
0.8
1
1.2
1.4
0.0E+00 5.0E+03 1.0E+04 1.5E+04 2.0E+04
Vo
l Bri
ne
En
trai
ne
d/V
ol
Bri
ne
Flo
we
d
Re_Jet
3/8"
1/4"
1/8"
39
Figure 18. Time required for the unstable black-brine-in-oil interface to return to its original height (before the flow test was begun) normalized by the time during which brine was pumped through the oil layer, versus the jet Reynolds number, ReJet (dimensionless).
y = 9E-07x2.0948
R² = 0.9011
1
10
100
1000
10000
1.E+03 1.E+04 1.E+05
Re
cove
ry T
ime
/ F
low
Tim
e
Re_Jet

40
8 BOTTLE TESTS ON ALL SPR OILS
All of the SPR sites conducted bottle tests on downhole-sampled oil samples and raw-intake
water to determine which cavern oils are susceptible to stable emulsion formation. The
downhole oil samples used were previously collected under the existing DynMcDermott
downhole sampling manual (U. S. Department of Energy, 2009) and are stored in refrigerated
storage at Northrup Grumman Corp. Not all cavern oils were tested as DynMcDermott decided
that some caverns have had too extensive oil movements (generally > 15 vol % since the
downhole oil samples were collected) for the downhole samples to be relevant to current
inventories.
For each bottle test, DynMcDermott reports the oil-water interface height versus time, and the
interface height in the bottles before they are shaken. These heights were obtained from ruled
markings affixed to the bottle. From this information we calculated
, (3)
where Ii is the initial oil-water interface height before the bottle is shaken, and If is the oil-water
interface height after the bottle is shaken, measured at different times. The interface height is
read from an external measuring tape affixed to the bottle. Equation (3) is interpreted to be the
fraction of water that remains “held up” in the oil phase. This should not be confused with the
volume fraction of water in the oil phase, as some oil will separate off the top of the emulsion
just as some water separates off the bottom.

41
Figure 19. Asphaltene wt % versus volwater %. Bottle tests on oils that do not have an asphaltene assay are not plotted.
For each of the results reported to us by DynMcDermott we calculated volwater % using equation
(3). A plot of asphaltene wt % versus volwater % is shown in Figure 19. The volwater % and
asphaltene wt % for each cavern are also shown below in Table 10 approximately 3 months after
the tests were begun; Table 11 gives a list of caverns that do not have a bottle test result. Figure
19 shows two populations: a sweet population at lower asphaltene wt %, and a sour population at
higher asphaltene wt %. The majority of those samples with a volwater % above 20 %, are sour
and have a high asphaltene wt %. However there is an outlier, downhole-sampled BM002,
which is a sweet cavern with a low asphaltene wt % and a high volwater %. Bottle tests on oils
that do not have an asphaltene assay are not plotted in Figure 19.
In Appendix B we have included the full table of bottle test results versus time. These results
should be considered when examining drawdowns or delaying workovers on caverns with
shortened/broken hanging strings. Many of the caverns show significant water hold up for the
first several days. We caution the reader that the bottle tests were designed to gauge the stability
of the emulsions, not the time dependent behavior of emulsion separation. Nonetheless, we
believe that they may be a useful guide.
0
0.5
1
1.5
2
2.5
3
3.5
0.0 20.0 40.0 60.0 80.0 100.0
Asp
hal
ten
e w
t %
volwater %
Sour
Sweet

42
Table 10. Bottle test results for downhole-sampled SPR oils reported approximately 3 months after the tests were begun. Here we give volwater %, asphaltene wt %, wax wt %, type of oil (sweet or sour) from SPR site bottle tests, and test duration, organized by site. The asphaltene and wax wt % were obtained from DynMcDermott oil quality data sheets.
Cavern ID Volwater % Asphaltene wt % Wax wt % Sweet/Sour Days since Shaken
BH101 10.9 0.33 0.05 Sweet 97
BH102 0.0 1.02 0.52 Sour 97
BH103 0.0 0.26 0.78 Sweet 97
BH104 3.0 0.35 0.07 Sweet 97
BH105 5.2 0.54 0.46 Sweet 97
BH106 57.5 2.1 0.06 Sour 97
BH107 45.5 2 0.41 Sour 97
BH108 20.0 1.9 0.18 Sour 97
BH109 20.9 1.53 0.06 Sour 97
BH110 0.0 1.76
Sour 97
BH111 0.0 1.57 0.09 Sour 97
BH112 10.1 1.79 0.24 Sour 97
BH113 0.0 1.77 0.26 Sour 97
BH114 0.0 0.37 0.38 Sour 97
BC101 33.3 1.36 0.05 Sour 98
BC17 4.7 1.8 0.08 Sour 98
BC18 0.0 0.38 1.1 Sweet 98
BC19 0.0 1.32 0.1 Sour 98
BC20 0.0 0.58
Sweet 98
BC15 0.0 0.82 0.21 Sour 98
WH006 12.8 1.41 0.16 Sour 94
WH007 0.0 0.23 0.12 Sweet 94
WH008 8.7 0.67
Sour 94
WH009 0.9 0.80 5.8 Sour 94
WH011 6.5 0.76
Sour 94
WH105 0.0 NA NA Sweet 94
WH106 14.3 1.74 0.06 Sour 94
WH108 6.4 0.33 0.26 Sweet 94
WH109 0.0 1.61 0.14 Sour 94
WH110 9.5 0.4 0.31 Sweet 94
WH111 0.0 1.29 0.26 Sour 94
WH112 13.6 1.35 0.18 Sour 94
WH114 0.0 1.23 0.68 Sour 94
WH115 0.0 1.47 0.15 Sour 94
WH116 0.8 NA NA Sweet 94

43
Cavern ID Volwater % Asphaltene wt % Wax wt % Sweet/Sour Days since Shaken
WH117 0.0 1.65 0.1 Sour 94
BM001 40.9 2.0
Sour 84
BM002 45.8 0.4 0.45 Sweet 84
BM004 13.0 0.29
Sweet 84
BM005 0.0 1.99 0.14 Sour 84
BM101 31.8 2.16 0.96 Sour 84
BM102 100.0 1.9
Sour 84
BM103 4.3 2.16
Sour 84
BM104 10.0 1.84
Sour 84
BM105 0.0 2.06
Sour 84
BM106 0.0 0.4
Sweet 84
BM107 14.3 1.69 0.22 Sour 84
BM108 35.0 2.1
Sour 84
BM109 0.0 1.34 0.49 Sour 84
BM110 0.0 3.11 0.14 Sour 84
BM111 0.0 1.63 0.7 Sour 84
BM113 0.0 0.32
Sweet 84
BM114 9.1 0.47 0.24 Sweet 84
BM115 14.3 0.41 0.17 Sweet 84
BM116 0.0 0.33 0.51 Sweet 84
Table 11. List of caverns that do not have a bottle test result. The refrigerated downhole samples for these caverns are no longer considered representative of current oil inventories.
Cavern ID
WH102
WH101
WH104
WH113
WH103
WH107
BM112

44
[This page intentionally blank]

45
9 CONCLUSIONS
We were not able to produce a theoretical description of stable brine-in-crude-oil emulsion
formation in an SPR-like geometry as a function of flow conditions. However we believe that
several pieces of useful information have been obtained. First, brine does not flow straight
through the crude oil into the brine layer. It becomes entrained in the crude-oil layer and
requires time to separate. Second, stable brine-in-crude-oil emulsions have been obtained in an
SPR-like geometry at flow conditions that are far less vigorous than would be encountered in a
real SPR cavern. Third, from the data obtained thus far it seems unlikely that a reasonable flow
rate can be found that would prevent permanent emulsification in a real SPR cavern, if brine
were to flow through a crude-oil layer that is susceptible to permanent emulsion formation.
Fourth, stable emulsions have been found to loosely correlate with sour oils with a high
asphaltene concentration. Fifth, water-based de-emulsifying compounds work well and deserve
further consideration.

46
[This page intentionally blank]

47
REFERENCES
Barenblatt, G. I. Scaling, self-similarity, and intermediate asymptotics. Cambridge Texts in
Applied Mathematics. edited by D. G. Crighton Cambridge, United Kingtom: Cambridge
University Press, 1996.
Eley, D. D., M. J. Hey, and J. D. Symonds. "Emulsions of Water in Asphaltene-Containing Oils;
1. Droplet Size Distribution and Emulsification Rates." Colloids and Surfaces 32 (1988):
87-101.
Fan, Y., S. Simon, and J. Sjoblom. "Chemical Destabilization of Crude Oil Emulsions: Effect of
Nonionic Surfactants as Emulsion Inhibitors." Energy & Fuels 23 (2009): 4575-83.
Fingas, M., and B. FieldHouse. "Studies of the formation process of water-in-oil emulsions."
Marine Pollution Bulletin 47 (2003): 369-96.
Gafonova, O. V., and W. Yarranton. "The Stabilization of Water-in-Hydrocarbon Emulsions by
Asphaltenes and Resins." Journal of Colloid and Interface Science 241 (2001): 469-78.
Goldszal, A., and M. Bourrel. "Demulsification of Crude Oil Emulsions: Correlations to
Microemulsion Phase Behavior." Ind. Eng. Chem. Res. 39 (2000): 2746-51.
Kilpatrick, P. K. "Water-in-Crude Oil Emulsion Stabilization: Review and Unanswered
Questions." Energy & Fuels 26, No. 7 (2012): 4017-26.
Lee, R. F. "Agents Which Promote and Stabilize Water-in-Oil Emulsions." Spill Science &
Technology Bulletin 5, No. 2 (1999): 117-26.
McLean, J. D., and P. K. Kilpatrick. "Effects of Asphaltene Aggregation in model heptane-
toluene mixtures on stability of water-in-oil emulsions." Journal of Colloid and Interface
Science 196 (1997): 23-24.
Nemer, M., and D. Lord, Emulsions from Raw Water Injection Through Broken Hanging String,
March 31'st, 2008 Progress Report for Subtask 2.3, Sandia National Laboratories,
Carlsbad, NM 2008.
Pena, A. A., G. J. Hirasaki, and C. A. Miller. "Chemically Induced Destabilization of Water-in-
Crude Oil Emulsions." Ind. Eng. Chem. Res. 44 (2005): 1139-49.
Poindexter, M. K., S. Chuai, R. A. Marble, and M. S. C. "Solid Content Dominates Emulsion
Stability Predictions." Energy and Fuels 19 (2005): 1346-52.
Sjoblom, J., O. Urdahl, K. G. Nordli Borve, M. Li, J. O. Saeten, A. A. Christy, and T. Gu.
"Stabilization and Destabilization of Water-in-Crude Oil Emulsions from the Norwegian
Continental Shelf. Correlation with Model Systems.". Advances in Colloid and Interface
Science 41 (1992): 241-71.
48
Spiecker, P. M., K. L. Gawrys, C. B. Trail, and P. K. Kilpatrick. "Effects of petroleum resins on
asphaltene aggregation and water-in-oil emulsion formation." Colloids and Surfaces A:
Physiochem. Eng. Aspects 220 (2003): 9-27.
Thompson, D. G., A. S. Taylor, and D. E. Graham. "Emulsification and Demulsification Related
to Crude Oil Production." Colloids and Surfaces 15 (1985): 175-89.
U. S. Department of Energy, Crude Oil Quality Program and Test Criteria, SPRPMO O 413.1C
Chg 1. Strategic Petroleum Reserve, New Orleans, LA 2004.
U. S. Department of Energy, DOE Manual SPRPMO M 413.1-1A, Crude Oil Quality Program
and Test Criteria Manual, DOE, New Orleans, LA 2009.

49
APPENDIX A. COMPLETE OIL BLENDING EXPERIMENTAL DATA
Table 12. Raw data from the blended oil experiments.
Oil A Oil B Oil A + Oil B Oil + Brine Free Oil Time
Between Mixing
and
Sample ID Vol. (mL)
Asphaltene (wt %)
Sample ID Vol (mL)
Asphaltene (wt %)
Asphaltene (wt %)
Visual Separation
(g) Free Oil Weighing
(Hrs.)
CAV106 A 3 3.1 CAV101A 12 1.2 1.58 Yes - Max Separation
11.76 330.5
CAV106 A 3.5 3.1 CAV101A 11.5 1.2 1.64 No 6.36 305.5
CAV106 A 4 3.1 CAV101A 11 1.2 1.71 No 9.14 307.25
CAV106 A 5 3.1 CAV101A 10 1.2 1.83 No 7.81 359
CAV106 A 5 3.1 CAV101A 10 1.2 1.83 No 7.48 358.5
CAV106 A 10 3.1 CAV101A 5 1.2 2.47 No 7.58 359.25
CAV106 A 10 3.1 CAV101A 5 1.2 2.47 No 7.23 359
CAV106 A 1 3.1 CAV105A 14 1.1 1.23
CAV106 A 2 3.1 CAV105A 13 1.1 1.37
CAV106 A 3 3.1 CAV105A 12 1.1 1.50 Yes - Min Separation
8.09 71
CAV106 A 4 3.1 CAV105A 11 1.1 1.63 Yes - Min Separation
7.96 70.5
CAV106 A 5 3.1 CAV105A 10 1.1 1.77 No 7.08 71.75
CAV106 A 6 3.1 CAV105A 9 1.1 1.90 No 7.56 71.75
CAV108A 1 3.1 CAV102A 14 1.7 1.79 Yes - Max Separation
12.14 21
CAV108A 2 3.1 CAV102A 13 1.7 1.89 Yes - Max Separation
10.73 20.25
CAV108A 3 3.1 CAV102A 12 1.7 1.98 Yes - Modest
Separate
10.27 66

50
Oil A Oil B Oil A + Oil B Oil + Brine Free Oil Time Between Mixing
and
Sample ID Vol. (mL)
Asphaltene (wt %)
Sample ID Vol (mL)
Asphaltene (wt %)
Asphaltene (wt %)
Visual Separation
(g) Free Oil Weighing
(Hrs.)
CAV108A 4 3.1 CAV102A 11 1.7 2.07 Yes - Modest
Separate
10.16 20
CAV108A 5 3.1 CAV102A 10 1.7 2.17 Yes - Modest
Separate
10.2 17.5
CAV108A 6 3.1 CAV102A 9 1.7 2.26 Yes - Modest
Separate
9.96 17.5
CAV108A 7 3.1 CAV102A 8 1.7 2.35 Yes- Modest
Separate
CAV108A 9 3.1 CAV102A 6 1.7 2.54 Yes-Minimum
Separation
CAV108A 4 3.1 CAV103A 11 0.9 1.49 Yes - Max Separation
10.7 72
CAV108A 4.5 3.1 CAV103A 10.5 0.9 1.56 Yes - Modest
Separate
11.58 71
CAV108A 5 3.1 CAV103A 10 0.9 1.63 Yes - Modest
Separate
10.25 71.75
CAV108A 5.5 3.1 CAV103A 9.5 0.9 1.71 Yes - Min Separation
10.3 66.5
CAV108A 6 3.1 CAV103A 9 0.9 1.78 Yes - Min Separation
10.42 66
CAV108A 7 3.1 CAV103A 8 0.9 1.93
CAV108A 8 3.1 CAV103A 7 0.9 2.07
CAV108A 9 3.1 CAV103A 6 0.9 2.22
CAV108A 1 3.1 CAV105A 14 1.1 1.23
CAV108A 2 3.1 CAV105A 13 1.1 1.37

51
Oil A Oil B Oil A + Oil B Oil + Brine Free Oil Time Between Mixing
and
Sample ID Vol. (mL)
Asphaltene (wt %)
Sample ID Vol (mL)
Asphaltene (wt %)
Asphaltene (wt %)
Visual Separation
(g) Free Oil Weighing
(Hrs.)
CAV108A 3 3.1 CAV105A 12 1.1 1.50 Yes - Min Separation
8.29 72
CAV108A 4 3.1 CAV105A 11 1.1 1.63 Yes - Min Separation
7.82 71.75
CAV108A 5 3.1 CAV105A 10 1.1 1.77 Yes - Min Separation
7.91 71.25
CAV108A 6 3.1 CAV105A 9 1.1 1.90 No 7.72 71.25
CAV111A 6 2.4 CAV103A 9 0.9 1.50 Yes - Min Separation
12.59 68
CAV111A 8 2.4 CAV103A 7 0.9 1.70 No 9.56 19.75
CAV111A 9 2.4 CAV103A 6 0.9 1.80 No 8.49 19.5
CAV111A 10 2.4 CAV103A 5 0.9 1.90 No 9.37 19.5

52
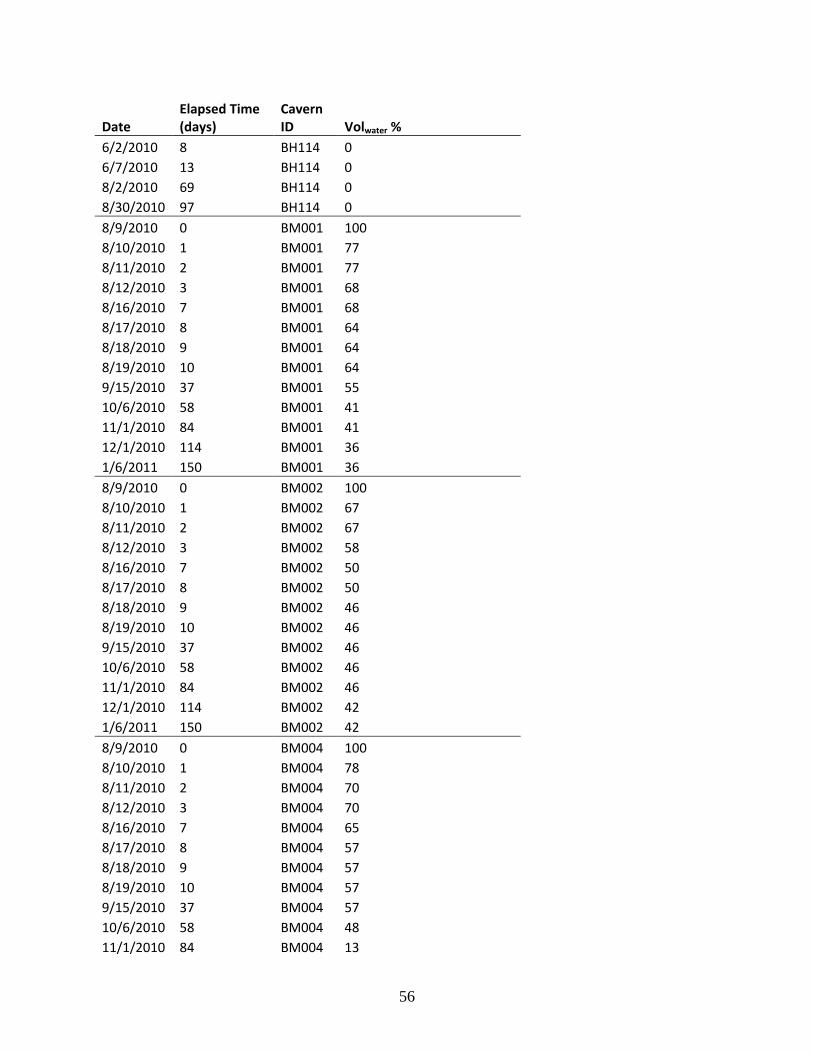
APPENDIX B: FULL DOWNHOLE-SAMPLED CRUDE OIL BOTTLE TEST RESULTS WITH TIME
Shown below are the bottle test results for all SPR downhole-sampled oils tested. The date
column refers to the date a measurement was made, elapsed time is the time (days) from when
the bottle was shaken, cavern id is self-explanatory, and volwater % is given by Equation (3).
Date Elapsed Time (days)
Cavern ID Volwater %
5/25/2010 0 BC15 100
5/27/2010 2 BC15 7
6/3/2010 9 BC15 2
6/7/2010 13 BC15 0
8/4/2010 71 BC15 0
8/30/2010 97 BC15 0
5/24/2010 0 BC17 100
5/25/2010 1 BC 17 37
5/27/2010 3 BC17 19
6/3/2010 10 BC17 16
6/7/2010 14 BC17 12
8/4/2010 72 BC17 9
8/30/2010 98 BC 17 5
5/24/2010 0 BC18 2
5/25/2010 1 BC18 0
5/27/2010 3 BC18 0
6/1/2010 8 BC18 0
6/2/2010 9 BC18 0
6/3/2010 10 BC18 0
6/7/2010 14 BC18 0
8/4/2010 72 BC18 0
8/30/2010 98 BC18 0
5/24/2010 0 BC19 2
5/25/2010 1 BC19 0
5/27/2010 3 BC19 0
6/1/2010 8 BC19 0
6/2/2010 9 BC19 0
6/3/2010 10 BC19 0
6/7/2010 14 BC19 0
8/4/2010 72 BC19 0
8/30/2010 98 BC19 0
5/24/2010 0 BC20 4
5/25/2010 1 BC20 0
5/27/2010 3 BC20 0

53
Date Elapsed Time (days)
Cavern ID Volwater %
6/1/2010 8 BC20 0
6/2/2010 9 BC20 0
6/3/2010 10 BC20 0
6/7/2010 14 BC20 0
8/4/2010 72 BC20 0
8/30/2010 98 BC20 0
5/24/2010 0 BC101 100
5/25/2010 1 BC101 100
5/27/2010 3 BC101 100
6/1/2010 8 BC101 81
6/2/2010 9 BC101 57
6/3/2010 10 BC101 52
6/7/2010 14 BC101 48
8/4/2010 72 BC101 38
8/30/2010 98 BC101 33
5/25/2010 0 BH101 17
5/25/2010 0 BH101 2
5/27/2010 2 BH101 9
6/1/2010 7 BH101 11
6/2/2010 8 BH101 11
6/7/2010 13 BH101 9
8/2/2010 69 BH101 13
8/30/2010 97 BH101 11
5/25/2010 0 BH102 100
5/26/2010 1 BH102 5
5/27/2010 2 BH102 14
6/1/2010 7 BH102 0
6/2/2010 8 BH102 1
6/7/2010 13 BH102 0
8/2/2010 69 BH102 1
8/30/2010 97 BH102 0
5/25/2010 0 BH103 15
5/26/2010 1 BH103 2
5/27/2010 2 BH103 1
6/1/2010 7 BH103 2
6/2/2010 8 BH103 1
6/7/2010 13 BH103 1
8/2/2010 69 BH103 2
8/30/2010 97 BH103 0
5/25/2010 0 BH104 9
5/26/2010 1 BH104 3

54
Date Elapsed Time (days)
Cavern ID Volwater %
5/27/2010 2 BH104 3
6/1/2010 7 BH104 3
6/2/2010 8 BH104 0
6/7/2010 13 BH104 3
8/2/2010 69 BH104 7
8/30/2010 97 BH104 3
5/25/2010 0 BH105 13
5/26/2010 1 BH105 7
5/27/2010 2 BH105 7
6/1/2010 7 BH105 5
6/2/2010 8 BH105 2
6/7/2010 13 BH105 2
8/2/2010 69 BH105 5
8/30/2010 97 BH105 5
5/25/2010 0 BH106 100
5/26/2010 1 BH106 100
5/27/2010 2 BH106 100
6/1/2010 7 BH106 36
6/2/2010 8 BH106 65
6/7/2010 13 BH106 60
8/2/2010 69 BH106 58
8/30/2010 97 BH106 58
5/25/2010 0 BH107 100
5/26/2010 1 BH107 100
5/27/2010 2 BH107 100
6/1/2010 7 BH107 100
6/2/2010 8 BH107 100
6/7/2010 13 BH107 68
8/2/2010 69 BH107 49
8/30/2010 97 BH107 45
5/25/2010 0 BH108 100
5/26/2010 1 BH108 69
5/27/2010 2 BH108 62
6/1/2010 7 BH108 36
6/2/2010 8 BH108 40
6/7/2010 13 BH108 49
8/2/2010 69 BH108 34
8/30/2010 97 BH108 20
5/25/2010 0 BH109 100
5/26/2010 1 BH109 72
5/27/2010 2 BH109 70

55
Date Elapsed Time (days)
Cavern ID Volwater %
6/1/2010 7 BH109 44
6/2/2010 8 BH109 37
6/7/2010 13 BH109 33
8/2/2010 69 BH109 23
8/30/2010 97 BH109 21
5/25/2010 0 BH110 0
5/26/2010 1 BH110 0
5/27/2010 2 BH110 0
6/1/2010 7 BH110 0
6/2/2010 8 BH110 0
6/7/2010 13 BH110 0
8/2/2010 69 BH110 0
8/30/2010 97 BH110 0
5/25/2010 0 BH111 100
5/26/2010 1 BH111 36
5/27/2010 2 BH111 20
6/1/2010 7 BH111 8
6/2/2010 8 BH111 3
6/7/2010 13 BH111 0
8/2/2010 69 BH111 0
8/30/2010 97 BH111 0
5/25/2010 0 BH112 100
5/26/2010 1 BH112 63
5/27/2010 2 BH112 46
6/1/2010 7 BH112 23
6/2/2010 8 BH112 22
6/7/2010 13 BH112 18
8/2/2010 69 BH112 10
8/30/2010 97 BH112 10
5/25/2010 0 BH113 100
5/26/2010 1 BH113 69
5/27/2010 2 BH113 54
6/1/2010 7 BH113 18
6/2/2010 8 BH113 15
6/7/2010 13 BH113 13
8/2/2010 69 BH113 0
8/30/2010 97 BH113 0
5/25/2010 0 BH114 23
5/26/2010 1 BH114 2
5/27/2010 2 BH114 6
6/1/2010 7 BH114 0
56
Date Elapsed Time (days)
Cavern ID Volwater %
6/2/2010 8 BH114 0
6/7/2010 13 BH114 0
8/2/2010 69 BH114 0
8/30/2010 97 BH114 0
8/9/2010 0 BM001 100
8/10/2010 1 BM001 77
8/11/2010 2 BM001 77
8/12/2010 3 BM001 68
8/16/2010 7 BM001 68
8/17/2010 8 BM001 64
8/18/2010 9 BM001 64
8/19/2010 10 BM001 64
9/15/2010 37 BM001 55
10/6/2010 58 BM001 41
11/1/2010 84 BM001 41
12/1/2010 114 BM001 36
1/6/2011 150 BM001 36
8/9/2010 0 BM002 100
8/10/2010 1 BM002 67
8/11/2010 2 BM002 67
8/12/2010 3 BM002 58
8/16/2010 7 BM002 50
8/17/2010 8 BM002 50
8/18/2010 9 BM002 46
8/19/2010 10 BM002 46
9/15/2010 37 BM002 46
10/6/2010 58 BM002 46
11/1/2010 84 BM002 46
12/1/2010 114 BM002 42
1/6/2011 150 BM002 42
8/9/2010 0 BM004 100
8/10/2010 1 BM004 78
8/11/2010 2 BM004 70
8/12/2010 3 BM004 70
8/16/2010 7 BM004 65
8/17/2010 8 BM004 57
8/18/2010 9 BM004 57
8/19/2010 10 BM004 57
9/15/2010 37 BM004 57
10/6/2010 58 BM004 48
11/1/2010 84 BM004 13

57
Date Elapsed Time (days)
Cavern ID Volwater %
12/1/2010 114 BM004 4
1/6/2011 150 BM004 4
8/9/2010 0 BM005 100
8/10/2010 1 BM005 100
8/11/2010 2 BM005 85
8/12/2010 3 BM005 85
8/16/2010 7 BM005 75
8/17/2010 8 BM005 65
8/18/2010 9 BM005 60
8/19/2010 10 BM005 60
9/15/2010 37 BM005 60
10/6/2010 58 BM005 25
11/1/2010 84 BM005 0
12/1/2010 114 BM005 0
1/6/2011 150 BM005 0
8/9/2010 0 BM101 100
8/10/2010 1 BM101 77
8/11/2010 2 BM101 55
8/12/2010 3 BM101 50
8/16/2010 7 BM101 41
8/17/2010 8 BM101 41
8/18/2010 9 BM101 36
8/19/2010 10 BM101 36
9/15/2010 37 BM101 32
10/6/2010 58 BM101 27
11/1/2010 84 BM101 32
12/1/2010 114 BM101 27
1/6/2011 150 BM101 27
8/9/2010 0 BM102 100
8/10/2010 1 BM102 100
8/11/2010 2 BM102 100
8/12/2010 3 BM102 100
8/16/2010 7 BM102 100
8/17/2010 8 BM102 100
8/18/2010 9 BM102 100
8/19/2010 10 BM102 100
9/15/2010 37 BM102 100
10/6/2010 58 BM102 100
11/1/2010 84 BM102 100
12/1/2010 114 BM102 100
1/6/2011 150 BM102 100

58
Date Elapsed Time (days)
Cavern ID Volwater %
8/9/2010 0 BM103 100
8/10/2010 1 BM103 100
8/11/2010 2 BM103 100
8/12/2010 3 BM103 100
8/16/2010 7 BM103 100
8/17/2010 8 BM103 100
8/18/2010 9 BM103 100
8/19/2010 10 BM103 100
9/15/2010 37 BM103 100
10/6/2010 58 BM103 43
11/1/2010 84 BM103 4
12/1/2010 114 BM103 4
1/6/2011 150 BM103 4
8/9/2010 0 BM104 100
8/10/2010 1 BM104 60
8/11/2010 2 BM104 40
8/12/2010 3 BM104 30
8/16/2010 7 BM104 20
8/17/2010 8 BM104 15
8/18/2010 9 BM104 10
8/19/2010 10 BM104 10
9/15/2010 37 BM104 10
10/6/2010 58 BM104 10
11/1/2010 84 BM104 10
12/1/2010 114 BM104 10
1/6/2011 150 BM104 10
8/9/2010 0 BM105 100
8/10/2010 1 BM105 100
8/11/2010 2 BM105 100
8/12/2010 3 BM105 75
8/16/2010 7 BM105 65
8/17/2010 8 BM105 65
8/18/2010 9 BM105 65
8/19/2010 10 BM105 65
9/15/2010 37 BM105 35
10/6/2010 58 BM105 5
11/1/2010 84 BM105 0
12/1/2010 114 BM105 0
1/6/2011 150 BM105 0
8/9/2010 0 BM106 100
8/10/2010 1 BM106 0

59
Date Elapsed Time (days)
Cavern ID Volwater %
8/11/2010 2 BM106 0
8/12/2010 3 BM106 0
8/16/2010 7 BM106 0
8/17/2010 8 BM106 0
8/18/2010 9 BM106 0
8/19/2010 10 BM106 0
9/15/2010 37 BM106 0
10/6/2010 58 BM106 0
11/1/2010 84 BM106 0
12/1/2010 114 BM106 0
1/6/2011 150 BM106 0
8/9/2010 0 BM107 100
8/10/2010 1 BM107 100
8/11/2010 2 BM107 100
8/12/2010 3 BM107 100
8/16/2010 7 BM107 100
8/17/2010 8 BM107 100
8/19/2010 10 BM107 100
9/15/2010 37 BM107 100
10/6/2010 58 BM107 29
11/1/2010 84 BM107 14
12/1/2010 114 BM107 10
1/6/2011 150 BM107 5
8/9/2010 0 BM108 100
8/10/2010 1 BM108 100
8/11/2010 2 BM108 100
8/12/2010 3 BM108 100
8/16/2010 7 BM108 100
8/17/2010 8 BM108 100
8/19/2010 10 BM108 100
9/15/2010 37 BM108 100
10/6/2010 58 BM108 75
11/1/2010 84 BM108 35
12/1/2010 114 BM108 35
1/6/2011 150 BM108 25
8/9/2010 0 BM109 100
8/10/2010 1 BM109 5
8/11/2010 2 BM109 0
8/12/2010 3 BM109 0
8/16/2010 7 BM109 0
8/17/2010 8 BM109 0
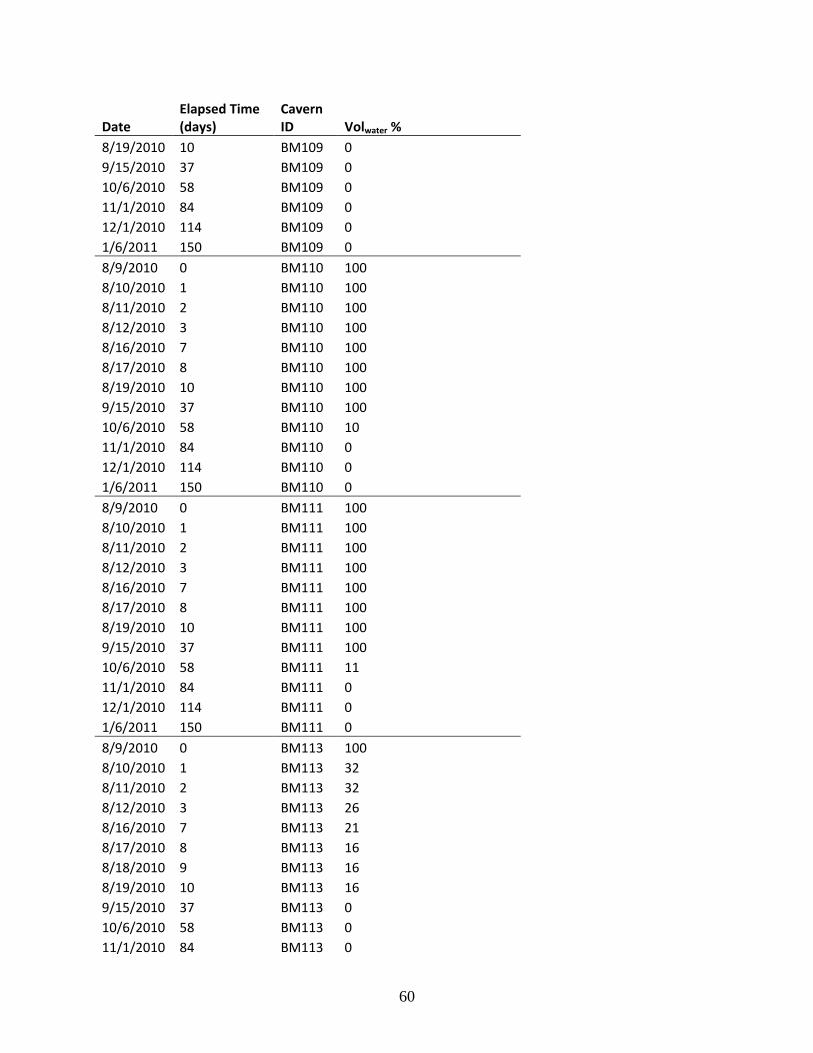
60
Date Elapsed Time (days)
Cavern ID Volwater %
8/19/2010 10 BM109 0
9/15/2010 37 BM109 0
10/6/2010 58 BM109 0
11/1/2010 84 BM109 0
12/1/2010 114 BM109 0
1/6/2011 150 BM109 0
8/9/2010 0 BM110 100
8/10/2010 1 BM110 100
8/11/2010 2 BM110 100
8/12/2010 3 BM110 100
8/16/2010 7 BM110 100
8/17/2010 8 BM110 100
8/19/2010 10 BM110 100
9/15/2010 37 BM110 100
10/6/2010 58 BM110 10
11/1/2010 84 BM110 0
12/1/2010 114 BM110 0
1/6/2011 150 BM110 0
8/9/2010 0 BM111 100
8/10/2010 1 BM111 100
8/11/2010 2 BM111 100
8/12/2010 3 BM111 100
8/16/2010 7 BM111 100
8/17/2010 8 BM111 100
8/19/2010 10 BM111 100
9/15/2010 37 BM111 100
10/6/2010 58 BM111 11
11/1/2010 84 BM111 0
12/1/2010 114 BM111 0
1/6/2011 150 BM111 0
8/9/2010 0 BM113 100
8/10/2010 1 BM113 32
8/11/2010 2 BM113 32
8/12/2010 3 BM113 26
8/16/2010 7 BM113 21
8/17/2010 8 BM113 16
8/18/2010 9 BM113 16
8/19/2010 10 BM113 16
9/15/2010 37 BM113 0
10/6/2010 58 BM113 0
11/1/2010 84 BM113 0

61
Date Elapsed Time (days)
Cavern ID Volwater %
12/1/2010 114 BM113 0
1/6/2011 150 BM113 0
8/9/2010 0 BM114 100
8/10/2010 1 BM114 100
8/11/2010 2 BM114 100
8/12/2010 3 BM114 100
8/16/2010 7 BM114 100
8/17/2010 8 BM114 100
8/19/2010 10 BM114 100
9/15/2010 37 BM114 100
10/6/2010 58 BM114 32
11/1/2010 84 BM114 9
12/1/2010 114 BM114 9
1/6/2011 150 BM114 9
8/9/2010 0 BM115 100
8/10/2010 1 BM115 100
8/11/2010 2 BM115 76
8/12/2010 3 BM115 62
8/16/2010 7 BM115 62
8/17/2010 8 BM115 62
8/19/2010 10 BM115 62
9/15/2010 37 BM115 52
10/6/2010 58 BM115 43
11/1/2010 84 BM115 14
12/1/2010 114 BM115 10
1/6/2011 150 BM115 5
8/9/2010 0 BM116 32
8/10/2010 1 BM116 0
8/11/2010 2 BM116 0
8/12/2010 3 BM116 0
8/16/2010 7 BM116 0
8/17/2010 8 BM116 0
8/18/2010 9 BM116 0
8/19/2010 10 BM116 0
9/15/2010 37 BM116 0
10/6/2010 58 BM116 0
11/1/2010 84 BM116 0
12/1/2010 114 BM116 0
1/6/2011 150 BM116 0
5/24/2010 0 WH006 100
5/25/2010 1 WH006 38

62
Date Elapsed Time (days)
Cavern ID Volwater %
5/26/2010 2 WH006 26
5/27/2010 3 WH006 26
6/1/2010 8 WH006 6
6/2/2010 9 WH006 9
6/3/2010 10 WH006 6
6/29/2010 36 WH006 15
8/26/2010 94 WH006 13
5/24/2010 0 WH007 2
5/25/2010 1 WH007 0
5/26/2010 2 WH007 0
5/27/2010 3 WH007 0
6/1/2010 8 WH007 0
6/2/2010 9 WH007 0
6/3/2010 10 WH007 0
6/29/2010 36 WH007 0
8/26/2010 94 WH007 0
5/24/2010 0 WH008 100
5/25/2010 1 WH008 61
5/26/2010 2 WH008 52
5/27/2010 3 WH008 51
6/1/2010 8 WH008 20
6/2/2010 9 WH008 24
6/3/2010 10 WH008 20
7/29/2010 66 WH008 9
8/26/2010 94 WH008 9
5/24/2010 0 WH009 100
5/25/2010 1 WH009 32
5/26/2010 2 WH009 21
5/27/2010 3 WH009 13
6/1/2010 8 WH009 11
6/2/2010 9 WH009 0
6/3/2010 10 WH009 0
7/29/2010 66 WH009 2
8/26/2010 94 WH009 1
5/24/2010 0 WH011 100
5/25/2010 1 WH011 13
5/26/2010 2 WH011 9
5/27/2010 3 WH011 15
6/1/2010 8 WH011 4
6/2/2010 9 WH011 2
6/3/2010 10 WH011 2

63
Date Elapsed Time (days)
Cavern ID Volwater %
6/29/2010 36 WH011 7
8/26/2010 94 WH011 7
5/24/2010 0 WH105 0
5/25/2010 1 WH105 0
5/26/2010 2 WH105 0
5/27/2010 3 WH105 0
6/1/2010 8 WH105 0
6/2/2010 9 WH105 0
6/3/2010 10 WH105 0
6/29/2010 36 WH105 0
8/26/2010 94 WH105 0
5/24/2010 0 WH106 100
5/25/2010 1 WH106 76
5/26/2010 2 WH106 67
5/27/2010 3 WH106 61
6/1/2010 8 WH106 14
6/2/2010 9 WH106 14
6/3/2010 10 WH106 14
7/29/2010 66 WH106 14
8/26/2010 94 WH106 14
5/24/2010 0 WH108 100
5/25/2010 1 WH108 36
5/26/2010 2 WH108 51
5/27/2010 3 WH108 30
6/1/2010 8 WH108 5
6/2/2010 9 WH108 4
6/3/2010 10 WH108 4
7/29/2010 66 WH108 6
8/26/2010 94 WH108 6
5/24/2010 0 WH109 4
5/25/2010 1 WH109 0
5/26/2010 2 WH109 0
5/27/2010 3 WH109 1
6/1/2010 8 WH109 0
6/2/2010 9 WH109 0
6/3/2010 10 WH109 0
7/29/2010 66 WH109 1
8/26/2010 94 WH109 0
5/24/2010 0 WH110 100
5/25/2010 1 WH110 1
5/26/2010 2 WH110 0
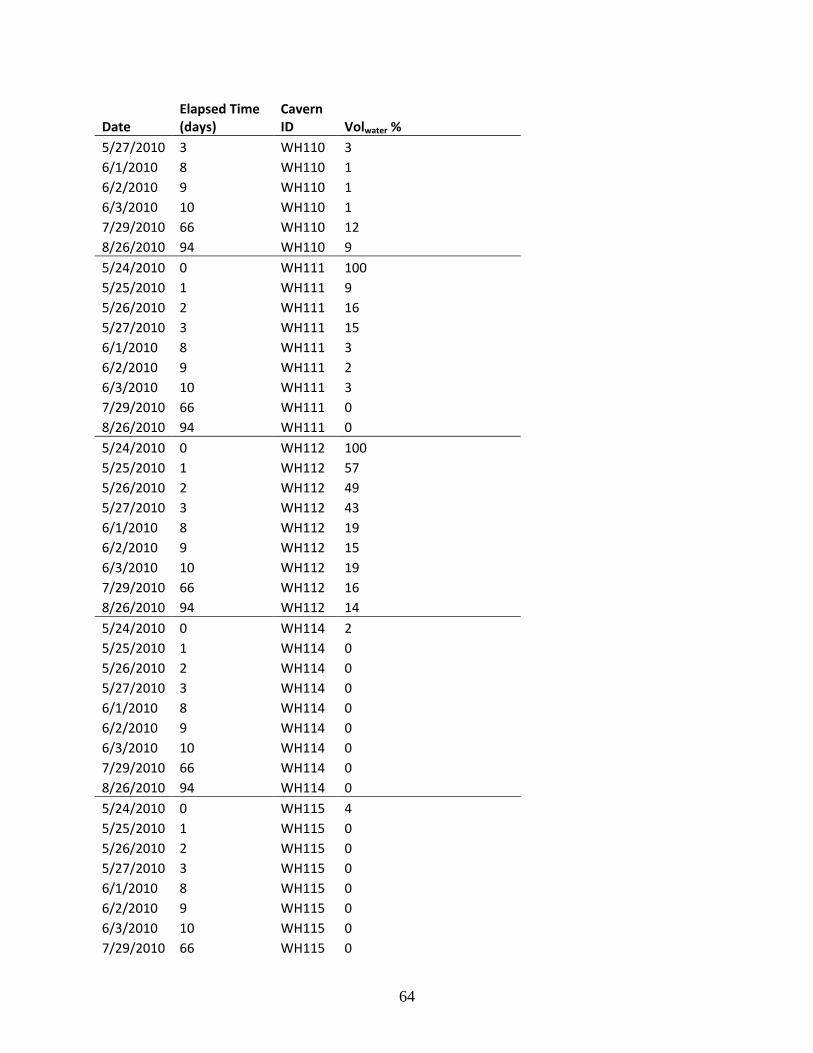
64
Date Elapsed Time (days)
Cavern ID Volwater %
5/27/2010 3 WH110 3
6/1/2010 8 WH110 1
6/2/2010 9 WH110 1
6/3/2010 10 WH110 1
7/29/2010 66 WH110 12
8/26/2010 94 WH110 9
5/24/2010 0 WH111 100
5/25/2010 1 WH111 9
5/26/2010 2 WH111 16
5/27/2010 3 WH111 15
6/1/2010 8 WH111 3
6/2/2010 9 WH111 2
6/3/2010 10 WH111 3
7/29/2010 66 WH111 0
8/26/2010 94 WH111 0
5/24/2010 0 WH112 100
5/25/2010 1 WH112 57
5/26/2010 2 WH112 49
5/27/2010 3 WH112 43
6/1/2010 8 WH112 19
6/2/2010 9 WH112 15
6/3/2010 10 WH112 19
7/29/2010 66 WH112 16
8/26/2010 94 WH112 14
5/24/2010 0 WH114 2
5/25/2010 1 WH114 0
5/26/2010 2 WH114 0
5/27/2010 3 WH114 0
6/1/2010 8 WH114 0
6/2/2010 9 WH114 0
6/3/2010 10 WH114 0
7/29/2010 66 WH114 0
8/26/2010 94 WH114 0
5/24/2010 0 WH115 4
5/25/2010 1 WH115 0
5/26/2010 2 WH115 0
5/27/2010 3 WH115 0
6/1/2010 8 WH115 0
6/2/2010 9 WH115 0
6/3/2010 10 WH115 0
7/29/2010 66 WH115 0

65
Date Elapsed Time (days)
Cavern ID Volwater %
8/26/2010 94 WH115 0
5/24/2010 0 WH116 6
5/25/2010 1 WH116 2
5/26/2010 2 WH116 2
5/27/2010 3 WH116 4
6/1/2010 8 WH116 2
6/2/2010 9 WH116 2
6/3/2010 10 WH116 1
7/29/2010 66 WH116 1
8/26/2010 94 WH116 1
5/24/2010 0 WH117 100
5/25/2010 1 WH117 8
5/26/2010 2 WH117 6
5/27/2010 3 WH117 8
6/1/2010 8 WH117 0
6/2/2010 9 WH117 0
6/3/2010 10 WH117 0
7/29/2010 66 WH117 1
8/26/2010 94 WH117 0

66
APPENDIX C: NEW MEXICO TECH REPORT
Properties of Sandia Oil Samples
Tianguang Fan and Jill Buckley
NM Petroleum Recovery Research Center
New Mexico Tech
5 October 2007
SAMPLES Ten crude oil samples and eleven water samples were received for testing from Sandia on
August 24, 2007. Each sample consisted of approximately 1 liter of fluid in a clear glass bottle
with screw-on cap. Identifying information from the labels is summarized in Table 1.
Table 1. Identification of Oil and Water Samples
Oil from ID # Bottle # Type
101 C101 BH070822-001 5232 swt
102 C102 BH070822-005 5236 swt
103 Cav 103A BH070822-009 5240 swt
104 Cav 104A BH070822-013 5244 swt
105 Cav 105A BH070822-018 5249 swt
106 Cav 106A BH070822-019 5250 sour
107 Cav 107A BH070822-024 5255 sour
108 Cav 108A BH070822-028 5259 sour
111 Cav 111A BH070822-036 5267 sour
112 Cav 112 BH070822-040 5271 sour
Water from ID # Bottle # Type
101 C101 BH070822-003 5234 brine
102 Cav 102B BH070822-007 5238 brine
103 Cav 103B BH070822-011 5242 brine
104 Cav 104B BH070822-015 5246 brine
106 Cav 106B BH070822-021 5253 brine
107 Cav 107B BH070822-026 5257 brine
108 Cav 108B BH070822-030 5261 brine
111 Cav 111B BH070822-038 5269 brine
112 Cav 112B BH070822-042 5273 brine
Raw-1 raw water intake BH070822-049 5280 raw water
Raw-2 raw water intake BH070822-050 5281 raw water
EXPERIMENTAL METHODS Physical Properties
Oil density and viscosity were measured over a small temperature range, from 20 to 30ºC
using an Anton-Paar SVM 3000 Stabinger viscometer. Water sample density and pH were
measured at 25ºC. Refractive index of each oil sample was measured at 20ºC using a GPR 11-37

67
automatic refractometer from Index Instruments. API gravity is calculated from the density at
20ºC using a standard temperature correction.
Chemical Characteristics
Acid and base numbers are measured by non-aqueous potentiometric titration using
variations of the standard ASTM techniques (ASTM D664-01; ASTM D2896-98). A known
amount of an organic base is used to force an endpoint for base number measurements, as first
described by Dubey and Doe (1993). Adaptations to the acid number measurements, including
spiking with stearic acid, are described in a recent paper by Fan and Buckley (2007).
Separation of crude oil into solubility fractions known as SARA (for saturates, aromatics,
resins and asphaltenes) is based on the standard chromatographic method described in ASTM
D2007-93. The method has been adapted to use an HPLC as described by Fan and Buckley
(2002).
Interfacial Tensions
Interfacial tensions (IFT) between crude oil samples and their respective brines were
measured using a pendant drop apparatus and software from DataPhysics (model OCA20 with
SCA20 software). Measurement details are described in Buckley and Fan (2007). IFT of each
of the oil samples was also measured with one of the raw water intake samples (Raw-1). The
data were fit to an equation of the form: /)( t
eqoeq e
where is IFT (mN/m) with subscripts eq=equilibrium, and o=zero time or initial, t is time, is a
characteristic time constant with the same units as time, t. Details and plots of the IFT
measurements are in Sandia-ift.xls.
RESULTS Table 2 summarizes the physical properties measured for oil samples. Those for water
samples are in Table 3. Additional measurements and plots of density and viscosity as a function
of temperature are in the spreadsheet (Sandia-summary.xls).
Table 2. Crude Oil Physical Properties
Oil density at
20ºC (g/cm3) °API
viscosity at 20ºC (cP) RI
101 0.8385 36.6 5.23 1.4707
102 0.8457 35.2 5.82 1.4748
103 0.8408 36.2 5.23 1.4717
104 0.8349 37.4 5.20 1.4693
105 0.8344 38.1 4.96 1.4693
106 0.8618 32.7 10.06 1.4867
107 0.8597 32.5 9.93 1.4858
108 0.8621 32.0 10.17 1.4870
111 0.8535 33.7 7.95 1.4804
112 0.8707 30.4 14.23 1.4911
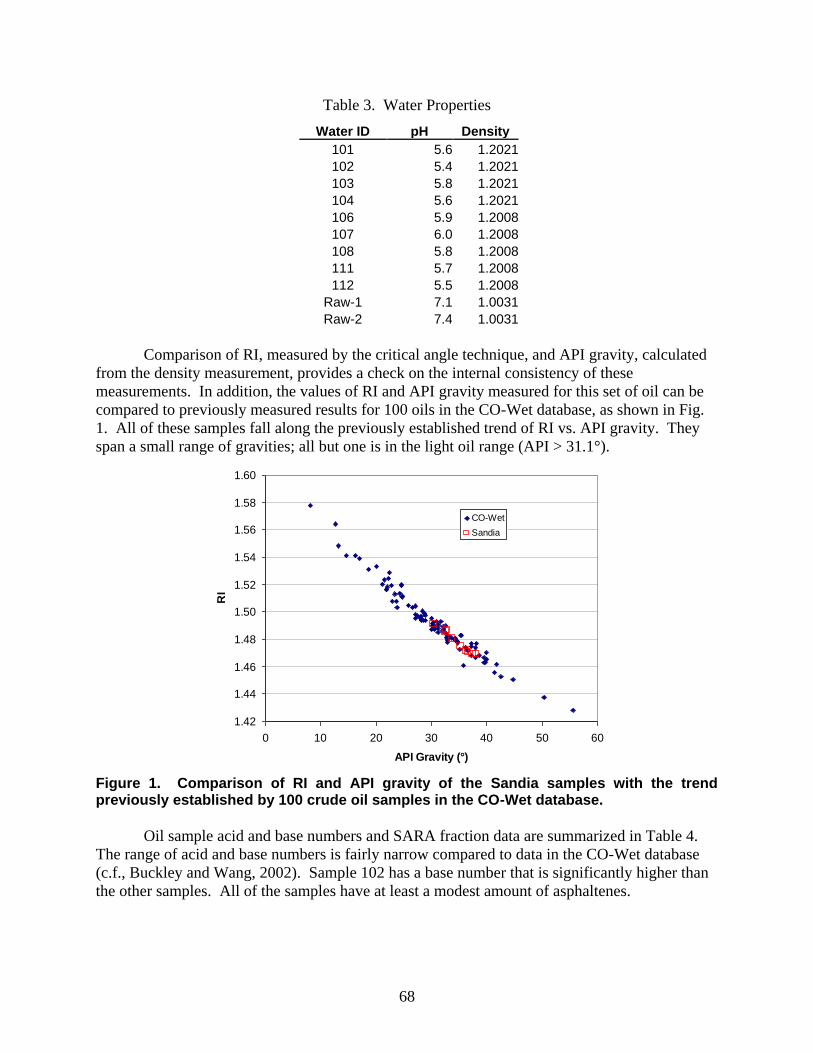
68
Table 3. Water Properties
Water ID pH Density
101 5.6 1.2021
102 5.4 1.2021
103 5.8 1.2021
104 5.6 1.2021
106 5.9 1.2008
107 6.0 1.2008
108 5.8 1.2008
111 5.7 1.2008
112 5.5 1.2008
Raw-1 7.1 1.0031
Raw-2 7.4 1.0031
Comparison of RI, measured by the critical angle technique, and API gravity, calculated
from the density measurement, provides a check on the internal consistency of these
measurements. In addition, the values of RI and API gravity measured for this set of oil can be
compared to previously measured results for 100 oils in the CO-Wet database, as shown in Fig.
1. All of these samples fall along the previously established trend of RI vs. API gravity. They
span a small range of gravities; all but one is in the light oil range (API > 31.1°).
Figure 1. Comparison of RI and API gravity of the Sandia samples with the trend previously established by 100 crude oil samples in the CO-Wet database.
Oil sample acid and base numbers and SARA fraction data are summarized in Table 4.
The range of acid and base numbers is fairly narrow compared to data in the CO-Wet database
(c.f., Buckley and Wang, 2002). Sample 102 has a base number that is significantly higher than
the other samples. All of the samples have at least a modest amount of asphaltenes.
1.42
1.44
1.46
1.48
1.50
1.52
1.54
1.56
1.58
1.60
0 10 20 30 40 50 60
API Gravity (°)
RI
CO-Wet
Sandia

69
Table 4. Crude Oil Chemical Properties
Oil Acid # Base # Saturates Aromatics Resins n-C6
Asphaltenes
mg KOH/g oil wt %
101 0.30 1.56 66.3 19.9 12.6 1.2
102 0.49 2.55 62.2 19.4 16.7 1.7
103 0.43 1.71 64.3 21.4 13.5 0.9
104 0.19 1.47 64.0 21.9 13.0 1.2
105 0.20 1.47 64.5 20.5 13.9 1.1
106 0.28 1.44 59.5 21.3 16.2 3.1
107 0.28 1.46 58.2 21.6 16.8 3.4
108 0.29 1.50 58.3 21.6 17.0 3.1
111 0.43 1.57 59.7 23.8 14.1 2.4
112 0.30 1.65 56.3 21.8 18.9 3.0
Table 5 summarizes the equilibrium interfacial tension data. Each oil was tested with the
brine from the same source, except sample 105 for which there was not a corresponding brine
sample. Brine 104 was used instead. In all cases, the IFT measured with the raw water sample
was lower than that measured with the brine. The difference was 5.5 mN/m on average. Sample
102, which has the highest base number, has the lowest values of IFT with both brine and raw
water. Meaningful statistics relating oil properties to IFT cannot be obtained with this small data
set, especially since the oils are fairly similar in properties.
Table 5. Equilibrated Interfacial Tensions
Oil IFT-brine IFT-raw IFT
mN/m
101 26.5 21.3 5.3
102 22.0 19.0 3.0
103 28.0 20.0 8.0
104 27.0 20.0 7.0
105 26.5* 19.5 7.0
106 28.0 24.5 3.5
107 26.5 20.0 6.5
108 26.5 21.5 5.0
111 27.5 24.0 3.5
112 27.0 21.0 6.0
* measured with 104 brine

70
REFERENCES
ASTM D664-01: “Standard Test Method for Acid Number of Petroleum Products by
Potentiometric Titration,” ASTM (1989).
ASTM D2007-93: “Standard Test Method for Characteristic Groups in Rubber Extender and
Processing Oils by the Clay-Gel Adsorption Chromatographic Method,” ASTM (1993).
ASTM D2896-98: “Standard Test Method for Base Number of Petroleum Products by
Potentiometric Perchloric Acid Titration, ASTM (1998).
Buckley, J.S. and Fan, T.: "Crude Oil/Brine Interfacial Tensions," Petrophysics, (2007) 48, 175-
185.
Buckley, J.S. and Wang, J.X.: "Crude Oil and Asphaltene Characterization for Prediction of
Wetting Alteration," J. Pet. Sci. Eng. (2002) 33, 195-202.
Dubey, S.T. and Doe, P.H.: “Base Number and Wetting Properties of Crude Oils,” SPERE
(Aug. 1993) 8, 195-200.
Fan, T. and Buckley, J.S.: "Rapid and Accurate SARA Analysis of Medium Gravity Crude Oils,"
Energy & Fuels (2002) 16, 1571-1575.
Fan, T. and Buckley, J.S.: "Acid Number Measurements Revisited," paper SPE 99884 presented
at the 2006 SPE IOR Symposium, Tulsa, 22-26 April (accepted for publication in SPEJ, 2007).

71
DISTRIBUTION
External Distribution
Electronic copies to:
Wayne Elias ([email protected]) for distribution to DOE SPR Program
Office, Washington, DC
Diane Willard ([email protected]) for distribution to DOE and DM SPR
Project Management Office, New Orleans, LA
Sandia Distribution
Print copies to:
5 MS0706 David Lord 6912
5 MS0750 Carolyn Kirby 6913
Electronic Copies:
MS0899 Technical Library, 9536 (electronic copy)

72
[This page intentionally blank]