Brighter opportunities beyond the shadow of the dollar Richard Adams – Client Portfolio Manager...
21
Brighter opportunities beyond the shadow of the dollar Richard Adams – Client Portfolio Manager For professional investors only September 2015
-
Upload
hope-marshall -
Category
Documents
-
view
217 -
download
0
Transcript of Brighter opportunities beyond the shadow of the dollar Richard Adams – Client Portfolio Manager...

Brighter opportunities beyond the shadow of the dollarRichard Adams – Client Portfolio ManagerFor professional investors only
September 2015

Learning objectives
Identify macroeconomic factors that can inform investment strategy choices
Understand how rising interest rates might impact the active vs passive debate
Identify areas of US market that may benefit despite dollar strength
2

Brighter opportunities beyond the shadow of the dollar
3
“So far every single person that’s bet against America has lost money, because we always come back.”Bill Clinton, Speech to the Democratic National Convention, 5 September 2012.
Near-term outlook
Strong dollar
Question mark over valuations
Improving consumer spending
Long-term outlook
Most dynamic and innovative economy
Positive demographics
Strong legal, regulatory and corporate governance framework

4
Dollar strength: threat or opportunity?
Impacts
Exporters > importers
Market > economy
Large > small companies
Opportunities
Consumers
Secular themes
Active managers
Overseas investorsSource: Columbia Threadneedle Investments.

Is the US market expensive?
5
Source: Bloomberg, as at 30 June 2015. Source: Bloomberg, as at 30 June 2015.
60 63 66 69 72 75 78 81 84 87 90 93 96 99 02 05 08 11 140
5
10
15
20
25
30
35
S&P 500 trailing 12 month P/E...
Average quarterly level
84 86 88 90 92 94 96 98 00 02 04 06 08 10 12 140%
2%
4%
6%
8%
10%
12%
14%
S&P 500 Earnings Yield US 10 Year Treasury Yield
S&P 500 trailing 12 month P/E ratio Earnings yield vs bond yield

6
Is the US market expensive?
Region Index 2015 P/E 2016 P/E 2015 P/CF 2016 P/CF
United Kingdom FTSE 100 15.1x 13.7x 9.3x 8.5x
Europe MSCI Europe 15.0x 13.7x 8.9x 8.2x
United States S&P 500 16.1x 14.7x 11.3x 10.2x
Japan TOPIX 13.5x 12.4x 7.6x 7.3x
Asia ex Japan MSCI AC Asia ex Japan 11.2x 10.1x 7.4x 6.7x
Source: Bloomberg, as at 8 Sep 2015.

7
Is the US market expensive?
Source: Bloomberg, as at 30 June 2015. Yellow line indicates current CPI vs S&P500 trailing P/E (at 30 June 15).
-2% 0% 2% 4% 6% 8% 10% 12% 14% 16%5
10
15
20
25
30
September 1987
March 1980
June 1971
March 2009
December 1999
CPI vs. S&P500 Trailing P/Es Quarterly data since 1960
CP
I
S&P P/E
8
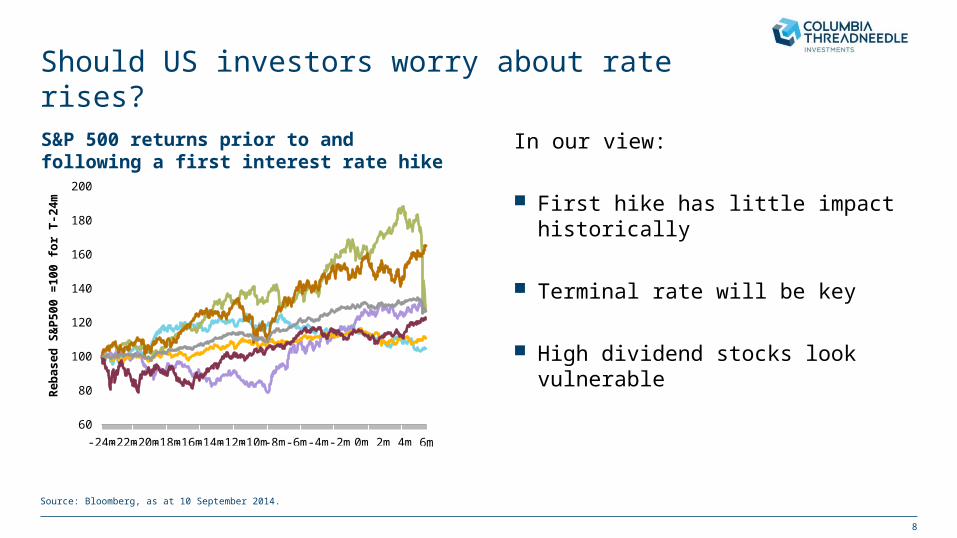
Should US investors worry about rate rises?
In our view:
First hike has little impact historically
Terminal rate will be key
High dividend stocks look vulnerable
Source: Bloomberg, as at 10 September 2014.
-24m-22m-20m-18m-16m-14m-12m-10m-8m-6m-4m-2m 0m 2m 4m 6m60
80
100
120
140
160
180
200
1977 1983 1987 1994 1999
Re
ba
se
d S
&P
50
0 =
10
0 f
or
T-2
4m
S&P 500 returns prior to and following a first interest rate hike

Implications of higher interest ratesVolatility
9
Jun 10 Jun 11 Jun 12 Jun 13 Jun 14 Jun 1550
60
70
80
90
100
110
120
130
140
150
VVIX Index Moving 200 day average
Expectations of rates rises have increased the frequency of market sell-offs
Market panics can create opportunities to invest in “superior” growth companies
Tactical shorting can add alpha
Source: Bloomberg, as at 10 July 2015.
VVIX Index June 2010 to July 2015

10
Implications of higher interest ratesExcess returns
1961 1968 1975 1982 1989 1996 2003 20100
2
4
6
8
10
12
14
16
-30
-20
-10
0
10
20
30
40
50
60
70
80
10-year treasury yieldActive fund excess return (median)
10-y
ear
trea
sury
yie
ld (
%)
Cu
mu
lative excess return
(%)
Treasury yields and cumulative excess returns are 0.91 correlated historically
Higher rates widen differences in corporate profitability
An active stock picking approach can profit
Source: Nomura Securities, as at 31 December 2014.
US active fund excess return vs. rate environment

11
How long will the recovery last?
Source: BEA, Haver Analytics, DB Global Markets Research, as at 30 June 2015.
-4 -3 -2 -1 0 1 2 3 4 5 6 7 8 9 10 11 12 13 14 15 16 17 18 19 20 21 22 2390
95
100
105
110
115
120
125
Average of last 5 cycles Current business cycle
“0” represents the recession end date
Q2 2015
Real GDP (Q1 1958 to Q2 2015, pre-recession peak = 100)

12
A health check on the driver of global growth
90 92 94 96 98 00 02 04 06 08 10 12 1450%
60%
70%
80%
90%
100%
Ho
us
eh
old
de
bt:
GD
P
(%)
Source: Bloomberg, as at 30 June 2015.
Import costs
Energy costsLabour market
Household finances
Dec 13 Mar 14 Jun 14 Sep 14 Dec 14 Mar 15 Jun 155.0
5.5
6.0
6.5
7.0
Un
emp
loym
ent
rate
(%
)
Dec 13 Mar 14 Jul 14 Oct 14 Jan 15 Apr 1575
80
85
90
95
100
105
Do
llar
in
dex
Dec 13 Mar 14 Jul 14 Oct 14 Jan 15 Apr 1540
60
80
100
120
WT
I Cru
de
oil
fu-
ture
s (
$)

13
63 67 71 75 79 83 87 91 95 99 03 07 11 15200
400
600
800
1,000
1,200
1,400
Th
ou
san
ds
Averagemonthly level
US housingA question of supply and demand
Supply side
Stronger bank balance sheets
Relaxation of tight lending standards
Low new home inventories
Demand side
Household formation below trend
Good housing affordability
Improving wages and employment
Source: Lombard Street Research , as at 30 June 2015. The mention of specific stocks is not a recommendation to deal.
Annual US new homes sales

14
Disruptive innovationIdentifying winner and losers
The mention of specific stocks is not a recommendation to deal.
Investment optionsSecular growth of e-commerce

15
Biotechnology R&D renaissance
The mention of specific stocks is not a recommendation to deal.
Recent trends
Advances in statistical techniques
Large pharma less willing to bear R&D risk
Niche treatments offer good pricing power
Specialised stock research is key

16
Demographics are destiny
Source: US Census Bureau, December 2014.The mention of specific stocks is not a recommendation to deal.
Growing workforce
Positive birth rate
Better dependency ratio than most economies
US and China population pyramids for 2015 and 2050

Learning outcomes
Identify how macroeconomic factors can inform investment strategy choices Views on the dollar, volatility, and rates can influence the type of equity strategy investors may prefer
Understand how rising interest rates might impact the active vs passive debate Higher rates can create divergences for active stock pickers to explore
Identify areas of US market that may benefit despite dollar strength Rising consumer incomes Recovering housing market Disruptive innovators Biotechnology R&D renaissance Constructive demographics
17

18
Broad strategy palette with $11bn AuMUS Equities range, Columbia Threadneedle Investments (EMEA)
Source: Columbia Threadneedle Investments, as at 30 June 2015.1 The numbers indicated represent typical values under normal market conditions.
Strategy Strategy Focus Representative FundTracking error
target1 Stock holdings1 Benchmark Structure Strategy AuM Lead manager
Core and Core Plus
Diversified exposure to world’s largest
economy
Threadneedle American Fund
2-6% 60-80 S&P 500 OEIC & SICAV $7,595mNadia Grant/ Diane Sobin
Equity Income3% dividend yield with capital growth upside
potential
Threadneedle US Equity Income Fund
2-6% 50-70 S&P 500OEIC
(UK only)$124m
Diane Sobin/ Nadia Grant
High AlphaBest ideas from across
style & market cap ranges
Threadneedle American Select Fund
4-8% 50-60 S&P 500 OEIC & SICAV $1,797mDiane Sobin/ Nadia Grant
Small CapExploiting higher
growth, less efficient opportunities
Threadneedle American Smaller Companies Fund
4-8% 70-90 S&P 400 Midcap OEIC $948m Diane Sobin
Extended Alpha130/30 strategy with
60% extra gross investment power
Threadneedle American Extended
Alpha Fund4-8%
Long: 40-80 Short: 40-80
S&P 500 OEIC $359mNeil Robson/
Ashish Kochar

US Equities investment team
19
US Equities Team profile – Columbia Threadneedle Investments (EMEA)
Nine investment professionals within the with 18 years’ average industry experience
Diverse professional and academic backgrounds
Significant accumulated experience of living and working in the US
Additional resources
28 US industry specialists based in New York and Boston
Columbia Threadneedle Investments has over 450 investment professionals globally, covering all markets and asset classes
Source: Columbia Threadneedle Investments, as at 30 June 2015.1 Attached to the Global team. 2 Co-portfolio manager.
Long/Short strategies
Diane Sobin, CFA Head of US Equities Fund Manager Sectors: Energy 32 years’ experience
Nadia Grant, CFA Fund Manager Sectors: Healthcare 15 years’ experience
Neil Robson¹ Fund Manager 29 years’ experience
Ashish Kochar1,2
Fund Manager 10 years’ experience
Brad Colton Portfolio Analyst Sectors: Financials & Healthcare 18 years’ experience
Amit Kumar, CFA Portfolio Analyst Sectors: Consumer & Technology 8 years’ experience
Nicolas Janvier, CFA Fund Manager Sectors: Materials, Consumer & Utilities 15 years’ experience
Stéphane Jeannin, CFA Portfolio Analyst Sectors: Technology & Telecommunications 17 years’ experience
Benedikt Blomberg, CFA Portfolio Analyst Sectors: Industrials 19 years’ experience
Richard Adams Client Portfolio Manager 14 years’ experience

Learning outcomes
Identify how macroeconomic factors can inform investment strategy choices Views on the dollar, volatility, rates can influence the type of equity strategy investors may prefer
Understand how rising interest rates might impact the active vs passive debate Higher rates can create divergences for active stock pickers to explore
Identify areas of US market that may benefit despite dollar strength Rising consumer incomes Recovering housing market Disruptive innovators Biotechnology R&D renaissance Constructive demographics
20

21
Important notesFor internal use by Professional and/or Qualified Investors only (not to be used with or passed on to retail clients)
Past performance is not a guide to future performance. The value of investments and any income is not guaranteed and can go down as well as up and may be affected by exchange rate fluctuations. This means that an investor may not get back the amount invested.
This material is for information only and does not constitute an offer or solicitation of an order to buy or sell any securities or other financial instruments, or to provide investment advice or services.
Threadneedle Investment Funds ICVC (“TIF”), Threadneedle Investment Funds II ICVC (“TIF II”) and Threadneedle Specialist Investment Funds ICVC (“TSIF”) are open-ended investment companies structured as umbrella companies incorporated in England and Wales, authorised and regulated in the UK by the Financial Conduct Authority (FCA) as a UCITS scheme.
Subscriptions to a Fund may only be made on the basis of the current Prospectus and the Key Investor Information Document, as well as the latest annual or interim reports and the applicable terms & conditions. Please refer to the ‘Risk Factors’ section of the Prospectus for all risks applicable to investing in any fund. The above documents for TIF and TSIF are available in English, French, German, Portuguese, Italian, Spanish and Dutch (no Dutch Prospectus), Swedish (for the Key Investor Information Document only), for TIF II in English only, and may be obtained free of charge on request from Columbia Threadneedle Investments, Client Services department PO Box 10033, Chelmsford, Essex CM99 2AL.
The research and analysis included in this document has been produced by Columbia Threadneedle Investments for its own investment management activities, may have been acted upon prior to publication and is made available here incidentally. Any opinions expressed are made as at the date of publication but are subject to change without notice and should not be seen as investment advice. Information obtained from external sources is believed to be reliable but its accuracy or completeness cannot be guaranteed.
This presentation and its contents are confidential and proprietary. The information provided in this presentation is for the sole use of those attending the presentation. It may not be reproduced in any form or passed on to any third party without the express written permission of Columbia Threadneedle Investments. This presentation is the property of Columbia Threadneedle Investments and must be returned upon request.
Issued by Threadneedle Investment Services Limited. Registered in England and Wales, Registered No. 3701768, Cannon Place, 78 Cannon Street , London EC4N 6AG, United Kingdom. Authorised and regulated in the UK by the Financial Conduct Authority.
Columbia Threadneedle Investments is the global brand name of the Columbia and Threadneedle group of companies