contents briefly about the latest developments in the global economy and Turkish economy, and the...
62
Message from the Chairman 1 Agenda of General Assembly Meeting 3 1. Company 4 1.1 Summary Info 1.2 Capital and Shareholding Structure 1.3 Board of Directors, Auditing Board and Auditing Committee 1.4 Organisation Chart 1.5 Management Team 1.6 Historical Background 2. Sector of Operation 20 2.1 Turkish IT Sector 2.2 Sub-segments of the IT Sector 2.3 Growth of Turkish IT Sector 3. Subsidiaries 40 3.1 Datagate Bilgisayar Malzemeleri Tic. A.fi 3.2 Neteks ‹letiflim Ürünleri Da¤›t›m A.fi. 3.3 Neotech Teknolojik Ürünler Da¤›t›m A.fi. 3.4 ‹nfin Bilgisayar Ticaret A.fi. 3.5 Teklos Teknoloji Lojistik A.fi. 4. Operation 46 4.1 Structure of Product Supply and Distribution 4.2 Logistics 4.3 Invoicing and Payment Collection 4.4 Technical Service and Customer Relations 4.5 Sales and Marketing 4.6 Anatolian Channel Organisation 5. Corporate Governance Principles Compliance Report 54 6. Board of Directors' Suggestions on Dividend Distribution 64 7. Auditing Board’s Report 68 8. Independent Auditor’s Report 72 9. Financial Statements and Notes 76 contents ANNUAL REPORT 2009
Transcript of contents briefly about the latest developments in the global economy and Turkish economy, and the...
Message from the Chairman 1
Agenda of General Assembly Meeting 3
1. Company 4
1.1 Summary Info
1.2 Capital and Shareholding Structure
1.3 Board of Directors, Auditing Board and Auditing Committee
1.4 Organisation Chart
1.5 Management Team
1.6 Historical Background
2. Sector of Operation 20
2.1 Turkish IT Sector
2.2 Sub-segments of the IT Sector
2.3 Growth of Turkish IT Sector
3. Subsidiaries 40
3.1 Datagate Bilgisayar Malzemeleri Tic. A.fi
3.2 Neteks ‹letiflim Ürünleri Da¤›t›m A.fi.
3.3 Neotech Teknolojik Ürünler Da¤›t›m A.fi.
3.4 ‹nfin Bilgisayar Ticaret A.fi.
3.5 Teklos Teknoloji Lojistik A.fi.
4. Operation 46
4.1 Structure of Product Supply and Distribution
4.2 Logistics
4.3 Invoicing and Payment Collection
4.4 Technical Service and Customer Relations
4.5 Sales and Marketing
4.6 Anatolian Channel Organisation
5. Corporate Governance Principles Compliance Report 54
6. Board of Directors' Suggestions on Dividend Distribution 64
7. Auditing Board’s Report 68
8. Independent Auditor’s Report 72
9. Financial Statements and Notes 76
contents
ANNUAL REPORT 2009
Dear Shareholders;
Before opening the Ordinary General Assembly and discussing on ouractivities performed in 2009, and the relevant balance sheet and profit& loss account reflecting the results of these activities, I would like totalk briefly about the latest developments in the global economy andTurkish economy, and the expectations of the IT sector in 2010.
The global financial crisis, which started initially in the US in 2007 andthen rapidly spread out to other countries, affected the whole worldin the last quarter of 2008. This event, which is also called the crisisof century, was experienced such a war against recession particularlyin the first half of 2009. Thanks to monetary policies implemented andfinancial measures taken by many countries, particularly developedones, the effects of the crises tended to diminish to some extent fromthe second quarter of 2009. Turkey’s economy has tended to improvefrom the second quarter of 2009 as a result of the high capital adequacyratios of the banking system, interest rate cuts made by the TurkishCentral Bank, stimulus packages intended for real economy, VAT cuts,stability in exchange rates and economic administration of the countryacting in integration with the other countries. On the basis of the tightfiscal policies implemented and the desire of the financial markets tofund the real economy more conveniently in 2010, it is expected forthe national growth to be approximately 4%.
IT sector in which we operate is the one most ready to take a leap withits own dynamics in 2010. When compared with the previous year,the sector has reached the volume of 5.7 billion USD, with a growthpercentage of 7.2. When considering the income levels of Hardware,Software and Service groups as these are 3 main groups of IT sector,Hardware products represent 74% of the total income of the sector.The most important factors underlying the growth of our sector are theVAT cut applied in our sector between 01.04.2009 and 30.09.2009and the campaigns conducted by retail chain stores andtelecommunication companies targeting individual customers. Wepredict that the sector will grow by approx. 10%, reaching beyond 6,0 billion USD, in 2010.
Considering the fact that 50% of the population of Turkey is under 28years-old and that PC ownership rate of the total population is about25%, one may see that we are still at the beginning of the way to cover. Continuation of the IT investments made by the government forexpanding the usage of e-government services and promoting theirusage by the public, expanding the usage of 3G technology, increasinginterest of alternative channels such as dowry and food markets in ITproducts, expansion of the use of PC in education, and the interestof international retail stores in Turkish market are the factors that willstimulate the IT market to grow in 2010.
In 2009, our Company’s turnover reached 1.087.422.382 TRL with an increase of 17.19% comparing to the previous year. Our grossprofit has been TRL 64.305.184; and its ratio to sales realized as 5.91%. Operating costs of our Company has decreased from 2.66%to 2.25% of the sales, comparing to the previous year. Net income after tax reached 15.934.942 TRL with an increase of 215%comparing to the previous year.
In 2010, as the company management, we will continue our business understanding, which is focused on profitability, making cost-effective analyses, aiming at the realization of the sales budget figures, producing sales policies with a target of customer satisfactionusing mobile channel sales teams and prioritizing productivity.
Wishing that the world and Turkey leave the crisis behind in 2010, I would like to express my gratitude to all who contributed to oursuccess, to our business partners, suppliers, employees, and particularly to our shareholders.
Yours Faithfully,
Erol B‹LEC‹K
Chairman
1 2
Erol B‹LEC‹KChairman
ANNUAL REPORT 2009 ANNUAL REPORT 2009
Agenda of General Assembly Meeting 20091. Opening and Election of the Chair of the Meeting,2. Authorisation of the Chair of Meeting for signing of the Minutes of General Assembly Meeting,3. Review of the Board of Director's Report, Auditing Board's Report and Independent Auditor's Report prepared
by AGD Ba¤›ms›z Denetim ve Dan›flmanl›k S.M.M.M. A.fi. regarding the activities and related accounts of2009,
4. Review and approval of the Balance Sheet and Profit & Loss Account of 2009,5. Acquittal of the members of the Board of Directors and Auditing Board in respect of the duties performed
during the year 2009,6. Approval of the appointment of Independent Audit Company,7. Review and approval of the Board of Directors' suggestion on dividend distribution for the year 2009 and
determination of the dividend distribution date,8. Providing the shareholders with information on “Disclosure Policy” adopted by a resolution of the Company
Board in accordance with the Corporate Governance Principles,9. Determining the remunerations to be paid to the Board Members in 2010,10. Determination of the remunerations and number of the members of the Auditing Board and election thereof,11. Wishes and closing.
Date of Meeting : 20.04.2010Time of Meeting : 10:00Place of Meeting : Ayaza¤a Mah. Cendere Yolu No :9/1 fiiflli / ISTANBUL
3
1. COMPANY
‹NDEKS B‹LG‹SAYAR S‹STEMLER‹ MÜHEND‹SL‹K SANAY‹ VE T‹CARET A.fi. ANNUAL REPORT 2009
ANNUAL REPORT 2009
5 6
1. Company1.1 Highlights• ‹ndeks Bilgisayar Sistemleri Mühendislik Sanayi ve Ticaret A.fi., which was founded in 1989 to operate in the computer field, has
became a company distributing about 200 worldwide brands, employing 289 people and cooperating with over 7.500 businesspartners, holding the leadership position of the sector for a long time.
• In the Turkey Top 500 ICT Companies Ranking performed every year by Interpro Medya A.fi., our company ranked 7th (seventh)in the general ranking based on turnover achieved in 2008 among the companies including telephone operators and mobile phonesellers. Our company ranked first in the hardware category with a turnover of 870.084 (thousand TRL) among the companies includingthose above. On the other hand, our Company ranked 1st (first) with a sales revenue of TRL 927,893 (thousand TRL), like the previousyears, in the category of companies selling only computers. Further, it ranked first in six IT categories.
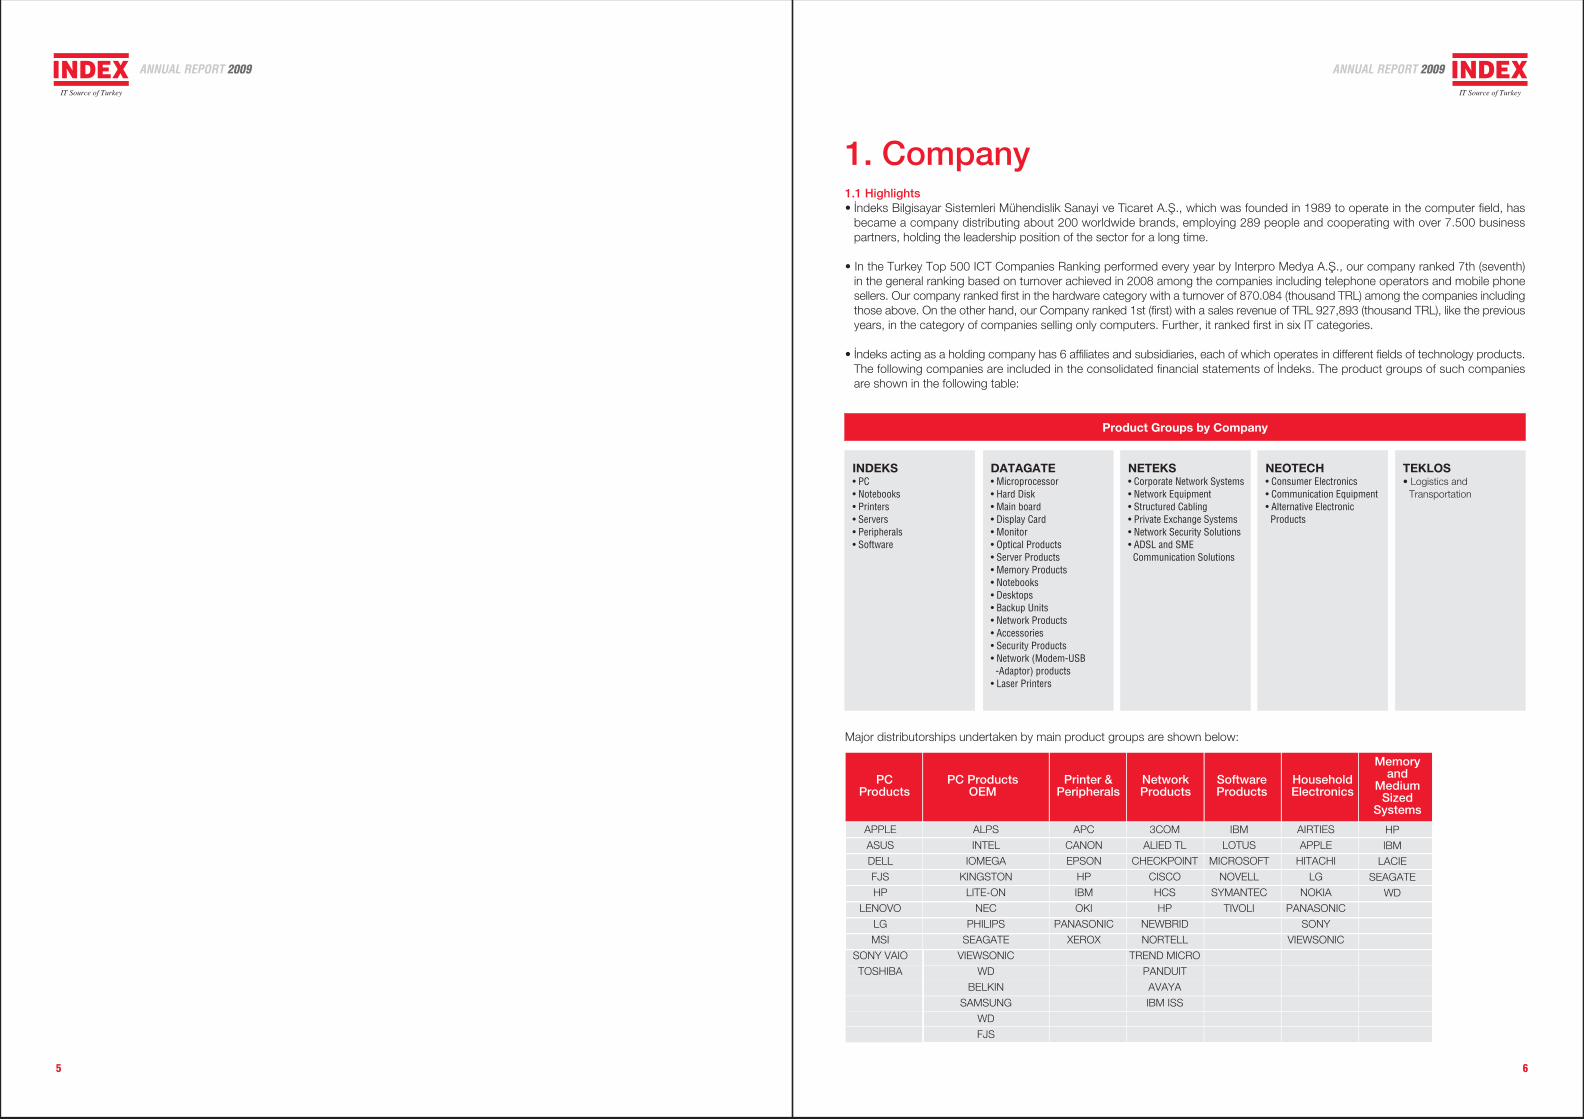
• ‹ndeks acting as a holding company has 6 affiliates and subsidiaries, each of which operates in different fields of technology products.The following companies are included in the consolidated financial statements of ‹ndeks. The product groups of such companiesare shown in the following table:
Product Groups by Company
INDEKS• PC• Notebooks• Printers• Servers• Peripherals• Software
DATAGATE• Microprocessor• Hard Disk• Main board• Display Card• Monitor• Optical Products• Server Products• Memory Products• Notebooks• Desktops• Backup Units• Network Products• Accessories• Security Products• Network (Modem-USB
-Adaptor) products• Laser Printers
NETEKS• Corporate Network Systems• Network Equipment• Structured Cabling• Private Exchange Systems• Network Security Solutions• ADSL and SME
Communication Solutions
NEOTECH• Consumer Electronics• Communication Equipment• Alternative Electronic
Products
TEKLOS• Logistics and
Transportation
Major distributorships undertaken by main product groups are shown below:
PCProducts
PC ProductsOEM
Printer &Peripherals
NetworkProducts
SoftwareProducts
HouseholdElectronics
Memoryand
MediumSized
Systems
APPLE
ASUS
DELL
FJS
HP
LENOVO
LG
MSI
SONY VAIO
TOSHIBA
ALPS
INTEL
IOMEGA
KINGSTON
LITE-ON
NEC
PHILIPS
SEAGATE
VIEWSONIC
WD
BELKIN
SAMSUNG
WD
FJS
APC
CANON
EPSON
HP
IBM
OKI
PANASONIC
XEROX
3COM
ALIED TL
CHECKPOINT
CISCO
HCS
HP
NEWBRID
NORTELL
TREND MICRO
PANDUIT
AVAYA
IBM ISS
IBM
LOTUS
MICROSOFT
NOVELL
SYMANTEC
TIVOLI
AIRTIES
APPLE
HITACHI
LG
NOKIA
PANASONIC
SONY
VIEWSONIC
HP
IBM
LACIE
SEAGATE
WD
ANNUAL REPORT 2009 ANNUAL REPORT 2009
87
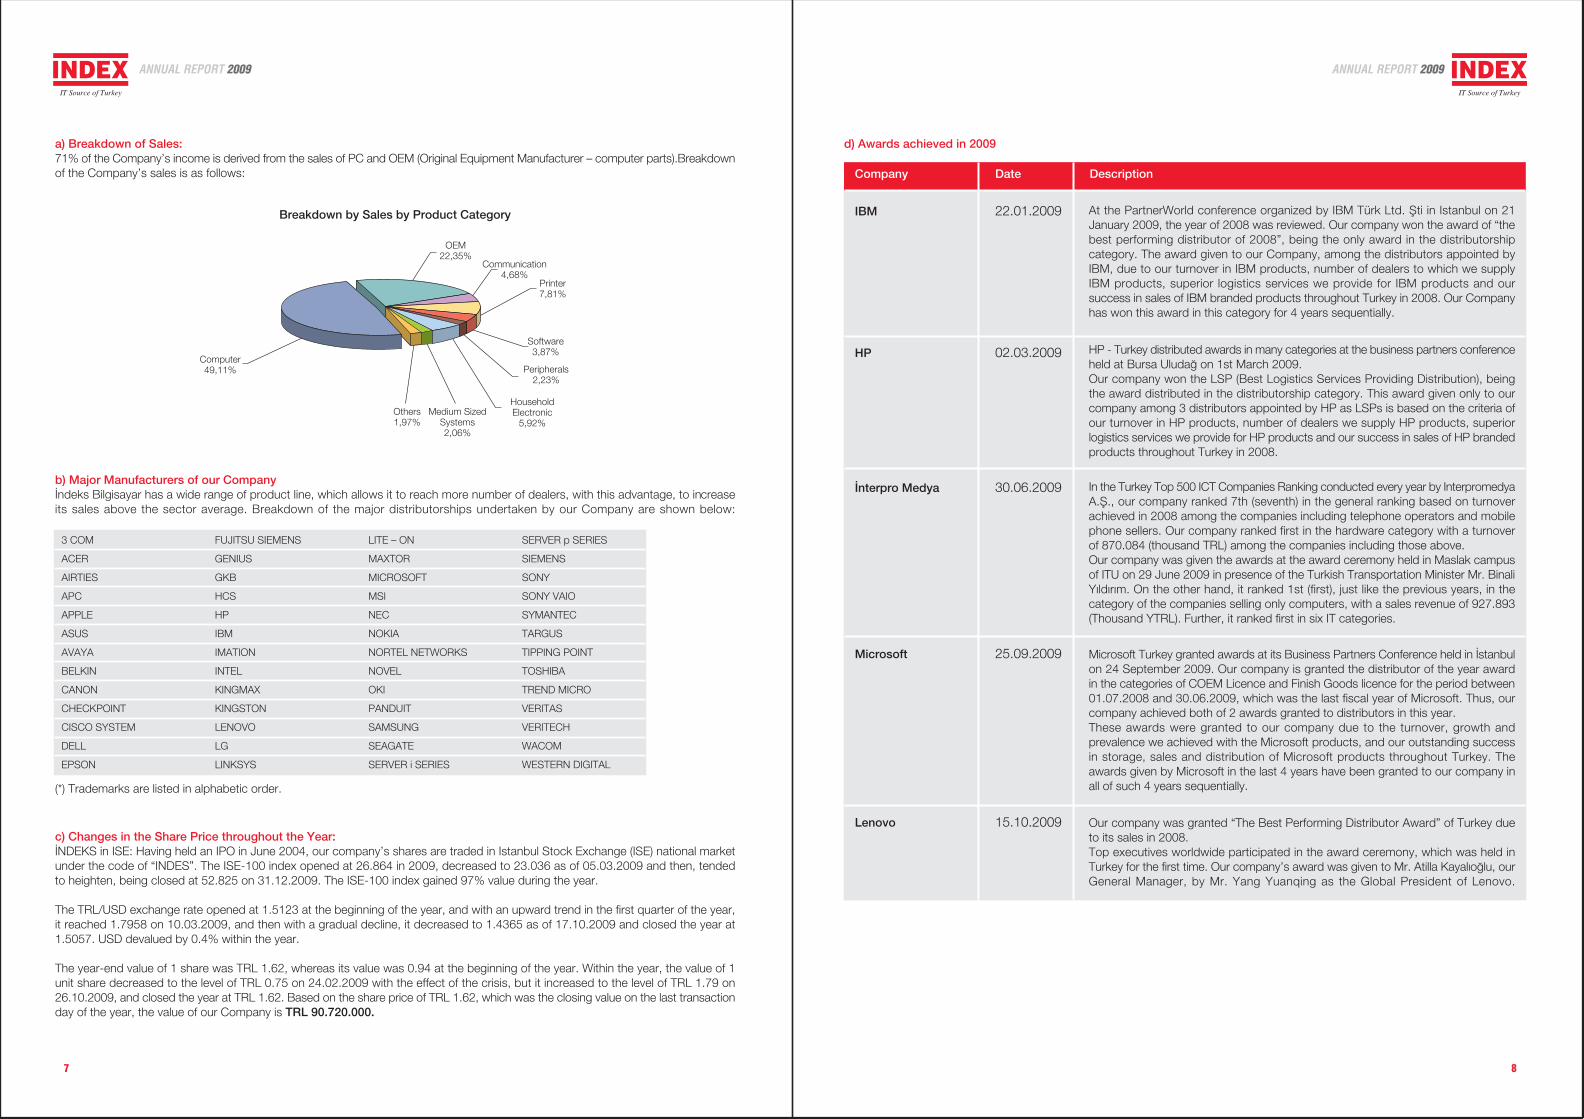
a) Breakdown of Sales:71% of the Company’s income is derived from the sales of PC and OEM (Original Equipment Manufacturer – computer parts).Breakdownof the Company’s sales is as follows:
Breakdown by Sales by Product Category
c) Changes in the Share Price throughout the Year:‹NDEKS in ISE: Having held an IPO in June 2004, our company’s shares are traded in Istanbul Stock Exchange (ISE) national marketunder the code of “INDES”. The ISE-100 index opened at 26.864 in 2009, decreased to 23.036 as of 05.03.2009 and then, tendedto heighten, being closed at 52.825 on 31.12.2009. The ISE-100 index gained 97% value during the year.
The TRL/USD exchange rate opened at 1.5123 at the beginning of the year, and with an upward trend in the first quarter of the year,it reached 1.7958 on 10.03.2009, and then with a gradual decline, it decreased to 1.4365 as of 17.10.2009 and closed the year at1.5057. USD devalued by 0.4% within the year.
The year-end value of 1 share was TRL 1.62, whereas its value was 0.94 at the beginning of the year. Within the year, the value of 1unit share decreased to the level of TRL 0.75 on 24.02.2009 with the effect of the crisis, but it increased to the level of TRL 1.79 on26.10.2009, and closed the year at TRL 1.62. Based on the share price of TRL 1.62, which was the closing value on the last transactionday of the year, the value of our Company is TRL 90.720.000.
b) Major Manufacturers of our Company‹ndeks Bilgisayar has a wide range of product line, which allows it to reach more number of dealers, with this advantage, to increaseits sales above the sector average. Breakdown of the major distributorships undertaken by our Company are shown below:
3 COM
ACER
AIRTIES
APC
APPLE
ASUS
AVAYA
BELKIN
CANON
CHECKPOINT
CISCO SYSTEM
DELL
EPSON
FUJITSU SIEMENS
GENIUS
GKB
HCS
HP
IBM
IMATION
INTEL
KINGMAX
KINGSTON
LENOVO
LG
LINKSYS
LITE – ON
MAXTOR
MICROSOFT
MSI
NEC
NOKIA
NORTEL NETWORKS
NOVEL
OKI
PANDUIT
SAMSUNG
SEAGATE
SERVER i SERIES
SERVER p SERIES
SIEMENS
SONY
SONY VAIO
SYMANTEC
TARGUS
TIPPING POINT
TOSHIBA
TREND MICRO
VERITAS
VERITECH
WACOM
WESTERN DIGITAL
(*) Trademarks are listed in alphabetic order.
d) Awards achieved in 2009
Company Date Description
IBM 22.01.2009 At the PartnerWorld conference organized by IBM Türk Ltd. fiti in Istanbul on 21January 2009, the year of 2008 was reviewed. Our company won the award of “thebest performing distributor of 2008”, being the only award in the distributorshipcategory. The award given to our Company, among the distributors appointed byIBM, due to our turnover in IBM products, number of dealers to which we supplyIBM products, superior logistics services we provide for IBM products and oursuccess in sales of IBM branded products throughout Turkey in 2008. Our Companyhas won this award in this category for 4 years sequentially.
HP - Turkey distributed awards in many categories at the business partners conferenceheld at Bursa Uluda¤ on 1st March 2009.Our company won the LSP (Best Logistics Services Providing Distribution), beingthe award distributed in the distributorship category. This award given only to ourcompany among 3 distributors appointed by HP as LSPs is based on the criteria ofour turnover in HP products, number of dealers we supply HP products, superiorlogistics services we provide for HP products and our success in sales of HP brandedproducts throughout Turkey in 2008.
HP 02.03.2009
‹nterpro Medya 30.06.2009 In the Turkey Top 500 ICT Companies Ranking conducted every year by InterpromedyaA.fi., our company ranked 7th (seventh) in the general ranking based on turnoverachieved in 2008 among the companies including telephone operators and mobilephone sellers. Our company ranked first in the hardware category with a turnoverof 870.084 (thousand TRL) among the companies including those above.Our company was given the awards at the award ceremony held in Maslak campusof ITU on 29 June 2009 in presence of the Turkish Transportation Minister Mr. BinaliY›ld›r›m. On the other hand, it ranked 1st (first), just like the previous years, in thecategory of the companies selling only computers, with a sales revenue of 927.893(Thousand YTRL). Further, it ranked first in six IT categories.
Microsoft 25.09.2009 Microsoft Turkey granted awards at its Business Partners Conference held in ‹stanbulon 24 September 2009. Our company is granted the distributor of the year awardin the categories of COEM Licence and Finish Goods licence for the period between01.07.2008 and 30.06.2009, which was the last fiscal year of Microsoft. Thus, ourcompany achieved both of 2 awards granted to distributors in this year.These awards were granted to our company due to the turnover, growth andprevalence we achieved with the Microsoft products, and our outstanding successin storage, sales and distribution of Microsoft products throughout Turkey. Theawards given by Microsoft in the last 4 years have been granted to our company inall of such 4 years sequentially.
Lenovo 15.10.2009 Our company was granted “The Best Performing Distributor Award” of Turkey dueto its sales in 2008.Top executives worldwide participated in the award ceremony, which was held inTurkey for the first time. Our company’s award was given to Mr. Atilla Kayal›o¤lu, ourGeneral Manager, by Mr. Yang Yuanqing as the Global President of Lenovo.
Computer49,11%
OEM22,35%
Communication4,68%
Printer7,81%
Software3,87%
Peripherals2,23%
HouseholdElectronic
5,92%Medium Sized
Systems2,06%
Others1,97%
ANNUAL REPORT 2009 ANNUAL REPORT 2009
9
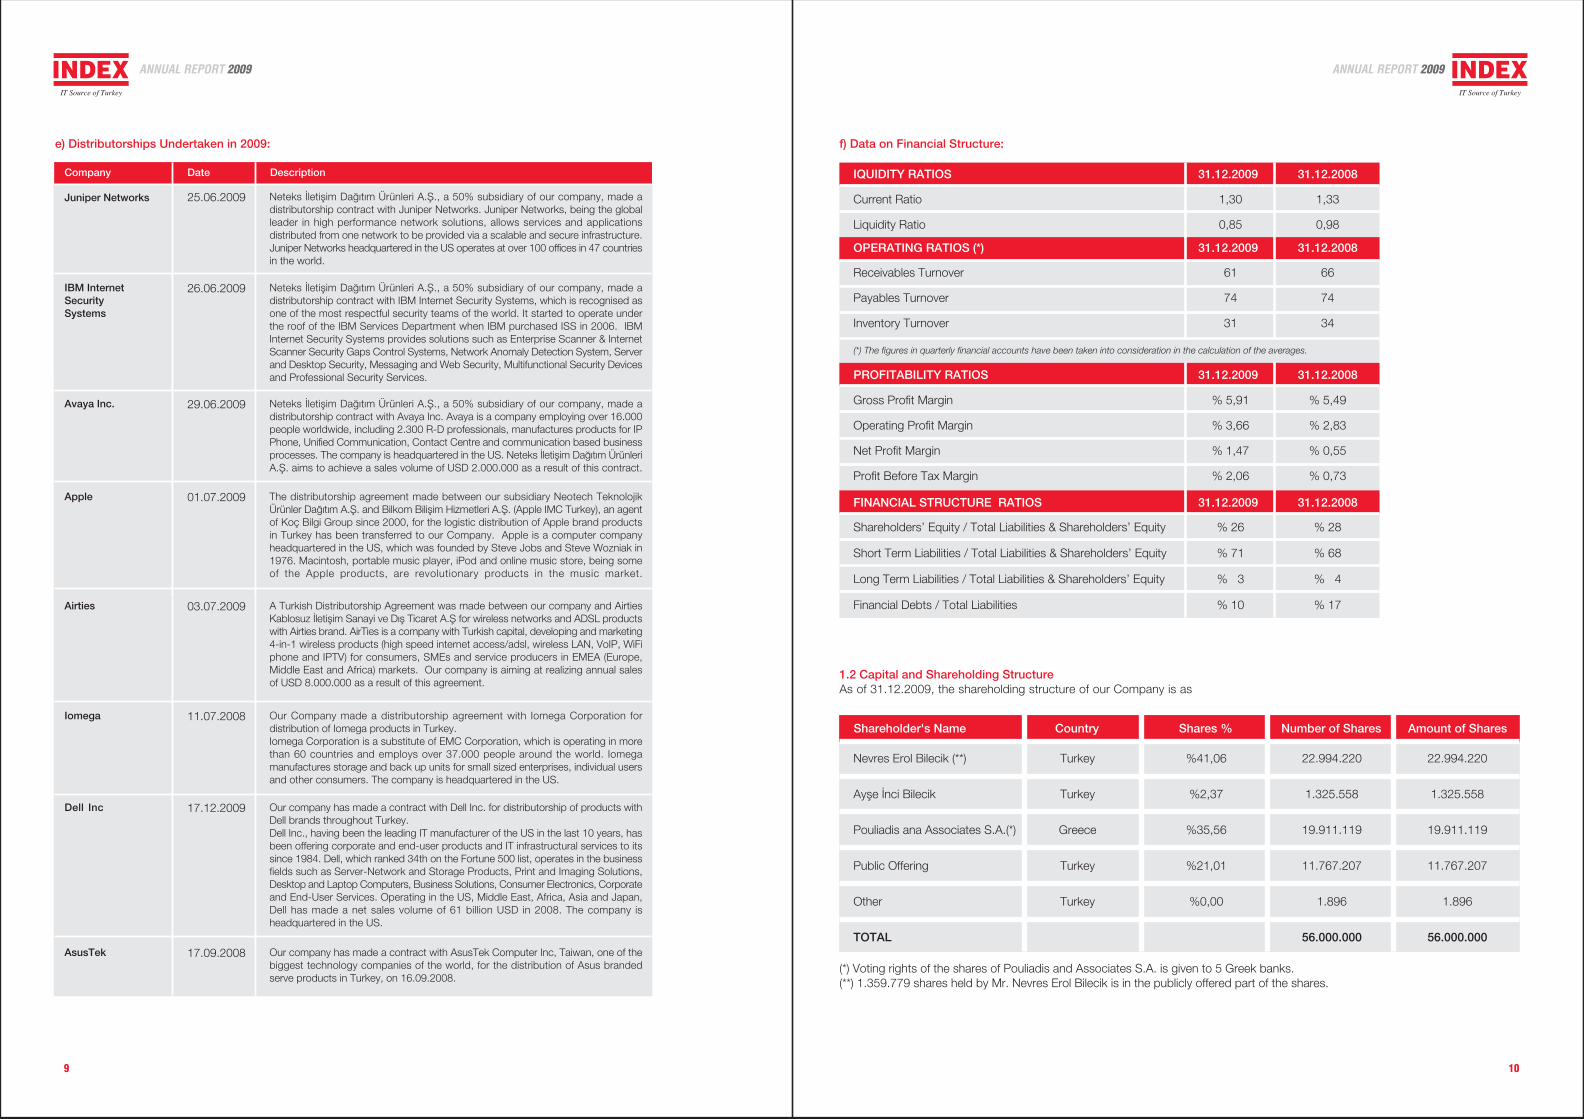
e) Distributorships Undertaken in 2009:
Firma Tarih Aç›klama
A Turkish Distributorship Agreement was made between our company and AirtiesKablosuz ‹letiflim Sanayi ve D›fl Ticaret A.fi for wireless networks and ADSL productswith Airties brand. AirTies is a company with Turkish capital, developing and marketing4-in-1 wireless products (high speed internet access/adsl, wireless LAN, VoIP, WiFiphone and IPTV) for consumers, SMEs and service producers in EMEA (Europe,Middle East and Africa) markets. Our company is aiming at realizing annual salesof USD 8.000.000 as a result of this agreement.
Iomega Our Company made a distributorship agreement with Iomega Corporation fordistribution of Iomega products in Turkey.Iomega Corporation is a substitute of EMC Corporation, which is operating in morethan 60 countries and employs over 37.000 people around the world. Iomegamanufactures storage and back up units for small sized enterprises, individual usersand other consumers. The company is headquartered in the US.
11.07.2008
Dell Inc 17.12.2009 Our company has made a contract with Dell Inc. for distributorship of products withDell brands throughout Turkey.Dell Inc., having been the leading IT manufacturer of the US in the last 10 years, hasbeen offering corporate and end-user products and IT infrastructural services to itssince 1984. Dell, which ranked 34th on the Fortune 500 list, operates in the businessfields such as Server-Network and Storage Products, Print and Imaging Solutions,Desktop and Laptop Computers, Business Solutions, Consumer Electronics, Corporateand End-User Services. Operating in the US, Middle East, Africa, Asia and Japan,Dell has made a net sales volume of 61 billion USD in 2008. The company isheadquartered in the US.
17.09.2008
Airties 03.07.2009
AsusTek Our company has made a contract with AsusTek Computer Inc, Taiwan, one of thebiggest technology companies of the world, for the distribution of Asus brandedserve products in Turkey, on 16.09.2008.
Al›nan Ödül Tarih Aç›klamaCompany Date Description
Juniper Networks 25.06.2009 Neteks ‹letiflim Da¤›t›m Ürünleri A.fi., a 50% subsidiary of our company, made adistributorship contract with Juniper Networks. Juniper Networks, being the globalleader in high performance network solutions, allows services and applicationsdistributed from one network to be provided via a scalable and secure infrastructure.Juniper Networks headquartered in the US operates at over 100 offices in 47 countriesin the world.
IBM InternetSecuritySystems
Neteks ‹letiflim Da¤›t›m Ürünleri A.fi., a 50% subsidiary of our company, made adistributorship contract with IBM Internet Security Systems, which is recognised asone of the most respectful security teams of the world. It started to operate underthe roof of the IBM Services Department when IBM purchased ISS in 2006. IBMInternet Security Systems provides solutions such as Enterprise Scanner & InternetScanner Security Gaps Control Systems, Network Anomaly Detection System, Serverand Desktop Security, Messaging and Web Security, Multifunctional Security Devicesand Professional Security Services.
26.06.2009
Avaya Inc. Neteks ‹letiflim Da¤›t›m Ürünleri A.fi., a 50% subsidiary of our company, made adistributorship contract with Avaya Inc. Avaya is a company employing over 16.000people worldwide, including 2.300 R-D professionals, manufactures products for IPPhone, Unified Communication, Contact Centre and communication based businessprocesses. The company is headquartered in the US. Neteks ‹letiflim Da¤›t›m ÜrünleriA.fi. aims to achieve a sales volume of USD 2.000.000 as a result of this contract.
29.06.2009
Apple The distributorship agreement made between our subsidiary Neotech TeknolojikÜrünler Da¤›t›m A.fi. and Bilkom Biliflim Hizmetleri A.fi. (Apple IMC Turkey), an agentof Koç Bilgi Group since 2000, for the logistic distribution of Apple brand productsin Turkey has been transferred to our Company. Apple is a computer companyheadquartered in the US, which was founded by Steve Jobs and Steve Wozniak in1976. Macintosh, portable music player, iPod and online music store, being someof the Apple products, are revolutionary products in the music market.
01.07.2009
10
f) Data on Financial Structure:
1.2 Capital and Shareholding StructureAs of 31.12.2009, the shareholding structure of our Company is as
Shareholder's Name Country Shares % Number of Shares Amount of Shares
Nevres Erol Bilecik (**) Turkey %41,06 22.994.220 22.994.220
Ayfle ‹nci Bilecik Turkey %2,37 1.325.558 1.325.558
Pouliadis ana Associates S.A.(*) Greece %35,56 19.911.119 19.911.119
Public Offering Turkey %21,01 11.767.207 11.767.207
Other Turkey %0,00 1.896 1.896
TOTAL 56.000.000 56.000.000
(*) Voting rights of the shares of Pouliadis and Associates S.A. is given to 5 Greek banks.(**) 1.359.779 shares held by Mr. Nevres Erol Bilecik is in the publicly offered part of the shares.
IQUIDITY RATIOS 31.12.2009 31.12.2008
Current Ratio 1,30 1,33
Liquidity Ratio 0,85 0,98
OPERATING RATIOS (*) 31.12.2009 31.12.2008
Receivables Turnover 61 66
Payables Turnover 74 74
Inventory Turnover 31 34
(*) The figures in quarterly financial accounts have been taken into consideration in the calculation of the averages.
PROFITABILITY RATIOS 31.12.2009 31.12.2008
FINANCIAL STRUCTURE RATIOS 31.12.2009 31.12.2008
Shareholders’ Equity / Total Liabilities & Shareholders’ Equity % 26 % 28
Short Term Liabilities / Total Liabilities & Shareholders’ Equity % 71 % 68
Long Term Liabilities / Total Liabilities & Shareholders’ Equity % 3 % 4
Financial Debts / Total Liabilities % 10 % 17
Gross Profit Margin % 5,91 % 5,49
Operating Profit Margin % 3,66 % 2,83
Net Profit Margin % 1,47 % 0,55
Profit Before Tax Margin % 2,06 % 0,73
ANNUAL REPORT 2009 ANNUAL REPORT 2009
11 12
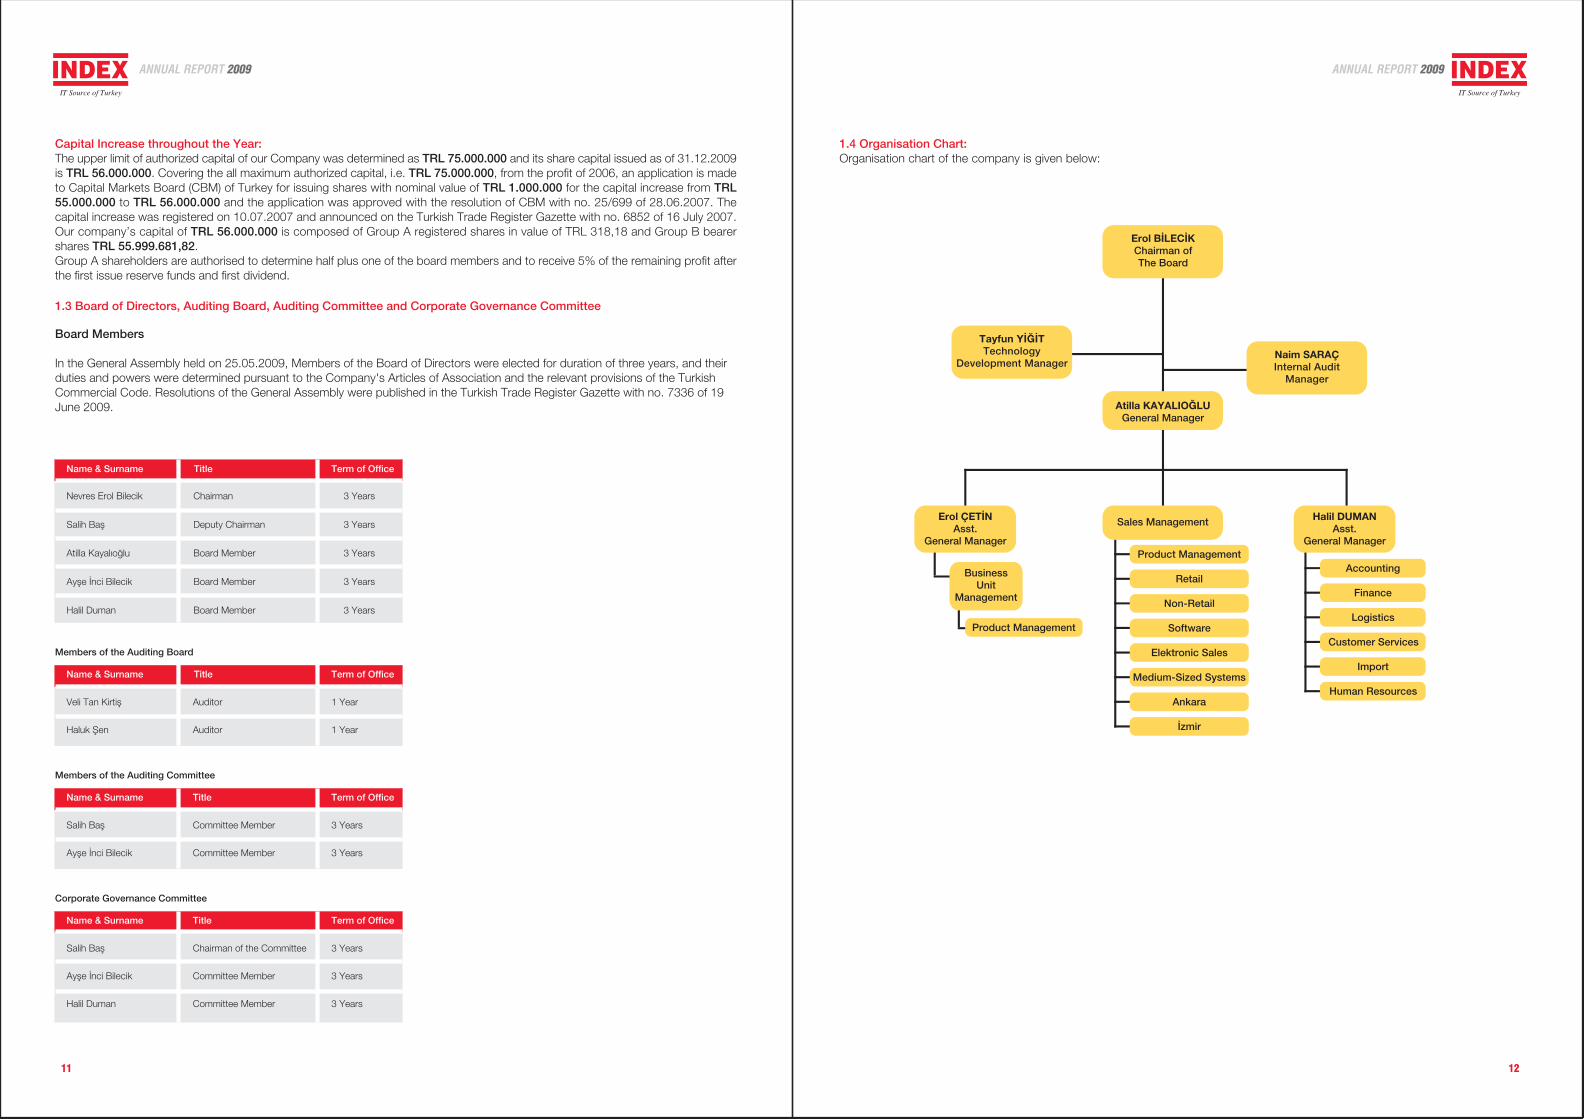
1.4 Organisation Chart:Organisation chart of the company is given below:
Capital Increase throughout the Year:The upper limit of authorized capital of our Company was determined as TRL 75.000.000 and its share capital issued as of 31.12.2009is TRL 56.000.000. Covering the all maximum authorized capital, i.e. TRL 75.000.000, from the profit of 2006, an application is madeto Capital Markets Board (CBM) of Turkey for issuing shares with nominal value of TRL 1.000.000 for the capital increase from TRL55.000.000 to TRL 56.000.000 and the application was approved with the resolution of CBM with no. 25/699 of 28.06.2007. Thecapital increase was registered on 10.07.2007 and announced on the Turkish Trade Register Gazette with no. 6852 of 16 July 2007.Our company’s capital of TRL 56.000.000 is composed of Group A registered shares in value of TRL 318,18 and Group B bearershares TRL 55.999.681,82.Group A shareholders are authorised to determine half plus one of the board members and to receive 5% of the remaining profit afterthe first issue reserve funds and first dividend.
1.3 Board of Directors, Auditing Board, Auditing Committee and Corporate Governance Committee
Board Members
In the General Assembly held on 25.05.2009, Members of the Board of Directors were elected for duration of three years, and theirduties and powers were determined pursuant to the Company's Articles of Association and the relevant provisions of the TurkishCommercial Code. Resolutions of the General Assembly were published in the Turkish Trade Register Gazette with no. 7336 of 19June 2009.
Product Management
Retail
Non-Retail
Software
Elektronic Sales
Medium-Sized Systems
Ankara
‹zmir
Erol B‹LEC‹KChairman ofThe Board
Atilla KAYALIO⁄LUGeneral Manager
Tayfun Y‹⁄‹TTechnology
Development ManagerNaim SARAÇInternal Audit
Manager
BusinessUnit
Management
Product Management
Erol ÇET‹NAsst.
General Manager
Sales Management Halil DUMANAsst.
General Manager
Accounting
Finance
Logistics
Customer Services
Import
Human Resources
Name & Surname Title Term of Office
Nevres Erol Bilecik Chairman 3 Years
Salih Bafl Deputy Chairman 3 Years
Atilla Kayal›o¤lu Board Member 3 Years
Ayfle ‹nci Bilecik Board Member 3 Years
Halil Duman Board Member 3 Years
Members of the Auditing Board
Name & Surname Title Term of Office
Veli Tan Kirtifl Auditor 1 Year
Haluk fien Auditor 1 Year
Corporate Governance Committee
Name & Surname Title Term of Office
Salih Bafl Chairman of the Committee 3 Years
Ayfle ‹nci Bilecik Committee Member 3 Years
Halil Duman Committee Member 3 Years
Members of the Auditing Committee
Name & Surname Title Term of Office
Salih Bafl Committee Member 3 Years
Ayfle ‹nci Bilecik Committee Member 3 Years
ANNUAL REPORT 2009 ANNUAL REPORT 2009
13 14
1.5. Board of DirectorsThe Board of Directors of the company consists of five members. Curriculum Vitae of the board members are given below.
Nevres Erol Bilecik, Chairman of the Board of Directors: Erol Bilecik was born in 1962 and graduated from Istanbul TechnicalUniversity, Department of Computer Engineering. Erol Bilecik, who established ‹ndeks A.fi. in 1989, acts as the chairman of the followingsubsidiaries of Index, besides our company: Despec Bilgisayar Pazarlama ve Ticaret A.fi., Datagate Bilgisayar Malzemeleri TicaretA.fi., Neteks ‹letiflim Ürünleri Da¤›t›m A.fi., Neotech Teknolojik Ürünler Da¤›t›m A.fi., Desbil Teknolojik Ürünler Ticaret Afi., HomendElektrikli Cihazlar San. Ve Ticaret Afi., ‹nfin Bilgisayar Ticaret A.fi. and Teklos Teknoloji Lojistik Hizmetleri Afi. Moreover, between theyears 2002 and 2005, he presided TUBISAD (Turkish Informatics Industry Association) established in 1974, the oldest civil societyorganisation in the ICT sector, members of which are companies realising 95% of the total transaction volume of the Turkish ICT sector.Erol Bilecik is married with two children and speaks English.
Salih Bafl, Deputy Chairman: Salih Bafl was born in 1965, and graduated from Anadolu University, Department of BusinessAdministration. He has been working for Index Group since 1990. In 2003, while he was acting as the Assistant General Manager -Finance & Accounting for ‹ndeks Bilgisayar Sistemleri Mühendislik Sanayi ve Ticaret A.fi., he was appointed as the General Managerand Vice Chairman of the Board of Directors of Datagate Bilgisayar Malzemeleri Ticaret A.fi.. He currently acts as the Deputy Chairmanfor the companies, ‹ndeks Bilgisayar Sistemleri Mühendislik Sanayi ve Ticaret Afi., Teklos Teknoloji Lojistik Hizmetleri Afi., HomendElektrikli Cihazlar San. Ve Ticaret Afi., ‹nfin Bilgisayar Ticaret A.fi. and Desbil Teknolojik Ürünler Ticaret A.fi., and as one of the membersof the Board of Directors for the companies Despec Bilgisayar Pazarlama ve Ticaret Afi., Neotech Teknolojik Ürünler Da¤›t›m A.fi. andNeteks ‹letiflim Ürünleri Da¤›t›m A.fi. Salih Bafl is married with one child and speaks English.
Atilla Kayal›o¤lu, General Manager, Board Member: Atilla Kayal›o¤lu was born in 1952, and graduated from Bo¤aziçi University,Department of Mechanical Engineering in 1974; following that he received a masters degree from Syracuse University, Departmentof Industrial Engineering. He carried out several duties in IBM Turk between the years 1980-1999; and in 1999, when he was the GlobalServices Manager he left IBM Turk and joined Index. Kayal›o¤lu acts as a Board Member and General Manager of ‹ndeks BilgisayarSistemleri Mühendislik Sanayi ve Ticaret A.fi.; he also acts as a Board Member of the companies of Neteks ‹letiflim Ürünleri Da¤›t›mA.fi., Datagate Bilgisayar Malzemeleri Ticaret Afi., ‹nfin Bilgisayar Ticaret A.fi. and Teklos Teknoloji Lojistik Hizmetleri Afi.. Atilla Kayal›o¤luis married with two children and speaks English.
Ayfle ‹nci Bilecik, Board Member, Computer Engineer: Ayfle ‹nci Bilecik was born in 1964 and graduated from Istanbul TechnicalUniversity, Department of Computer Engineering. She also acts as a Board Member of Desbil Teknolojik Ürünler Ticaret A.fi., being asubsidiary of Index. Being one of the founding partners of ‹ndeks Bilgisayar founded in 1989, Ayfle ‹nci Bilecik used to work as anengineer specialized in software in the ICT sector for long years. Ayfle ‹nci Bilecik is married with two children and speaks English.
Halil Duman, Board Member: Halil Duman was born in 1965, and graduated from Marmara University, Department of BusinessAdministration. He carried out several duties in Yücelen ‹nflaat A.fi. between the years 1987 and 2000; and in 2000, when he wasthe Manager of Finance, he left Yücelen ‹nflaat and joined Index as Finance Director. Duman acts as a member of the Board of Directorsof ‹ndeks Bilgisayar Sistemleri Mühendislik Sanayi ve Ticaret A.fi., and also acts as a Board Member of Datagate Bilgisayar MalzemeleriTicaret Afi., Neteks ‹letiflim Ürünleri Da¤›t›m Afi., Teklos Teknoloji Lojistik Hizmetleri Afi., Neotech Teknolojik Ürünler Da¤›t›m Afi.,Despec Bilgisayar Pazarlama ve Ticaret Afi., Desbil Teknolojik Ürünler Ticaret A.fi. Homend Elektrikli Cihazlar San. ve Ticaret Afi., ‹nfinBilgisayar Ticaret A.fi. ve Alk›m Bilgisayar Afi, and acts as Assistant General Manager - Finance of ‹ndeks Bilgisayar Sistemleri MühendislikSanayi ve Ticaret A.fi. Halil Duman is married with two children.
Names and titles of executives are as follows:
Board Member - General Manager Atilla KAYALIO⁄LU [email protected]
Board Member – Asst. General Manager Halil DUMAN [email protected]
Assistant General Manager (Sales and Marketing) Erol ÇET‹N [email protected]
Internal Audit Manager Naim SARAÇ [email protected]
Technology Development Manager Tayfun Y‹⁄‹T [email protected]
Finance Manager Birgül ÖZTÜRK [email protected]
Accounting Manager Halim ÇA⁄LAYAN [email protected]
Customer Services and Logistics Dept. Manager Çetin EK‹NC‹ [email protected]
IT Manager Erkan BERBER [email protected]
Import Manager Canan Koç RANA [email protected]
Administrative Affairs Manager Selahattin GÜL [email protected]
Ankara District Manager Özcan AKDEN‹Z [email protected]
‹zmir District Manager Osman fiAH‹N [email protected]
Marketing and Communication Manager Özen BOZÇA⁄A BEZ‹RC‹ [email protected]
Group Sales Manager Mahmut ÖLÇER [email protected]
Retail Channel Sales Manager Atilla ALKAfi aalkas @index.com.tr
Electronic Sales and Marketing Manager Korkut YILDIRIM [email protected]
IBM e server Software Manager Cenk KANTAR [email protected]
OEM Sales Manager Elif fiEN [email protected]
HP Business Unit Manager Ebru KOÇO⁄LU [email protected]
Microsoft IBM and Lenovo Sales Manager Sedat AZ‹ZO⁄LU [email protected]
Asus, Dell, Toshiba, Canon Business Unit Manager Yeliz ÖZCAN [email protected]
ANNUAL REPORT 2009 ANNUAL REPORT 2009
15 16
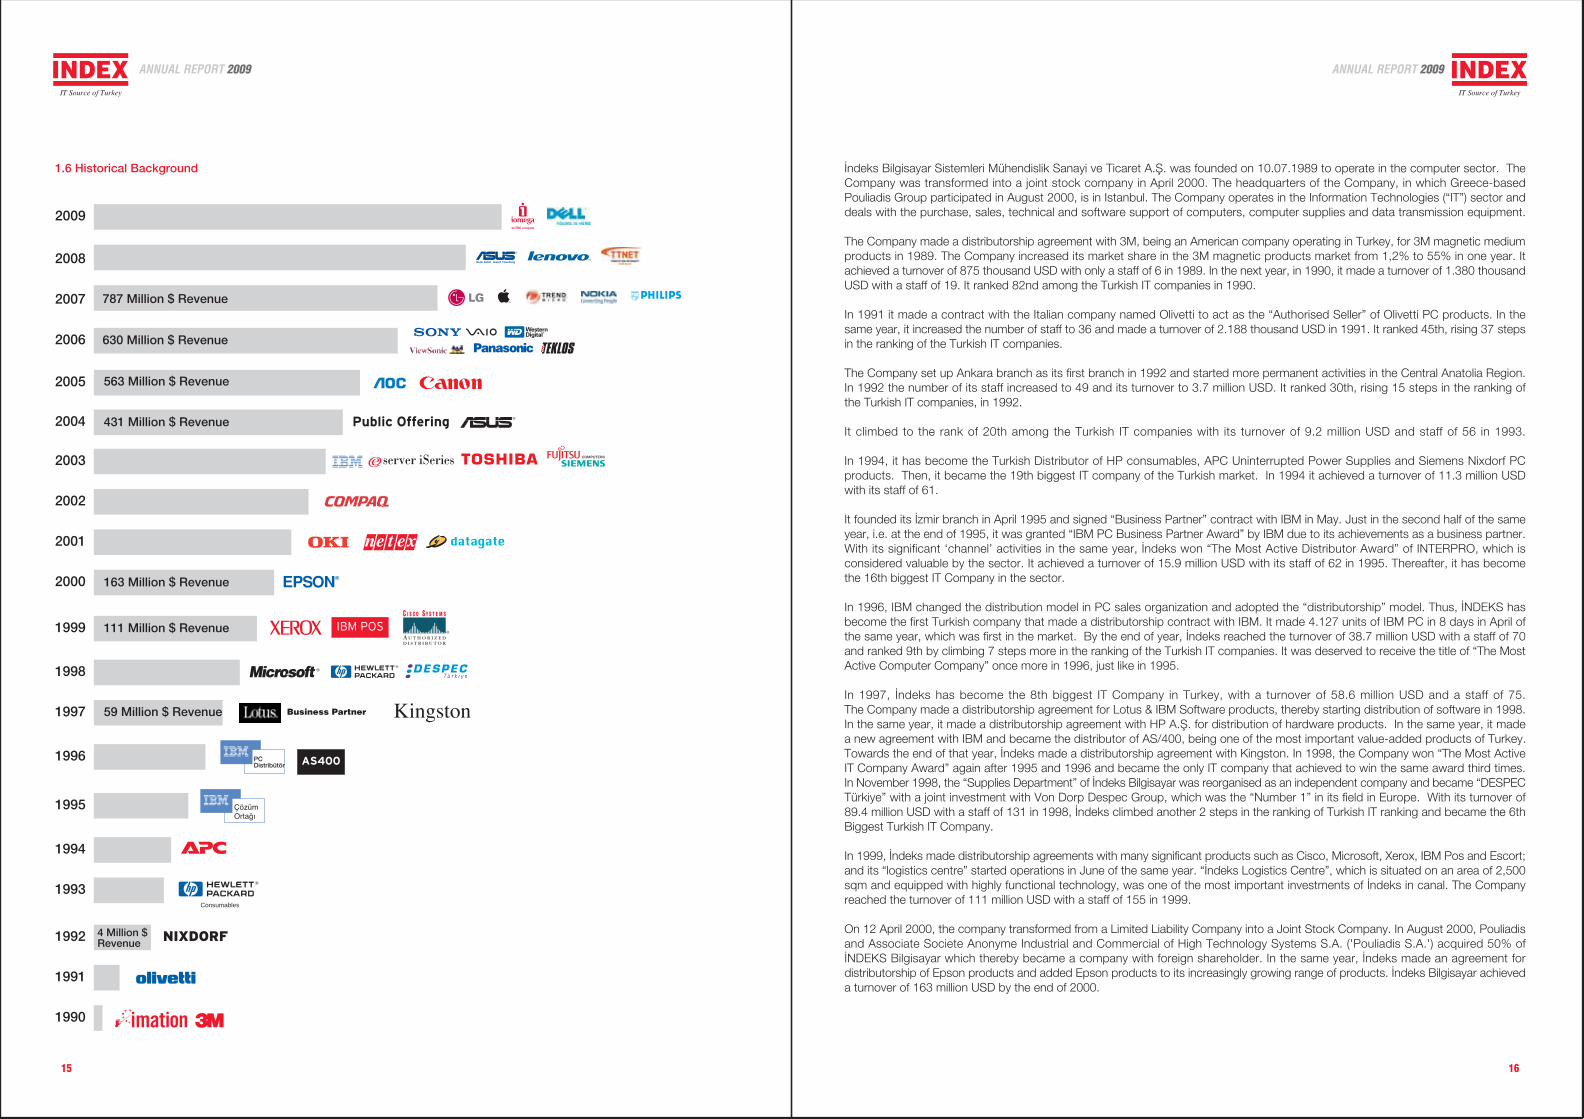
‹ndeks Bilgisayar Sistemleri Mühendislik Sanayi ve Ticaret A.fi. was founded on 10.07.1989 to operate in the computer sector. TheCompany was transformed into a joint stock company in April 2000. The headquarters of the Company, in which Greece-basedPouliadis Group participated in August 2000, is in Istanbul. The Company operates in the Information Technologies (“IT”) sector anddeals with the purchase, sales, technical and software support of computers, computer supplies and data transmission equipment.
The Company made a distributorship agreement with 3M, being an American company operating in Turkey, for 3M magnetic mediumproducts in 1989. The Company increased its market share in the 3M magnetic products market from 1,2% to 55% in one year. Itachieved a turnover of 875 thousand USD with only a staff of 6 in 1989. In the next year, in 1990, it made a turnover of 1.380 thousandUSD with a staff of 19. It ranked 82nd among the Turkish IT companies in 1990.
In 1991 it made a contract with the Italian company named Olivetti to act as the “Authorised Seller” of Olivetti PC products. In thesame year, it increased the number of staff to 36 and made a turnover of 2.188 thousand USD in 1991. It ranked 45th, rising 37 stepsin the ranking of the Turkish IT companies.
The Company set up Ankara branch as its first branch in 1992 and started more permanent activities in the Central Anatolia Region.In 1992 the number of its staff increased to 49 and its turnover to 3.7 million USD. It ranked 30th, rising 15 steps in the ranking ofthe Turkish IT companies, in 1992.
It climbed to the rank of 20th among the Turkish IT companies with its turnover of 9.2 million USD and staff of 56 in 1993.
In 1994, it has become the Turkish Distributor of HP consumables, APC Uninterrupted Power Supplies and Siemens Nixdorf PCproducts. Then, it became the 19th biggest IT company of the Turkish market. In 1994 it achieved a turnover of 11.3 million USDwith its staff of 61.
It founded its ‹zmir branch in April 1995 and signed “Business Partner” contract with IBM in May. Just in the second half of the sameyear, i.e. at the end of 1995, it was granted “IBM PC Business Partner Award” by IBM due to its achievements as a business partner.With its significant ‘channel’ activities in the same year, ‹ndeks won “The Most Active Distributor Award” of INTERPRO, which isconsidered valuable by the sector. It achieved a turnover of 15.9 million USD with its staff of 62 in 1995. Thereafter, it has becomethe 16th biggest IT Company in the sector.
In 1996, IBM changed the distribution model in PC sales organization and adopted the “distributorship” model. Thus, ‹NDEKS hasbecome the first Turkish company that made a distributorship contract with IBM. It made 4.127 units of IBM PC in 8 days in April ofthe same year, which was first in the market. By the end of year, ‹ndeks reached the turnover of 38.7 million USD with a staff of 70and ranked 9th by climbing 7 steps more in the ranking of the Turkish IT companies. It was deserved to receive the title of “The MostActive Computer Company” once more in 1996, just like in 1995.
In 1997, ‹ndeks has become the 8th biggest IT Company in Turkey, with a turnover of 58.6 million USD and a staff of 75.The Company made a distributorship agreement for Lotus & IBM Software products, thereby starting distribution of software in 1998.In the same year, it made a distributorship agreement with HP A.fi. for distribution of hardware products. In the same year, it madea new agreement with IBM and became the distributor of AS/400, being one of the most important value-added products of Turkey.Towards the end of that year, ‹ndeks made a distributorship agreement with Kingston. In 1998, the Company won “The Most ActiveIT Company Award” again after 1995 and 1996 and became the only IT company that achieved to win the same award third times.In November 1998, the “Supplies Department” of ‹ndeks Bilgisayar was reorganised as an independent company and became “DESPECTürkiye” with a joint investment with Von Dorp Despec Group, which was the “Number 1” in its field in Europe. With its turnover of89.4 million USD with a staff of 131 in 1998, ‹ndeks climbed another 2 steps in the ranking of Turkish IT ranking and became the 6thBiggest Turkish IT Company.
In 1999, ‹ndeks made distributorship agreements with many significant products such as Cisco, Microsoft, Xerox, IBM Pos and Escort;and its “logistics centre” started operations in June of the same year. “‹ndeks Logistics Centre”, which is situated on an area of 2,500sqm and equipped with highly functional technology, was one of the most important investments of ‹ndeks in canal. The Companyreached the turnover of 111 million USD with a staff of 155 in 1999.
On 12 April 2000, the company transformed from a Limited Liability Company into a Joint Stock Company. In August 2000, Pouliadisand Associate Societe Anonyme Industrial and Commercial of High Technology Systems S.A. ('Pouliadis S.A.') acquired 50% of‹NDEKS Bilgisayar which thereby became a company with foreign shareholder. In the same year, ‹ndeks made an agreement fordistributorship of Epson products and added Epson products to its increasingly growing range of products. ‹ndeks Bilgisayar achieveda turnover of 163 million USD by the end of 2000.
1.6 Historical Background
1990
2002
1998
1996 PCDistribütör AS400
1994
1995
NIXDORF1992
2005 563 Million $ Revenue
1999 IBM POS111 Million $ Revenue
Business Partner1997 59 Million $ Revenue
1993Consumables
4 Million $Revenue
Public Offering2004 431 Million $ Revenue
2000 163 Million $ Revenue
2003
2001
2006 630 Million $ Revenue
2008
2007 787 Million $ Revenue
2009
Kingston
ANNUAL REPORT 2009 ANNUAL REPORT 2009
1991
17 18
In 2001, the Company made a distributorship agreement with COMPAQ. With this agreement, ‹NDEKS blazed a trail being the onlydistributor dealing with IBM, HP and COMPAQ PC products. In the same year, ‹ndeks also made distributorship agreements for Novel,Sony and Microsoft OEM products. The Company continued its investments in spite of the economic crisis in 2001 and in March ofthe same year, it acquired 50.5% of Datagate Bilgisayar Malzemeleri Ticaret Afi. (DATAGATE), which is a leading company in Computerparts/OEM sector, thereby boosting the morale of the sector. In the same period, it acquired 70% of Neteks ‹letiflim Ürünleri Da¤›t›mA.fi. (NETEKS) , which is one of the highly experienced distribution companies in network, and continued its growth in spite of thecrisis. In the Turkey Top 500 ICT Companies Ranking performed by Interpro Medya A.fi. in 2001, our company ranked 1st in thecategory of “IT Hardware Incomes”, 2nd in the category of “Turkish IT Companies” and 11th in the general ranging of the ICT Sector.
In 2002, Oki printers and Toshiba notebook and server products were included in the ‹ndeks range of products.In July 2002, all companies of the group relocated to its current three-storey building with an indoor area of 10.000 sqm in the addressof Cendere Yolu, No: 23 Ka¤›thane. The turnover of the Company in 2002 was 189 million USD.
Products with Fujitsu Siemens and Nec brands were added to the product portfolio of the Company in 2003. Further, the share of‹ndeks in DATAGATE, of which 50.5% shares were acquired by ‹ndeks in 2001, thereby being an affiliate of the Company, was increasedto 85%. The consolidated turnover of the Company was realized as 323 million USD as of the end of 2003.
15.34% of the ‹ndeks Bilgisayar shares was offered to public on ISE via a capital increase through rights issue after restricting theexecution of pre-emptive rights of existing shareholders, on 24.06.2004. The Company made distributorship contracts with Kingmaxand Asus for memory and barebone products, respectively, in 2004 and started to distribute such products. In the same year, ‹ndeksBilgisayar A.fi. was awarded ISO 9001:2000 certificate.
On 02.02.2005, in accordance with the resolution of the Board of Directors dated 02.02.2005, ‹ndeks acquired 80% of NeotechTeknolojik Ürünler Da¤›t›m Anonim fiirketi for wholesale trade of consumer electronics and communication products as a new field ofoperation of the Company. In March 2005, the Registered Capital System was adopted, and its maximum registered capital wasapproved as TRL 75.000.000. In May 2005, the issued capital of ‹ndeks was increased from TRL 17.600.000 to 45.000.000. InSeptember 2005, the Company made an exclusive distributorship agreement with TPV Technology Limited, which manufactures 19,5%of the monitors in the global market and has realised a turnover of 4 billion USD in 2004, for distribution of AOC branded LCD, CRTMonitor, Plasma Monitor and LCD TV products in Turkey. According to the Top 500 Turkish ICT Companies report issued by Interproon 27.05.2005 for 2004, our Company ranked 1st in the categories of Notebooks, Desktop PCs, Print Systems, Servers, Data Backupand Storage Units, Office Software and OEM and 8th in the turnover-based general ranking of Turkey, in which Turk Telekom ranked1st. With these results, ‹ndeks Bilgisayar achieved to be the only local computer company in the Top Ten.
In February 2006, 30.30% of the shares of the second biggest company of the group and a subsidiary of ‹ndeks Bilgisayar, namelyDatagate Bilgisayar Malzemeleri Ticaret A.fi., was offered to public in February 2006. of was offered to public on ISE via a capitalincrease through rights issue after restricting the execution of pre-emptive rights of existing shareholders. Began to be traded on ISEon 10.02.2006 Thus, 2 companies of the group have been offered to public and begun to be traded on ISE. Partnership share of‹ndeks Bilgisayar decreased from 85% to 59.2% with the public offering of Datagate.
The issued capital of ‹ndeks Bilgisayar was increased from TRL 45.000.000 to TRL 55.000.000 in May 2006. TRL 8.718.703 out ofthe amount of increase, i.e. TRL 10.000.000, is covered from the profit of the period of 2005 and the remaining TRL 1.281.297 fromextraordinary reserves. ‹ndeks has executed one of the most important and greatest investments in ICT sector by purchasing KaradenizOrme A.S., which is founded on a 39.761 m2 land and having 18.969 m2 indoor area, in order to be used as a logistics centre. Thetrade name of Karadeniz Orme AS has been changed into Teklos Teknoloji Lojistik Hizmetler A.fi. and its field of activity has beencustomized to be able to work on the logistics services. The head office of the company moved to its new location on 26.10.2006.EVOS (Effective Efficient Operational Result-Oriented) ERP System developed by ‹ndeks A.fi. in 2006 was started to be used by ‹ndeksGroup Companies on 01.01.2007. EVOS Project was developed by the Software Engineers Group of ‹ndeks A.fi. within a period of9 months. Our Company and its subsidiaries included in the consolidated financial statements made distributorship agreements withCanon for printer, fax and scanner products, with Western Digital Corporation for hard disk products, with Panasonic for consumerelectronics, with Viewsonic for monitor products and with Sony Vaio for notebook products. According to the 2005 Turkey Top 500ICT Companies report issued Interpro in 2006, ‹ndeks Bilgisayar, with its turnover of 758.634 (thousand TRL), again ranked 1st in thecategory of companies selling only computers, like in 2004. With this result, the Company kept its special place as the only localcomputer company in the Top Ten. Moreover, it was ranked the biggest company in the category of markets with respect to theincomes from Server, Print Systems, OEM, Operating System, Office Software and E-Trade sales.
‹ndeks Bilgisayar and its subsidiaries made distributorship contracts with Philips for monitors and PC peripherals, Asus for notebookproducts, Apple IMC for Apple brand products, Trend Micro for software products for internet security and viruses, Nokia for E-seriesproducts, LG Electronics for notebook products in 2007. The issued capital of the Company was increased from TRL 55.000.000 toTRL 56.000.000 in July 2007. The amount of increase, i.e. TRL 1.000.000, is covered from the profit of the period of 2006.On 24.07.2007, ‹ndeks Bilgisayar and its subsidiary Datagate Bilgisayar A.fi sold 50% of their shares in Neteks ‹letiflim Ürünleri Da¤›t›mA.fi., an affiliate of ‹ndeks Bilgisayar, to Westcon Group Eurepean Operation Limited, one of the leading global companies in its field.Of the 50% shares sold, 26% and 24% were provided by ‹ndeks Bilgisayar Sistemleri Mühendislik Sanayi ve Ticaret A.fi and DatagateBilgisayar Malzemeleri Ticaret A.fi., respectively. Following such sale, Neteks become a JV of which shares are held by ‹ndeks BilgisayarA.fi. and Westcon Group on 50%-50% basis. It was the first time that with this agreement, Westcon Group made an investment inTurkey under a partnership; until then, it was operating only with its fully owned subsidiaries in 19 countries around the world.
According to the 2007 Turkey Top 500 ICT Companies Ranking performed by Interpro Medya A.fi., our company ranked seventh,one step higher than the previous year, in the general ranking based on turnover achieved in 2006 among the companies includingtelephone operators and mobile phone sellers. On the other hand, it ranked first with its sales income of 901.778 (thousand TRL),like the previous years, in the category of companies selling only computers. Further, it ranked first in nine ICT categories. The categoriesin which ‹ndeks Bilgisayar ranked first are the Portable computer wholesale trader and distributor, Data backup and storage hardware,Server, Print systems wholesale trader and distributor, Data communication hardware, OEM products, Operating system, Officesoftware wholesale trader and distributor and E-trade.
In 2008, ‹ndeks Bilgisayar made a distributorship agreement with LG, which is one of the most valuable brands of the world, fornotebooks, consumer products and monitors and with Asustek for Asus branded server products. In the same year, Neotech, beinga subsidiary of ‹ndeks Bilgisayar, and Datagate were appointed as the distributors of Wacom and Belkin products, respectively. OurCompany ranked sixth, one step higher than the previous year, in the general ranking based on sales made in 2007 among the first500 ICT companies including telephone operators and mobile phone sellers in Turkey. On the other hand, our Company ranked 1stwith a sales revenue of TRL 1.022.919 thousand TRL, like the previous years, in the category of companies selling only computers.Further, it ranked first in eight ICT categories.
In 2009, ‹ndeks Bilgisayar made distributorship agreements with Iomega and Dell and a supply contract with Best Buy. The contractsmade by Neotech A.fi., a subsidiary of ‹ndeks Bilgisayar, for Apple and Airties products were transferred to ‹ndeks Bilgisayar as a resultof the segment adjustments in this year. In the same period, Neteks, a 50% affiliate of ‹ndeks Bilgisayar, made distributorship agreementswith Juniper, IBM ISS and Avaya. On the other hand, Datagate A.fi. made a distributorship agreement with Fujitsu Siemens. ‹ndeksBilgisayar ranked 7th among the Turkey Top 500 ICT Companies with its sales income of 927.893 thousand TRL in the turnover-basedgeneral ranking as determined by Interpromedya A.fi. In the analysis of the general ranking results, ‹ndeks Bilgisayar ranked 1st, asthe previous years, among the companies dealing with computer trade only. Further, it ranked first in six ICT categories. Further,Datagate Bilgisayar Malzemeleri Tic. A.fi., which is a 59% subsidiary of ‹ndeks Bilgisayar, ranked first in the category of “OEM (computerparts)” incomes and Neteks ‹letiflim Da¤›t›m Ürünleri A.fi., which is a 50% subsidiary of ‹ndeks Bilgisayar, ranked first in the categoryof “Data Communication Hardware”.
ANNUAL REPORT 2009 ANNUAL REPORT 2009
19
2. SECTOR OF OPERATION
‹NDEKS B‹LG‹SAYAR S‹STEMLER‹ MÜHEND‹SL‹K SANAY‹ VE T‹CARET A.fi. ANNUAL REPORT 2009
ANNUAL REPORT 2009
21 22
2. Sector of Operation2.1 IT Sector
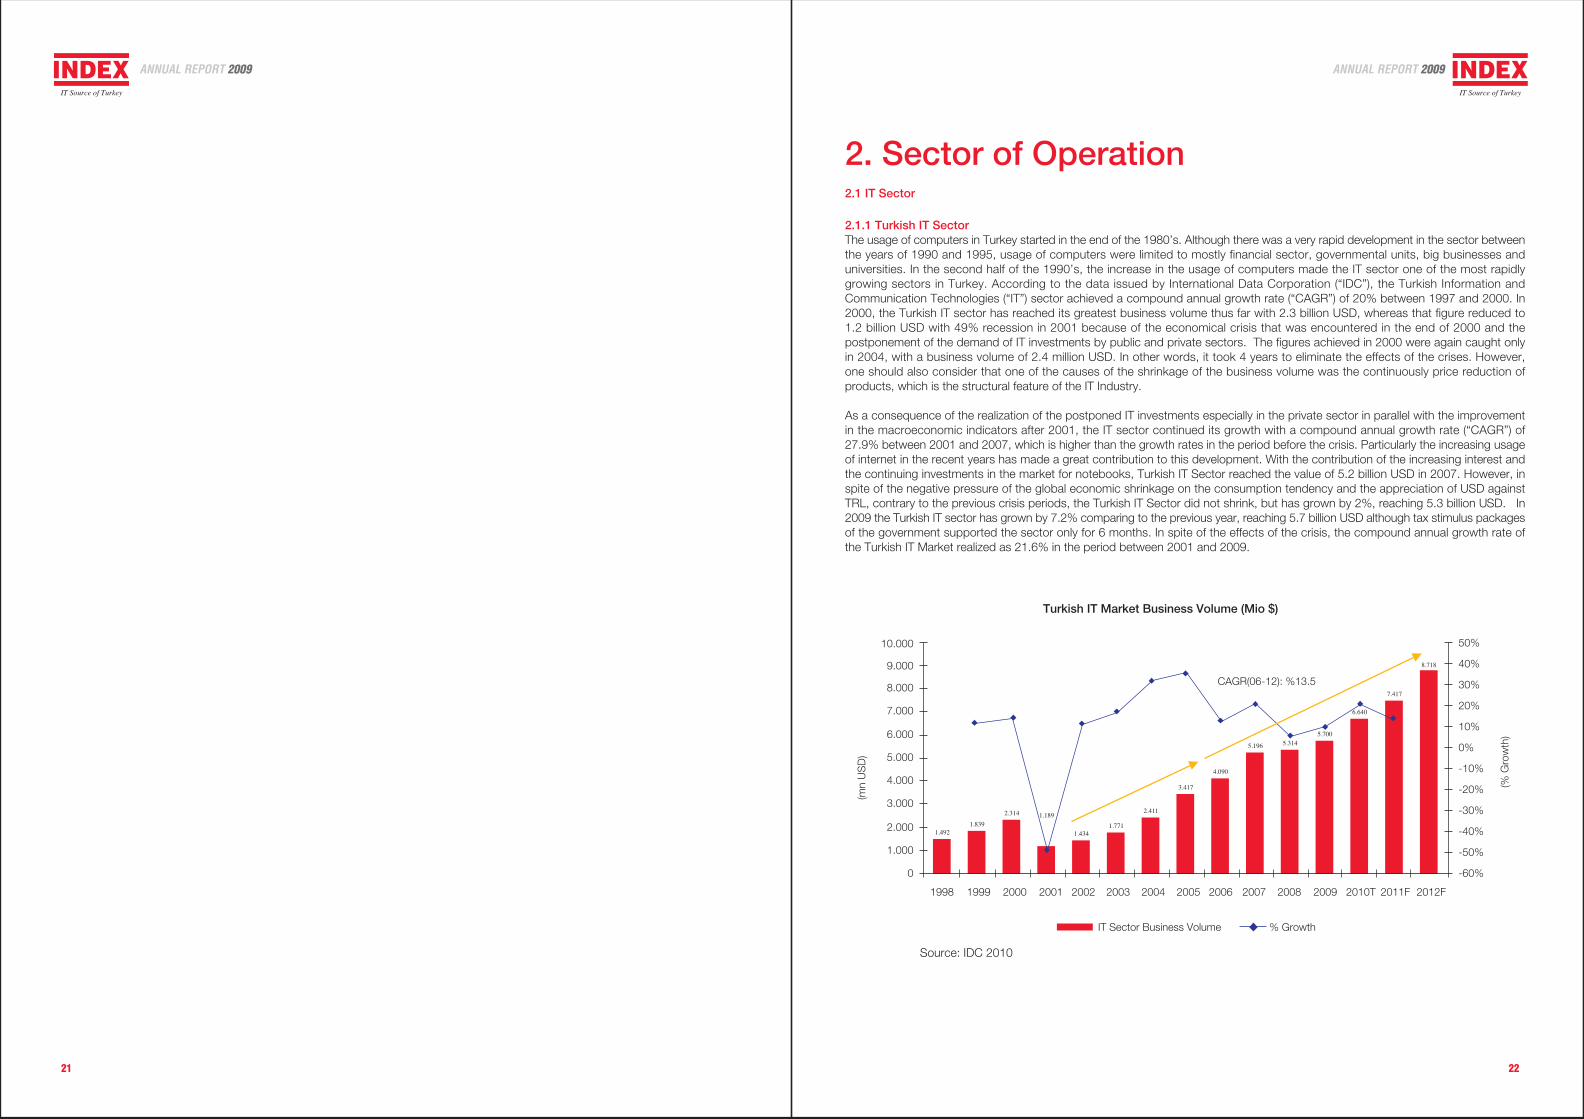
2.1.1 Turkish IT SectorThe usage of computers in Turkey started in the end of the 1980’s. Although there was a very rapid development in the sector betweenthe years of 1990 and 1995, usage of computers were limited to mostly financial sector, governmental units, big businesses anduniversities. In the second half of the 1990’s, the increase in the usage of computers made the IT sector one of the most rapidlygrowing sectors in Turkey. According to the data issued by International Data Corporation (“IDC”), the Turkish Information andCommunication Technologies (“IT”) sector achieved a compound annual growth rate (“CAGR”) of 20% between 1997 and 2000. In2000, the Turkish IT sector has reached its greatest business volume thus far with 2.3 billion USD, whereas that figure reduced to1.2 billion USD with 49% recession in 2001 because of the economical crisis that was encountered in the end of 2000 and thepostponement of the demand of IT investments by public and private sectors. The figures achieved in 2000 were again caught onlyin 2004, with a business volume of 2.4 million USD. In other words, it took 4 years to eliminate the effects of the crises. However,one should also consider that one of the causes of the shrinkage of the business volume was the continuously price reduction ofproducts, which is the structural feature of the IT Industry.
As a consequence of the realization of the postponed IT investments especially in the private sector in parallel with the improvementin the macroeconomic indicators after 2001, the IT sector continued its growth with a compound annual growth rate (“CAGR”) of27.9% between 2001 and 2007, which is higher than the growth rates in the period before the crisis. Particularly the increasing usageof internet in the recent years has made a great contribution to this development. With the contribution of the increasing interest andthe continuing investments in the market for notebooks, Turkish IT Sector reached the value of 5.2 billion USD in 2007. However, inspite of the negative pressure of the global economic shrinkage on the consumption tendency and the appreciation of USD againstTRL, contrary to the previous crisis periods, the Turkish IT Sector did not shrink, but has grown by 2%, reaching 5.3 billion USD. In2009 the Turkish IT sector has grown by 7.2% comparing to the previous year, reaching 5.7 billion USD although tax stimulus packagesof the government supported the sector only for 6 months. In spite of the effects of the crisis, the compound annual growth rate ofthe Turkish IT Market realized as 21.6% in the period between 2001 and 2009.
8.718
7.417
6.640
5.7005.3145.196
4.090
3.417
2.411
1.7711.434
1.1892.314
1.8391.492
Turkish IT Market Business Volume (Mio $)
1999 2000 2001 2002 2003 2004 2005 2006 2007 2008 2009 2010T
0
1.000
2.000
3.000
4.000
5.000
6.000
7.000
8.000
9.000
(mn
US
D)
CAGR(06-12): %13.5
IT Sector Business Volume % Growth
1998
-60%
-40%
-10%
0%
10%
30%
50%
(% G
row
th)
-50%
-30%
-20%
20%
40%
2011F
10.000
2012F
Source: IDC 2010
ANNUAL REPORT 2009 ANNUAL REPORT 2009
23 24
According to the 2010 Turkey IT Expenditures Research conducted by IDC, the Turkish IT market is expected to have a 13.5%compound annual growth rate (CAGR) in the period between 2006 and 2012, reaching 8.7 billion USD in 2012. IT investment demandsdeferred in the 2001 crisis period have been started to be realized with the appearance of the increasing stable outlook of the economyand these investment expenditures have been one of the most powerful dynamics of the market in the first 5 years following 2001.New investments that increased after merger and acquisition operations in all sectors, beginning in the finance and telecommunicationsectors and spread to other sectors from 2005 on, technology replacement investments, increased IT investment made by thegovernment as part of e-government projects, increase in the internet usage rates and finally, in the number of the users who followup the rapidly developing technology became the driving forces of the market between 2005 and 2008. Although the first quarter of2008 started very favourably, the sector started to lose its strength due to the suit brought to close AKP, a slowdown was experiencedin the third quarter when not so many negative results were observed. However, with the last quarter, the sector was affected bythe global financial crisis that started at the beginning of October, and thus, the quarter was closed with a double-digit shrinkage.2009 was experienced as a year when the wounds of the crisis were bandaged; the effects of the crisis in the first quarter diminishedwith the effect of the VAT cut applied for 6 months, including the second and third quarters, and positive growth was recorded in thefourth quarter. In 2009, hardware segments that represents 74% of the sector shrunk by 9.8%, service 1.6% and software by 0.8%.
Turkey has been one of the major developing countries due to the improving general economic conditions, increased per capita incomeand steps taken for globalization. In addition to highly qualified and cost effective human resources, majority of the young populationis contributing to the attractiveness of our country. When the pressure of the diminished consumption tendency on the IT Market dueto the crisis in 2008-2009 decreased, it is estimated that the IT sector will grow by 16.5 comparing to the previous year and with suchgrowth, the sector will reach 6.6 billion USD by the end of 2010.
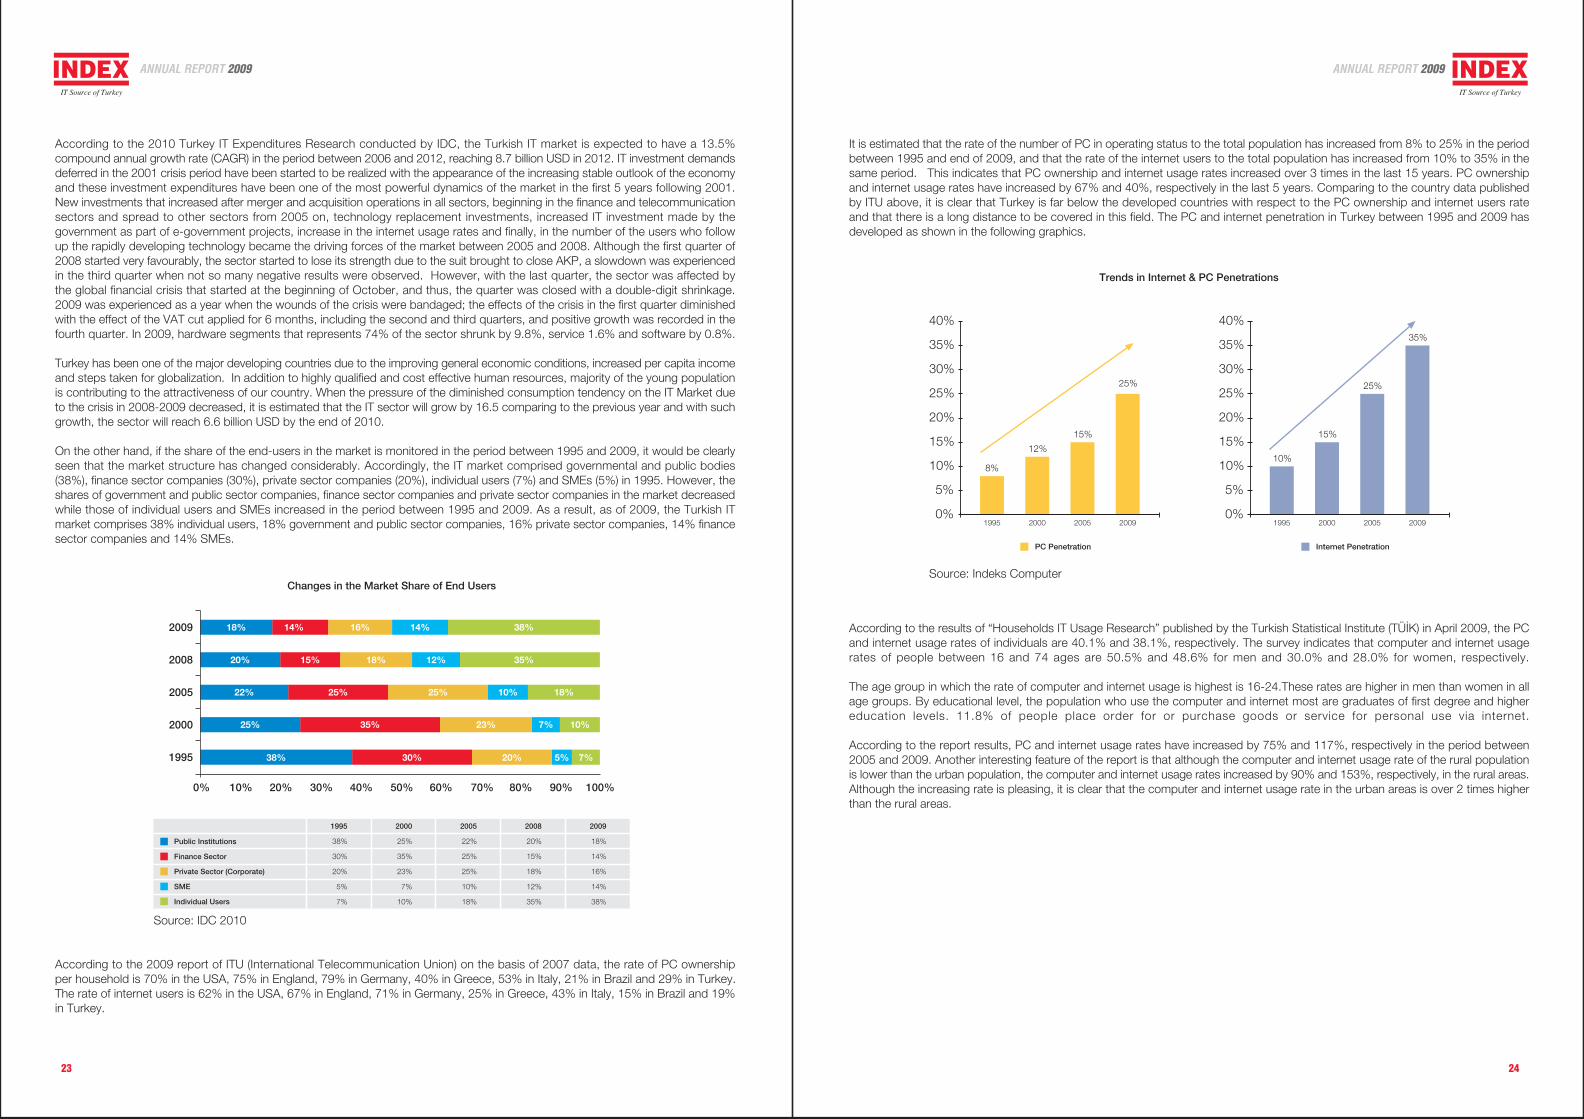
On the other hand, if the share of the end-users in the market is monitored in the period between 1995 and 2009, it would be clearlyseen that the market structure has changed considerably. Accordingly, the IT market comprised governmental and public bodies(38%), finance sector companies (30%), private sector companies (20%), individual users (7%) and SMEs (5%) in 1995. However, theshares of government and public sector companies, finance sector companies and private sector companies in the market decreasedwhile those of individual users and SMEs increased in the period between 1995 and 2009. As a result, as of 2009, the Turkish ITmarket comprises 38% individual users, 18% government and public sector companies, 16% private sector companies, 14% financesector companies and 14% SMEs.
It is estimated that the rate of the number of PC in operating status to the total population has increased from 8% to 25% in the periodbetween 1995 and end of 2009, and that the rate of the internet users to the total population has increased from 10% to 35% in thesame period. This indicates that PC ownership and internet usage rates increased over 3 times in the last 15 years. PC ownershipand internet usage rates have increased by 67% and 40%, respectively in the last 5 years. Comparing to the country data publishedby ITU above, it is clear that Turkey is far below the developed countries with respect to the PC ownership and internet users rateand that there is a long distance to be covered in this field. The PC and internet penetration in Turkey between 1995 and 2009 hasdeveloped as shown in the following graphics.
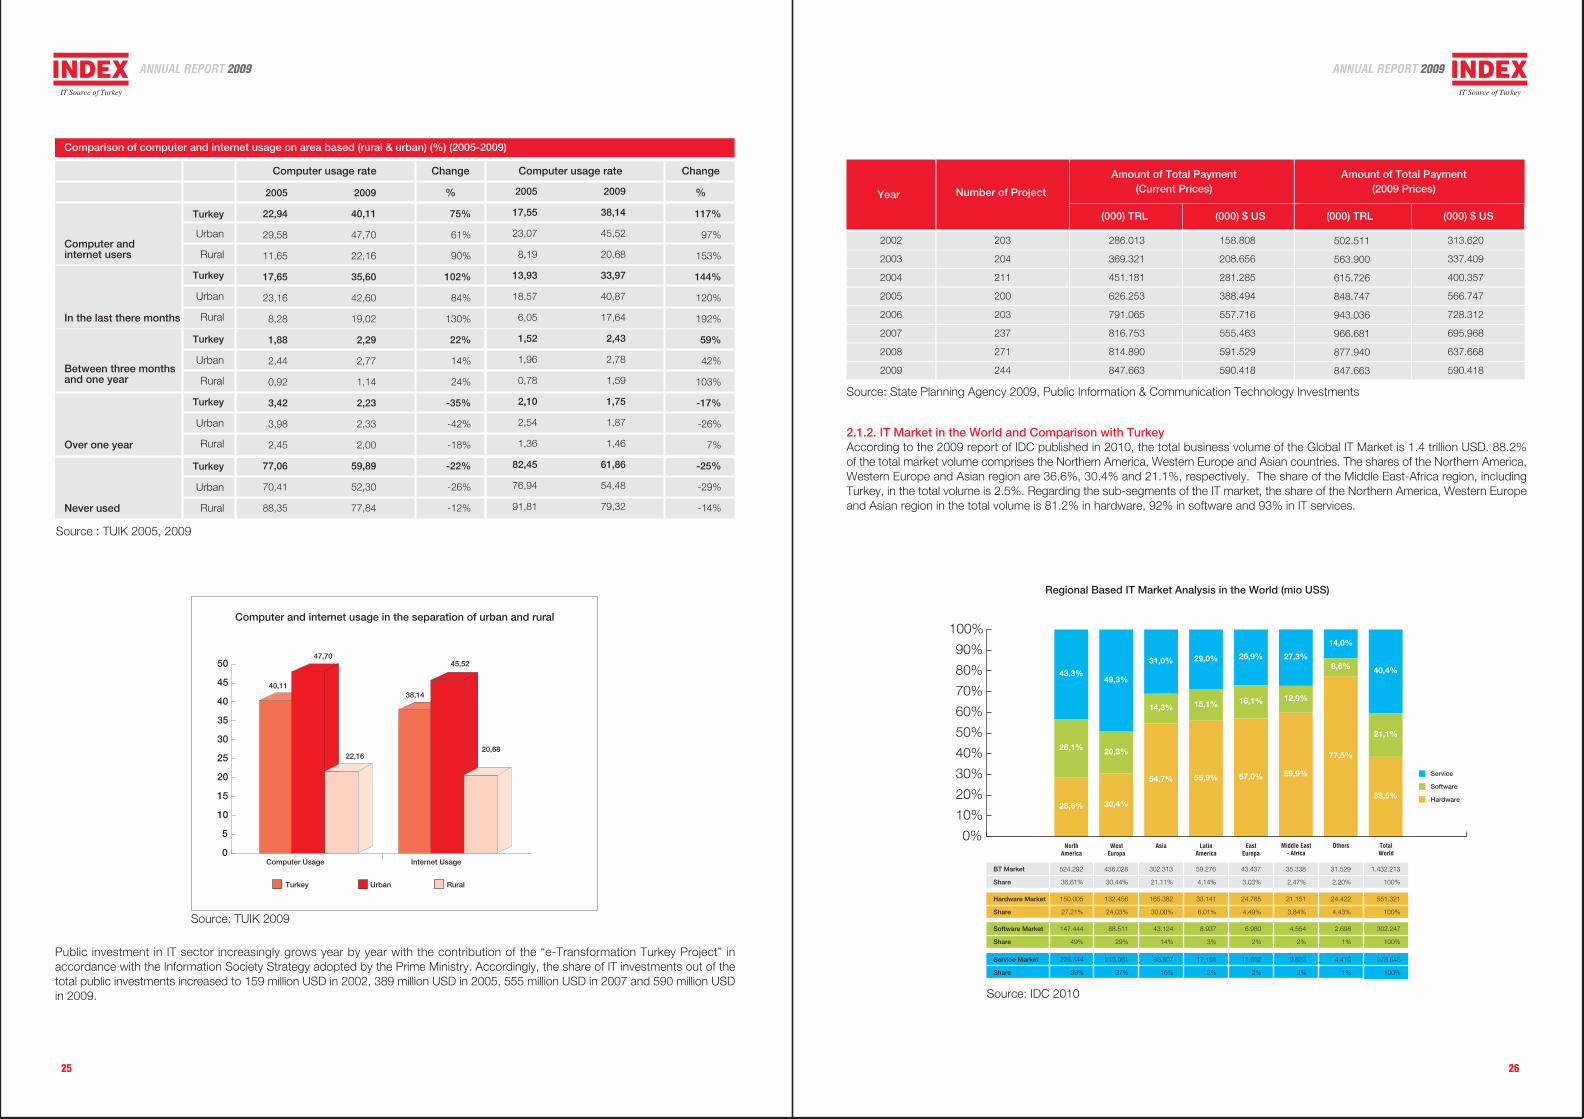
According to the results of “Households IT Usage Research” published by the Turkish Statistical Institute (TÜ‹K) in April 2009, the PCand internet usage rates of individuals are 40.1% and 38.1%, respectively. The survey indicates that computer and internet usagerates of people between 16 and 74 ages are 50.5% and 48.6% for men and 30.0% and 28.0% for women, respectively.
The age group in which the rate of computer and internet usage is highest is 16-24.These rates are higher in men than women in allage groups. By educational level, the population who use the computer and internet most are graduates of first degree and highereducation levels. 11.8% of people place order for or purchase goods or service for personal use via internet.
According to the report results, PC and internet usage rates have increased by 75% and 117%, respectively in the period between2005 and 2009. Another interesting feature of the report is that although the computer and internet usage rate of the rural populationis lower than the urban population, the computer and internet usage rates increased by 90% and 153%, respectively, in the rural areas.Although the increasing rate is pleasing, it is clear that the computer and internet usage rate in the urban areas is over 2 times higherthan the rural areas.
According to the 2009 report of ITU (International Telecommunication Union) on the basis of 2007 data, the rate of PC ownershipper household is 70% in the USA, 75% in England, 79% in Germany, 40% in Greece, 53% in Italy, 21% in Brazil and 29% in Turkey.The rate of internet users is 62% in the USA, 67% in England, 71% in Germany, 25% in Greece, 43% in Italy, 15% in Brazil and 19%in Turkey.
Changes in the Market Share of End Users
2009
0% 10% 20% 30% 40% 50% 60% 70% 80% 90% 100%
1995
2000
2005
2008
18% 14% 16% 14% 38%
20% 15% 18% 12% 35%
22% 25% 25% 10% 18%
25% 35% 23% 7% 10%
38% 30% 20% 5% 7%
Public Institutions
Finance Sector
Private Sector (Corporate)
SME
Individual Users
1995
38%
30%
20%
5%
7%
2000
25%
35%
23%
7%
10%
2005
22%
25%
25%
10%
18%
2008
20%
15%
18%
12%
35%
2009
18%
14%
16%
14%
38%
Source: IDC 2010
25%
15%
12%
8%
0%
5%
10%
15%
20%
25%
30%
35%
40%
2009200520001995
PC Penetration
35%
25%
15%
10%
0%
5%
10%
15%
20%
25%
30%
35%
40%
2009200520001995
Internet Penetration
Source: Indeks Computer
Trends in Internet & PC Penetrations
ANNUAL REPORT 2009 ANNUAL REPORT 2009
25 26
Public investment in IT sector increasingly grows year by year with the contribution of the “e-Transformation Turkey Project” inaccordance with the Information Society Strategy adopted by the Prime Ministry. Accordingly, the share of IT investments out of thetotal public investments increased to 159 million USD in 2002, 389 million USD in 2005, 555 million USD in 2007 and 590 million USDin 2009.
Year Number of Project
(000) TRLÜrünleri
(000) $ US (000) TRL (000) $ US
Amount of Total Payment(Current Prices)
Amount of Total Payment(2009 Prices)
Source: State Planning Agency 2009, Public Information & Communication Technology Investments
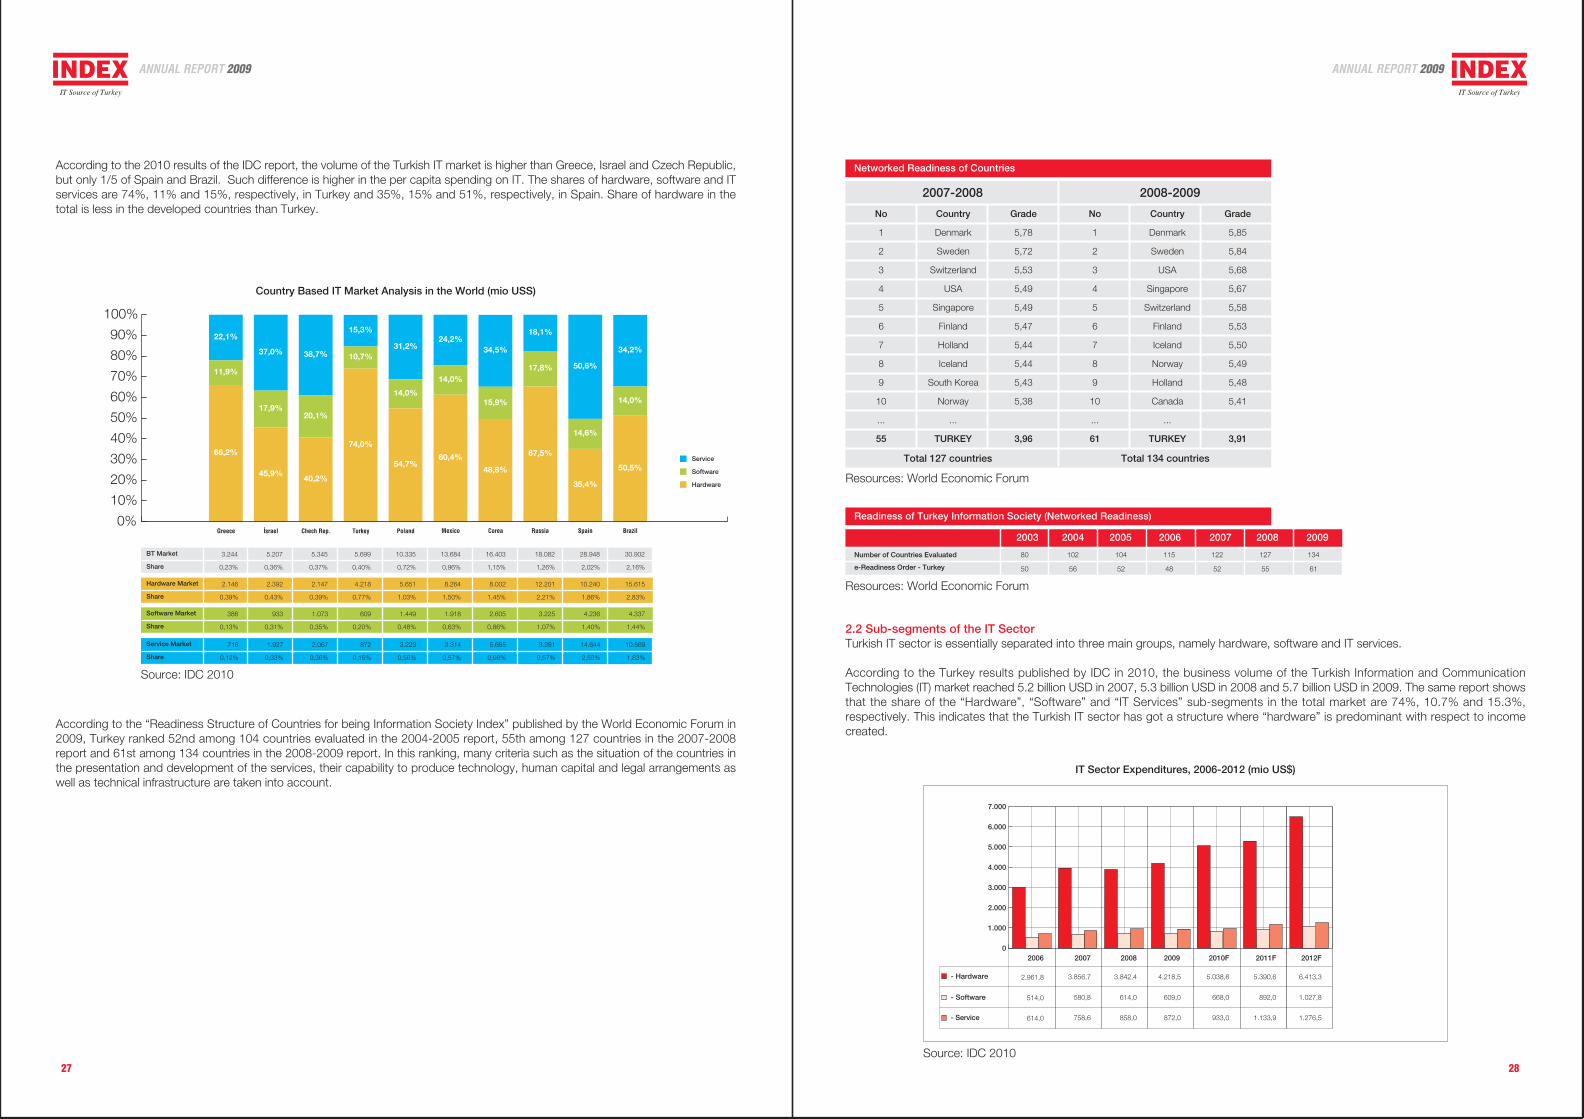
2.1.2. IT Market in the World and Comparison with TurkeyAccording to the 2009 report of IDC published in 2010, the total business volume of the Global IT Market is 1.4 trillion USD. 88.2%of the total market volume comprises the Northern America, Western Europe and Asian countries. The shares of the Northern America,Western Europe and Asian region are 36.6%, 30.4% and 21.1%, respectively. The share of the Middle East-Africa region, includingTurkey, in the total volume is 2.5%. Regarding the sub-segments of the IT market, the share of the Northern America, Western Europeand Asian region in the total volume is 81.2% in hardware, 92% in software and 93% in IT services.
2002
2003
2004
2005
2006
2007
2008
2009
203
204
211
200
203
237
271
244
286.013
369.321
451.181
626.253
791.065
816.753
814.890
847.663
158.808
208.656
281.285
388.494
557.716
555.463
591.529
590.418
502.511
563.900
615.726
848.747
943.036
966.681
877.940
847.663
313.620
337.409
400.357
566.747
728.312
695.968
637.668
590.418
Regional Based IT Market Analysis in the World (mio USS)
Comparison of computer and internet usage on area based (rural & urban) (%) (2005-2009)
Computer usage rate
Turkey
Urban
Rural
Computer usage rate
In the last there months
Computer andinternet users
Between three monthsand one year
Over one year
Never used
2005
22,94
29,58
11,65
17,65
23,16
8,28
1,88
2,44
0,92
3,42
3,98
2,45
77,06
70,41
88,35
2009
40,11
47,70
22,16
35,60
42,60
19,02
2,29
2,77
1,14
2,23
2,33
2,00
59,89
52,30
77,84
Change
%
75%
61%
90%
102%
84%
130%
22%
14%
24%
-35%
-42%
-18%
-22%
-26%
-12%
2005
17,55
23,07
8,19
13,93
18,57
6,05
1,52
1,96
0,78
2,10
2,54
1,36
82,45
76,94
91,81
2009
38,14
45,52
20,68
33,97
40,87
17,64
2,43
2,78
1,59
1,75
1,87
1,46
61,86
54,48
79,32
Change
%
117%
97%
153%
144%
120%
192%
59%
42%
103%
-17%
-26%
7%
-25%
-29%
-14%
Source : TUIK 2005, 2009
Computer and internet usage in the separation of urban and rural
0
5
10
15
20
25
30
35
40
40,11
47,70
22,16
38,14
45,52
20,68
Computer Usage Internet Usage
Turkey Urban Rural
45
50
0%
10%
20%
30%
40%
50%
60%
70%
80%
90%
100%
43,3%
28,1%
28,6%
49,3%
20,3%
30,4%
40,4%
21,1%
38,5%
31,0%
14,3%
54,7%
29,0%
15,1%
55,9%
26,9%
16,1%
57,0%
27,3%
12,9%
59,9%
14,0%
8,6%
77,5%
BT Market
Share
524.292
36,61%
436.028
30,44%
302.313
21,11%
59.276
4,14%
43.437
3,03%
35.338
2,47%
31.529
2,20%
1.432.213
100%
NorthAmerica
WestEuropa
TotalWorld
Asia LatinAmerica
EastEuropa
Middle East- Africa
Others
Hardware Market
Share
150.005
27,21%
132.456
24,03%
165.382
30,00%
33.141
6,01%
24.765
4,49%
21.151
3,84%
24.422
4,43%
551.321
100%
Software Market
Share
147.444
49%
88.511
29%
43.124
14%
8.937
3%
6.980
2%
4.554
2%
2.698
1%
302.247
100%
Service Market
Share
226.844
39%
215.061
37%
93.807
16%
17.198
3%
11.692
2%
9.633
2%
4.410
1%
578.645
100%
Service
Software
Hardware
Source: TUIK 2009
Source: IDC 2010
Turkey
Urban
Rural
Turkey
Urban
Rural
Turkey
Urban
Rural
Turkey
Urban
Rural
ANNUAL REPORT 2009 ANNUAL REPORT 2009
27 28
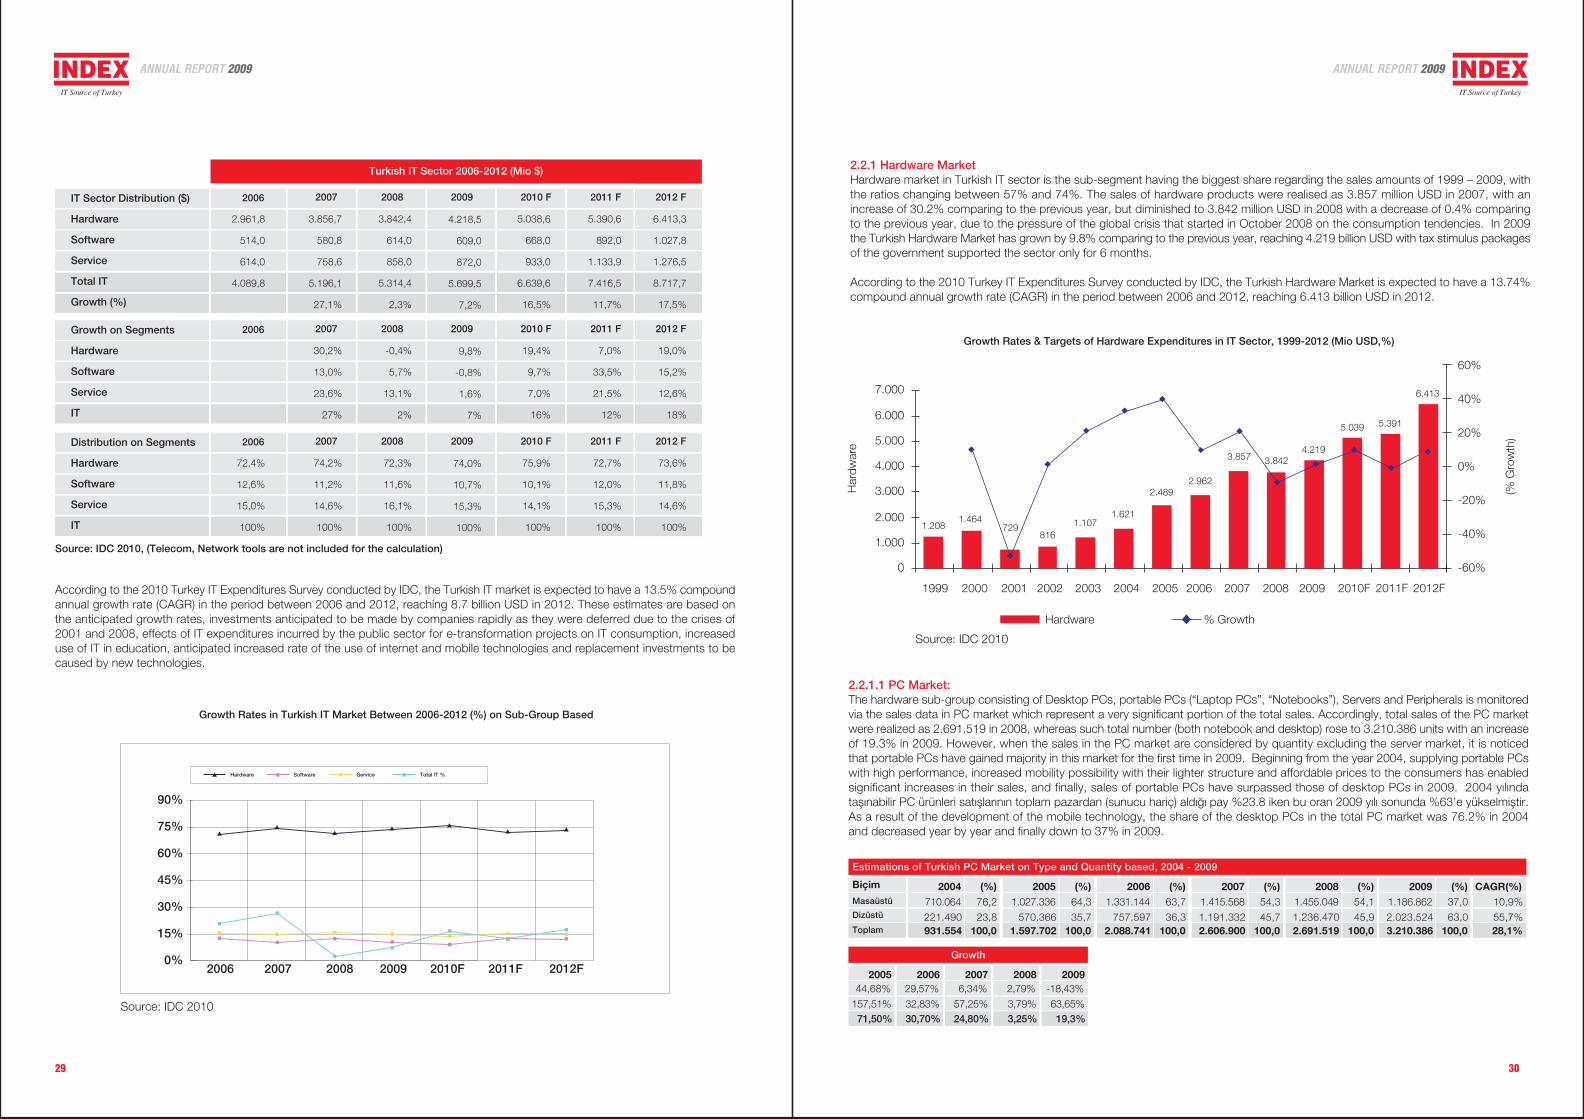
According to the 2010 results of the IDC report, the volume of the Turkish IT market is higher than Greece, Israel and Czech Republic,but only 1/5 of Spain and Brazil. Such difference is higher in the per capita spending on IT. The shares of hardware, software and ITservices are 74%, 11% and 15%, respectively, in Turkey and 35%, 15% and 51%, respectively, in Spain. Share of hardware in thetotal is less in the developed countries than Turkey.
According to the “Readiness Structure of Countries for being Information Society Index” published by the World Economic Forum in2009, Turkey ranked 52nd among 104 countries evaluated in the 2004-2005 report, 55th among 127 countries in the 2007-2008report and 61st among 134 countries in the 2008-2009 report. In this ranking, many criteria such as the situation of the countries inthe presentation and development of the services, their capability to produce technology, human capital and legal arrangements aswell as technical infrastructure are taken into account.
2.2 Sub-segments of the IT SectorTurkish IT sector is essentially separated into three main groups, namely hardware, software and IT services.
According to the Turkey results published by IDC in 2010, the business volume of the Turkish Information and CommunicationTechnologies (IT) market reached 5.2 billion USD in 2007, 5.3 billion USD in 2008 and 5.7 billion USD in 2009. The same report showsthat the share of the “Hardware”, “Software” and “IT Services” sub-segments in the total market are 74%, 10.7% and 15.3%,respectively. This indicates that the Turkish IT sector has got a structure where “hardware” is predominant with respect to incomecreated.
IT Sector Expenditures, 2006-2012 (mio US$)
0
1.000
2.000
3.000
4.000
5.000
6.000
7.000
2006 2007 2008 2009 2010F 2011F
2.961,8 3.856,7 3.842,4 4.218,5 5.038,6 5.390,6
514,0 580,8 614,0 609,0 668,0 892,0
614,0 758,6 858,0 872,0 933,0 1.133,9- Service
- Software
- Hardware
2012F
6.413,3
1.027,8
1.276,5
Source: IDC 2010
66,2%
50,5%45,9%
74,0%
54,7%60,4%
48,8%
67,5%
22,1%
34,2%37,0% 38,7%
15,3%
31,2%24,2%
34,5%
18,1%
50,6%11,9%
14,0%17,9%
20,1%
10,7%
14,0%
14,0%
15,9%
17,8%
14,6%
35,4%
0%
10%
20%
30%
40%
50%
60%
70%
80%
90%
100%
3.244
0,23%
5.207
0,36%
5.345
0,37%
5.699
0,40%
10.335
0,72%
13.684
0,96%
16.403
1,15%
Greece ‹srael Chech Rep. Turkey Poland Mexico Corea
2.146
0,39%
2.392
0,43%
2.147
0,39%
4.218
0,77%
5.651
1,03%
8.264
1,50%
8.002
1,45%
386
0,13%
933
0,31%
1.073
0,35%
609
0,20%
1.449
0,48%
1.918
0,63%
2.605
0,86%
716
0,12%
1.927
0,33%
2.067
0,36%
872
0,15%
3.223
0,56%
3.314
0,57%
5.655
0,98%
18.082
1,26%
Russia
12.201
2,21%
3.225
1,07%
3.281
0,57%
Service
Software
Hardware
28.948
2,02%
Spain
10.240
1,86%
4.236
1,40%
14.644
2,53%
30.902
2,16%
Brazil
15.615
2,83%
4.337
1,44%
10.569
1,83%
Country Based IT Market Analysis in the World (mio USS)
2007-2008
No
1
2
3
4
5
6
7
8
9
10
...
55
2008-2009
Country
Denmark
Sweden
Switzerland
USA
Singapore
Finland
Holland
Iceland
South Korea
Norway
...
TURKEY
Grade
5,78
5,72
5,53
5,49
5,49
5,47
5,44
5,44
5,43
5,38
3,96
Total 127 countries
No
1
2
3
4
5
6
7
8
9
10
...
61
Country
Denmark
Sweden
USA
Singapore
Switzerland
Finland
Iceland
Norway
Holland
Canada
...
TURKEY
Total 134 countries
Networked Readiness of Countries
Grade
5,85
5,84
5,68
5,67
5,58
5,53
5,50
5,49
5,48
5,41
3,91
Number of Countries Evaluated 80
50
102
56
104
52
115
48
122
52
127
55
134
61e-Readiness Order - Turkey
2003 2004 2005 2006 2007 2008 2009
Readiness of Turkey Information Society (Networked Readiness)
Source: IDC 2010
Resources: World Economic Forum
Resources: World Economic Forum40,2%
BT Market
Share
Hardware Market
Share
Software Market
Share
Service Market
Share
ANNUAL REPORT 2009 ANNUAL REPORT 2009
3029
2006 2007 2008 2009 2010 F 2011 FGrowth on Segments
Hardware
Software
Service
IT
30,2%
13,0%
23,6%
27%
-0,4%
5,7%
13,1%
2%
9,8%
-0,8%
1,6%
7%
19,4%
9,7%
7,0%
16%
7,0%
33,5%
21,5%
12%
2012 F
19,0%
15,2%
12,6%
18%
Turkish IT Sector 2006-2012 (Mio $)
2006 2007 2008 2009 2010 F 2011 FIT Sector Distribution ($)
Hardware
Software
Service
Total IT
Growth (%)
2.961,8
514,0
614,0
4.089,8
3.856,7
580,8
758,6
5.196,1
27,1%
3.842,4
614,0
858,0
5.314,4
2,3%
4.218,5
609,0
872,0
5.699,5
7,2%
5.038,6
668,0
933,0
6.639,6
16,5%
5.390,6
892,0
1.133,9
7.416,5
11,7%
2012 F
6.413,3
1.027,8
1.276,5
8.717,7
17,5%
2006 2007 2008 2009 2010 F 2011 FDistribution on Segments
Hardware
Software
Service
IT
74,2%
11,2%
14,6%
100%
72,3%
11,6%
16,1%
100%
74,0%
10,7%
15,3%
100%
75,9%
10,1%
14,1%
100%
72,7%
12,0%
15,3%
100%
2012 F
73,6%
11,8%
14,6%
100%
72,4%
12,6%
15,0%
100%
According to the 2010 Turkey IT Expenditures Survey conducted by IDC, the Turkish IT market is expected to have a 13.5% compoundannual growth rate (CAGR) in the period between 2006 and 2012, reaching 8.7 billion USD in 2012. These estimates are based onthe anticipated growth rates, investments anticipated to be made by companies rapidly as they were deferred due to the crises of2001 and 2008, effects of IT expenditures incurred by the public sector for e-transformation projects on IT consumption, increaseduse of IT in education, anticipated increased rate of the use of internet and mobile technologies and replacement investments to becaused by new technologies.
2.2.1 Hardware MarketHardware market in Turkish IT sector is the sub-segment having the biggest share regarding the sales amounts of 1999 – 2009, withthe ratios changing between 57% and 74%. The sales of hardware products were realised as 3.857 million USD in 2007, with anincrease of 30.2% comparing to the previous year, but diminished to 3.842 million USD in 2008 with a decrease of 0.4% comparingto the previous year, due to the pressure of the global crisis that started in October 2008 on the consumption tendencies. In 2009the Turkish Hardware Market has grown by 9.8% comparing to the previous year, reaching 4.219 billion USD with tax stimulus packagesof the government supported the sector only for 6 months.
According to the 2010 Turkey IT Expenditures Survey conducted by IDC, the Turkish Hardware Market is expected to have a 13.74%compound annual growth rate (CAGR) in the period between 2006 and 2012, reaching 6.413 billion USD in 2012.
2.2.1.1 PC Market:The hardware sub-group consisting of Desktop PCs, portable PCs (“Laptop PCs”, “Notebooks”), Servers and Peripherals is monitoredvia the sales data in PC market which represent a very significant portion of the total sales. Accordingly, total sales of the PC marketwere realized as 2.691.519 in 2008, whereas such total number (both notebook and desktop) rose to 3.210.386 units with an increaseof 19.3% in 2009. However, when the sales in the PC market are considered by quantity excluding the server market, it is noticedthat portable PCs have gained majority in this market for the first time in 2009. Beginning from the year 2004, supplying portable PCswith high performance, increased mobility possibility with their lighter structure and affordable prices to the consumers has enabledsignificant increases in their sales, and finally, sales of portable PCs have surpassed those of desktop PCs in 2009. 2004 y›l›ndatafl›nabilir PC ürünleri sat›fllar›n›n toplam pazardan (sunucu hariç) ald›¤› pay %23.8 iken bu oran 2009 y›l› sonunda %63’e yükselmifltir.As a result of the development of the mobile technology, the share of the desktop PCs in the total PC market was 76.2% in 2004and decreased year by year and finally down to 37% in 2009.
Growth Rates in Turkish IT Market Between 2006-2012 (%) on Sub-Group Based
Source: IDC 2010
0%
15%
30%
45%
60%
75%
90%
2006 2007 2008 2009 2010F 2011F
Hardware Software Service Total IT %
2012F
Growth Rates & Targets of Hardware Expenditures in IT Sector, 1999-2012 (Mio USD,%)
Source: IDC 2010
0
1.000
2.000
3.000
4.000
5.000
6.000
7.000
1999 2000 2001 2002 2003 2004 2005 2006 2007 2008 2009 2010F
Hardware % Growth
1.2081.464
729816
1.1071.621
2.4892.962
3.857 3.8424.219
5.039
2011F
5.391
-60%
-40%
-20%
0%
20%
40%
60%
(% G
row
th)
Har
dwar
e
2012F
6.413
Source: IDC 2010, (Telecom, Network tools are not included for the calculation)
Biçim
Masaüstü
Dizüstü
(%)76,2
23,8
2004710.064
221.490
Estimations of Turkish PC Market on Type and Quantity based, 2004 - 2009
2005 (%)1.027.336 64,3
570.366 35,7
2006 (%)1.331.144 63,7
757.597 36,3
2007 (%)1.415.568 54,3
1.191.332 45,7
CAGR(%)10,9%
55,7%
2008 (%)1.455.049 54,1
1.236.470 45,9
2009 (%)1.186.862 37,0
2.023.524 63,0Toplam 100,0931.554 1.597.702 100,0 2.088.741 100,0 2.606.900 100,0 28,1%2.691.519 100,0 3.210.386 100,0
200544,68%
157,51%
200629,57%
32,83%
20076,34%
57,25%
Growth
20082,79%
3,79%
2009-18,43%
63,65%71,50% 30,70% 24,80% 3,25% 19,3%
ANNUAL REPORT 2009 ANNUAL REPORT 2009
31 32
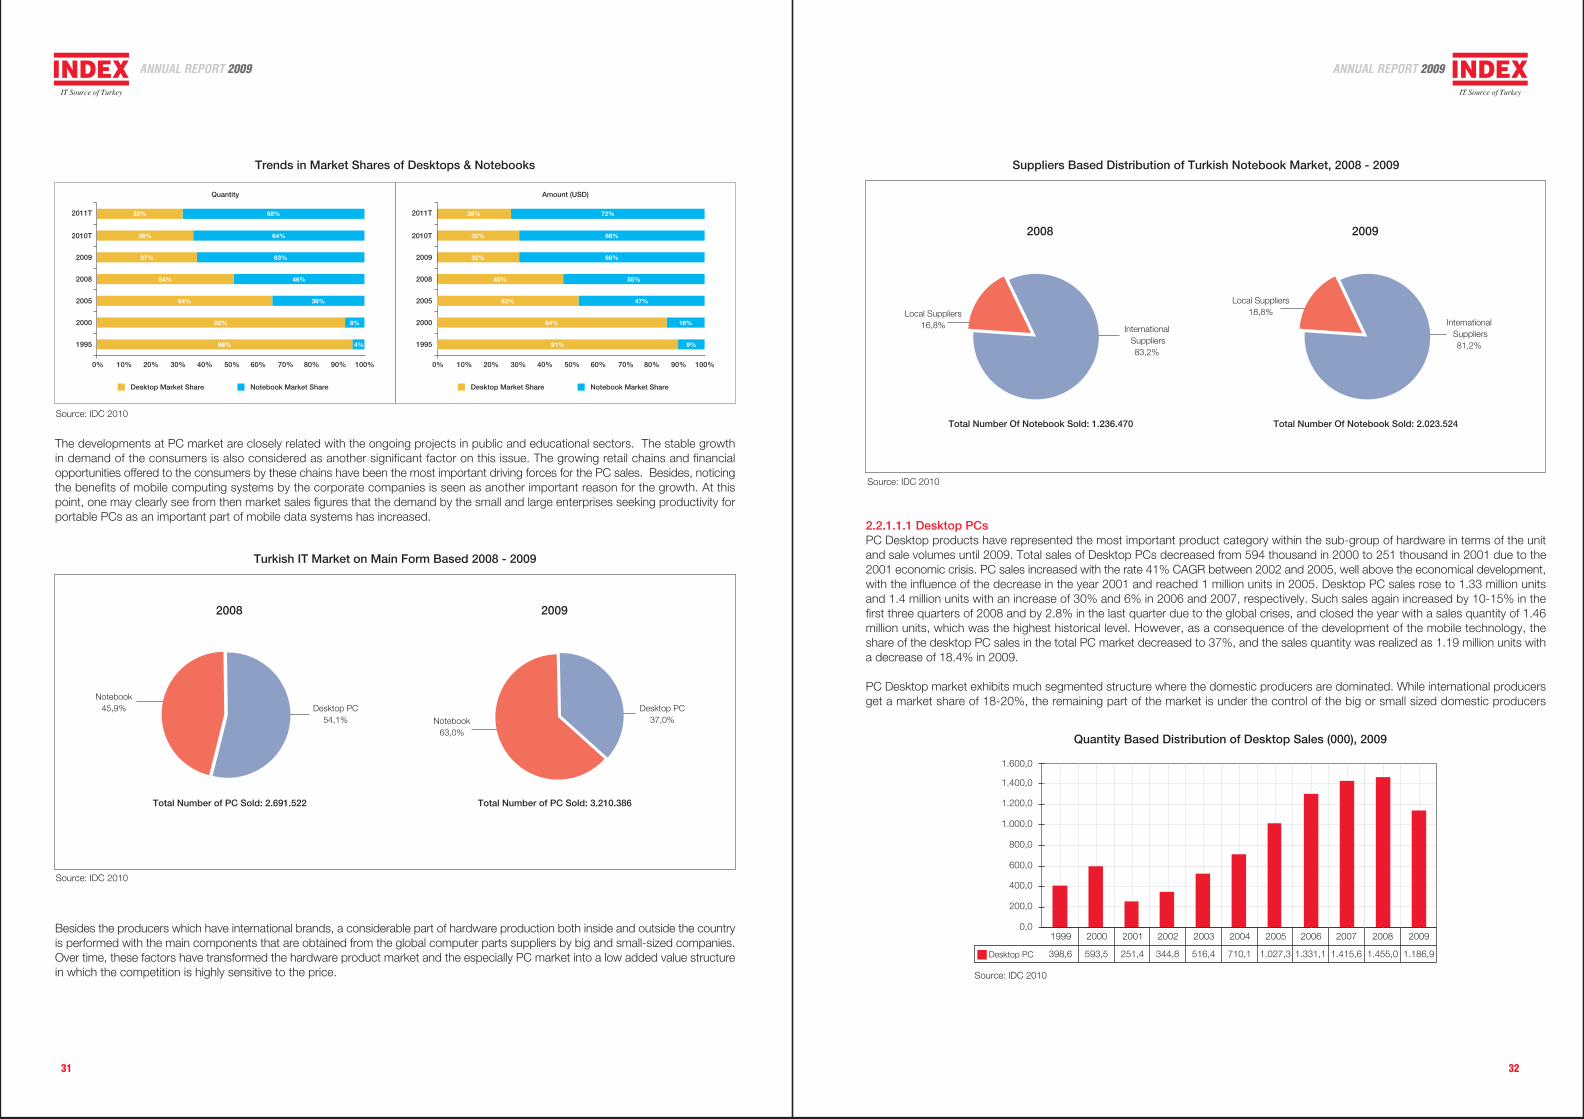
The developments at PC market are closely related with the ongoing projects in public and educational sectors. The stable growthin demand of the consumers is also considered as another significant factor on this issue. The growing retail chains and financialopportunities offered to the consumers by these chains have been the most important driving forces for the PC sales. Besides, noticingthe benefits of mobile computing systems by the corporate companies is seen as another important reason for the growth. At thispoint, one may clearly see from then market sales figures that the demand by the small and large enterprises seeking productivity forportable PCs as an important part of mobile data systems has increased.
Besides the producers which have international brands, a considerable part of hardware production both inside and outside the countryis performed with the main components that are obtained from the global computer parts suppliers by big and small-sized companies.Over time, these factors have transformed the hardware product market and the especially PC market into a low added value structurein which the competition is highly sensitive to the price.
2.2.1.1.1 Desktop PCsPC Desktop products have represented the most important product category within the sub-group of hardware in terms of the unitand sale volumes until 2009. Total sales of Desktop PCs decreased from 594 thousand in 2000 to 251 thousand in 2001 due to the2001 economic crisis. PC sales increased with the rate 41% CAGR between 2002 and 2005, well above the economical development,with the influence of the decrease in the year 2001 and reached 1 million units in 2005. Desktop PC sales rose to 1.33 million unitsand 1.4 million units with an increase of 30% and 6% in 2006 and 2007, respectively. Such sales again increased by 10-15% in thefirst three quarters of 2008 and by 2.8% in the last quarter due to the global crises, and closed the year with a sales quantity of 1.46million units, which was the highest historical level. However, as a consequence of the development of the mobile technology, theshare of the desktop PC sales in the total PC market decreased to 37%, and the sales quantity was realized as 1.19 million units witha decrease of 18.4% in 2009.
PC Desktop market exhibits much segmented structure where the domestic producers are dominated. While international producersget a market share of 18-20%, the remaining part of the market is under the control of the big or small sized domestic producers
Trends in Market Shares of Desktops & Notebooks
54% 46%
37% 63%
36% 64%
2009
0% 10% 20% 30% 40% 50% 60% 70% 80% 90% 100%
1995
2000
2005
2008
2010T
2011T 32% 68%
64% 36%
92% 8%
96% 4%
Quantity
45% 55%
32% 68%
32% 68%
2009
0% 10% 20% 30% 40% 50% 60% 70% 80% 90% 100%
1995
2000
2005
2008
2010T
2011T 28% 72%
53% 47%
84% 16%
91% 9%
Amount (USD)
Desktop Market Share Notebook Market Share Desktop Market Share Notebook Market Share
Notebook45,9%
Turkish IT Market on Main Form Based 2008 - 2009
Desktop PC54,1%
2008
Total Number of PC Sold: 2.691.522
Notebook63,0%
Desktop PC37,0%
2009
Total Number of PC Sold: 3.210.386
Source: IDC 2010
Local Suppliers16,8%
Suppliers Based Distribution of Turkish Notebook Market, 2008 - 2009
International Suppliers
83,2%
2008
Total Number Of Notebook Sold: 1.236.470
Local Suppliers18,8%
International Suppliers
81,2%
2009
Total Number Of Notebook Sold: 2.023.524
Source: IDC 2010
Quantity Based Distribution of Desktop Sales (000), 2009
Source: IDC 2010
200,0
400,0
600,0
800,0
1.000,0
1.200,0
1.400,0
Desktop PC 398,6 593,5 251,4 344,8 516,4 710,1 1.027,3 1.331,1
1999 2000 2001 2002 2003 2004 2005 2006 2007
1.600,0
1.415,6
2008
1.455,0
2009
1.186,9
0,0
Source: IDC 2010
ANNUAL REPORT 2009 ANNUAL REPORT 2009
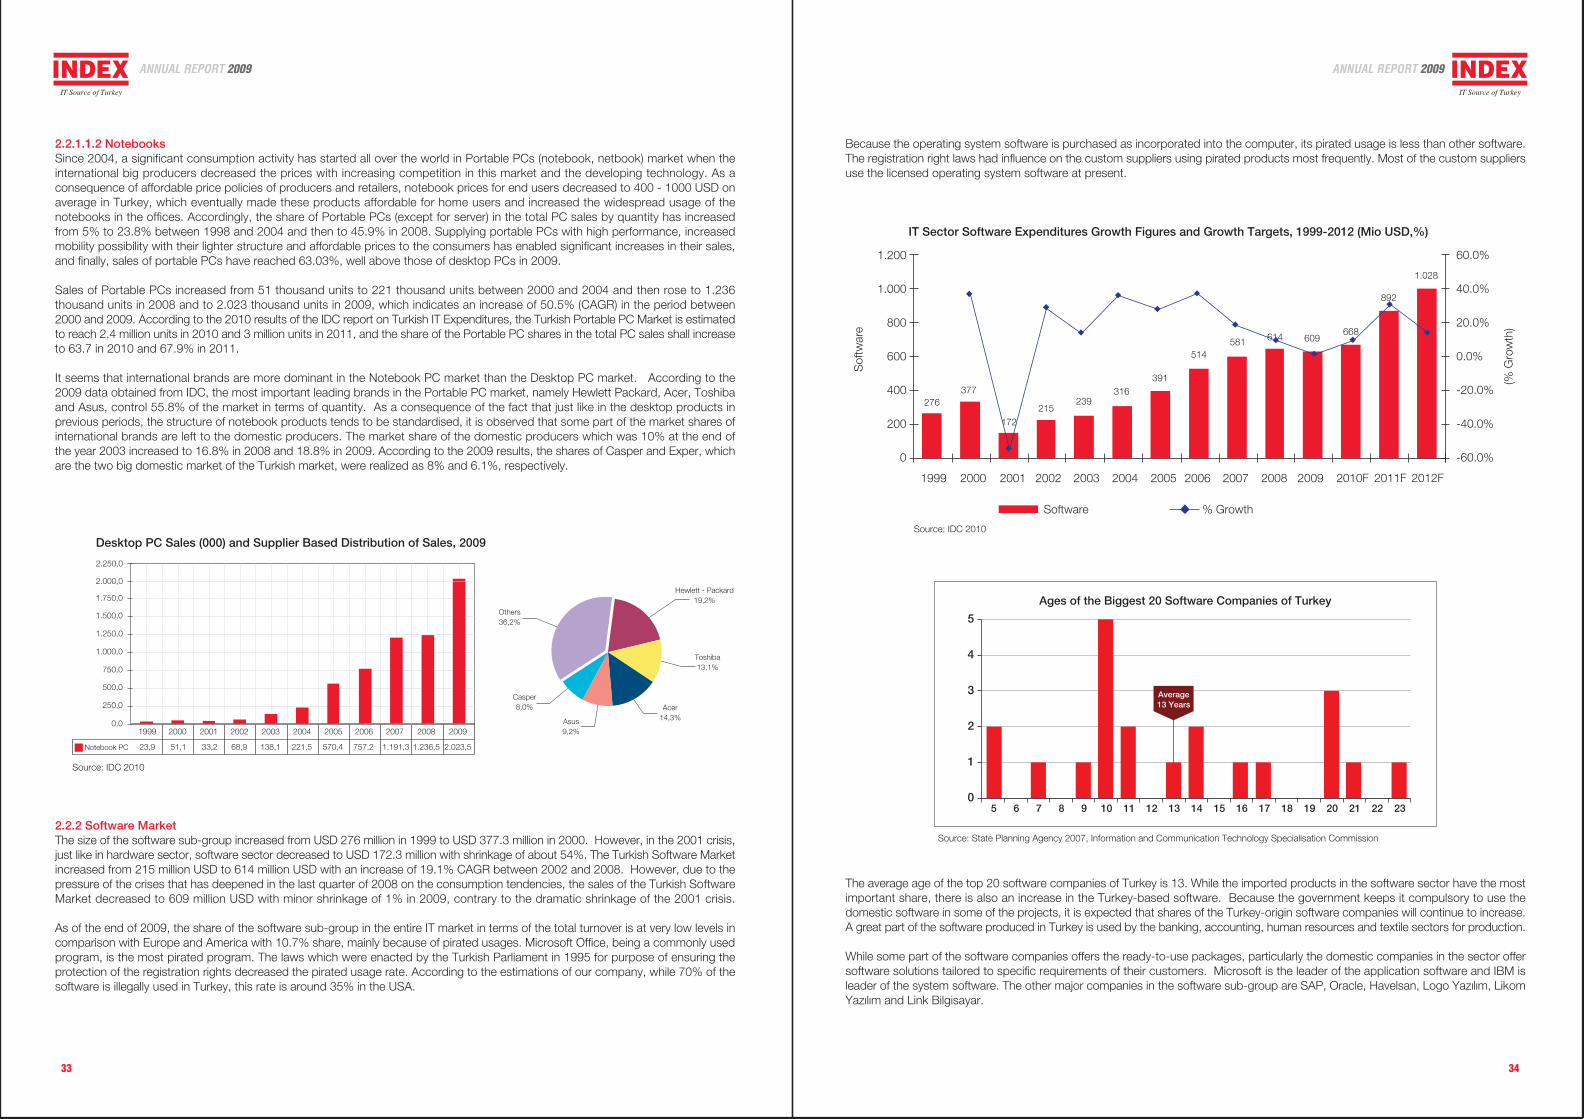
33 34
2.2.1.1.2 NotebooksSince 2004, a significant consumption activity has started all over the world in Portable PCs (notebook, netbook) market when theinternational big producers decreased the prices with increasing competition in this market and the developing technology. As aconsequence of affordable price policies of producers and retailers, notebook prices for end users decreased to 400 - 1000 USD onaverage in Turkey, which eventually made these products affordable for home users and increased the widespread usage of thenotebooks in the offices. Accordingly, the share of Portable PCs (except for server) in the total PC sales by quantity has increasedfrom 5% to 23.8% between 1998 and 2004 and then to 45.9% in 2008. Supplying portable PCs with high performance, increasedmobility possibility with their lighter structure and affordable prices to the consumers has enabled significant increases in their sales,and finally, sales of portable PCs have reached 63.03%, well above those of desktop PCs in 2009.
Sales of Portable PCs increased from 51 thousand units to 221 thousand units between 2000 and 2004 and then rose to 1.236thousand units in 2008 and to 2.023 thousand units in 2009, which indicates an increase of 50.5% (CAGR) in the period between2000 and 2009. According to the 2010 results of the IDC report on Turkish IT Expenditures, the Turkish Portable PC Market is estimatedto reach 2.4 million units in 2010 and 3 million units in 2011, and the share of the Portable PC shares in the total PC sales shall increaseto 63.7 in 2010 and 67.9% in 2011.
It seems that international brands are more dominant in the Notebook PC market than the Desktop PC market. According to the2009 data obtained from IDC, the most important leading brands in the Portable PC market, namely Hewlett Packard, Acer, Toshibaand Asus, control 55.8% of the market in terms of quantity. As a consequence of the fact that just like in the desktop products inprevious periods, the structure of notebook products tends to be standardised, it is observed that some part of the market shares ofinternational brands are left to the domestic producers. The market share of the domestic producers which was 10% at the end ofthe year 2003 increased to 16.8% in 2008 and 18.8% in 2009. According to the 2009 results, the shares of Casper and Exper, whichare the two big domestic market of the Turkish market, were realized as 8% and 6.1%, respectively.
Because the operating system software is purchased as incorporated into the computer, its pirated usage is less than other software.The registration right laws had influence on the custom suppliers using pirated products most frequently. Most of the custom suppliersuse the licensed operating system software at present.
IT Sector Software Expenditures Growth Figures and Growth Targets, 1999-2012 (Mio USD,%)
Source: IDC 2010
0
200
400
600
800
1.000
1.200
1999 2000 2001 2002 2003 2004 2005 2006 2007 2008 2009 2010F
Software % Growth
276377
172215
239316
391
514581 614 609
668
2011F
892
-60.0%
-40.0%
-20.0%
0.0%
20.0%
40.0%
60.0%
(% G
row
th)
Sof
twar
e
2012F
1.028
0
1
2
3
4
5
Ages of the Biggest 20 Software Companies of Turkey
5 6 7 8 9 10 11 12 13 14 15 16 17 18 19 20 21 22 23
Average13 Years
Source: State Planning Agency 2007, Information and Communication Technology Specialisation Commission
Desktop PC Sales (000) and Supplier Based Distribution of Sales, 2009
Source: IDC 2010
250,0
500,0
750,0
1.000,0
1.250,0
1.500,0
1.750,0
Notebook PC 23,9 51,1 33,2 68,9 138,1 221,5 570,4 757,2
1999 2000 2001 2002 2003 2004 2005 2006 2007
2.000,0
1.191,3
2008
1.236,5
2009
2.023,5
0,0
2.250,0
Others36,2%
Hewlett - Packard19,2%
Toshiba13,1%
Acer14,3%Asus
9,2%
Casper8,0%
2.2.2 Software MarketThe size of the software sub-group increased from USD 276 million in 1999 to USD 377.3 million in 2000. However, in the 2001 crisis,just like in hardware sector, software sector decreased to USD 172.3 million with shrinkage of about 54%. The Turkish Software Marketincreased from 215 million USD to 614 million USD with an increase of 19.1% CAGR between 2002 and 2008. However, due to thepressure of the crises that has deepened in the last quarter of 2008 on the consumption tendencies, the sales of the Turkish SoftwareMarket decreased to 609 million USD with minor shrinkage of 1% in 2009, contrary to the dramatic shrinkage of the 2001 crisis.
As of the end of 2009, the share of the software sub-group in the entire IT market in terms of the total turnover is at very low levels incomparison with Europe and America with 10.7% share, mainly because of pirated usages. Microsoft Office, being a commonly usedprogram, is the most pirated program. The laws which were enacted by the Turkish Parliament in 1995 for purpose of ensuring theprotection of the registration rights decreased the pirated usage rate. According to the estimations of our company, while 70% of thesoftware is illegally used in Turkey, this rate is around 35% in the USA.
The average age of the top 20 software companies of Turkey is 13. While the imported products in the software sector have the mostimportant share, there is also an increase in the Turkey-based software. Because the government keeps it compulsory to use thedomestic software in some of the projects, it is expected that shares of the Turkey-origin software companies will continue to increase.A great part of the software produced in Turkey is used by the banking, accounting, human resources and textile sectors for production.
While some part of the software companies offers the ready-to-use packages, particularly the domestic companies in the sector offersoftware solutions tailored to specific requirements of their customers. Microsoft is the leader of the application software and IBM isleader of the system software. The other major companies in the software sub-group are SAP, Oracle, Havelsan, Logo Yaz›l›m, LikomYaz›l›m and Link Bilgisayar.
ANNUAL REPORT 2009 ANNUAL REPORT 2009
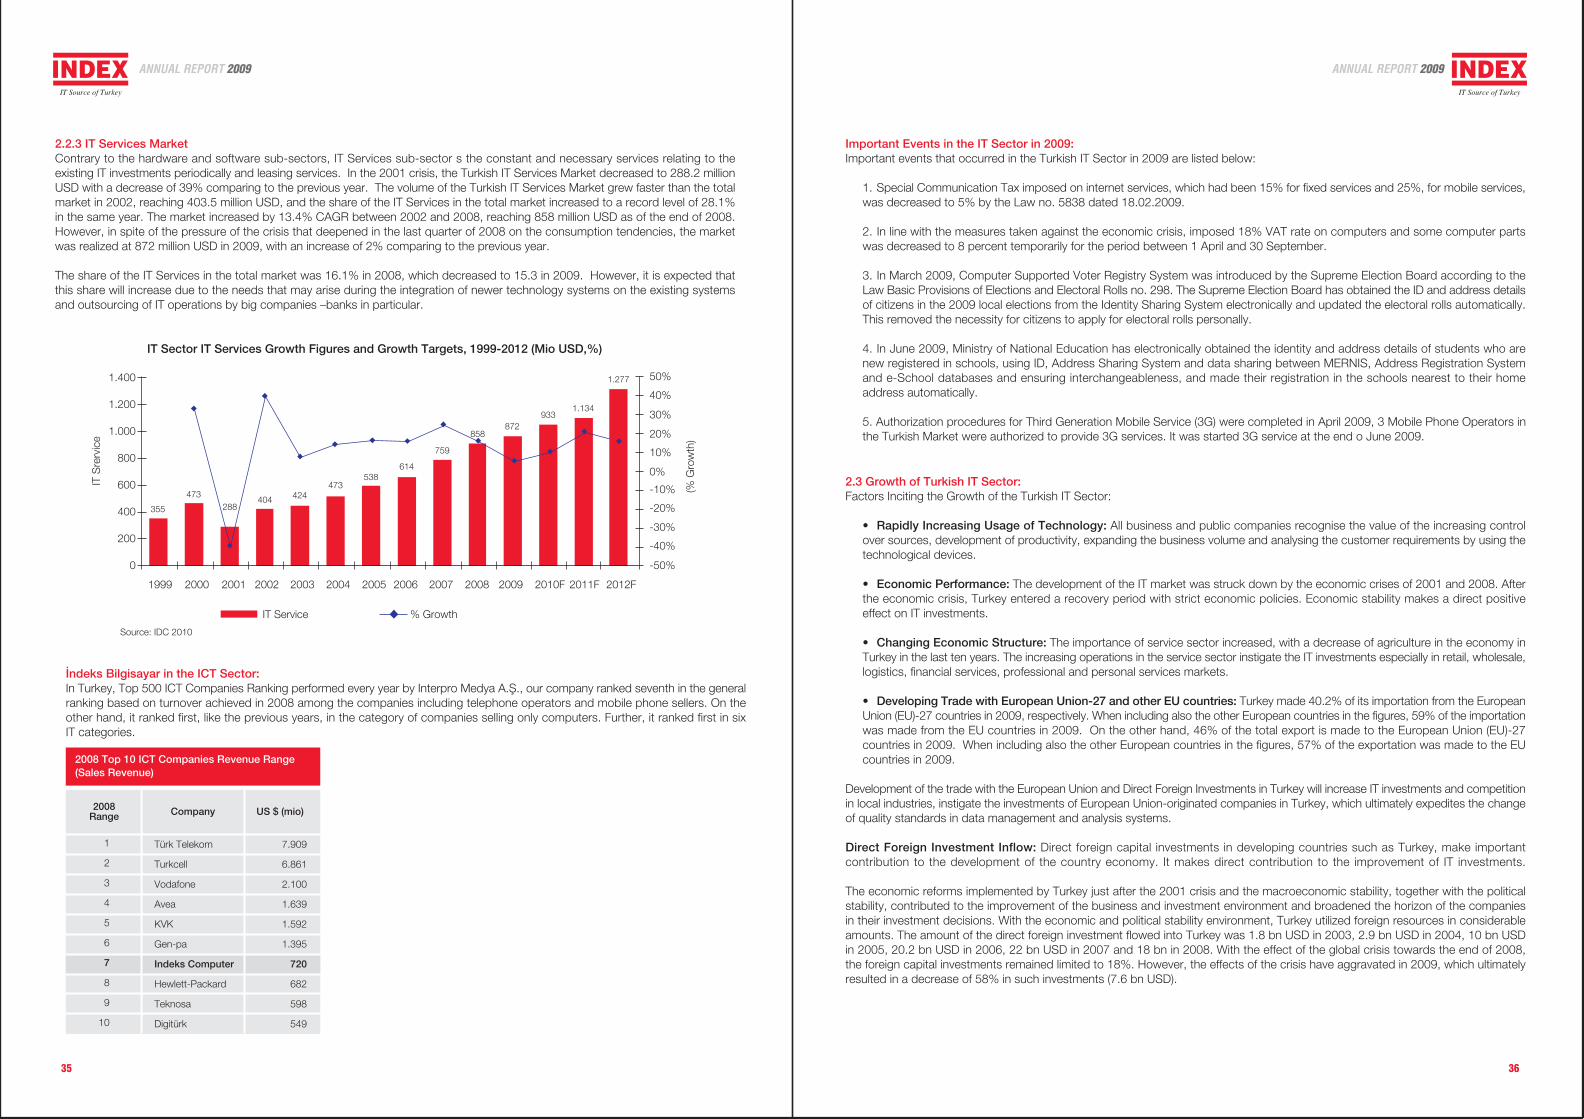
35 36
2.2.3 IT Services MarketContrary to the hardware and software sub-sectors, IT Services sub-sector s the constant and necessary services relating to theexisting IT investments periodically and leasing services. In the 2001 crisis, the Turkish IT Services Market decreased to 288.2 millionUSD with a decrease of 39% comparing to the previous year. The volume of the Turkish IT Services Market grew faster than the totalmarket in 2002, reaching 403.5 million USD, and the share of the IT Services in the total market increased to a record level of 28.1%in the same year. The market increased by 13.4% CAGR between 2002 and 2008, reaching 858 million USD as of the end of 2008.However, in spite of the pressure of the crisis that deepened in the last quarter of 2008 on the consumption tendencies, the marketwas realized at 872 million USD in 2009, with an increase of 2% comparing to the previous year.
The share of the IT Services in the total market was 16.1% in 2008, which decreased to 15.3 in 2009. However, it is expected thatthis share will increase due to the needs that may arise during the integration of newer technology systems on the existing systemsand outsourcing of IT operations by big companies –banks in particular.
‹ndeks Bilgisayar in the ICT Sector:In Turkey, Top 500 ICT Companies Ranking performed every year by Interpro Medya A.fi., our company ranked seventh in the generalranking based on turnover achieved in 2008 among the companies including telephone operators and mobile phone sellers. On theother hand, it ranked first, like the previous years, in the category of companies selling only computers. Further, it ranked first in sixIT categories.
Company
2008 Top 10 ICT Companies Revenue Range(Sales Revenue)
2008Range
1
2
3
4
5
6
7
8
9
10
Türk Telekom
Turkcell
Vodafone
Avea
KVK
Gen-pa
Indeks Computer
Hewlett-Packard
Teknosa
Digitürk
US $ (mio)
7.909
6.861
2.100
1.639
1.592
1.395
720
682
598
549
Important Events in the IT Sector in 2009:Important events that occurred in the Turkish IT Sector in 2009 are listed below:
1. Special Communication Tax imposed on internet services, which had been 15% for fixed services and 25%, for mobile services,was decreased to 5% by the Law no. 5838 dated 18.02.2009.
2. In line with the measures taken against the economic crisis, imposed 18% VAT rate on computers and some computer partswas decreased to 8 percent temporarily for the period between 1 April and 30 September.
3. In March 2009, Computer Supported Voter Registry System was introduced by the Supreme Election Board according to theLaw Basic Provisions of Elections and Electoral Rolls no. 298. The Supreme Election Board has obtained the ID and address detailsof citizens in the 2009 local elections from the Identity Sharing System electronically and updated the electoral rolls automatically.This removed the necessity for citizens to apply for electoral rolls personally.
4. In June 2009, Ministry of National Education has electronically obtained the identity and address details of students who arenew registered in schools, using ID, Address Sharing System and data sharing between MERNIS, Address Registration Systemand e-School databases and ensuring interchangeableness, and made their registration in the schools nearest to their homeaddress automatically.
5. Authorization procedures for Third Generation Mobile Service (3G) were completed in April 2009, 3 Mobile Phone Operators inthe Turkish Market were authorized to provide 3G services. It was started 3G service at the end o June 2009.
2.3 Growth of Turkish IT Sector:Factors Inciting the Growth of the Turkish IT Sector:
• Rapidly Increasing Usage of Technology: All business and public companies recognise the value of the increasing controlover sources, development of productivity, expanding the business volume and analysing the customer requirements by using thetechnological devices.
• Economic Performance: The development of the IT market was struck down by the economic crises of 2001 and 2008. Afterthe economic crisis, Turkey entered a recovery period with strict economic policies. Economic stability makes a direct positiveeffect on IT investments.
• Changing Economic Structure: The importance of service sector increased, with a decrease of agriculture in the economy inTurkey in the last ten years. The increasing operations in the service sector instigate the IT investments especially in retail, wholesale,logistics, financial services, professional and personal services markets.
• Developing Trade with European Union-27 and other EU countries: Turkey made 40.2% of its importation from the EuropeanUnion (EU)-27 countries in 2009, respectively. When including also the other European countries in the figures, 59% of the importationwas made from the EU countries in 2009. On the other hand, 46% of the total export is made to the European Union (EU)-27countries in 2009. When including also the other European countries in the figures, 57% of the exportation was made to the EUcountries in 2009.
Development of the trade with the European Union and Direct Foreign Investments in Turkey will increase IT investments and competitionin local industries, instigate the investments of European Union-originated companies in Turkey, which ultimately expedites the changeof quality standards in data management and analysis systems.
Direct Foreign Investment Inflow: Direct foreign capital investments in developing countries such as Turkey, make importantcontribution to the development of the country economy. It makes direct contribution to the improvement of IT investments.
The economic reforms implemented by Turkey just after the 2001 crisis and the macroeconomic stability, together with the politicalstability, contributed to the improvement of the business and investment environment and broadened the horizon of the companiesin their investment decisions. With the economic and political stability environment, Turkey utilized foreign resources in considerableamounts. The amount of the direct foreign investment flowed into Turkey was 1.8 bn USD in 2003, 2.9 bn USD in 2004, 10 bn USDin 2005, 20.2 bn USD in 2006, 22 bn USD in 2007 and 18 bn in 2008. With the effect of the global crisis towards the end of 2008,the foreign capital investments remained limited to 18%. However, the effects of the crisis have aggravated in 2009, which ultimatelyresulted in a decrease of 58% in such investments (7.6 bn USD).
IT Sector IT Services Growth Figures and Growth Targets, 1999-2012 (Mio USD,%)
Source: IDC 2010
0
200
400
600
800
1999 2000 2001 2002 2003 2004 2005 2006 2007 2008 2009 2010F
IT Service % Growth
355
473288
404 424473
538614
759
858872
933
2011F
1.134
IT S
rerv
ice
-50%
-40%
-20%
0%
20%
30%
50%
(% G
row
th)
-30%
-10%
10%
40%
1.000
1.200
1.400 1.277
2012F
ANNUAL REPORT 2009 ANNUAL REPORT 2009
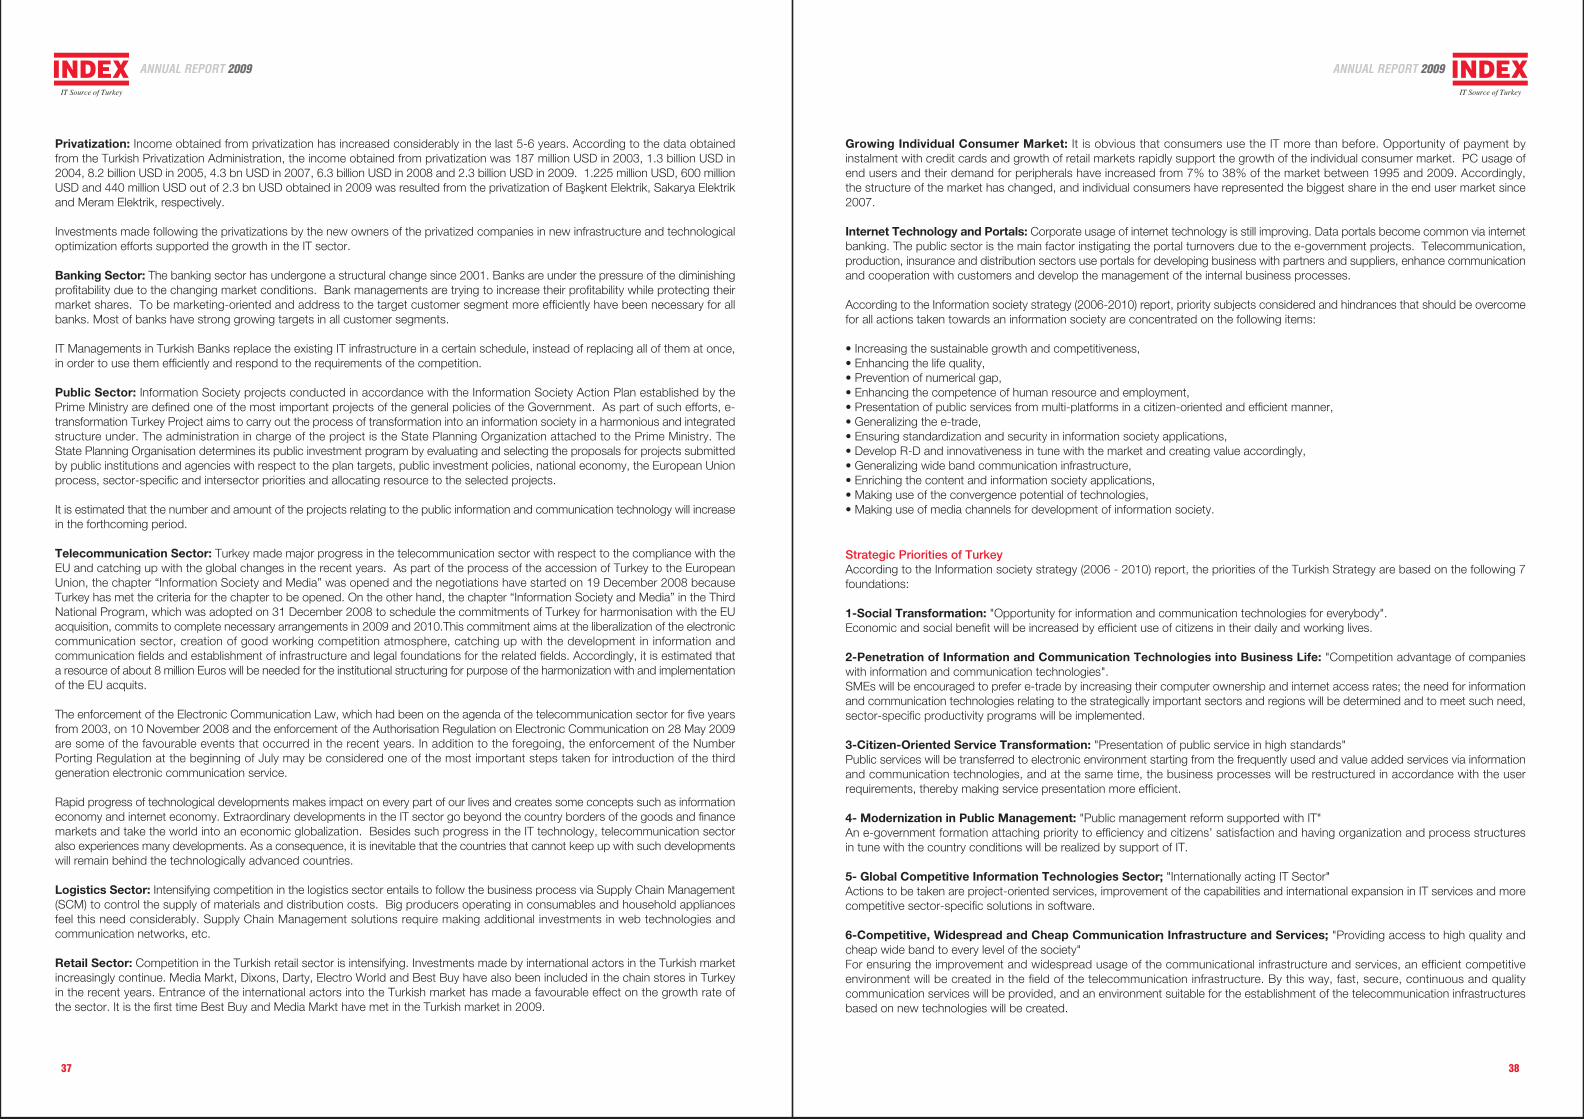
37 38
Privatization: Income obtained from privatization has increased considerably in the last 5-6 years. According to the data obtainedfrom the Turkish Privatization Administration, the income obtained from privatization was 187 million USD in 2003, 1.3 billion USD in2004, 8.2 billion USD in 2005, 4.3 bn USD in 2007, 6.3 billion USD in 2008 and 2.3 billion USD in 2009. 1.225 million USD, 600 millionUSD and 440 million USD out of 2.3 bn USD obtained in 2009 was resulted from the privatization of Baflkent Elektrik, Sakarya Elektrikand Meram Elektrik, respectively.
Investments made following the privatizations by the new owners of the privatized companies in new infrastructure and technologicaloptimization efforts supported the growth in the IT sector.
Banking Sector: The banking sector has undergone a structural change since 2001. Banks are under the pressure of the diminishingprofitability due to the changing market conditions. Bank managements are trying to increase their profitability while protecting theirmarket shares. To be marketing-oriented and address to the target customer segment more efficiently have been necessary for allbanks. Most of banks have strong growing targets in all customer segments.
IT Managements in Turkish Banks replace the existing IT infrastructure in a certain schedule, instead of replacing all of them at once,in order to use them efficiently and respond to the requirements of the competition.
Public Sector: Information Society projects conducted in accordance with the Information Society Action Plan established by thePrime Ministry are defined one of the most important projects of the general policies of the Government. As part of such efforts, e-transformation Turkey Project aims to carry out the process of transformation into an information society in a harmonious and integratedstructure under. The administration in charge of the project is the State Planning Organization attached to the Prime Ministry. TheState Planning Organisation determines its public investment program by evaluating and selecting the proposals for projects submittedby public institutions and agencies with respect to the plan targets, public investment policies, national economy, the European Unionprocess, sector-specific and intersector priorities and allocating resource to the selected projects.
It is estimated that the number and amount of the projects relating to the public information and communication technology will increasein the forthcoming period.
Telecommunication Sector: Turkey made major progress in the telecommunication sector with respect to the compliance with theEU and catching up with the global changes in the recent years. As part of the process of the accession of Turkey to the EuropeanUnion, the chapter “Information Society and Media” was opened and the negotiations have started on 19 December 2008 becauseTurkey has met the criteria for the chapter to be opened. On the other hand, the chapter “Information Society and Media” in the ThirdNational Program, which was adopted on 31 December 2008 to schedule the commitments of Turkey for harmonisation with the EUacquisition, commits to complete necessary arrangements in 2009 and 2010.This commitment aims at the liberalization of the electroniccommunication sector, creation of good working competition atmosphere, catching up with the development in information andcommunication fields and establishment of infrastructure and legal foundations for the related fields. Accordingly, it is estimated thata resource of about 8 million Euros will be needed for the institutional structuring for purpose of the harmonization with and implementationof the EU acquits.
The enforcement of the Electronic Communication Law, which had been on the agenda of the telecommunication sector for five yearsfrom 2003, on 10 November 2008 and the enforcement of the Authorisation Regulation on Electronic Communication on 28 May 2009are some of the favourable events that occurred in the recent years. In addition to the foregoing, the enforcement of the NumberPorting Regulation at the beginning of July may be considered one of the most important steps taken for introduction of the thirdgeneration electronic communication service.
Rapid progress of technological developments makes impact on every part of our lives and creates some concepts such as informationeconomy and internet economy. Extraordinary developments in the IT sector go beyond the country borders of the goods and financemarkets and take the world into an economic globalization. Besides such progress in the IT technology, telecommunication sectoralso experiences many developments. As a consequence, it is inevitable that the countries that cannot keep up with such developmentswill remain behind the technologically advanced countries.
Logistics Sector: Intensifying competition in the logistics sector entails to follow the business process via Supply Chain Management(SCM) to control the supply of materials and distribution costs. Big producers operating in consumables and household appliancesfeel this need considerably. Supply Chain Management solutions require making additional investments in web technologies andcommunication networks, etc.
Retail Sector: Competition in the Turkish retail sector is intensifying. Investments made by international actors in the Turkish marketincreasingly continue. Media Markt, Dixons, Darty, Electro World and Best Buy have also been included in the chain stores in Turkeyin the recent years. Entrance of the international actors into the Turkish market has made a favourable effect on the growth rate ofthe sector. It is the first time Best Buy and Media Markt have met in the Turkish market in 2009.
Growing Individual Consumer Market: It is obvious that consumers use the IT more than before. Opportunity of payment byinstalment with credit cards and growth of retail markets rapidly support the growth of the individual consumer market. PC usage ofend users and their demand for peripherals have increased from 7% to 38% of the market between 1995 and 2009. Accordingly,the structure of the market has changed, and individual consumers have represented the biggest share in the end user market since2007.
Internet Technology and Portals: Corporate usage of internet technology is still improving. Data portals become common via internetbanking. The public sector is the main factor instigating the portal turnovers due to the e-government projects. Telecommunication,production, insurance and distribution sectors use portals for developing business with partners and suppliers, enhance communicationand cooperation with customers and develop the management of the internal business processes.
According to the Information society strategy (2006-2010) report, priority subjects considered and hindrances that should be overcomefor all actions taken towards an information society are concentrated on the following items:
• Increasing the sustainable growth and competitiveness,• Enhancing the life quality,• Prevention of numerical gap,• Enhancing the competence of human resource and employment,• Presentation of public services from multi-platforms in a citizen-oriented and efficient manner,• Generalizing the e-trade,• Ensuring standardization and security in information society applications,• Develop R-D and innovativeness in tune with the market and creating value accordingly,• Generalizing wide band communication infrastructure,• Enriching the content and information society applications,• Making use of the convergence potential of technologies,• Making use of media channels for development of information society.
Strategic Priorities of TurkeyAccording to the Information society strategy (2006 - 2010) report, the priorities of the Turkish Strategy are based on the following 7foundations:
1-Social Transformation: "Opportunity for information and communication technologies for everybody".Economic and social benefit will be increased by efficient use of citizens in their daily and working lives.
2-Penetration of Information and Communication Technologies into Business Life: "Competition advantage of companieswith information and communication technologies".SMEs will be encouraged to prefer e-trade by increasing their computer ownership and internet access rates; the need for informationand communication technologies relating to the strategically important sectors and regions will be determined and to meet such need,sector-specific productivity programs will be implemented.
3-Citizen-Oriented Service Transformation: "Presentation of public service in high standards"Public services will be transferred to electronic environment starting from the frequently used and value added services via informationand communication technologies, and at the same time, the business processes will be restructured in accordance with the userrequirements, thereby making service presentation more efficient.
4- Modernization in Public Management: "Public management reform supported with IT"An e-government formation attaching priority to efficiency and citizens’ satisfaction and having organization and process structuresin tune with the country conditions will be realized by support of IT.
5- Global Competitive Information Technologies Sector; "Internationally acting IT Sector"Actions to be taken are project-oriented services, improvement of the capabilities and international expansion in IT services and morecompetitive sector-specific solutions in software.
6-Competitive, Widespread and Cheap Communication Infrastructure and Services; "Providing access to high quality andcheap wide band to every level of the society"For ensuring the improvement and widespread usage of the communicational infrastructure and services, an efficient competitiveenvironment will be created in the field of the telecommunication infrastructure. By this way, fast, secure, continuous and qualitycommunication services will be provided, and an environment suitable for the establishment of the telecommunication infrastructuresbased on new technologies will be created.
ANNUAL REPORT 2009 ANNUAL REPORT 2009
39
7- Development of R-D and Innovativeness: "New product and services suitable to the demand of the global market"Priority will be attached to R-D activities in the IT sector which is a highly demanded Innovative and highly value-added sector in theglobal markets. Development of new technologies and transformation of such technologies into production will be supported. Inaddition, for development and efficiency of R-D and innovativeness activities, ITs will be used to the maximum extent.The first four of the foregoing strategic priorities are for the change in the daily life of the citizens participating in the economic andsocial transformation, public sector and business life, and the other strategic priorities are for the IT infrastructure necessary for therealization of such transformation, strengthening the sector that will provide such infrastructure and development of the new productand services that will enhance the competitiveness of our country, being suitable to the demands of the market.
According to the same report, the objectives of 2010 as follows:• Young generations will be prepared for the global information economy.• Each student graduated from high school will be able to use the basic information and communication technologies.• One-third of people will make use of e-government, e-trade or e-education services by efficient use of the internet.• The internet will become an ordinary part of the daily life.• In the public internet access centres, everybody will have opportunity to learn and use IT.• Half of the population will use the internet.• The internet will be made a secure environment for all parts of the society.• Almost all SMEs, except for micro sized enterprises, will have minimum one computer in Turkey.• 70 percent of SMEs defined above will have access to wide band internet.• 15 percent of the total trade will be made via e-trade.• Minimum 15% of the companies will use enterprise resource planning and 12 percent the modern business applications required by information age such as supply chain management.• Citizens will access to the electronic public services 7 days x24 hrs via any channel they choose.• By 2010, 70 percent of the public services will be provided by electronic means, and minimum 80 percent of citizen satisfaction will be obtained in the usage of electronic public services.• By 2010, one-third of public transaction will be made via electronic means.• Citizens and enterprises will access to the electronic public service via one single portal, i.e. e-government portal.• Turkey will become the software and service centre in the region.• Share of the IT market in the Gross Domestic Market will be increased from 0.8 percent to above 2 percent, which is the average level of OECD.
3. SUBSIDIARIES
‹NDEKS B‹LG‹SAYAR S‹STEMLER‹ MÜHEND‹SL‹K SANAY‹ VE T‹CARET A.fi. ANNUAL REPORT 2009
ANNUAL REPORT 2009
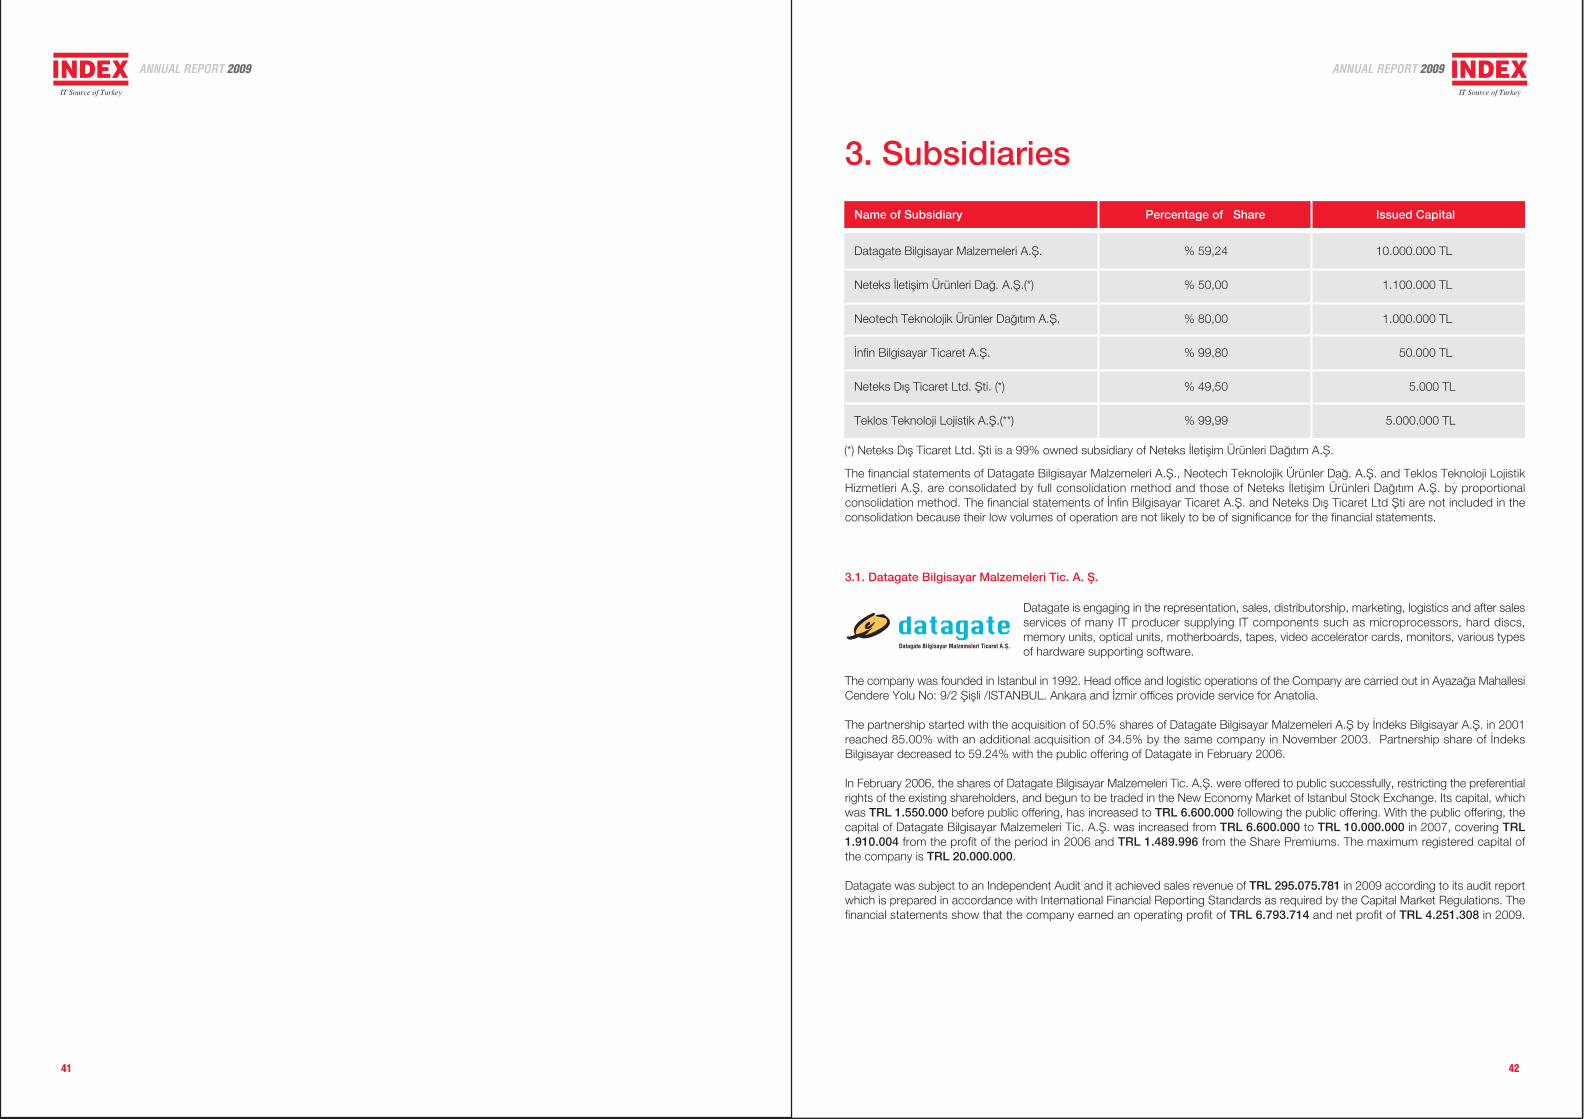
41 42
3. Subsidiaries
Name of Subsidiary Percentage of Share Issued Capital
Datagate Bilgisayar Malzemeleri A.fi. % 59,24 10.000.000 TL
Neteks ‹letiflim Ürünleri Da¤. A.fi.(*) % 50,00 1.100.000 TL
Neotech Teknolojik Ürünler Da¤›t›m A.fi. % 80,00 1.000.000 TL
‹nfin Bilgisayar Ticaret A.fi. % 99,80 50.000 TL
Neteks D›fl Ticaret Ltd. fiti. (*) % 49,50 5.000 TL
Teklos Teknoloji Lojistik A.fi.(**) % 99,99 5.000.000 TL
(*) Neteks D›fl Ticaret Ltd. fiti is a 99% owned subsidiary of Neteks ‹letiflim Ürünleri Da¤›t›m A.fi.
The financial statements of Datagate Bilgisayar Malzemeleri A.fi., Neotech Teknolojik Ürünler Da¤. A.fi. and Teklos Teknoloji LojistikHizmetleri A.fi. are consolidated by full consolidation method and those of Neteks ‹letiflim Ürünleri Da¤›t›m A.fi. by proportionalconsolidation method. The financial statements of ‹nfin Bilgisayar Ticaret A.fi. and Neteks D›fl Ticaret Ltd fiti are not included in theconsolidation because their low volumes of operation are not likely to be of significance for the financial statements.
3.1. Datagate Bilgisayar Malzemeleri Tic. A. fi.
Datagate is engaging in the representation, sales, distributorship, marketing, logistics and after salesservices of many IT producer supplying IT components such as microprocessors, hard discs,memory units, optical units, motherboards, tapes, video accelerator cards, monitors, various typesof hardware supporting software.
The company was founded in Istanbul in 1992. Head office and logistic operations of the Company are carried out in Ayaza¤a MahallesiCendere Yolu No: 9/2 fiiflli /ISTANBUL. Ankara and ‹zmir offices provide service for Anatolia.
The partnership started with the acquisition of 50.5% shares of Datagate Bilgisayar Malzemeleri A.fi by ‹ndeks Bilgisayar A.fi. in 2001reached 85.00% with an additional acquisition of 34.5% by the same company in November 2003. Partnership share of ‹ndeksBilgisayar decreased to 59.24% with the public offering of Datagate in February 2006.
In February 2006, the shares of Datagate Bilgisayar Malzemeleri Tic. A.fi. were offered to public successfully, restricting the preferentialrights of the existing shareholders, and begun to be traded in the New Economy Market of Istanbul Stock Exchange. Its capital, whichwas TRL 1.550.000 before public offering, has increased to TRL 6.600.000 following the public offering. With the public offering, thecapital of Datagate Bilgisayar Malzemeleri Tic. A.fi. was increased from TRL 6.600.000 to TRL 10.000.000 in 2007, covering TRL1.910.004 from the profit of the period in 2006 and TRL 1.489.996 from the Share Premiums. The maximum registered capital ofthe company is TRL 20.000.000.
Datagate was subject to an Independent Audit and it achieved sales revenue of TRL 295.075.781 in 2009 according to its audit reportwhich is prepared in accordance with International Financial Reporting Standards as required by the Capital Market Regulations. Thefinancial statements show that the company earned an operating profit of TRL 6.793.714 and net profit of TRL 4.251.308 in 2009.
ANNUAL REPORT 2009 ANNUAL REPORT 2009
44
The main product groups and brands distributed by Datagate are listed below:
Group Brands
Neteks was subject to an Independent Audit and it achieved sales revenue of TRL 99.640.222 in 2009 according to its audit reportwhich is prepared in accordance with International Financial Reporting Standards as required by the Capital Market Regulations. Thefinancial statements show that the company earned an operating profit of TRL 2,095,566 and net profit of TRL 998.032 in 2009.
70% and 24% of the share of Neteks were acquired by ‹ndeks and Datagate A.fi., respectively, in 2001. In 2007, 6% of Neteks A.fi.’sshares which are held by other shareholders were acquired by Indeks A.fi. at US$ 374.000. Our company kept 50% of shares foritself and sold 26% to Westcon Group European Operation Limited at US$ 1.820.000. According to the agreement signed betweenthe parties, 24% of the shares of Neteks ‹letiflim Ürünleri Da¤›t›m A.fi. held by Datagate Bilgisayar A.fi, as a 59,24% affiliate of ‹ndeksBilgisayar A.fi. and listed in Istanbul Stock Exchange, were sold to Westcon Group European Operation Limited at US$ 1.680.000.
Of the 50% shares sold, 26% and 24% were provided by ‹ndeks Bilgisayar Sistemleri Mühendislik Sanayi ve Ticaret A.fi and DatagateBilgisayar Malzemeleri Ticaret A.fi., respectively. ‹ndeks Bilgisayar A.fi. and Westcon Group have had 50-50% of the shares of NeteksA.fi after the sale of shares.
Group Brands
3.3. Neotech Teknolojik Ürünler Da¤›t›m A.fi.
Neotech Teknolojik Ürünler Da¤›t›m A.S. was established with a capital of 100.000 TRL on04.02.2005. The company, being an 80% affiliate of ‹ndeks A.S., operates in wholesale marketingof consumer electronics and communication devices. The company increased its capital fromTRL 100.000 to TRL 1.000.000 in 2007.
The main product groups and brands distributed by Neotech are listed below:
The contracts made between our company and Apple and Airties, respectively, have been transferred to ‹ndeks Bilgisayar A.fi., whichis our main shareholder, within the year.
Neotech was subject to an Independent Audit and it achieved sales revenue of TRL 105.402.679 in 2009 according to its audit reportwhich is prepared in accordance with International Financial Reporting Standards as required by the Capital Market Regulations. TheCompany earned an operating profit of TRL 603.859 in 2009 according to the financial statements.
3.4. ‹nfin Bilgisayar Ticaret A.fi.
‹nfin Bilgisayar Ticaret Anonim fiirketi was established in 2001 to help the retailers with their sales and exportoperations within the framework of investment operations under incentive certificates.
Due to the fact that its biggest part of purchase and sales of the company was arisen out of the companies included in the financialstatements, and its business volume was so low that does not make any impact on the financial statements, this company is left outof the said statements
3.2. Neteks ‹letiflim Ürünleri Da¤›t›m A.fi.
Neteks was established to provide network and communication products to the market through itsretailers and business partners as a distributor company in1996. Neteks has aimed to providecomplete network solutions to business partners by accommodating the most experienced namesin their fields in Turkey. Besides the corporate networks systems and its components of the companies
such as Cisco, Nortel Networks, 3Com, HP, Juniper and Avocent, Neteks A.S. also distributes corporate telephone switchboardsystems of Nortel Networks and Avaya, structural cable products of HSC, Corning, Panduit and Günko, network security solutionsof Check Point, Trend Micro and IBM ISS.
The main product groups and brands distributed by Neteks are listed below:
43
Group Brands
Corporate Network Systems Cisco System
Nortel Networks
3Com
HP
Avocent
Corporate Telephone Switchboard Systems Avaya, Nortel Networks
Structured Cabling Solutions Corning, HCS, Panduit, Günko
Network Security Solutions Check Point, Trend Micro, IBM ISS
Hard Disk
Microprocessor
Main board
Display Card
Monitor
Optical products
Laptops
Desktops
Memory Products
Server Products
Card Readers
Network Products
Laser Printer
Backup Units
Accessories
Security products
Network (Modem-USB-Adaptor) products
Seagate, Maxtor
Intel
Intel, MSI
MSI, Sapphire
AOC
Lite-On
Acer, MSI, Fujitsu
Fujitsu
Veritech, Samsung
Intel, Fujitsu
Sony
Intel
Xerox
Fujitsu
Belkin,Sony, Genius
GKB
BelkinApple
Sony
Tosh›ba
Wievsonic
Nec
LG
Household Electronics Product
ANNUAL REPORT 2009 ANNUAL REPORT 2009
45
3.5. Teklos Teknoloji Lojistik A. fi
This company was founded under the name of Karadeniz Örme Sanayi A.fi. to operate in textile sector on03.01.1973. In March 2006, ‹ndeks has executed an important and greatest investment in IT sector bypurchasing Karadeniz Orme A.S., which is founded on a 39,761 square meters land and having 18,969square meters indoor area, in order to be used as a logistics headquarters. The trade name of Karadeniz
Orme AS has been changed into Teklos Teknoloji Lojistik Hizmetler A.fi. and its field of activity has been changed to as logisticsservices.
Teklos Teknoloji Lojistik Hizmetler A.fi. is providing logistic services to the companies operating in the IT sector. The company distributed10.287.389 units of products and 515.427 cartons in 2009.
Teklos was subject to an Independent Audit and it achieved sales revenue of TRL 5.130.270 in 2009. According to its audit reportwhich is prepared in accordance with International Financial Reporting Standards required by the Capital Market Regulations. Thestatements show that the company earned an operating profit of TRL 2.666.638 and net profit of TRL 2.029.990 in 2009.
4. OPERATION
‹NDEKS B‹LG‹SAYAR S‹STEMLER‹ MÜHEND‹SL‹K SANAY‹ VE T‹CARET A.fi. ANNUAL REPORT 2009
ANNUAL REPORT 2009
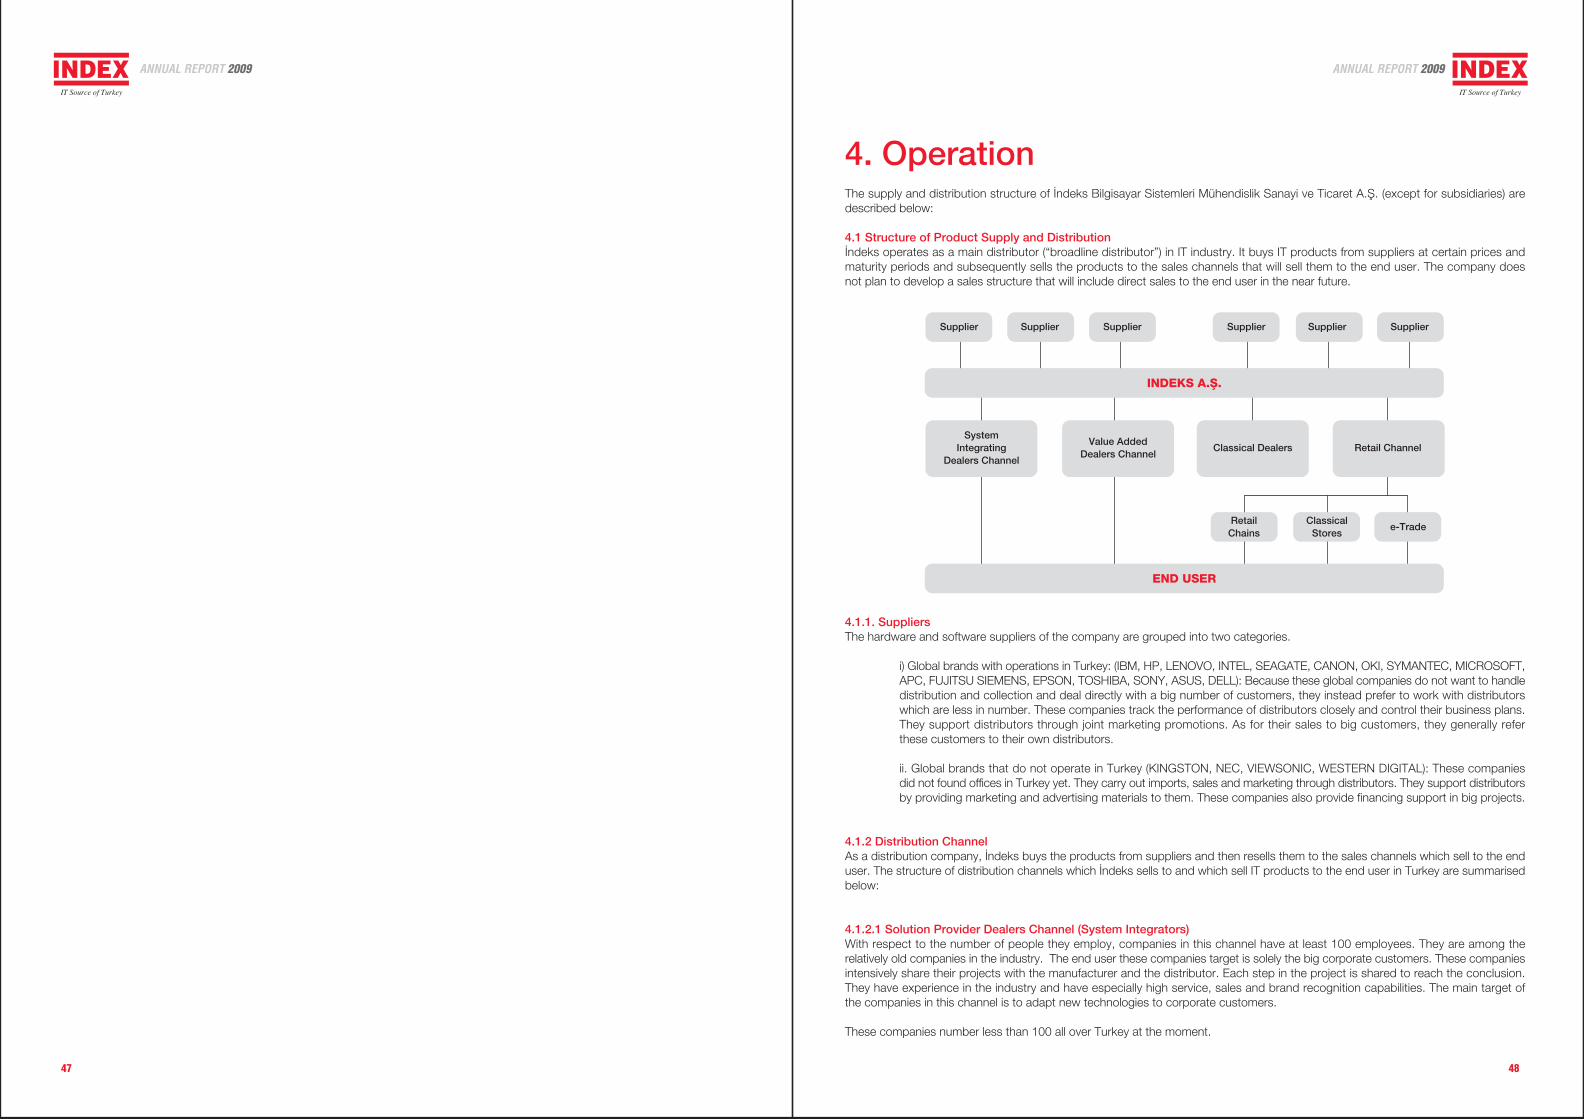
47 48
4. OperationThe supply and distribution structure of ‹ndeks Bilgisayar Sistemleri Mühendislik Sanayi ve Ticaret A.fi. (except for subsidiaries) aredescribed below:
4.1 Structure of Product Supply and Distribution‹ndeks operates as a main distributor (“broadline distributor”) in IT industry. It buys IT products from suppliers at certain prices andmaturity periods and subsequently sells the products to the sales channels that will sell them to the end user. The company doesnot plan to develop a sales structure that will include direct sales to the end user in the near future.
Supplier
INDEKS A.fi.
SystemIntegrating
Dealers Channel
Value AddedDealers Channel
Classical Dealers Retail Channel
RetailChains
ClassicalStores
e-Trade
END USER
Supplier Supplier Supplier Supplier Supplier
4.1.1. SuppliersThe hardware and software suppliers of the company are grouped into two categories.
i) Global brands with operations in Turkey: (IBM, HP, LENOVO, INTEL, SEAGATE, CANON, OKI, SYMANTEC, MICROSOFT,APC, FUJITSU SIEMENS, EPSON, TOSHIBA, SONY, ASUS, DELL): Because these global companies do not want to handledistribution and collection and deal directly with a big number of customers, they instead prefer to work with distributorswhich are less in number. These companies track the performance of distributors closely and control their business plans.They support distributors through joint marketing promotions. As for their sales to big customers, they generally referthese customers to their own distributors.
ii. Global brands that do not operate in Turkey (KINGSTON, NEC, VIEWSONIC, WESTERN DIGITAL): These companiesdid not found offices in Turkey yet. They carry out imports, sales and marketing through distributors. They support distributorsby providing marketing and advertising materials to them. These companies also provide financing support in big projects.
4.1.2 Distribution ChannelAs a distribution company, ‹ndeks buys the products from suppliers and then resells them to the sales channels which sell to the enduser. The structure of distribution channels which ‹ndeks sells to and which sell IT products to the end user in Turkey are summarisedbelow:
4.1.2.1 Solution Provider Dealers Channel (System Integrators)With respect to the number of people they employ, companies in this channel have at least 100 employees. They are among therelatively old companies in the industry. The end user these companies target is solely the big corporate customers. These companiesintensively share their projects with the manufacturer and the distributor. Each step in the project is shared to reach the conclusion.They have experience in the industry and have especially high service, sales and brand recognition capabilities. The main target ofthe companies in this channel is to adapt new technologies to corporate customers.
These companies number less than 100 all over Turkey at the moment.
ANNUAL REPORT 2009 ANNUAL REPORT 2009
49 50
4.1.2.2 Value Added DealersWith respect to the number of people they employ, companies in this channel have 25-100 employees. These companies are morelimited with respect to capital but thanks to their young and dynamic structures, they are able to make quick decisions and operateon low margins by keeping costs down. Their target group is multinational companies and corporate customers with generally onelocation.
Although they do not take part in very big projects, the fact that they follow the technological innovations very closely and that theyare young and dynamic make these companies supplier of choice for their customers.
Distributors support these companies with respect to finance, logistics, and product information. These companies do not have anintensive relationship with the manufacturers. These companies number more than 500 all over Turkey.
4.1.2.3 Regular DealersThese are pretty small companies with a staff of 5 to 25. They do not have their own unique solutions. Their target is SMEs and thehome market. They number at least 4.000 to 5.000 and are the biggest group in the IT industry. Because their target is customergroups that use technology at a simpler level and they have limited resources, they have a low know-how level.
These companies carry out their operations fully with distributor company resources. Their sales are more directed towards OEMproducts and peripherals than branded products.
4.1.2.4 Retail ChannelThis category covers the sales network of the stores with window. For ‹ndeks, there are 3 types of retail groups:
i. Retail ChainsThe retail chains are big groups having more than one store under the same brand such as Teknosa, Bimeks, Vatan, Gold,Media Markt, Best Buy, Dixons, Darty, Electro world, Teknolojiks, NT, Evkur. The main function of some groups of thiscategory is computer, while some of them like Metro Hypermarket are chains dealing with computer as a secondary business.
ii.Regular Computer StoresThese stores are small companies where the owner of the store and a few sales representatives work and they operatewith limited resources. They are totally focused on computers.
iii. E-RetailThis channel is based on virtual markets which open virtual stores and operate in the internet medium. Due to the widespreadusage of the internet in the recent years, the number of the companies operating in this channel is increasingly growing.The companies such as D-Market (Hepsiburada.com) are the examples of this type of channel.
4.1.2.5 Regional Wholesale Trader ChannelThis category contains Intermediary Wholesale Trader Companies sel l ing to dealer channel regional ly.These companies, which generally operate in a certain region, are the wholesale traders getting the products from distributors andselling to the small dealers in the region. They enjoy the advantage to have local warehouse and the ability to deliver the goods promptly.The company works with 40-50 intermediary wholesale traders in this group.
4.2 Logistics‹ndeks makes sales and distribution via its staff of 289 and over 7,500 dealers and companies included in its financial statements to81 provinces of Turkey from its logistic centres in Istanbul, Ankara and Izmir. The company delivers the goods to its dealers in Istanbul,Ankara and Izmir via its own vehicle fleet or rented fleet and makes distribution to other districts through logistic companies withwidespread distribution networks.
The branch offices in Ankara and ‹zmir established in 1992 and 1995, respectively, operate as “district offices”. Having their ownlogistic, sales, accounting, finance, current accounts and customer services departments, they are responsible for sales to the dealersand development of the sales channels in their cities. Ankara office is responsible for the district Ankara, Central Anatolia and EasternAnatolia Regions, ‹zmir Office for the District Izmir, Western Anatolia and Aegean Regions. The areas not included the foregoing shallbe under the responsibility of the headquarters in Istanbul.
‹ndeks has executed one of the most important and greatest investments in IT sector by purchasing Karadeniz Orme A.S., which isfounded on a 39,761 square meters land and having 18,969 square meters closed area, in order to be used as a logistics headquarters.The trade name of Karadeniz Orme AS has been changed into Teklos Teknoloji Lojistik Hizmetler A.fi. and its field of activity has beencustomized to be able to work on the logistics services. Teklos Teknoloji Lojistik Hizmetler A.fi. is providing logistic services to thegroup companies and other companies in IT sector as well. The head office of the company moved to its new location on 26.10.2006.
‹ndeks has also district warehouses in Ankara and Izmir. The logistic centre in Istanbul employs 61 personnel which consists of 25logistic staff and 36 warehouse staff. Further, there is a 23-vehicle distribution fleet consisting of minibuses and trucks in the Istanbullogistic centre. 18 people including 4 in the logistics and warehouse, and 15 people including 2 in the logistics and warehouse areemployed in Ankara and Izmir offices respectively. Data flow, invoicing and collection procedures between the branches are carriedout online.
The Company is planning to utilize a kind of software specially designed for IT products in inventory control, warehouse management,customer performance monitoring and reporting. Further, the Company is planning to deploy GPS systems in its distribution fleet forthe control of the fleet.
4.3 Invoicing and Payment Collection‹ndeks makes sales to almost all companies dealing with computer and IT products. The capital structure of the companies whichare considered regular dealer among the distribution channels is weak. The dealers of this kind, which are estimated to number about5.000 in total in Turkey, are the group for which ‹ndeks established its own organisation and working system and took measures withrespect to risk management to minimise any payment risk. The measures taken can be listed as follows:
1. Cash-based cooperation with companies younger than 1 year in the industry: No payment terms other than cash paymentis used for cooperation with computer companies younger than 1 in the industry.
2. An investigation team of 2 in the current accounts department makes continuous inquiries about our dealers. Theseinquiries are intended to reveal current account relations of the dealers with other suppliers, their relations with banks andother financial institutions and whether they issue any bad cheques or not.
3. Credit Committee: The reports on the computer companies which completed their first year in the industry and thosewhose credit line has been extended are drawn up by the investigation team and presented to the credit committee. Thecredit committee consists of the Assistant General Manager-Finance as the chairman, the Finance Manager, Current AccountManager, Representative of Investigation Team and the Sales Department Manager of the related customer. The creditcommittee determines credit lines for each company according to the data from the investigation team, past payment dataand sales performance of the companies and, if required, asks dealers to submit a guaranty or give another security inmortgage form.
4. Archiving: The data of all dealers assessed by the credit committee are archived by the current accounts department.
4.4 Technical Service and Customer RelationsThe Company does not provide after sale service. Instead, it directs the customers to the companies of each product authorised toprovide service. It is because the suppliers prefer their own solution partner to provide service to the end user.
4.5 Sales and MarketingDue to the structure of the IT industry, the technologies and prices of the products that ‹ndeks distributes are subject to frequentchanges and improvements. Therefore, an efficient and effective inventory management and rate of inventory turnover may makesignificant impact on the operational performance of companies.
Considering the dynamic structure of the industry, ‹ndeks assigns one product manager for each group of product. With the structuresummarised below, requirements of the sales groups with differing targets and objectives are comprehended better and therefore,the Company provides better service to such groups.Product managers assume the fol lowing dut ies for achievement of higher rates of inventory turnover:
1. Through an effective market research and business plan, to determine market expectations, check the past performanceof each group and establish the positions of competitive products and companies according to the market researchdata,
ANNUAL REPORT 2009 ANNUAL REPORT 2009
51 52
2. To remain up-to-date about possible technological changes, and ensure the products to be ordered by considering themarketable future estimations for the products, their price/performance analysis and the status of inventory; ensureproper shipment and storage of products, order changes or cancellations when necessary, payment of product costsin accordance with the contracts made with producers; provide training to logistic staff; make perpetual controls of therate of inventory turnover and implement general campaigns by a high level coordination with logistics, import and financedepartments,
3. To conduct all marketing, advertising, promotional activities, dealer and channel relations, both in general and individually;organise regular training of the sales channel and sales team for the product ranges; make the analyses of product anddealer by product group and district; make pricing and price changes for the products considering the cost, channelstructure and corporate profitability target,
4. To ensure that income, gross profitability targets of their departments/products are met; carry out the control of proceduresrelated to the product store put into market for replacement and Return Material Authorization (RMA) procedures incooperation with the customer relations manager and logistics manager; control and approve any configuration changerequested and also control and dispose scrap products or economically depreciated products in stock,
5. To check the performance of the current product range and the compliance of the performance with the business plan;draw up monthly, quarterly or periodical business plans; arrange any return of price difference, product returns, inventoryprotecting payments, any premium, bonus or taking back procedures as determined by the contracts made with producersor producers’ plans and programs,
6. To manage relations with product groups and other executives of producers; represent ‹ndeks before producers; carryout market research to analyse the positions of competitive products and companies and make the findings availableto other departments and the management.
Sales and marketing campaigns of ‹ndeks are conducted in cooperation with suppliers. In general, the Company and suppliers launcha campaign with prior agreement on a common marketing budget. Campaign activities are conducted with seminars, monthly customerevents, brochures and periodical price catalogues. Data exchange with customers is made via web, e-mail or fax.
Product Management and MarketingProduct Management and marketing is restructured to focus on certain business groups and market segments more efficiently.Accordingly, the Product and Marketing organization of the Company comprise the following units:
1) HP Business Unit ManagementThis unit is established for management of all HP branded products, preparation of schedules related to channel,monitoring project sales, conducting the relations with the manufacturer and increasing the attention to HP Brand. 1Business Unit Manager, 4 Product Managers, 1 Order Manager, 2 Project Managers, 4 Channel Managers and 1 ProgramManager, totally 13 people are employed in this unit.
2) MS-IBM-Lenovo Business Unit ManagementManagement of all Microsoft products, and preparation and implementation of marketing programs and business plansrest with the responsibility of this unit. This unit provides direct support to sales groups to meet Microsoft targets andis also responsible for the System X Server family of IBM and notebook and PC of Lenovo in the same way. Thecontribution of a focused Product Management and Marketing has been noticed by both our Dealer Channel andManufacturers. 1 Unit Manager, 3 Product Managers, 1 Order Manager and 4 Sales Managers are employed in this unit.
3) ASUS-DELL-TOSHIBA-CANON Business Unit ManagementThe management of three major Notebook brands, and preparation and implementation of marketing programs andbusiness plans rest with the responsibility of this unit. The unit works for conducting the producer relations, developingchannel programs and achieving the targeted sales and extensiveness. 1 Unit Manager, 3 Product Managers, 1 ChannelManager and 4 Order Managers are employed in this unit which supports the sales group for the sales of the foregoingbrands.
4) OEM Business Unit ManagementAll parts comprising PC and notebook such as Disk, Memory and Monitor, which are called OEM in the Turkish market,are managed by this business unit. Determination of products, development of sales to new channels and preparationand implementation of sales and marketing programs rest with the responsibility of this unit. Brands such as Kingston,Western Digital, LG and Asus are also under the responsibility of this business unit. 1 Unit Manager, 6 Product Managersand 1 Channel manager are employed in this unit.
The sales management and organisation of the Company are carried out by 9 departments which are:
a) Corporate Dealers Department: The department mostly provides service to solution providing, server based and certified dealersin the distribution channel segment. It consists of 1 sales manager, 4 customer representatives and 2 project managers. It sells allproducts, except for big and complex projects and medium-sized products.
b) Anatolian Authorised Dealers Department: This is a department selling mostly OEM products and working with dealers in 57cities in Anatolia. It consists of 1 Sales Manager and 2 customer representatives. It sells all products, except for small and simpleprojects and medium-sized products, to the all dealers under its responsibility.
c) Marmara Authorised Dealers Department: This is a Sales Unit working with dealers in 11 cities in the Marmara Region. It consistsof 1 Sales Manager and 5 customer representatives. It sells all products, except for small and simple projects and medium-sizedproducts, to the all dealers under its responsibility.
d) Intermediary Wholesaler: It provides service to the Intermediary Wholesale Traders engaging in Regional Wholesale Trade.1 customer representative in the department makes sales to the firms included in this channel.
e) Retail (Chain Stores) Department: The department provides services mostly to regular retailers among the distribution channels. It consists of 1 sales manager, 1 channel manager and 3 customer representatives. The main customers of the department are themajor retail stores such as Teknosa, Bimeks and Vatan.
f) Medium-Sized Systems Sales Department: The department covers solution provider dealers with IBM e-server products (AS400,Unix Systems, Back-up products) and IBM Software products (IBM Database and Lotus). It consists of 1 sales manager, 1 productmanagers, 1 channel responsible and 1 order responsible.
g) Electronic Sales Department: The department provides information service from www.indexpazar.com to all dealers of theCompany on orders, product management and the Company itself. It is responsible for the arrangement and improvement of thewebsite, making contracts with dealers, conducting order and campaign management. 1 sales manager, 1 web master and 2 CustomerRepresentatives are employed in this department.
h) District Ankara: The department provides service to all dealers in Ankara and Central Anatolia for the sales of all products, exceptfor medium-sized products. Further, it provides project based service to all dealers serving to the public authorities. It consists of 1district manager, 3 customer representatives and 1 project managers.
i) District Izmir: The department provides service to all dealers in Izmir and Western Anatolia for the sales of all products, except formedium-sized products. It consists of 1 district manager, 3 customer representatives and 1 project managers.
4.6. Anatolian Channel Organisation (CSP)Corporate Sales Personnel working mobile in various cities are employed for increasing our sales and extensiveness in the dealerchannel other than Corporate, Retail Chain stores and Regional Wholesale Traders. For this purpose, there are CSP mobile channelteams making sales to the dealers on behalf of INDEX in the following cities:
- ‹zmit- Bursa- Tekirda¤,- ‹zmir,- Ankara,- Erzurum,- Elaz›¤,- Adana,- Antalya,- Gaziantep,- Trabzon.
CSPs in the centres above cover about 70 cities. This organization which is developed only for small dealers channel is increasinglyexpanded every year.
53
5. CORPORATE GOVERNANCE PRINCIPLESCOMPLIANCE REPORT 2009
‹NDEKS B‹LG‹SAYAR S‹STEMLER‹ MÜHEND‹SL‹K SANAY‹ VE T‹CARET A.fi. ANNUAL REPORT 2009
ANNUAL REPORT 2009
55 56
5. Corporate Governance PrinciplesCompliance Report 2009:1. Corporate Governance Principles Compliance StatementOur Company complies with and applies the Corporate Governance Principles published by the Capital Markets Board within theoperating period between 01.01.2009 and 31.12.2009. These principles are adopted by the company management. Some of theseprinciples were adopted immediately, and works continue to fulfil the deficiencies.
SECTION I - SHAREHOLDERS
2. Shareholders Relations Department:We have established an Investor Relations Department in order to facilitate the relations with the shareholders. The Department carriesout it activities reporting to Asst. General Manager-Finance Halil Duman, and contact information of the responsible people are asfollows.
During the period, Investor Relations Department has provided information to the shareholders and intermediary institution analysts,and to this end, questions asked via telephone, fax or e-mail were answered. Questions asked by the shareholders and intermediaryinstitutions during the period were answered pursuant to CMB's "Communiqué on the Disclosure of Special Events to the Public"Series VIII, No. 39. Besides, our Company makes a press conference each year, evaluates the previous year, publishes the targetsfor the relevant year, thus informs the investors. Recently, a press conference was made on 14.04.2009 for the group companies,and information was provided on the activities.
3. Use of Shareholders' Rights to Obtain Information:Shareholders direct their requests to our Company to obtain information via telephone, fax or e-mail. A great part of the questionsasked by the investors are on the subsidiaries of the Company, contents of the concluded distributorship contracts, capital increase,and share certificate activities. No distinction is made among shareholders as regards the exercise of the right to obtain information.Aside from the annual press conferences, disclosure of special events submitted to ISE is another method for providing generalinformation. Our special event disclosures are also published on our web-site simultaneously. In order to help shareholders to usetheir rights to obtain information in an efficient way, detailed information is given www.index.com.tr, in the investors.Assignment of a special auditor is not arranged as an individual right in the Articles of Association. In order to ensure shareholdersto use their rights to obtain information, the principle has been adopted allowing minority shareholders to notify any subjects, theyare doubtful of and request inspection of, to the Auditing Committee, and thus, investigation of such subjects. During the period norequest was made for assignment of a special auditor.
Moreover, in order to help foreign investors to use their rights to obtain information, an English version of the investors section of ourwebsite has been prepared, and company information, financial statements and notes, operation reports, and research reports wereuploaded to this section.
4. Information on General Assembly:2008 General Assembly of our Company was held on 25.05.2009. The General Assembly resolved the followings unanimously:
- acceptance of the accounts of the 2008 Balance Sheet and Income Statement,- acquittal and discharge of the Board Members and Auditors with respect to the accounts in 2008, and - hiring AGD Ba¤›ms›z Denetim ve Dan›flmanl›k SMMM A.fi. for Independent Audit Services to be provided for the 2009 financial statements,
Name and Surname Title E-mail Address Telephone No
Halil Duman Assistant General Manager [email protected] 0-212-312 21 09
Naim Saraç Internal Audit Manager [email protected] 0-212-331 21 15
Halim Ça¤layan Accounting Manager [email protected] 0-212-331 23 70
Emre Ba¤c› Internal Auditor [email protected] 0-212-331 21 17
ANNUAL REPORT 2009 ANNUAL REPORT 2009
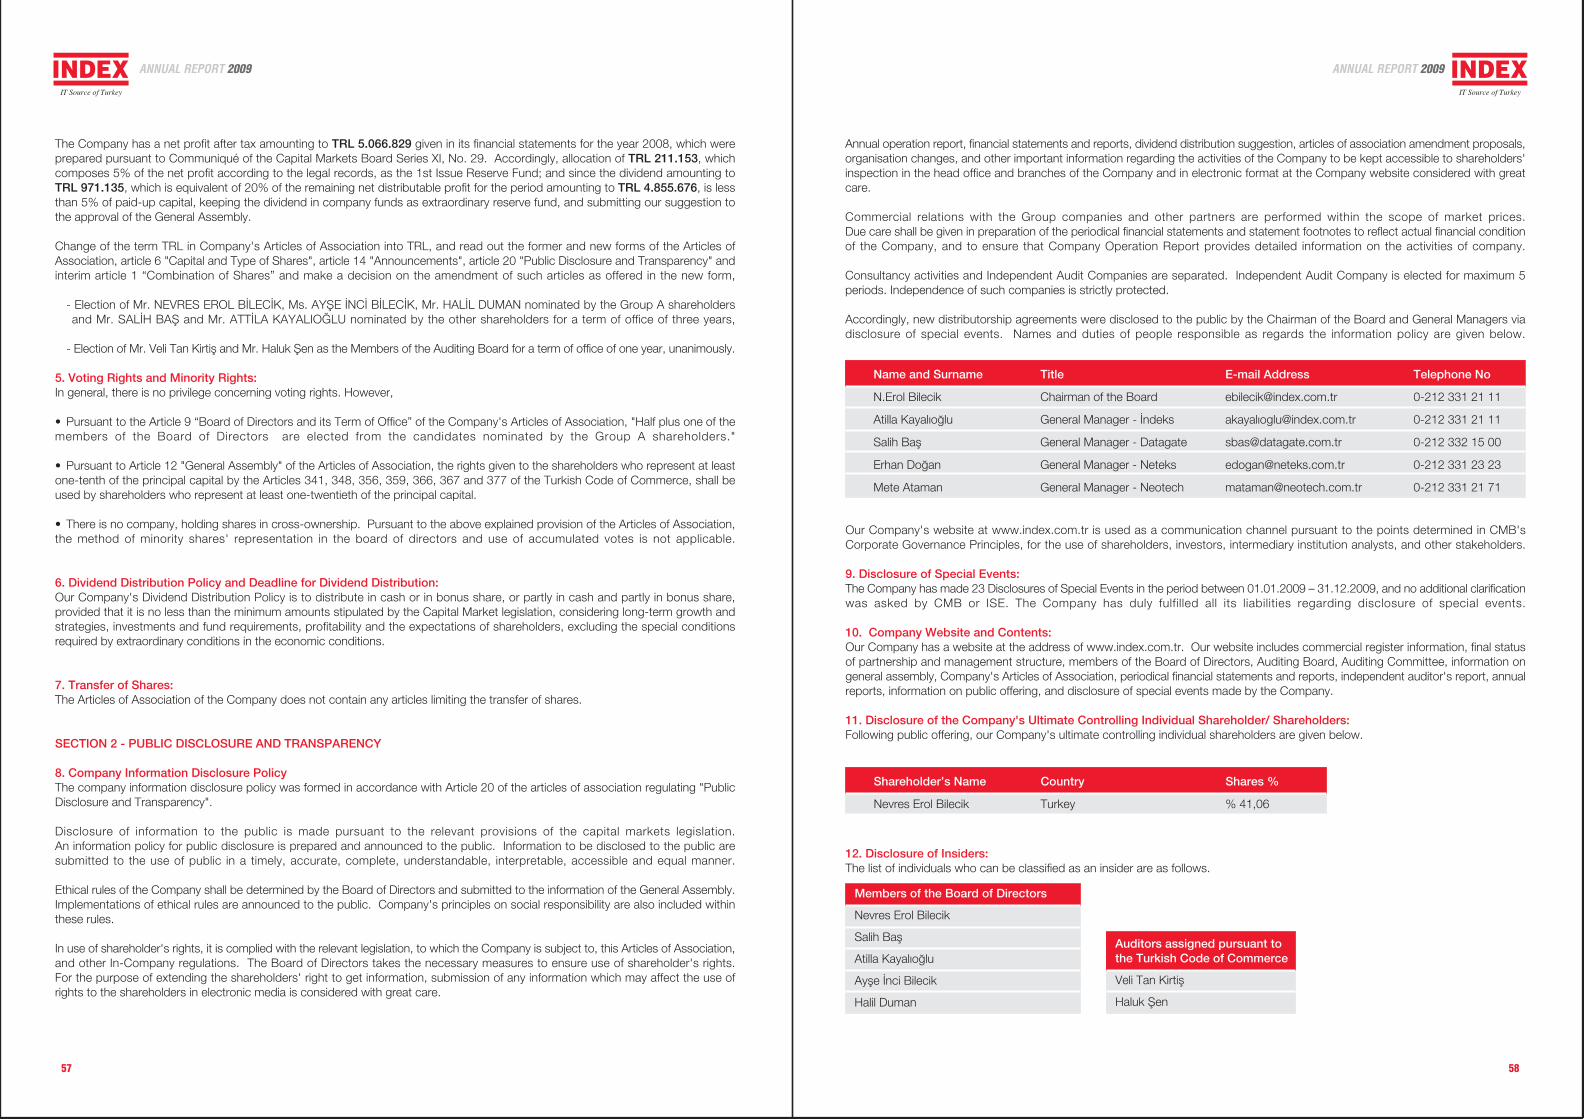
57 58
The Company has a net profit after tax amounting to TRL 5.066.829 given in its financial statements for the year 2008, which wereprepared pursuant to Communiqué of the Capital Markets Board Series XI, No. 29. Accordingly, allocation of TRL 211.153, whichcomposes 5% of the net profit according to the legal records, as the 1st Issue Reserve Fund; and since the dividend amounting toTRL 971.135, which is equivalent of 20% of the remaining net distributable profit for the period amounting to TRL 4.855.676, is lessthan 5% of paid-up capital, keeping the dividend in company funds as extraordinary reserve fund, and submitting our suggestion tothe approval of the General Assembly.
Change of the term TRL in Company's Articles of Association into TRL, and read out the former and new forms of the Articles ofAssociation, article 6 "Capital and Type of Shares", article 14 "Announcements", article 20 "Public Disclosure and Transparency" andinterim article 1 “Combination of Shares” and make a decision on the amendment of such articles as offered in the new form,
- Election of Mr. NEVRES EROL B‹LEC‹K, Ms. AYfiE ‹NC‹ B‹LEC‹K, Mr. HAL‹L DUMAN nominated by the Group A shareholders and Mr. SAL‹H BAfi and Mr. ATT‹LA KAYALIO⁄LU nominated by the other shareholders for a term of office of three years,
- Election of Mr. Veli Tan Kirtifl and Mr. Haluk fien as the Members of the Auditing Board for a term of office of one year, unanimously.
5. Voting Rights and Minority Rights:In general, there is no privilege concerning voting rights. However,
• Pursuant to the Article 9 “Board of Directors and its Term of Office” of the Company's Articles of Association, "Half plus one of themembers of the Board of Directors are elected from the candidates nominated by the Group A shareholders."
• Pursuant to Article 12 "General Assembly" of the Articles of Association, the rights given to the shareholders who represent at leastone-tenth of the principal capital by the Articles 341, 348, 356, 359, 366, 367 and 377 of the Turkish Code of Commerce, shall beused by shareholders who represent at least one-twentieth of the principal capital.
• There is no company, holding shares in cross-ownership. Pursuant to the above explained provision of the Articles of Association,the method of minority shares' representation in the board of directors and use of accumulated votes is not applicable.
6. Dividend Distribution Policy and Deadline for Dividend Distribution:Our Company's Dividend Distribution Policy is to distribute in cash or in bonus share, or partly in cash and partly in bonus share,provided that it is no less than the minimum amounts stipulated by the Capital Market legislation, considering long-term growth andstrategies, investments and fund requirements, profitability and the expectations of shareholders, excluding the special conditionsrequired by extraordinary conditions in the economic conditions.
7. Transfer of Shares:The Articles of Association of the Company does not contain any articles limiting the transfer of shares.
SECTION 2 - PUBLIC DISCLOSURE AND TRANSPARENCY
8. Company Information Disclosure PolicyThe company information disclosure policy was formed in accordance with Article 20 of the articles of association regulating "PublicDisclosure and Transparency".
Disclosure of information to the public is made pursuant to the relevant provisions of the capital markets legislation.An information policy for public disclosure is prepared and announced to the public. Information to be disclosed to the public aresubmitted to the use of public in a timely, accurate, complete, understandable, interpretable, accessible and equal manner.
Ethical rules of the Company shall be determined by the Board of Directors and submitted to the information of the General Assembly.Implementations of ethical rules are announced to the public. Company's principles on social responsibility are also included withinthese rules.
In use of shareholder's rights, it is complied with the relevant legislation, to which the Company is subject to, this Articles of Association,and other In-Company regulations. The Board of Directors takes the necessary measures to ensure use of shareholder's rights.For the purpose of extending the shareholders' right to get information, submission of any information which may affect the use ofrights to the shareholders in electronic media is considered with great care.
Name and Surname Title E-mail Address Telephone No
N.Erol Bilecik Chairman of the Board [email protected] 0-212 331 21 11
Atilla Kayal›o¤lu General Manager - ‹ndeks akayal›[email protected] 0-212 331 21 11
Salih Bafl General Manager - Datagate [email protected] 0-212 332 15 00
Erhan Do¤an General Manager - Neteks [email protected] 0-212 331 23 23
Mete Ataman General Manager - Neotech [email protected] 0-212 331 21 71
Our Company's website at www.index.com.tr is used as a communication channel pursuant to the points determined in CMB'sCorporate Governance Principles, for the use of shareholders, investors, intermediary institution analysts, and other stakeholders.
9. Disclosure of Special Events:The Company has made 23 Disclosures of Special Events in the period between 01.01.2009 – 31.12.2009, and no additional clarificationwas asked by CMB or ISE. The Company has duly fulfilled all its liabilities regarding disclosure of special events.
10. Company Website and Contents:Our Company has a website at the address of www.index.com.tr. Our website includes commercial register information, final statusof partnership and management structure, members of the Board of Directors, Auditing Board, Auditing Committee, information ongeneral assembly, Company's Articles of Association, periodical financial statements and reports, independent auditor's report, annualreports, information on public offering, and disclosure of special events made by the Company.
11. Disclosure of the Company's Ultimate Controlling Individual Shareholder/ Shareholders:Following public offering, our Company's ultimate controlling individual shareholders are given below.
Shareholder’s Name Country Shares %
Nevres Erol Bilecik Turkey % 41,06
12. Disclosure of Insiders:The list of individuals who can be classified as an insider are as follows.
Members of the Board of Directors
Nevres Erol Bilecik
Salih Bafl
Atilla Kayal›o¤lu
Ayfle ‹nci Bilecik
Halil Duman
Auditors assigned pursuant tothe Turkish Code of Commerce
Veli Tan Kirtifl
Haluk fien
Annual operation report, financial statements and reports, dividend distribution suggestion, articles of association amendment proposals,organisation changes, and other important information regarding the activities of the Company to be kept accessible to shareholders'inspection in the head office and branches of the Company and in electronic format at the Company website considered with greatcare.
Commercial relations with the Group companies and other partners are performed within the scope of market prices.Due care shall be given in preparation of the periodical financial statements and statement footnotes to reflect actual financial conditionof the Company, and to ensure that Company Operation Report provides detailed information on the activities of company.
Consultancy activities and Independent Audit Companies are separated. Independent Audit Company is elected for maximum 5periods. Independence of such companies is strictly protected.
Accordingly, new distributorship agreements were disclosed to the public by the Chairman of the Board and General Managers viadisclosure of special events. Names and duties of people responsible as regards the information policy are given below.
ANNUAL REPORT 2009 ANNUAL REPORT 2009
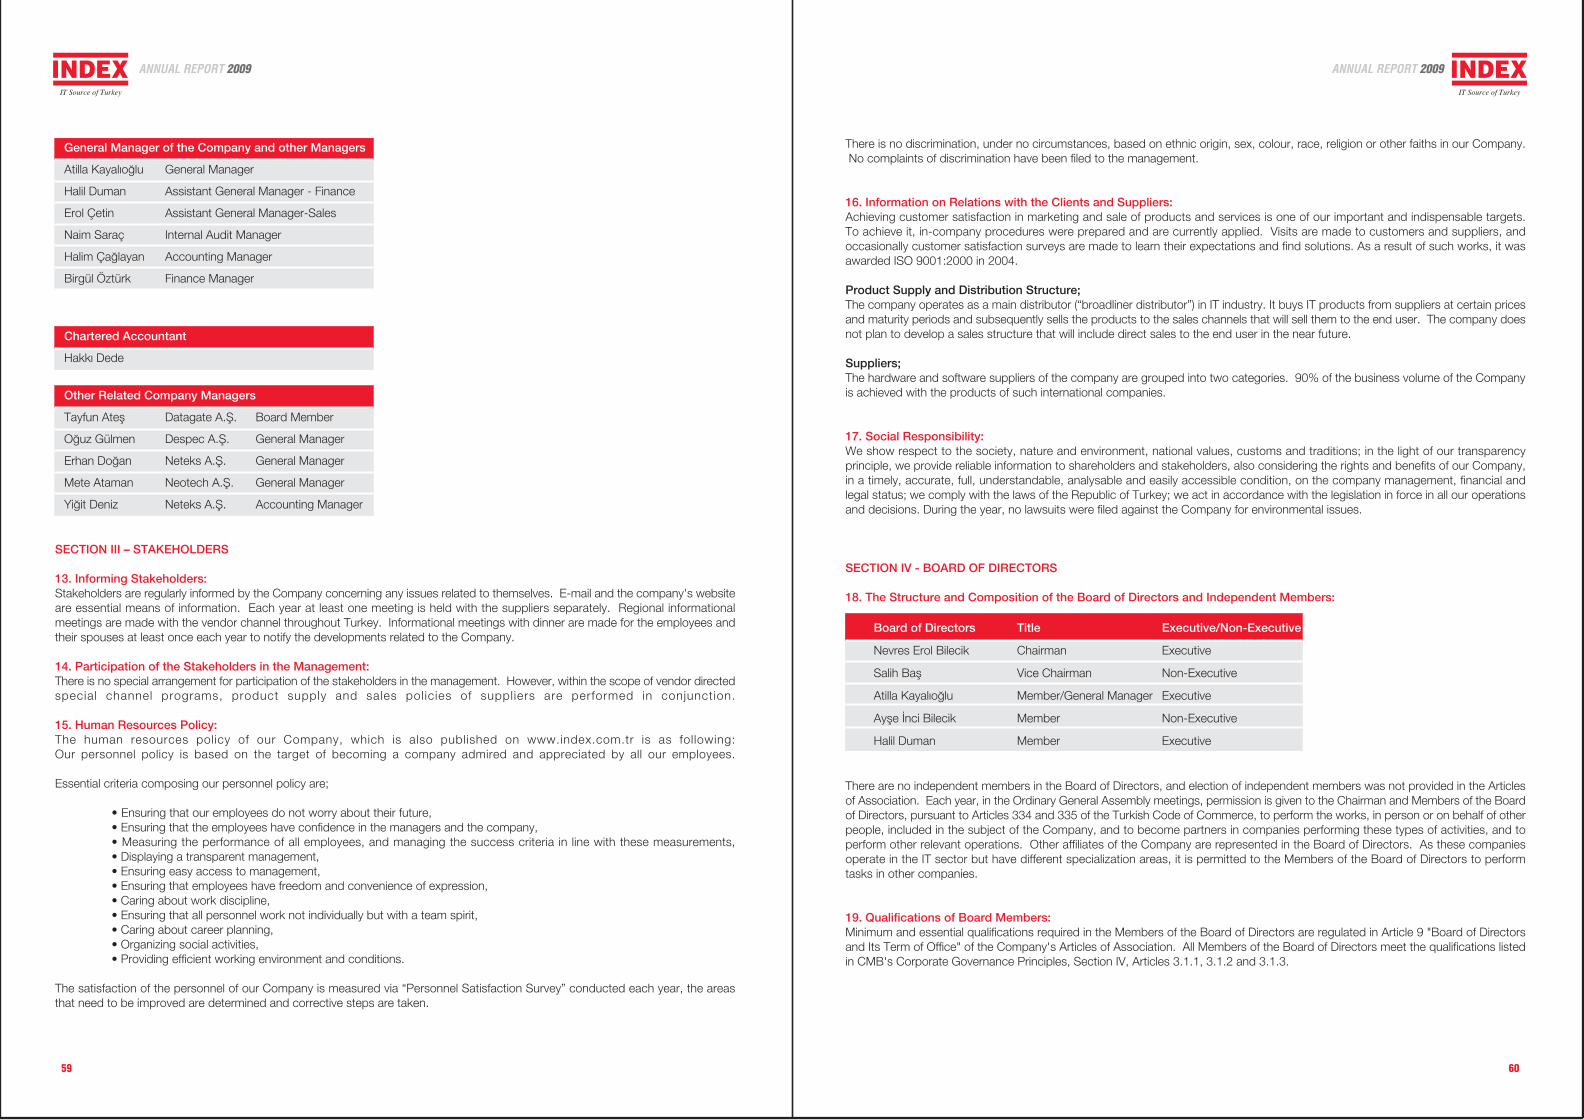
59 60
General Manager of the Company and other Managers
Atilla Kayal›o¤lu General Manager
Halil Duman Assistant General Manager - Finance
Erol Çetin Assistant General Manager-Sales
Naim Saraç Internal Audit Manager
Halim Ça¤layan Accounting Manager
Birgül Öztürk Finance Manager
Other Related Company Managers
Tayfun Atefl Datagate A.fi. Board Member
O¤uz Gülmen Despec A.fi. General Manager
Erhan Do¤an Neteks A.fi. General Manager
Mete Ataman Neotech A.fi. General Manager
Yi¤it Deniz Neteks A.fi. Accounting Manager
Chartered Accountant
Hakk› Dede
SECTION III – STAKEHOLDERS
13. Informing Stakeholders:Stakeholders are regularly informed by the Company concerning any issues related to themselves. E-mail and the company's websiteare essential means of information. Each year at least one meeting is held with the suppliers separately. Regional informationalmeetings are made with the vendor channel throughout Turkey. Informational meetings with dinner are made for the employees andtheir spouses at least once each year to notify the developments related to the Company.
14. Participation of the Stakeholders in the Management:There is no special arrangement for participation of the stakeholders in the management. However, within the scope of vendor directedspecial channel programs, product supply and sales pol icies of suppl iers are performed in conjunction.
15. Human Resources Policy:The human resources policy of our Company, which is also published on www.index.com.tr is as following:Our personnel policy is based on the target of becoming a company admired and appreciated by all our employees.
Essential criteria composing our personnel policy are;
• Ensuring that our employees do not worry about their future,• Ensuring that the employees have confidence in the managers and the company,• Measuring the performance of all employees, and managing the success criteria in line with these measurements,• Displaying a transparent management,• Ensuring easy access to management,• Ensuring that employees have freedom and convenience of expression,• Caring about work discipline,• Ensuring that all personnel work not individually but with a team spirit,• Caring about career planning,• Organizing social activities,• Providing efficient working environment and conditions.
The satisfaction of the personnel of our Company is measured via “Personnel Satisfaction Survey” conducted each year, the areasthat need to be improved are determined and corrective steps are taken.
There is no discrimination, under no circumstances, based on ethnic origin, sex, colour, race, religion or other faiths in our Company. No complaints of discrimination have been filed to the management.
16. Information on Relations with the Clients and Suppliers:Achieving customer satisfaction in marketing and sale of products and services is one of our important and indispensable targets.To achieve it, in-company procedures were prepared and are currently applied. Visits are made to customers and suppliers, andoccasionally customer satisfaction surveys are made to learn their expectations and find solutions. As a result of such works, it wasawarded ISO 9001:2000 in 2004.
Product Supply and Distribution Structure;The company operates as a main distributor (“broadliner distributor”) in IT industry. It buys IT products from suppliers at certain pricesand maturity periods and subsequently sells the products to the sales channels that will sell them to the end user. The company doesnot plan to develop a sales structure that will include direct sales to the end user in the near future.
Suppliers;The hardware and software suppliers of the company are grouped into two categories. 90% of the business volume of the Companyis achieved with the products of such international companies.
17. Social Responsibility:We show respect to the society, nature and environment, national values, customs and traditions; in the light of our transparencyprinciple, we provide reliable information to shareholders and stakeholders, also considering the rights and benefits of our Company,in a timely, accurate, full, understandable, analysable and easily accessible condition, on the company management, financial andlegal status; we comply with the laws of the Republic of Turkey; we act in accordance with the legislation in force in all our operationsand decisions. During the year, no lawsuits were filed against the Company for environmental issues.
SECTION IV - BOARD OF DIRECTORS
18. The Structure and Composition of the Board of Directors and Independent Members:
Board of Directors Title Executive/Non-Executive
Nevres Erol Bilecik Chairman Executive
Salih Bafl Vice Chairman Non-Executive
Atilla Kayal›o¤lu Member/General Manager Executive
Ayfle ‹nci Bilecik Member Non-Executive
Halil Duman Member Executive
There are no independent members in the Board of Directors, and election of independent members was not provided in the Articlesof Association. Each year, in the Ordinary General Assembly meetings, permission is given to the Chairman and Members of the Boardof Directors, pursuant to Articles 334 and 335 of the Turkish Code of Commerce, to perform the works, in person or on behalf of otherpeople, included in the subject of the Company, and to become partners in companies performing these types of activities, and toperform other relevant operations. Other affiliates of the Company are represented in the Board of Directors. As these companiesoperate in the IT sector but have different specialization areas, it is permitted to the Members of the Board of Directors to performtasks in other companies.
19. Qualifications of Board Members:Minimum and essential qualifications required in the Members of the Board of Directors are regulated in Article 9 "Board of Directorsand Its Term of Office" of the Company's Articles of Association. All Members of the Board of Directors meet the qualifications listedin CMB's Corporate Governance Principles, Section IV, Articles 3.1.1, 3.1.2 and 3.1.3.
ANNUAL REPORT 2009 ANNUAL REPORT 2009
61 62
20. Mission, Vision and Strategic Goals of the Company:Our Company’s mission is to “Continue its leadership by providing service as a main supply centre of IT products for all companiesin the computer channel considering their changing requirements”. This definition has been determined by the Board of Directors andannounced to the general public through the website of the Company.Our Company’s vision is to “Be an IT Distributor capable of meeting all requirements of the computer channel from one single point.”
Managers each year prepare a business plan and submit to the Board of Directors, which upon approval becomes effective as of thefirst week of January. Strategic business plan, income and expenditure budgets, which are prepared at the beginning of December,are evaluated by the Board of Directors which convenes regularly each month.
21. Risk Management Mechanism and Internal Control:Risk management has an important place within the constant activities of our Company. Main starting point of risk management isidentification and follow-up of all risks, which our Company has confronted with or it is probable to confront. Our managers targetto ensure that applications which improve and develop risk management are constantly implemented in the Company. Current andprobable risks of our Company are categorized as follows:
a- Receivables Risk: Dealer channel, which is described as regular dealers within the distribution structure, has low capital structure. This group of dealers, which is considered to have a number of approx. 5,000, is transferred frequently, therefore, their opening andclosing ratio is rather high. The Company makes sales to almost all companies dealing with the trading of computer.
b- Constant Renewal of Product Technologies: The most important feature of the sector we operate in is that technology andprices of the products are constantly changed and renewed. Companies who fail to adjust their inventory turnover to this changemay face with the risk of loss.
c- High Competition in the Sector and Profit Margins: Manufacturer companies in the sector have a high competition worldwideas brands. The competition of manufacturer companies reflects to the prices in the national market. For companies which have weakfinancing and cost structure, this situation causes an important risk.
d- Exchange Rate Risk: A great part of the IT products are imported from foreign countries or purchased from domestic sourcesin foreign currency. When buying products the Company is often credited in foreign currency, and then payments are made in thesecurrencies. Companies, which do not formulate their sales policy based on product-in-currency, are faced with loss risk when foreignexchange rate increases.
e- No exclusivity clause in appointing of distributors by the manufacturer companies: In distributorship contracts made withmanufacturer companies there is no reciprocal exclusivity relation. Manufacturer companies, when appointing distributors, may appointother distributors as well according to the conditions of the market, and distributor companies may sign distributorship contracts withother manufacturer companies.
f- Changes made in importation regimes: Changes occasionally made by the Governments in importation regimes effect theimportation positively, but such changes may sometimes have negative effects as well.
Due to the foregoing risks and for controlling all assets and liabilities of the Company, an Internal Audit Department reporting directlyto the Chairman of the Board is established. Further, our current accounts and risk management department investigates our dealers.These inquiries are intended to reveal current account relations of the dealers with other suppliers, their relations with banks and otherfinancial institutions and whether they issue any bad cheques or not. Credit Committee: The reports on the computer companies whichcompleted their first year in the industry and those whose credit line has been extended are drawn up by the risk control analysts andpresented to the credit committee that meets in certain days each week. The credit committee determines credit lines for each companyaccording to the data from their investigation, past payment data and sales performance. The credit committee determines the workingmethod, and if required, asks dealers to submit a cheque endorsed by a third party or give a further security in mortgage form. Creditlines exceeding a certain amount are evaluated at the weekly meetings of the executive committee, and any excess of credit lines issubject to the approval of the executive committee.
22. Authority and Responsibilities of the Members of the Board of Directors and Managers:Authority and Responsibilities of the Members of the Board of Directors and Managers are defined in the Articles of Association withreference to the relevant provisions of the Turkish Code of Commerce.
23. Principles of Activity of the Board of Directors:The Board of Directors has convened 14 times within the period between 01.01.2009 and 31.12.2009. The agenda and statementsrelating to the meeting are passed to the Members of the Board of Directors in advance. Such communication is handled by thesecretary of the Chairman of the Board.
While no resolutions are made in some of the discussed topics, the minutes of the topics which were resolved are not disclosed tothe public. On the other hand, important subjects resolved in the meeting of the Board of Directors are announced to the generalpublic through Disclosure of Special Events.
24. Prohibitions Concerning Transactions and Competition with the Company:The required permission was granted by the General Assembly to the Members of the Board of Directors to carry out transactionsand competition with the Company as specified in Articles 334 and 335 of the Turkish Commercial Code.
25. Ethical Rules:The Board of Directors of the Company has formulated the ethical rules for the employees. These rules are included in the prospectuswhich was published during the public offering of the company, and can be found in the investors section of the company websiteat the address of www.index.com.tr.
26. Number, Structure and Independence of Committees Established by the Board of Directors:Auditing Committee of our Company is composed of Mr. Salih Bafl and Mrs. Ayfle ‹nci Bilecik. The committee met 3 times in 2009.Auditing Committee audited and inspected the accounting system and financial data of the Company, controlled whether the financialstatements reflected the actual financial status, and found out compliance to generally accepted accounting principles and financiallegislation. There are not independent members in the Board of Directors, therefore, the members of the committee are not independent, either. Executive members of the Board of Directors do not take office in any committee. At the meeting of the Board of Directors of theCompany held on 29.04.2009, it was resolved to establish a Corporate Governance Committee, and to elect Salih BAfi, who is aBoard Member, as the Chairman of the Committee, and Ayfle ‹nci Bilecik and Halil Duman, who are Board Members, as the membersof the Committee.
27. Remuneration of the Board of Directors:Members of the Board of Directors do not get any remuneration. The Chairman and Deputy Chairman of the Board of Directors andPresident of the Executive Board, also the General Manager and Deputy General Manager get monthly salaries related to their tasks.
The Company did not lend any money, extend any credit, extend a personal credit through a third party, nor provided any guaranteesto or in favour of any Member of the Board of Directors or any Manager of the Company.
ANNUAL REPORT 2009 ANNUAL REPORT 2009

63
6. BOARD OF DIRECTORS' SUGGESTIONSON DIVIDEND DISTRIBUTION
‹NDEKS B‹LG‹SAYAR S‹STEMLER‹ MÜHEND‹SL‹K SANAY‹ VE T‹CARET A.fi. ANNUAL REPORT 2009
ANNUAL REPORT 2009
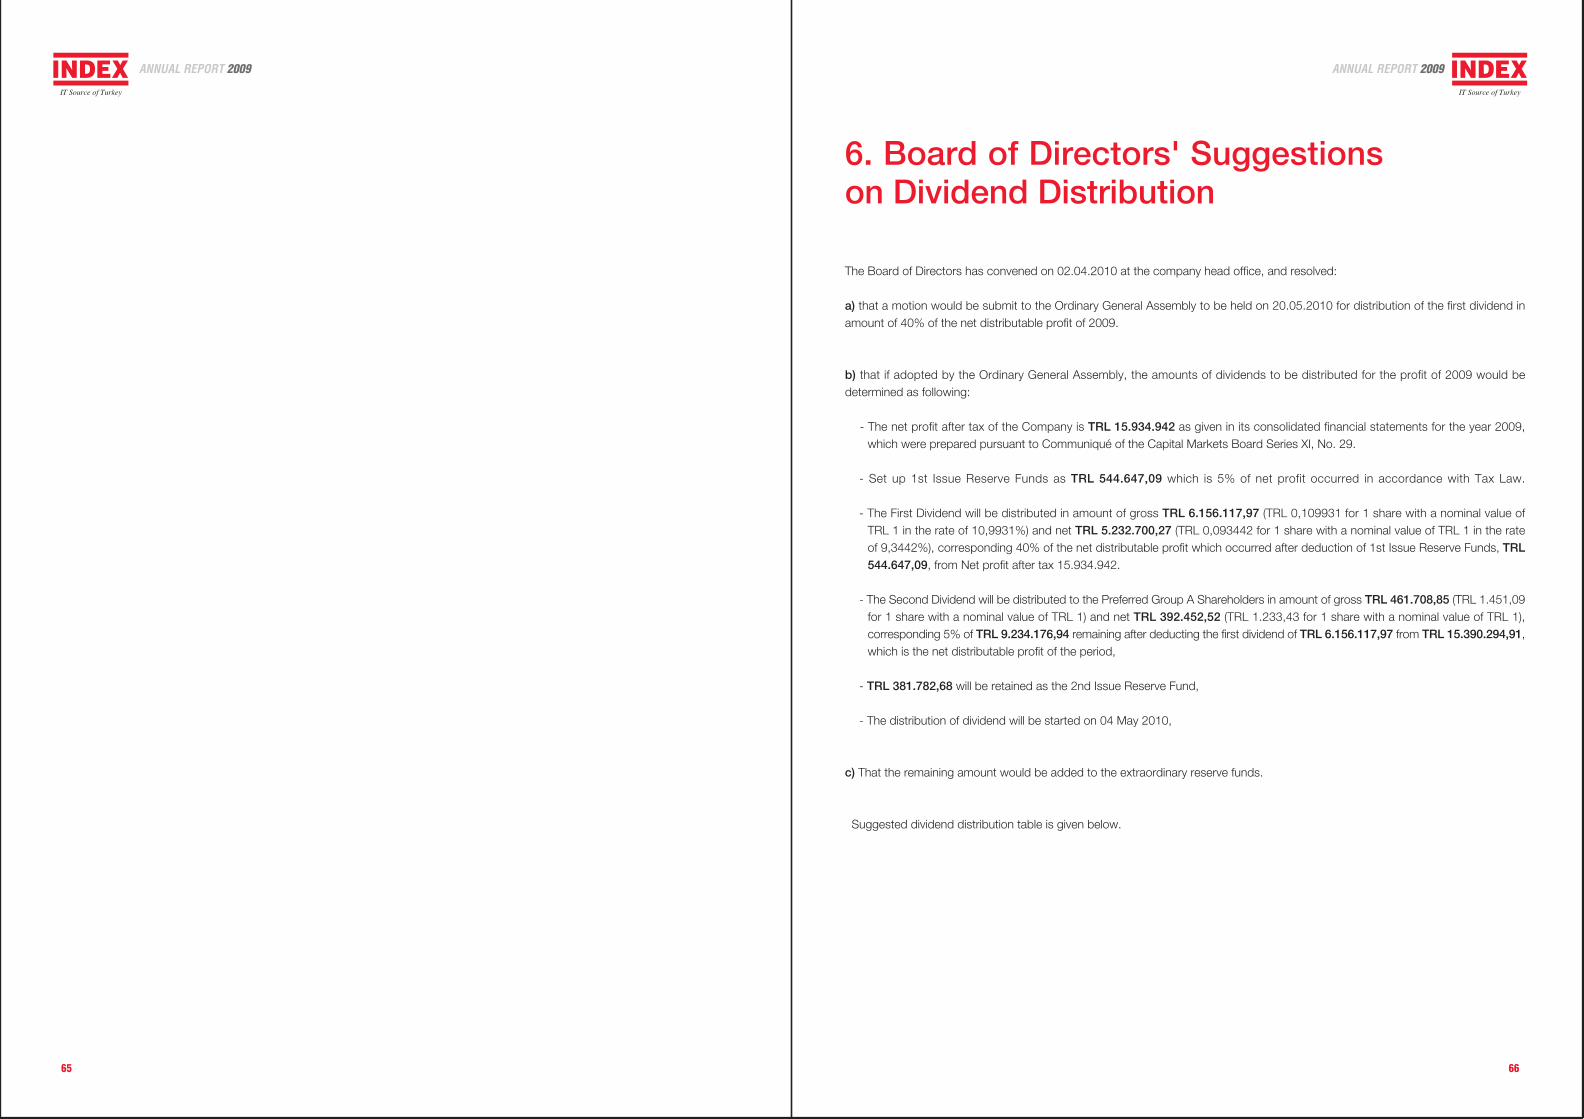
65 66
6. Board of Directors' Suggestionson Dividend Distribution
The Board of Directors has convened on 02.04.2010 at the company head office, and resolved:
a) that a motion would be submit to the Ordinary General Assembly to be held on 20.05.2010 for distribution of the first dividend inamount of 40% of the net distributable profit of 2009.
b) that if adopted by the Ordinary General Assembly, the amounts of dividends to be distributed for the profit of 2009 would bedetermined as following:
- The net profit after tax of the Company is TRL 15.934.942 as given in its consolidated financial statements for the year 2009,which were prepared pursuant to Communiqué of the Capital Markets Board Series XI, No. 29.
- Set up 1st Issue Reserve Funds as TRL 544.647,09 which is 5% of net profit occurred in accordance with Tax Law.
- The First Dividend will be distributed in amount of gross TRL 6.156.117,97 (TRL 0,109931 for 1 share with a nominal value ofTRL 1 in the rate of 10,9931%) and net TRL 5.232.700,27 (TRL 0,093442 for 1 share with a nominal value of TRL 1 in the rateof 9,3442%), corresponding 40% of the net distributable profit which occurred after deduction of 1st Issue Reserve Funds, TRL544.647,09, from Net profit after tax 15.934.942.
- The Second Dividend will be distributed to the Preferred Group A Shareholders in amount of gross TRL 461.708,85 (TRL 1.451,09for 1 share with a nominal value of TRL 1) and net TRL 392.452,52 (TRL 1.233,43 for 1 share with a nominal value of TRL 1),corresponding 5% of TRL 9.234.176,94 remaining after deducting the first dividend of TRL 6.156.117,97 from TRL 15.390.294,91,which is the net distributable profit of the period,
- TRL 381.782,68 will be retained as the 2nd Issue Reserve Fund,
- The distribution of dividend will be started on 04 May 2010,
c) That the remaining amount would be added to the extraordinary reserve funds.
Suggested dividend distribution table is given below.
ANNUAL REPORT 2009 ANNUAL REPORT 2009
67
7. AUDITING BOARD’S REPORT
‹NDEKS B‹LG‹SAYAR S‹STEMLER‹ MÜHEND‹SL‹K SANAY‹ VE T‹CARET A.fi. ANNUAL REPORT 2009
ANNUAL REPORT 2009
69 70
7. Auditing Board’s Report
AUDITING BOARD'S REPORTTo the General Assembly of
İndeks Bilgisayar istemleri Mühendislik Sanayi ve Ticaret A.Ş.
Title : İndeks Bilgisayar istemleri Mühendislik Sanayi veTicaret A.Ş.
Head Office : Ayzağa Mah. Cendere Yolu No: 9/1 Şişli –ISTANBUL
Capital : TRL 56.000.000
Fields of Activity : Purchase and sale of computers of any kind, providingtechnical and software support and their sales, purchase andsale of computer parts, accessories and consumables of anykind.
The auditors' names, terms of office, whether they arepartners or personnel of the company, or not
: Veli TAN KİRTİŞ, Haluk ŞEN: Term of office is 1 year,and they are not partners or personnel of the company.
Number of the Board of Directors meetings attended orAuditing Board meetings held
: Attended the Board of Directors Meetings for 3 times.
Scope, dates and consequence of examinations performedon the company's accounts, books, and documents
: The legal book records and the documents concerning thesemi-annual and annual balance sheets of the company havebeen examined. We confirm that the mentioned bookrecords and documents reflect the actual situation.
Numbers and conclusions of the counting made in theshareholding cash office in accordance with the sub-paragraph 3, paragraph 1, article 353 of the Turkish Codeof Commerce
: The company cash office was counted 4 times within theperiod, and as a result of the counting, it was seen that theactual cash assets comply with the corresponding records.
Dates and conclusions of the examinations performed inaccordance with the sub-paragraph 4, paragraph 1, article353 of the Turkish Code of Commerce
: The presence of the guarantees and valuable papers listed inthe company's records was checked, and it was seen thatthey comply with the corresponding records.
Complaints and irregularities reported and measures takenin respect of the same
: No complaints or irregularities have been reported to us.
We have examined the accounts and transactions of İndeks Bilgisayar Sistemleri Mühendislik Sanayi veTicaret Anonim Şirketi for the accounting period between 01.01.2009 to 31.12.2009 for compliance withthe requirements of the Turkish Code of Commerce, the company's Articles of Association, other relevantlegislation, and generally accepted accounting principles and standards.
In our opinion the enclosed balance sheet issued as of 31.12.2009, the contents of which we certify,accurately reflects the true financial standing of the company as of the same date; and the profit & lossstatement for the period between 01.01.2009 and 31.12.2009 accurately and truly reflects the results ofbusiness activities during the same period, and the suggestion of profit allocation is in compliance with thelegislation in force and the articles of association of the company.
We kindly submit for your approval the balance sheet and the profit & loss statement and acquittal of theBoard of Directors.
Veli TAN KİRTİŞ
Auditors
Haluk ŞEN
ANNUAL REPORT 2009 ANNUAL REPORT 2009
71
8. INDEPENDENT AUDITORS REPORT
‹NDEKS B‹LG‹SAYAR S‹STEMLER‹ MÜHEND‹SL‹K SANAY‹ VE T‹CARET A.fi. ANNUAL REPORT 2009
ANNUAL REPORT 2009
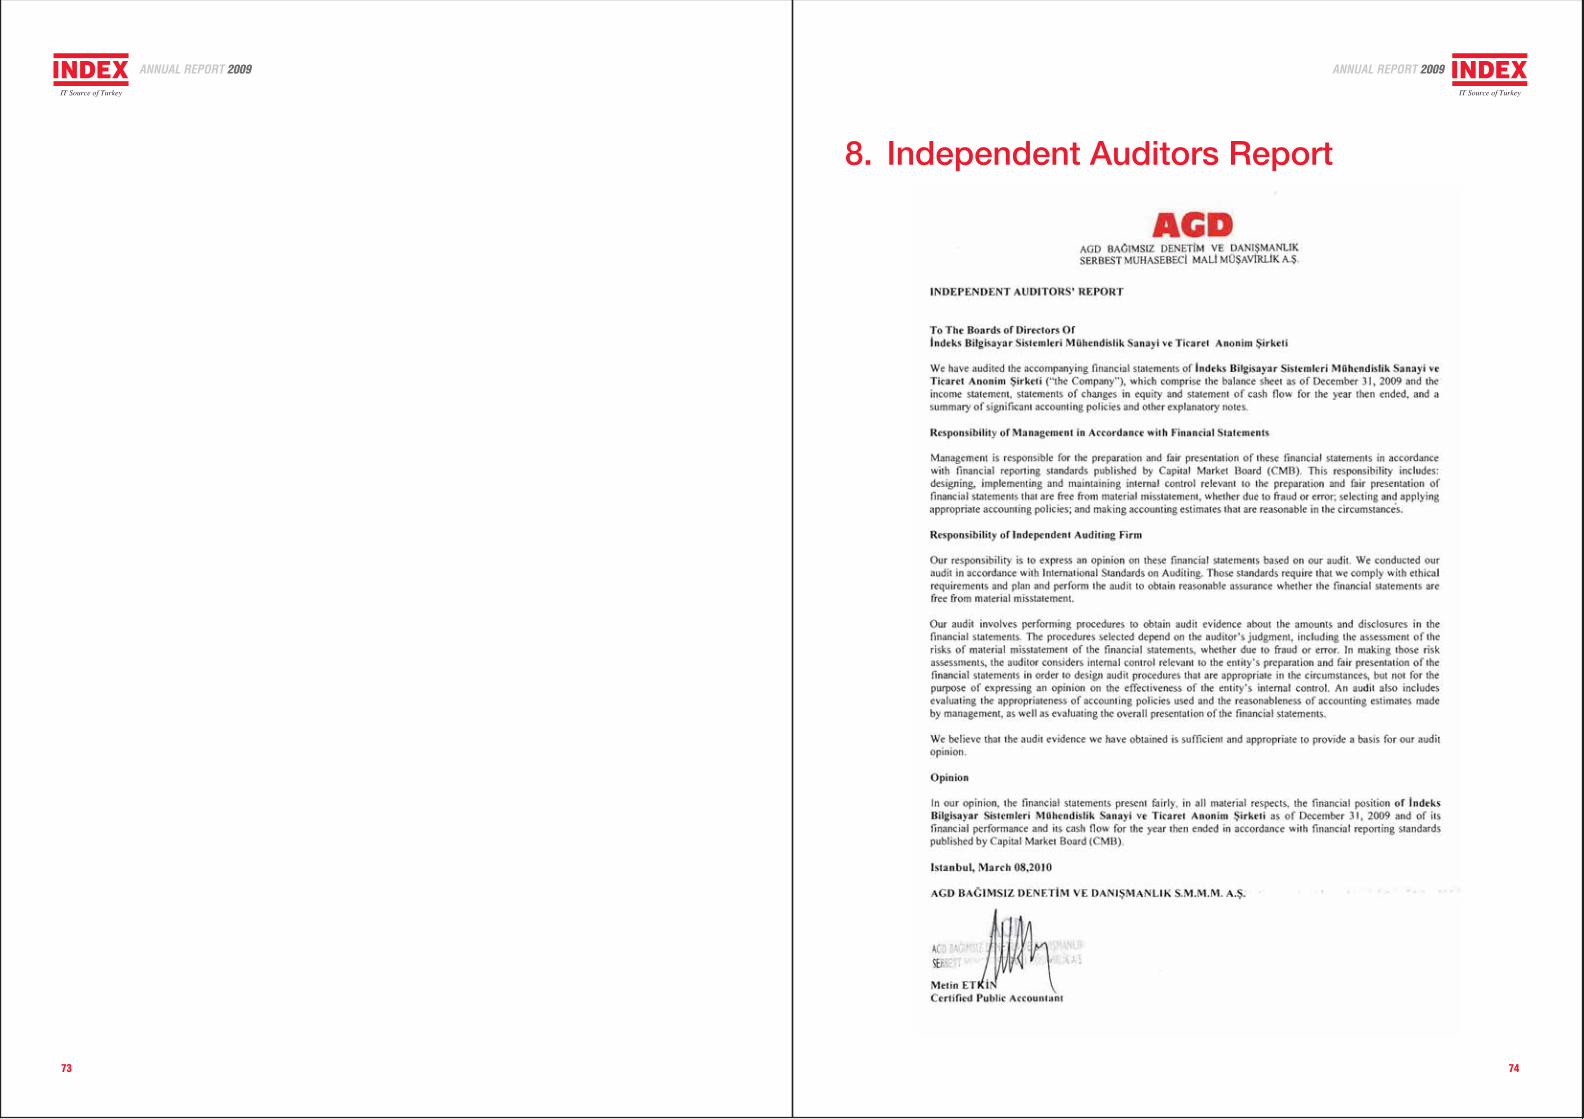
73 74
8. Independent Auditors Report
ANNUAL REPORT 2009 ANNUAL REPORT 2009
75
9. FINANCIAL STATEMENTS AND NOTES
‹NDEKS B‹LG‹SAYAR S‹STEMLER‹ MÜHEND‹SL‹K SANAY‹ VE T‹CARET A.fi. ANNUAL REPORT 2009
ANNUAL REPORT 2009
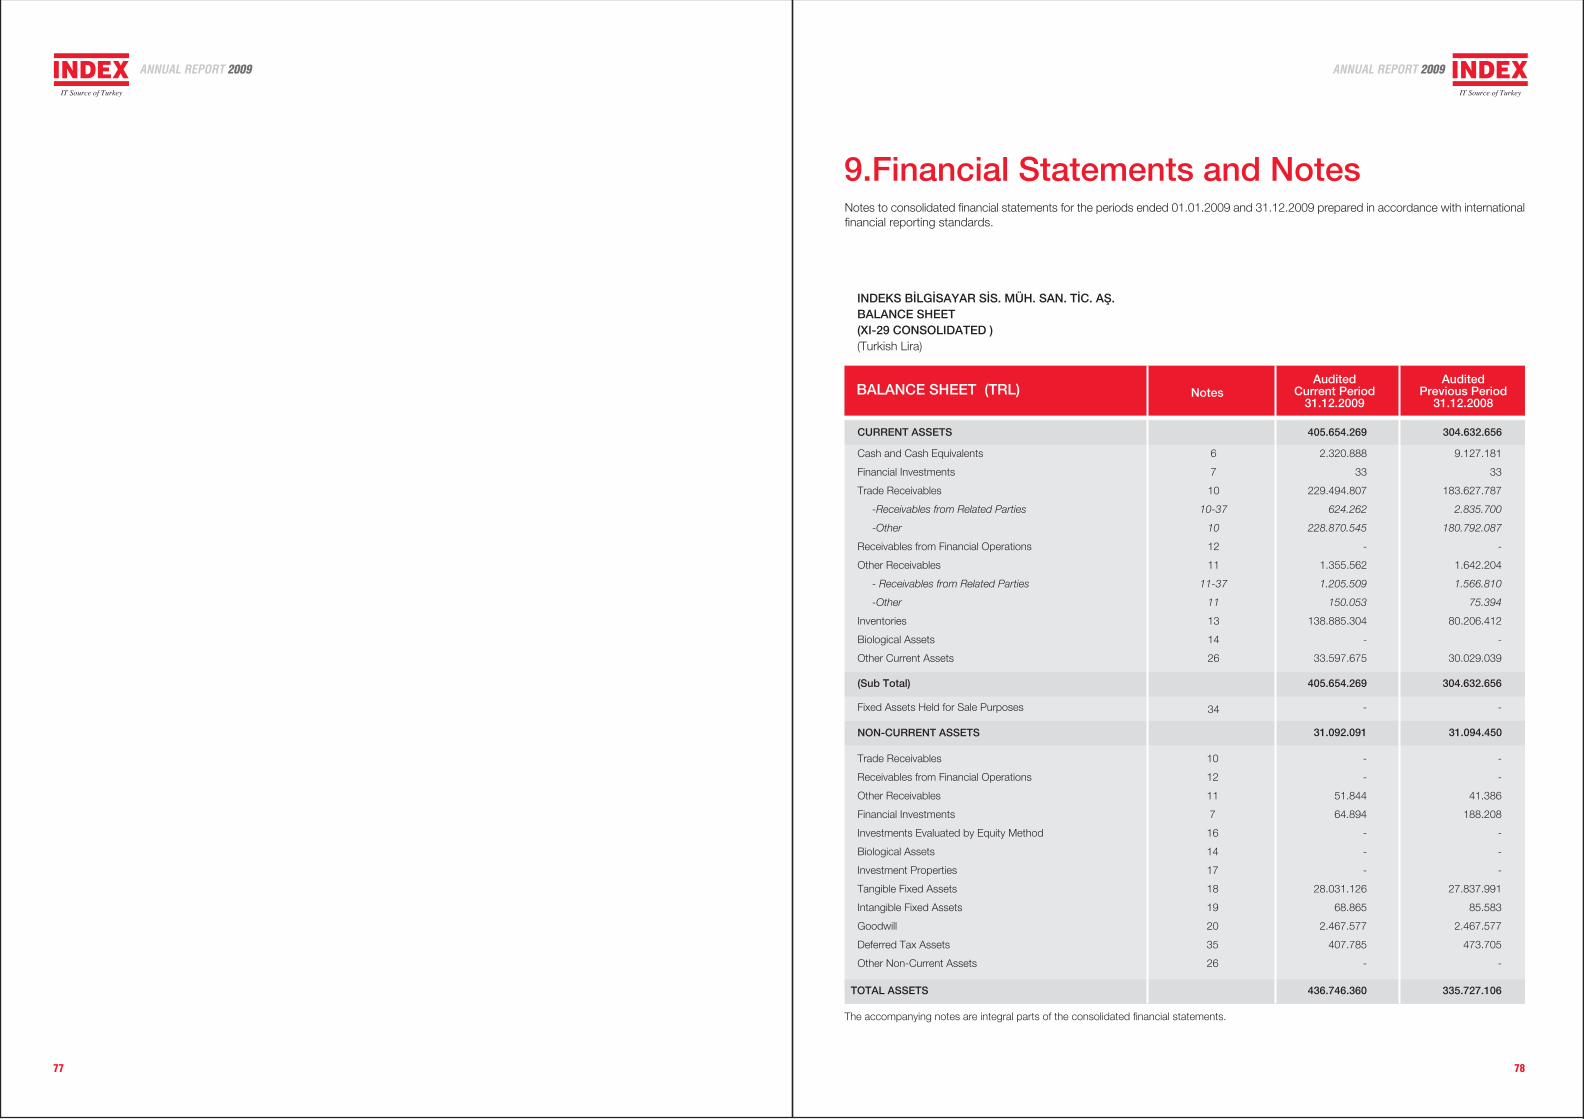
77 78
9.Financial Statements and NotesNotes to consolidated financial statements for the periods ended 01.01.2009 and 31.12.2009 prepared in accordance with internationalfinancial reporting standards.
CURRENT ASSETS
BALANCE SHEET (TRL)
The accompanying notes are integral parts of the consolidated financial statements.
Cash and Cash Equivalents
Financial Investments
Trade Receivables
-Receivables from Related Parties
-Other
Receivables from Financial Operations
Other Receivables
- Receivables from Related Parties
-Other
Inventories
Biological Assets
Other Current Assets
6
7
10
10-37
10
12
11
11-37
11
13
14
26
405.654.269 304.632.656
2.320.888
33
229.494.807
624.262
228.870.545
-
1.355.562
1.205.509
150.053
138.885.304
-
33.597.675
(Sub Total) 405.654.269 304.632.656
Fixed Assets Held for Sale Purposes -
Trade Receivables
Receivables from Financial Operations
Other Receivables
Financial Investments
Investments Evaluated by Equity Method
Biological Assets
Investment Properties
Tangible Fixed Assets
Intangible Fixed Assets
Goodwill
Deferred Tax Assets
Other Non-Current Assets
10
12
11
7
16
14
17
18
19
20
35
26
TOTAL ASSETS
9.127.181
33
183.627.787
2.835.700
180.792.087
-
1.642.204
1.566.810
75.394
80.206.412
-
30.029.039
436.746.360 335.727.106
NON-CURRENT ASSETS 31.092.091
-
-
51.844
64.894
-
-
-
28.031.126
68.865
2.467.577
407.785
-
-
-
41.386
188.208
-
-
-
27.837.991
85.583
2.467.577
473.705
-
-
31.094.450
34
INDEKS B‹LG‹SAYAR S‹S. MÜH. SAN. T‹C. Afi.BALANCE SHEET(XI-29 CONSOLIDATED )(Turkish Lira)
NotesAudited
Current Period31.12.2009
AuditedPrevious Period
31.12.2008
ANNUAL REPORT 2009 ANNUAL REPORT 2009
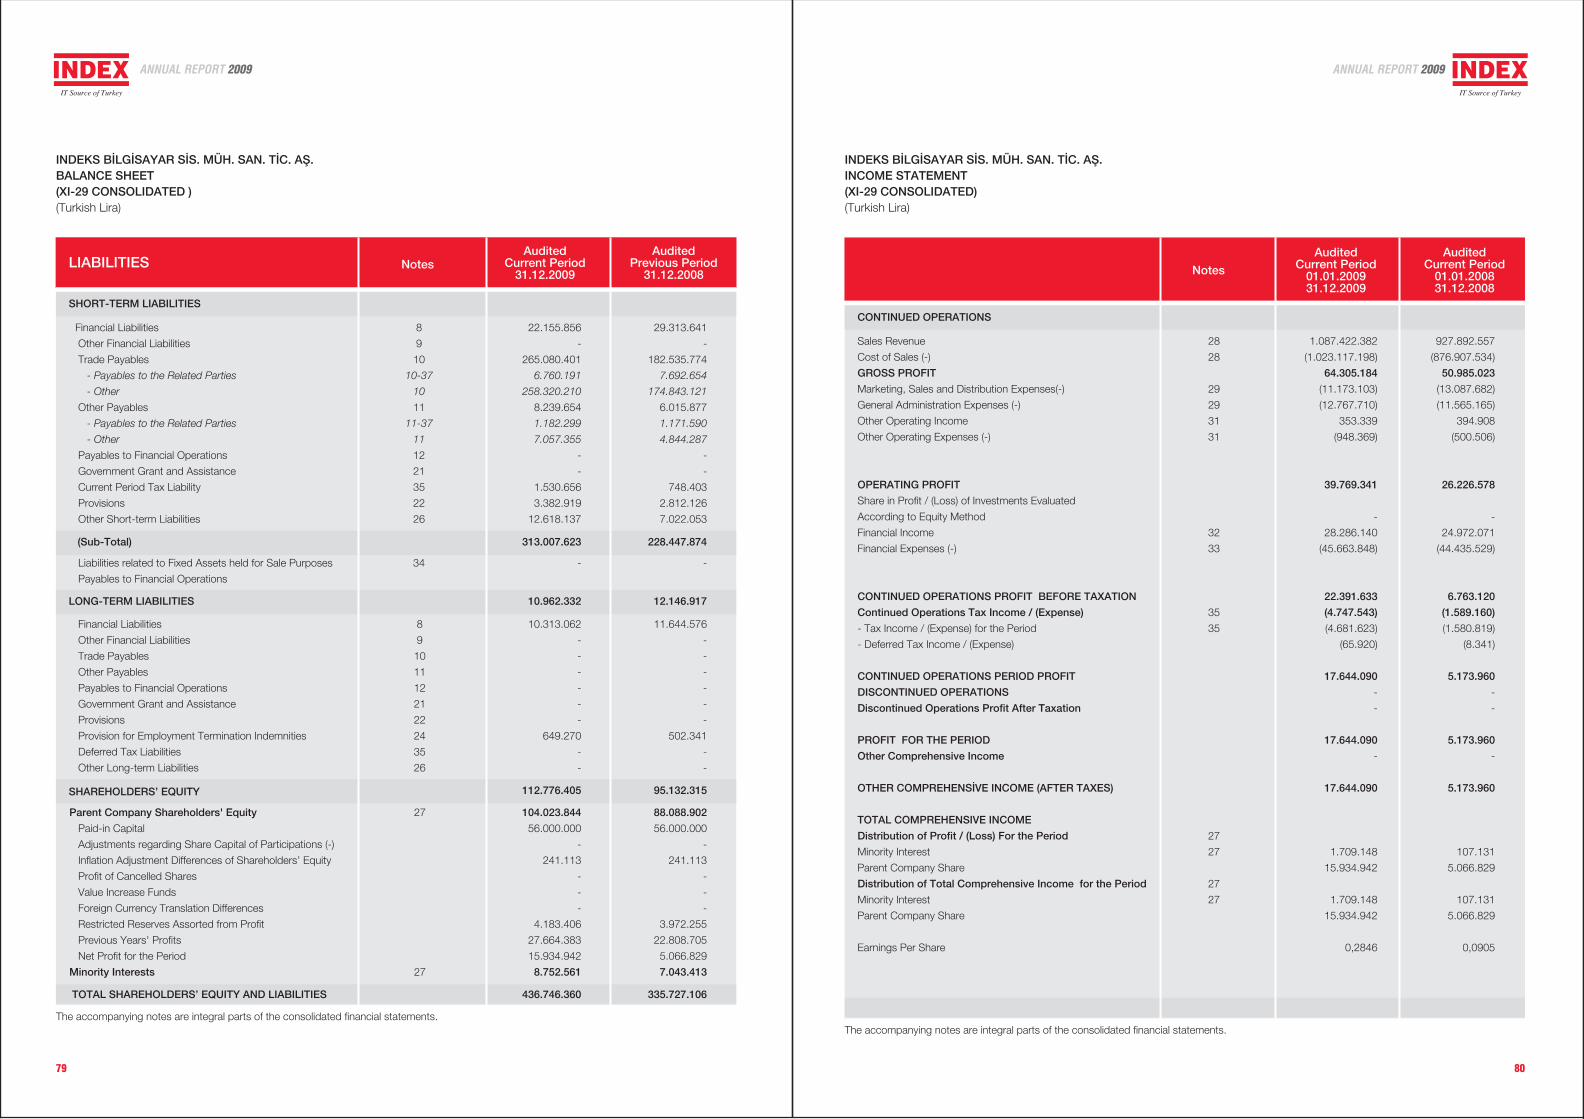
79 80
SHORT-TERM LIABILITIES
Financial Liabilities
Other Financial Liabilities
Trade Payables
- Payables to the Related Parties
- Other
Other Payables
- Payables to the Related Parties
- Other
Payables to Financial Operations
Government Grant and Assistance
Current Period Tax Liability
Provisions
Other Short-term Liabilities
(Sub-Total) 313.007.623 228.447.874
Liabilities related to Fixed Assets held for Sale Purposes
Payables to Financial Operations
34 -
LONG-TERM LIABILITIES
Financial Liabilities
Other Financial Liabilities
Trade Payables
Other Payables
Payables to Financial Operations
Government Grant and Assistance
Provisions
Provision for Employment Termination Indemnities
Deferred Tax Liabilities
Other Long-term Liabilities
10.962.332 12.146.917
8
9
10
11
12
21
22
24
35
26
8
9
10
10-37
10
11
11-37
11
12
21
35
22
26
10.313.062
-
-
-
-
-
-
649.270
-
-
11.644.576
-
-
-
-
-
-
502.341
-
-
SHAREHOLDERS’ EQUITY 112.776.405 95.132.315
Parent Company Shareholders' Equity
Paid-in Capital
Adjustments regarding Share Capital of Participations (-)
Inflation Adjustment Differences of Shareholders’ Equity
Profit of Cancelled Shares
Value Increase Funds
Foreign Currency Translation Differences
Restricted Reserves Assorted from Profit
Previous Years' Profits
Net Profit for the Period
Minority Interests
LIABILITIES
22.155.856
-
265.080.401
6.760.191
258.320.210
8.239.654
1.182.299
7.057.355
-
-
1.530.656
3.382.919
12.618.137
29.313.641
-
182.535.774
7.692.654
174.843.121
6.015.877
1.171.590
4.844.287
-
-
748.403
2.812.126
7.022.053
104.023.844
56.000.000
-
241.113
-
-
-
4.183.406
27.664.383
15.934.942
8.752.561
88.088.902
56.000.000
-
241.113
-
-
-
3.972.255
22.808.705
5.066.829
7.043.413
TOTAL SHAREHOLDERS’ EQUITY AND LIABILITIES 436.746.360 335.727.106
The accompanying notes are integral parts of the consolidated financial statements.
27
27
-
INDEKS B‹LG‹SAYAR S‹S. MÜH. SAN. T‹C. Afi.INCOME STATEMENT(XI-29 CONSOLIDATED)(Turkish Lira)2.2007
INDEKS B‹LG‹SAYAR S‹S. MÜH. SAN. T‹C. Afi.BALANCE SHEET(XI-29 CONSOLIDATED )(Turkish Lira)
NotesAudited
Current Period31.12.2009
AuditedPrevious Period
31.12.2008
The accompanying notes are integral parts of the consolidated financial statements.
Sales Revenue
Cost of Sales (-)
GROSS PROFIT
Marketing, Sales and Distribution Expenses(-)
General Administration Expenses (-)
Other Operating Income
Other Operating Expenses (-)
OPERATING PROFIT
Share in Profit / (Loss) of Investments Evaluated
According to Equity Method
Financial Income
Financial Expenses (-)
CONTINUED OPERATIONS PROFIT BEFORE TAXATION
Continued Operations Tax Income / (Expense)
- Tax Income / (Expense) for the Period
- Deferred Tax Income / (Expense)
CONTINUED OPERATIONS PERIOD PROFIT
DISCONTINUED OPERATIONS
Discontinued Operations Profit After Taxation
PROFIT FOR THE PERIOD
Other Comprehensive Income
OTHER COMPREHENS‹VE INCOME (AFTER TAXES)
TOTAL COMPREHENSIVE INCOME
Distribution of Profit / (Loss) For the Period
Minority Interest
Parent Company Share
Distribution of Total Comprehensive Income for the Period
Minority Interest
Parent Company Share
Earnings Per Share
CONTINUED OPERATIONS
927.892.557
(876.907.534)
50.985.023
(13.087.682)
(11.565.165)
394.908
(500.506)
26.226.578
-
24.972.071
(44.435.529)
6.763.120
(1.589.160)
(1.580.819)
(8.341)
5.173.960
-
-
5.173.960
-
5.173.960
107.131
5.066.829
107.131
5.066.829
0,0905
28
28
29
29
31
31
32
33
35
35
27
27
27
27
1.087.422.382
(1.023.117.198)
64.305.184
(11.173.103)
(12.767.710)
353.339
(948.369)
39.769.341
-
28.286.140
(45.663.848)
22.391.633
(4.747.543)
(4.681.623)
(65.920)
17.644.090
-
-
17.644.090
-
17.644.090
1.709.148
15.934.942
1.709.148
15.934.942
0,2846
Notes
AuditedCurrent Period
01.01.200931.12.2009
AuditedCurrent Period
01.01.200831.12.2008
ANNUAL REPORT 2009 ANNUAL REPORT 2009
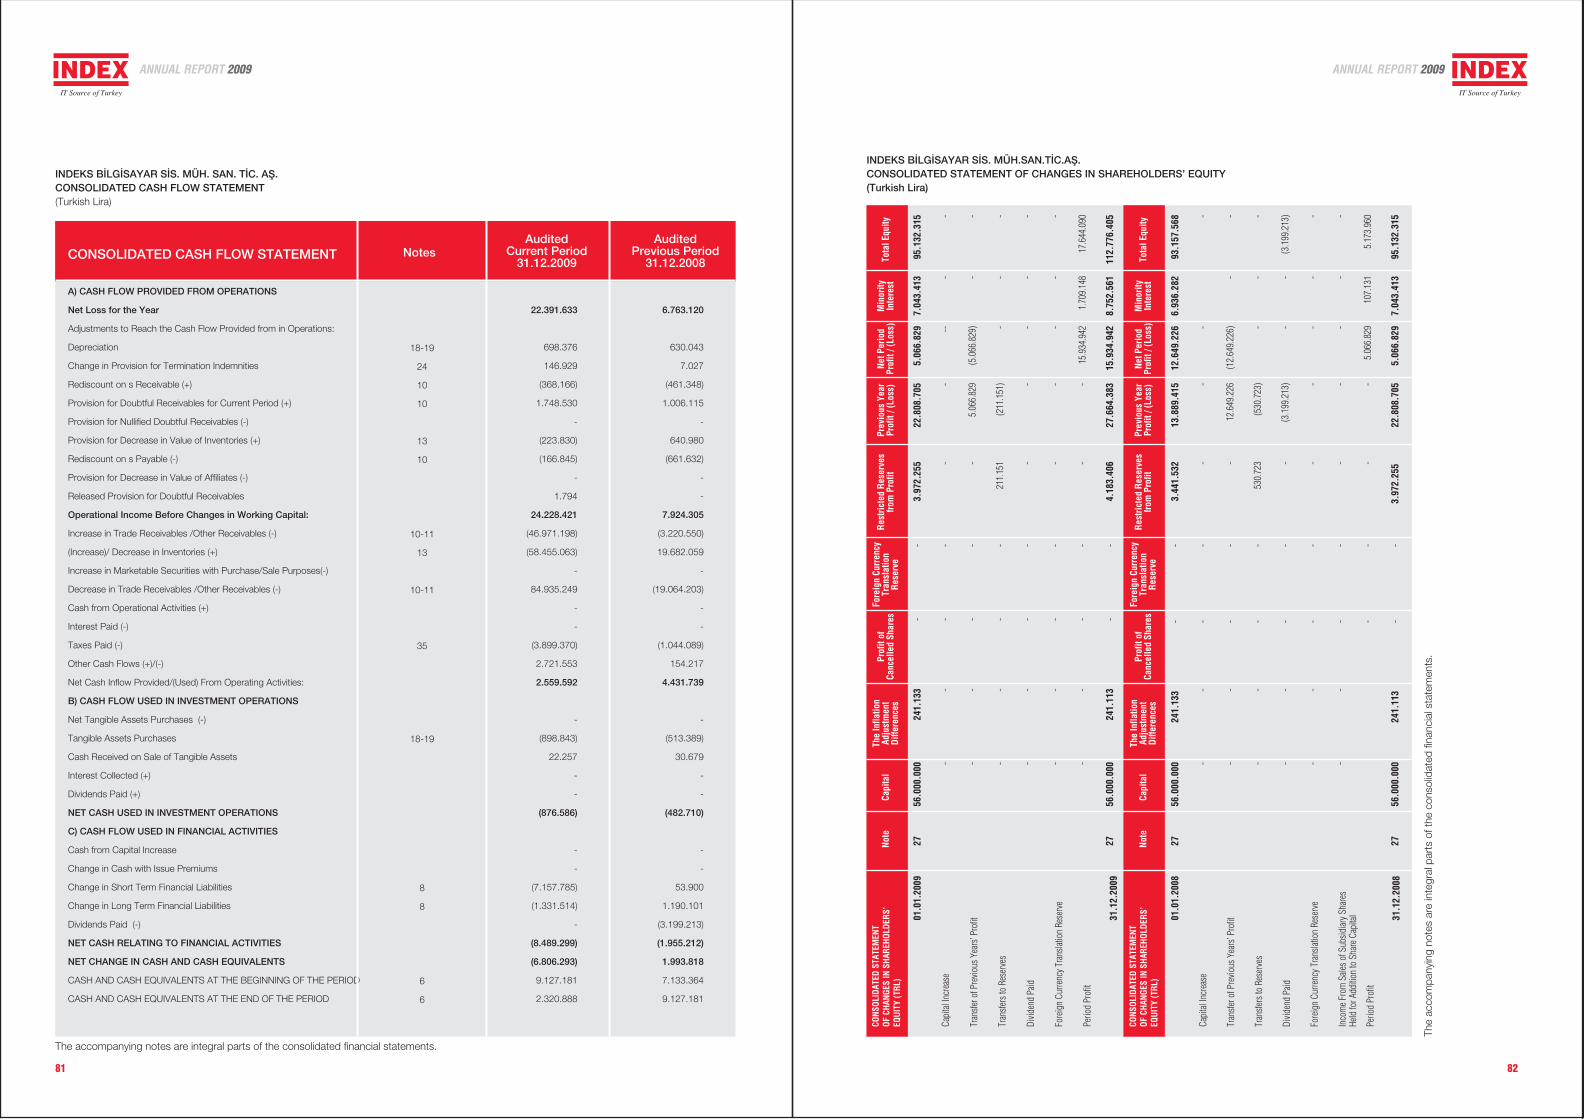
81 82
A) CASH FLOW PROVIDED FROM OPERATIONS
Net Loss for the Year
Adjustments to Reach the Cash Flow Provided from in Operations:
Depreciation
Change in Provision for Termination Indemnities
Rediscount on s Receivable (+)
Provision for Doubtful Receivables for Current Period (+)
Provision for Nullified Doubtful Receivables (-)
Provision for Decrease in Value of Inventories (+)
Rediscount on s Payable (-)
Provision for Decrease in Value of Affiliates (-)
Released Provision for Doubtful Receivables
Operational Income Before Changes in Working Capital:
Increase in Trade Receivables /Other Receivables (-)
(Increase)/ Decrease in Inventories (+)
Increase in Marketable Securities with Purchase/Sale Purposes(-)
Decrease in Trade Receivables /Other Receivables (-)
Cash from Operational Activities (+)
Interest Paid (-)
Taxes Paid (-)
Other Cash Flows (+)/(-)
Net Cash Inflow Provided/(Used) From Operating Activities:
B) CASH FLOW USED IN INVESTMENT OPERATIONS
Net Tangible Assets Purchases (-)
Tangible Assets Purchases
Cash Received on Sale of Tangible Assets
Interest Collected (+)
Dividends Paid (+)
NET CASH USED IN INVESTMENT OPERATIONS
C) CASH FLOW USED IN FINANCIAL ACTIVITIES
Cash from Capital Increase
Change in Cash with Issue Premiums
Change in Short Term Financial Liabilities
Change in Long Term Financial Liabilities
Dividends Paid (-)
NET CASH RELATING TO FINANCIAL ACTIVITIES
NET CHANGE IN CASH AND CASH EQUIVALENTS
CASH AND CASH EQUIVALENTS AT THE BEGINNING OF THE PERIOD
CASH AND CASH EQUIVALENTS AT THE END OF THE PERIOD
22.391.633
698.376
146.929
(368.166)
1.748.530
-
(223.830)
(166.845)
-
1.794
24.228.421
(46.971.198)
(58.455.063)
-
84.935.249
-
-
(3.899.370)
2.721.553
2.559.592
-
(898.843)
22.257
-
-
(876.586)
-
-
(7.157.785)
(1.331.514)
-
(8.489.299)
(6.806.293)
9.127.181
2.320.888
6.763.120
630.043
7.027
(461.348)
1.006.115
-
640.980
(661.632)
-
-
7.924.305
(3.220.550)
19.682.059
-
(19.064.203)
-
-
(1.044.089)
154.217
4.431.739
-
(513.389)
30.679
-
-
(482.710)
-
-
53.900
1.190.101
(3.199.213)
(1.955.212)
1.993.818
7.133.364
9.127.181
18-19
24
10
10
13
10
10-11
13
10-11
35
18-19
8
8
6
6
The accompanying notes are integral parts of the consolidated financial statements.
INDEKS B‹LG‹SAYAR S‹S. MÜH. SAN. T‹C. Afi.CONSOLIDATED CASH FLOW STATEMENT(Turkish Lira)
INDEKS B‹LG‹SAYAR S‹S. MÜH.SAN.T‹C.Afi.CONSOLIDATED STATEMENT OF CHANGES IN SHAREHOLDERS’ EQUITY(Turkish Lira)
CONSOLIDATED CASH FLOW STATEMENT NotesAudited
Current Period31.12.2009
AuditedPrevious Period
31.12.2008
Not
eCa
pita
lTh
e In
flatio
nAd
just
men
tD
iffer
ence
sPr
ofit
ofCa
ncel
led
Shar
esFo
reig
n Cu
rren
cyTr
ansl
atio
nR
eser
veR
estr
icte
d R
eser
ves
from
Pro
fitPr
evio
us Y
ear
Prof
it / (
Loss
)N
et P
erio
dPr
ofit
/ (Lo
ss)
Min
ority
Inte
rest
Tota
l Equ
ityCO
NSO
LID
ATED
STA
TEM
ENT
OF
CHAN
GES
IN S
HAR
EHO
LDER
S’EQ
UIT
Y (T
RL)
01.0
1.20
09
Capi
tal I
ncre
ase
Tran
sfer
of P
revi
ous
Year
s’ Pr
ofit
Tran
sfer
s to
Res
erve
s
Divi
dend
Pai
d
Fore
ign
Curre
ncy
Tran
slat
ion
Rese
rve
Perio
d Pr
ofit
31.1
2.20
09
01.0
1.20
08
Capi
tal I
ncre
ase
Tran
sfer
of P
revi
ous
Year
s’ Pr
ofit
Tran
sfer
s to
Res
erve
s
Divi
dend
Pai
d
Fore
ign
Curre
ncy
Tran
slat
ion
Rese
rve
Inco
me
From
Sal
es o
f Sub
sidi
ary
Shar
es
Perio
d Pr
ofit
31.1
2.20
08
27 27
56.0
00.0
00
- - - - - -
56.0
00.0
00
56.0
00.0
00
- - - - - -
56.0
00.0
00
241.
133 - - - - - -
241.
113
241.
133 - - - - - -
241.
113
- - - - - - - - - - - - - - - - -
3.44
1.53
2 - -
530.
723 - - - -
3.97
2.25
5
3.97
2.25
5 - -
211.
151 - - -
4.18
3.40
6
22.8
08.7
05
-
5.06
6.82
9
(211
.151
) - - -
27.6
64.3
83
13.8
89.4
15
-
12.6
49.2
26
(530
.723
)
(3.1
99.2
13) - - -
22.8
08.7
05
5.06
6.82
9 --
(5
.066
.829
) - - -
15.9
34.9
42
15.9
34.9
42
12.6
49.2
26
-
(12.
649.
226) - - - -
5.06
6.82
9
5.06
6.82
9
7.04
3.41
3 - - - - -
1.70
9.14
8
8.75
2.56
1
6.93
6.28
2 - - - - -
107.
131
7.04
3.41
3
95.1
32.3
15
- - - - -
17.6
44.0
90
112.
776.
405
93.1
57.5
68
- - -
(3.1
99.2
13) - -
5.17
3.96
0
95.1
32.3
15
- - - - - - - -
27 27
- - - - - - - - -
Held
for A
dditi
on to
Sha
re C
apita
l
CON
SOLI
DAT
ED S
TATE
MEN
TO
F CH
ANG
ES IN
SH
AREH
OLD
ERS’
EQU
ITY
(TR
L)N
ote
Capi
tal
The
Infla
tion
Adju
stm
ent
Diff
eren
ces
Prof
it of
Canc
elle
d Sh
ares
Fore
ign
Curr
ency
Tran
slat
ion
Res
erve
Res
tric
ted
Res
erve
sfr
om P
rofit
Prev
ious
Yea
rPr
ofit
/ (Lo
ss)
Net
Per
iod
Prof
it / (
Loss
)M
inor
ityIn
tere
stTo
tal E
quity
ANNUAL REPORT 2009 ANNUAL REPORT 2009
The
acco
mpa
nyin
g no
tes
are
inte
gral
par
ts o
f the
con
solid
ated
fina
ncia
l sta
tem
ents
.
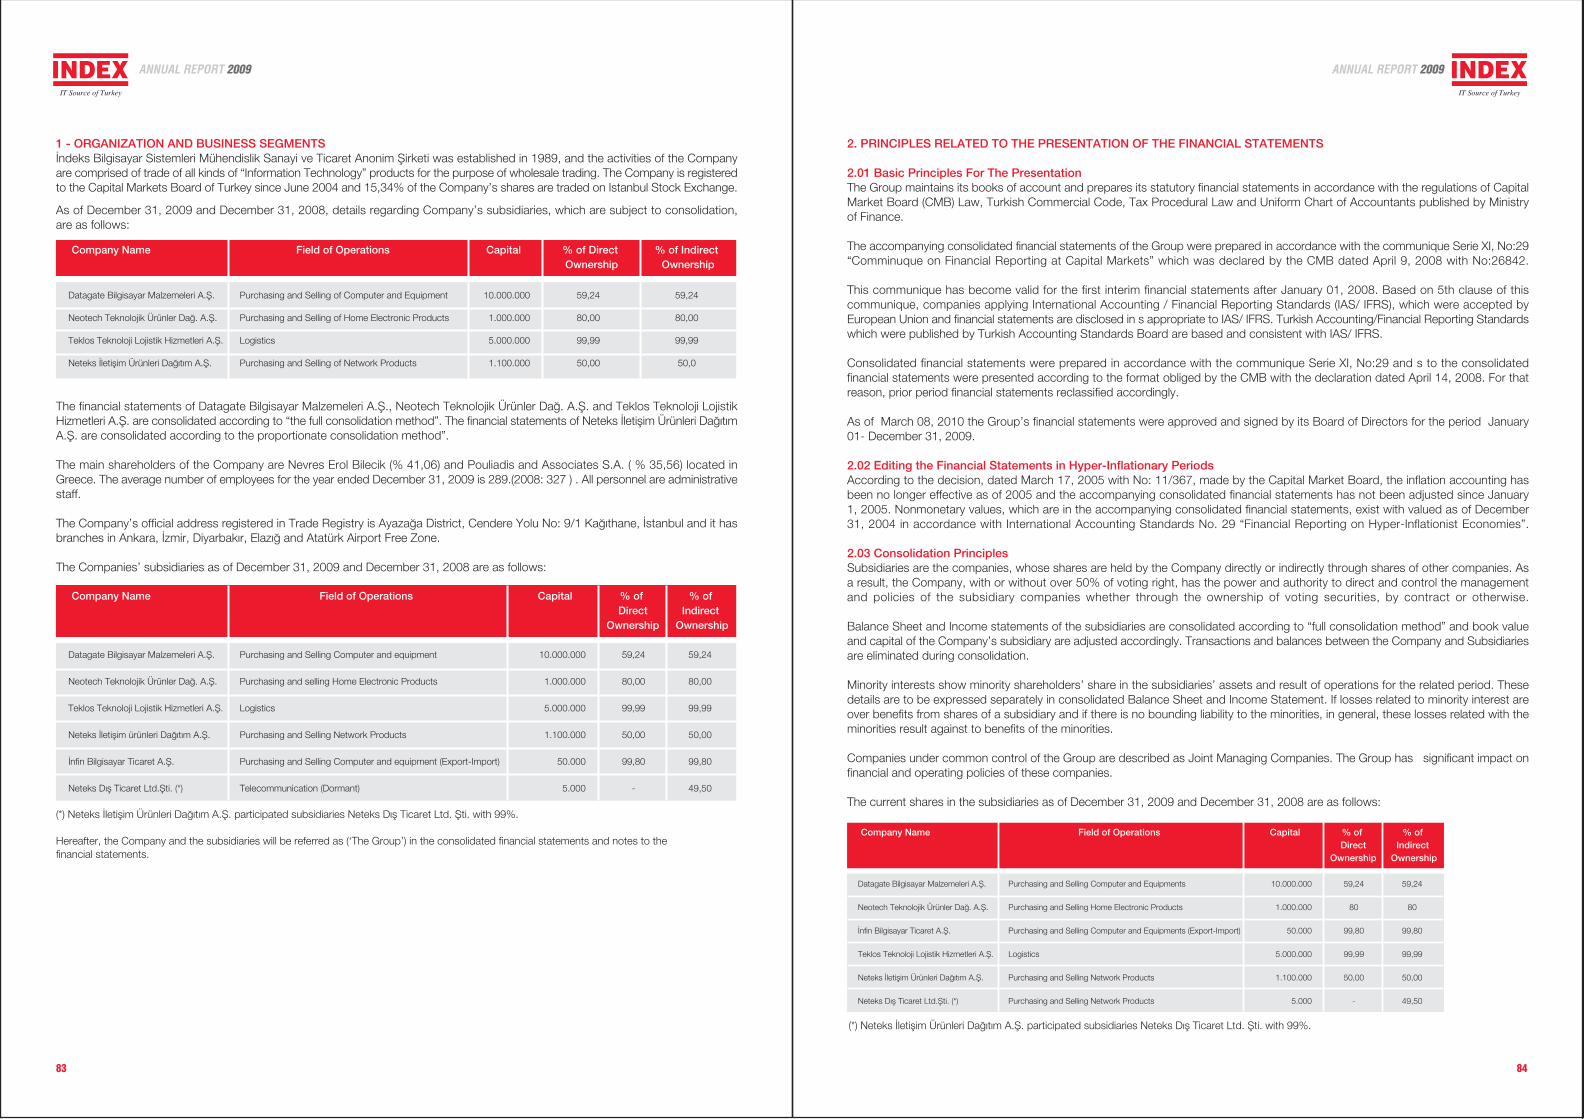
Company Name Field of Operations Capital % of Direct % of Indirect Ownership Ownership
83 84
1 - ORGANIZATION AND BUSINESS SEGMENTS‹ndeks Bilgisayar Sistemleri Mühendislik Sanayi ve Ticaret Anonim fiirketi was established in 1989, and the activities of the Companyare comprised of trade of all kinds of “Information Technology” products for the purpose of wholesale trading. The Company is registeredto the Capital Markets Board of Turkey since June 2004 and 15,34% of the Company’s shares are traded on Istanbul Stock Exchange.
As of December 31, 2009 and December 31, 2008, details regarding Company’s subsidiaries, which are subject to consolidation,are as follows:
Datagate Bilgisayar Malzemeleri A.fi. Purchasing and Selling of Computer and Equipment 10.000.000 59,24 59,24
Neotech Teknolojik Ürünler Da¤. A.fi. Purchasing and Selling of Home Electronic Products 1.000.000 80,00 80,00
Teklos Teknoloji Lojistik Hizmetleri A.fi. Logistics 5.000.000 99,99 99,99
Neteks ‹letiflim Ürünleri Da¤›t›m A.fi. Purchasing and Selling of Network Products 1.100.000 50,00 50,0
The financial statements of Datagate Bilgisayar Malzemeleri A.fi., Neotech Teknolojik Ürünler Da¤. A.fi. and Teklos Teknoloji LojistikHizmetleri A.fi. are consolidated according to “the full consolidation method”. The financial statements of Neteks ‹letiflim Ürünleri Da¤›t›mA.fi. are consolidated according to the proportionate consolidation method”.
The main shareholders of the Company are Nevres Erol Bilecik (% 41,06) and Pouliadis and Associates S.A. ( % 35,56) located inGreece. The average number of employees for the year ended December 31, 2009 is 289.(2008: 327 ) . All personnel are administrativestaff.
The Company’s official address registered in Trade Registry is Ayaza¤a District, Cendere Yolu No: 9/1 Ka¤›thane, ‹stanbul and it hasbranches in Ankara, ‹zmir, Diyarbak›r, Elaz›¤ and Atatürk Airport Free Zone.
The Companies’ subsidiaries as of December 31, 2009 and December 31, 2008 are as follows:
2. PRINCIPLES RELATED TO THE PRESENTATION OF THE FINANCIAL STATEMENTS
2.01 Basic Principles For The PresentationThe Group maintains its books of account and prepares its statutory financial statements in accordance with the regulations of CapitalMarket Board (CMB) Law, Turkish Commercial Code, Tax Procedural Law and Uniform Chart of Accountants published by Ministryof Finance.
The accompanying consolidated financial statements of the Group were prepared in accordance with the communique Serie XI, No:29“Comminuque on Financial Reporting at Capital Markets” which was declared by the CMB dated April 9, 2008 with No:26842.
This communique has become valid for the first interim financial statements after January 01, 2008. Based on 5th clause of thiscommunique, companies applying International Accounting / Financial Reporting Standards (IAS/ IFRS), which were accepted byEuropean Union and financial statements are disclosed in s appropriate to IAS/ IFRS. Turkish Accounting/Financial Reporting Standardswhich were published by Turkish Accounting Standards Board are based and consistent with IAS/ IFRS.
Consolidated financial statements were prepared in accordance with the communique Serie XI, No:29 and s to the consolidatedfinancial statements were presented according to the format obliged by the CMB with the declaration dated April 14, 2008. For thatreason, prior period financial statements reclassified accordingly.
As of March 08, 2010 the Group’s financial statements were approved and signed by its Board of Directors for the period January01- December 31, 2009.
2.02 Editing the Financial Statements in Hyper-Inflationary PeriodsAccording to the decision, dated March 17, 2005 with No: 11/367, made by the Capital Market Board, the inflation accounting hasbeen no longer effective as of 2005 and the accompanying consolidated financial statements has not been adjusted since January1, 2005. Nonmonetary values, which are in the accompanying consolidated financial statements, exist with valued as of December31, 2004 in accordance with International Accounting Standards No. 29 “Financial Reporting on Hyper-Inflationist Economies”.
2.03 Consolidation PrinciplesSubsidiaries are the companies, whose shares are held by the Company directly or indirectly through shares of other companies. Asa result, the Company, with or without over 50% of voting right, has the power and authority to direct and control the managementand policies of the subsidiary companies whether through the ownership of voting securities, by contract or otherwise.
Balance Sheet and Income statements of the subsidiaries are consolidated according to “full consolidation method” and book valueand capital of the Company’s subsidiary are adjusted accordingly. Transactions and balances between the Company and Subsidiariesare eliminated during consolidation.
Minority interests show minority shareholders’ share in the subsidiaries’ assets and result of operations for the related period. Thesedetails are to be expressed separately in consolidated Balance Sheet and Income Statement. If losses related to minority interest areover benefits from shares of a subsidiary and if there is no bounding liability to the minorities, in general, these losses related with theminorities result against to benefits of the minorities.
Companies under common control of the Group are described as Joint Managing Companies. The Group has significant impact onfinancial and operating policies of these companies.
The current shares in the subsidiaries as of December 31, 2009 and December 31, 2008 are as follows:(*) Neteks ‹letiflim Ürünleri Da¤›t›m A.fi. participated subsidiaries Neteks D›fl Ticaret Ltd. fiti. with 99%.
Hereafter, the Company and the subsidiaries will be referred as (‘The Group’) in the consolidated financial statements and notes to thefinancial statements.
Datagate Bilgisayar Malzemeleri A.fi. Purchasing and Selling Computer and equipment 10.000.000 59,24 59,24
Neotech Teknolojik Ürünler Da¤. A.fi. Purchasing and selling Home Electronic Products 1.000.000 80,00 80,00
Teklos Teknoloji Lojistik Hizmetleri A.fi. Logistics 5.000.000 99,99 99,99
Neteks ‹letiflim ürünleri Da¤›t›m A.fi. Purchasing and Selling Network Products 1.100.000 50,00 50,00
‹nfin Bilgisayar Ticaret A.fi. Purchasing and Selling Computer and equipment (Export-Import) 50.000 99,80 99,80
Neteks D›fl Ticaret Ltd.fiti. (*) Telecommunication (Dormant) 5.000 - 49,50
Company Name Field of Operations Capital % of % ofDirect Indirect
Ownership Ownership
(*) Neteks ‹letiflim Ürünleri Da¤›t›m A.fi. participated subsidiaries Neteks D›fl Ticaret Ltd. fiti. with 99%.
Datagate Bilgisayar Malzemeleri A.fi. Purchasing and Selling Computer and Equipments 10.000.000 59,24 59,24
Neotech Teknolojik Ürünler Da¤. A.fi. Purchasing and Selling Home Electronic Products 1.000.000 80 80
‹nfin Bilgisayar Ticaret A.fi. Purchasing and Selling Computer and Equipments (Export-Import) 50.000 99,80 99,80
Teklos Teknoloji Lojistik Hizmetleri A.fi. Logistics 5.000.000 99,99 99,99
Neteks ‹letiflim Ürünleri Da¤›t›m A.fi. Purchasing and Selling Network Products 1.100.000 50,00 50,00
Neteks D›fl Ticaret Ltd.fiti. (*) Purchasing and Selling Network Products 5.000 - 49,50
Company Name Field of Operations Capital % of % ofDirect Indirect
Ownership Ownership
ANNUAL REPORT 2009 ANNUAL REPORT 2009
85 86
2.08 Summary of Significant Accounting Policies
2.08.01 IncomeThe Group recognizes income according to the accrual basis, when the Group reasonably determines the income and economicbenefit is probable. Revenue is reduced for customer returns and sales discounts.
Revenue from the sale of goods is recognized when all the following conditions are gratified:
• The significant risks and the ownership of the goods are transferred to the buyer;• The Group refrains the managerial control over the goods and the effective control over the goods sold;• The revenue can be measured reasonably;• It is probable that the the economic benefits related to transaction will flow to the entitiy;• The costs incurred or will be incurred in conjuction with the transaction can be measured reliably.
Interest revenue is accured on a time basis, by reference to the principal outstanding and at the effective interest rate applicaple, whichis the rate that discounts the estimated future cash receipts through the expected life of the financial asset to that asset’s net carryingamount.
When there is significant amount of cost of financing included in the sales, the fair value is determined by discouting all probable futurecash flows with the yield rate, which is embedded in the cost of financing. The differences between the fair value and the nominal valueis recorded as interest income according to the accrual basis.
2.08.02 InventoriesInventories are stated either at the lower of acquisition cost or net realizable value. Group’s inventories consist of computer andcomputer equipments like PC, laptop, electrical household appliances, network products. The inventory costing method used by theGroup is “First in First out (FIFO)”. Net realizable value is the estimated selling price in the ordinary course of business less the estimatedcosts of completion and the estimated costs necessary to make the sale.
2.08.03 Tangible Fixed AssetsFor Assets acquired in and after 2005, the tangible assets are reflected to the consolidated financial statements by deducting theiraccumulated depreciation from their cost. For assets that were acquired before January 01, 2005, the tangible fixed assets is presentedon the consolidated financial statements based on their cost value, which is adjusted according to the inflationary effects as of December31, 2004. Depreciation is calculated using the straight-line method based on their economic lives. The following rates, determined inaccordance with the economic lives of the fixed assets, are used in calculation of depreciation.
The financial statements of Datagate Bilgisayar Malzemeleri A.fi., Neotech Teknolojik Ürünler Da¤. A.fi. and Teklos Teknoloji LojistikHizmetleri A.fi. are consolidated for using direct consolidation method, the financial statements of Neteks ‹letiflim Ürünleri Da¤›t›m A.fi.is consolidated by using partial consolidation method.
Balance Sheets and Income statements of the subsidiaries are consolidated according to “full consolidation method” and “partialconsolidation method”, and book value and capital of the Company’s subsidiaries are adjusted accordingly. Transactions and balancesbetween the Company and subsidiaries are eliminated during consolidation.
Minority interests show minority shareholders’ equity in the subsidiaries’ assets and result of operations for the related period. Thesedetails are expressed separately in consolidated balance sheet and Profit/Loss Statement. If losses related to minority interest are overbenefits from shares of a subsidiary and if there is no bounding liability to the minorities, in general, these losses related with theminorities can result against to benefits of the main shareholders.
The Associates in relation with the parent Company and the subsidiary in terms of capital, management and control but excluded fromthe consolidation scope are shown below.
(*) Neteks ‹letiflim Ürünleri Da¤›t›m A.fi. participated subsidiaries Neteks D›fl Ticaret Ltd. fiti. with 99%.
Associate % of Ownership TRL Amount of Ownership
‹nfin Bilgisayar Ticaret A.fi.
Neteks D›fl Ticaret Ltd. fiti.(*)
99,80
49,50
62.419
2.475
Total Subsidiary Amount 64.894
‹nfin Bilgisayar Ticaret A.fi. and Neteks D›fl Ticaret Limited fiirketi were not consolidated to the fact that they are both insignificant anddo not have material effect on the Group’s consolidated financial statements.
These subsidiaries are classified as financial assets available for sale in consolidated financial statements.
2.04 Comparative Information and Adjustment of the Previous Consolidated Financial StatementsThe changes in classification of the consolidated financial statements of the current period are also applied to the prior period, ifnecessary.
There were some classifications made on the comparative balance sheet for the year ended December 31, 2008 which did have anyeffect on the period profit and total shareholders’ equity.
The item of prepaid taxes and funds, which is shown within other current assets on the Group’s balance sheet dated 31.12.2008, isshown within current period tax liability.
2.05 OffsettingThe financial assets and liabilities in the consolidated financial statements are shown at their net value when a legal granted permission,an intention of stating the consolidated financial statements with their net values and the financial asset and liabilities are arisenconcurrently.
2.06 Changes in Accounting PoliciesThe changes to the current accounting policies can be performed if it is necessary or the changes will provide more appropriate andreliable presentation of the transactions and events related to the financial position, performance and the cash flow of the Group thataffect the financial statements of the Group. If the changes in accounting policies affects the prior periods, policy is applied to the priorperiod financial statements as if it is applied before.
2.07 Changes in Accounting Estimates and ErrorsThe Group evaluates and presents circumstances and other similar operations and transactions, consistently on the financial statements.Significant changes in accounting policies and significant errors are applied backwards and prior financial statements are adjusted. Ifchanges in accounting forecasts are related to only one period, amendments are made in the current period. If amendments are relatedto the forthcoming periods, changes are applied in both current period and forthcoming periods.
Expenditures on a qualifying asset include only those expenditures that have resulted in payments of cash, transfers of other assetsor the assumption of interest-bearing liabilities. There are no capitalized borrowing costs in current period related to qualifying assets.
Land Improvements 10 10
Buildings 2 2
Machinery, Plant and Equipment 20-10 20-10
Motor Vehicles 20-10 20-10
Furniture and Fixtures 20-10 20-10
Leasehold Improvements 20-10 20-10
TYPE OF FIXED ASSET Depreciation rates as of Depreciation rates as of
December 31, 2009 (%) December 31, 2008 (%)
Lands are not subject to depreciation since they have unlimited useful lives.If the carrying value of a tangible fixed asset is more than its expected net realizable value then the carrying value is reduced to itsnet realizable value by making the necessary provision.
The profit and loss arisen from fixed asset sales are determined by comparing the net book value with the sales price and the resultis added to the operating profit or loss.
Maintenance and repair expenses are accounted as expense at their realization date. If the maintenance and repair expenses clearlyimprove the economic value or performance of the related asset then they are capitalized.
ANNUAL REPORT 2009 ANNUAL REPORT 2009
87 88
c) Financial Assets Available-For-SaleFinancial assets, which are “Available-for-Sale” are either (a) financial assets, which will not be held to maturity or (b) financial assets,which are not held for trading purposes. Financial assets Available-for-Sale are recorded with their fair value if their fair value can bedetermined reliably. Marketable securities are shown at their cost basis unless their fair value can be reliably measured or have anactive trading market. Profit or loss pertaining to the financial assets Available-for-Sale is not recorded on the income statement. Thefluctuation in the fair value of these assets are shown in the statement of shareholders’ equity. Where the investment is disposed ofor is determined to be impaired, the cumulative gain or loss previously recognized is includeded in profit or loss for the period.Provisions recorded in the income statement pertaining to the impairment of financial asset Available-for-Sale can not be reversedfrom the income statement in future periods.
Except equity instruments classified as available-for-sale, if impairment loss decreases in next period and if therein decreasing canbe related to an event occurred after the accounting of impairment loss, impairment loss accounted before, can be cancelled in incomestatement.
d) Loans and ReceivablesTrade receivables, other receivables, and loans are initially recognized at their fair value. Subsequeny, receivables and loans aremeasured at amortized cost using the effective interest method. In the case of interest on loans and receivables negligible, registeredvalue of loan and receivables is accepted as fair value.
Impairment of financial assetsFinancial assets, other than those at fair value through profit or loss, are assessed for indication of impairment at each balance sheetdate. Financial assets are impaired, where there is objective evidence that, as a result of one or more events that occurred after theinitial recognition of the financial asset, the estimated future cash flows of the investment have been impacted. For financial assetscarried at amortized cost, the amount of the impairment is the difference between the asset’s carrying amount and the present valueof estimated future cash flows, discounted at the original effective interest rate.
The carrying amount of the financial asset is reduced with the impairment loss directly for all financial assets with the exception of tradereceivables, where the carrying amount is reduced through the use of an allowance account. When a trade receivable is uncollectible,it is written off against the allowance account. Subsequent recoveries of amounts previously written off are reversed against theallowance account. Changes in the carrying amount of the allowance account are recognized in profit or loss.
With the exception of available for sale equity instruments, if, in a subsequent period, the amount of the impairment loss decreasesand the decrease can be related objectively to an event occurring after the impairment was recognized, the previously recognizedimpairment loss is reversed through profit or loss to the extent that the carrying amount of the investment at the date the impairmentis reversed does not exceed what the amortized cost would have been had the impairment not been recognized.
With respect to available-for-sale equity securities, any increase in fair value subsequent to an impairment loss is recognized directlyin equity.
Cash and Cash EquivalentsCash and cash equivalents are cash, demand deposit and other short-term highly liquid investments, which their maturities are threemonths or less from the date as of acquisition, that are readily convertible to a known amount of cash and are subject to an insignificantrisk of changes in value.
(ii) Financial LiabilitiesFinancial liabilities and equity instruments are classified based on arrangements according to the agreement, and definition of financialliability and equity instrument. Agreement which embodies right of assets after deducting all the liabilities, is a financial instrument basedon equity. Accounting policies for the financial liabilities and the financial instruments based on equity are determined below.
Financial liabilities are classified as financial liabilities whose fair value differences are reflected to the profit /(loss) or other financialliabilities.
a) Financial Liabilities Whose Fair Value Differences Are Reflected to the Profit /(Loss)“Financial liabilities whose fair value differences are reflected to the profit /loss” are recorded at fair value and are re-evaluated at theend of each balance sheet date. Changes in fair value are recognized in the income statement. Recognized net earnings and/or lossesin the income statement also include interest payments made for this financial liability.
b) Other Financial LiabilitiesOther financial liabilities are initially measured at fair value, net of transaction costs.
Other financial liabilities are subsequently measured at amortized cost using the effective interest method, with interest expenserecognized on an effective yield basis.
2.08.04 Intangible AssetsIntangible assets acquired before January 01, 2005 are carried at acquisition costs adjusted for inflation; whereas those purchasedin the year 2005 and purchased after 2005 are carried forward at their acquisition cost less accumulated amortization.
Intangible fixed assets comprise of software rights and research & development expenses.
Amortization is calculated using the straight-line method between 5 and 10 years period.
2.08.05 Impairment of AssetsThe carrying value of non-current assets including, tangible and intangible fixed assets, are reviewed for impairment, when events orchanges in circumstances indicate that the carrying value may not be recoverable. If the recoverable amount of an asset is below itscarrying amount, impairment loss is recognized by making the necessary provision.
2.08.06 Research and Development ExpensesNone.
2.08.07 Borrowings CostsThe borrowing costs are recognized as expense when they are incurred. Borrowing costs that are directly attributable to the acquisition,construction or production of a qualifying asset shall be capitalized as part of the cost of that asset. The capitalization of borrowingcosts as part of the cost of a qualifying asset shall commence, when expenditures and borrowing costs for the asset are incurred,continues until that asset becomes available for sale. Expenditures on a qualifying asset include only those expenditures that haveresulted in payments of cash, transfers of other assets or the assumption of interest-bearing liabilities. There are no capitalized borrowingcosts in current period related to qualifying assets.
2.08.08 Financial Instruments
(i) Financial AssetsInvestments are recognized and derecognized on trade date where the purchase of sales of an investment is under a contract, whoseterms require delivery of the investment within the timeframe establ›shed by the market concerned and are initially measured at fairvalue, net of transaction costs except for those financial assets aclassified as fair value through profit or loss which are initially measuredat fair value.
Other financial assets are classified as “financial assets, whose fair value differences are reflected to the profit or loss”, “financial assetsheld to the maturity”, “financial assets available for-sale” and “loans and receivables.
Prevailing Interest MethodPrevailing interest method is the valuation of financial asset with their amortized cost and allocation of interest income to the relevantperiod. Prevailing interest rate is that discounts the estimated cash flow for the expected life of financial instrument or where appropriatea shorter period.
Income related to financial assets, except the “financial assets, whose fair value differences are reflected to the profit or loss”, iscalculated by using the prevailing interest rate.
a) Financial Assets Whose Fair Value Differences Are Reflected to the Profit or Loss“Financial assets whose fair value differences are reflected to the profit or loss”, are the financial assets that are held for trading purposes.If a financial asset is acquired for trading purposes, it is classified in this category. Also, derivative instruments, which are not exemptfrom financial risk, are also classified as “Financial assets whose fair value differences are reflected to the profit or loss”. These financialassets are classified as current assets.
b) Financial Assets Which Will Be Held to the MaturityDebt instruments, which the Group has the intention and capablity to hold to maturity, and/or have fixed or determinable paymentarrangement are classified as “Investments Held to the Maturity”. Financial asset that will be held to the maturity, are recorded afterdeducting the impairment from the cost basis, which has been amortized with prevailing interest method. All relevant income is calculatedusing the prevailing interest method.
ANNUAL REPORT 2009 ANNUAL REPORT 2009
89 90
The prevailing interest method is a method of calculating the amortized cost of a financial liability and of allocating interest expenseover the relevant period. The prevailing interest rate is the rate that exactly discounts estimated future cash payments through theexpected life of the financial liability, or, where appropriate, a shorter period.
(iii) Derivative Financial InstrumentsDerivative financial instruments are initially recognized at fair value and measured at fair value in following periods. The Group occasionallyuses derivative instruments to minimize its risks from liabilities denominated in foreign currency.
2.08.09 Effects of Currency FluctuationsAll transactions, denominated in foreign currencies, are converted into TRL by the exchange rate ruling at the transaction date. Allforeign currency denominated monetary assets and liabilities stated at the balance sheet are converted into TRL by the exchange rateruling at the balance sheet date. Foreign exchange gains and/or losses as a result of the conversions are recorded in the incomestatement.
2.08.10 Earnings per ShareEarnings per share in the income statement is calculated by dividing net income by the weighted average number of common sharesoutstanding for the period.
In Turkey, companies are allowed to increase their share capital by distributing “bonus shares” from retained earnings. These bonusshares are deemed as issued shares while calculating the net earnings per share. Accordingly, the retrospective effect for those sharedistributions is taken into consideration in determining the weighted-average number of shares outstanding used in this computation.
2.08.11 Events after the Balance Sheet DateAn explanation for any event between the balance sheet date and the publication date of the balance sheet,which has positive ornegative effects on the Group (should any evidence come about events that were prior to the balance sheet date or should new eventscome about) they will be explained in the relevant footnote.If such an event were to arise, the Group restates its financial statementsaccordingly.
2.08.12 Provisions, Contingent Liabilities and AssetsA provision is recognized when an entity has a present obligation (legal or constructive) as a result of a past event; it is probable thatan outflow of resources embodying economic benefits will be required to settle the obligation; and reliable estimate can be made ofthe amount of the obligation Where the effect of the time value of money is material, the amount of a provision is the present value ofthe expenditures expected to be required to settle the obligation. The discount rate (or rates) is a pre-tax rate (or rates) that reflect(s)current market assessments of the time value of money and the risks specific to the liability. The increase in provisions arisen fromtime differences is recorded as interest expense in case of discounting. Future events that may affect the amount required to settlean obligation shall be reflected in the amount of a provision where there is sufficient objective evidence that they will occur. The amountrecognized as a provision is the best estimate of the consideration required to settle the present obligation at the balance sheet date,taking into account the risks and uncertainties surrounding the obligation.
Contingent liabilities and assets are not reflected to consolidated financial statements but disclosed in the notes to the consolidatedfinancial statements. The entity recognizes a provision for the part of the obligation, for which an outflow of resources embodyingeconomic benefits is probable, except in the extremely rare circumstances where no reliable estimate can be made.
2.08.13 Leases
The Group as Lessee
Finance LeasesWhen fixed assets are obtained with financial leasing and the possession of these fixed assets are transferred to the Group togetherwith all significant risks and benefit at the end of the lease term, these assets are recorded with the lesser of current value as of lease-commencement date and present value of the minimum lease payments as of balance sheet date.
The liability arising from a financial leasing transaction is separated into interest payable and principal debt in order to determine a fixedinterest rate on the remaining balance. The costs and expenses incurred at the initial acquisition of the fixed asset subject to financialleasing are added to the cost. The fixed assets obtained through financial leasing are subject to depreciation over their estimated usefullives.
Operating LeasesLease agreements in which the lessor retains all the risks and benefits relating to the good are described as operational leasing. Leasepayments made for an operational leasing are recorded as expense according to normal method throughout the lease term.
The Group as Lessor
Operating LeasesThe Group presents assets subject to operating leases in their balance sheet according to the nature of the asset. Lease income fromoperating leases is recognized as income according to the normal method. The initial direct costs incurred during operational leasingare reflected to income statement as expense.
2.08.14 Related Party DisclosuresThe shareholders’ of the Group, its directors and other companies directly or indirectly controlled by the Group are considered relatedparties. The transactions with related parties are disclosed in the s to the consolidated financial statements.
2.08.15 Government Grants and AssistanceNone.
2.08.16 Investment PropertyNone.
2.08.17 Taxation and Deferred TaxIncome tax expense represents the sum of the tax currently payable and deferred tax.
Current taxThe tax currently payable is based on taxable profit for the year. Taxable profit differs from profit as reported in the income statementbecause it excludes items of income or expense that are taxable or deductible in other years and it further excludes items that arenever taxable or deductible. The Group’s liability for current tax is calculated using tax rates that have been enacted or substantivelyenacted by the balance sheet date.
Deferred taxDeferred tax is recognized on differences between the carrying amounts of assets and liabilities in the financial statements and thecorresponding tax bases which is used in the computation of taxable profit, and is accounted for using the balance sheet liabilitymethod. Deferred tax liabilities are generally recognized for all taxable temporary differences and deferred tax assets are recognizedfor all deductible temporary differences to the extent that it is probable that taxable profits will be available against whichthose deductibletemporary differences can be utilized. Such assets and liabilities are not recognized if the temporary difference arises from goodwillor from the initial recognition (other than in a business combination) of other assets and liabilities in a transaction that affects neitherthe taxable profit nor the accounting profit.
Deferred tax liabilities are recognized for taxable temporary differences associated with investments in subsidiaries and associates,and interests in joint ventures, except where the Group is able to control the reversal of the temporary difference and it is probablethat the temporary difference will not reverse in the foreseeable future. Deferred tax assets arising from deductible temporary differencesassociated with such investments and interests are only recognized to the extent that it is probable that there will be sufficient taxableprofits against which to utilize the benefits of the temporary differences and they are expected to reverse in the foreseeable future.
The carrying amount of deferred tax assets is reviewed at each balance sheet date and reduced to the extent that it is no longerprobable that sufficient taxable profits will be available to allow all or part of the asset to be recovered.
Deferred tax assets and liabilities are measured at the tax rates that are expected to apply in the period in which the liability is settledor the asset realized, based on tax rates (and tax laws) that have been enacted or substantively enacted by the balance sheet date.The measurement of deferred tax liabilities and assets reflects the tax consequences that would follow from the manner in which theGroup expects, at the reporting date, to recover or settled the carrying amount of its assets and liabilities.
Deferred tax assets and liabilities are offset when there is a legally enforceable right to set off current tax assets against current taxliabilities and when they relate to income taxes levied by the same taxation authority and the Group intends to settled its current taxassets and liabilities on a net basis.
ANNUAL REPORT 2009 ANNUAL REPORT 2009
91 92
Current and deferred tax for the periodCurrent and deferred tax are recognized as an expense or income to the income statement, except when they relate to items creditedor debited directly to equity, in which case the tax is also recognized directly in the equity, or where they arise from the initial accountingfor a business combination.
In the case of a business combination, the tax effect is taken into account in calculating goodwill or determining the excess of theacquirer’s interest in the net fair value of the acquirer’s identifiable assets, liabilities and contingent liabilities over cost.
Taxes stated in financial statements contain changes in current and deferred taxes for the period. The Group calculates current periodtax and deferred tax over the period results.
Offsetting Tax Income and LiabilitiesCorporate tax amounts are offset with prepaid corporate tax as they are related. Deferred tax assets and liabilities are also offset.
2.08.18 Retirement Pay / Termination IndemnityAccording to Turkish Labor Law, employee termination benefit is reflected in the financial statements, when the termination indemnitiesare deserved. Such payments are considered as being part of defined retirement benefit plan as per IAS No.19 “Employee Benefits”.
The retirement benefit obligation recognized in the financial statements represents the present value of the defined benefit obligationas adjusted for unrecognized gains and losses.
2.08.19 Statement of Cash FlowCash and cash equivalents are stated at their fair values in the balance sheet. The cash and cash equivalents comprises cash in hand,bank deposits and highly liquid investments. On cash flow statement, the Group classifies period’s cash flows as investment andfinancing activities.
Cash inflow provided from operating activities denotes cash inflow provided from main activities of the Group. Cash flow concernedwith investment activities shows cash used and provided from investment activities (asset investments and financial investments).
Cash flow concerned with investment activities represents sources used from financial activities and pay-back of these funds.
2.09 New and Revised International Financial Reporting Standards
a) Amendments and interpretations that have become effective in 2009 and their effects on Group’s financial statementsare as follows:
�• IAS 1, “Presentation of Financial Statements”
‘Presentation of Financial Statements’ (2007) introduces as a financial statement ‘the statement of comprehensive income’ whichrepresents changes in equity during a period other than those changes resulting from transactions with owners in their capacity asowners. Total comprehensive income may be presented in either a single statement of comprehensive income or in an income statementand a separate statement of comprehensive income.�
• IFRS 7 “Financial Instruments”
Additional disclosures related to the methods used for the determination of Fair Value and Liquidity Risk. The necessary disclosurein accordance with IFRS 7 is made in Note 38 and these changes do not have impact on period profit/loss.
b)Become effective in 2009 and have no impact on Group’s financial statements and disclosures:
• IFRS 1 (Amendment), “First time adoption of IFRS”• IFRS 2 (Amendment), “Share-based payment”• IAS 27 (Revised), “Consolidated and Separate Financial Statements”• IAS 28, “Investments in Associates”• IAS 31 (Amendment), ‘Interests in joint ventures”• IAS 39, “Financial Instruments: Recognit ion and Measurement” – Amended for El igible Hedged Items• IFRIC 15, “Agreements for the Construction of Real Estate”• IFRIC 16, “Hedges of a Net Investment in a Foreign Operation”• IAS 23, ‘(Revised) Borrowing Costs’.• IFRS 8 “Operating Segments”
IFRS / IAS
IAS 24 (Revised)“Related-Party Disclosures”
IAS 27 (Revised)“Consolidated and Separate FinancialStatements”
IFRS 1 (Amendment)“First Time Adoption of IFRS”
IFRS 2 (Amendment)“Share-based Payment”
IFRS3 (Amendment)“Business Combinations”
IFRS 5 (Amendment)“Non-current assets held-for-sale anddiscontinued operations”
IFRS 9“Financial Instruments”
Adoption Date
The amendment is effective for financial periodbeginning on and after 1 January 2011.
The amendment is effective for financial periodbeginning after 1 July 2009.
The amendment is effective for financial periodbeginning on and after 1 January 2010.
The amendment is effective for financial periodbeginning on and after 1 January 2010.
The amendment is effective for financial periodafter 1 July 2009
The amendment is effective for financial periodafter 1 January 2009.
The amendment is effective for financial periodbeginning on and after 1 January 2013
Description
Revision on the related party disclosures relatedto entities with significant state ownership.
Accounting for changes in ownership interest ina subsidiary or how to account these transactions.
Election of exemption from retrospectiveapplication of IFRS for oil and gas assets andleasing contracts.
Disclosures related to share-based payments.
Measurement of contingent considerations,assessment of goodwill and accounting of actualcost.
The disclosure for non-current assets andpresentation of discontinued operations.
New requirements for classifying and measuringfinancial assets.
Management of the Group has the opinion that the implementations of the standards stated above does not have an important effectof the Group’s financial statements at subsequent periods. Therefore, it has not reported the financial information according to segments.However, some information are provided regarding production and sales demand in the 24. footnote.
3 - BUSINESS COMBINATIONSNone.
4 - BUSINESS ASSOCIATIONSNone.
5 – REPORTING FINANCIAL INFORMATION BY SEGMENTSThe Group has no operation in context of business combinations.
c) The following standards have not become effective as of December 31, 2009 and the Group chose not to adopt early.
ANNUAL REPORT 2009 ANNUAL REPORT 2009
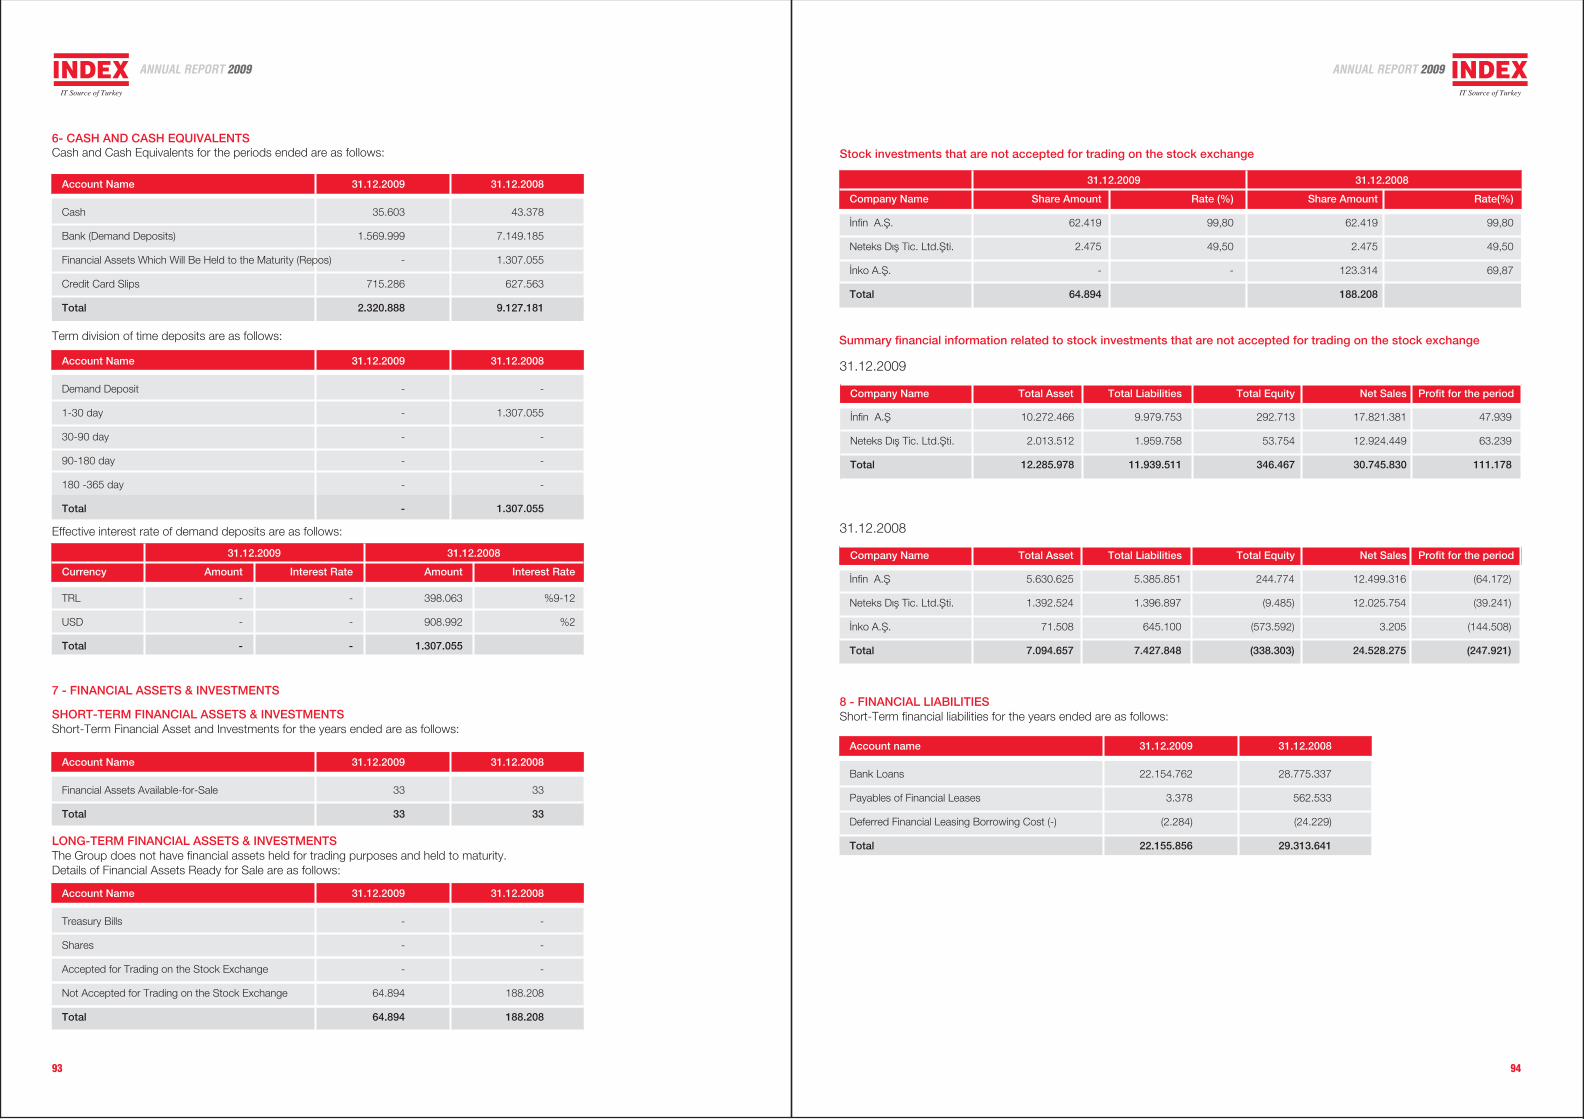
93 94
Stock investments that are not accepted for trading on the stock exchange
31.12.2009 31.12.2008
Company Name Share Amount Rate (%) Share Amount Rate(%)
‹nfin A.fi. 62.419 99,80 62.419 99,80
Neteks D›fl Tic. Ltd.fiti. 2.475 49,50 2.475 49,50
‹nko A.fi. - - 123.314 69,87
Total 64.894 188.208
Summary financial information related to stock investments that are not accepted for trading on the stock exchange
‹nfin A.fi 10.272.466 9.979.753 292.713 17.821.381 47.939
Neteks D›fl Tic. Ltd.fiti. 2.013.512 1.959.758 53.754 12.924.449 63.239
Total 12.285.978 11.939.511 346.467 30.745.830 111.178
31.12.2009
‹nfin A.fi 5.630.625 5.385.851 244.774 12.499.316 (64.172)
Neteks D›fl Tic. Ltd.fiti. 1.392.524 1.396.897 (9.485) 12.025.754 (39.241)
‹nko A.fi. 71.508 645.100 (573.592) 3.205 (144.508)
Total 7.094.657 7.427.848 (338.303) 24.528.275 (247.921)
31.12.2008
6- CASH AND CASH EQUIVALENTSCash and Cash Equivalents for the periods ended are as follows:
Account Name 31.12.2009 31.12.2008
Cash 35.603 43.378
Bank (Demand Deposits) 1.569.999 7.149.185
Financial Assets Which Will Be Held to the Maturity (Repos) - 1.307.055
Credit Card Slips 715.286 627.563
Total 2.320.888 9.127.181
Term division of time deposits are as follows:
Account Name 31.12.2009 31.12.2008
Demand Deposit - -
1-30 day - 1.307.055
30-90 day - -
90-180 day - -
180 -365 day - -
Total - 1.307.055
Effective interest rate of demand deposits are as follows:
31.12.2009 31.12.2008
Currency Amount Interest Rate Amount Interest Rate
TRL - - 398.063 %9-12
USD - - 908.992 %2
Total - - 1.307.055
7 - FINANCIAL ASSETS & INVESTMENTS
SHORT-TERM FINANCIAL ASSETS & INVESTMENTSShort-Term Financial Asset and Investments for the years ended are as follows:
Account Name 31.12.2009 31.12.2008
Financial Assets Available-for-Sale 33 33
Total 33 33
LONG-TERM FINANCIAL ASSETS & INVESTMENTSThe Group does not have financial assets held for trading purposes and held to maturity.Details of Financial Assets Ready for Sale are as follows:
Account Name 31.12.2009 31.12.2008
Treasury Bills - -
Shares - -
Accepted for Trading on the Stock Exchange - -
Not Accepted for Trading on the Stock Exchange 64.894 188.208
Total 64.894 188.208
8 - FINANCIAL LIABILITIESShort-Term financial liabilities for the years ended are as follows:
Account name 31.12.2009 31.12.2008
Bank Loans 22.154.762 28.775.337
Payables of Financial Leases 3.378 562.533
Deferred Financial Leasing Borrowing Cost (-) (2.284) (24.229)
Total 22.155.856 29.313.641
Company Name Total Asset Total Liabilities Total Equity Net Sales Profit for the period
Company Name Total Asset Total Liabilities Total Equity Net Sales Profit for the period
ANNUAL REPORT 2009 ANNUAL REPORT 2009
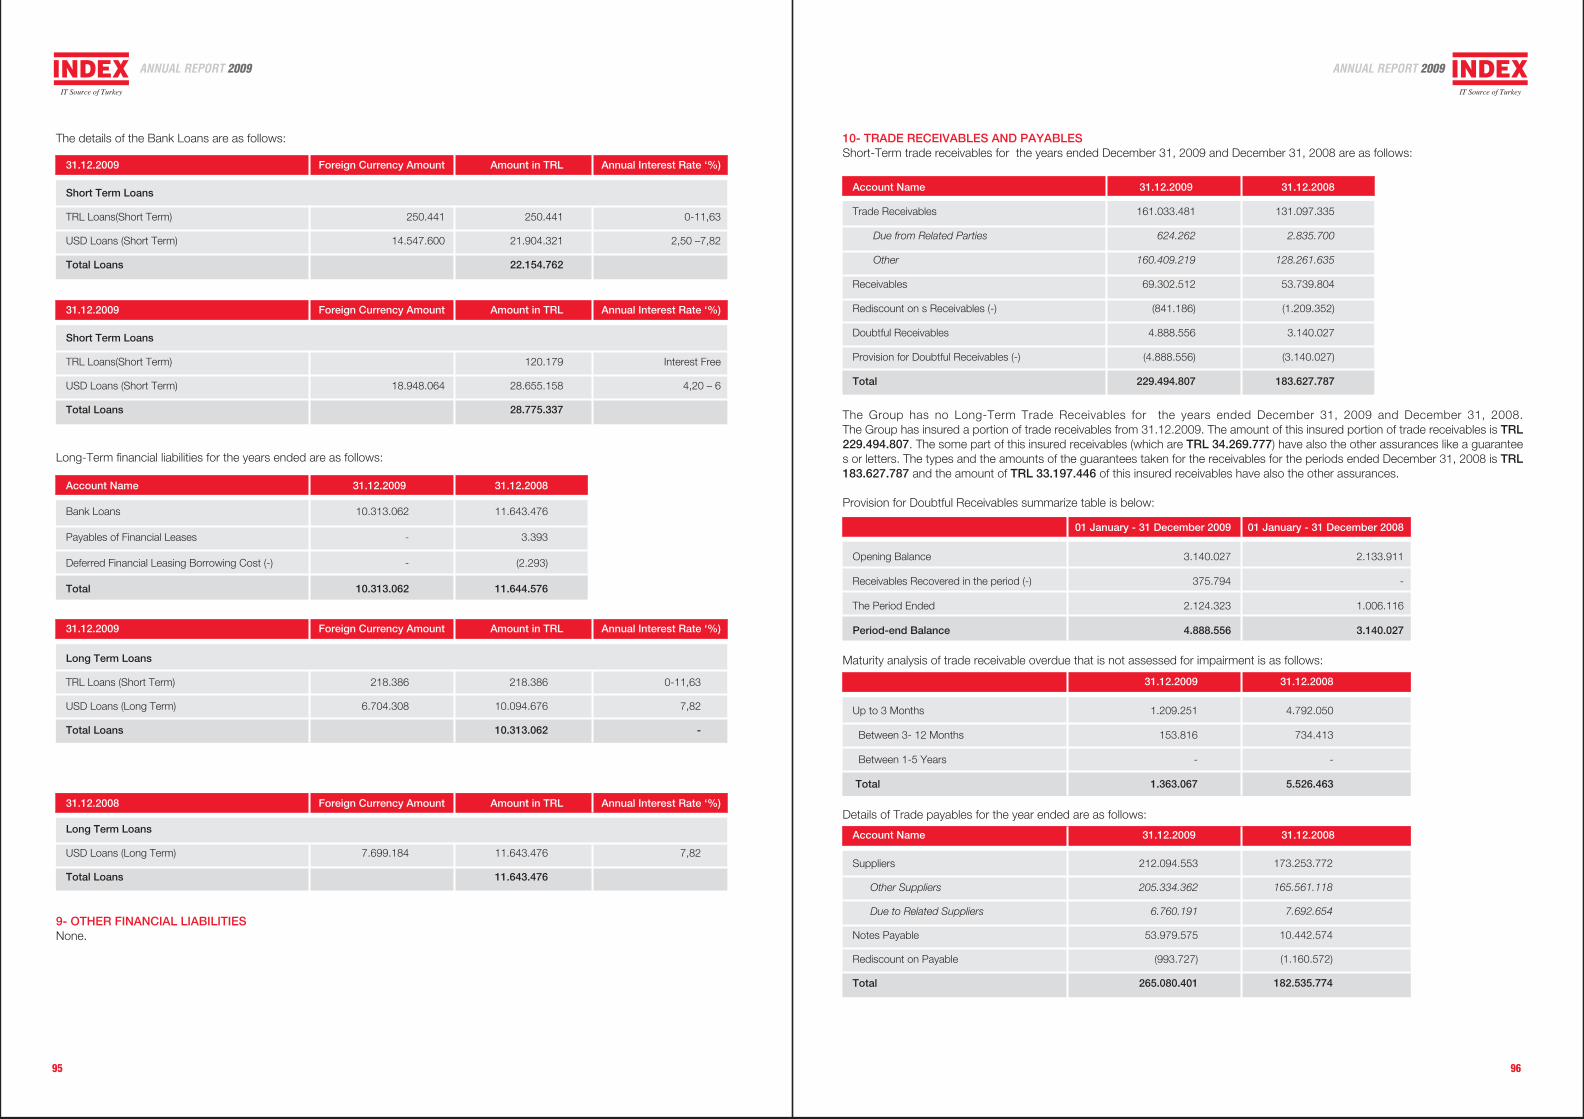
95 96
The Group has no Long-Term Trade Receivables for the years ended December 31, 2009 and December 31, 2008.The Group has insured a portion of trade receivables from 31.12.2009. The amount of this insured portion of trade receivables is TRL229.494.807. The some part of this insured receivables (which are TRL 34.269.777) have also the other assurances like a guarantees or letters. The types and the amounts of the guarantees taken for the receivables for the periods ended December 31, 2008 is TRL183.627.787 and the amount of TRL 33.197.446 of this insured receivables have also the other assurances.
Provision for Doubtful Receivables summarize table is below:
10- TRADE RECEIVABLES AND PAYABLESShort-Term trade receivables for the years ended December 31, 2009 and December 31, 2008 are as follows:
Account Name 31.12.2009 31.12.2008
Trade Receivables 161.033.481 131.097.335
Due from Related Parties 624.262 2.835.700
Other 160.409.219 128.261.635
Receivables 69.302.512 53.739.804
Rediscount on s Receivables (-) (841.186) (1.209.352)
Doubtful Receivables 4.888.556 3.140.027
Provision for Doubtful Receivables (-) (4.888.556) (3.140.027)
Total 229.494.807 183.627.787
The details of the Bank Loans are as follows:
Long-Term financial liabilities for the years ended are as follows:
9- OTHER FINANCIAL LIABILITIESNone.
31.12.2009 Foreign Currency Amount Amount in TRL Annual Interest Rate ‘%)
Short Term Loans
TRL Loans(Short Term) 250.441 250.441 0-11,63
USD Loans (Short Term) 14.547.600 21.904.321 2,50 –7,82
Total Loans 22.154.762
Account Name 31.12.2009 31.12.2008
Bank Loans 10.313.062 11.643.476
Payables of Financial Leases - 3.393
Deferred Financial Leasing Borrowing Cost (-) - (2.293)
Total 10.313.062 11.644.576
Long Term Loans
USD Loans (Long Term) 7.699.184 11.643.476 7,82
Total Loans 11.643.476
Long Term Loans
TRL Loans (Short Term) 218.386 218.386 0-11,63
USD Loans (Long Term) 6.704.308 10.094.676 7,82
Total Loans 10.313.062 -
01 January - 31 December 2009 01 January - 31 December 2008
Opening Balance 3.140.027 2.133.911
Receivables Recovered in the period (-) 375.794 -
The Period Ended 2.124.323 1.006.116
Period-end Balance 4.888.556 3.140.027
Maturity analysis of trade receivable overdue that is not assessed for impairment is as follows:
31.12.2009 31.12.2008
Up to 3 Months 1.209.251 4.792.050
Between 3- 12 Months 153.816 734.413
Between 1-5 Years - -
Total 1.363.067 5.526.463
Account Name 31.12.2009 31.12.2008
Suppliers
Other Suppliers
Due to Related Suppliers
Notes Payable
Rediscount on Payable
Total
212.094.553
205.334.362
6.760.191
53.979.575
(993.727)
265.080.401
173.253.772
165.561.118
7.692.654
10.442.574
(1.160.572)
182.535.774
Details of Trade payables for the year ended are as follows:
31.12.2009 Foreign Currency Amount Amount in TRL Annual Interest Rate ‘%)
Short Term Loans
TRL Loans(Short Term) 120.179 Interest Free
USD Loans (Short Term) 18.948.064 28.655.158 4,20 – 6
Total Loans 28.775.337
31.12.2009 Foreign Currency Amount Amount in TRL Annual Interest Rate ‘%)
31.12.2008 Foreign Currency Amount Amount in TRL Annual Interest Rate ‘%)
ANNUAL REPORT 2009 ANNUAL REPORT 2009
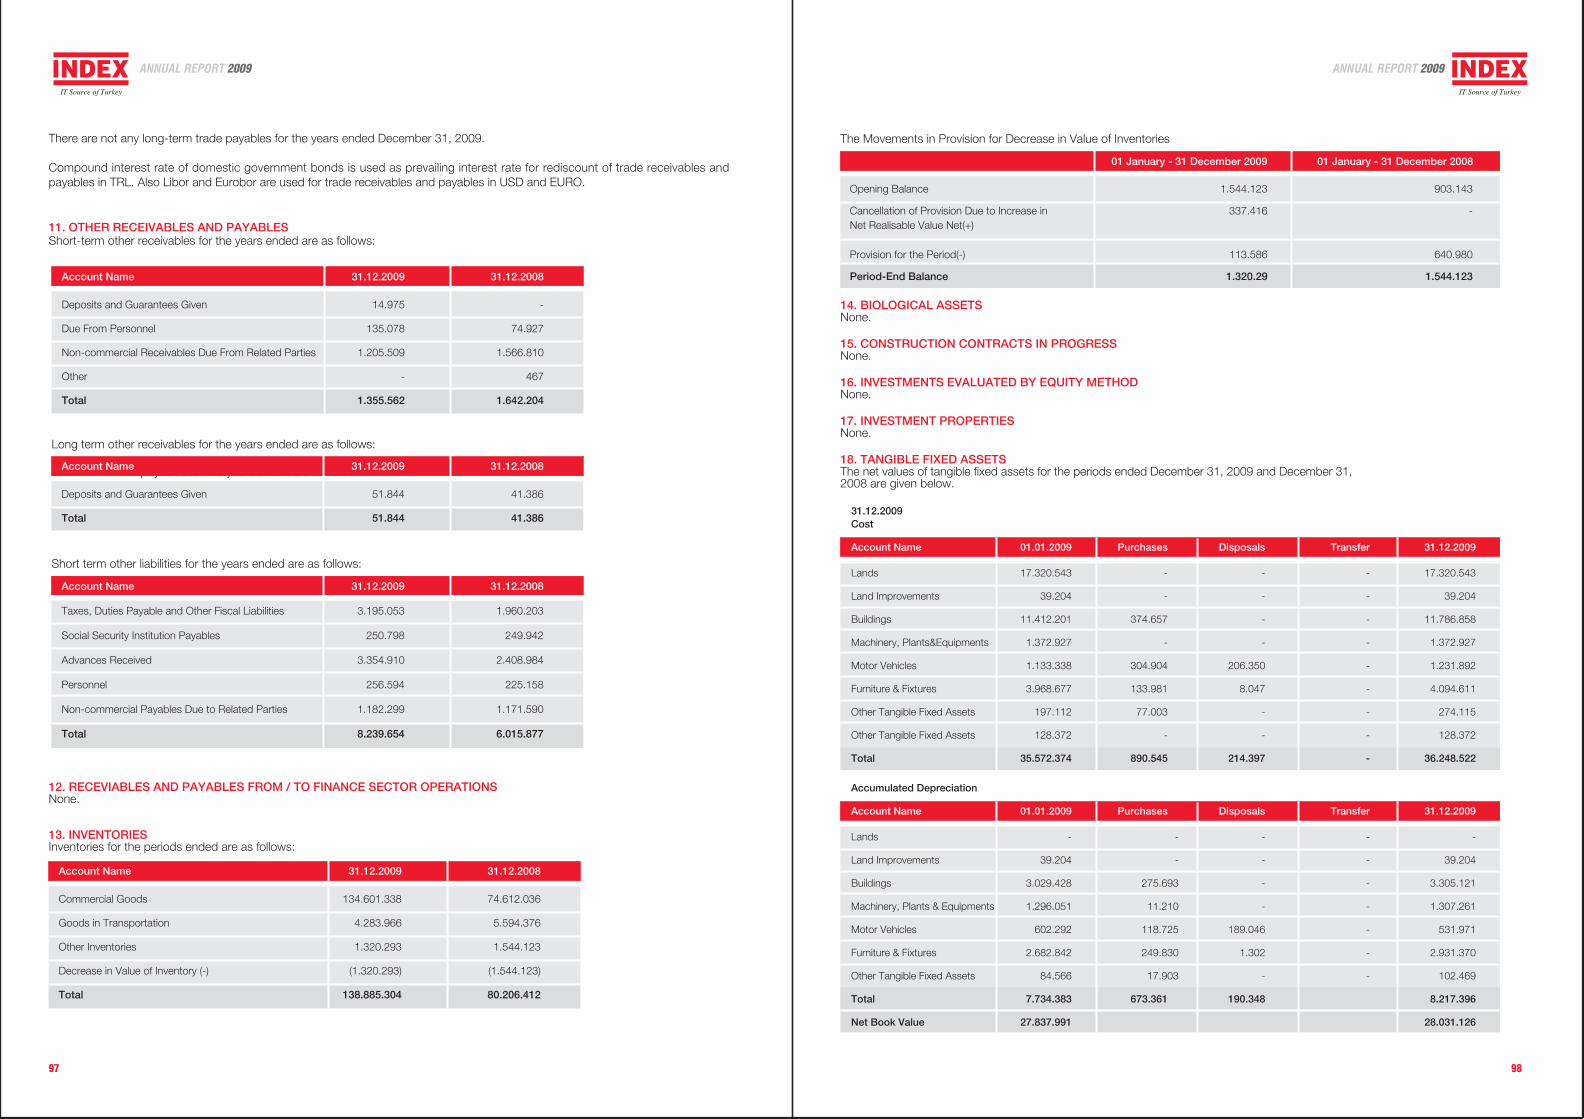
97 98
Short-term other payables for the years ended are as follows:
The Movements in Provision for Decrease in Value of Inventories
01 January - 31 December 2009 01 January - 31 December 2008
Cost
Account Name 01.01.2009 Purchases Disposals Transfer 31.12.2009
Lands 17.320.543 - - - 17.320.543
Land Improvements 39.204 - - - 39.204
Buildings 11.412.201 374.657 - - 11.786.858
Machinery, Plants&Equipments 1.372.927 - - - 1.372.927
Motor Vehicles 1.133.338 304.904 206.350 - 1.231.892
Furniture & Fixtures 3.968.677 133.981 8.047 - 4.094.611
Other Tangible Fixed Assets 197.112 77.003 - - 274.115
Other Tangible Fixed Assets 128.372 - - - 128.372
Total 35.572.374 890.545 214.397 - 36.248.522
Accumulated Depreciation
Account Name 01.01.2009 Purchases Disposals Transfer 31.12.2009
Lands - - - - -
Land Improvements 39.204 - - - 39.204
Buildings 3.029.428 275.693 - - 3.305.121
Machinery, Plants & Equipments 1.296.051 11.210 - - 1.307.261
Motor Vehicles 602.292 118.725 189.046 - 531.971
Furniture & Fixtures 2.682.842 249.830 1.302 - 2.931.370
Other Tangible Fixed Assets 84.566 17.903 - - 102.469
Total 7.734.383 673.361 190.348 8.217.396
Net Book Value 27.837.991 28.031.126
31.12.2009
14. BIOLOGICAL ASSETSNone.
15. CONSTRUCTION CONTRACTS IN PROGRESSNone.
16. INVESTMENTS EVALUATED BY EQUITY METHODNone.
17. INVESTMENT PROPERTIESNone.
18. TANGIBLE FIXED ASSETSThe net values of tangible fixed assets for the periods ended December 31, 2009 and December 31,2008 are given below.
Account Name 31.12.2009 31.12.2008
Taxes, Duties Payable and Other Fiscal Liabilities 3.195.053 1.960.203
Social Security Institution Payables 250.798 249.942
Advances Received 3.354.910 2.408.984
Personnel 256.594 225.158
Non-commercial Payables Due to Related Parties 1.182.299 1.171.590
Total 8.239.654 6.015.877
Account Name 31.12.2009 31.12.2008
Deposits and Guarantees Given 51.844 41.386
Total 51.844 41.386
11. OTHER RECEIVABLES AND PAYABLESShort-term other receivables for the years ended are as follows:
Account Name 31.12.2009 31.12.2008
Deposits and Guarantees Given 14.975 -
Due From Personnel 135.078 74.927
Non-commercial Receivables Due From Related Parties 1.205.509 1.566.810
Other - 467
Total 1.355.562 1.642.204
12. RECEVIABLES AND PAYABLES FROM / TO FINANCE SECTOR OPERATIONSNone.
13. INVENTORIESInventories for the periods ended are as follows:
Account Name 31.12.2009 31.12.2008
Commercial Goods 134.601.338 74.612.036
Goods in Transportation 4.283.966 5.594.376
Other Inventories 1.320.293 1.544.123
Decrease in Value of Inventory (-) (1.320.293) (1.544.123)
Total 138.885.304 80.206.412
There are not any long-term trade payables for the years ended December 31, 2009.
Compound interest rate of domestic government bonds is used as prevailing interest rate for rediscount of trade receivables andpayables in TRL. Also Libor and Eurobor are used for trade receivables and payables in USD and EURO.
Opening Balance 1.544.123 903.143
Cancellation of Provision Due to Increase in 337.416 -
Provision for the Period(-) 113.586 640.980
Period-End Balance 1.320.29 1.544.123
Net Realisable Value Net(+)
ANNUAL REPORT 2009 ANNUAL REPORT 2009
Long term other receivables for the years ended are as follows:
Short term other liabilities for the years ended are as follows:
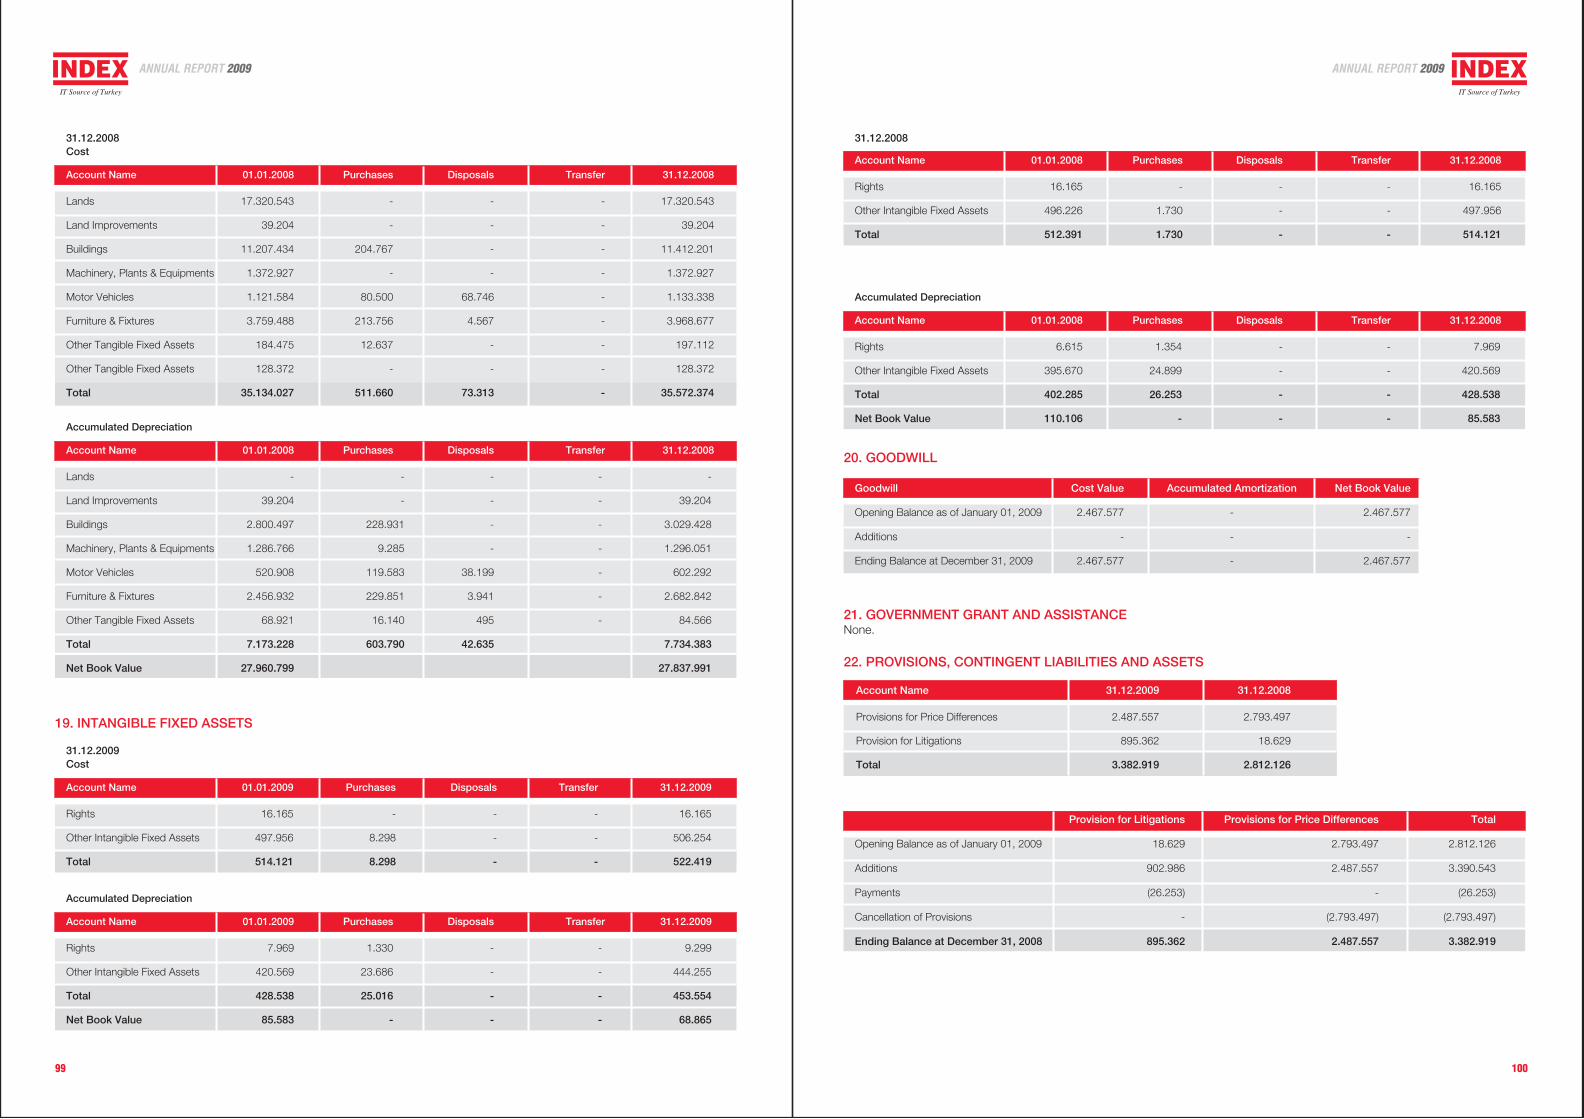
99 100
Accumulated Depreciation
Account Name 01.01.2008 Purchases Disposals Transfer 31.12.2008
Rights 6.615 1.354 - - 7.969
Other Intangible Fixed Assets 395.670 24.899 - - 420.569
Total 402.285 26.253 - - 428.538
Net Book Value 110.106 - - - 85.583
20. GOODWILL
Goodwill Cost Value Accumulated Amortization Net Book Value
Opening Balance as of January 01, 2009 2.467.577 - 2.467.577
Additions - - -
Ending Balance at December 31, 2009 2.467.577 - 2.467.577
Account Name 31.12.2009 31.12.2008
Provisions for Price Differences 2.487.557 2.793.497
Provision for Litigations 895.362 18.629
Total 3.382.919 2.812.126
22. PROVISIONS, CONTINGENT LIABILITIES AND ASSETS
21. GOVERNMENT GRANT AND ASSISTANCENone.
Provision for Litigations Provisions for Price Differences Total
Opening Balance as of January 01, 2009 18.629 2.793.497 2.812.126
Additions 902.986 2.487.557 3.390.543
Payments (26.253) - (26.253)
Cancellation of Provisions - (2.793.497) (2.793.497)
Ending Balance at December 31, 2008 895.362 2.487.557 3.382.919
19. INTANGIBLE FIXED ASSETS
Accumulated Depreciation
Account Name 01.01.2009 Purchases Disposals Transfer 31.12.2009
Rights 7.969 1.330 - - 9.299
Other Intangible Fixed Assets 420.569 23.686 - - 444.255
Total 428.538 25.016 - - 453.554
Net Book Value 85.583 - - - 68.865
Account Name 01.01.2008 Purchases Disposals Transfer 31.12.2008
Rights 16.165 - - - 16.165
Other Intangible Fixed Assets 496.226 1.730 - - 497.956
Total 512.391 1.730 - - 514.121
31.12.2008
Cost
Account Name 01.01.2009 Purchases Disposals Transfer 31.12.2009
Rights 16.165 - - - 16.165
Other Intangible Fixed Assets 497.956 8.298 - - 506.254
Total 514.121 8.298 - - 522.419
31.12.2009
Accumulated Depreciation
Account Name 01.01.2008 Purchases Disposals Transfer 31.12.2008
Lands - - - - -
Land Improvements 39.204 - - - 39.204
Buildings 2.800.497 228.931 - - 3.029.428
Machinery, Plants & Equipments 1.286.766 9.285 - - 1.296.051
Motor Vehicles 520.908 119.583 38.199 - 602.292
Furniture & Fixtures 2.456.932 229.851 3.941 - 2.682.842
Other Tangible Fixed Assets 68.921 16.140 495 - 84.566
Total 7.173.228 603.790 42.635 7.734.383
Net Book Value 27.960.799 27.837.991
Cost
Account Name 01.01.2008 Purchases Disposals Transfer 31.12.2008
Lands 17.320.543 - - - 17.320.543
Land Improvements 39.204 - - - 39.204
Buildings 11.207.434 204.767 - - 11.412.201
Machinery, Plants & Equipments 1.372.927 - - - 1.372.927
Motor Vehicles 1.121.584 80.500 68.746 - 1.133.338
Furniture & Fixtures 3.759.488 213.756 4.567 - 3.968.677
Other Tangible Fixed Assets 184.475 12.637 - - 197.112
Other Tangible Fixed Assets 128.372 - - - 128.372
Total 35.134.027 511.660 73.313 - 35.572.374
31.12.2008
ANNUAL REPORT 2009 ANNUAL REPORT 2009
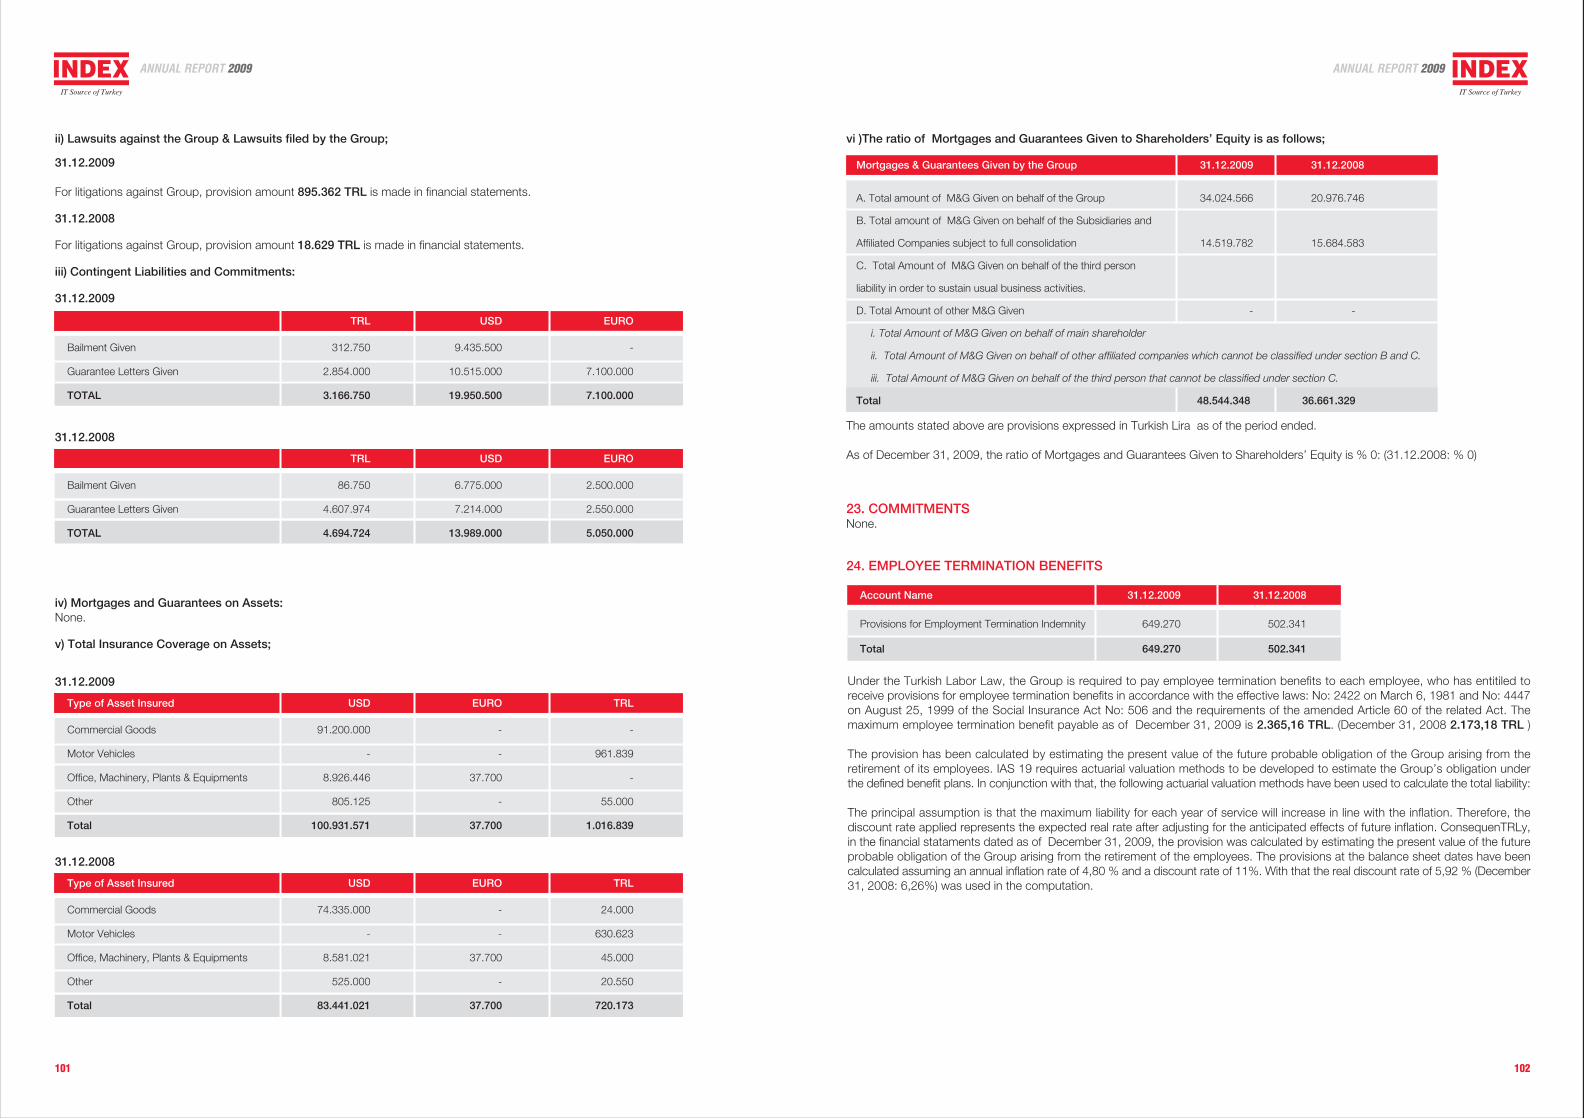
101 102
TRL USD EURO
Bailment Given 86.750 6.775.000 2.500.000
Guarantee Letters Given 4.607.974 7.214.000 2.550.000
TOTAL 4.694.724 13.989.000 5.050.000
31.12.2008
iv) Mortgages and Guarantees on Assets:None.
v) Total Insurance Coverage on Assets;
Type of Asset Insured USD EURO TRL
Commercial Goods 91.200.000 - -
Motor Vehicles - - 961.839
Office, Machinery, Plants & Equipments 8.926.446 37.700 -
Other 805.125 - 55.000
Total 100.931.571 37.700 1.016.839
31.12.2009
Type of Asset Insured USD EURO TRL
Commercial Goods 74.335.000 - 24.000
Motor Vehicles - - 630.623
Office, Machinery, Plants & Equipments 8.581.021 37.700 45.000
Other 525.000 - 20.550
Total 83.441.021 37.700 720.173
31.12.2008
vi )The ratio of Mortgages and Guarantees Given to Shareholders’ Equity is as follows;
Mortgages & Guarantees Given by the Group 31.12.2009 31.12.2008
A. Total amount of M&G Given on behalf of the Group 34.024.566 20.976.746
B. Total amount of M&G Given on behalf of the Subsidiaries and
Affiliated Companies subject to full consolidation 14.519.782 15.684.583
C. Total Amount of M&G Given on behalf of the third person
liability in order to sustain usual business activities.
D. Total Amount of other M&G Given - -
i. Total Amount of M&G Given on behalf of main shareholder
ii. Total Amount of M&G Given on behalf of other affiliated companies which cannot be classified under section B and C.
iii. Total Amount of M&G Given on behalf of the third person that cannot be classified under section C.
Total 48.544.348 36.661.329
The amounts stated above are provisions expressed in Turkish Lira as of the period ended.
As of December 31, 2009, the ratio of Mortgages and Guarantees Given to Shareholders’ Equity is % 0: (31.12.2008: % 0)
Account Name 31.12.2009 31.12.2008
Provisions for Employment Termination Indemnity 649.270 502.341
Total 649.270 502.341
Under the Turkish Labor Law, the Group is required to pay employee termination benefits to each employee, who has entitiled toreceive provisions for employee termination benefits in accordance with the effective laws: No: 2422 on March 6, 1981 and No: 4447on August 25, 1999 of the Social Insurance Act No: 506 and the requirements of the amended Article 60 of the related Act. Themaximum employee termination benefit payable as of December 31, 2009 is 2.365,16 TRL. (December 31, 2008 2.173,18 TRL )
The provision has been calculated by estimating the present value of the future probable obligation of the Group arising from theretirement of its employees. IAS 19 requires actuarial valuation methods to be developed to estimate the Group’s obligation underthe defined benefit plans. In conjunction with that, the following actuarial valuation methods have been used to calculate the total liability:
The principal assumption is that the maximum liability for each year of service will increase in line with the inflation. Therefore, thediscount rate applied represents the expected real rate after adjusting for the anticipated effects of future inflation. ConsequenTRLy,in the financial stataments dated as of December 31, 2009, the provision was calculated by estimating the present value of the futureprobable obligation of the Group arising from the retirement of the employees. The provisions at the balance sheet dates have beencalculated assuming an annual inflation rate of 4,80 % and a discount rate of 11%. With that the real discount rate of 5,92 % (December31, 2008: 6,26%) was used in the computation.
23. COMMITMENTSNone.
24. EMPLOYEE TERMINATION BENEFITS
ii) Lawsuits against the Group & Lawsuits filed by the Group;
31.12.2009
For litigations against Group, provision amount 895.362 TRL is made in financial statements.
31.12.2008
For litigations against Group, provision amount 18.629 TRL is made in financial statements.
iii) Contingent Liabilities and Commitments:
31.12.2009
TRL USD EURO
Bailment Given 312.750 9.435.500 -
Guarantee Letters Given 2.854.000 10.515.000 7.100.000
TOTAL 3.166.750 19.950.500 7.100.000
ANNUAL REPORT 2009 ANNUAL REPORT 2009
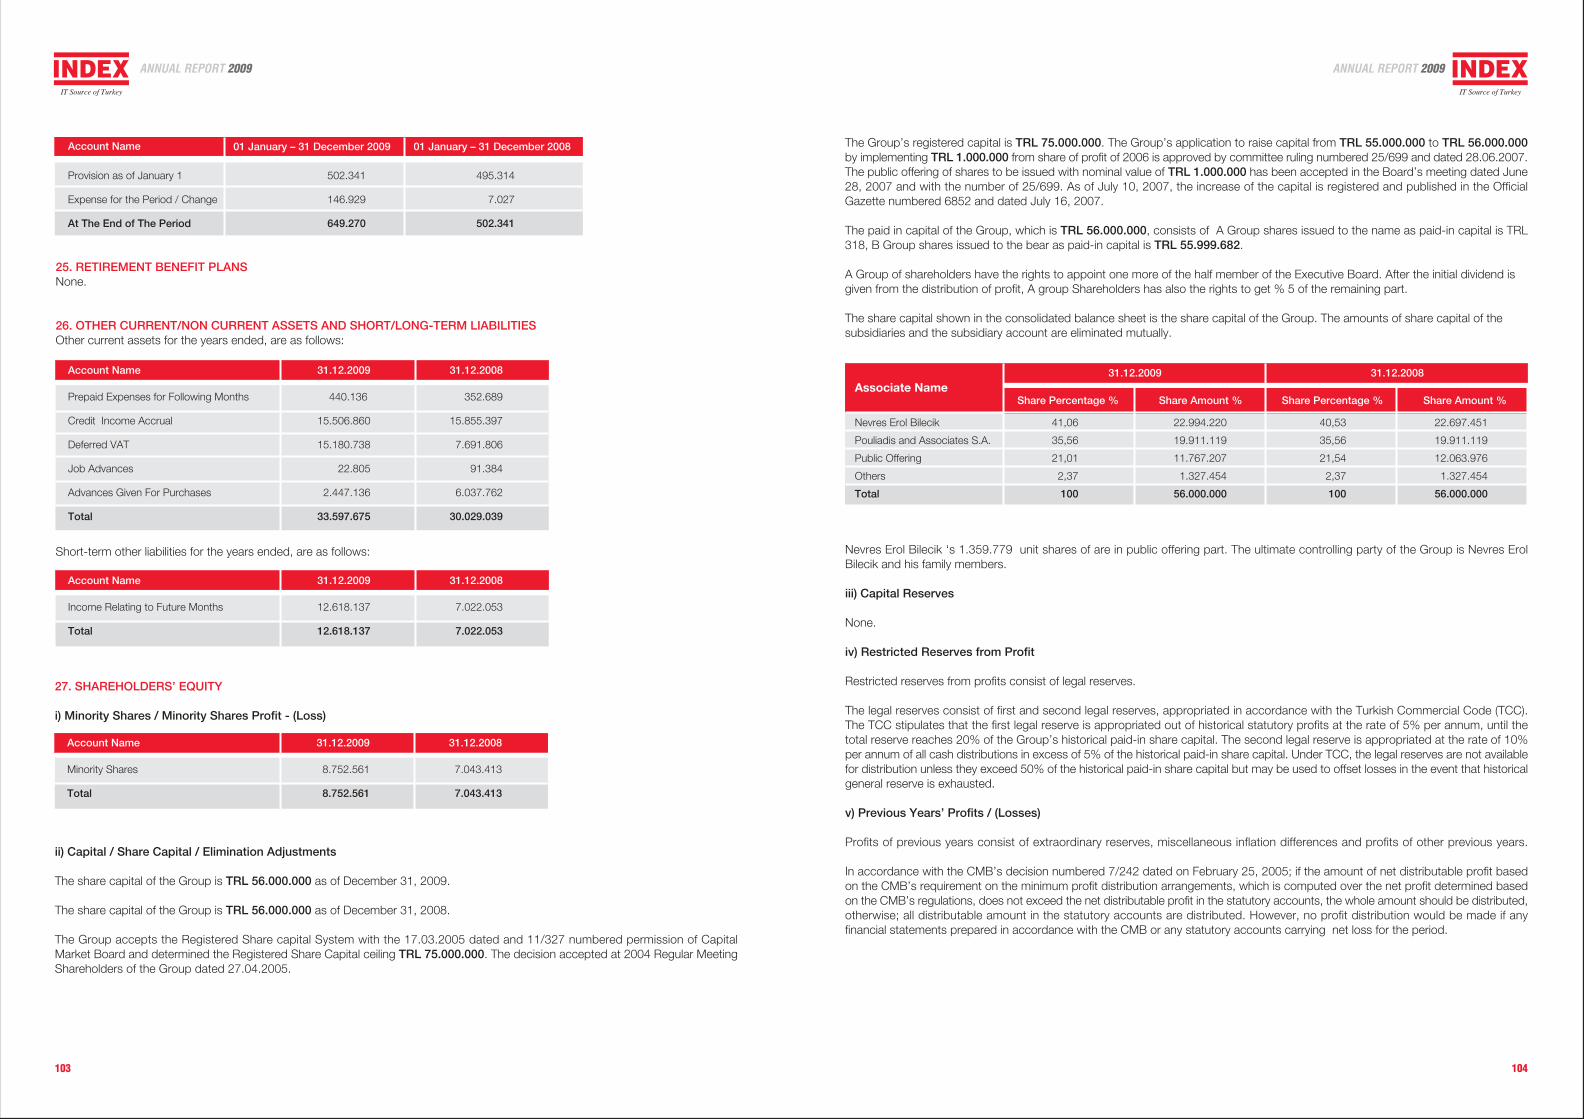
103 104
25. RETIREMENT BENEFIT PLANSNone.
26. OTHER CURRENT/NON CURRENT ASSETS AND SHORT/LONG-TERM LIABILITIESOther current assets for the years ended, are as follows:
Account Name 31.12.2009 31.12.2008
Prepaid Expenses for Following Months 440.136 352.689
Credit Income Accrual 15.506.860 15.855.397
Deferred VAT 15.180.738 7.691.806
Job Advances 22.805 91.384
Advances Given For Purchases 2.447.136 6.037.762
Total 33.597.675 30.029.039
Account Name 31.12.2009 31.12.2008
Income Relating to Future Months 12.618.137 7.022.053
Total 12.618.137 7.022.053
Short-term other liabilities for the years ended, are as follows:
01 January – 31 December 2009 01 January – 31 December 2008
Provision as of January 1 502.341 495.314
Expense for the Period / Change 146.929 7.027
At The End of The Period 649.270 502.341
Account Name The Group’s registered capital is TRL 75.000.000. The Group’s application to raise capital from TRL 55.000.000 to TRL 56.000.000by implementing TRL 1.000.000 from share of profit of 2006 is approved by committee ruling numbered 25/699 and dated 28.06.2007.The public offering of shares to be issued with nominal value of TRL 1.000.000 has been accepted in the Board’s meeting dated June28, 2007 and with the number of 25/699. As of July 10, 2007, the increase of the capital is registered and published in the OfficialGazette numbered 6852 and dated July 16, 2007.
The paid in capital of the Group, which is TRL 56.000.000, consists of A Group shares issued to the name as paid-in capital is TRL318, B Group shares issued to the bear as paid-in capital is TRL 55.999.682.
A Group of shareholders have the rights to appoint one more of the half member of the Executive Board. After the initial dividend isgiven from the distribution of profit, A group Shareholders has also the rights to get % 5 of the remaining part.
The share capital shown in the consolidated balance sheet is the share capital of the Group. The amounts of share capital of thesubsidiaries and the subsidiary account are eliminated mutually.
Share Percentage % Share Amount % Share Percentage % Share Amount %
Nevres Erol Bilecik 41,06 22.994.220 40,53 22.697.451
Pouliadis and Associates S.A. 35,56 19.911.119 35,56 19.911.119
Public Offering 21,01 11.767.207 21,54 12.063.976
Others 2,37 1.327.454 2,37 1.327.454
Total 100 56.000.000 100 56.000.000
Associate Name
Nevres Erol Bilecik ‘s 1.359.779 unit shares of are in public offering part. The ultimate controlling party of the Group is Nevres ErolBilecik and his family members.
iii) Capital Reserves
None.
iv) Restricted Reserves from Profit
Restricted reserves from profits consist of legal reserves.
The legal reserves consist of first and second legal reserves, appropriated in accordance with the Turkish Commercial Code (TCC).The TCC stipulates that the first legal reserve is appropriated out of historical statutory profits at the rate of 5% per annum, until thetotal reserve reaches 20% of the Group’s historical paid-in share capital. The second legal reserve is appropriated at the rate of 10%per annum of all cash distributions in excess of 5% of the historical paid-in share capital. Under TCC, the legal reserves are not availablefor distribution unless they exceed 50% of the historical paid-in share capital but may be used to offset losses in the event that historicalgeneral reserve is exhausted.
v) Previous Years’ Profits / (Losses)
Profits of previous years consist of extraordinary reserves, miscellaneous inflation differences and profits of other previous years.
In accordance with the CMB’s decision numbered 7/242 dated on February 25, 2005; if the amount of net distributable profit basedon the CMB’s requirement on the minimum profit distribution arrangements, which is computed over the net profit determined basedon the CMB’s regulations, does not exceed the net distributable profit in the statutory accounts, the whole amount should be distributed,otherwise; all distributable amount in the statutory accounts are distributed. However, no profit distribution would be made if anyfinancial statements prepared in accordance with the CMB or any statutory accounts carrying net loss for the period.
27. SHAREHOLDERS’ EQUITY
i) Minority Shares / Minority Shares Profit - (Loss)
Account Name 31.12.2009 31.12.2008
Minority Shares 8.752.561 7.043.413
Total 8.752.561 7.043.413
ii) Capital / Share Capital / Elimination Adjustments
The share capital of the Group is TRL 56.000.000 as of December 31, 2009.
The share capital of the Group is TRL 56.000.000 as of December 31, 2008.
The Group accepts the Registered Share capital System with the 17.03.2005 dated and 11/327 numbered permission of CapitalMarket Board and determined the Registered Share Capital ceiling TRL 75.000.000. The decision accepted at 2004 Regular MeetingShareholders of the Group dated 27.04.2005.
31.12.2009 31.12.2008
ANNUAL REPORT 2009 ANNUAL REPORT 2009
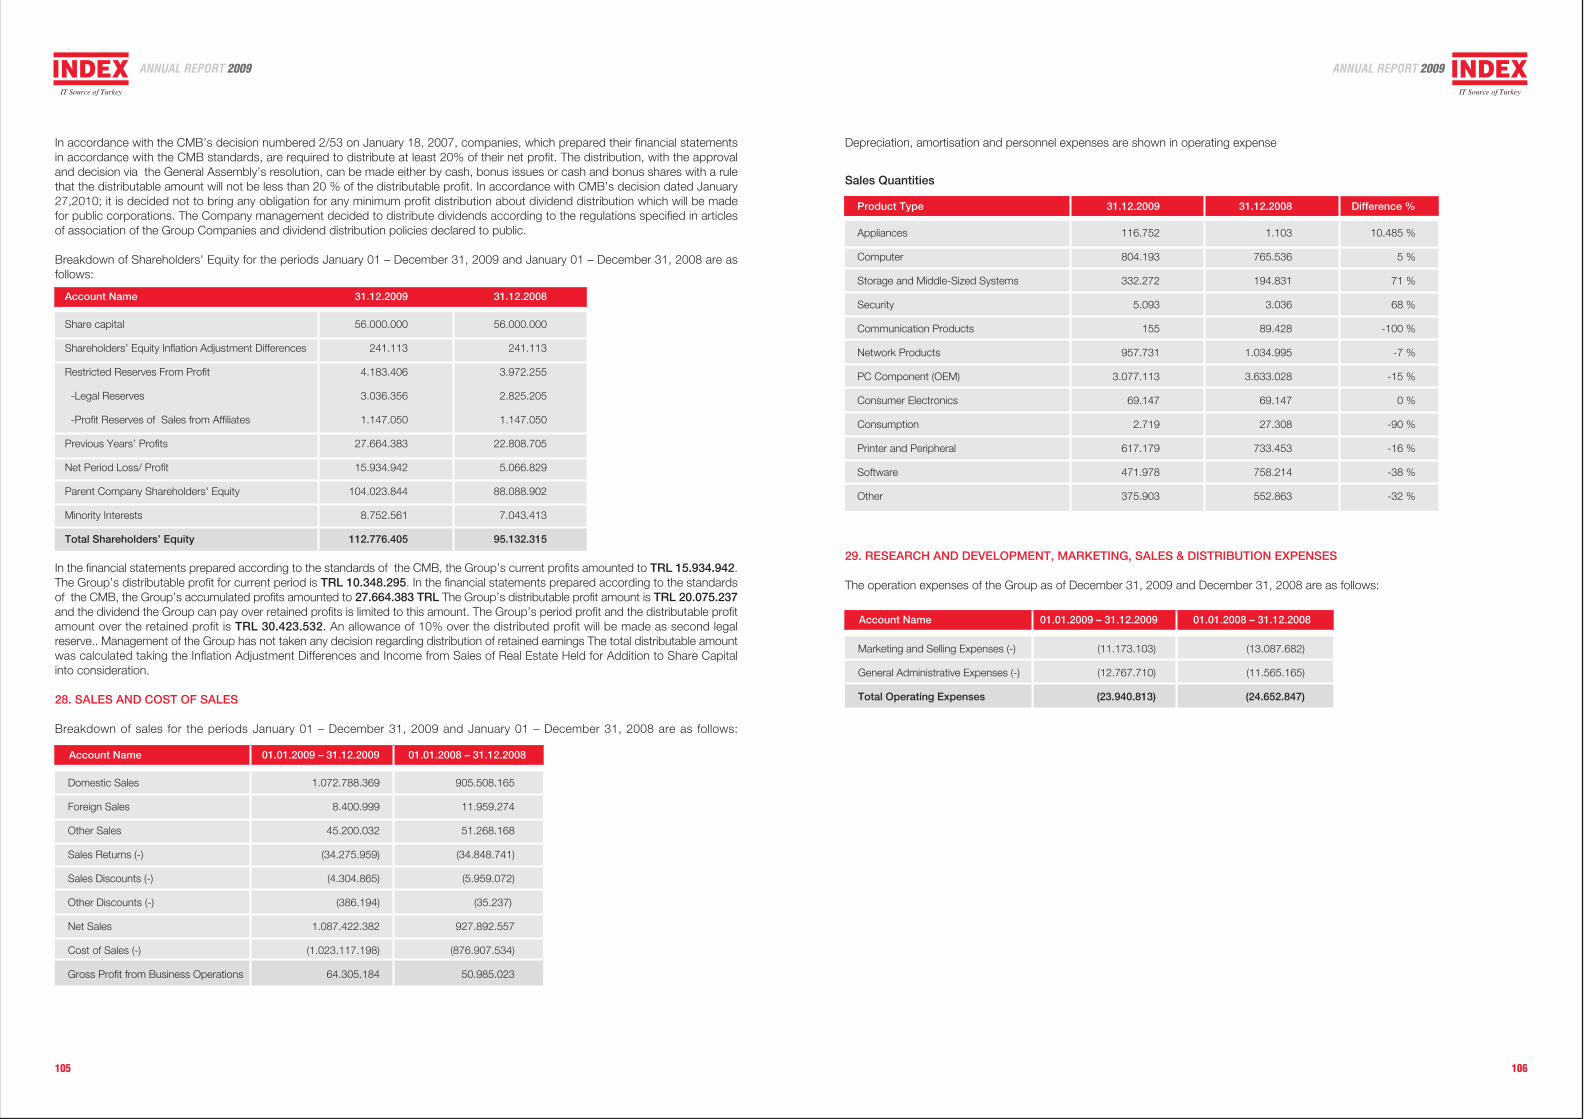
105 106
In the financial statements prepared according to the standards of the CMB, the Group’s current profits amounted to TRL 15.934.942.The Group’s distributable profit for current period is TRL 10.348.295. In the financial statements prepared according to the standardsof the CMB, the Group’s accumulated profits amounted to 27.664.383 TRL The Group’s distributable profit amount is TRL 20.075.237and the dividend the Group can pay over retained profits is limited to this amount. The Group’s period profit and the distributable profitamount over the retained profit is TRL 30.423.532. An allowance of 10% over the distributed profit will be made as second legalreserve.. Management of the Group has not taken any decision regarding distribution of retained earnings The total distributable amountwas calculated taking the Inflation Adjustment Differences and Income from Sales of Real Estate Held for Addition to Share Capitalinto consideration.
28. SALES AND COST OF SALES
Breakdown of sales for the periods January 01 – December 31, 2009 and January 01 – December 31, 2008 are as follows:
Account Name 31.12.2009 31.12.2008
Share capital 56.000.000 56.000.000
Shareholders’ Equity Inflation Adjustment Differences 241.113 241.113
Restricted Reserves From Profit 4.183.406 3.972.255
-Legal Reserves 3.036.356 2.825.205
-Profit Reserves of Sales from Affiliates 1.147.050 1.147.050
Previous Years’ Profits 27.664.383 22.808.705
Net Period Loss/ Profit 15.934.942 5.066.829
Parent Company Shareholders' Equity 104.023.844 88.088.902
Minority Interests 8.752.561 7.043.413
Total Shareholders’ Equity 112.776.405 95.132.315
Product Type 31.12.2009 31.12.2008 Difference %
Appliances 116.752 1.103 10.485 %
Computer 804.193 765.536 5 %
Storage and Middle-Sized Systems 332.272 194.831 71 %
Security 5.093 3.036 68 %
Communication Products 155 89.428 -100 %
Network Products 957.731 1.034.995 -7 %
PC Component (OEM) 3.077.113 3.633.028 -15 %
Consumer Electronics 69.147 69.147 0 %
Consumption 2.719 27.308 -90 %
Printer and Peripheral 617.179 733.453 -16 %
Software 471.978 758.214 -38 %
Other 375.903 552.863 -32 %
29. RESEARCH AND DEVELOPMENT, MARKETING, SALES & DISTRIBUTION EXPENSES
The operation expenses of the Group as of December 31, 2009 and December 31, 2008 are as follows:
Account Name 01.01.2009 – 31.12.2009 01.01.2008 – 31.12.2008
Marketing and Selling Expenses (-) (11.173.103) (13.087.682)
General Administrative Expenses (-) (12.767.710) (11.565.165)
Total Operating Expenses (23.940.813) (24.652.847)
Account Name 01.01.2009 – 31.12.2009 01.01.2008 – 31.12.2008
Domestic Sales 1.072.788.369 905.508.165
Foreign Sales 8.400.999 11.959.274
Other Sales 45.200.032 51.268.168
Sales Returns (-) (34.275.959) (34.848.741)
Sales Discounts (-) (4.304.865) (5.959.072)
Other Discounts (-) (386.194) (35.237)
Net Sales 1.087.422.382 927.892.557
Cost of Sales (-) (1.023.117.198) (876.907.534)
Gross Profit from Business Operations 64.305.184 50.985.023
In accordance with the CMB’s decision numbered 2/53 on January 18, 2007, companies, which prepared their financial statementsin accordance with the CMB standards, are required to distribute at least 20% of their net profit. The distribution, with the approvaland decision via the General Assembly’s resolution, can be made either by cash, bonus issues or cash and bonus shares with a rulethat the distributable amount will not be less than 20 % of the distributable profit. In accordance with CMB’s decision dated January27,2010; it is decided not to bring any obligation for any minimum profit distribution about dividend distribution which will be madefor public corporations. The Company management decided to distribute dividends according to the regulations specified in articlesof association of the Group Companies and dividend distribution policies declared to public.
Breakdown of Shareholders' Equity for the periods January 01 – December 31, 2009 and January 01 – December 31, 2008 are asfollows:
Depreciation, amortisation and personnel expenses are shown in operating expense
Sales Quantities
ANNUAL REPORT 2009 ANNUAL REPORT 2009
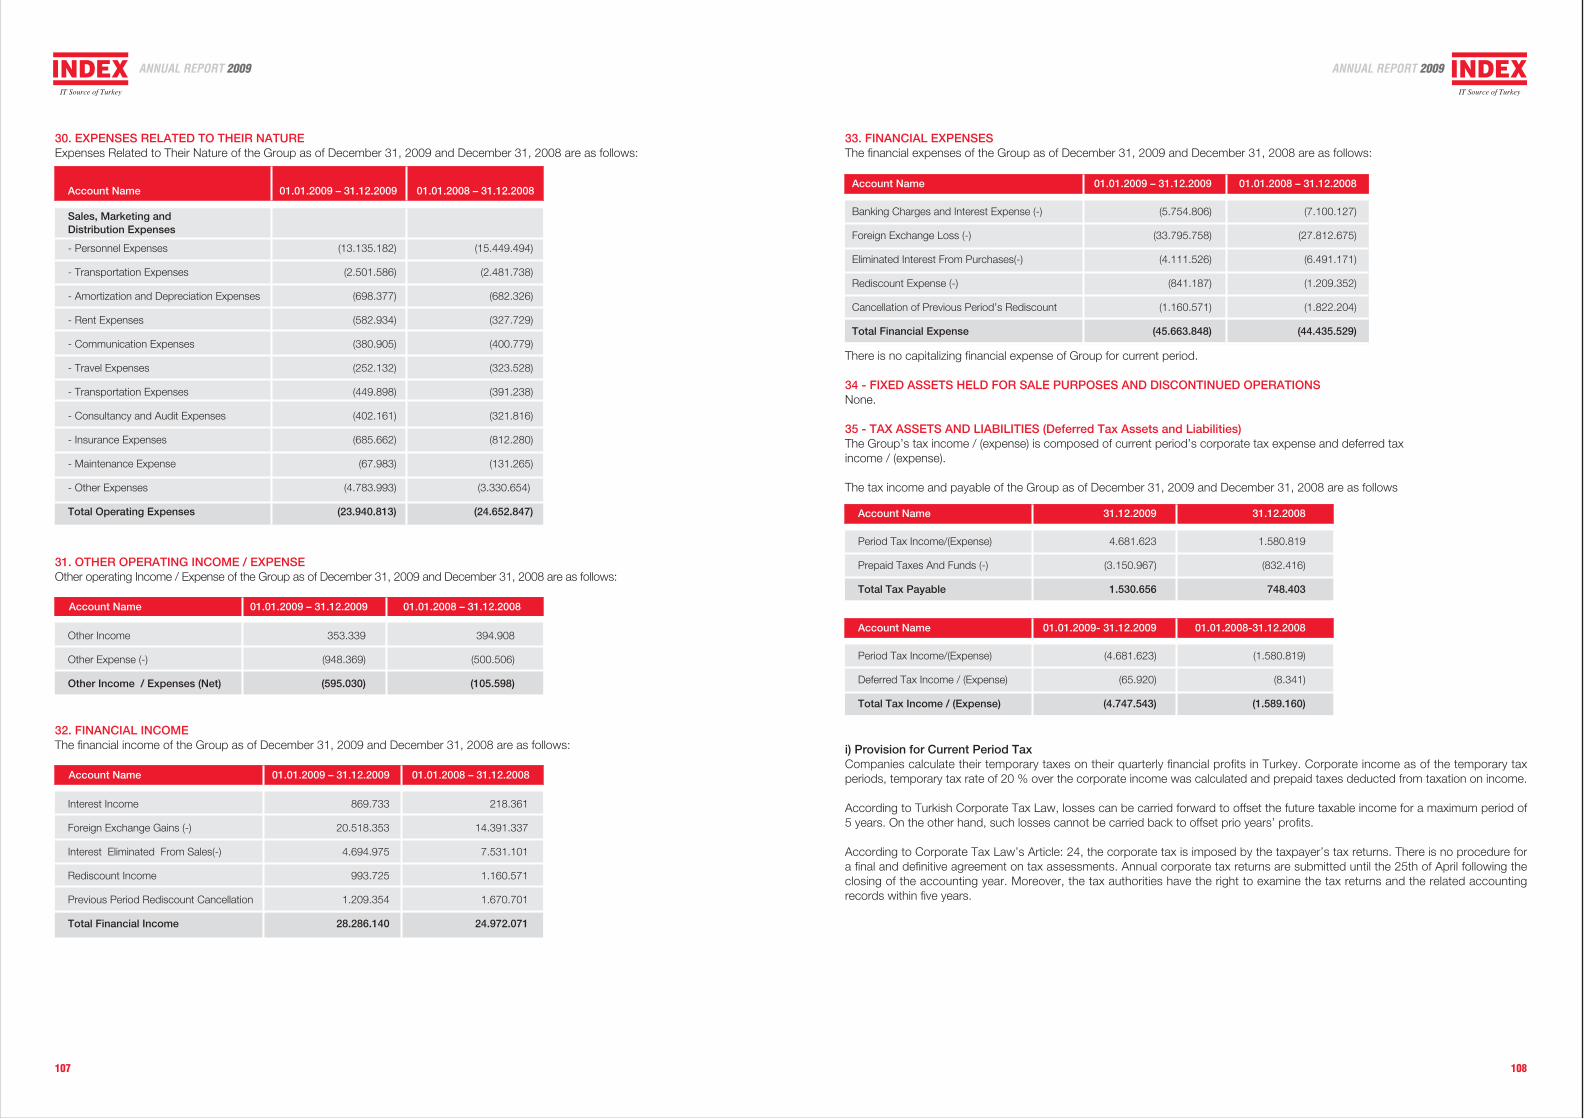
107 108
30. EXPENSES RELATED TO THEIR NATUREExpenses Related to Their Nature of the Group as of December 31, 2009 and December 31, 2008 are as follows:
01.01.2009 – 31.12.2009 01.01.2008 – 31.12.2008
Sales, Marketing andDistribution Expenses
31. OTHER OPERATING INCOME / EXPENSEOther operating Income / Expense of the Group as of December 31, 2009 and December 31, 2008 are as follows:
Account Name 01.01.2009 – 31.12.2009 01.01.2008 – 31.12.2008
Other Income 353.339 394.908
Other Expense (-) (948.369) (500.506)
Other Income / Expenses (Net) (595.030) (105.598)
32. FINANCIAL INCOMEThe financial income of the Group as of December 31, 2009 and December 31, 2008 are as follows:
Account Name 01.01.2009 – 31.12.2009 01.01.2008 – 31.12.2008
Account Name
- Personnel Expenses (13.135.182) (15.449.494)
- Transportation Expenses (2.501.586) (2.481.738)
- Amortization and Depreciation Expenses (698.377) (682.326)
- Rent Expenses (582.934) (327.729)
- Communication Expenses (380.905) (400.779)
- Travel Expenses (252.132) (323.528)
- Transportation Expenses (449.898) (391.238)
- Consultancy and Audit Expenses (402.161) (321.816)
- Insurance Expenses (685.662) (812.280)
- Maintenance Expense (67.983) (131.265)
- Other Expenses (4.783.993) (3.330.654)
Total Operating Expenses (23.940.813) (24.652.847)
Interest Income 869.733 218.361
Foreign Exchange Gains (-) 20.518.353 14.391.337
Interest Eliminated From Sales(-) 4.694.975 7.531.101
Rediscount Income 993.725 1.160.571
Previous Period Rediscount Cancellation 1.209.354 1.670.701
Total Financial Income 28.286.140 24.972.071
33. FINANCIAL EXPENSESThe financial expenses of the Group as of December 31, 2009 and December 31, 2008 are as follows:
Account Name 01.01.2009 – 31.12.2009 01.01.2008 – 31.12.2008
Banking Charges and Interest Expense (-) (5.754.806) (7.100.127)
Foreign Exchange Loss (-) (33.795.758) (27.812.675)
Eliminated Interest From Purchases(-) (4.111.526) (6.491.171)
Rediscount Expense (-) (841.187) (1.209.352)
Cancellation of Previous Period’s Rediscount (1.160.571) (1.822.204)
Total Financial Expense (45.663.848) (44.435.529)
There is no capitalizing financial expense of Group for current period.
34 - FIXED ASSETS HELD FOR SALE PURPOSES AND DISCONTINUED OPERATIONSNone.
35 - TAX ASSETS AND LIABILITIES (Deferred Tax Assets and Liabilities)The Group’s tax income / (expense) is composed of current period’s corporate tax expense and deferred taxincome / (expense).
The tax income and payable of the Group as of December 31, 2009 and December 31, 2008 are as follows
Account Name 31.12.2009 31.12.2008
Period Tax Income/(Expense) 4.681.623 1.580.819
Prepaid Taxes And Funds (-) (3.150.967) (832.416)
Total Tax Payable 1.530.656 748.403
Account Name 01.01.2009- 31.12.2009 01.01.2008-31.12.2008
Period Tax Income/(Expense) (4.681.623) (1.580.819)
Deferred Tax Income / (Expense) (65.920) (8.341)
Total Tax Income / (Expense) (4.747.543) (1.589.160)
i) Provision for Current Period TaxCompanies calculate their temporary taxes on their quarterly financial profits in Turkey. Corporate income as of the temporary taxperiods, temporary tax rate of 20 % over the corporate income was calculated and prepaid taxes deducted from taxation on income.
According to Turkish Corporate Tax Law, losses can be carried forward to offset the future taxable income for a maximum period of5 years. On the other hand, such losses cannot be carried back to offset prio years’ profits.
According to Corporate Tax Law’s Article: 24, the corporate tax is imposed by the taxpayer’s tax returns. There is no procedure fora final and definitive agreement on tax assessments. Annual corporate tax returns are submitted until the 25th of April following theclosing of the accounting year. Moreover, the tax authorities have the right to examine the tax returns and the related accountingrecords within five years.
ANNUAL REPORT 2009 ANNUAL REPORT 2009
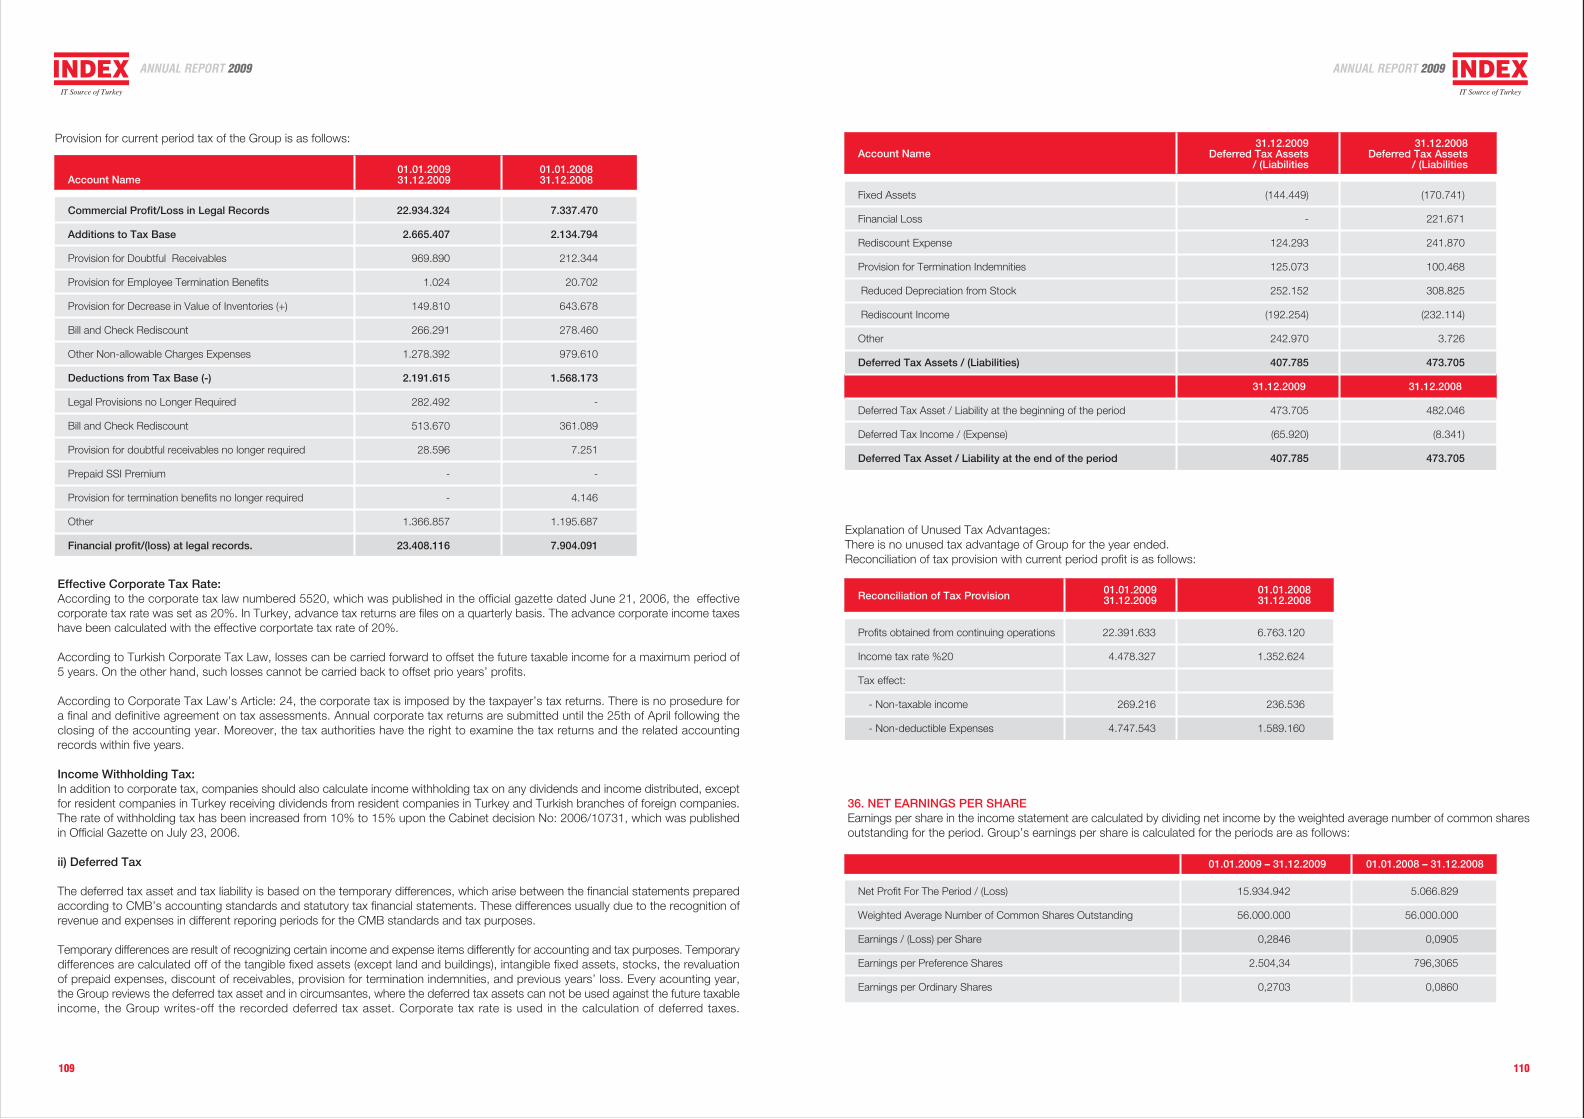
109 110
Effective Corporate Tax Rate:According to the corporate tax law numbered 5520, which was published in the official gazette dated June 21, 2006, the effectivecorporate tax rate was set as 20%. In Turkey, advance tax returns are files on a quarterly basis. The advance corporate income taxeshave been calculated with the effective corportate tax rate of 20%.
According to Turkish Corporate Tax Law, losses can be carried forward to offset the future taxable income for a maximum period of5 years. On the other hand, such losses cannot be carried back to offset prio years’ profits.
According to Corporate Tax Law’s Article: 24, the corporate tax is imposed by the taxpayer’s tax returns. There is no prosedure fora final and definitive agreement on tax assessments. Annual corporate tax returns are submitted until the 25th of April following theclosing of the accounting year. Moreover, the tax authorities have the right to examine the tax returns and the related accountingrecords within five years.
Income Withholding Tax:In addition to corporate tax, companies should also calculate income withholding tax on any dividends and income distributed, exceptfor resident companies in Turkey receiving dividends from resident companies in Turkey and Turkish branches of foreign companies.The rate of withholding tax has been increased from 10% to 15% upon the Cabinet decision No: 2006/10731, which was publishedin Official Gazette on July 23, 2006.
ii) Deferred Tax
The deferred tax asset and tax liability is based on the temporary differences, which arise between the financial statements preparedaccording to CMB’s accounting standards and statutory tax financial statements. These differences usually due to the recognition ofrevenue and expenses in different reporing periods for the CMB standards and tax purposes.
Temporary differences are result of recognizing certain income and expense items differently for accounting and tax purposes. Temporarydifferences are calculated off of the tangible fixed assets (except land and buildings), intangible fixed assets, stocks, the revaluationof prepaid expenses, discount of receivables, provision for termination indemnities, and previous years’ loss. Every acounting year,the Group reviews the deferred tax asset and in circumsantes, where the deferred tax assets can not be used against the future taxableincome, the Group writes-off the recorded deferred tax asset. Corporate tax rate is used in the calculation of deferred taxes.
01.01.200831.12.2008Account Name
Commercial Profit/Loss in Legal Records 22.934.324 7.337.470
Additions to Tax Base 2.665.407 2.134.794
Provision for Doubtful Receivables 969.890 212.344
Provision for Employee Termination Benefits 1.024 20.702
Provision for Decrease in Value of Inventories (+) 149.810 643.678
Bill and Check Rediscount 266.291 278.460
Other Non-allowable Charges Expenses 1.278.392 979.610
Deductions from Tax Base (-) 2.191.615 1.568.173
Legal Provisions no Longer Required 282.492 -
Bill and Check Rediscount 513.670 361.089
Provision for doubtful receivables no longer required 28.596 7.251
Prepaid SSI Premium - -
Provision for termination benefits no longer required - 4.146
Other 1.366.857 1.195.687
Financial profit/(loss) at legal records. 23.408.116 7.904.091
01.01.200931.12.2009
36. NET EARNINGS PER SHAREEarnings per share in the income statement are calculated by dividing net income by the weighted average number of common sharesoutstanding for the period. Group’s earnings per share is calculated for the periods are as follows:
Account Name
Fixed Assets (144.449) (170.741)
Financial Loss - 221.671
Rediscount Expense 124.293 241.870
Provision for Termination Indemnities 125.073 100.468
Reduced Depreciation from Stock 252.152 308.825
Rediscount Income (192.254) (232.114)
Other 242.970 3.726
Deferred Tax Assets / (Liabilities) 407.785 473.705
31.12.2009 31.12.2008
Deferred Tax Asset / Liability at the beginning of the period 473.705 482.046
Deferred Tax Income / (Expense) (65.920) (8.341)
Deferred Tax Asset / Liability at the end of the period 407.785 473.705
31.12.2009Deferred Tax Assets
/ (Liabilities
31.12.2008Deferred Tax Assets
/ (Liabilities
Explanation of Unused Tax Advantages:There is no unused tax advantage of Group for the year ended.Reconciliation of tax provision with current period profit is as follows:
Reconciliation of Tax Provision
Profits obtained from continuing operations 22.391.633 6.763.120
Income tax rate %20 4.478.327 1.352.624
Tax effect:
- Non-taxable income 269.216 236.536
- Non-deductible Expenses 4.747.543 1.589.160
01.01.200931.12.2009
01.01.200831.12.2008
01.01.2009 – 31.12.2009 01.01.2008 – 31.12.2008
Net Profit For The Period / (Loss) 15.934.942 5.066.829
Weighted Average Number of Common Shares Outstanding 56.000.000 56.000.000
Earnings / (Loss) per Share 0,2846 0,0905
Earnings per Preference Shares 2.504,34 796,3065
Earnings per Ordinary Shares 0,2703 0,0860
Provision for current period tax of the Group is as follows:
ANNUAL REPORT 2009 ANNUAL REPORT 2009
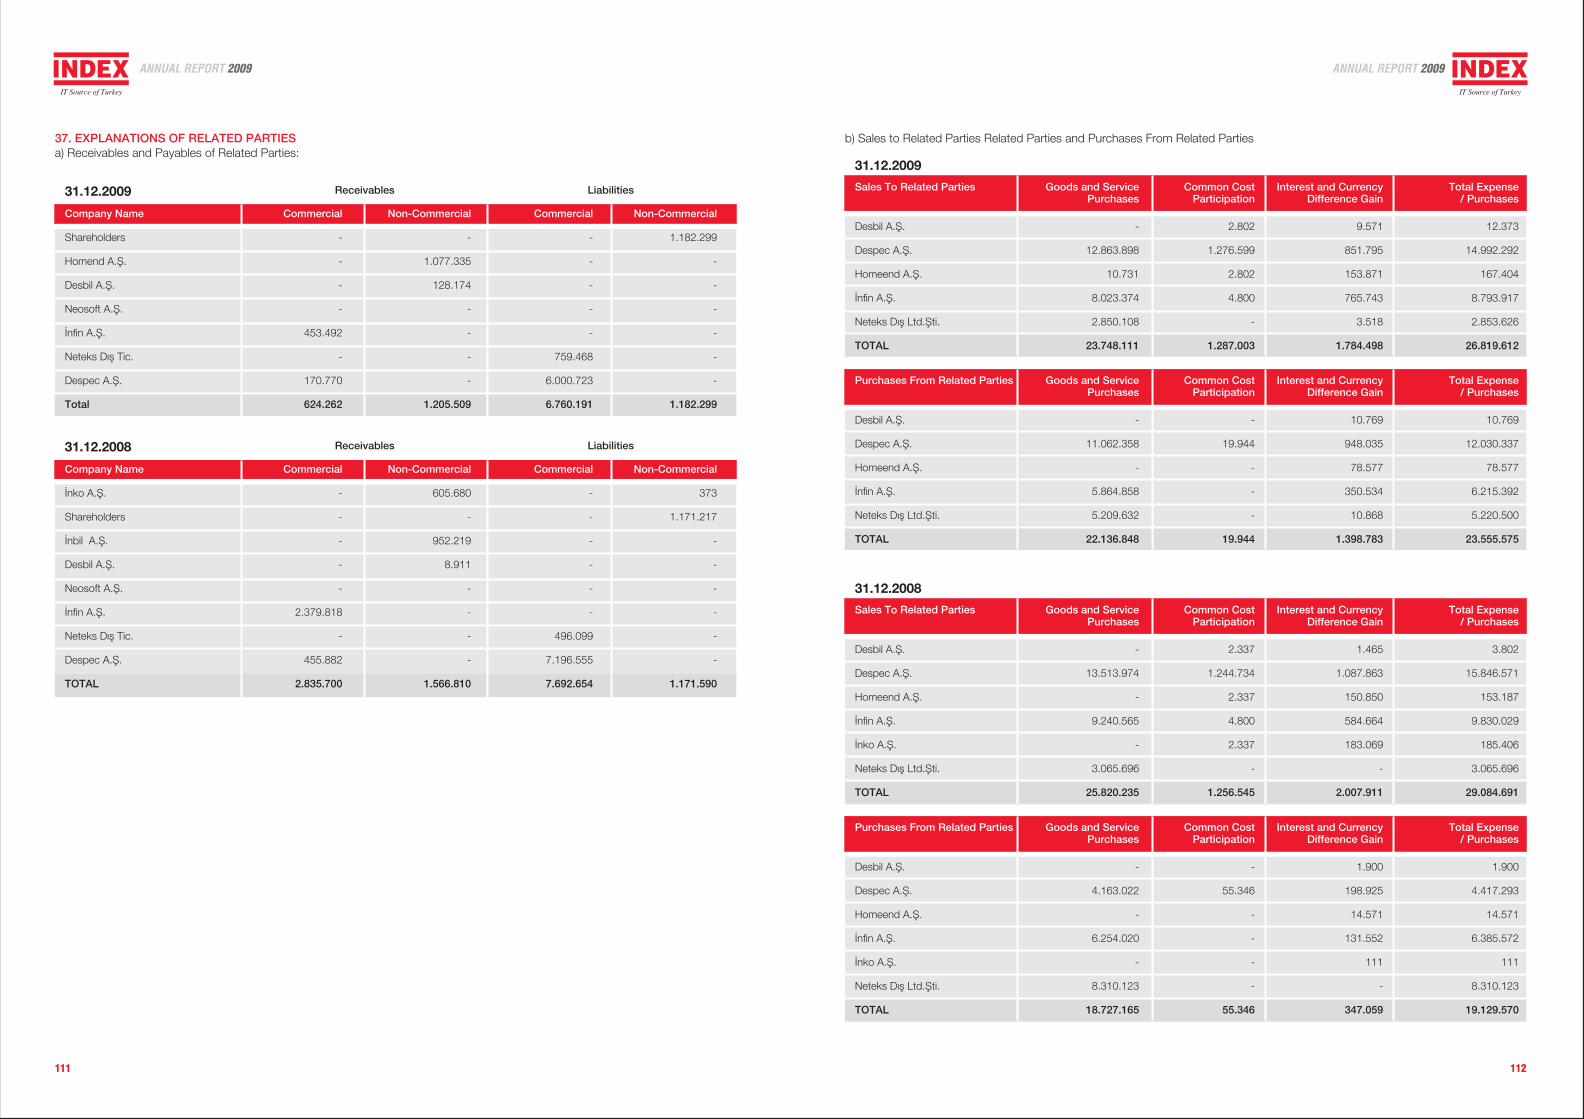
111 112
37. EXPLANATIONS OF RELATED PARTIESa) Receivables and Payables of Related Parties:
31.12.2009
Company Name Commercial Non-Commercial Commercial Non-Commercial
Shareholders - - - 1.182.299
Homend A.fi. - 1.077.335 - -
Desbil A.fi. - 128.174 - -
Neosoft A.fi. - - - -
‹nfin A.fi. 453.492 - - -
Neteks D›fl Tic. - - 759.468 -
Despec A.fi. 170.770 - 6.000.723 -
Total 624.262 1.205.509 6.760.191 1.182.299
Receivables Liabilities
31.12.2008
Company Name Commercial Non-Commercial Commercial Non-Commercial
‹nko A.fi. - 605.680 - 373
Shareholders - - - 1.171.217
‹nbil A.fi. - 952.219 - -
Desbil A.fi. - 8.911 - -
Neosoft A.fi. - - - -
‹nfin A.fi. 2.379.818 - - -
Neteks D›fl Tic. - - 496.099 -
Despec A.fi. 455.882 - 7.196.555 -
TOTAL 2.835.700 1.566.810 7.692.654 1.171.590
Receivables Liabilities
b) Sales to Related Parties Related Parties and Purchases From Related Parties
31.12.2009
Desbil A.fi. - 2.802 9.571 12.373
Despec A.fi. 12.863.898 1.276.599 851.795 14.992.292
Homeend A.fi. 10.731 2.802 153.871 167.404
‹nfin A.fi. 8.023.374 4.800 765.743 8.793.917
Neteks D›fl Ltd.fiti. 2.850.108 - 3.518 2.853.626
TOTAL 23.748.111 1.287.003 1.784.498 26.819.612
Sales To Related Parties Goods and Service Common Cost Interest and Currency Total ExpensePurchases Participation Difference Gain / Purchases
Desbil A.fi. - - 10.769 10.769
Despec A.fi. 11.062.358 19.944 948.035 12.030.337
Homeend A.fi. - - 78.577 78.577
‹nfin A.fi. 5.864.858 - 350.534 6.215.392
Neteks D›fl Ltd.fiti. 5.209.632 - 10.868 5.220.500
TOTAL 22.136.848 19.944 1.398.783 23.555.575
Purchases From Related Parties Goods and Service Common Cost Interest and Currency Total ExpensePurchases Participation Difference Gain / Purchases
31.12.2008
Desbil A.fi. - 2.337 1.465 3.802
Despec A.fi. 13.513.974 1.244.734 1.087.863 15.846.571
Homeend A.fi. - 2.337 150.850 153.187
‹nfin A.fi. 9.240.565 4.800 584.664 9.830.029
‹nko A.fi. - 2.337 183.069 185.406
Neteks D›fl Ltd.fiti. 3.065.696 - - 3.065.696
TOTAL 25.820.235 1.256.545 2.007.911 29.084.691
Sales To Related Parties Goods and Service Common Cost Interest and Currency Total ExpensePurchases Participation Difference Gain / Purchases
Desbil A.fi. - - 1.900 1.900
Despec A.fi. 4.163.022 55.346 198.925 4.417.293
Homeend A.fi. - - 14.571 14.571
‹nfin A.fi. 6.254.020 - 131.552 6.385.572
‹nko A.fi. - - 111 111
Neteks D›fl Ltd.fiti. 8.310.123 - - 8.310.123
TOTAL 18.727.165 55.346 347.059 19.129.570
Purchases From Related Parties Goods and Service Common Cost Interest and Currency Total ExpensePurchases Participation Difference Gain / Purchases
ANNUAL REPORT 2009 ANNUAL REPORT 2009

113 114
c) Benefits Provided to Managerial Staff :
38. THE CHARACTERISTICS AND LEVEL OF RISKS GROW OUT OF FINANCIAL INSTRUMENTS
(a) Capital risk management
The Group, while trying to maintain the continuity of its activities in capital management on one hand, aims to increase its profitabilityby using the balance between debts and resources on the other hand.
The capital structure of the Group consists of debts containing the credits explained in 8, cash and cash equivalents explained in 6and resource items containing respectively issued capital, capital reserves, profit reserves and profits of previous years explained in27.
Risks, associated with each capital class, and the capital cost are evaluated by the senior management. It is aimed that the capitalstructure will be stabilized by means of new borrowings or repaying the existing debts as well as dividend payments and new shareissuances based on the senior management evaluations.
The Group follows the capital by using debt/total capital rate. This rate is found by dividing the net debt by total capital. The net debtis calculated by excluding the cash and cash equivalent amounts from the total debt amount (including credits, leasing and commercialdebts as indicated in the balance sheet). Total capital is calculated as resources plus net debt as indicated in the balance sheet.
General strategy of the Group based on resources is not different from the previous years.
The Group is entering into hedging contracts (including derivative financial instruments) for the purpose of diversifying currency fluctuationrisks.
(b) Important Accounting Policies
Significant accounting policies of the Group relating to the financial instruments are stated in the foot 2.
(c) Risks
The Group, due to its activities, is exposed to changes in exchange rates (see article d) and interest rates (see article e), and otherrisks (article g). The Group, as it holds the financial instruments, also bears the risk of other party not meeting the requirements of theagreement. (Article h)
Market risks seen at the level of Group are measured according to the sensitivity analysis principle. The market risk of the Groupincurred during the current year or the method of handling the encountered risks or the method of measuring those risks are no differentfrom the previous year.
(d) Currency risk management
Transactions by foreign currency cause the formation of rate risks. The Group is exposed to rate risk due to the changes in exchangerates used for exchanging the assets and liabilities from foreign currency to New Turkish Lira. The rate risk evolves due to the commercialtransactions to be executed in the future and the difference between actives and passives of the recorded.
The Group is exposed to rate risk depending on the course of change of rate changes because it actually evaluates its accounts asforeign exchange deposits and has payables and receivables in foreign currency.
Account Name 31.12.2009 31.12.2008
Short-Term Benefits provided to Employees 1.882.189 1.945.241
Employment Termination Benefits - -
Other Long Term Benefits - -
Total 1.882.189 1.945.241In the event of 10% value change of US Dollar against TRL;
1- US Dollar Net Asset / Liability (5.727.877) 5.727.877 (5.727.877) 5.727.877
2- The part, protected from US Dollar Risk (-)
3- US Dollar Net Effect (1+2) (5.727.877) 5.727.877 (5.727.877) 5.727.877
Current Period
Foreign Exchange Rate Sensitivity Analysis Table
In the event of 10% value change of Avro against TRL;
4- Avro Net Asset / Liability (622.808) 622.808 (622.808) 622.808
5- The part, protected from Avro Risk (-)
6- Avro Net Effect (4+5) (622.808) 622.808 (622.808) 622.808
TOTAL (6.350.685) 6.350.685 (6.350.685) 6.350.685
Account Name
In the event of 10% value change of US Dollar against TRL;
1- US Dollar Net Asset / Liability (3.387.811) 3.387.811 (3.387.811) 3.387.811
2- The part, protected from US Dollar Risk (-)
3- US Dollar Net Effect (1+2) (3.387.811) 3.387.811 (3.387.811) 3.387.811
Profit / Loss Resource
Previous Period
Foreign Exchange Rate Sensitivity Analysis Table
In the event of 10% value change of Avro against TRL;
4- Avro Net Asset / Liability (374.337) 374.337 (374.337) 374.337
5- The part, protected from Avro Risk (-)
6- Avro Net Effect (4+5) (374.337) 374.337 (374.337) 374.337
TOTAL (3.762.148) 3.762.148 (3.762.148) 3.762.148
As of 31.12.2009, total amount of the commercial good inventories is TRL 134.601.338. A significant part of inventories are purchasedor imported priced at USD. As of 31.12.2008, total amount of the commercial good inventories is TRL 74.612.036. A significant partof inventories are purchased or imported priced at USD.
Account Name
Profit / Loss Resource
Rivaluation ofForeign Exchange
DevalutionOf Foreign Exchange
Rivaluation ofForeign Exchange
DevalutionOf Foreign Exchange
Rivaluation ofForeign Exchange
DevalutionOf Foreign Exchange
Rivaluation ofForeign Exchange
DevalutionOf Foreign Exchange
ANNUAL REPORT 2009 ANNUAL REPORT 2009
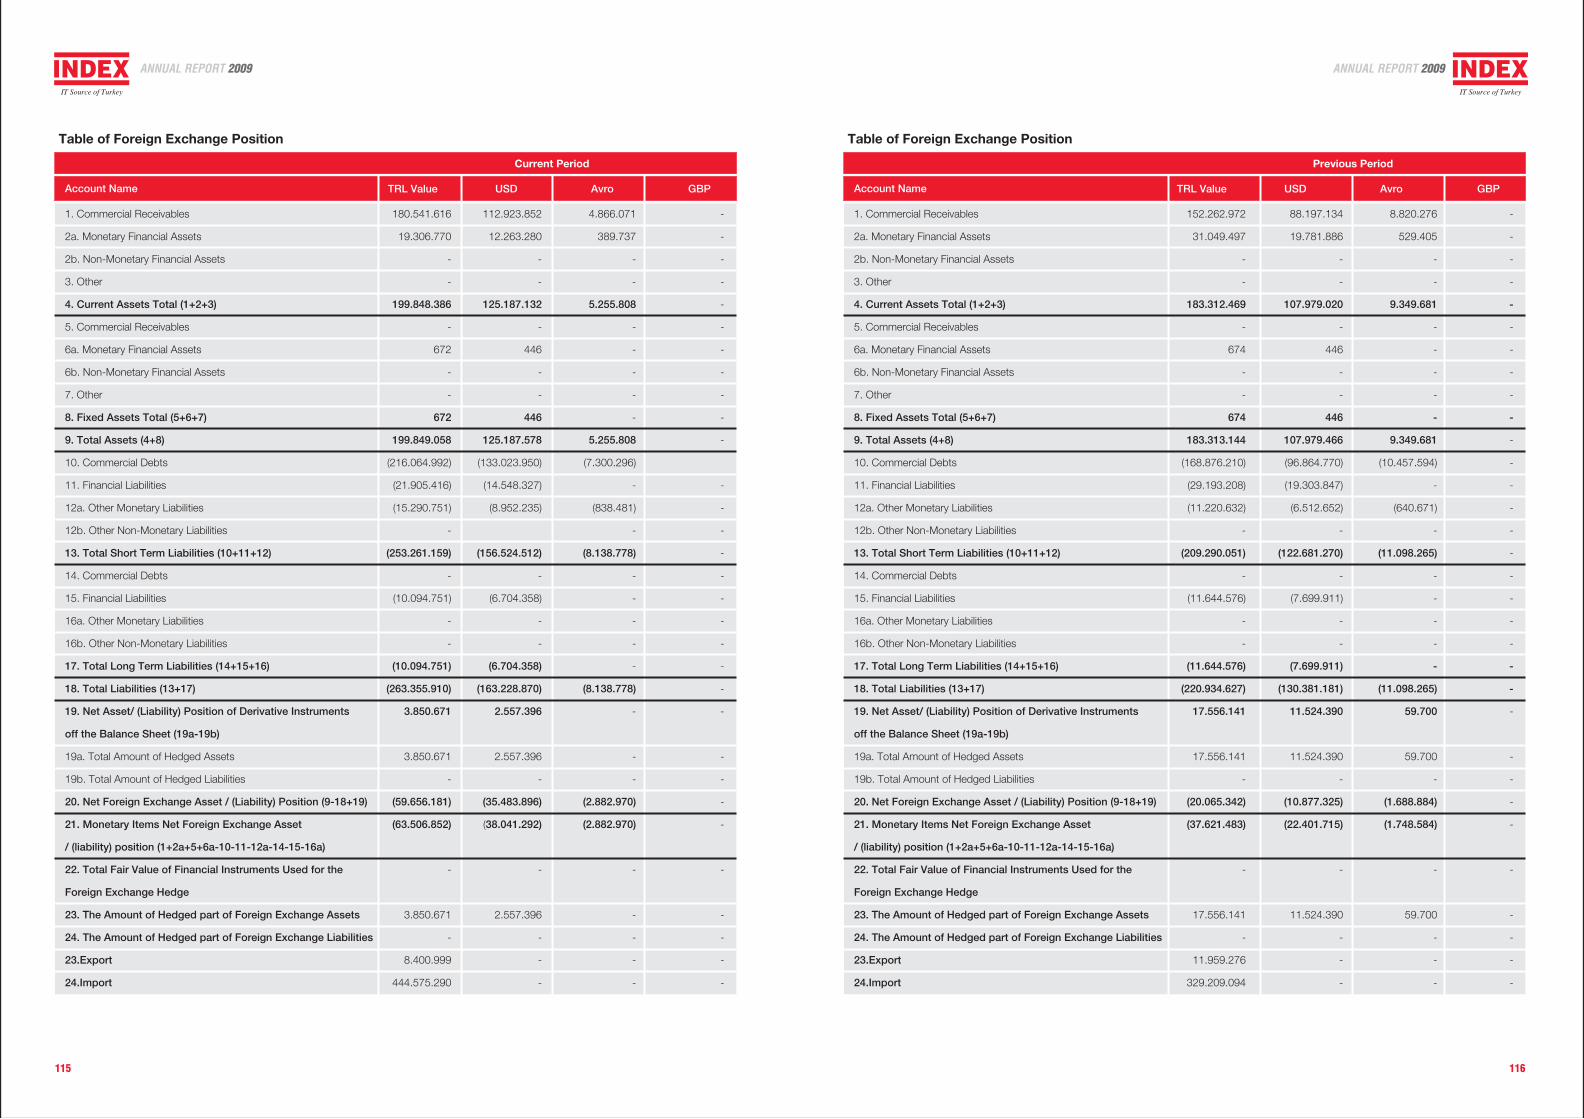
115 116
8.820.276
529.405
-
-
9.349.681
-
-
-
-
-
9.349.681
(10.457.594)
-
(640.671)
-
(11.098.265)
-
-
-
-
-
(11.098.265)
59.700
59.700
-
(1.688.884)
(1.748.584)
-
59.700
-
-
-
TRL Value USD Avro GBP
Previous Period
-
-
-
-
-
-
-
-
-
-
-
-
-
-
-
-
-
-
-
-
-
-
-
-
-
-
-
-
-
-
-
-
152.262.972
31.049.497
-
-
183.312.469
-
674
-
-
674
183.313.144
(168.876.210)
(29.193.208)
(11.220.632)
-
(209.290.051)
-
(11.644.576)
-
-
(11.644.576)
(220.934.627)
17.556.141
17.556.141
-
(20.065.342)
(37.621.483)
-
17.556.141
-
11.959.276
329.209.094
88.197.134
19.781.886
-
-
107.979.020
-
446
-
-
446
107.979.466
(96.864.770)
(19.303.847)
(6.512.652)
-
(122.681.270)
-
(7.699.911)
-
-
(7.699.911)
(130.381.181)
11.524.390
11.524.390
-
(10.877.325)
(22.401.715)
-
11.524.390
-
-
-
TRL Value USD Avro GBP
Current Period
Table of Foreign Exchange Position
Account Name
1. Commercial Receivables
2a. Monetary Financial Assets
2b. Non-Monetary Financial Assets
3. Other
4. Current Assets Total (1+2+3)
5. Commercial Receivables
6a. Monetary Financial Assets
6b. Non-Monetary Financial Assets
7. Other
8. Fixed Assets Total (5+6+7)
9. Total Assets (4+8)
10. Commercial Debts
11. Financial Liabilities
12a. Other Monetary Liabilities
12b. Other Non-Monetary Liabilities
13. Total Short Term Liabilities (10+11+12)
14. Commercial Debts
15. Financial Liabilities
16a. Other Monetary Liabilities
16b. Other Non-Monetary Liabilities
17. Total Long Term Liabilities (14+15+16)
18. Total Liabilities (13+17)
19. Net Asset/ (Liability) Position of Derivative Instruments
off the Balance Sheet (19a-19b)
19a. Total Amount of Hedged Assets
19b. Total Amount of Hedged Liabilities
20. Net Foreign Exchange Asset / (Liability) Position (9-18+19)
21. Monetary Items Net Foreign Exchange Asset
/ (liability) position (1+2a+5+6a-10-11-12a-14-15-16a)
22. Total Fair Value of Financial Instruments Used for the
Foreign Exchange Hedge
23. The Amount of Hedged part of Foreign Exchange Assets
24. The Amount of Hedged part of Foreign Exchange Liabilities
23.Export
24.Import
180.541.616
19.306.770
-
-
199.848.386
-
672
-
-
672
199.849.058
(216.064.992)
(21.905.416)
(15.290.751)
-
(253.261.159)
-
(10.094.751)
-
-
(10.094.751)
(263.355.910)
3.850.671
3.850.671
-
(59.656.181)
(63.506.852)
-
3.850.671
-
8.400.999
444.575.290
112.923.852
12.263.280
-
-
125.187.132
-
446
-
-
446
125.187.578
(133.023.950)
(14.548.327)
(8.952.235)
(156.524.512)
-
(6.704.358)
-
-
(6.704.358)
(163.228.870)
2.557.396
2.557.396
-
(35.483.896)
(38.041.292)
-
2.557.396
-
-
-
4.866.071
389.737
-
-
5.255.808
-
-
-
-
-
5.255.808
(7.300.296)
-
(838.481)
-
(8.138.778)
-
-
-
-
-
(8.138.778)
-
-
-
(2.882.970)
(2.882.970)
-
-
-
-
-
-
-
-
-
-
-
-
-
-
-
-
-
-
-
-
-
-
-
-
-
-
-
-
-
-
-
-
-
-
-
-
Account Name
Table of Foreign Exchange Position
1. Commercial Receivables
2a. Monetary Financial Assets
2b. Non-Monetary Financial Assets
3. Other
4. Current Assets Total (1+2+3)
5. Commercial Receivables
6a. Monetary Financial Assets
6b. Non-Monetary Financial Assets
7. Other
8. Fixed Assets Total (5+6+7)
9. Total Assets (4+8)
10. Commercial Debts
11. Financial Liabilities
12a. Other Monetary Liabilities
12b. Other Non-Monetary Liabilities
13. Total Short Term Liabilities (10+11+12)
14. Commercial Debts
15. Financial Liabilities
16a. Other Monetary Liabilities
16b. Other Non-Monetary Liabilities
17. Total Long Term Liabilities (14+15+16)
18. Total Liabilities (13+17)
19. Net Asset/ (Liability) Position of Derivative Instruments
off the Balance Sheet (19a-19b)
19a. Total Amount of Hedged Assets
19b. Total Amount of Hedged Liabilities
20. Net Foreign Exchange Asset / (Liability) Position (9-18+19)
21. Monetary Items Net Foreign Exchange Asset
/ (liability) position (1+2a+5+6a-10-11-12a-14-15-16a)
22. Total Fair Value of Financial Instruments Used for the
Foreign Exchange Hedge
23. The Amount of Hedged part of Foreign Exchange Assets
24. The Amount of Hedged part of Foreign Exchange Liabilities
23.Export
24.Import
ANNUAL REPORT 2009 ANNUAL REPORT 2009
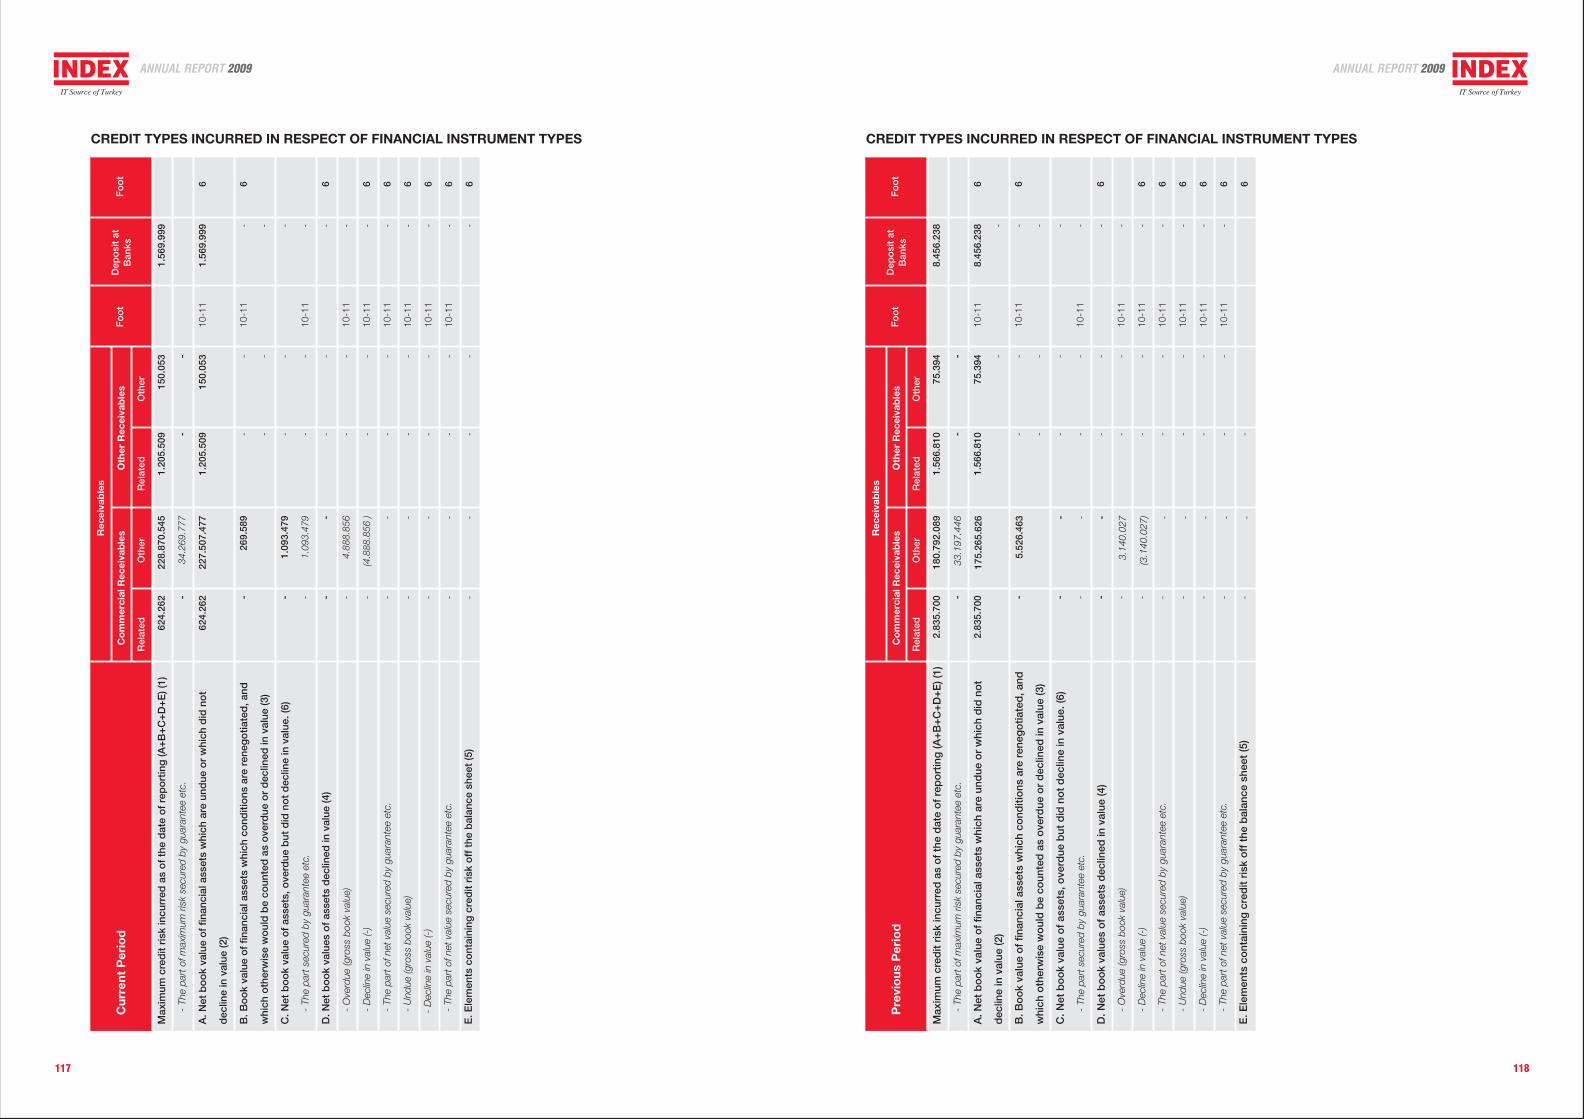
117 118
CREDIT TYPES INCURRED IN RESPECT OF FINANCIAL INSTRUMENT TYPES CREDIT TYPES INCURRED IN RESPECT OF FINANCIAL INSTRUMENT TYPESR
elat
edO
ther
Rel
ated
Oth
er
Rec
eiva
ble
s
Co
mm
erci
al R
ecei
vab
les
Oth
er R
ecei
vab
les
Fo
ot
Dep
osi
t at
Ban
ksF
oo
tC
urre
nt P
erio
d
Max
imum
cre
dit
risk
incu
rred
as
of
the
dat
e o
f re
po
rtin
g (A
+B
+C
+D
+E
) (1)
-
The
part
of m
axim
um r
isk
secu
red
by g
uara
ntee
etc
.
A. N
et b
oo
k va
lue
of
finan
cial
ass
ets
whi
ch a
re u
ndue
or
whi
ch d
id n
ot
dec
line
in v
alue
(2)
B. B
oo
k va
lue
of
finan
cial
ass
ets
whi
ch c
ond
itio
ns a
re r
eneg
otia
ted
, and
whi
ch o
ther
wis
e w
oul
d b
e co
unte
d a
s o
verd
ue o
r d
eclin
ed in
val
ue (3
)
C. N
et b
oo
k va
lue
of
asse
ts, o
verd
ue b
ut d
id n
ot
dec
line
in v
alue
. (6)
-
The
part
sec
ured
by
guar
ante
e et
c.
D. N
et b
oo
k va
lues
of
asse
ts d
eclin
ed in
val
ue (4
)
-
Ove
rdue
(gro
ss b
ook
valu
e)
-
Dec
line
in v
alue
(-)
-
The
par
t of n
et v
alue
sec
ured
by
guar
ante
e et
c.
-
Und
ue (g
ross
boo
k va
lue)
-
Dec
line
in v
alue
(-)
-
The
par
t of n
et v
alue
sec
ured
by
guar
ante
e et
c.
E. E
lem
ents
co
ntai
ning
cre
dit
risk
off
the
bal
ance
she
et (5
)
624.
262 -
624.
262
- -
-
- - - -
- - - -
228.
870.
545
34.2
69.7
77
227.
507.
477
269.
589
1.09
3.47
9
1.09
3.47
9 -
4.88
8.85
6
(4.8
88.8
56 ) - - - -
-
1.20
5.50
9 -
1.20
5.50
9 -
-
- - -
- - - - - - -
150.
053 -
150.
053 -
-
- - -
- - - - - - -
� �
10-1
1
10-1
1
10-1
1
10-1
1
10-1
1
10-1
1
10-1
1
10-1
1
10-1
1
1.56
9.99
9 �
1.56
9.99
9 -
-
- - - - - - -
- - -
6 6 6 6 6 6 6 6 6
ANNUAL REPORT 2009 ANNUAL REPORT 2009
Rel
ated
Oth
erR
elat
edO
ther
Rec
eiva
ble
s
Co
mm
erci
al R
ecei
vab
les
Oth
er R
ecei
vab
les
Fo
ot
Dep
osi
t at
Ban
ksF
oo
tP
revi
ous
Per
iod
2.83
5.70
0 -
2.83
5.70
0
- -
-
- - - -
- - - -
180.
792.
089
33.1
97.4
46
175.
265.
626
5.52
6.46
3 - - -
3.14
0.02
7
(3.1
40.0
27) - - - -
-
1.56
6.81
0 -
1.56
6.81
0 -
-
- - -
- - - - - - -
75.3
94
-
75.3
94
-
-
- - -
- - - - - - -
� �
10-1
1
10-1
1
10-1
1
10-1
1
10-1
1
10-1
1
10-1
1
10-1
1
10-1
1
8.4
56.2
38
�
8.45
6.23
8 -
-
- - - - - - -
- - -
Max
imum
cre
dit
risk
incu
rred
as
of
the
dat
e o
f re
po
rtin
g (A
+B
+C
+D
+E
) (1)
-
The
part
of m
axim
um r
isk
secu
red
by g
uara
ntee
etc
.
A. N
et b
oo
k va
lue
of
finan
cial
ass
ets
whi
ch a
re u
ndue
or
whi
ch d
id n
ot
dec
line
in v
alue
(2)
B. B
oo
k va
lue
of
finan
cial
ass
ets
whi
ch c
ond
itio
ns a
re r
eneg
otia
ted
, and
whi
ch o
ther
wis
e w
oul
d b
e co
unte
d a
s o
verd
ue o
r d
eclin
ed in
val
ue (3
)
C. N
et b
oo
k va
lue
of
asse
ts, o
verd
ue b
ut d
id n
ot
dec
line
in v
alue
. (6)
-
The
part
sec
ured
by
guar
ante
e et
c.
D. N
et b
oo
k va
lues
of
asse
ts d
eclin
ed in
val
ue (4
)
-
Ove
rdue
(gro
ss b
ook
valu
e)
-
Dec
line
in v
alue
(-)
-
The
par
t of n
et v
alue
sec
ured
by
guar
ante
e et
c.
-
Und
ue (g
ross
boo
k va
lue)
-
Dec
line
in v
alue
(-)
-
The
par
t of n
et v
alue
sec
ured
by
guar
ante
e et
c.
E. E
lem
ents
co
ntai
ning
cre
dit
risk
off
the
bal
ance
she
et (5
)
6 6 6 6 6 6 6 6 6
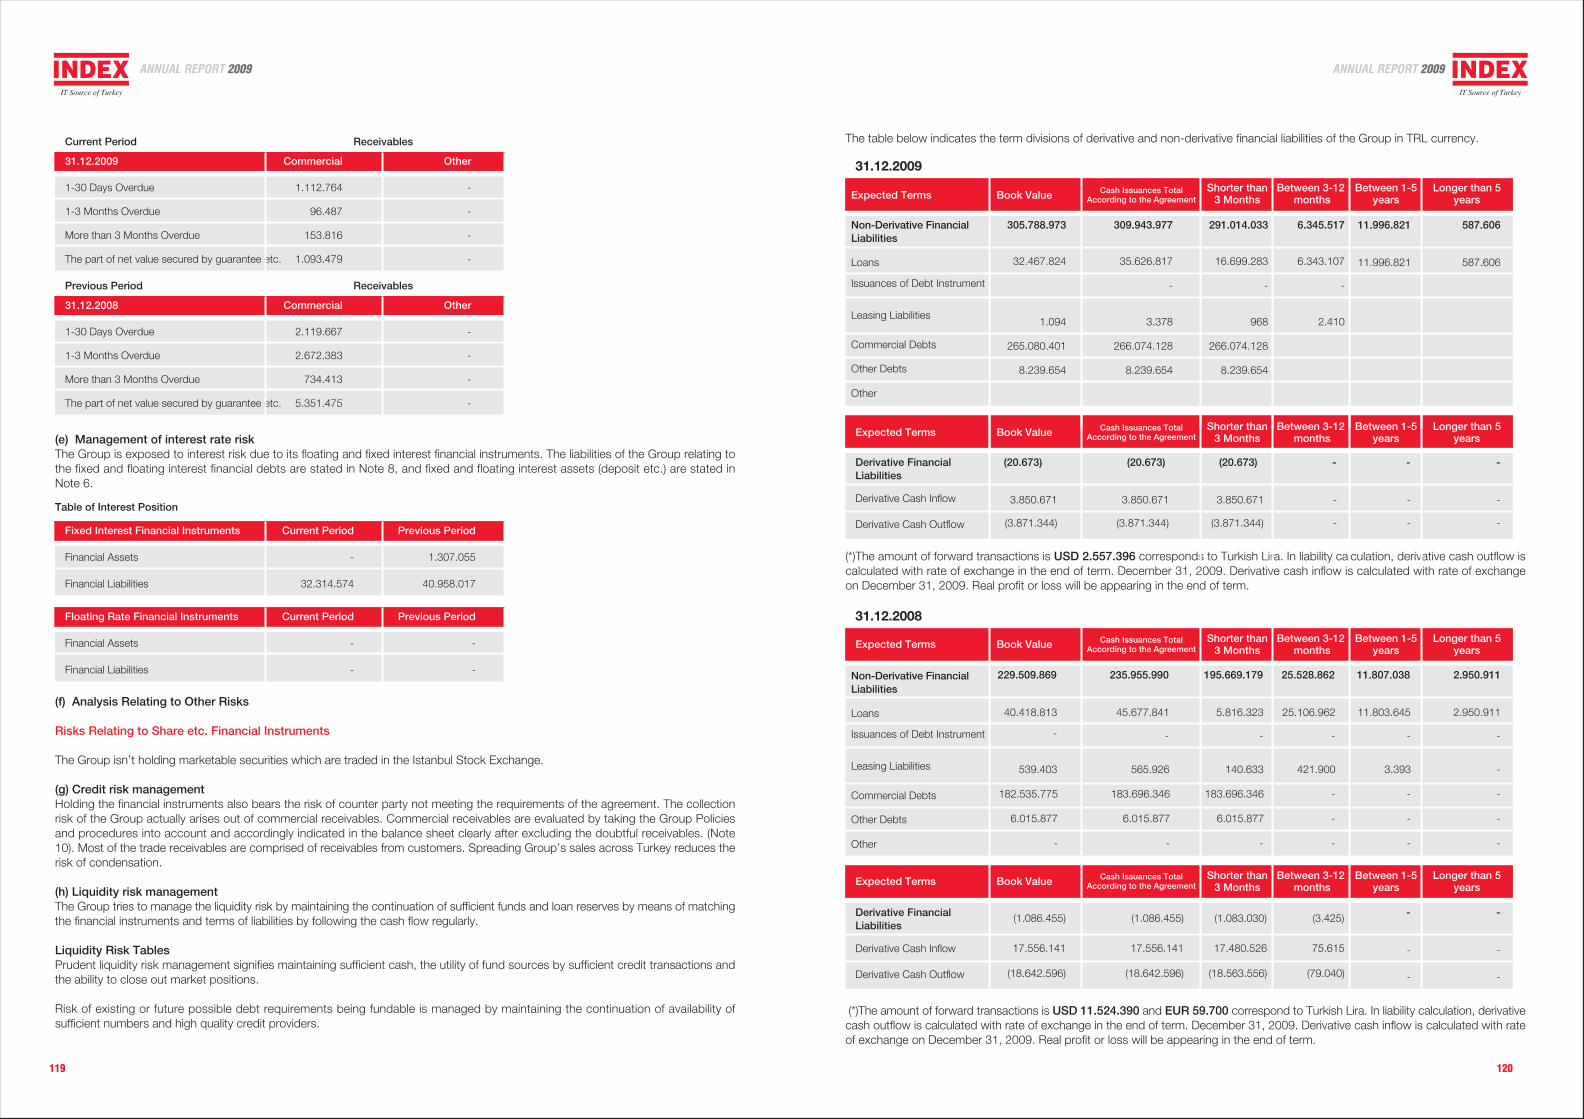
119 120
Commercial Other
1-30 Days Overdue 1.112.764 -
1-3 Months Overdue 96.487 -
More than 3 Months Overdue 153.816 -
The part of net value secured by guarantee etc. 1.093.479 -
(e) Management of interest rate riskThe Group is exposed to interest risk due to its floating and fixed interest financial instruments. The liabilities of the Group relating tothe fixed and floating interest financial debts are stated in Note 8, and fixed and floating interest assets (deposit etc.) are stated inNote 6.
Fixed Interest Financial Instruments Current Period Previous Period
Financial Assets - 1.307.055
Financial Liabilities 32.314.574 40.958.017
Table of Interest Position
Floating Rate Financial Instruments Current Period Previous Period
Financial Assets - -
Financial Liabilities - -
(f) Analysis Relating to Other Risks
Risks Relating to Share etc. Financial Instruments
The Group isn’t holding marketable securities which are traded in the Istanbul Stock Exchange.
(g) Credit risk managementHolding the financial instruments also bears the risk of counter party not meeting the requirements of the agreement. The collectionrisk of the Group actually arises out of commercial receivables. Commercial receivables are evaluated by taking the Group Policiesand procedures into account and accordingly indicated in the balance sheet clearly after excluding the doubtful receivables. (Note10). Most of the trade receivables are comprised of receivables from customers. Spreading Group’s sales across Turkey reduces therisk of condensation.
(h) Liquidity risk managementThe Group tries to manage the liquidity risk by maintaining the continuation of sufficient funds and loan reserves by means of matchingthe financial instruments and terms of liabilities by following the cash flow regularly.
Liquidity Risk TablesPrudent liquidity risk management signifies maintaining sufficient cash, the utility of fund sources by sufficient credit transactions andthe ability to close out market positions.
Risk of existing or future possible debt requirements being fundable is managed by maintaining the continuation of availability ofsufficient numbers and high quality credit providers.
31.12.2009
The table below indicates the term divisions of derivative and non-derivative financial liabilities of the Group in TRL currency.
(*)The amount of forward transactions is USD 2.557.396 corresponds to Turkish Lira. In liability calculation, derivative cash outflow iscalculated with rate of exchange in the end of term. December 31, 2009. Derivative cash inflow is calculated with rate of exchangeon December 31, 2009. Real profit or loss will be appearing in the end of term.
Shorter than3 Months
Between 3-12 months
Between 1-5yearsBook ValueExpected Terms
11.996.821
Longer than 5years
587.606
11.996.821 587.606
Non-Derivative FinancialLiabilities
Loans
Leasing Liabilities
Commercial Debts
Other Debts
Other
Issuances of Debt Instrument
(20.673) (20.673)Derivative FinancialLiabilities
(20.673) - -
Derivative Cash Inflow 3.850.671 3.850.6713.850.671
Derivative Cash Outflow
31.12.2009
(3.871.344) (3.871.344)(3.871.344)
- -
- -
305.788.973
32.467.824
1.094
265.080.401
8.239.654
309.943.977
35.626.817
-
3.378
266.074.128
8.239.654
291.014.033
16.699.283
-
968
266.074.128
8.239.654
6.345.517
6.343.107
-
2.410
-
-
-
235.955.990 195.669.179 25.528.862229.509.869 11.807.038 2.950.911
45.677.841 5.816.323 25.106.96240.418.813 11.803.645 2.950.911
565.926 140.633 421.900539.403 3.393
-
183.696.346 183.696.346182.535.775
6.015.877 6.015.8776.015.877
-
- -
31.12.2008
- -
-
--
- --
- --
- ---
- -
- -
-
-
17.556.141
(1.086.455)
(18.642.596)
17.556.141
(1.086.455)
(18.642.596)
17.480.526
(1.083.030)
(18.563.556)
75.615
(3.425)
(79.040)
(*)The amount of forward transactions is USD 11.524.390 and EUR 59.700 correspond to Turkish Lira. In liability calculation, derivativecash outflow is calculated with rate of exchange in the end of term. December 31, 2009. Derivative cash inflow is calculated with rateof exchange on December 31, 2009. Real profit or loss will be appearing in the end of term.
Current Period Receivables
Commercial Other
1-30 Days Overdue 2.119.667 -
1-3 Months Overdue 2.672.383 -
More than 3 Months Overdue 734.413 -
The part of net value secured by guarantee etc. 5.351.475 -
31.12.2008
Previous Period Receivables
Shorter than3 Months
Between 3-12 months
Between 1-5yearsBook ValueExpected Terms
Cash Issuances TotalAccording to the Agreement
Shorter than3 Months
Between 3-12 months
Between 1-5yearsBook ValueExpected Terms
Shorter than3 Months
Between 3-12 months
Between 1-5yearsBook ValueExpected Terms
Non-Derivative FinancialLiabilities
Loans
Leasing Liabilities
Commercial Debts
Other Debts
Other
Issuances of Debt Instrument
Derivative FinancialLiabilities
Derivative Cash Inflow
Derivative Cash Outflow
ANNUAL REPORT 2009 ANNUAL REPORT 2009
Longer than 5years
Longer than 5years
Longer than 5years
Cash Issuances TotalAccording to the Agreement
Cash Issuances TotalAccording to the Agreement
Cash Issuances TotalAccording to the Agreement
121
39. FINANCIAL INSTRUMENTS (EXPLANATION OF FAIR VALUE AND EXPLANATION REGARDING ACCOUNTANCY FORGETTING PROTECTED FORM THE RISK)
The Group considers that the recorded values of financial instruments reflect the fair values.
Aims at financial risk management
The finance department of the Group is responsible for maintaining the access to financial markets regularly and observing and managingthe financial risks incurred in relation with the activities of the Group. The said risks include market risk (including foreign exchangerisk, fair interest rate risk and price risk), credit risk, liquidity risk and cash receiving risk.
The Group uses the forward exchange agreements out of derivative financial instruments for the purpose of decreasing the effects ofthese risks and being protected from financial risk against the same. The Group has no speculative financial instruments (includingderivative financial instruments) and does not involve in any activity relating to the sale or purchase of such instruments.
40. EVENTS AFTER THE DATE OF BALANCE SHEET
None.
41. OTHER ISSUES THAT MAY AFFECT THE FINANCIAL SHEETS IN IMPORTANT LEVEL OR THE ISSUES THAT MAY AFFECTTHE FINANCIAL SHEETS IN TERMS OF UNDERSTANDING, EVALUATING AND VIEWING
None.
ANNUAL REPORT 2009