Briefing the functioning of HMWS&SB - CNet.AT HMWSSB.pdf · 2003-11-25 · SALIENT FEATURES OF...
53
Briefing on the functioning of HMWS&SB To Our Partners from The City of Venice & The City of Modling
Transcript of Briefing the functioning of HMWS&SB - CNet.AT HMWSSB.pdf · 2003-11-25 · SALIENT FEATURES OF...
Briefing on
the functioning of HMWS&SB
To
Our Partners from
The City of Venice &The City of Modling

HMWSSB-EvolutionWater Works Department,Govt. of Andhra Pradesh
Municipal Corporation of Hyderabad
SewerageWater Supply
Hyderabad MetropolitanWater Supply and Sewerage
Board
1987 Transferred with staff
Constituted on 1 Nov 1989 under the Hyderabad Metropolitan Water
Supply & Sewerage Act 1989
1 November 1989
HMWSSB
Goals
– Access to Water Supply• To provide access to safe and adequate drinking
water to 100% of the projected population of the Hyderabad Metropolitan Area.
– Access to Sewerage• 100% coverage• 100% sewerage treatment to 30 BOD

Access Modes of WS
100 100
56
21
49
85
0 0
19
39
32
80 0
2550
197
0%10%20%30%40%50%60%70%80%90%
100%
N.America Europe L.America Africa Asia Hyderabad
HouseHold Conns Other Access No Access
Global Water supply and Sanitation Coverage Report 2000, WHO

HMWSSB
Hyderabad Population projections (in Millions)
2.774
4.3495.533
8.191
10.153
0
2
4
6
8
10
12
1981 1991 2001 2011 2021
3.16% per Annum
Census
TCE Projections
The Decadal Growth rate as per 2001 census for Hyderabad city is13.8% whereas it is 72% for LB Nagar and 112% for Qutbullapur
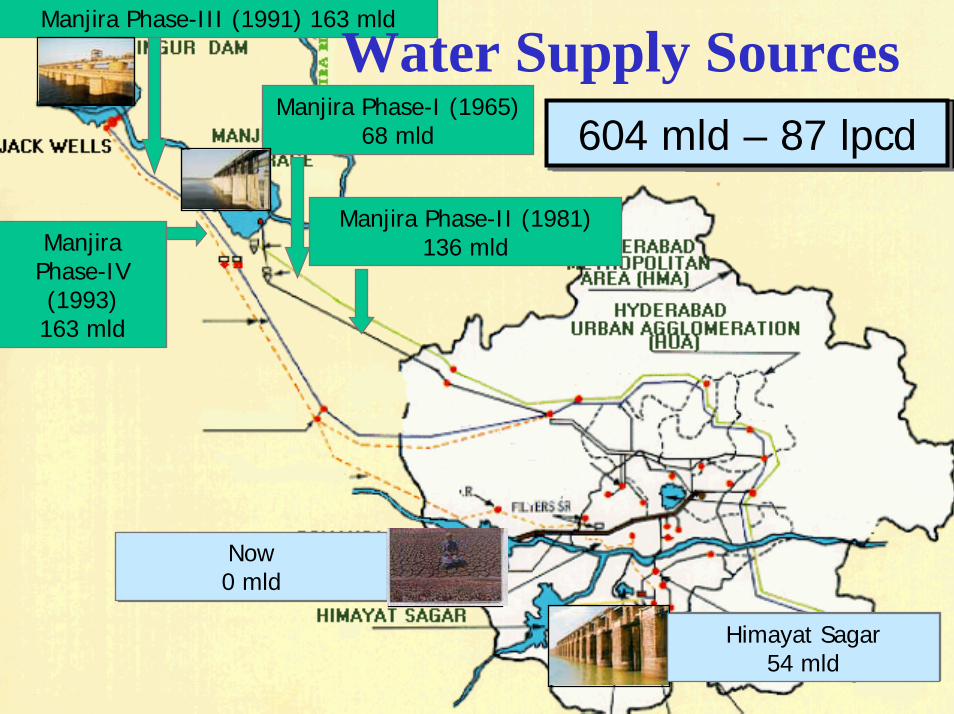
Osman Sagar (1920)123 mld
Himayat Sagar (1927)82 mld
Manjira Phase-II (1981)136 mld
Manjira Phase-I (1965)68 mld
Manjira Phase-III (1991) 163 mld
Manjira Phase-IV (1993)163 mld
Water Supply Sources123 mld123 mld204 mld204 mld272 mld272 mld409 mld409 mld572 mld572 mld735 mld – 114 lpcd735 mld – 114 lpcd
Now0 mld
Himayat Sagar 54 mld
604 mld – 87 lpcd604 mld – 87 lpcd

Demand and Supply ImmediateHMWSSB
0
50
100
150
200
250
300
350
MG
D
PresentCapacity 153 162 162 162 162 162GroundWater 25 25 25 25 25 25Demand 230 240 250 260 275 290
2001 2002 2003 2004 2005 2006

HMWSSB
Demand and Supply
050
100150200250300350400450
MG
D
PresentSupply 153 162 162 162 162
GroundWater 25 25 25 25 25
Demand 230 290 328 360 400
2001 2006 2011 2016 2021

Supply Mix HMWSSB
145Total Water Drawn
4833.2%Unaccounted Water(Break-up for 17 MGD yet to be Calculated)
97100%Total
2223%Non-domestic
2930%Domestic - Bulk
4040%Domestic - Individual
77%Free Water (6600)
MGD%

HMWSSB
Unaccounted For Water
Revenue Losses
Physical Losses
145100.0%Water Drawn
4329.7%Total
4833.2%Total
53.5%Total non revenue water in the 3 municipalities taken over
1510.2%
85.5%Distribution Losses
2014.0%Transmission Losses
MCH
MGD%Details
Break-up for 145 MGD only

UFW-Asian Cities HMWSSB
Hyderabad is one of the very few cities which has reliable UFW accounting. UFW figures in many other cases are estimates. In some cases are only estimated physical losses, without real reconciliation of water drawn and billed
Mandalay, Lee, PhnomPenh, Honoi, RarotongaAbove 60%
Dhaka, Jakarta, Khatmandu, Nuku, Biankek, suva, Bandung, Ulaanbatav, Apis
50%-60%
Lahore, Manila, Calcutta, 40%-50%
Karchi, Ulssah, Hochiminh, Seol, Colombo, Kulalumpur, Hongkong, Bangkok, Faislabad, Devao, Vientine, Chittagong, Chaingmai, Thimpu, Chonburi, Honaira, Cebu
30%-40%
Johar Bahru, Delhi, Taipei, Medan, Penang, PortVila20%-30%
Shanghai, Mumbai, Chennai, Mali, Tianjin, Almaty, Tashkent10%-20%Singapore, Beijing5% - 10%
CitiesUFW %
HMWSSB
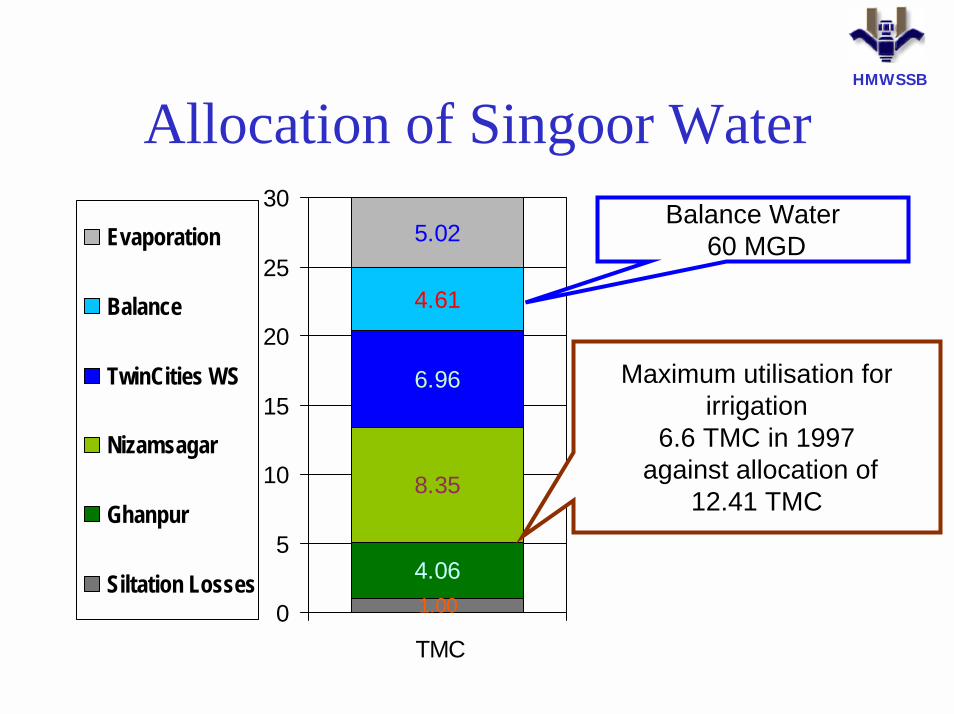
Allocation of Singoor Water
8.35
6.96
4.61
5.02
1.00
4.06
0
5
10
15
20
25
30
TMC
Evaporation
Balance
TwinCities WS
Nizamsagar
Ghanpur
Siltation Losses
Balance Water60 MGD
Maximum utilisation for irrigation
6.6 TMC in 1997against allocation of
12.41 TMC

!"#$ &'() *$+ ,'- !.(!(&#" ,( /.#) #//*,*($#" 01 2+/ 3.(2 &*$+4. /#25(2!($-$, 6 *
/#,- (3 3*.&, /.#) $
/#,- (3 54..-$, 4!/#,*($
'7/-.#8#/ 2-,.(!("*,#$ ) #,-. &4!!"7 #$/ &-) -.#+- 8(#./
5-$,.#" /-&*+$ 5-""
9: 6 90 6 0111
9: 6 90 6 0111
Phase III
Phase IV
COMPONENT – I MAP

Access to poor –slum improvement project
HMWSSB
• Government approved a project to provide drinking water and sewerage network in slums at a cost of Rs 54 Crores to be implemented in 2 years
• 596 works executed at a cost of Rs 30.75 crores• 228 Slums were provided with Water Supply
and 322 slums with improved sewerage network

Sewerage Network
822 Kms1087 KmsLaterals (300 mm diameter and below)
3
423 Kms572 KmsTrunk Sewers, Main Sewers, Branch Sewers (above 300 mm diameter)
2
1323113 +20Sewage Treatment Plant (MLD)1
Required as per Master
Plan
ExistingFacilitiesS.No
Approximate Cost Rs 4000 Crores

Hussain SagarHussain SagarK&S MainK&S Main
DuplicateK&S MainDuplicateK&S Main
Existing Sewer Mains

Hussain SagarHussain SagarSewer Main completed last
Duplicate A - MainDuplicate A - Main

Picket DrainPicket Drain
Industrial effluents through Kukatpally Drain
Industrial effluents through Kukatpally Drain
Yousufguda DrainYousufguda Drain
Banjara DrainBanjara Drain
Balkapur DrainBalkapur Drain
Sources of Pollution
Hussain SagarHussain Sagar

STP
Hussain SagarHussain SagarDiversion of sewage
and effluents into the Sewer Mains

STP
Hussain SagarHussain SagarDiversion of sewage
and effluents into the Sewer Mains

Aeration Tank Inlet Units
Settling Tank Flow Indicator

Hussain Sagar STP in Action

HMWSSB
The Krishna Water
• Cabinet Approval vide G.O.Ms No 559. M.A Dated 23rd November 2001
• Approved method of funding– GOAPs Contribution - Rs 300 Crores– Term loans/Bonds - Rs 700 Crores
• Project implementation period 2½ years– Now crashed to 1½ years– Expected to be completed by March 2004

" ( 5 # , *( $ !" # $; . *& ' $ # ) # , -. & 4 !!" 7 !. ( ☺-5 ,
' 7 / -. # 8 # / 2 -, . ( !( " *, # $ ) # , -. & 4 !!" 7 = & -) -. # + - 8 ( # . /
"( 5 # , *( $ !" # $ ( 3 !. ( ☺-5 , # . -#
C E N T R A L D E S I G N C E L LD A T E O F F I R S T D R A W ND A T E O F C U R R E N T U P D A T I O N
H Y D E R A B A D M E T R O P O L I T A N W A T E R S U P P L Y A N D S E W E R A G E B O A R D
1 6 - 0 4 - 2 0 0 11 0 - 1 1 - 2 0 0 0
>& " 8 5 # & & ( 4 . 5 -?
Sunikesula
Head 405.5 Mts

Status• Pipeline works
• Tenders received• 25% to 29% less (Saving Rs.110 Crores)• Works to commence shortly
• Water Treatment Plant• Tenders received• -20.16% for part 1 & +11.9% for part 2 (saving 4.6 crores)
• Enroute Reservoirs• Tenders received• +2% for 1 and -8.25% to 12.81% for others (saving 2.12 crores)
• Pumping Equipment• Tenders due

Abatement of Pollution to river Musi
HMWSSB
• Assistance under NRCAP• Detailed Project Report –Rs.344 Crores• 70% assistance from GOI• Balance from beneficiaries• Sewerage cess to be enhanced to meet
O&M cost

SALIENT FEATURES OF CONSERVATION OF
RIVER MUSI PROJECT.
•Interception and Diversion of dry weather flow from the existing 18 storm water drains joining River Musi in the city area on either side.
•Interception and Diversion structures with screens and grid chambers.
•Conveying mains of 33 Kms., to transmit the DWF from the I&D works to the proposed STPs.
•Sewage Treatment Plants at 5 places to treat expected flows by 2005 of 592 Mld.
Amberet - 339 MldJiaguda - 21 Mld
Nagole - 172 MldNallacheruvu - 30 MldNandimusalaiguda - 30 Mld
Total - 592 Mld

Rain Water Harvesting
HMWSSB

Past Performance
25.1335.25
43.6053.79
59.6364.46
80.56
106.24 110.59120.10
125.00 127.30
0
20
40
60
80
100
120
140
160
180
200
90-91 91-92 92-93 93-94 94-95 95-96 96-97 97-98 98-99 99-00 00-01 01-02
Rs. C
rore
s
Debt ServiceDepreciationChemicalsOpns & MtceStaffPowerRevenue

Financial Projections
0
50
100
150
200
250
300
350
400
450
2002-03 2003-04 2004-05 2005-06 2006-07 2007-08 2008-09
Year
Rs.
Cro
res
DebtServiceDepreciationMaintenanceStaffPowerSales

Non-domestic Tariffs in Metros
0
10
20
30
40
50
60
70
Rs.
per
KL
Rs. Per KL 60 40 35 25
Bangalore Chennai Mumbai Hyderabad
Chennai and Mumbai have large captive non-domestic consumptions

Domestic Slab Rates in Metros
0
20
40
60
80
100
120
Rs.
per
Mon
th
Rs per Mth 100 90 90 50 30
AP Mun Corpns
Hyderabad Bangalore Chennai Mumbai
Chennai : Additional 7% water & sew tax on annual rental value

Domestic Tariff - Metros
25.0036.0025.00Above 20025.0030.0010.0050-20025.0012.0010.0030-5025.0012.006.0025-3015.008.006.0015-2510.006.006.0010-152.506.006.000-10
509090MinimumChennaiBangaloreHyderabadSlab (KLPM)

Board Total
0
20,000,000
40,000,000
60,000,000
80,000,000
100,000,000
120,000,000
140,000,000
160,000,000
180,000,000
200,000,000
Apr-99
Jun-9
9Aug-9
9Oct-
99Dec-9
9Feb
-00Apr-
00Ju
n-00Aug
-00Oct-
00Dec-0
0Feb
-01Apr-
01Ju
n-01Aug
-01Oct-
01Dec
-01Feb
-02Apr-0
2Ju
n-02Aug
-02Oct-
02Dec
-02Feb
-03
Collections in the Month(Rs)
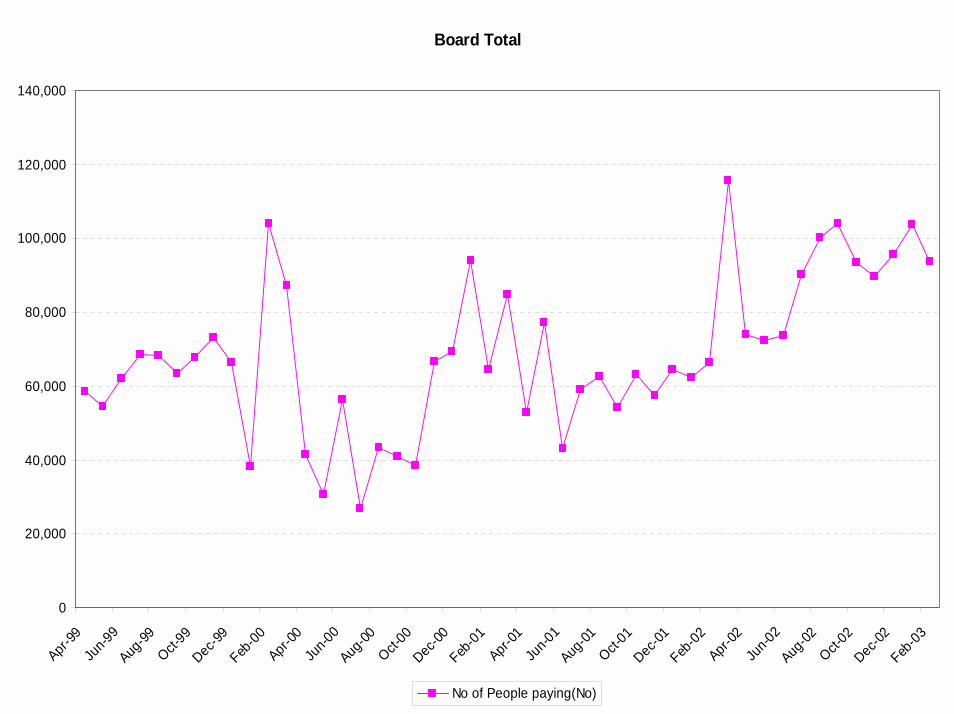
Board Total
0
20,000
40,000
60,000
80,000
100,000
120,000
140,000
Apr-99
Jun-99
Aug-99
Oct-99
Dec-99
Feb-00
Apr-00
Jun-00
Aug-00Oct-
00Dec-0
0Feb
-01Apr-
01Ju
n-01Aug
-01Oct-
01Dec-0
1Feb
-02Apr-0
2Ju
n-02Aug-02Oct-
02Dec-0
2Feb
-03
No of People paying(No)

Customer Care InitiativesHMWSSB
• Citizen’s Charter
• MCC 1916
• SWC
• Revenue MIS
• Lok Adalat
• MSTC
•Monitoring Indicators

Complaint wise Redressal EfficiencyFrom 01-02-1999 to 04-03-2003
• 93.2%• 83.3%• 74.6%• 65.9%• 64.3%• 63.1%• 59.2%• 58.9%• 58.2%• 56.1%• 53.4%
• Septic Tank Clearing• Changing of line requested• Cleaning & Maintenance of meters• Meter repairs & Replacements• Change of category of consumption• Sewerage overflows on the road• No water for ‘X’ days• Low water Pressure• Others• Non-receipt of water bill• Water Leakage

Division wise Redressal EfficiencyFrom 01-02-1999 to 04-03-2003
• 38.2%• 28.6%• 53.0%• 62.7%• 41.4%• 59.7%• 54.5%• 35.4%• 38.6%
• Division 1• Division 2• Division 3 • Division 4• Division 5 • Division 6• Division 7 • Division 9• Division 10

Analysis of Top 10 complaintsFrom 01-02-1999 to 04-03-2003
No water for x days17.76%
Replacement of missing manhole
1.08%
Sewerage overflows on the road
36.00%
non-receipt of water bill
0.30%
erratic timing of water supply
0.25%
water leakage4.98%
Chokage customer premises29.99%
Others1.61%
polluted water supply3.37%
low water pressure4.66%
These constitute about 99.29 % of 2,95,447 complaints from 2/99 till 04.03.03

No Water for 'X'days
0
20
40
60
80
100
120
140
160
180
200
01/0
2/19
99
01/0
4/19
99
01/0
6/19
99
01/0
8/19
99
01/1
0/19
99
01/1
2/19
99
01/0
2/20
00
01/0
4/20
00
01/0
6/20
00
01/0
8/20
00
01/1
0/20
00
01/1
2/20
00
01/0
2/20
01
01/0
4/20
01
01/0
6/20
01
01/0
8/20
01
01/1
0/20
01
01/1
2/20
01
01/0
2/20
02
01/0
4/20
02
01/0
6/20
02
01/0
8/20
02
01/1
0/20
02
01/1
2/20
02
01/0
2/20
03
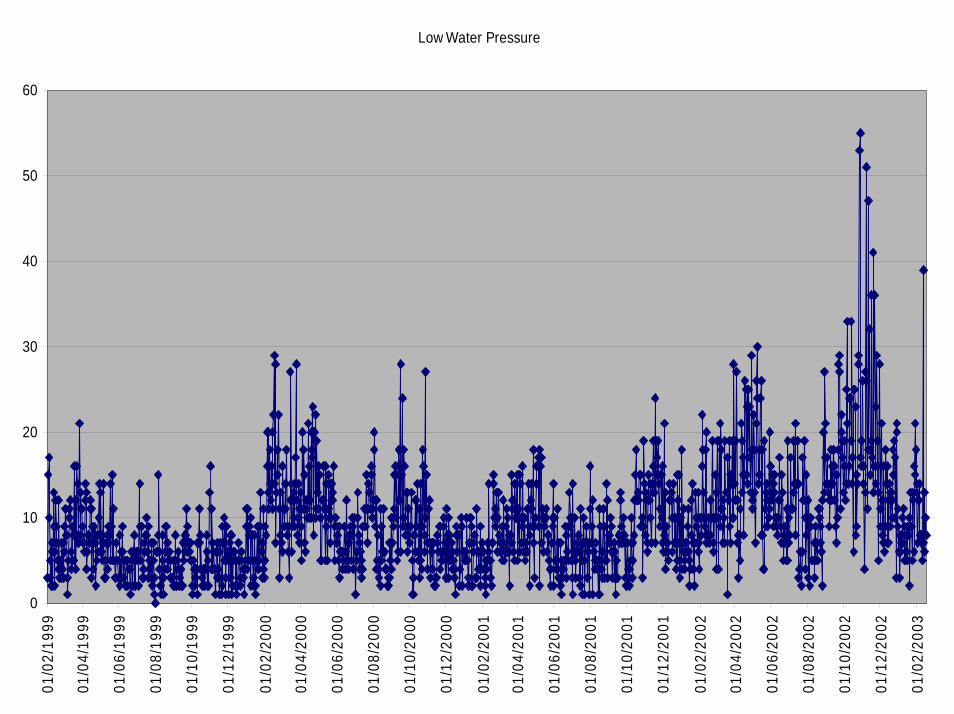
Low Water Pressure
0
10
20
30
40
50
60
01/0
2/19
99
01/0
4/19
99
01/0
6/19
99
01/0
8/19
99
01/1
0/19
99
01/1
2/19
99
01/0
2/20
00
01/0
4/20
00
01/0
6/20
00
01/0
8/20
00
01/1
0/20
00
01/1
2/20
00
01/0
2/20
01
01/0
4/20
01
01/0
6/20
01
01/0
8/20
01
01/1
0/20
01
01/1
2/20
01
01/0
2/20
02
01/0
4/20
02
01/0
6/20
02
01/0
8/20
02
01/1
0/20
02
01/1
2/20
02
01/0
2/20
03

Sewerage overflows on the Road
0
50
100
150
200
250
300
01/0
2/19
99
01/0
4/19
99
01/0
6/19
99
01/0
8/19
99
01/1
0/19
99
01/1
2/19
99
01/0
2/20
00
01/0
4/20
00
01/0
6/20
00
01/0
8/20
00
01/1
0/20
00
01/1
2/20
00
01/0
2/20
01
01/0
4/20
01
01/0
6/20
01
01/0
8/20
01
01/1
0/20
01
01/1
2/20
01
01/0
2/20
02
01/0
4/20
02
01/0
6/20
02
01/0
8/20
02
01/1
0/20
02
01/1
2/20
02
01/0
2/20
03
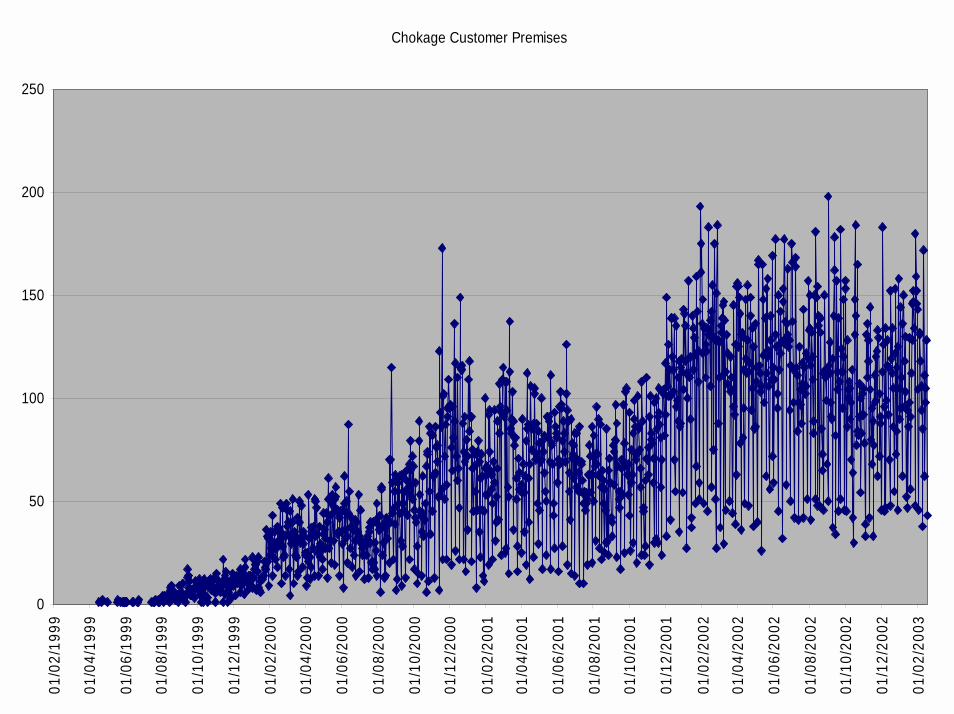
Chokage Customer Premises
0
50
100
150
200
250
01/0
2/19
99
01/0
4/19
99
01/0
6/19
99
01/0
8/19
99
01/1
0/19
99
01/1
2/19
99
01/0
2/20
00
01/0
4/20
00
01/0
6/20
00
01/0
8/20
00
01/1
0/20
00
01/1
2/20
00
01/0
2/20
01
01/0
4/20
01
01/0
6/20
01
01/0
8/20
01
01/1
0/20
01
01/1
2/20
01
01/0
2/20
02
01/0
4/20
02
01/0
6/20
02
01/0
8/20
02
01/1
0/20
02
01/1
2/20
02
01/0
2/20
03

GE cases in Fever Hospital- Trend Reversed
0
500
1000
1500
199519961997199819992000200120022003
1995 328 577 657 595 722 1079 1299 1030 596 636 416 418
1996 396 546 882 878 1269 1407 1159 866 617 471 342 325
1997 312 361 607 571 692 669 758 684 511 448 363 355
1998 391 501 684 982 1366 872 933 1053 834 750 435 322
1999 327 381 495 630 1008 607 493 344 236 235 233 195
2000 236 285 439 432 512 678 867 294 151 123 93 75
2001 66 67 74 67 76 82 111 94 82 119 61 64
2002 49 17 12 4 10 3 1 0 0 0 0 0
2003 0
Jan Feb Mar Apl May Jun July Aug Sept Oct Nov Dec

Never Paid Connections
34.15 lakhs5% incentive
6.83 Crores17,401Converted
36.54 Crores43,489Total
AmountNumber

GOAL HMWSSB
Target
March2004
January2003
20.078
Alternative Indicator is:
No. of GE cases per Lakh population per month
Difficult for assessment on a regular basis
DALY(Disability Affected Life Years)Ensure Public
Health by provision of safe drinking water and safe sanitary conditions
Baseline2000-01
IndicatorsGoal

OutcomesCoverage & UFW
Workings
HMWSSB
Target
50066611027. Complaints per LakhConnections
March2004
January2003
16%18%19%6. Physical Losses
134 MGD133MGD117 MGD5. Quantity Supplied
162 MGD162 MGD145 MGD4. Capacity
4.20Lakhs
4.03Lakhs
3.40Lakhs
3. Number of domestic Connections
81%85%75%2. Population covered
Alt. day 2 hours
Alt. day 2 hours
Alt. day2 hours
1. Frequency of supply1. Increase access to piped water supply
Baseline2000-01
IndicatorsOutcomes
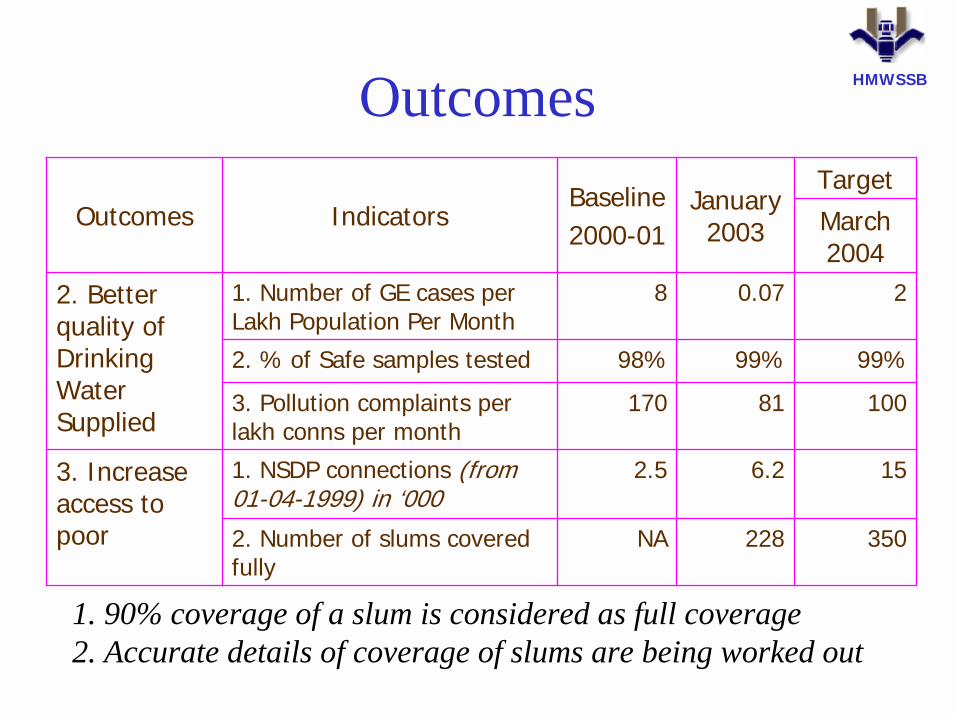
Outcomes HMWSSB
Target
100811703. Pollution complaints per lakh conns per month
March2004
January2003
350228NA2. Number of slums covered fully
156.22.51. NSDP connections (from 01-04-1999) in ‘000
3. Increase access to poor
99%99%98%2. % of Safe samples tested
20.0781. Number of GE cases per Lakh Population Per Month
2. Better quality of Drinking Water Supplied
Baseline2000-01
IndicatorsOutcomes
1. 90% coverage of a slum is considered as full coverage2. Accurate details of coverage of slums are being worked out
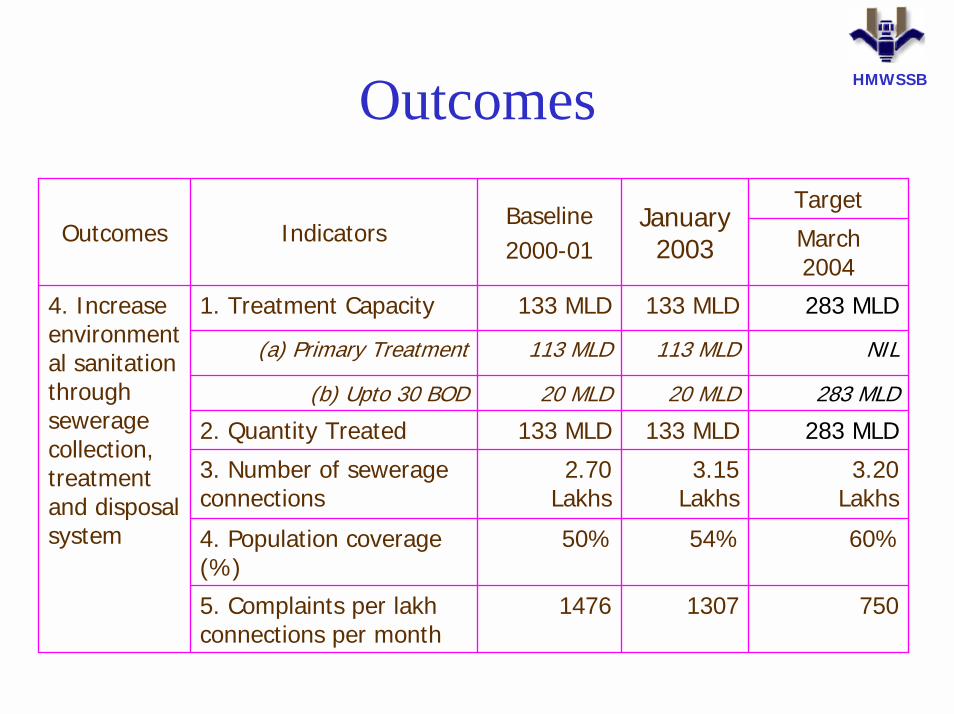
Outcomes HMWSSB
Target
750130714765. Complaints per lakhconnections per month
60%54%50%4. Population coverage (%)
283 MLD20 MLD20 MLD(b) Upto 30 BOD
March2004
January2003
3.20Lakhs
3.15 Lakhs
2.70Lakhs
3. Number of sewerage connections
283 MLD133 MLD133 MLD2. Quantity Treated
NIL113 MLD113 MLD(a) Primary Treatment
283 MLD133 MLD133 MLD1. Treatment Capacity4. Increase environmental sanitation through sewerage collection, treatment and disposal system
Baseline2000-01
IndicatorsOutcomes

Outcomes HMWSSB
Target
13.613.579.03 Demand (Rs. Crores PM)
March2004
January2003
Rs.8.28Rs.12.50Rs. 8.37. Realisation per KL (*)
Rs.11.51Rs.12.50Rs.11.22 6. Cost per KL of water billed
13.012.277.44. Collections (Rs. CroresPM)
10%16%17%2. Unaccounted for water (Revenue Losses)
3%5%5%1. Nonrevenue (accounted for ) water
5. Financial Self sufficiency & Provision of services at economic cost
Baseline
2000-01IndicatorsOutcome
s
* Appropriate tariff revision needed

HMWSSB
PPP
Public Private Partnership HMWSSB
• Water treatment plant,• Sewerage treatment plants –2 Nos,• Water Tankers• Johannesburg experiment• Bangalore proposals• Kukatpally initiative• Concession proposal• GDANSK model

HMWSSB
Thank you