
Brief about Petroleum Activities at IFE
50
Brief about Petroleum Activities at IFE Tor Bjørnstad Chief Scientist Institute for Energy Technology (IFE) [email protected]
Transcript of Brief about Petroleum Activities at IFE

Brief about Petroleum
Activities at IFE
Tor Bjørnstad
Chief Scientist
Institute for Energy Technology (IFE)

Subjects not to be treated here
• Multiphase flow in wells and pipelines (OLGA etc.)
• CO2 and H2S corrosion in transportation systems
• Hydrate prevention (MEG-technology) and most
other flow assurance aspects
• Geology/geochemistry/diagenesis/stable isotope
signatures
• Micropaleontology/biomarkers/production allocation
• Basin modelling
• CCS
• Application of tracer technology during exploration
11.06.2013

11.06.2013
Reservoir
evaluation

11.06.2013
Reservoir characterization
Geological
(or static)
reservoir
model
Well logs
Biostratigraphy
Sedimentology
Geochemistry Seismics
Reservoir modelling
Tracer data
Production data

11.06.2013
Water expelling oil –should be traced

6
Tracer Technology Research Themes
Development of radioactive and chemical tracers.
Testing and verification in laboratory experiments
Development of hyper-sensitive analytical techniques for tracers in highly diluted field samples
Practical implementation in the field
Development of simulation tools
0 0.4 0.8 1.2 1.6 2 2.4 2.8
0.07
0.06
0.05
0.04
0.03
0.02
0.01
0
ELUTED PORE VOLUME
NO
RM
AL
IZE
D F
RA
CT
ION
AL
CO
UN
TIN
G R
AT
E,
R/R
0
TRACER DISPERSION PROFILES from laboratory examinations of
S14CN- and HTO in carbonate rock
TEMPERATURE = 90 C
PRESSURE = 190 BAR
MOBILE PHASE: SEA WATER
LINEAR FLOW RATE = 20 cm/d
S14CN-
HTO
Injector Producer
H
F
COOH
H
H H
F
H
COOH
F
H H
F
F
COOH
COOH
F F
Tor Bjørnstad

The «Tracer Club»
IFE Tracer Research
Co-operation (ITRC
1991-1996
Main focus on pas-
sive water tracers
and new gas tracers
ADVanced IFE SOR
program (ADVISOR)
1997-2002
Main focus on
phase-partitioning
tracers
Reservoir Tracing
(ResTrac)
2002-2007
Main focus on
environmentally
acceptable trac.
Tracers in EOR
operations
(TracEOR)
2008-2012
Main focus on
tracers for EOR
operations
The ”core” of the tracer development is the ”Tracer Club” which is an
industry-supported program (JIP) which are being carried out in well-
defined development phases:
Intelligent tracers
(TracIntel)
2013-2017
Main focus on
functional tracers
for reservoar
properties

PETRAD
seminar Vietnam
2008
9
H
F
COOH
H
H H
H F
COOH
H H H
H
F
COOH
H
H H
F
H
COOH
F
H H
H
F
COOH
H
H F
H
H
COOH
F
F H
H
H
COOH
H
F F
H
F
COOH
F
F F
«Industry standard» interwell water tracers

PETRAD
seminar Vietnam
2008
10
“Industry standard” non-radioactive gas tracers
Perfluorinated
cyclic hydro-
carbons with
coordinated light
hydrocarbon
(methyl) groups
are excellent gas
tracers
PMCP PMCH
CARBON
FLUORINE
1,2,4-PTMCH
PDCB
1,3-PDMCH

PETRAD
seminar Vietnam
2008
11
Particle core emission
Particle core and functional layer
emission
Particle core and multifunctional layer emission
Fluorescent and radioactive nano-particles
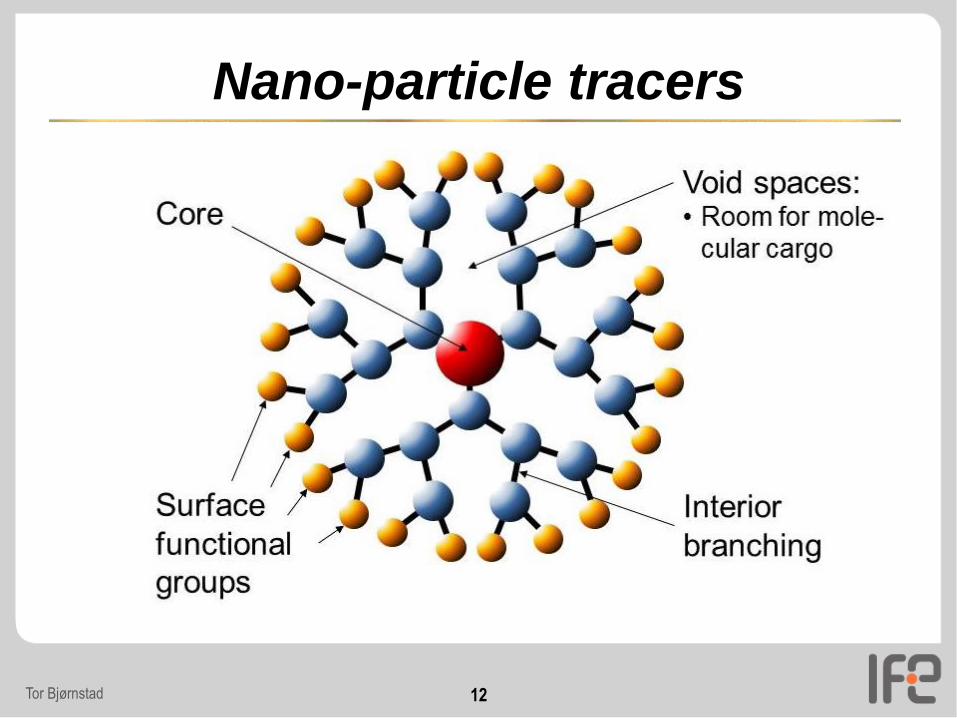
Nano-particle tracers
12 Tor Bjørnstad
11.06.2013
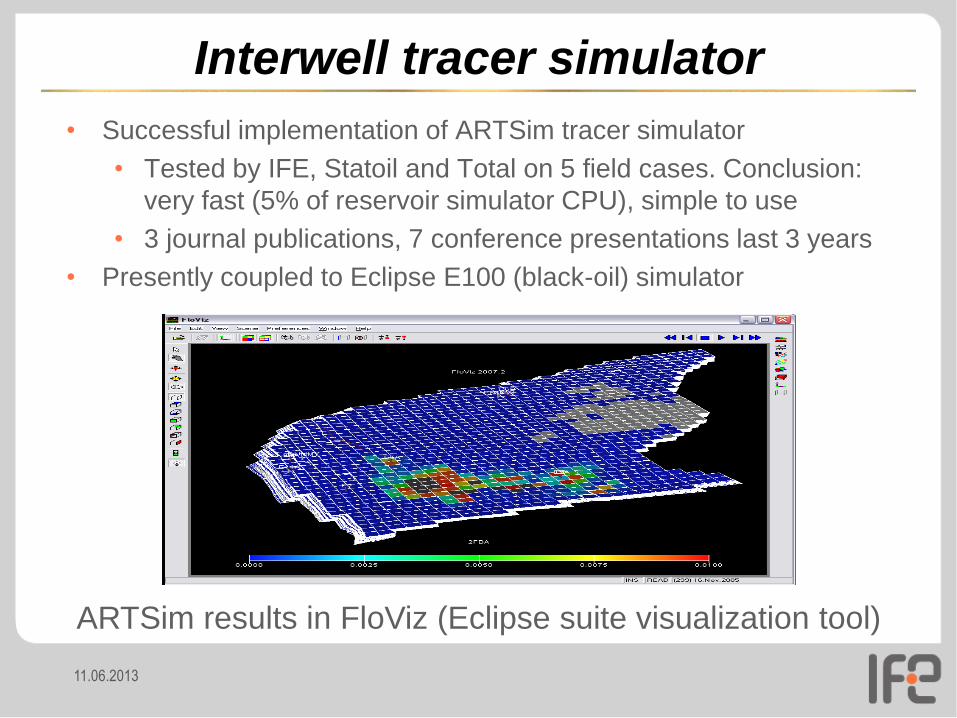
Interwell tracer simulator
• Successful implementation of ARTSim tracer simulator
• Tested by IFE, Statoil and Total on 5 field cases. Conclusion:
very fast (5% of reservoir simulator CPU), simple to use
• 3 journal publications, 7 conference presentations last 3 years
• Presently coupled to Eclipse E100 (black-oil) simulator
ARTSim results in FloViz (Eclipse suite visualization tool)
11.06.2013
Tracers in reservoirs

11.06.2013
Injection
well
Production
well
Stratified reservoir
Tracing of
injection
fluids Preferential flow directions
Horizontal and vertical communication between wells
Permeability strata
Sweep volumes
Large-scale hetero-geneities

11.06.2013
P4 P8 P7 P5
I2
PMCH
Tracer response after WAG

11.06.2013
Petromaks KMB, technical content
Geostatistical
modeling
φ,k
Reservoir
model
History matched
model.
Used for predictions /
decisions
Add tracer and
production data Communicate lessons learned back to geo-model
Proposed workflow
Geostatistical
modeling
φ,k
Reservoir
model
History matched
model.
Used for predictions /
decisions
Assisted HM
Todays workflow
Assisted HM

11.06.2013
Remaining oil saturation

11.06.2013
Passive and partitioning tracer flow in a flooding pore of formation rock
Two main tracer
categories:
FORMATION ROCK
RESIDUAL OIL
Active tracers (sorbing to rock, partitioning
between liq. phases,
reacting….)
Passive tracers (conservative, non-reacting)
The partitioning tracer becomes delayed with
respect to the passive water tracer.

11.06.2013
K-value (partition coefficient)
• Partitioning tracer in water
and oil
• Non-partitioning tracer
only in water
• Water moves, oil is (close
to) stagnant in EOR cases
K = (CTr)o/(CTr)w

11.06.2013
0
0,2
0,4
0,6
0,8
1
1,2
40 50 60 70 80 90 100 110 120 130 140
Rela
tive r
esp
on
s t
o p
eak c
on
cen
trati
on
Eluted amount (g)
WTP-1
WTP-2
WTP-3
WTP-4
WTP-5
WTP-6
HTO
Partitioning tracer – Lab Experiments
Silica-packed
column
prepared with
residual oil
T = 40 C
P = 170 bar
SOR = 15.7 %

Estimation of So by scaling x-axis
11.06.2013
Scaling x-axis of the partitioning tracer : x' = x / (1+b)

b = 0.6 gives match (So=0.24)
11.06.2013
b=0.6, K=1.9 gives saturation: So = b/(b + K) = 0.6/(0.6+1.9) = 0.24

RTD analysis of PITTs
Must first correct for re-injection & extrapolate to
infinity

LAV-1 results
Results are consistent
11.06.2013
Tracer 𝛽 𝐾 𝑆𝑜 [%]
IFE-WTP8 0.6 1.9 24
IFE-WTP7 0.75 2.4 24
IFE-WTP3 0.50 1.5 25
IFE-WTP2 0.50 1.5 25
IFE-WTP1 0.70 2.1 25
IFE-WTP4 0.80 2.9 22

LAV-2 results
Results are consistent
11.06.2013
Tracer 𝛽 𝐾 𝑆𝑜 [%]
IFE-WTP8 0.55 1.9 22
IFE-WTP7 0.65 2.4 21
IFE-WTP3 0.45 1.5 23
IFE-WTP2 0.45 1.5 23
IFE-WTP1 0.60 2.1 22
IFE-WTP4 0.70 2.9 19

SWCTT stage 1 injection
Water and ester is injected into watered out section
EtAc EtAc NPA NPA
NPA NPA EtAc EtAc

SWCTT stage 2 hydrolysis shut-in
Some of the ester hydrolyses to alcohol
EtAc
EtOH EtOH
EtAc
NPA NPA
NPA NPA

SWCTT stage 3 back production
The ester partition to oil and is delayed, compared to the alcohol
The water tracer is catching up on the partitioning tracer.
EtAc
EtOH EtOH
EtAc
NPA
NPA
NPA
NPA

11.06.2013
0
0
Unreacted Ester
Tracer
Volume Produced (bbls)
Material Balance Tracer
Product
Alcohol
Tracer
0
200
400
600
800
1000
1200
1400
1600
1800
2000
0 500 1000 1500 2000
0
50
100
150
200
250
300 C
on
cen
trati
on
Tra
ce
rs (
pp
m)
Co
ncen
trati
on
Tra
ce
rs (
pp
m)
Single Well Chemical Tracer Test
Production Curve

Partitioning interwell tracer test (PITT)
• Exploits the delay of partitioning tracers compared to
non-partitioning tracers
• Works by injecting partitioning & non-partitioning
tracer simultaneously
• Saturation can be estimated by:
𝑺𝒐 = (𝑻𝒑 − 𝑻𝒊)/(𝑻𝒑 + 𝑻𝒊(𝑲 − 𝟏))= 𝜷/(𝜷+K)
where 𝑻𝒑 = 𝑻𝒊(𝟏 − 𝜷)
11.06.2013

11.06.2013
EOR-methods

11.06.2013
Enhanced oil recovery

11.06.2013
CO2–EOR challenges

11.06.2013
Synthesis of 35S-labeled surfactant
• Synthesis of the sulfonation agent acetylsulfate:
H235SO4 + CH3-COOOC-CH3
CH3-COO35SO3H + CH3-COOH
• Sulfonation of 1-dodecene to get the surfactant:
CH3-COO35SO3H + R-CH2-CH=CH2
R-CH=CH-CH2-35SO3H + CH3-COOH
(R = C9H19)

11.06.2013
Less liquid, more CO2
0.0 0.5 1.0 1.5 2.0 2.5 3.00.0
0.2
0.4
0.6
0.8
1.0
Trac
er re
spon
se/a
.u.
Number of pore volumes
14
C
3H
35
S
CO2
Water
Surfactant

11.06.2013
Using 22Na+ tracer to monitor water front
40 60 80 100 120 140 160 180
0
2000
4000
6000
8000
10000
12000
14000
CenterWidth
106,3518,497106,7018,136
Conditions:
Pressure: 305.5bar
Diff.pres.: 123mbar
Temp.: 89.6oC
Flow: 1.06mL/min
Flow cell: 500L
Scint.flow: 4.0mL/min
Scint.: Ultima Gold XR
Pulse of HTO and 35S-labelled surfactant
measured with flow-cell detector
HTO
Co
un
ts
40 60 80 100 120 140 160 180
0
2000
4000
6000
8000
10000
12000
14000
35S-labelled surfactant
2.5% solution
500L pulse
Flooded volume (mL)
0 100 200 300 400 500
600
800
1000
1200
1400
1600
1800
2000
Co
un
ts
0 100 200 300 400 500
600
800
1000
1200
1400
1600
1800
2000
0 100 200 300 400 500
600
800
1000
1200
1400
1600
1800
2000
Position of scanner (mm)
0 100 200 300 400 500
600
800
1000
1200
1400
1600
1800
2000
Flow: 1ml/min
Pressure: 307bar
Temp.: 89.5oC
Water containing 22Na+ displacing water
t = 100min
t = 66min
t = 40min
t = 19min
Front end of core
40 60 80 100 120 140 160 180
0
2000
4000
6000
8000
10000
12000
14000
CenterWidth
106,3518,497106,7018,136
Conditions:
Pressure: 305.5bar
Diff.pres.: 123mbar
Temp.: 89.6oC
Flow: 1.06mL/min
Flow cell: 500L
Scint.flow: 4.0mL/min
Scint.: Ultima Gold XR
Pulse of HTO and 35S-labelled surfactant
measured with flow-cell detector
HTO
Co
un
ts
40 60 80 100 120 140 160 180
0
2000
4000
6000
8000
10000
12000
14000
35S-labelled surfactant
2.5% solution
500L pulse
Flooded volume (mL)
0 100 200 300 400 500
600
800
1000
1200
1400
1600
1800
2000
Co
un
ts
0 100 200 300 400 500
600
800
1000
1200
1400
1600
1800
2000
0 100 200 300 400 500
600
800
1000
1200
1400
1600
1800
2000
Position of scanner (mm)
0 100 200 300 400 500
600
800
1000
1200
1400
1600
1800
2000
Flow: 1ml/min
Pressure: 307bar
Temp.: 89.5oC
Water containing 22Na+ displacing water
t = 100min
t = 66min
t = 40min
t = 19min
Front end of core

11.06.2013
How can CO2 sweep efficiency be
improved ?
CO2/foam: What kind of surfactant?
Increasing viscosity by polymers:
What kind of polymer?
WAG: How long (frequency of) slugs?
What are the displacement
mechanisms with supercritical or
dense-phase CO2?

What injection strategy to follow?
11.06.2013

CO2 foam flooding: Parameters
11.06.2013
• Foam stability
• Foam quality
• Surfactant retention
• Component separation
Gas
Wate
r

11.06.2013
Production and
flow assurance

11.06.2013
Well inflow monitoring
11.06.2013
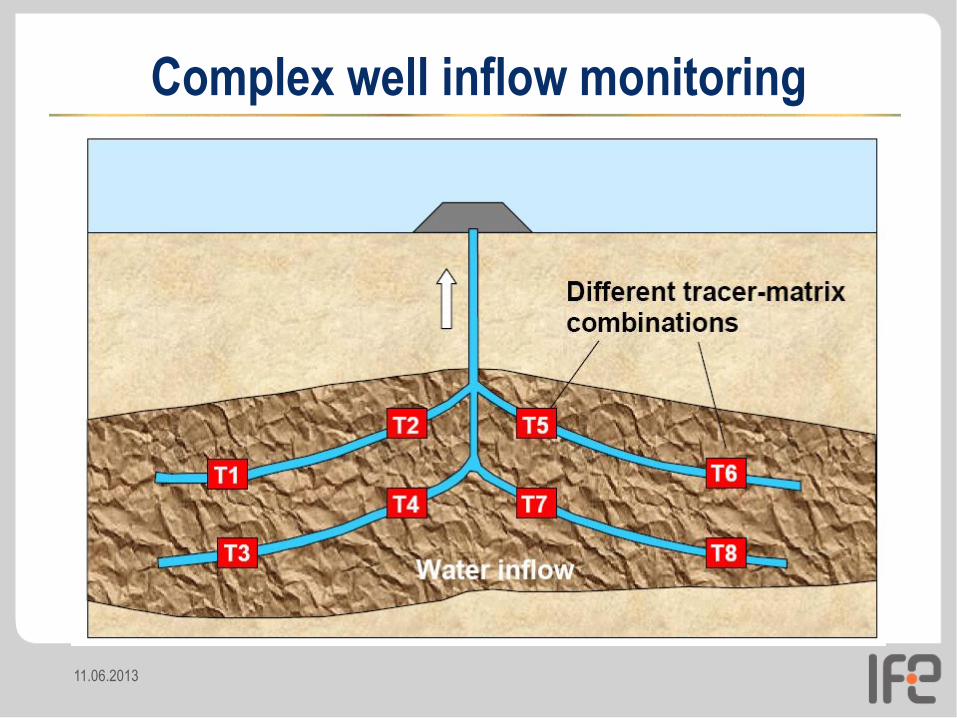
Complex well inflow monitoring

11.06.2013 Tor Bjørnstad 46
Generator principles (2)
Mother nuclide
Aqueous solution
(complexing agent,
salinity, pH)
Aqueous solution
+ complexed
daughter possibly
extractable into
organics
Aqueous or
organic tracer
Example: 52Fe 52mMn
Anion exch.column,
elution with tartrate
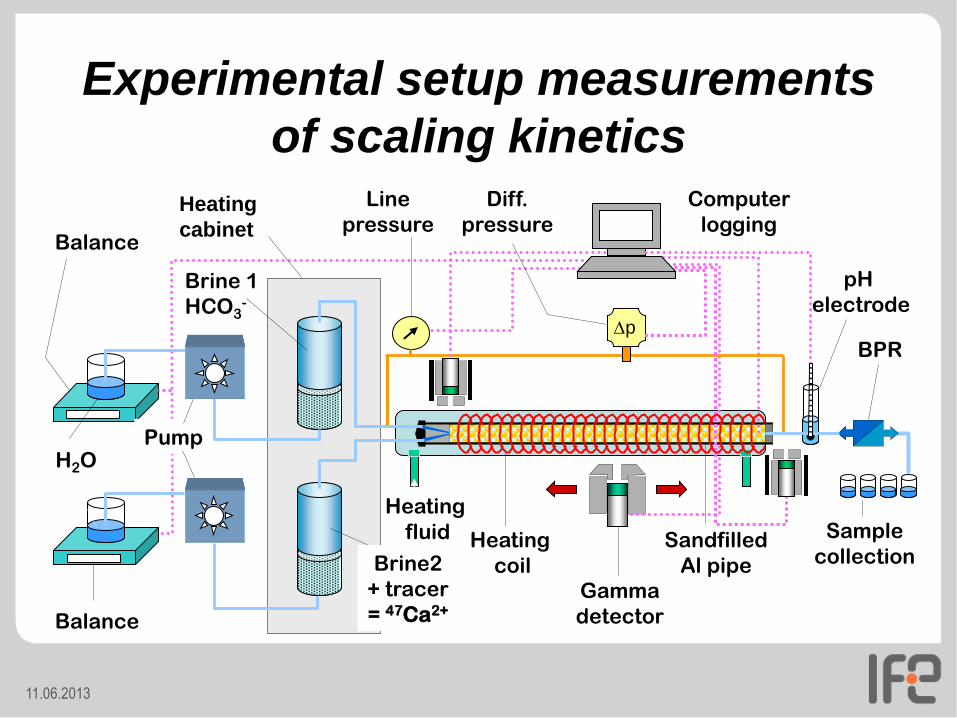
Brine 1
HCO3-
Experimental setup measurements
of scaling kinetics
11.06.2013
Heating
fluid Sandfilled
Al pipe
Gamma
detector Balance
H2O Pump
p
Balance
Line
pressure
Diff.
pressure
Computer
logging
BPR
Sample
collection
pH
electrode
Brine2
+ tracer
= 47Ca2+
Heating
coil
Heating
cabinet
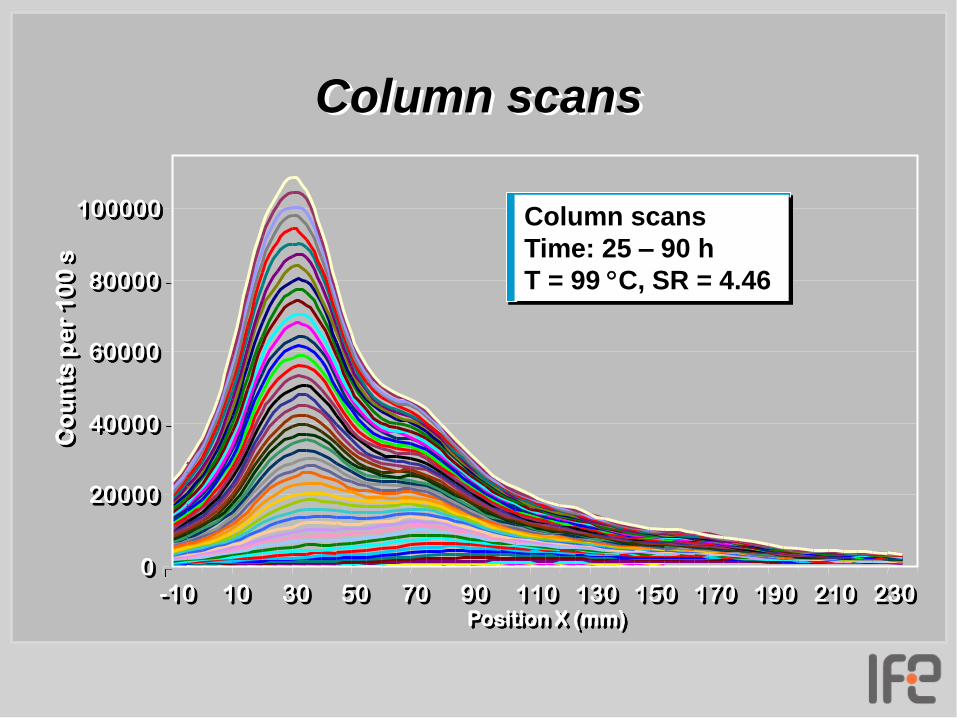
0
20000
40000
60000
80000
100000
-10 10 30 50 70 90 110 130 150 170 190 210 230 Position X (mm)
Co
un
ts p
er
10
0 s
Column scans
Time: 25 – 90 h
T = 99 C, SR = 4.46
Column scans

0
20000
40000
60000
80000
100000
120000
-10 40 90 140 190 240 Position (mm)
Co
un
tin
g r
ate
(c
p1
00
s)
to + to,y
97,38 h 81,04 h 72,58 h 62,71 h 52,84 h 44,38 h 37,33 h 31,69 h 26,84 h
Selected CaCO3
precipitation curves
Selected column scans

0
20000
40000
60000
80000
100000
120000
0 10 20 30 40 50 60 70 80
Time (to+ to,y+ xitc , hours)
Co
un
tin
g r
ate
(c
p1
00
s) Xi = 30 mm
Xj = 90 mm
True scaling rates at xi and xj

Shale gas and
hydrofracturing
51 Tor Bjørnstad

52
Field experience Common R&D projects Technology contacts
Tracer projects and contacts world-wide
Tor Bjørnstad

Warning: Spider on drugs
Drug Free Spider Exposed to mescaline\Peyote Exposed to LSD
Exposed to Marijuana Exposed to Benzedrine/
Speed
Exposed to Caffeine