
bridging the digital divide...bridging the digital divide in Africa 6 differentiating through...
59
A bridging the digital divide annual report 2011–12 3
Transcript of bridging the digital divide...bridging the digital divide in Africa 6 differentiating through...

Annual Report 2011–2012
A
bridging the digital divide
annual report 2011–12
3

Annual Report 2011–2012
1Annual Report 2011–2012
1Annual Report
2011–2012
B
As the Brand behind Brands, we believe in building strong
partnerships with all our stakeholders. We innovate with an
aim to empower. And we commit to creating outstanding
value for our investors, shareholders and staff alike.
At Redington we like to understate our capability but
believe we should over- deliver on our commitments.
We like to be cautious in our approach but believe
we should take measured risks when needed.
We like to bring a local fl avor wherever we
do business but we believe it is important
to think with a global mind.
At Redington we handle a package
day in and day out but we
believe we fuel an experience.
Brand Promise
corporate information 2
message from the managing director 4
bridging the digital divide in Africa 6
differentiating through support services 10
going the whole nine yards 12
nurturing the last mile 14
fi ve years at a glance 16
delivering value 18
directors’ report 20
report on corporate governance 29
management discussion and analysis 43
standalone fi nancial statements
auditors' report 51
balance sheet 54
statement of profi t and loss 55
cash fl ow statement 56
notes to fi nancial statements 57
consolidated fi nancial statements
auditors' report 79
balance sheet 80
statement of profi t and loss 81
cash fl ow statement 82
notes to fi nancial statements 83
statement under section 212(8) of the Companies Act 1956 relating to subsidiary companies 105
Notice 106
contents
page
1 To begin: choose desired 'CONTENT' and click on it 3 CLOSE

Annual Report 2011–2012
3Annual Report
2011–2012
2Annual Report 2011–2012
3Annual Report
2011–2012
2
1 TO CONTENTS PAGE 3 CLOSE
corporate information
chairman Prof. J Ramachandran
managing director R Srinivasan
deputy managing director Raj Shankar
whole-time director M Raghunandan
directors
R Jayachandran
Tu, Shu-Chyuan
Lin Tai-Yang
Nainesh Jaisingh
N Srinivasan
William Adamopoulos
company secretary M Muthukumarasamy
statutory auditorsM/s Deloitte Haskins & Sells
Chartered Accountants
internal auditorsM/s Pricewaterhouse Coopers
Chartered Accountants
bankers – india
ANZ Banking Group Limited
Bank of Nova Scotia
Barclays Bank PLC
BNP Paribas
Citi Bank N.A
DBS Bank Limited
Deutsche Bank AG
First Rand Bank
HDFC Bank Limited
HSBC
ICICI Bank Limited
IDBI Bank Limited
IndusInd Bank Limited
ING Vysya Bank Limited
Kotak Mahindra Bank Limited
Standard Chartered Bank
State Bank of India
The Royal Bank of Scotland
YES Bank Ltd
bankers – overseas
Axis Bank, Dubai
Bank of Baroda, Dubai
Barclays Bank, Dubai
BNP Paribas, Dubai
BNP Paribas, Singapore
Dubai Islamic Bank, Dubai
Emirates Bank, Dubai
Exim Bank, India
First Gulf Bank, Dubai
HSBC, Dubai
HSBC, Singapore
ICICI Bank, Bahrain
Mashreq Bank, Dubai
May Bank, Singapore
National Bank of Fujairah, Dubai
OCBC Bank, Singapore
Standard Chartered Bank, Dubai
Standard Chartered Bank, Singapore
State Bank of India, Bahrain
UCO Bank, Singapore
Annual Report 2011–2012
5Annual Report
2011–2012
4Annual Report 2011–2012
5Annual Report
2011–2012
4
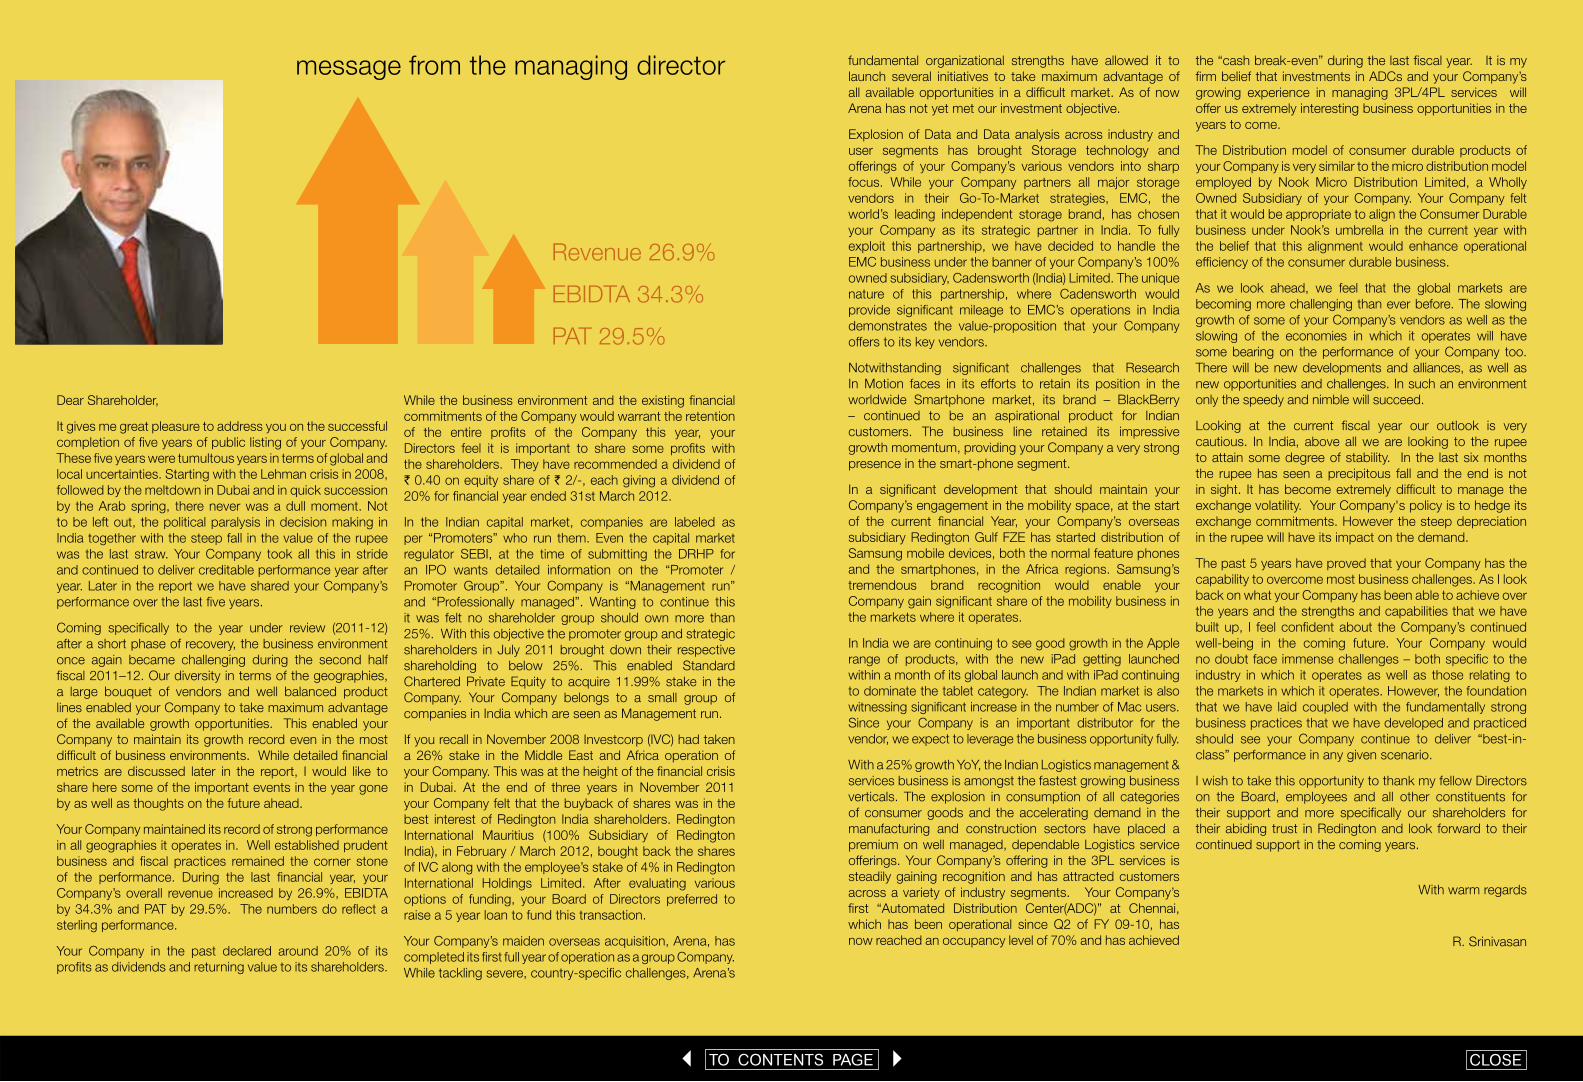
Dear Shareholder,
It gives me great pleasure to address you on the successful
completion of fi ve years of public listing of your Company.
These fi ve years were tumultous years in terms of global and
local uncertainties. Starting with the Lehman crisis in 2008,
followed by the meltdown in Dubai and in quick succession
by the Arab spring, there never was a dull moment. Not
to be left out, the political paralysis in decision making in
India together with the steep fall in the value of the rupee
was the last straw. Your Company took all this in stride
and continued to deliver creditable performance year after
year. Later in the report we have shared your Company’s
performance over the last fi ve years.
Coming specifi cally to the year under review (2011-12)
after a short phase of recovery, the business environment
once again became challenging during the second half
fi scal 2011–12. Our diversity in terms of the geographies,
a large bouquet of vendors and well balanced product
lines enabled your Company to take maximum advantage
of the available growth opportunities. This enabled your
Company to maintain its growth record even in the most
diffi cult of business environments. While detailed fi nancial
metrics are discussed later in the report, I would like to
share here some of the important events in the year gone
by as well as thoughts on the future ahead.
Your Company maintained its record of strong performance
in all geographies it operates in. Well established prudent
business and fi scal practices remained the corner stone
of the performance. During the last fi nancial year, your
Company’s overall revenue increased by 26.9%, EBIDTA
by 34.3% and PAT by 29.5%. The numbers do refl ect a
sterling performance.
Your Company in the past declared around 20% of its
profi ts as dividends and returning value to its shareholders.
While the business environment and the existing fi nancial
commitments of the Company would warrant the retention
of the entire profi ts of the Company this year, your
Directors feel it is important to share some profi ts with
the shareholders. They have recommended a dividend of
` 0.40 on equity share of ` 2/-, each giving a dividend of
20% for fi nancial year ended 31st March 2012.
In the Indian capital market, companies are labeled as
per “Promoters” who run them. Even the capital market
regulator SEBI, at the time of submitting the DRHP for
an IPO wants detailed information on the “Promoter /
Promoter Group”. Your Company is “Management run”
and “Professionally managed”. Wanting to continue this
it was felt no shareholder group should own more than
25%. With this objective the promoter group and strategic
shareholders in July 2011 brought down their respective
shareholding to below 25%. This enabled Standard
Chartered Private Equity to acquire 11.99% stake in the
Company. Your Company belongs to a small group of
companies in India which are seen as Management run.
If you recall in November 2008 Investcorp (IVC) had taken
a 26% stake in the Middle East and Africa operation of
your Company. This was at the height of the fi nancial crisis
in Dubai. At the end of three years in November 2011
your Company felt that the buyback of shares was in the
best interest of Redington India shareholders. Redington
International Mauritius (100% Subsidiary of Redington
India), in February / March 2012, bought back the shares
of IVC along with the employee’s stake of 4% in Redington
International Holdings Limited. After evaluating various
options of funding, your Board of Directors preferred to
raise a 5 year loan to fund this transaction.
Your Company’s maiden overseas acquisition, Arena, has
completed its fi rst full year of operation as a group Company.
While tackling severe, country-specifi c challenges, Arena’s
fundamental organizational strengths have allowed it to
launch several initiatives to take maximum advantage of
all available opportunities in a diffi cult market. As of now
Arena has not yet met our investment objective.
Explosion of Data and Data analysis across industry and
user segments has brought Storage technology and
offerings of your Company’s various vendors into sharp
focus. While your Company partners all major storage
vendors in their Go-To-Market strategies, EMC, the
world’s leading independent storage brand, has chosen
your Company as its strategic partner in India. To fully
exploit this partnership, we have decided to handle the
EMC business under the banner of your Company’s 100%
owned subsidiary, Cadensworth (India) Limited. The unique
nature of this partnership, where Cadensworth would
provide signifi cant mileage to EMC’s operations in India
demonstrates the value-proposition that your Company
offers to its key vendors.
Notwithstanding signifi cant challenges that Research
In Motion faces in its efforts to retain its position in the
worldwide Smartphone market, its brand – BlackBerry
– continued to be an aspirational product for Indian
customers. The business line retained its impressive
growth momentum, providing your Company a very strong
presence in the smart-phone segment.
In a signifi cant development that should maintain your
Company’s engagement in the mobility space, at the start
of the current fi nancial Year, your Company’s overseas
subsidiary Redington Gulf FZE has started distribution of
Samsung mobile devices, both the normal feature phones
and the smartphones, in the Africa regions. Samsung’s
tremendous brand recognition would enable your
Company gain signifi cant share of the mobility business in
the markets where it operates.
In India we are continuing to see good growth in the Apple
range of products, with the new iPad getting launched
within a month of its global launch and with iPad continuing
to dominate the tablet category. The Indian market is also
witnessing signifi cant increase in the number of Mac users.
Since your Company is an important distributor for the
vendor, we expect to leverage the business opportunity fully.
With a 25% growth YoY, the Indian Logistics management &
services business is amongst the fastest growing business
verticals. The explosion in consumption of all categories
of consumer goods and the accelerating demand in the
manufacturing and construction sectors have placed a
premium on well managed, dependable Logistics service
offerings. Your Company’s offering in the 3PL services is
steadily gaining recognition and has attracted customers
across a variety of industry segments. Your Company’s
fi rst “Automated Distribution Center(ADC)” at Chennai,
which has been operational since Q2 of FY 09-10, has
now reached an occupancy level of 70% and has achieved
the “cash break-even” during the last fi scal year. It is my
fi rm belief that investments in ADCs and your Company’s
growing experience in managing 3PL/4PL services will
offer us extremely interesting business opportunities in the
years to come.
The Distribution model of consumer durable products of
your Company is very similar to the micro distribution model
employed by Nook Micro Distribution Limited, a Wholly
Owned Subsidiary of your Company. Your Company felt
that it would be appropriate to align the Consumer Durable
business under Nook’s umbrella in the current year with
the belief that this alignment would enhance operational
effi ciency of the consumer durable business.
As we look ahead, we feel that the global markets are
becoming more challenging than ever before. The slowing
growth of some of your Company’s vendors as well as the
slowing of the economies in which it operates will have
some bearing on the performance of your Company too.
There will be new developments and alliances, as well as
new opportunities and challenges. In such an environment
only the speedy and nimble will succeed.
Looking at the current fi scal year our outlook is very
cautious. In India, above all we are looking to the rupee
to attain some degree of stability. In the last six months
the rupee has seen a precipitous fall and the end is not
in sight. It has become extremely diffi cult to manage the
exchange volatility. Your Company's policy is to hedge its
exchange commitments. However the steep depreciation
in the rupee will have its impact on the demand.
The past 5 years have proved that your Company has the
capability to overcome most business challenges. As I look
back on what your Company has been able to achieve over
the years and the strengths and capabilities that we have
built up, I feel confi dent about the Company’s continued
well-being in the coming future. Your Company would
no doubt face immense challenges – both specifi c to the
industry in which it operates as well as those relating to
the markets in which it operates. However, the foundation
that we have laid coupled with the fundamentally strong
business practices that we have developed and practiced
should see your Company continue to deliver “best-in-
class” performance in any given scenario.
I wish to take this opportunity to thank my fellow Directors
on the Board, employees and all other constituents for
their support and more specifi cally our shareholders for
their abiding trust in Redington and look forward to their
continued support in the coming years.
With warm regards
R. Srinivasan
message from the managing director
Revenue 26.9%
EBIDTA 34.3%
PAT 29.5%
1 TO CONTENTS PAGE 3 CLOSE

Annual Report 2011–2012
7Annual Report
2011–2012
6Annual Report 2011–2012
7Annual Report
2011–2012
6
1 TO CONTENTS PAGE 3 CLOSE
With more than one-eighth of the total population of the
world distributed over a land area representing slightly more
than one-fi fth of the earth’s land surface, Africa is today the
fastest urbanizing region in the world. Available statistics
indicate a rate of 3.5% per annum. By 2030, the continent’s
population is projected to grow to 1.3 billion and the
proportion of urbanized Africans is expected to reach nearly
58% of the total population (760 million) as compared to
39% in 2005. Notably this demographic will be astonishingly
young and create a strong impact on Africa’s patterns of
consumption.
There is already enough evidence of an increasingly
aspirational middle-class in the large cities of present
day Africa who are driven by Western ideologies and
consumption traits. The prosperity of this new and distinctive
social stratum, if only slight, is making its presence felt
and is nudging Africa’s purchasing power north. Demand
for computers, computer-related products and services,
electronics, and cell phones is sweeping through most
countries in the continent, and these collectively represent
the most promising market in the world today .
Redington entered this geography, specifi cally Nigeria, in
2003 and in 2004 set up an entity in Lagos. Encouraged
by the buying patterns of cash rich traders in Africa who
were importing large quantities of branded IT goods from
Dubai, Redington determined that proximate availability
of the products would be critical in making their venture
successful. Today Redington is the leading distributor
of IT and IT-related products and services. In increasing
its footprint, Redington fi rst chose emerging markets
nourished by rich oil fi elds where there was a signifi cant
business opportunity for IT hardware. Redington also
chose English speaking regions with signifi cant Asian
and Indian diaspora—Sub-Saharan Africa with Nigeria
and Ghana in the West, and Kenya, Tanzania, Ethiopia,
and Uganda in the East. Building on the experience
gained in these countries and armed with a successful
business model and an effi cient in-country infrastructure
supported by experienced people, Redington is now
all set to move towards North Africa —Morocco, Libya,
Algeria, and Tunisia—and into South Africa over the
next three years.
Redington is in the middle of a cultural and economic transformation in Africa and effectively bridges the digital divide in the continent
Redington fi rst chose emerging markets nourished by rich oil fi elds where there was a signifi cant business opportunity for IT hardware
consumption. train Aeffbridigthe
10
21
post salesupport
service centres
countries
5countries
smart phones
12IT hardwarecountries
countries currently present in
countries in view
Morocco
Algeria
Tunisia
LibyaEgypt
NigeriaGhana
Kenya
TanzaniaTT
Ethiopia
Uganda
Angola
Rwanda
South AfricaSouth Africa
bridging the digital divide in Africa

Annual Report 2011–2012
9Annual Report
2011–2012
8Annual Report 2011–2012
9Annual Report
2011–2012
8
Despite its deep experience in supply chain
management and world-class business practices,
Africa was however initially a new ball game for
Redington. They had to devise a creative distribution
strategy very different from other markets like India
and the Middle East. For one, most customers in
Africa operated in a very informal environment,
selling wares like cell phones out of roadside stalls
and pushcarts. In Uganda for example, the fi rst
African country to record more mobile sales than
those of fi xed telephones, only about a quarter of
the population has a mobile subscription, but street
vendors offer mobile access on a per-call basis.
They also invite those without access to electricity
to charge their phones using car batteries. As
a result, Redington learnt a new way of doing
business. Within the Company’s risk framework
they made credit decisions founded on trust rather
than on fi nancial statements . Events have proved
that the trust was not misplaced. Additionally they
conceived effi cient ways of reaching the products
to customers while operating in an environment
fraught with risk and security related issues.
Importantly, they did not take advantage of the non-
availability of IT products, but priced their products
competitively.
While prospects for business are admittedly huge in Africa, success really depends on how well a company can adapt and customize its services to suit local ways
Cisco's Special DistributorPartner of the YearAward for Africa
It is no mean achievement that today Redington distributes
IT hardware products in 12 countries, mobile and Smart
phones in 5 countries, and provides post sales support in
10 countries through 21 Redington Service Centers. Nearly
60% of the total Africa sales came from the cell phone
segment last year. Popular mobile services include money
transfers and facility for people without bank accounts to
send money by text message. Many farmers in Africa have
started to use mobiles for trading commodities and they
check market prices on their phones.
It is to the team’s credit that Redington’s Africa success
has come in largely unfamiliar territories. Being the fi rst
international player in Africa for IT products distribution,
there were no contemporary best practices for Redington
to learn from. They devised their modus operandi as they
went along. Remarkably this became the ace in their hands.
Because of the nature of its business, Redington is
right smack in the middle of a cultural and economic
transformation in Africa and effectively bridges the digital
divide in the continent through distribution of IT and
Telecom products. Redington has the widest network
of service centers in Africa and is one of only a few
distributors with presence in so many countries. The
astonishing growth of mobile telephony in the continent
is a good story to tell. And by all accounts, a robust one.
Consumption is expected to grow even more rapidly with
economic liberalization, better network facilities and bigger
offerings in consumer electronics. It is fascinating to note
that enterprises like Redington while going about their
day to day business, are in fact contributing to Africa’s
development in amazing ways. Studies have indicated
that there is correlation between mobile phone uptake and
socio-economic progress due to the ensuing economic
activity people engage in as a result of owning a cell phone.
“In Africa, as in other developing areas, the mobile phone
is a tool that is, at once, equalising and empowering, and
has allowed those marginalised in society to participate in
the mainstream economy.” The story of Redington in Africa
then is only just beginning.
While prospects for business are admittedly huge
in Africa, success really depends on how well a
Company can adapt and customize its services to suit
local ways; how well they can face fi erce competition
from local distributors who intrinsically understand the
game and its nuances much better. It is against this
market backdrop that Redington made a foray into
this greenfi eld and established its business.
1 TO CONTENTS PAGE 3 CLOSE

Annual Report 2011–2012
11Annual Report
2011–2012
10Annual Report 2011–2012
11Annual Report
2011–2012
10
1 TO CONTENTS PAGE 3 CLOSE
differentiating through support services
The choice available in the markets today
combined with increasing demand in every
nook and corner for IT and Telecom products
including lifestyle products, gadgets, and
businessware, has put increasing pressure on
brands to penetrate deeper into newer and
remote territories, even small towns and villages.
On the back of this strategy some important
questions pop up for the vendor and for the
brand itself: How do I provide after sales quality
service for my brand’s suite of products? How
do I stand behind my service guarantee to my
customers in remote corners, small towns and
villages across such a wide region? How do I
keep my customers happy? Redington stepped
in to provide the answers.
The Company forayed into support services
in 1994 in a modest way. It was appointed as
Master Parts Seller for Hewlett Packard (HP) to
sell genuine HP parts and later in the year as
service provider for HP printers at 5 locations.
By 1998 this network had expanded to 19
locations, included many more brands, and
was servicing multiple products like computers,
monitors and printers.
2002 was a milestone year for Redington
services — they increased their footprint
to 38 locations, started servicing telecom
products, computerized their business and
deployed on-line systems for their end to
end service operations. In 2003 Redington
offered services to its vendors as an end to
end post sales services provider. For those
who took advantage, Redington became the
single point of contact for post sales services.
It offered a variety of facilities ranging from
Call Center support for end users to register
their complaints through a national toll free
number to get technical and warranty service
support, to warehousing facilities around the
country for parts, forward and reverse logistics
for parts, fi eld support through a network of
service centers, development of CRM and SCM
systems to meet vendor specifi c requirements
and an easy mechanism for testing and re-
export of defectives.
With the increase in mobile phone usage in India’s tier 3 and 4
towns, the Company enlisted authorized service partners in
these towns to meet service demands. The initial number of
100 locations soon grew to 200 by 2010. Resources in these
centers were trained by Redington to provide superior and
timely service. Redington today boasts of one of the largest
networks of stable and established service centers across
the country. All partner service centers operate on-line on
the Company’s CRM and SCM systems. Today, through 70
owned service centres, supported by a certifi ed franchisee
network of 220 service partners, Redington provides
the full spectrum of warranty & post-warranty services to
customers of its product vendors. The Company’s support
service is ISO 9001:2008 certifi ed and is in the process of
being certifi ed for ISO 20000 compliance. Every month more
than 100,000 customers avail services from Redington from
across the country for various products.
It is noteworthy that understanding the enormous value
Redington brings to the table through these services, many
vendors approach the Company for third party logistics
services. Redington differentiates itself from the pack by
not only offering end to end logistics support but by also
engaging in planning and forecasting to ensure optimum
stock levels and maximum availability to fulfi ll commitments.
They also manage end of life stock and scrapping.
To maintain the high standards and superior quality of
service, Redington started to issue annual maintenance
contracts and post-warranty paid repairs. It offers a range
of IT Infrastructure Services to corporate customers
based on individual need, including Help Desk support,
Comprehensive Annual Maintenance contracts and Facility
Management Services. Multinationals who deal with
Redington like the convenience of a single service provider
across India for all their service needs. Redington is the
authorized pre-sale and post-sales support partner for
some global brands in enterprise space for voice and data,
storage and networking products and services.
Recognizing that service demands were increasing and
timely response was critical, Redington went a step further
in 2010 and invested in setting up a central Network
Operations Center (NOC) to provide Remote Infrastructure
Management (RIM) support to corporate clients. With
automatic diagnosis and resolution capabilities, most of
the common problems are proactively resolved without
human intervention. This has helped in many ways
– it has reduced travel time and manpower costs and
enhanced the quality of personnel the Company deploys
for addressing issues. Redington aims to deploy remote
support at all client sites that are currently availing
maintenance contracts and facility management services
so as to deliver more effi cient and superior service.
Redington’s professional and neutral approach has made
the Company the preferred choice as a support partner
for many reputed global brands.
Redington today boasts of one of the largest networks of stable and established service centers across the country
End
to E
nd
Logis
tics
IT Infr
astr
uctu
re S
erv
ices
Bra
nd
Ag
no
stic
3PL,
Pla
nnin
g, a
nd F
orec
astin
gC
usto
miz
ed S
ervi
ce P
acka
ges
Pre
ferre
d se
rvic
e pa
rtner
of g
loba
l bra
nds.

Annual Report 2011–2012
13Annual Report
2011–2012
12Annual Report 2011–2012
13Annual Report
2011–2012
12
1 TO CONTENTS PAGE 3 CLOSE
In tandem with its brand promise of
being an end to end supply chain
solutions provider and founded on its
twenty fi ve year distribution experience
and strong network of 69 warehouses,
Redington in 2008 ventured into third
party and reverse logistics for telecom,
IT Hardware, Consumer Durables
and FMCG. In India alone Redington
already had close to a million square
feet of warehouse space spread across
70+ metros in the country. It had the
clout of a strong distribution network
with well trained and experienced staff
and offered value adding services like
packing, bar-coding, stickering, kitting,
bundling, OCI, and shrink wrapping to
the brands it supports. It was but logical
that the Company would extend its 3PL
and reverse logistics services pan India.
going the whole nine yards
Redington handles 100,000 tons of goods per annum through multimodal agencies to enable road, rail, and air transportation
The Company’s warehouse in Chennai,
the fi rst automated distribution center it
set up in 2009, is literally state-of-the-
art. It is built on a sprawling 12 acre
property with a warehouse capacity of
2.25 lakh square feet. It has 24 docks,
dock levelers and cross docks and
comes with the assurance of 24 x 7
power supply. It is fi tted with G+7 levels
for racking and G+3 shelves for storing
small items and offers storage options
for the smallest package all the way
up to half pallets, full pallets and bulk
items. All items big and small are bar-
coded. The entire warehouse is Wi-Fi
enabled. Processes are system driven
and tasks are managed through hand
held devises. The material handling
equipments are from Toyota BT in
Sweden and the WMS (eBiznet) is from
M/s Seven Hills. The Company’s Warehouse Management
Software (WMS) enables its clients to check the status of
their orders online from their own offi ces. The warehouse is
fi tted with very narrow aisle racks from Schaefer, Germany,
optimizing warehouse space and making it faster for the
VNA reach truck to maneuver a variety of equipment for
handling pieces, cases and pallets around the facility. From
a safety perspective, the distribution center is equipped
with fi re sprinklers and yard hydrants, smoke and beam
detectors.
Redington offers the entire gamut of 3PL logistics to its
clients – import clearance, warehousing, primary, secondary
and last mile deliveries, reverse logistics supported by a
call center and a consignment sale agency model.
Redington offers 3PL services for IT, telecom, lifestyle,
and FMCG products and construction products, non-
hazardous chemicals like paints, consumer durables and
household electronic goods. The highly experienced
team that supports this service fi rst studies the potential
client’s operations and maps all their requirements which
it then benchmarks with best of breed practices. It
proactively eliminates any existing redundancy and offers
a cost effective proposal. The dedicated Redington team
can take responsibility for transition, process control
implementation, compliance, and manpower recruitment
and training, continuous monitoring and periodic review
of the operations, periodic hygiene and process audits,
SOP training for process improvements and evaluation of
performance using KPIs of customer service levels.
Local deliveries are made through dedicated vehicles
and through contracted local operators for piece meal
loads. For up country deliveries, part loads are sent
through express cargo and full loads through contracted
vehicles at economical rates with assurance of quick
delivery. Redington handles 100,000 tons of goods per
annum through multimodal agencies like road, rail and air
transportation.
Clients enjoy the benefi ts of enhanced service levels in the
warehouses and better turn-around times in transportation.
Status reports and tracking information is available at
the click of a mouse. Most importantly, Redington offers
these end to end value added services all under one roof
in a dedicated multi client facility which offers economies
of scale that the Company passes back to the client. It
also enables easy scalability for seasonal business needs.
Because of its enormous and impressive experience in
supply chain management, Redington differentiates itself
by offering ideas and solutions which are best suited for a
client’s business together with the advantage of a one stop
shop to meet their objectives.
Redington offers these end to end value added services all under one roof in a dedicated multi client facility which offers economies of scale that the Company passes back to the client

Annual Report 2011–2012
15Annual Report
2011–2012
14Annual Report 2011–2012
15Annual Report
2011–2012
14
1 TO CONTENTS PAGE 3 CLOSE
nurturing the last mile
Around 2010, Redington started to see a new landscape
unfolding in IT distribution. Heralded by increasing IT
penetration into remote corners of the country, challenges
began to arise in reaching products to retailers and
into the hands of consumers. In-depth penetration and
distribution were the answer but there were limitations
as to how much it could do as a national distributor to
address the needs of tier 3, 4 and 5 retailers and resellers.
Vendors as a practice rely on regional resellers to address
these requirements of the supply chain. But in reality there
are limitations here as well.
In response to this market need and with a view to increasing
its reach into small tier 3, 4 and 5 towns Redington focused
on micro distribution through its wholly owned subsidiary,
Nook Micro Distribution Limited. Nook essentially caters
to the last mile distribution and addresses the needs of
partners with small value billings. The Company has a
presence in the four southern states of India – Tamil Nadu,
Andhra Pradesh, Kerala and Karnataka and currently has
partners in 200+ towns across these states.
Micro-distribution requires a very different approach as
compared to wholesale distribution. The operational and
supply chain processes including credit management
have to be tailor made to address this channel.The Nook
business model reaches out to all the potential towns in the
market and establishes direct engagement with the fi nal
tier of the channel, the last mile in distribution – the Reseller
and Retailer. The registration process is simple, and a basic
credit limit with fl exible payment terms is extended to start
transactions immediately. A dedicated fi eld team manages
Nook
Tamil Nadu
Kerala
Andhra Pradesh
Karnataka
ChennaiCoimbatore Cochin
BangaloreHyderabad
200+ towns18 sales offices25 warehouses
Market warehouses
Nook essentially caters to the last mile distribution and addresses the needs of partners with small value billings
a set of accounts in their territory and they communicate
regularly with the partner. It is interesting that in a few
locations the distribution warehouse is kept close to or
within the market itself so that delivery to the channel in the
main market is almost instantaneous. This is the one big
differentiator for Nook.
Nook distributes IT, non-IT products and consumer
durables through approximately 1500 retail and reseller
partners and deals with a number of leading brands.
The size of the partners in this business model is small
as compared to the regular distribution; and the system
allows them to bill small quantities, even 1 or 2 items.
Nook has to run a cost effective operation to be profi table.
A low cost business model is what will work best to handle
what is essentially a low value high volume business.
Nook’s credit decisions are secure but based more on
relationship and market knowledge rather than on ratings
and collaterals. And since they are closer to the end
customer, they have a direct feel for market pulse and
are able to predict demand through reseller feedback and
analysis. It is standard practice at Nook to stock roughly a
week’s inventory.
The ‘last mile distribution’ concept is organized business.
It is unique in its scope and proprietary in model to
Redington. A product of thought leadership, the business
is Redington’s own and no other national distributor offers
anything even close.
The Nook infrastructure is impressive. It has sales offi ces in
18 locations in South India, well spread out warehouses in
25 locations throughout the territory that can supply goods
in a snap, market warehouses in 6 main cities – Chennai,
Bangalore, Hyderabad, Cochin, Coimbatore and Vizag,
and a sales team of 100+ people. In order to manage their
unique business model, Nook has also implemented a new
ERP based on Microsoft Navision software which is hosted
on a cloud environment A pioneering idea in distribution,
Nook Micro is upbeat about its growth and confi dent of
adding signifi cant value to Redington.
Nook distributes IT, non-IT and consumer durable products through approximately 1500 retail and reseller partners
brands
nationaldistributor
regionaldistributor
subdistributor
localdistributor
customer
retailer/reseller
NOOK
last mile
distribution

Annual Report 2011–2012
17Annual Report
2011–2012
16Annual Report 2011–2012
17Annual Report
2011–2012
16
1 TO CONTENTS PAGE 3 CLOSE
fi ve years at a glance
standalone fi nancials(` in crore)
Particulars 2011-12 2010-11 2009-10 2008-09 2007-08 CAGR
Total Revenue 9,871.48 8,144.84 6,278.84 5,896.43 5,649.83 15%
EBIDTA 321.24 249.92 201.60 173.87 148.25 21%
PBT 233.29 193.40 153.16 124.25 103.57 23%
PAT 156.81 128.44 99.46 80.69 67.11 24%
Networth 908.97 764.06 675.98 614.39 569.56
Capital Employed 1,529.69 1,279.09 1,051.50 904.29 821.82
EBIDTA / Revenue 3.25% 3.07% 3.21% 2.95% 2.62%
PAT / Revenue 1.59% 1.58% 1.58% 1.37% 1.19%
Return on Average Capital Employed * 35.40% 33.57% 31.67% 31.20% 25.87%
Return on Average Equity * 50.62% 49.59% 38.97% 29.76% 24.60%
EPS ( FV ` 2) (`) # 3.94 3.25 2.54 2.07 1.72
Book Value per Share (FV of ` 2) (`) 22.81 19.28 17.19 15.78 14.63
# For EPS calculation-weighted average number of equity shares have been considered. During the year 2010–11, Face Value of shares got split from ` 10 to ` 2. EPS and Book Value for earlier years converted basis Face Value ` 2.
* Investments made in wholly owned Subsidiaries are excluded
consolidated fi nancials(` in crore)
Particulars 2011-12 2010-11 2009-10 2008-09 2007-08 CAGR
Revenue 21,222.02 16,722.65 13,277.65 12,375.99 10,542.53 19%
EBITDA 633.40 471.65 365.72 329.57 259.04 25%
PBT 450.33 351.00 275.92 219.02 177.06 26%
PAT 292.74 226.00 184.33 159.66 136.07 21%
Networth 1,322.48 1,255.32 1,075.72 1,002.20 721.49
Capital Employed 3,477.61 3,186.28 2,464.57 2,226.51 1,505.44
EBITDA / Revenue 2.98% 2.82% 2.75% 2.66% 2.46%
PAT / Revenue 1.38% 1.35% 1.39% 1.29% 1.29%
Return on Average Capital Employed * 18.44% 16.01% 14.59% 17.23% 18.86%
Return on Average Equity * 23.93% 19.95% 17.74% 19.12% 21.68%
EPS (`) # 7.35 5.72 4.70 4.10 3.50
Book Value per Share (`)* 33.18 31.67 27.36 25.74 18.53
# For EPS per share calculation-weighted average number of equity shares have been considered. During the year 2010–11, Face Value of shares got split from ` 10 to ` 2. EPS and Book Value for earlier years converted basis Face Value ` 2.
* While calculating Return On Average Capital Employed and Return On Average Equity, goodwill has been excluded / capital reserve has been included appropriately.
Note:
Financials are post acquisition of following entities - FY 06 (Redington Distribution Pte Ltd and Cadensworth (India) Ltd) and FY 08 (Easyaccess Financial Services Limited) and FY 11 (Arena)
Annual Report 2011–2012
19Annual Report
2011–2012
18Annual Report 2011–2012
19Annual Report
2011–2012
18
1 TO CONTENTS PAGE 3 CLOSE
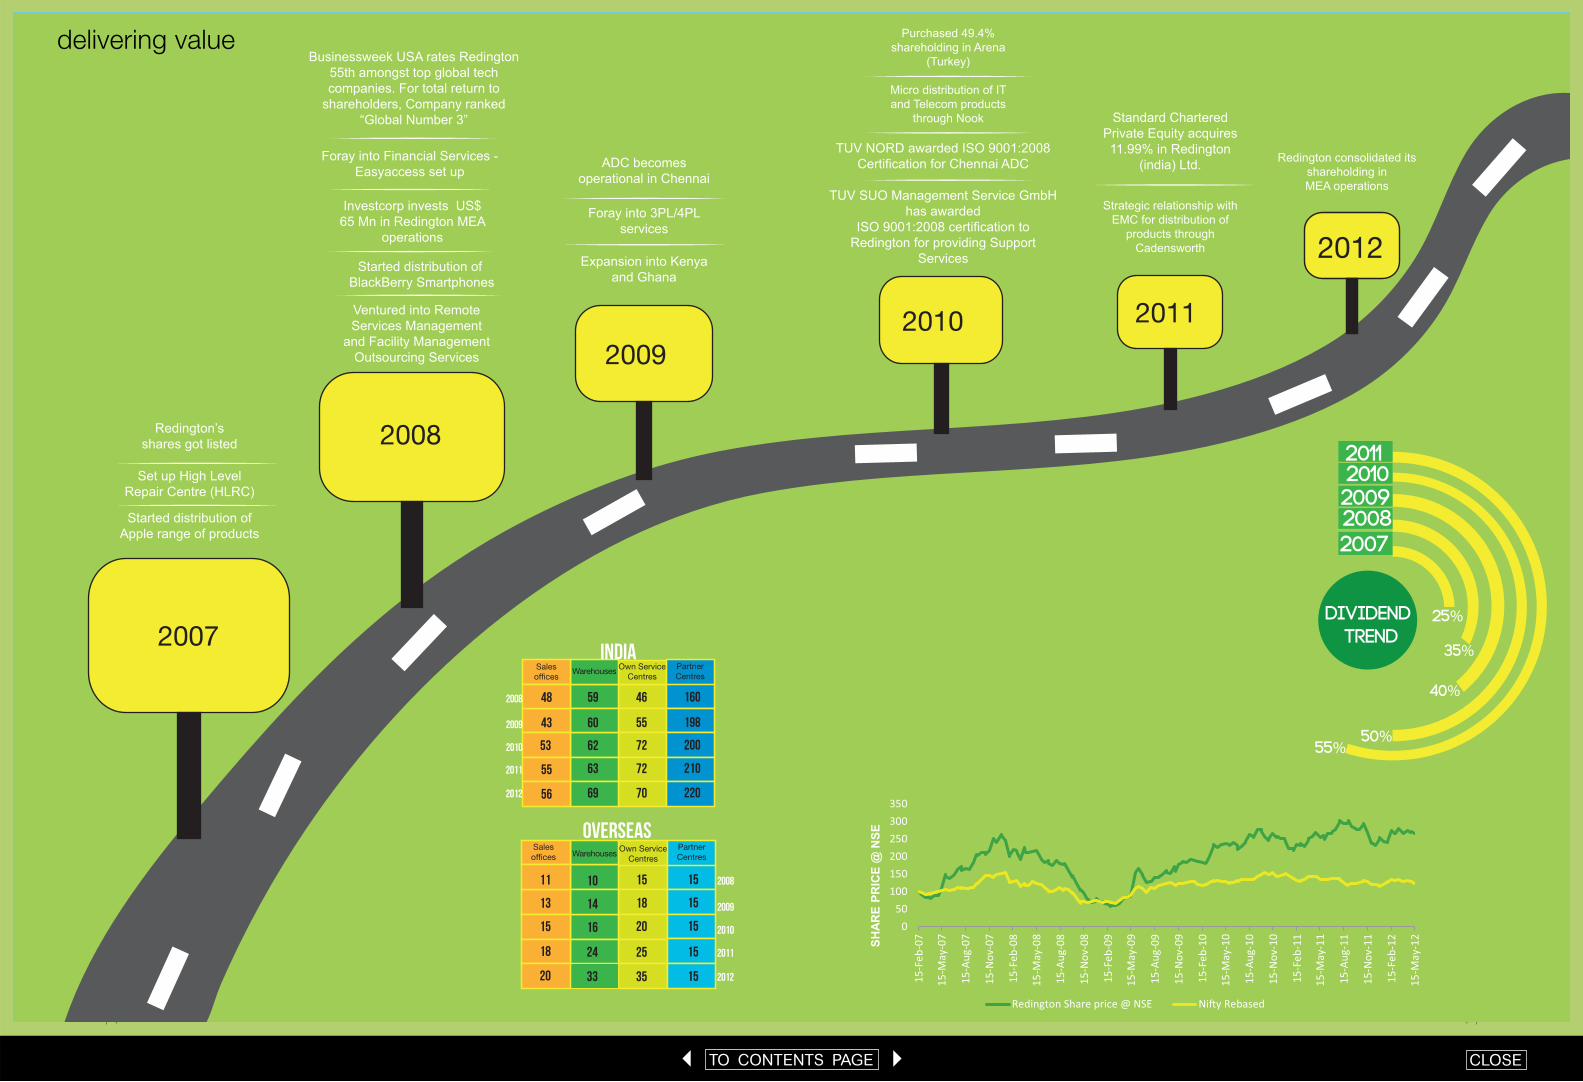
Standard Chartered Private Equity acquires 11.99% in Redington
(india) Ltd.TUV NORD awarded ISO 9001:2008
Certification for Chennai ADC
TUV SUO Management Service GmbH has awarded
ISO 9001:2008 certification to Redington for providing Support
Services
ADC becomes operational in Chennai
Foray into 3PL/4PL services
Expansion into Kenya and Ghana
Purchased 49.4% shareholding in Arena
(Turkey)
Micro distribution of IT and Telecom products
through Nook
Strategic relationship with EMC for distribution of
products through Cadensworth
Redington consolidated its shareholding in MEA operations
2009
2010 2011
2012
Redington’sshares got listed
20112010200920082007
dIVIDEND TREND
25%
35%
40%
50%55%
050
100150200250300350
15-F
eb-0
7
15-M
ay-0
7
15-A
ug-0
7
15-N
ov-0
7
15-F
eb-0
8
15-M
ay-0
8
15-A
ug-0
8
15-N
ov-0
8
15-F
eb-0
9
15-M
ay-0
9
15-A
ug-0
9
15-N
ov-0
9
15-F
eb-1
0
15-M
ay-1
0
15-A
ug-1
0
15-N
ov-1
0
15-F
eb-1
1
15-M
ay-1
1
15-A
ug-1
1
15-N
ov-1
1
15-F
eb-1
2
15-M
ay-1
2
Redington Share price @ NSE Ni�y Rebased
SHAR
E PR
ICE
@ N
SE
48
43
53
55
56
59
60
62
63
69
46
55
72
72
70
11
13
15
18
10
14
16
24
15
18
20
25
Sales
offices
Sales
officesOwn Service
Centres
Partner
Centres
Own Service
Centres
160
198
200
210
220
Partner
CentresWarehouses
Warehouses
2008
2009
2010
2011
2012
2008
2009
2010
2011
2012
2007
Businessweek USA rates Redington 55th amongst top global tech companies. For total return to
shareholders, Company ranked “Global Number 3”
Foray into Financial Services -Easyaccess set up
Ventured into Remote Services Management
and Facility Management Outsourcing Services
Investcorp invests US$ 65 Mn in Redington MEA
operations
2008
Started distribution of Apple range of products
Set up High Level Repair Centre (HLRC)
15
15
15
15
20 33 35 15
INDIA
Overseas
Started distribution of BlackBerry Smartphones
delivering value

Annual Report 2011–2012
21Annual Report
2011–2012
20Annual Report 2011–2012
21Annual Report
2011–2012
20
1 TO CONTENTS PAGE 3 CLOSE
directors’ report
To the Members,
Your Directors take pleasure in presenting the Nineteenth Annual Report of the Company for the year ended March
31, 2012.
Financial Highlights
(` in Cr)
Particulars Consolidated Standalone
2011-12 2010-11 2011-12 2010-11
Net Sales /Income from operations 21192.99 16703.77 9840.40 8131.95
Add: Other Income 29.03 18.88 31.08 12.89
Total Revenue 21222.02 16722.65 9871.48 8144.84
Less: Total Expenditure
a) Cost of goods sold 19934.75 15766.11 9280.90 7679.83
b) Staff Cost 280.37 206.57 97.53 83.10
c) Other Expenditure 373.50 278.32 171.81 131.99
Profi t before Interest, Depreciation and Tax (EBIDTA) 633.40 471.65 321.24 249.92
Less: Finance Cost 152.04 96.09 77.40 43.05
Less: Depreciation and Amortisation 31.03 24.56 10.55 13.47
Profi t before Tax (PBT) 450.33 351.00 233.29 193.40
Less: Tax Expense 111.29 86.23 76.48 64.96
Profi t after Tax (PAT) 339.04 264.77 156.81 128.44
Less: Share of loss of Associate 0.02 0.00 NA NA
Less: Minority Interest 46.28 38.77 NA NA
Net Profi t for the year 292.74 226.00 156.81 128.44
Previous year fi gures are re-grouped.
Your Directors have made the following appropriations:
(` in Crore)
Balance of Profi t brought forward from last year 298.11
Less: Dividend for the year 2010-11 including Dividend Distribution tax for additional equity
shares allotted under the ESOP scheme after the closure of the fi nancial year 0.08
298.03
Add: Profi t for the year 2011-12 156.81
Profi t available for appropriation 454.84
Less: Proposed Dividend @ ` 0.40 per Equity Share of ` 2/- each (i.e. 20%) for the
year ended March 31, 2012
15.95
Dividend Distribution Tax thereon 1.97
Transfer to General Reserve 11.76 29.68
Balance of Profi t to be carried forward 425.16
DividendYour Directors are pleased to recommend for approval of the Members a dividend of ` 0.40 per equity share of
face value ` 2/- each of the Company for the fi nancial year 2011-12. The lower dividend, this year, is to augment
resources for the growth of the Company’s immediate and future business opportunities.
PerformanceDuring the year under review, on a consolidated basis, your Company has continued to maintain the growth
momentum. There has been a good growth in terms of turnover by 26.9%, EBIDTA by 34.3% and PAT by 29.5%
over the previous year. The consolidated revenue of your Company was ` 21,222.0 Crore as against ` 16,722.7
Crore in the previous year with a CAGR of 19.1% for fi ve years. The consolidated net profi t for the year under review
was ` 292.7 Crore as against ` 226.0 Crore in the previous year with a CAGR of 21.1% for fi ve years.
The Standalone revenue of your Company was ` 9,871.5 Crore as against ` 8,144.8 Crore in the previous year
(Year-on-Year growth 21.2%) and the profi t after tax was ` 156.8 Crore as against ` 128.4 Crore in the previous year
(Year-on-Year growth 22.1%). The Earnings per Share (EPS) on a consolidated basis (based on weighted average
number of shares) increased to ` 7.4 in the year under review as compared to ` 5.7 in the previous year. EPS on
a standalone basis (based on weighted average number of shares) increased to ` 3.9 in the year under review as
compared to ` 3.2 in the previous year.
Distribution business
Information Technology ProductsAs anticipated towards the end of FY 2010-11 and projected by various Economic forums, the Information Technology
(IT) industry in India grew quite well during the fi rst half of the year under review. On the back of strong investments
by Government and large corporates in the infrastructure and Enterprise space, the IT distribution business of the
Company posted signifi cant growth during the fi rst two quarters.
The sudden and rapid downtrend in the country’s and Global business environment during the second half of FY
11-12 threw up challenges, with contraction in demand from Government and Large Enterprises. Continued high
interest rates, a dramatic weakening of the rupee and a general overhang of negative sentiments borne out of lack of
policy initiatives and decision making by the Government slowed down the demand for IT products. The deepening
of the economic crisis in Europe also cast its shadow on India’s economic metrics during the second half of the year.
The branded PC market remained under pressure from loss of traction in Government and Large Enterprise space.
The assembled / unbranded PC segment, which services a large part of Tier-3 and Tier-4 cities demand, came
under severe supply constraints starting October ’11. Due to the unprecedented fl oods in Thailand, which wiped
away almost 50% of the world’s Hard Disk Drive (HDD) manufacturing capacity, the availability of HDDs reduced
to about 35% of the total estimated demand for the period. The supply of assembled PCs, which constitute about
25% of the total Desktop & Notebook demand in the country, suffered a huge setback. This had a knock-on effect
on the demand for CPUs, Mother Boards and Memories, further impacting the overall revenue of your Company. As
a result, the overall PC market growth during FY 11-12 is estimated to have been 9-10% as against the projected
growth of 13-15%.
Your Company continued to augment its products and solutions by offering to its business partners by adding
niche vendors such as Molex, Smart Technologies and ADC India Communications. This would strengthen your
Company’s positioning as a one-stop-solution for its partners for all their requirements.
As briefl y mentioned in our last report to the shareholders, Virtualization and Cloud Computing is expected to bring
in a paradigm shift in the way IT assets are procured and deployed by both large organizations as well as Small
& Medium Enterprises. While in India the change appears to be gradual your Company proactively engaged with
vendors to take initial steps in this fi eld with the objective of being ready with appropriate offerings when the change
materializes.
Your Company’s new partnerships with VMWare, Nivio Technologies and Microsoft in the Virtualization and Cloud
Computing space would form the foundation for building a strong portfolio in this space. Its engagement with
traditional vendors like IBM, Cisco, HP, Hitachi and Oracle enables your Company to build on a portfolio that will
facilitate distribution of specifi c solutions to partners in areas of SaaS (Software as a Service), PaaS (Platform as a
Service) and IaaS (Infrastructure as a Service), to address the Cloud computing requirements of Large, Medium and
Small enterprises.
Consumer and Lifestyle ProductsThe distribution of Digital Life Style products by your Company continued to have another strong performance in the
last fi scal year. This vertical has shown a 50% revenue growth over the previous fi scal year.

Annual Report 2011–2012
23Annual Report
2011–2012
22Annual Report 2011–2012
23Annual Report
2011–2012
22
1 TO CONTENTS PAGE 3 CLOSE
Your Company is playing a signifi cant role in India’s Smartphone revolution. The Smartphone segment is expected to
grow at a Compounded Annual Growth Rate (CAGR) of over 50% over the next fi ve years. Your Company maintains
a strong position in this space with its strong relationship with Research in Motion for their BlackBerry Smartphones.
Although Research in Motion had a setback at the global level, the Company continues to be a key player in the Indian
market. Your Company has also increased its presence in the Smartphone space, with its tie-up with Huawei.
Your Company is focused on capitalizing the growth of smart communication devices in India. In the coming fi scal
year your Company will look to partner with one or more device manufacturers and also with manufacturers of
complementary products.
Your Company has positioned itself to be one of Apple’s most preferred partners in India. Apple's iPad continues
to show momentum and is the leader in the tablet segment inspite of a slew of competitors introducing lower cost
alternatives.
Your Company has taken signifi cant strides in the fast growing Digital Printing space in the past fi scal year. The
sizeable increase in the installed base of HP “Indigo” machines in India has not only contributed to revenue growth,
but has also ensured signifi cant growth in the annuity income on usage of consumables.
Hardware Support Services The IT & Telecom industry continues to witness increased intelligence and complexity in new generation products.
And in India, the industry is now penetrating the small towns and villages very rapidly. Taken together, these factors
have made pan-India after sales service vital, not just for the success of new product launches, but also for the
sustenance of growth of brands in the Indian market.
In anticipation, your Company has set up hardware support service centres, spanning the length and breadth of India.
Today, through 70 owned service centres, supported by a certifi ed franchisee network of 220 service partners, your
Company provides the full spectrum of warranty and post-warranty services to the customers of our product vendors –
covering Solution design and Consulting, Call Center support, Field Engineering support, Parts warehousing, Forward
and Reverse logistics, Imports and Re-exports, and Asset recovery . All these centres run on a robust CRM that enable
your Company to tightly manage the end-to-end service life cycle and create a great customer experience. This is one
of the key differentiators of your Company in the Supply Chain industry, and a growth enabler for our vendors.
Your Company’s support service is ISO 9001:2008 certifi ed and is in the process of being certifi ed for ISO 20000
compliance. In IT support, more than 100,000 customers avail services from your Company starting from Desktop
PCs to Enterprise systems. Your Company has successfully launched and started providing Remote Infrastructure
Management services to some large corporate customers. In the Telecom space, your Company strengthened its
Smartphone support portfolio by garnering national support authorization from HTC for their Smartphones.
During the period under review, your Company has expanded the Enterprise support portfolio through new vendor
engagements. Brocade has appointed your Company as SDP (Service Delivery Partner) and PSP (Professional
Services Partner), authorizing us to provide installation and support services for their IP Networking products.
Cisco has appointed your Company as Video Value Added Distributor after successfully meeting all Cisco service
authorization requirements. Your Company has also been appointed as ISP (Independent Service Provider) by Hitachi
Data Systems for rendering professional and support services for their entire range of Storage products.
Supply Chain Management ServicesSupply Chain Management forms a basic and integral part of the Company’s business offerings to vendors and
Channel Partners. Your Company has end-to-end logistics capabilities starting from import, warehousing, stock
movement across the geography, packing / repacking, order processing and delivery to any part within the
geographies it operates. The Company can reach its products to customers in more than 1500 cities in less than
48 hours.
To solidify the brand value of your Company’s supply chain services, your Company offers Third Party Logistics (3PL)
services ranging from imports management, warehousing till last mile transportation and Reverse logistics services.
Your Company’s 3PL services has got a diversifi ed client base of various industries including IT, Telecom, Mobiles,
Home appliances, FMCG, White Goods etc. Your Company understands the varied requirements of different clients
and has successfully offered its services to several new customers like BSH Home Appliance Ltd, Carl Zeiss, Nachus
Electronics, Cafe Coffee Day, Growmore, DSV Air & Sea Pvt.Ltd for Le Creuset and Celestial Tech Vates Ltd etc
during the year under review.
As globally the online sales model is catching-up, each of these vendors are keen to tie-up with a logistics partner
for backend support, that are similar to what your Company is already into. This emerging and fast growing concept
is going to open a window of opportunities for 3PL service providers like us and pave the way for increase and
sustainable profi tability in the years to come.
Understanding the value of an organized supply chain sector, your Company is improving its warehousing and
logistics capability in terms of infrastructure, software availability and multi locational offerings. In order to cater
to the expanding market and to reach the products on time to the clients, during the year, your Company added
warehouses in strategic locations thereby increasing the total warehouses to 70 with close to 1 Million Sq .ft.
The Reverse Logistics Center of your Company has a proven record of more than 10,000 satisfi ed customers in its
fold and its services are well received and appreciated by major brands including HP, Wipro, Acer, Intel, etc
Subsidiary CompaniesDuring the year under review your Company had made additional investments and strategic changes in the business
operations of the subsidiary companies facilitating more signifi cant contribution from them in the years to come to
the consolidated revenue stream of the Company.
We broadly describe the subsidiary operations as follows:
Indian SubsidiariesEasyaccess Financial Services Limited (Easyaccess) the wholly owned subsidiary and the Non-Banking Finance
Company (NBFC) arm of your Company, is India’s fi rst NBFC to cater to the IT distribution industry’s channel fi nance
needs. Easyaccess offers working capital facility with an operating cycle of 90 to 120 days. It provides extended
fi nance to the channel partners for them to not only carry on their trade, but also to grow their business while
ensuring better margins for your Company at the same time. Over the years, Easyaccess channel fi nancing to the IT
eco-system has gained signifi cant traction bringing considerable fi nancial discipline amongst the channel partners.
With an Independent professional team, Easyaccess pursues fi nancing the third-party corporates. While venturing
into this business has reduced Easyaccess’s dependence on Redington / Redington’s customers, it also offers an
attractive interest spread. Easyaccess has run quite successfully its fi rst four years of operation without any non-
performing assets, which is a commendable achievement.
Cadensworth (India) Limited (Cadensworth), engaged in the business of Support Services has shown signifi cant
improvement in its performance during the fi nancial year under review. The support services business for critical
parts being provided on behalf of M/s. Flash Global Logistics for their clients in India has done fairly well with addition
of new customers. The repair service business for Pegatron too has added to the revenue growth. Cadensworth
has passed the Quality Management System Standard during the ISO Audit in January 2012 and the validity of ISO
9001: 2008 Certifi cation has been extended till 18th January 2015. The LCD Panel repair opportunity seems very
promising for the coming years.
During this year, Cadensworth also made a beginning in Value Added Distribution Services. Cadensworth began its
journey in the distribution business with a strategic relationship with EMC and will focus on taking to market newer
and higher-value technologies such as data centers, virtualization , secure networking and support services. Value
added distribution services will involve developing and supporting specialist partners who reach and service complex
IT projects.
Nook Micro Distribution Limited (Nook Micro) - During FY 12, Nook Micro had its full year of operation post
embarking on its journey with low cost micro distribution last year. It added over 1500 Channel Partners in 175 towns
across 96 districts all over South India. Nook Micro is positioned to be the preferred intermediary to address the last
mile connect amongst national distributors, vendors, retailers and assemblers. To strengthen the fi nancial position of
Nook Micro, your Company has made an additional investment of ` 6 Crore in its equity.
More vendors and distributors are looking forward to tie up with Nook Micro to get in depth coverage of the market
for their products. Nook Micro has also started managing the distribution of Consumer Electronics products in South
India from April 2012. This will enable the Company to maximize the revenue by utilizing the existing infrastructure

Annual Report 2011–2012
25Annual Report
2011–2012
24Annual Report 2011–2012
25Annual Report
2011–2012
24
1 TO CONTENTS PAGE 3 CLOSE
and micro distribution strategy. By adding consumer electronics products, the Company is expected to add up
another 1500 channel partners in South India.
Overseas SubsidiariesYour Company’s overseas subsidiaries grew both revenues and profi tability impressively by 30% across each of the
markets it participated including Singapore & South Asia, Middle East, Turkey and Africa. Fortunately, the general
economic slowdown and geo political tensions in the Middle East and North Africa (MENA) region did not slow down
the pace of growth.
Redington Gulf has retained its leadership position by being rated as the number one distributor in ME for 6 years
in succession. Redington Gulf continues to enrich its brand portfolio and foster growth by adding new brands in
the Volume and Value added distribution portfolio. The new brands added during the year to its portfolio include
Seagate, Microsoft, LG, Tripplite, Lifesize, EMC, Siemens, Barracuda Networks, Belkin and Targus.
The hardware support service of your Company’s overseas subsidiary is well positioned as a neutral service provider.
The total number of service centers in MEA has increased to 49 making Redington Gulf the biggest service provider
in MEA with the widest network. The scope of support services have been extended to mobile devices and consumer
electronics in addition to IT hardware products.
Your Company’s overseas subsidiaries’ 29 warehouses were linked to a central warehouse admeasuring about
95,000 square feet in Jebel Ali, Dubai. The Automatic Distribution Centre in Jebel Ali has incorporated a superior
technology allowing it to enhance the effi ciencies and productivity.
Redington Gulf has once again retained the EMEA Channel Academy 2012 awards – the “MENA Preferred Distributor
Award” for delivering excellent services to its partners. Redington was also awarded as the “Retail Volume Distributor
of the Year” for the 6th consecutive year.
Though the countries affected in the Arab spring are slowly recovering, the ongoing political tensions in the region
and in the surrounding countries has a hangover effect on the general business environment. During the year under
review, the 19% depreciation of Turkish Lira against USD has resulted in lower consumption and a detrimental
impact on sales and profi ts of Arena, the listed Company in Turkey in which your Company had invested 49.4% in
November 2010.
Employee Stock Option Plan 2008During the year, out of the lapsed options issued under the Employee Stock Option Plan 2008 your Company has
granted 173,212 options to the employees of the Company and its subsidiaries. The details of the options granted
and options in force as required to be disclosed under Clause 12 of the Securities and Exchange Board of India
(Employee Stock Option Scheme & Employee Stock Purchase Scheme) Guidelines, 1999 are set out in Annexure
“A” of this Report.
Additional Information relating to Conservation of Energy, Technology Absorption and Expenditure in R & D
The operations of the Company involve low energy consumption. Adequate measures have, however, been taken
to conserve energy.
The Company continues to use the latest technologies for improving the quality of the services it offers.
Since the Company doesn’t involve in manufacturing activities it didn’t incur any expenditure on Research and
Development
DirectorsDuring the year, post acquisition of 11.99% stake in the Company, Standard Chartered Private Equity the largest
Private Equity Shareholder of the Company has nominated Mr. Nainesh Jaisingh, as their representative on the
Board. Mr. Nainesh Jaisingh was appointed as an Additional Director of the Company with effect from 5th August
2011. Mr. Lin, Tai-Yang was co-opted on the Board as an additional director in place of Mr. Huang Chi Cheng, the
earlier nominee of M/s. Synnex Global Limited, Taiwan with effect from 28th October 2011. M/s Nainesh Jaisingh
and Lin Tai-Yang will hold offi ce till the date of this Annual General Meeting. The Company has received notice from
members of the Company, under Section 257 of the Companies Act, 1956, proposing their appointment as Directors
of the Company, along with the requisite deposit. Resolutions for their appointment as Directors of the Company
are included in the notice of the ensuing Annual General Meeting. At the Meeting of the Board of Directors held on
25th May 2012, the Board approved appointment of Mr. Mukul Nag as an Alternate Director to Mr. Nainesh Jaisingh.
During the year, Mr. Steven A Pinto, Independent Director resigned from the Board with effect from 28th October 2011.
The Company continues to avail the services of Mr. Steven A Pinto as a Director on the Board of M/s Easyaccess
Financial Services Limited, (Easyaccess) a wholly owned subsidiary Company in an Independent capacity. Ms. Chew
Lee Fang, who had been an independent Director on the Board of Easyaccess for over four years, was appointed
as an additional director with effect from 5th August 2011 and subsequently she stepped down from the Board with
effect from 27th January 2012.
The Board places on record its appreciation for the services rendered by Mr. Huang Chi Cheng, Mr. Steven A Pinto
and Ms. Chew Lee Fang during their tenure as Directors.
In accordance with the provisions of the Companies Act, 1956 and the Articles of Association of your Company, Mr.
R. Jayachandran and Prof. J. Ramachandran, Directors would retire by rotation at the forthcoming Annual General
Meeting and being eligible, offer themselves for re-appointment.
The tenure of appointment of Mr. Raj Shankar as Deputy Managing Director will come to an end on 25th July 2012.
The Board of Directors at their meeting held on 25th May 2012 have approved re-appointment of Mr. Raj Shankar
as Deputy Managing Director for a period of fi ve years with effect from 26th July 2012 subject to the approval of
shareholders in the ensuing Annual General Meeting and the approval of the Central Government, since he being a
non-resident.
Directors’ Responsibility StatementPursuant to Section 217(2AA) of the Companies Act, 1956, the Directors confi rm:
i. that in the preparation of the annual accounts, the applicable accounting standards have been followed along
with proper explanations relating to material departures, if any;
ii. that appropriate accounting policies have been selected and applied consistently, and that the judgments and
estimates made are reasonable and prudent so as to give a true and fair view of the state of affairs of your
Company as at 31st March 2012 and of the profi t for the said year;
iii. that proper and suffi cient care has been taken for the maintenance of adequate accounting records in accordance
with the provisions of the Companies Act, 1956, for safeguarding the assets of your Company and for preventing
and detecting fraud and other irregularities;
iv. that the annual accounts have been prepared on a going concern basis.
Credit RatingAmidst the turbulent macroeconomic conditions, your Company’s credit ratings remained stable this year. CRISIL
has retained its rating on the Letter of Credit, short term loan and short term debt programme at ‘CRISIL A1+’ (read
as A one plus). Also CRISIL while reaffi rming its rating on cash credit and working capital demand loan as ‘CRISIL
AA-‘ (read as Double A minus), revised the outlook as ‘Negative’. CRISIL has stated that the outlook may be revised
to ‘Stable’ if the Company’s capital structure improves signifi cantly as per expectations.
ICRA, also reaffi rmed its rating on the short term debt program/Commercial Paper, Non-fund based facilities and
short term fund based facilities at ‘ICRA A1+’ (read as A one plus). It has also reaffi rmed its ratings for the Long term
Fund based facilities as ‘ICRA AA-’ ( read as Double A minus) and revised the outlook from stable to negative.
Particulars of EmployeesFor the fi nancial year under review none of the employees fall under the revised ceiling limits prescribed under section
217 (2A) of the Companies Act, 1956.
Annual Report 2011–2012
27Annual Report
2011–2012
26Annual Report 2011–2012
27Annual Report
2011–2012
26
1 TO CONTENTS PAGE 3 CLOSE
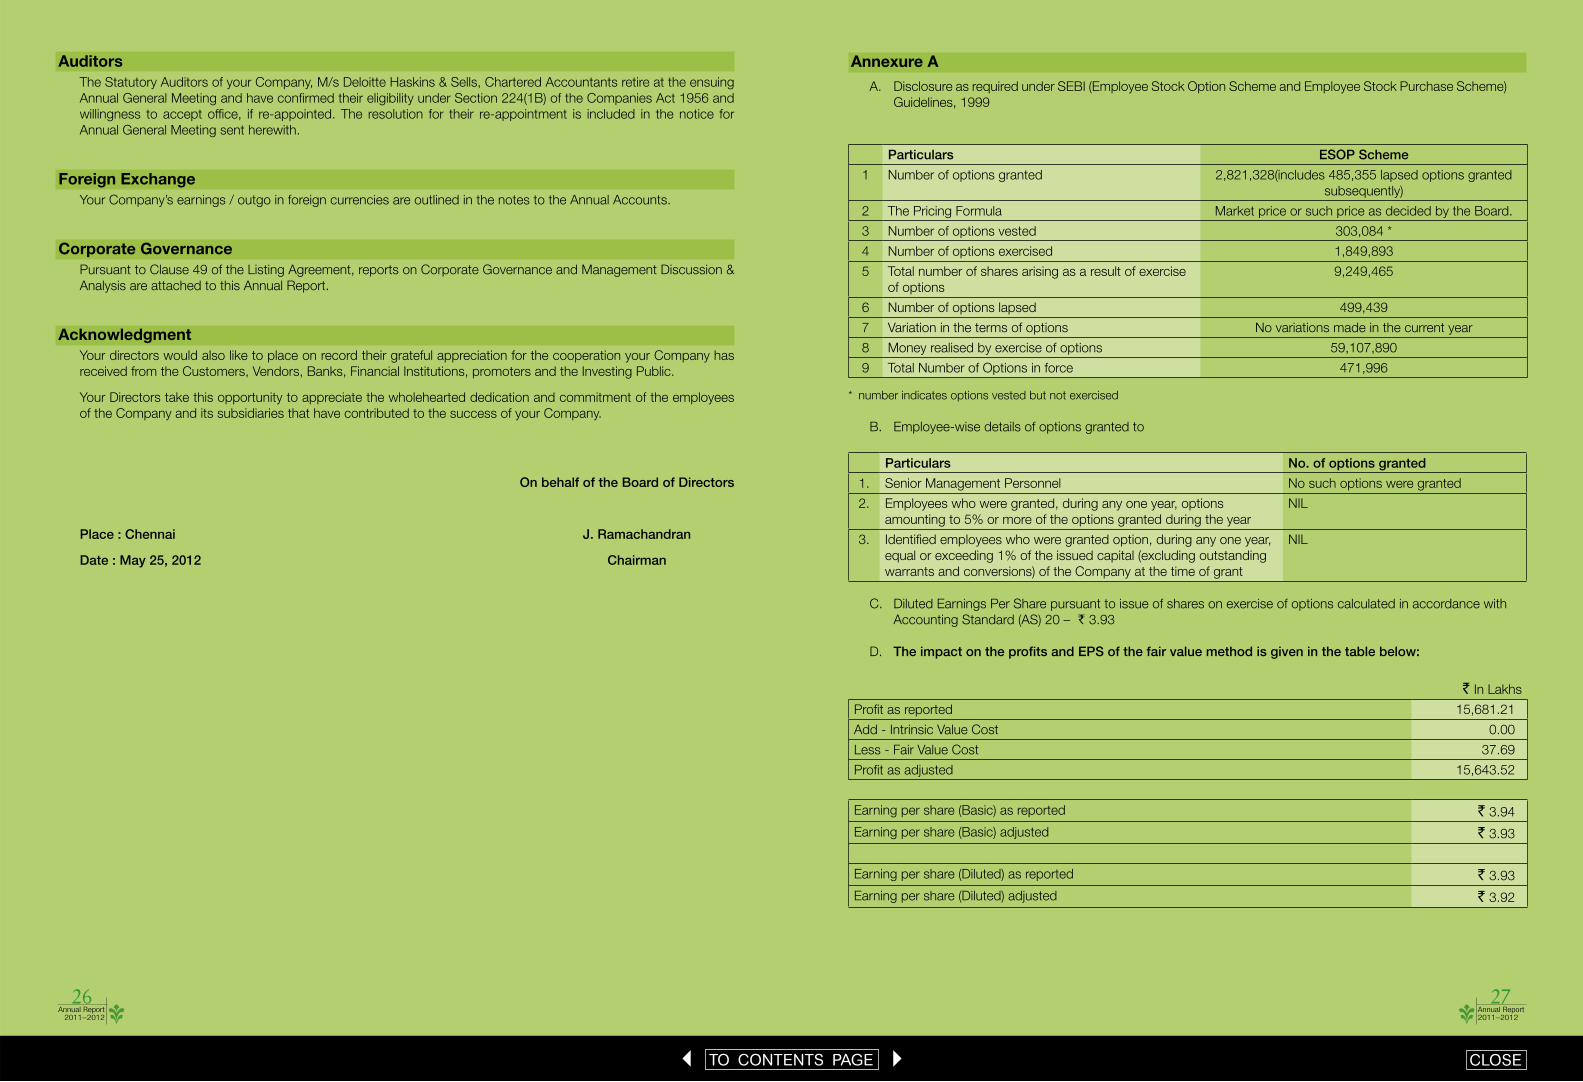
AuditorsThe Statutory Auditors of your Company, M/s Deloitte Haskins & Sells, Chartered Accountants retire at the ensuing
Annual General Meeting and have confi rmed their eligibility under Section 224(1B) of the Companies Act 1956 and
willingness to accept offi ce, if re-appointed. The resolution for their re-appointment is included in the notice for
Annual General Meeting sent herewith.
Foreign ExchangeYour Company’s earnings / outgo in foreign currencies are outlined in the notes to the Annual Accounts.
Corporate GovernancePursuant to Clause 49 of the Listing Agreement, reports on Corporate Governance and Management Discussion &
Analysis are attached to this Annual Report.
AcknowledgmentYour directors would also like to place on record their grateful appreciation for the cooperation your Company has
received from the Customers, Vendors, Banks, Financial Institutions, promoters and the Investing Public.
Your Directors take this opportunity to appreciate the wholehearted dedication and commitment of the employees
of the Company and its subsidiaries that have contributed to the success of your Company.
On behalf of the Board of Directors
Place : Chennai J. Ramachandran
Date : May 25, 2012 Chairman
Annexure A
A. Disclosure as required under SEBI (Employee Stock Option Scheme and Employee Stock Purchase Scheme)
Guidelines, 1999
Particulars ESOP Scheme
1 Number of options granted 2,821,328(includes 485,355 lapsed options granted
subsequently)
2 The Pricing Formula Market price or such price as decided by the Board.
3 Number of options vested 303,084 *
4 Number of options exercised 1,849,893
5 Total number of shares arising as a result of exercise
of options
9,249,465
6 Number of options lapsed 499,439
7 Variation in the terms of options No variations made in the current year
8 Money realised by exercise of options 59,107,890
9 Total Number of Options in force 471,996
* number indicates options vested but not exercised
B. Employee-wise details of options granted to
Particulars No. of options granted
1. Senior Management Personnel No such options were granted
2. Employees who were granted, during any one year, options
amounting to 5% or more of the options granted during the year
NIL
3. Identifi ed employees who were granted option, during any one year,
equal or exceeding 1% of the issued capital (excluding outstanding
warrants and conversions) of the Company at the time of grant
NIL
C. Diluted Earnings Per Share pursuant to issue of shares on exercise of options calculated in accordance with
Accounting Standard (AS) 20 – ` 3.93
D. The impact on the profi ts and EPS of the fair value method is given in the table below:
` In Lakhs
Profi t as reported 15,681.21
Add - Intrinsic Value Cost 0.00
Less - Fair Value Cost 37.69
Profi t as adjusted 15,643.52
Earning per share (Basic) as reported ` 3.94
Earning per share (Basic) adjusted ` 3.93
Earning per share (Diluted) as reported ` 3.93
Earning per share (Diluted) adjusted ` 3.92

Annual Report 2011–2012
29Annual Report
2011–2012
28Annual Report 2011–2012
29Annual Report
2011–2012
28
1 TO CONTENTS PAGE 3 CLOSE
E. Weighted average exercise price of Options whose
(a) Exercise price equals market price ` 396.50
(b) Exercise price is greater than market price Nil
(c) Exercise price is less than market price Nil
Weighted average fair value of options whose
(a) Exercise price equals market price ` 171.72
(b) Exercise price is greater than market price Nil
(c) Exercise price is less than market price Nil
F. Method and Assumptions used to estimate the fair value of options granted during the year:
The fair value has been calculated using the Black Scholes Option Pricing model
The Assumptions used in the model are as follows:
Date of grant 5-Dec-11
1. Risk Free Interest Rate 8.45%
2. Expected Life 4.25
3. Expected Volatility 46.00%
4. Dividend Yield 1.45%
5. Price of the underlying share in market at the time of the option grant ** ` 396.50
** 1 option = 5 shares so the stock price has been adjusted accordingly
Compliance Certifi cate in respect of ESOP Scheme
We have examined the books of account and other records maintained by Redington (India) Limited (“the
Company”) for the year ended 31st March 2012 and on the basis of such examination, information/explanations and
representations given to us, we confi rm that the Company’s Employee Stock Option Scheme 2008 (“the Scheme”)
has been implemented in accordance with the “Securities and Exchange Board of India (Employee Stock Option
Scheme and Employee Stock Purchase Scheme) Guidelines, 1999” and Resolution passed in the Extra-ordinary
General Meeting of the Company held on 27th February 2008.
For Deloitte Haskins & SellsChartered Accountants
(Registration No. 008072S)
B RamaratnamPartner
(Membership No. 21209)
Place: Chennai
Date: May 25, 2012
report on corporate governance
1. REDINGTON’S PHILOSOPHY ON CORPORATE GOVERNANCECorporate Governance is about the ethos of the organization and about fulfi lling the laid out collective goals in a
process compliant way. The Company believes that good corporate governance has to be woven into the DNA of
the organization helping to build a distinctive culture from top to bottom. Therefore the practices of your Company
extend beyond legal provisions and voluntarily adherence to a set of strong governance principles. In the present
competitive Corporate scenario, your Company ensures high ethical standards and a disciplined approach in
pursuing excellence in all its sphere of business. The Management believes that they are the trustees of the investors’
capital and other stakeholders’ interests. They believe their business practices should be founded on transparency,
disclosure, accountability and fi nancial controls, the four pillars of a good corporate governance system. They
‘Communicate externally, in a faithful manner, about how they run internally’.
2. BOARD OF DIRECTORS:To address emerging risks and guide the governance ecosystem of your Company to the next level of maturity in a
global economic and business environment, your Company has structured its Board with people of varied strengths
and experience. It values the participation of all members during the Board meetings and strongly believes that for
effective board governance the management of the Company should be transparent.
To facilitate participation of the directors, your Company after consulting with the Board, circulates in advance the
tentative calendar of Meetings of the Board and its Committees, to all the directors. In this reporting year, your
Company has organized meeting of the Board of Directors via Video Conferencing three times accruing savings to
the Company.
The Composition of the Board Members is optimally structured with the participation of representatives of the
Management, Shareholders and Independent directors.
a) Composi on:Currently, the Board comprises of ten members including three Non executive Independent Directors, Four Non
executive Directors and three Executive Directors. The Chairman of the board is a Non-Executive Independent
Director.
The Composition of the Board of Directors is depicted in Table 1 below.
b) Board Mee ngs:During the Financial Year, the Board of Directors of the Company met six times on 19th May 2011, 5th August 2011, 28th October 2011, 14th January 2012, 27th January 2012 and 26th March 2012. The maximum interval
between any two Board meetings was well within the maximum gap allowed of four months.
c) A endance and other Directorships:Table 1: Composition of the Board and Attendance of the Directors at the Board meetings held during 2011-12 and last Annual General Meeting:
Name CategoryNo. of board meetings
during 2011-12
Whether Attended last AGM
Held Attended
Prof. J. Ramachandran Non- Executive Chairman, Independent
Director
6 4 Yes
Mr. R. Jayachandran@ Non- Executive Director 6 3 No
Mr. Tu, Shu – Chyuan@ Non- Executive Director 6 5 No
Mr. Lin Tai-Yang@*** Non- Executive Director 6 2 NA
Mr. Huang Chi Cheng@ # Non- Executive Director 6 1 No
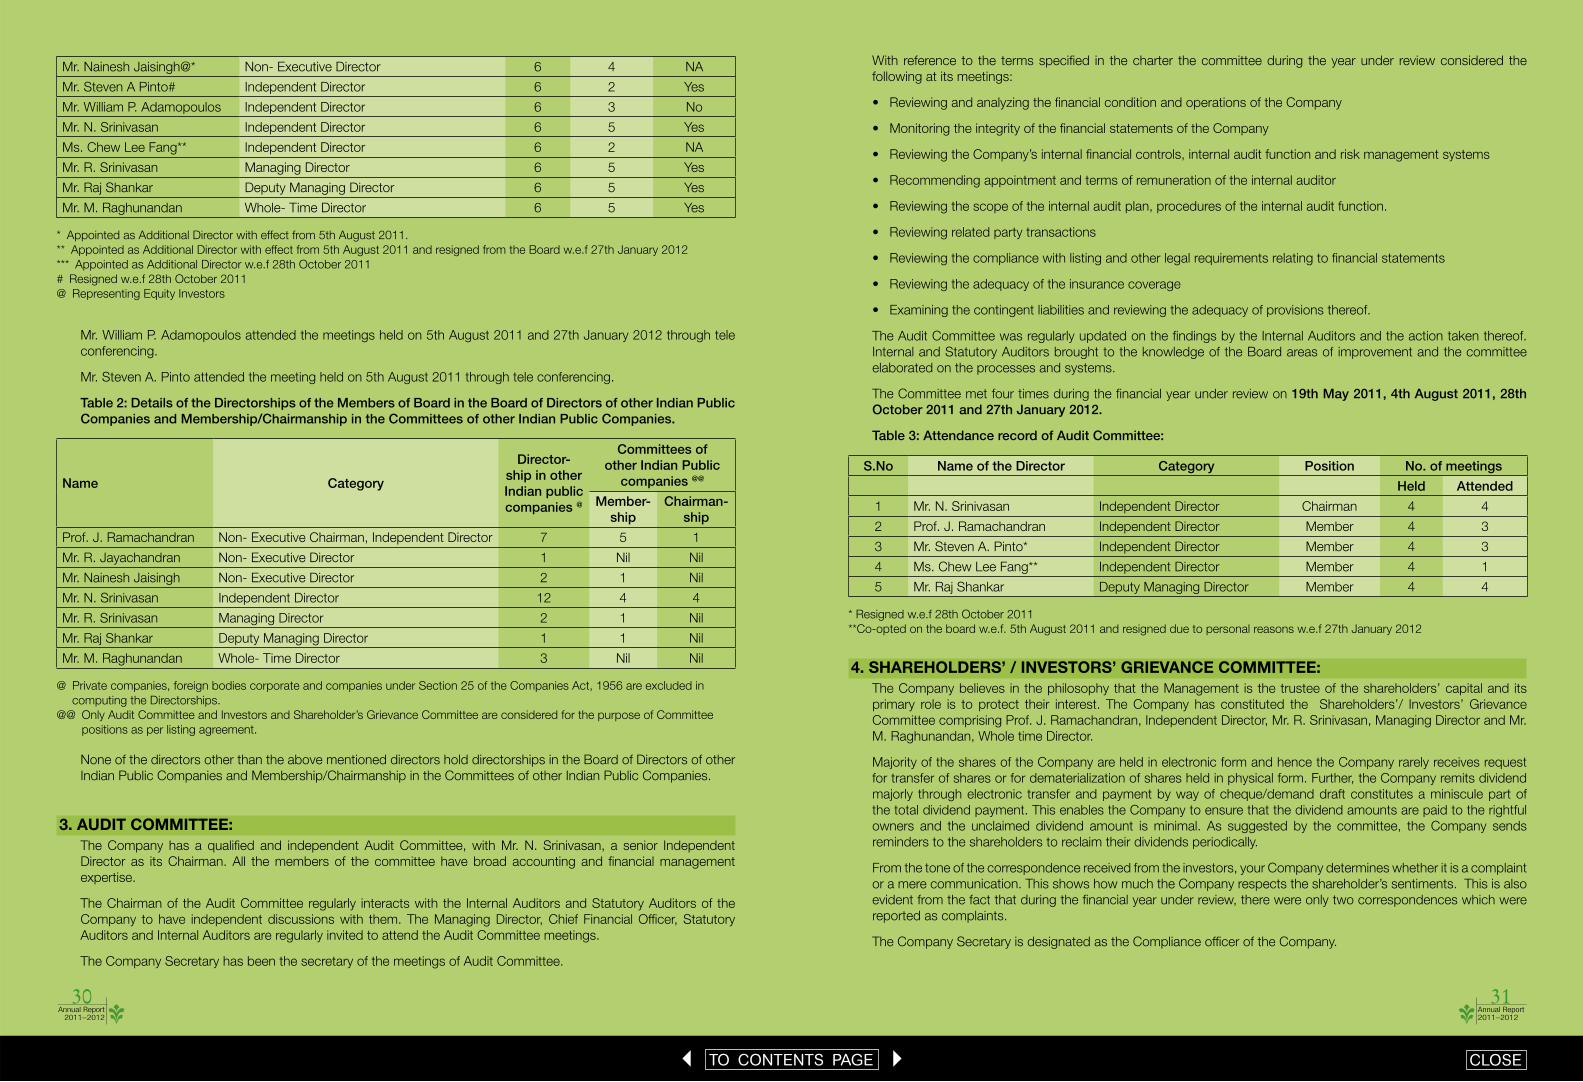
Annual Report 2011–2012
31Annual Report
2011–2012
30Annual Report 2011–2012
31Annual Report
2011–2012
30
1 TO CONTENTS PAGE 3 CLOSE
Mr. Nainesh Jaisingh@* Non- Executive Director 6 4 NA
Mr. Steven A Pinto# Independent Director 6 2 Yes
Mr. William P. Adamopoulos Independent Director 6 3 No
Mr. N. Srinivasan Independent Director 6 5 Yes
Ms. Chew Lee Fang** Independent Director 6 2 NA
Mr. R. Srinivasan Managing Director 6 5 Yes
Mr. Raj Shankar Deputy Managing Director 6 5 Yes
Mr. M. Raghunandan Whole- Time Director 6 5 Yes
* Appointed as Additional Director with effect from 5th August 2011.
** Appointed as Additional Director with effect from 5th August 2011 and resigned from the Board w.e.f 27th January 2012
*** Appointed as Additional Director w.e.f 28th October 2011
# Resigned w.e.f 28th October 2011
@ Representing Equity Investors
Mr. William P. Adamopoulos attended the meetings held on 5th August 2011 and 27th January 2012 through tele
conferencing.
Mr. Steven A. Pinto attended the meeting held on 5th August 2011 through tele conferencing.
Table 2: Details of the Directorships of the Members of Board in the Board of Directors of other Indian Public Companies and Membership/Chairmanship in the Committees of other Indian Public Companies.
Name Category
Director-ship in other Indian public companies @
Committees of other Indian Public
companies @@
Member-ship
Chairman-ship
Prof. J. Ramachandran Non- Executive Chairman, Independent Director 7 5 1
Mr. R. Jayachandran Non- Executive Director 1 Nil Nil
Mr. Nainesh Jaisingh Non- Executive Director 2 1 Nil
Mr. N. Srinivasan Independent Director 12 4 4
Mr. R. Srinivasan Managing Director 2 1 Nil
Mr. Raj Shankar Deputy Managing Director 1 1 Nil
Mr. M. Raghunandan Whole- Time Director 3 Nil Nil
@ Private companies, foreign bodies corporate and companies under Section 25 of the Companies Act, 1956 are excluded in
computing the Directorships.
@@ Only Audit Committee and Investors and Shareholder’s Grievance Committee are considered for the purpose of Committee
positions as per listing agreement.
None of the directors other than the above mentioned directors hold directorships in the Board of Directors of other
Indian Public Companies and Membership/Chairmanship in the Committees of other Indian Public Companies.
3. AUDIT COMMITTEE:The Company has a qualifi ed and independent Audit Committee, with Mr. N. Srinivasan, a senior Independent
Director as its Chairman. All the members of the committee have broad accounting and fi nancial management
expertise.
The Chairman of the Audit Committee regularly interacts with the Internal Auditors and Statutory Auditors of the
Company to have independent discussions with them. The Managing Director, Chief Financial Offi cer, Statutory
Auditors and Internal Auditors are regularly invited to attend the Audit Committee meetings.
The Company Secretary has been the secretary of the meetings of Audit Committee.
With reference to the terms specifi ed in the charter the committee during the year under review considered the
following at its meetings:
• Reviewing and analyzing the fi nancial condition and operations of the Company
• Monitoring the integrity of the fi nancial statements of the Company
• Reviewing the Company’s internal fi nancial controls, internal audit function and risk management systems
• Recommending appointment and terms of remuneration of the internal auditor
• Reviewing the scope of the internal audit plan, procedures of the internal audit function.
• Reviewing related party transactions
• Reviewing the compliance with listing and other legal requirements relating to fi nancial statements
• Reviewing the adequacy of the insurance coverage
• Examining the contingent liabilities and reviewing the adequacy of provisions thereof.
The Audit Committee was regularly updated on the fi ndings by the Internal Auditors and the action taken thereof.
Internal and Statutory Auditors brought to the knowledge of the Board areas of improvement and the committee
elaborated on the processes and systems.
The Committee met four times during the fi nancial year under review on 19th May 2011, 4th August 2011, 28th October 2011 and 27th January 2012.
Table 3: Attendance record of Audit Committee:
S.No Name of the Director Category Position No. of meetings
Held Attended
1 Mr. N. Srinivasan Independent Director Chairman 4 4
2 Prof. J. Ramachandran Independent Director Member 4 3
3 Mr. Steven A. Pinto* Independent Director Member 4 3
4 Ms. Chew Lee Fang** Independent Director Member 4 1
5 Mr. Raj Shankar Deputy Managing Director Member 4 4
* Resigned w.e.f 28th October 2011
**Co-opted on the board w.e.f. 5th August 2011 and resigned due to personal reasons w.e.f 27th January 2012
4. SHAREHOLDERS’ / INVESTORS’ GRIEVANCE COMMITTEE:The Company believes in the philosophy that the Management is the trustee of the shareholders’ capital and its
primary role is to protect their interest. The Company has constituted the Shareholders’/ Investors’ Grievance
Committee comprising Prof. J. Ramachandran, Independent Director, Mr. R. Srinivasan, Managing Director and Mr.
M. Raghunandan, Whole time Director.
Majority of the shares of the Company are held in electronic form and hence the Company rarely receives request
for transfer of shares or for dematerialization of shares held in physical form. Further, the Company remits dividend
majorly through electronic transfer and payment by way of cheque/demand draft constitutes a miniscule part of
the total dividend payment. This enables the Company to ensure that the dividend amounts are paid to the rightful
owners and the unclaimed dividend amount is minimal. As suggested by the committee, the Company sends
reminders to the shareholders to reclaim their dividends periodically.
From the tone of the correspondence received from the investors, your Company determines whether it is a complaint
or a mere communication. This shows how much the Company respects the shareholder’s sentiments. This is also
evident from the fact that during the fi nancial year under review, there were only two correspondences which were
reported as complaints.
The Company Secretary is designated as the Compliance offi cer of the Company.

Annual Report 2011–2012
33Annual Report
2011–2012
32Annual Report 2011–2012
33Annual Report
2011–2012
32
1 TO CONTENTS PAGE 3 CLOSE
The scope of reference to the committee is broadly as follows
(i) Oversee the redressal of investors’ complaints pertaining to share transfers, non-receipt of annual reports,
dividend payments, issue of duplicate certifi cates etc
(ii) Review of the amount lying in the unclaimed dividend account
(iii) Review of the movement in the major shareholders of the Company
(iv) Review the process of monitoring the Registrar and Share Transfer Agents.
During the year under review, the Committee met four times on the following dates: 28th April 2011, 22nd July 2011, 28th October 2011 and 27th January 2012.
Table 4: Attendance record of shareholders' / Investors' Grievance committee:
S. No Name of the Director Category Position No. of meetings
Held Attended
1 Prof. J. Ramachandran Independent Director Chairman 4 4
2 Mr. R. Srinivasan Managing Director Member 4 4
3 Mr. M. Raghunandan Whole time Director Member 4 4
During the year, 2 complaints were received from the investors and were resolved. No complaints from the investors
were pending as at 31st March 2012.
5. REMUNERATION COMMITTEE:To ensure that remuneration to the Board and senior management is in line with the strategic aims of the business,
the Company has a remuneration committee. During the year, the committee met on 19th May 2011 and 22nd July 2011. At its meetings the committee considered the following:
• Payment of performance linked Bonus to Whole-time Director
• Payment of commission to the Independent Directors
• Review of the remuneration of the Senior Management team
• Recommendation for the appointment of Executive directors
Ms. Chew Lee Fang was the Chairperson of the Committee for the period from 28th October 2011 till 27th January
2012. During her tenure no meeting of the Committee took place.
Table 5 Attendance record of Remuneration Committee:
S.No Name of the Director Category Position No. of meetings
Held Attended
1 Mr. N. Srinivasan Independent Director Member 2 2
2 Mr. R. Srinivasan Managing Director Member 2 2
3 Mr. M. Raghunandan Whole-time Director Member 2 2
4 Mr. Steven A. Pinto* Independent Director Chairman 2 2
5 Ms. Chew Lee Fang** Independent Director Chairperson 2 0
* Resigned w.e.f 28th October 2011
** Co-opted on the board w.e.f. 5th August 2011 and resigned due to personal reasons w.e.f 27th January 2012
Table 6: Details of remuneration paid / payable to Directors for the fi nancial year ended 31st March 2012
Name of Director Salary & Perquisites (` / Lacs)
Commission (` / Lacs)
Performance Linked Bonus
(` / Lacs)*
Sitting Fees (` / Lacs)
Prof J Ramachandran - 11.90 - 2.05
Mr. Steven A Pinto - 11.35 - 1.00
Mr. William P. Adamopoulos - 11.60 - 0.45
Mr. N. Srinivasan - 11.75 - 1.85
Ms. Chew Lee Fang - - - 0.45
Mr. M Raghunandan 24.00 - 16.00 -
Total 24.00 46.60 16.00 5.80
* Provisions MadeProvision of ` 50 Lakh is made towards payment of commission for the Financial Year 2011–12 and requires approval of shareholders at the ensuing Annual General Meeting.
Table 7: Shareholding of Directors in the Company as on 31st March 2012.
S. No Name of the Director Category No. of Shares % to Equity capital
Options granted
(Nos)1. Prof. J. Ramachandran Independent Director 1,25,000 0.031 25,000
2. Mr. N. Srinivasan Independent Director 93,750 0.024 25,000
3. Mr. William P. Adamopoulos Independent Director - - 25,000
4. Mr. R. Srinivasan Managing Director 2,00,000 0.050 1,00,000
5. Mr. Raj Shankar Deputy Managing Director 4,69,946 0.118 1,00,000
6. Mr. M. Raghunandan Whole time Director 95,250 0.024 76,143
6. CODE OF BUSINESS CONDUCT AND ETHICS FOR DIRECTORS AND SENIOR MANAGEMENT
Your Company has laid down a code of conduct for all Board members and senior management of the Company
with an aim to ensure effective and best business practices and strict adherence to the legal requirements as well.
The code of conduct has been posted on the Company’s website www. redingtonindia.com.
The Board members and the Senior Management personnel affi rm compliance with the code on an annual basis. A
declaration to this effect has been given by the Managing Director as below:
I hereby confi rm that the Company has obtained affi rmation from all the members of the Board and Senior Management that they have complied with the Code of Business Conduct and Ethics for Directors and Senior Management in respect of the fi nancial year 2011-12.
R. Srinivasan
Managing Director
7. GENERAL BODY MEETINGS:
Table 8: Location and time of last 3 Annual General Meetings:
Year Location Date Day Time
2010-2011 Narada Gana Sabha, Mini Hall, No. 314, T.T.K
Road, Chennai - 600 018.22nd July 2011 Friday 10.00 A.M.
2009-2010 Narada Gana Sabha, Mini Hall, No. 314, T.T.K
Road, Chennai - 600 018.20th July 2010 Tuesday 10.00 A.M.
2008-2009 Narada Gana Sabha, Mini Hall, No. 314, T.T.K
Road, Chennai - 600 018.24th July 2009 Friday 02.00 P.M.
No extra-ordinary General Meeting was convened during the last fi nancial year.

Annual Report 2011–2012
35Annual Report
2011–2012
34Annual Report 2011–2012
35Annual Report
2011–2012
34
1 TO CONTENTS PAGE 3 CLOSE
Table No.9: Details of Special Resolutions passed in the last three Annual General Meetings
Year Special resolutions passed2010-11 NIL
2009-10 Approval for extending the estimated time by further two years for utilization of net proceeds as
contained in ‘the object of the issue’ clause of prospectus dated 31st January 2007, for setting up
of Automated Distribution Centers (ADCs) at Chennai, Mumbai, New Delhi and Kolkata including the
revised size and capacity.
Approval to make any loan to any other body corporate, give any guarantee or provide any security
in connection with a loan from time to time and / or to invest in securities of any other body
corporate, any sum or sums of money(ies) which together with any loan made / given any guarantee
or provided any security by the Company may exceed the aggregate of the paid-up capital of
the Company and its free reserves, that is to say reserves not set apart for any specifi c purpose,
provided that the total amount of such loan made / given, any guarantee or security provided,
or investment made by the Company shall not at any time exceed Rs.1000 Crores (Rupees One
Thousand Crores only).
2008-09 Approval to amend the clauses 6.1, 15 and 21.1 of the Employee Share Purchase Scheme as given
below
6.1 The Company shall issue / allot a maximum of 15,52,500 shares under this scheme. In addition
to the aforementioned shares, the Trust is entitled to purchase from the open market and transfer to
the employees such number of equity shares of the Company as may be determined by the Board /
Compensation Committee from time to time.
15 WITHHOLDING FRINGE BENEFIT TAX
All shares issued under the Scheme shall be subject to any applicable taxes (including withholding
tax and Fringe Benefi t Tax)
21.1 The scheme shall continue to be in effect for a period of 72 months from the “Effective Date” or
from the date of approval of variations to the Scheme, if any, unless terminated by the Company or
the Group.
During the year, the Company has not passed any resolution through postal ballot.
8. SUBSIDIARY COMPANIES:The Company has one Wholly Owned material non listed Indian subsidiary Company viz., Easyaccess Financial
Services Limited. As per clause 49 of the Listing Agreement, the Company has nominated Prof. J. Ramachandran,
Chairman of the Board as director on the Board of the Subsidiary Company.
The Company also has two wholly-owned unlisted non-material Indian subsidiary companies viz Nook Micro
Distribution Limited and Cadensworth (India) Limited. In pursuit of achieving better governance, the Company has
also appointed the Whole time director of the Company as its nominee on the Board of these companies.
The Board of Directors of the Company has been apprised of the performance of the subsidiary companies. Minutes
of the unlisted subsidiaries are also placed before the Board.
9. DISCLOSURES:
RELATED PARTY TRANSACTIONS:There were no material related party transactions during the year 2011-12 that are prejudicial to the interest of the
Company.
NON COMPLIANCE BY THE COMPANY, PENALTIES, STRICTURES:The Company has complied with the requirements of the Stock Exchange/ SEBI/ other Statutory Authorities on all
matters related to capital markets wherever applicable, during the last fi ve years. There are no penalties or strictures
imposed on the Company by Stock Exchange or SEBI or any Statutory Authorities relating to the above.
APPOINTMENT / RE- APPOINTMENT OF DIRECTORSMr. R. Jayachandran and Prof. J. Ramachandran Directors of the Company are liable to retire by rotation and being
eligible have offered themselves for re-appointment.
The Board of Directors of the Company appointed Mr. Nainesh Jaisingh and Mr. Lin Tai-Yang as the Additional
Directors of the Company at their meetings held on 5th August 2011 and 28th October 2011 respectively. Notices
have been received from the members of the Company proposing their appointment as the Directors liable to retire
by rotation.
Mr. Raj Shankar is being re-appointed as Deputy Managing Director for a further period of fi ve years effective from
26th July 2012 subject to the approval of the Shareholders at the ensuing Annual General Meeting.
The details of above Directors seeking re-appointment and appointment at the forth coming Annual General Meeting
are provided in table 10:
Table 10: Brief Resume of Directors seeking Re-appointment/ appointment
Name of the Director Mr. R. JayachandranBrief resume of the Director Mr. R. Jayachandran is a Chartered Accountant and is a member of the Institute
of Certifi ed Public Accountant of Singapore. He has undergone an advanced
management program at the Harvard Business School. He is a Non-Executive
Chairman of OLAM International Limited, a listed Singapore entity.
Mr. Jayachandran is the Singapore’s High Commissioner to the Republic of Mauritius
and he is also a board member of the National Heritage Board, Singapore.
Expertise in Specifi c Functional Area
Finance and Business Strategy
Directorship in Indian Public Limited Companies other than Redington (India) Limited
Napier Healthcare Solutions (India) Limited
Membership of Committees in Indian Public Limited Companies other than Redington (India) Limited
Nil
Name of the Director Prof. J. RamachandranBrief resume of the Director J. Ramachandran is professor of strategy and international business at the
Indian Institute of Management Bangalore. He primarily studies the growth and governance challenges of business groups, multinational corporations and creative fi rms. Over the last decade, he has been engaged in developing a research and teaching program centered on the strategic behavior of fi rms in India.
Professor Ramachandran was recently honored as the fi rst Bain Fellow in India, and academic recognition for his work includes: the IMD FDC Award for Best Paper in Strategy / IB Theory from the Academy of Management USA; best paper citations from the Strategic Management Society, USA and the Academy of Management, USA; the Tata Steel-IIMB award for best case on corporate social responsibility; best case awards from the European Foundation for Management Development [EFMD], Association of Management Development Institutions in South Asia Schools [AMDISA], The Central and East European Management Development Association [CEEMAN], and Association of Indian Management Schools [AIMS] as well as best teacher awards at IIM Bangalore.
A qualifi ed Chartered and Cost Accountant, and a Fellow of the Indian Institute of
Management Ahmadabad, Prof. Ramachandran has been a Visiting Professor at
INSEAD, Fontainebleau, France, the Wharton School of the University of Pennsylvania,
USA; and the Carlson School of Management, University of Minnesota, USA. He has
also served Indian Institute of Management Bangalore as a member of the Board of
Governors.
Annual Report 2011–2012
37Annual Report
2011–2012
36Annual Report 2011–2012
37Annual Report
2011–2012
36
1 TO CONTENTS PAGE 3 CLOSE
Expertise in Specifi c Functional Area
Strategic management; International Business
Directorship in Indian Public Limited Companies other than Redington (India) Limited
• Reliance Communications Limited
• Sasken Communication Technologies Limited
• Bhoruka Power Corporation Limited
• Indofi l Industries Limited
• Infotech Enterprises Limited
• Tejas Networks Limited
• Easyaccess Financial Services Limited
Membership of Committees in Indian Public Limited Companies other than Redington (India) LimitedAudit Committee • Reliance Communications Limited
• Sasken Communication Technologies Limited
• Tejas Networks Limited
• Infotech Enterprises Ltd.
Shareholders/ Investors Grievance Committee
• Reliance Communications Limited
• Sasken Communication Technologies Limited
Name of the Director Mr. Raj ShankarBrief resume of the Director Mr. Raj Shankar is a postgraduate from Birla Institute of Technology and Sciences
(BITS), Pilani. He has 30+ years of professional experience working within and
outside India in diverse sectors, including pharmaceuticals (Novartis India Limited)
and textiles (Grasim Industries Limited). He joined Redington Gulf FZE in April 2001
as its Whole-time Director. He is currently responsible for Redington’s International
operations in Middle East, Turkey, Africa, Singapore and South Asia.
Expertise in Specifi c Functional Area
Business Strategy and General Management
Directorship in Indian Public Limited Companies other than Redington (India) Limited
Easyaccess Financial Services Limited
Membership of Committees in Indian Public Limited Companies other than Redington (India) Limited
Easyaccess Financial Services Limited – Audit Committee
Name of the Director Mr. Nainesh JaisinghBrief resume of the Director Mr. Nainesh is the Managing Director and Global Co-Head of SCPE and has been
with the business since 2000. In 2001, he co-founded Fin Ventures, a global Venture
Capital Fund sponsored by Standard Chartered Bank, headquartered at Singapore.
In 2003, Mr. Nainesh was instrumental in the launch of the Merlion India Fund, a JV
between SCPE and Temasek, Singapore. With SCPE, Mr. Nainesh has made and
managed successful investments in several sectors – Software / BPO, Engineering,
Pharmaceuticals, Shipbuilding, Auto Components, Power Generation, Travel, and
Financial Services.
Expertise in Specifi c Functional Area
Business Strategy
Directorship in Indian Public Limited Companies other than Redington (India) Limited
• Amalgamated Bean Coffee Trading Company Limited
• Powerica Limited
Membership of Committees in Indian Public Limited Companies other than Redington (India) Limited
• Powerica Limited – Audit Committee
Name of the Director Mr. Lin Tai-Yang
Brief resume of the Director Mr. Lin, an Accounting graduate from the National Chengchi University, Taipei,
Taiwan, has an overall work experience of 11 years. He joined M/s .Synnex
Technology International Corporation as Accounting Manager in 2000 and currently
serves as its Director of Finance Planning and Management. Mr. Lin is also a
Director on the Board of several public and private limited companies including
Bestcom Infotech Corporation, Synnex (Thailand) Public Company Ltd., Syntech
Asia Ltd and Pt Synnex Metrodata Indonesia.
Expertise in Specifi c Functional Area
Accounting and Business Strategy
Directorship in Indian Public Limited Companies other than Redington (India) Limited
Nil
Membership of Committees in Indian Public Limited Companies other than Redington (India) Limited
Nil
10. COMPLIANCE WITH THE NON-MANDATORY REQUIREMENTSThe Company has complied with all the mandatory requirements mentioned in Clause 49 of the Listing Agreement.
Apart from this the Company has also adopted the following non-mandatory requirements in pursuit of its adoption
of best governance practices.
• The Company has set up a Remuneration Committee and detailed particulars are furnished in Para 5 above.
• The Company has formulated a policy to provide a framework to promote responsible and secure whistle
blowing. It protects employees who raise a concern about serious irregularities within the Company.
The Company will implement other non-mandatory requirements as and when required and/or deemed necessary
by the Board.
11. MEANS OF COMMUNICATION:The Company has established procedures to disseminate in a planned manner, relevant information to the
shareholders, analysts, employees and the society at large.
A. The quarterly, half yearly and annual results are published in Business Standard and Makkal Kural which
are national and local dailies.
B. The quarterly, half yearly and annual results and shareholding pattern are also posted on the website of the
Company (www.redingtonindia.com). C. The Company also intimates the Stock Exchanges all price sensitive information and such other matters
which in its opinion are Material and of relevance to the investors/ shareholders.
D. The Management Discussion and Analysis on fi nancial and operational performance of the Company is
provided in the Annual Report.
The Company has designated ‘[email protected]’ as an email id for the purpose of registering complaints
by investors and displayed the same on the Company’s website.
12. GENERAL SHAREHOLDERS’ INFORMATION:
I. Annual General Meeting
Date : 31st July 2012
Time : 10.00 A.M.
Venue : Mini Hall, Narada Gana Sabha, No.314 (Old No. 254), T.T.K Road, Chennai – 600 018.

Annual Report 2011–2012
39Annual Report
2011–2012
38Annual Report 2011–2012
39Annual Report
2011–2012
38
1 TO CONTENTS PAGE 3 CLOSE
II. Financial Calendar : 1st April to 31st March
(Tentative Calendar for the Financial Year 2012-13)
Adoption of results for & considering other items for the I Quarter: 31st July 2012
Adoption of results for & considering other items for the II Quarter: 2nd November 2012
Adoption of results for & considering other items for the III Quarter: 31st January 2013
Adoption of results for & considering other items for the IV Quarter: Before 30th May 2013
III. Date of Book Closure : 25th July 2012 till 31st July 2012.
IV. Dividend payment date : 29th August 2012.
V. Listing on Stock Exchanges
Name Address Scrip/ Stock code
National Stock Exchange of India Ltd Exchange Plaza, 5th Floor, Plot No. C/1, G Block,
Bandra Kurla Complex, Bandra (E), Mumbai – 400 051.
REDINGTON
Bombay Stock Exchange Ltd Phiroze Jeejeebhoy Towers, Dalal Street, Fort,
Mumbai – 400 001.
532805
Listing fees for the period April 2011 to March 2012 have been paid to National Stock Exchange of India Limited and
Bombay Stock Exchange Limited.
VI. Depositories (Stock Code) : INE891D01026
VII. Registrar and Share Transfer Agents : M/s. Cameo Corporate Services Limited,
Subramanian Building,
No.1, Club House Road,
Chennai - 600 002.
Phone No: +91 44 2846 0390 (5 lines)
Website : www.cameoindia.com
VIII. Share Transfer System:
Share Transfer Committee:A Share transfer committee has been constituted with three directors and the Chairman being an Independent
Director
S.No Name of the Director Category Position
1 Mr. N. Srinivasan Independent Director Chairman
2 Mr. R. Srinivasan Managing Director Member
3 Mr. M. Raghunandan Whole time Director Member
The share transfer committee registers the shares sent for transfers in physical form provided the documents are
complete and valid in all respects within a period of 15 days from the date of receipt of such documents. The
committee meets at regular intervals for issue of duplicate share certifi cates, transmission of shares and other related
complaints.
IX. Reconciliation of Share Capital Audit:Audit of Share Capital for reconciling total number of shares held in NSDL and CDSL and in the physical form with
the issued / paid-up capital for each of the quarters in the fi nancial year ended 31st March 2012 is carried out by
a Practising Company Secretary and a Report on the same is placed before the Board. As per the reports issued
there are no variations/exceptions found in the total number of shares of the Company issued held both in physical
and electronic forms.
X. MARKET PRICE DATA AND LIQUIDITY:
S.No. Month NSE BSE
High Low Closing No of Shares Traded
High Low Closing No of Shares Traded
1 Apr-11 88.25 77.75 88.25 5,676,658 87.85 77.55 87.85 1,181,191
2 May-11 87.25 82.45 84.70 7,482,204 87.60 82.35 84.00 792,890
3 Jun-11 87.20 80.90 86.60 10,538,952 87.55 80.95 86.30 2,991,086
4 Jul-11 99.95 87.10 97.45 25,109,600 99.75 87.25 96.95 76,803,190
5 Aug-11 99.00 89.10 95.85 5,361,762 99.00 89.35 95.50 569,717
6 Sep-11 98.90 90.20 92.00 2,366,864 98.85 90.40 91.35 441,840
7 Oct-11 95.05 90.10 95.05 3,690,584 94.95 89.80 94.95 472,481
8 Nov-11 97.00 77.30 77.90 3,380,500 97.05 77.45 77.45 1,387,110
9 Dec-11 83.30 70.05 81.65 12,331,237 83.45 70.25 81.75 2,097,838
10 Jan-12 82.70 77.30 78.40 4,715,235 83.00 77.40 78.55 521,697
11 Feb-12 92.95 78.55 87.10 6,075,021 93.05 78.25 87.10 1,494,560
12 Mar-12 92.20 86.00 88.25 7,589,629 92.15 85.65 88.00 2,568,700
NIFTY Vs REDINGTON

Annual Report 2011–2012
41Annual Report
2011–2012
40Annual Report 2011–2012
41Annual Report
2011–2012
40
1 TO CONTENTS PAGE 3 CLOSE
SENSEX Vs REDINGTON
XI. DISTRIBUTION OF SHAREHOLDING AS ON 31ST MARCH 2012.
Share Holding No. of Shareholders
% of Total Shareholders
Amount of Share Capital (`)
% of Total share capital
2-5000 15,486 95.88 9,621,998 1.21
5001-10000 215 1.33 1,645,570 0.21
10001-20000 140 0.87 2,051,828 0.26
20001-30000 59 0.36 1,480,006 0.19
30001-40000 39 0.24 1,378,606 0.17
40001-50000 21 0.13 981,136 0.12
50001-100000 63 0.39 4,475,556 0.56
100001 & Above 129 0.80 775,521,690 97.28
Total 16,152 100.00 797,156,390 100.00
XII. STATEMENT SHOWING SHAREHOLDING PATTERN AS ON 31ST MARCH 2012.
Category No. of holders No. of shares % of shareholding
Promoter Holding
Foreign bodies corporate 1 84,027,302 21.08
Total of Promoter Holding 1 84,027,302 21.08
Non promoter holding
Mutual funds/ UTI 40 38,752,323 9.72
Foreign Institutional Investors 93 145,491,795 36.50
Non Institutions
Bodies Corporate 465 15,479,173 3.89
Indian Public 15,161 9,578,305 2.40
NRI’s/Foreign Nationals/Investors 353 104,699,988 26.27
Others 39 549,309 0.14
Total of Non promoter Holding 16,151 314,550,893 78.92
Grand Total 16,152 398,578,195 100.00
XIII. DEMATERIALISATION OF SHARESThe shares of the Company are compulsorily traded in dematerialised form by all categories of investors. As on 31st
March 2012, 76.31% shares of the Company are held in dematerialised form.
XIV GREEN INITIATIVE UPDATESYour Company is proud to state that as a green initiative which supports paperless compliance, it has initiated
sending soft copy of notice and Annual Reports to its shareholders who have registered their e-mail ids with their
Depository Participants. The Company also sends regular reminders to the registered email ids available with the
Company for encashing the dividends.
To make the initiative more successful, we request shareholders to register their e-mail Ids and the changes therein
with their Depository Participants (DPs) or with the Registrar and Share transfer agents from time to time for paving
the way for sustainable green practices.
Nevertheless a printed Annual Report will be mailed to members on request.
XV. ECS MANDATE:In order to enable the Company to serve the investors better, shareholders are requested to update their bank
accounts with their respective depository participants.
XVI. GDR/ ADRsThere are no outstanding GDRs/ ADRs/ Warrants or any convertible instruments.
XVII. LOCATIONS OF BRANCHES:The Company has the following distribution offi ces, warehouses and services centers both in India and overseas.
Particulars India Overseas operations (through subsidiary companies)
Sales offi ces 56 20
Warehouses 69 33
Owned Services centers 70 35
Partner Service centers 220 15
XVIII. ADDRESS FOR CORRESPONDENCE:The shareholders may address their communication / suggestions / grievances / queries to the Registrar and Share
Transfer Agents at the address mentioned in earlier Para VII or to:
Mr.M. Muthukumarasamy
Company Secretary
Redington (India) Limited,
Ground Floor, “Centre Point”
Plot No. 8 and 11 (SP),
Thiru-Vi-Ka Industrial Estate,
Ekkaduthangal, Guindy,
Chennai – 600 032
Tel: +91 44 4224 3353
Fax: +91 44 4224 3148
Email : [email protected]
The Company has a website namely www.redingtonindia.com. The website provides detailed information about the
Company, its products and services, locations of its corporate offi ce and various sales offi ces etc. The quarterly
results, annual reports and shareholding patterns are updated on the website of the Company.
Annual Report 2011–2012
43Annual Report
2011–2012
42Annual Report 2011–2012
43Annual Report
2011–2012
42
1 TO CONTENTS PAGE 3 CLOSE
CERTIFICATE UNDER SUB CLAUSE V OF CLAUSE 49 OF LISTING AGREEMENT
We, R. Srinivasan, Managing Director and S.V. Krishnan, Chief Financial Offi cer of the Company hereby confi rm and
certify that
a. we have reviewed fi nancial results for the year ended March 31, 2012 and that to the best of our knowledge and
belief;
i. these statements do not contain any materially untrue statement or omit any material fact or contain
statements that might be misleading.
ii. these statements together present a true and fair view of the Company’s affairs and are in compliance with
existing accounting standards, applicable laws and regulations.
b. There are, to the best of our knowledge and belief, no transactions entered into by the Company during the
period which are fraudulent, illegal or violative of the Company’s code of conduct.
c. We accept responsibility for establishing and maintaining internal controls for fi nancial reporting and that we
have evaluated the effectiveness of internal control systems of the Company pertaining to fi nancial reporting
and we have disclosed to the auditors and the Audit Committee, defi ciencies in the design or operation of such
internal controls, if any, of which we are aware and the steps we have taken or propose to take to rectify these
defi ciencies.
d. We have indicated to the auditors and the Audit Committee
i. that no signifi cant changes in internal control over fi nancial reporting during the period;
ii. that changes in accounting policies during the period have been disclosed in the notes to the fi nancial
statements; and
iii. that no instances of signifi cant fraud of which we have become aware and the involvement therein, if any,
of the management or an employee having a signifi cant role in the Company’s internal control system over
fi nancial reporting.
Place : Chennai R. Srinivasan S.V. Krishnan
Date : May 25, 2012 Managing Director Chief Financial Offi cer
Auditors Certifi cate on Corporate Governance
To the Members of Redington (India) Limited
We have examined the compliance of conditions of Corporate Governance by Redington (India) Limited (“the Company”)
for the year ended 31st March 2012 as stipulated in Clause 49 of the Listing Agreement of the said Company with Stock
Exchanges.
The compliance of conditions of Corporate Governance is the responsibility of the Management. Our examination was
limited to procedures and implementation thereof, adopted by the Company for ensuring the compliance of the conditions
of Corporate Governance. It is neither an audit nor an expression of opinion on the fi nancial statements of the Company.
In our opinion and to the best of our information and according to the explanations given to us by the Directors and
Management, we certify that the Company has complied with the conditions of Corporate Governance as stipulated in
clause 49 of the above mentioned Listing Agreement.
We further state that such compliance is neither an assurance as to the future viability of the Company nor the effi ciency
or effectiveness with which the Management has conducted the affairs of the Company.
For Deloitte Haskins & SellsChartered Accountants
(Registration No:008072S)
B. RamaratnamPlace : Chennai Partner
Date : 25th May 2012 (Membership No.21209)
management discussion and analysis
Global OutlookThe global economic outlook continues to be extremely challenging and volatile and is expected to remain so in
the immediate future. The economies of most developed countries are passing through a stressful period with their
governments trying to tackle recession, counter growing unemployment, and control the levels of high sovereign
debt. While the American economy shows defi nite signs of stability and improvement in industrial output and
employment fi gures during successive quarters, the sovereign debt and unemployment problems emerging in many
European Union nations seriously impact the stability of the Global Economy.
With growth limited mostly to emerging nations, many economists predict that this may not be suffi cient to counter
the economic crisis of the developed countries. With more and more countries being forced to adopt severe austerity
measures to bring their economies back on track, overall revival of demand for products and services is likely to take
far longer than anticipated earlier.
Indian OutlookFor most observers of the Indian Economy, the Indian problem is home-grown, rather than caused by external
impacts. While exports to developed nations would be a concern and global oil prices — the single largest import bill
for the Government of India — continue to increase, the bottom-line is that the country failed to build on its growth
momentum of the last decade and stimulate and encourage local industries and services.
Lack of decision making in a key areas of economic-policy has prevented businesses from taking full advantage
of domestic demand which has remained latent, as well as inhibited international investors from reposing full faith
in the Indian economy. As per a recent report in The Economist, a fi nancial magazine, India’s national growth
accelerated from an average of about 6% in the late 1980s to as much as 9%+ during the closing stages of the last
decade. Sound policy decisions and reforms follow-ups, essential for maintaining growth momentum, have not been
forthcoming. India’s growth rate has steadily declined each quarter of the last fi scal year to a low of 6.1% during
Q4. Even if the policy makers fi nally start instituting necessary growth initiatives, it is unlikely that the overall growth
would exceed 6.5% - 7% in the immediate foreseeable future.
CRISIL Research has lowered India’s GDP growth forecast for 2012-13 to 6.5 % from its March 2012 estimate of
7.0 %. The forecast has been scaled down in view of rising downside risks from recession in the Eurozone, muted
domestic investment demand, a domestic policy logjam, and limited fi scal and monetary options for stimulating the
economy. The growth performance in 2011-12 is India’s worst in the past nine years and a repeat of that in 2012-13
will make any meaningful recovery that much more diffi cult.
According to ICRA, India’s economic growth is expected to remain moderate in 2012-13 unless substantial policy
measures are undertaken to boost investment sentiments. The Associated Chambers of Commerce and Industry of
India (ASSOCHAM), in reaction to the Economic Survey 2011-12 has observed that India needs immediate fi nancial
and structural reforms to boost falling business confi dence and growth momentum. A survey of CEOs of leading
Indian business establishments reveals that their confi dence level today is at its lowest in many years.
Nature of BusinessYour Company is a Supply Chain Solutions provider in emerging markets and makes value offerings in all segments
of the business line. As a group, Redington is present in India, the sub-continent including Sri Lanka, Bangladesh,
Maldives (operating out of Singapore), Middle East, Turkey, Africa, and the CIS countries. Starting as a pure-play
IT distributor, your Company has successfully distinguished itself from its competitors by transforming itself into a
Supply Chain Solutions Provider with tailored offerings for various customer segments.
Your Company has successfully altered the total value of the Supply Chain offering by being a pioneer in integrating
Post-sales Support services and Financial Services as unique components.
Industry StructureThe fast rate of adoption of Information Technology over the past two decades by Indian businesses and the
Indian consumer can be essentially attributed to a multitiered distribution structure. This has facilitated availability
of products and technology across the geographical spread of the country while providing the necessary fi nancial
credit structure that has been key to the explosive growth of this industry.

Annual Report 2011–2012
45Annual Report
2011–2012
44Annual Report 2011–2012
45Annual Report
2011–2012
44
1 TO CONTENTS PAGE 3 CLOSE
With almost 70% of the domestic IT hardware and software demand being met through the tiered distribution
structure, the vendors have been able to very quickly reach out to their customers with newer products and
solutions.
The Digital Lifestyle products space, the Smart phone market, and the Digital Printing Solutions industry are much
more fragmented with many vendors choosing to adopt a more direct approach to the market. While more vendors
have increasingly recognised the necessity to have a structured, multitiered channel driven approach, the strength
and advantages of national distribution remains largely untapped by these segments.
Strengths, Opportunities and Concerns
StrengthsYour Company’s core competencies lie in identifying the ever changing requirements of its vendors and business
partners and developing capabilities to meet those requirements better than its competitors.
The requirements of vendors for Volume-driven products is met by offering sales and warehousing infrastructure
across the length and breadth of large geographies, providing post-sales support services, and enabling a well-
structured credit frame-work.
The essentials of the Value business portfolio require complex logistics solutions – starting from the vendors’
shipping locations and often ending at the end-user’s premises. The nature of the value business also calls for mid-
market development skills and tailored commercial offerings to meet differing requirements of different projects. Your
Company’s strength in the SMB space and in project execution has made it the distributor-of-choice for most of its
“Value” vendors and partners.
Your Company’s strategy to establish ground level presence in diffi cult-to-penetrate markets in the META region has
made it the pre-eminent distribution partner in that geography. Your Company’s practice of actually following the
oft-repeated theory of “global practices – local presence” has enabled it to structure its operations to meet country-
specifi c requirements.
Its thrust on partnering with more vendors for adding new products in its business boutique beyond the territories
of the domestic market without compromising market share is one of the greatest assets of your Company. Your
Company has a strong presence in over 23 countries, is associated with over 120 leading global IT and telecom
brands and has over 32,000 channel partners. Having 76 sales offi ces, 102 warehouses and 105 own service
centres, and 235 partner service centres, your Company can do well in the diffi cult to operate geographies.
In short, the inherent strength of your Company derives from its absolute belief in sound, sustainable business
practices and an ability to continuously address the diverse needs of its business partners.
OpportunitiesYour Company’s growing expertise in 3PL service offerings present it with an extremely interesting and promising
business opportunity. The Indian Logistics market is projected to witness a CAGR of around 26% during forecast
period (2011-2013), reaching total revenue of nearly US$ 4.6 Billion by March 2013. Your Company aims to
identify suitable niches within this vast business opportunity and leverage its core strength in logistics to become a
meaningful player in this space.
Recognizing that Africa is a truly untapped market, your Company established operations in key countries in that
region some years ago. Currently penetration levels for the products your Company deals in are very low and presents
a huge opportunity. Improving socio-economic conditions, emergence of democratically elected governments in
some countries and increasing investments in infrastructure will accelerate adoption of IT and Communications
products. We believe that your Company is uniquely positioned to take maximum advantage of any business
opportunity that may present itself. The success in these markets will result from implementation of best practices
from other established operations, availability of trained employees, strengths in stocking and fi nance; ability to
provide accurate market and fi nance reports for vendors and customers; developing partner confi dence through
joint market activities; and providing valuable advice to channel partners based on experience.
Your Company’s ability to engage itself with its vendors in the implementation of their marketing strategies for newer
technologies and products will ensure that it can utilize all unique opportunities. Storage applications to handle Big
Data and increasing acceptance of Virtualization and Cloud Computing will provide your Company with the next
growth opportunity as it develops capabilities in these business verticals.
ConcernsOverall, the uncertainty of consumer, commercial and enterprise demand of the products that your Company deals
in will be the single biggest challenge in the immediate future. A diffi cult fi nancial eco-system, where availability of
funds at a reasonable cost is proving to be challenge, can further aggravate the situation.
In a depressed business scenario, too many players will be chasing too few opportunities, and hence sustaining both
Revenue and Profi ts will be diffi cult. The constant challenge faced due to vendors cutting down available channel
margins and continuously trying to look at cheaper go-to-market alternatives is a signifi cant concern.
Our success with brand BlackBerry presents a unique challenge in itself due to the problems that the brand faces
globally.
The rupee has depreciated by more than 18% since May 2011, with serious all-round impact on the economy.
With the rupee breaching the exchange rate of 55-to-the-dollar mark, profi t margins of our vendors has come
under severe pressure, and this has resulted in price increases for the consumer. The depreciating rupee has also
impacted the non-branded PC segment as imported components have become signifi cantly more expensive. This
will have a defi nite impact on demand. The wholesale and distribution industry will need to continuously re-invent
itself with relevant value offerings to remain competitive and profi table. Those amongst existing players who are able
to successfully weather this challenge will survive and prosper.
Risk managementThe fundamentals of the Distribution Business lie in skilful business risk management. Since carrying stocks and
extending credit is the basic requirement of multi-tiered product distribution, these two services also defi ne the two
risk-areas that your Company has to manage smartly for sustained profi tability and long-term business health.
Pricing uncertainty due to fl uctuating foreign exchange rates, product and technology obsolescence, dependency
on major vendors, supplier compliance norms, and regulatory challenges are some other important dynamic risk
areas that your Company has to routinely manage to maintain business performance.
Your Company has in place robust risk management processes at all levels of its operations. Risks involved at
various levels are identifi ed, monitored and managed on a continuous basis, both manually and through its ERP
system. Regular audits are undertaken to identify possible weak areas and necessary corrective measures are
instituted. Every care is taken to ensure that there is effective partitioning between the various risk-assessment
teams and the operational teams to minimize undue infl uence.
SustainabilityYour Company recognizes that its survival and long-term vibrant business organization depends on its ability to
continuously add to its skill-areas, while consolidating and improving its operational effi ciencies and scalability in its
traditional business lines.
Addition of futuristic product portfolios in Smart Communications, Digital Lifestyle, and Digital Printing has allowed
your Company to leverage its traditional skill-sets in completely new industry and channel segments.
Strengthening the Value offerings for an effective product portfolio in the Virtualization, Storage and Cloud business
spaces will insulate your Company from changes in customer buying patterns of products and solutions.
To take advantage of the opportunities that are fast emerging in the area of Supply Chain Management, it will
be crucial for your Company to gain enhanced domain knowledge in warehousing and logistics operations. The
lead taken in investing in state-of-the-art Automated Distribution Centers (ADCs) demonstrates your Company’s
determination in developing modernized and tailor-made 3PL solutions for potential customers.
Financial Capital is key to any business activity and your Company has always recognized its importance. With a view
to taking advantage of a widening gap that exists between the Working Capital requirements of its business partners
and the Capital that is actually available to these partners for funding their growing businesses, your Company
set up its Non-Banking Financial Services arm, Easyaccess Financial Services Limited (Easyaccess). Starting with

Annual Report 2011–2012
47Annual Report
2011–2012
46Annual Report 2011–2012
47Annual Report
2011–2012
46
1 TO CONTENTS PAGE 3 CLOSE
offerings for its captive base of existing channel partners, Easyaccess now provides your Company an added value
proposition by extending these across carefully selected customer segments.
Post-sales service offerings of your Company is one area that is least understood and rarely appreciated. However,
your Company has always believed that for any brand to become successful and for India in general to become a
quality conscious country, we have to ultimately recognise the immense value of a truly dependable and trustworthy
service infrastructure. Your Company has signifi cant domain knowledge and skill-sets in this line of business and the
importance of its process based operations are slowly but steadily gaining traction with value-conscious vendors. As
customers become more quality conscious and see increasing value in paying for good service infrastructure, this
vertical would probably become the standard bearer for the industry.
In short, your Company’s long term sustainability willbe ensured through continuously adapting to the changing
usage and demand patterns for its products and services and by embedding high quality in all its interfaces with its
customers.
Environmental and Social responsibilityYour Company consciously engages in businesses which do not pose any direct threat to the environment and
the society. Policies are framed with a view to being a responsible corporate citizen. While making profi t is key for
enhancing shareholder value, ensuring sustainability of the business and adopting ethical business practices as a
way of life is also built into the system.
Understanding global environmental threats, your Company’s business sustainability initiatives contribute to the
society and environment in such a way that it is a win-win situation for both the society and the Company. Your
Company encourages its employees to think actively towards minimising consumption of energy and utilities. It
provides a workplace environment that is safe, hygienic and humane, which upholds the dignity of the employees
and strictly discourages any form of exploitation. Your Company policy does not allow engagement of child labour,
forced labour or any form of involuntary labour. Your Company systematically identifi es stakeholders’ concerns,
assumes responsibilities and assures transparency in framing policies that are associated with the stakeholders.
Being a responsible corporate citizen, your Company ensures ethical values at all level of its functions. Your Company
has also conducted free eye and dental check-up programs for its employees and their family. With a view to ensuring
employees’ skill and competency, your Company provides fi nancial assistance to those who pursue professional
courses on an equal and non-discriminatory basis. A gymnasium is also available to the staff to help them maintain
a healthy life style. Your Company has also recently encouraged its employees at its corporate head-quarters to
participate in yoga training sessions which are conducted within its premises.
Development of Human ResourcesYour Company takes pride that it employs persons from more than 23 different nations and operates in a multi faith
and multi-cultural environment.
Your Company has instituted a highly “people-driven” culture within the organization. It believes that human resources
are its most important assets and has encouraged professionals who enter the corporate family for a career to think
and behave as entrepreneurs. They are trained to make decisions as if this were their own business and act with a
great degree of independence in their defi ned area of responsibility. This has been the bedrock of your Company’s
performance over the years.
Like any other consistently performing organization, your Company’s success is crucially dependent on its ability to
attract, train and retain the services of talented individuals. Your Company endeavours to build, manage, reward and
retain talent through a variety of initiatives. Ensuring a transparent, cohesive, conducive and professional working
environment with a high degree of freedom, fair compensation and wealth creation opportunities, has provided
stability to your Company’s operations with very low attrition amongst its Executive Management Team and an
enviable degree of continuity and consistency in its Middle and Senior Management Teams for extended periods.
FINANCIAL PERFORMANCE & POSITION
The fi nancials of your Company and its Indian subsidiaries are prepared in accordance with Generally Accepted
Accounting Principles in India. The consolidated fi nancials of Redington Distribution Pte. Ltd is prepared in accordance
with the Singapore Financial Reporting Standards and other overseas subsidiaries are prepared according to the
International Financial Reporting Standards
Analysis of Consolidated FinancialsRevenue- Revenue for the fi scal 2012 grew by 26.9 % to ` 21,222.0 Crore
from ` 16,722.7 Crore in the previous year. Revenues grew strongly both
in India as well as in the overseas geography. Revenues from Overseas
subsidiaries contributed 53.1 % of the total revenues.
EBIDTA – grew by 34.3 % to ` 633.4 Crore in the fi scal 2012 from ` 471.6
Crore for the fi scal 2011.
EBIDTA as a percentage of revenue touched a high of 3.0 % for the fi scal
2012 as against 2.8% for the previous fi scal.
PBT and PAT- Profi t before tax is ` 450.3 Crore for the year as
against ` 351.0 Crore for the last fi scal year.
The provision for current tax and deferred tax for the year is
` 111.3 Crore as against ` 86.2 Crore for last year.
PAT for the year after minority interest is ` 292.7 Crore for the
fi scal 2012 as against ` 226.0 Crore for the fi scal 2011.
The growth of 28.3 % and 29.5% in the PBT and PAT respectively
has been mainly on account of increased contribution from
higher margin products and operational effi ciencies. The PBT
and PAT as a % of revenue have grown to 2.12% and 1.38%
respectively, as against 2.10% and 1.35% in the previous fi scal.
10542.5
12376.0
13277.7
16722.7
21222 .0
0 5000 10000 15000 20000 25000
FY08
FY09
FY10
FY11
FY12
` in crores
Revenue
0 100 200 300 400 500 600 700 800
FY08
FY09
FY10
FY11
FY12
259.0
329.6
365.7
471.6
633.4
` in crores
EBIDTA
0
100
200
300
400
500
fy 12FY11FY10FY09FY08
177.1136.1
159.7
450.3
184.3
351.0
219.0
275.9 292.7
226.0
PATPBT
` in
cro
res
PBT and PAT
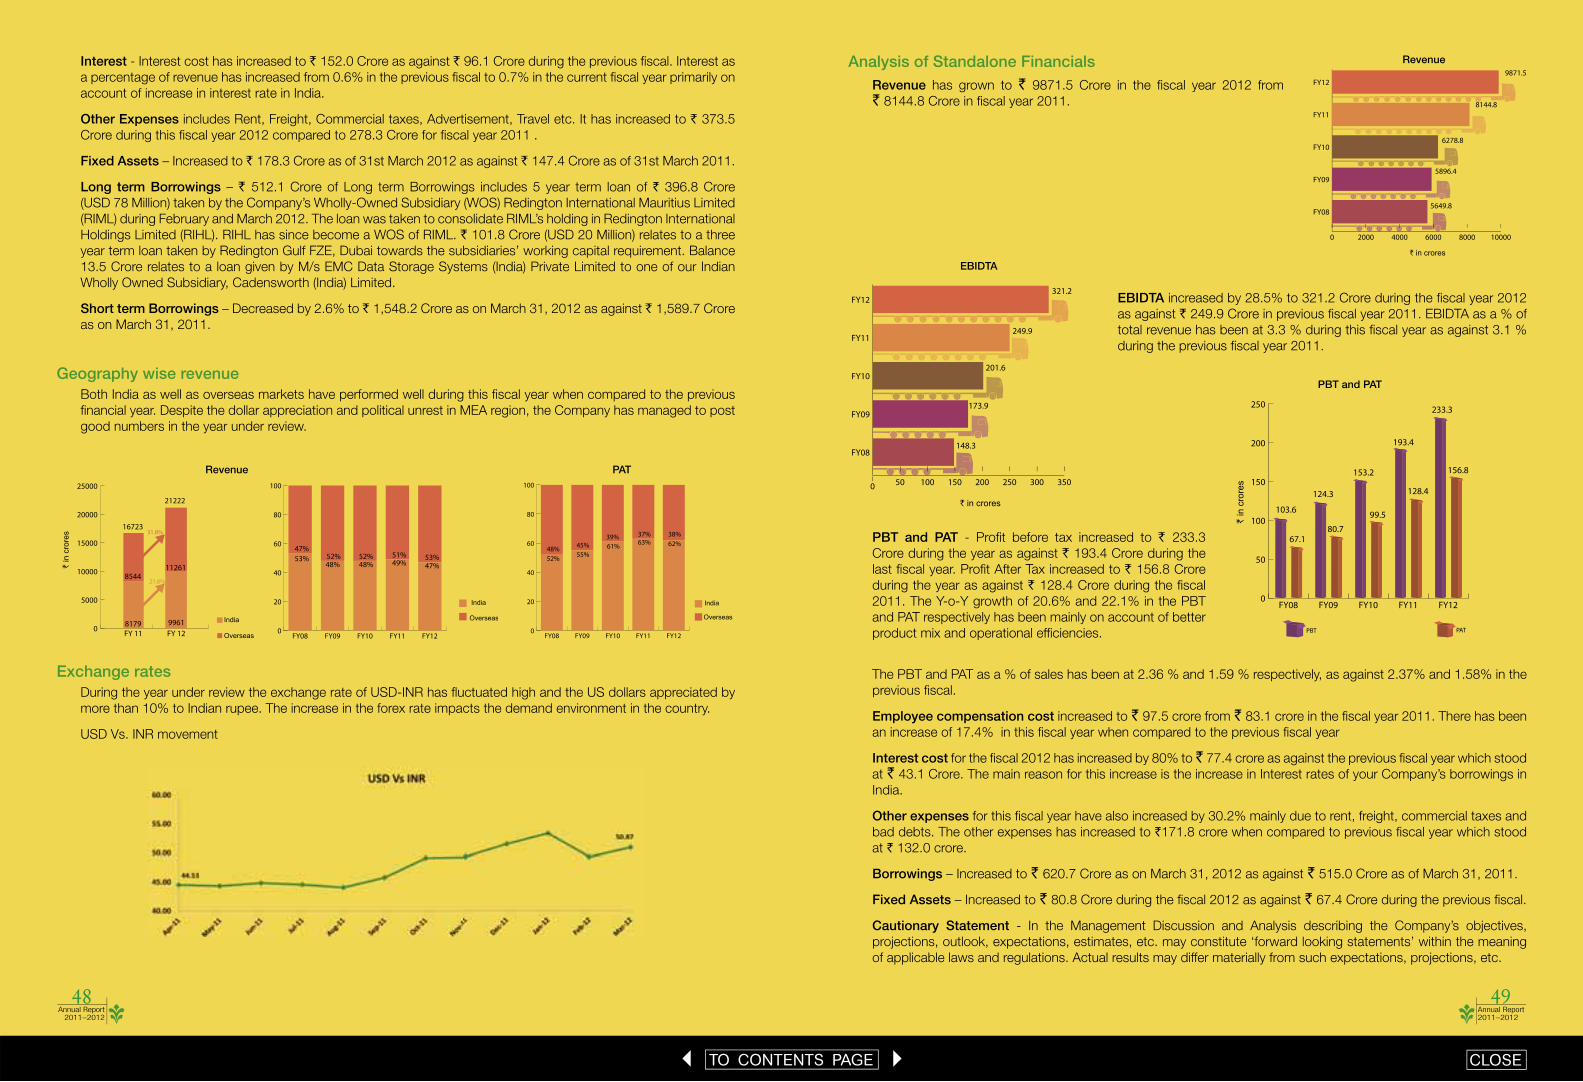
Annual Report 2011–2012
49Annual Report
2011–2012
48Annual Report 2011–2012
49Annual Report
2011–2012
48
1 TO CONTENTS PAGE 3 CLOSE
Interest - Interest cost has increased to ` 152.0 Crore as against ` 96.1 Crore during the previous fi scal. Interest as
a percentage of revenue has increased from 0.6% in the previous fi scal to 0.7% in the current fi scal year primarily on
account of increase in interest rate in India.
Other Expenses includes Rent, Freight, Commercial taxes, Advertisement, Travel etc. It has increased to ` 373.5
Crore during this fi scal year 2012 compared to 278.3 Crore for fi scal year 2011 .
Fixed Assets – Increased to ` 178.3 Crore as of 31st March 2012 as against ` 147.4 Crore as of 31st March 2011.
Long term Borrowings – ` 512.1 Crore of Long term Borrowings includes 5 year term loan of ` 396.8 Crore
(USD 78 Million) taken by the Company’s Wholly-Owned Subsidiary (WOS) Redington International Mauritius Limited
(RIML) during February and March 2012. The loan was taken to consolidate RIML’s holding in Redington International
Holdings Limited (RIHL). RIHL has since become a WOS of RIML. ` 101.8 Crore (USD 20 Million) relates to a three
year term loan taken by Redington Gulf FZE, Dubai towards the subsidiaries’ working capital requirement. Balance
13.5 Crore relates to a loan given by M/s EMC Data Storage Systems (India) Private Limited to one of our Indian
Wholly Owned Subsidiary, Cadensworth (India) Limited.
Short term Borrowings – Decreased by 2.6% to ` 1,548.2 Crore as on March 31, 2012 as against ` 1,589.7 Crore
as on March 31, 2011.
Geography wise revenueBoth India as well as overseas markets have performed well during this fi scal year when compared to the previous
fi nancial year. Despite the dollar appreciation and political unrest in MEA region, the Company has managed to post
good numbers in the year under review.
Exchange ratesDuring the year under review the exchange rate of USD-INR has fl uctuated high and the US dollars appreciated by
more than 10% to Indian rupee. The increase in the forex rate impacts the demand environment in the country.
USD Vs. INR movement
India
Overseas
0
20
40
60
80
100
FY12 FY11 FY10 FY09 FY08
53%47%
48%52%
48%52%
49%51%
47%53%
India
Overseas
0
20
40
60
80
100
FY12FY11FY10FY09FY08
52% 55%45%
39%61% 63% 62%
37% 38%
48%
Revenue PAT
16723
21222
India
Overseas
` in
cro
res
0
5000
10000
15000
20000
25000
FY 12FY 11
8544
99618179
11261
31.8%
21.8%
Analysis of Standalone FinancialsRevenue has grown to ` 9871.5 Crore in the fi scal year 2012 from
` 8144.8 Crore in fi scal year 2011.
EBIDTA increased by 28.5% to 321.2 Crore during the fi scal year 2012
as against ` 249.9 Crore in previous fi scal year 2011. EBIDTA as a % of
total revenue has been at 3.3 % during this fi scal year as against 3.1 %
during the previous fi scal year 2011.
PBT and PAT - Profi t before tax increased to ` 233.3
Crore during the year as against ` 193.4 Crore during the
last fi scal year. Profi t After Tax increased to ` 156.8 Crore
during the year as against ` 128.4 Crore during the fi scal
2011. The Y-o-Y growth of 20.6% and 22.1% in the PBT
and PAT respectively has been mainly on account of better
product mix and operational effi ciencies.
The PBT and PAT as a % of sales has been at 2.36 % and 1.59 % respectively, as against 2.37% and 1.58% in the
previous fi scal.
Employee compensation cost increased to ` 97.5 crore from ` 83.1 crore in the fi scal year 2011. There has been
an increase of 17.4% in this fi scal year when compared to the previous fi scal year
Interest cost for the fi scal 2012 has increased by 80% to ̀ 77.4 crore as against the previous fi scal year which stood
at ` 43.1 Crore. The main reason for this increase is the increase in Interest rates of your Company’s borrowings in
India.
Other expenses for this fi scal year have also increased by 30.2% mainly due to rent, freight, commercial taxes and
bad debts. The other expenses has increased to `171.8 crore when compared to previous fi scal year which stood
at ` 132.0 crore.
Borrowings – Increased to ` 620.7 Crore as on March 31, 2012 as against ` 515.0 Crore as of March 31, 2011.
Fixed Assets – Increased to ` 80.8 Crore during the fi scal 2012 as against ` 67.4 Crore during the previous fi scal.
Cautionary Statement - In the Management Discussion and Analysis describing the Company’s objectives,
projections, outlook, expectations, estimates, etc. may constitute ‘forward looking statements’ within the meaning
of applicable laws and regulations. Actual results may differ materially from such expectations, projections, etc.
5649.8
5896.4
6278.8
8144.8
9871.5
0 2000 4000 6000 8000 10000
FY08
FY09
FY10
FY11
FY12
` in crores
Revenue
0 50 100 150 200 250 300 350
FY08
FY09
FY10
FY11
FY12
148.3
173.9
201.6
249.9
321.2
` in crores
EBIDTA
103.6
67.180.7
99.5
128.4
156.8
124.3
153.2
193.4
233.3
0
50
100
150
200
250
FY12FY11FY10FY09FY08
PATPBT
` in
cro
res
PBT and PAT

Annual Report 2011–2012
51
brand behind brands
brand behind brands
brand behind brands
brand behind brands
and behind brandaa sdd
brbb arr nd behind braa arr ndaa sdd
brand b
ehin
d b
rands
ss
brand behind brands
brand behind brands
brand behind brands
brand behind brands
brand behind brands
brand behind brands
brand behind brands
brand behind brands
brand behind brands
ss
d b hi d b dd b hi d b d
brand behind brandsehind brands
hind brandsehind brands
dbrand behind brands
brand behind brands
brand behind brands
brand behind brandsbrand behind brands
brand behind brands b
b
bran
d be
hind
bra
ndsbrrbr
bb brand behind brandsbb
b r a n d b e h i n d b r a n d s
brand behind brands
brandbb behind bb brandbb sddbrand behind brandsbrand be
bran
dbe
hind
bran
ds
brand
brand
bran
dbe
hind
bran
dsbeh
inbeh
ibrand behind brands
brand behind brands
brbb andrr behind brandbb sddbrandbehind
brands
brand behind brands
bran
d be
hind
bra
nds
ands
ands
brand behind brandsbrand behind brands
brand behind brands
brand behind brands
brand behind brands
brand behind brands
b r a n d b e h i n d b r a n d s
b r a n d b e h i n d b r a n d s
b r a n d b e h i n d b r a n d s
b r a n d b e h i n d b r a n d sb r a n d b e h i n d b r a n d s
brand behind brands
b r a n d b e h i n d b r a n d s
brand behind brandsbrand behind brands
brandbehindbrands
brand behind brandsbrbb arr
brand behind brands
brand behind brands brand behind brands
brand behind brandsb db dbrand behind brands
b d b hi d bb h d b brand behind brands
brand behind brands
brand behind brands
brand behind brands
abrb
brand behind brandsbrand behiand behbrand behind brandsb a
brand behind brands
b r a n d b e h i n d b r a n d s
b r a n d b e h i n d b r a n d s
brand behind brands
b
bran
d be
hind
bran
ds
bbbbb
brarrnd
behin
dbr
arrnd
sbr
arrnd
behin
dbr
arrnd
s
brarr ndbehindbrarr ndsb r a n d b e h i n d b r a n d s
brarr ndbehindbrarr nds
brarr ndbehindbrarr nds
brand behind brands
brand behind brandsbrand
behindbrands
rand behind brandsr
brand behind brandsdd
brand behind brandsbrandbehindbrands
d b d
brand behind brands
brand behind brands
bd
brandsb
db
hd
brand behind
ehind bran
bran
dbe
hind
bra
nds
bran
dbe
hind
bra
nds
standalone fi nancial statements
AUDITORS’ REPORT TO THE MEMBERS OF REDINGTON (INDIA) LIMITED
1. We have audited the attached Balance Sheet of REDINGTON (INDIA) LIMITED (“the Company”) as at 31st
March, 2012, the Statement of Profi t and Loss and the Cash Flow Statement of the Company for the year
ended on that date, both annexed thereto. These fi nancial statements are the responsibility of the Company’s
Management. Our responsibility is to express an opinion on these fi nancial statements based on our audit.
2. We conducted our audit in accordance with the auditing standards generally accepted in India. Those Standards
require that we plan and perform the audit to obtain reasonable assurance about whether the fi nancial statements
are free of material misstatements. An audit includes examining, on a test basis, evidence supporting the amounts
and the disclosures in the fi nancial statements. An audit also includes assessing the accounting principles used
and the signifi cant estimates made by the Management, as well as evaluating the overall fi nancial statement
presentation. We believe that our audit provides a reasonable basis for our opinion.
3. As required by the Companies (Auditor’s Report) Order, 2003 (CARO) issued by the Central Government in terms
of Section 227(4A) of the Companies Act, 1956, we enclose in the Annexure a statement on the matters specifi ed
in paragraphs 4 and 5 of the said Order.
4. Further to our comments in the Annexure referred to in paragraph 3 above, we report as follows:
(a) we have obtained all the information and explanations which to the best of our knowledge and belief were
necessary for the purposes of our audit;
(b) in our opinion, proper books of account as required by law have been kept by the Company so far as it
appears from our examination of those books;
(c) the Balance Sheet, the Statement of Profi t and Loss and the Cash Flow Statement dealt with by this report
are in agreement with the books of account;
(d) in our opinion, the Balance Sheet, the Statement of Profi t and Loss and the Cash Flow Statement dealt
with by this report are in compliance with the Accounting Standards referred to in Section 211(3C) of the
Companies Act, 1956;
(e) in our opinion and to the best of our information and according to the explanations given to us, the said
accounts give the information required by the Companies Act, 1956 in the manner so required and give a true
and fair view in conformity with the accounting principles generally accepted in India:
(i) in the case of the Balance Sheet, of the state of affairs of the Company as at 31st March, 2012;
(ii) in the case of the Statement of Profi t and Loss, of the profi t of the Company for the year ended on that
date and
(iii) in the case of the Cash Flow Statement, of the cash fl ows of the Company for the year ended on that
date.
5. On the basis of the written representations received from the Directors as on 31st March, 2012 taken on record
by the Board of Directors, none of the Directors is disqualifi ed as on 31st March, 2012 from being appointed as
a director in terms of Section 274(1)(g) of the Companies Act, 1956.
For DELOITTE HASKINS & SELLSChartered Accountants
(Registration No.008072S)
B RamaratnamPartner
(Membership No.21209)
CHENNAI, May 25, 2012
1 TO CONTENTS PAGE 3 CLOSE

Annual Report 2011–2012
53Annual Report
2011–2012
52
1 TO CONTENTS PAGE 3 CLOSE
ANNEXURE TO THE AUDITORS’ REPORT
(Referred to in paragraph 3 of our report of even date)
(i) Having regard to the nature of the Company’s business, activities, result, clauses (vi), (viii), (x), (xii), (xiii), (xiv),
(xvi), (xviii), (xix) and (xx) of CARO are not applicable for the year.
(ii) In respect of its fi xed assets:
(a) The Company has maintained proper records showing full particulars, including quantitative details and
situation of the fi xed assets.
(b) The fi xed assets were physically verifi ed during the year by the Management in accordance with a regular
programme of verifi cation which, in our opinion, provides for physical verifi cation of all the fi xed assets at
reasonable intervals. According to the information and explanations given to us, no material discrepancies
were noticed on such verifi cation.
(c) The fi xed assets disposed off during the year, in our opinion, do not constitute a substantial part of the fi xed
assets of the Company and such disposal has, in our opinion, not affected the going concern status of the
Company.
(iii) In respect of its inventory:
(a) As explained to us, the inventories were physically verifi ed during the year by an external fi rm of Chartered
Accountants at reasonable intervals.
(b) In our opinion and according to the information and explanations given to us, the procedures of physical
verifi cation of inventories followed by the Management were reasonable and adequate in relation to the size
of the Company and the nature of its business.
(c) In our opinion and according to the information and explanations given to us, the Company has maintained
proper records of its inventories and no material discrepancies were noticed on physical verifi cation.
(iv) The Company has neither granted nor taken any loans, secured or unsecured, to/from companies, fi rms or
other parties listed in the Register maintained under Section 301 of the Companies Act, 1956.
(v) In our opinion and according to the information and explanations given to us, there is an adequate internal
control system commensurate with the size of the Company and the nature of its business with regard to
purchases of inventory and fi xed assets and the sale of goods and services. During the course of our audit, we
have not observed any major weakness in such internal control system.
(vi) In respect of contracts or arrangements entered in the Register maintained in pursuance of Section 301 of
the Companies Act, 1956, to the best of our knowledge and belief and according to the information and
explanations given to us, we are of the opinion that no transactions need to be entered in the register maintained
under 301 of the Companies Act, 1956.
(vii) In our opinion, the internal audit functions carried out during the year by a fi rm of Chartered Accountants
appointed by the Management have been commensurate with the size of the Company and the nature of its
business.
(viii) According to the information and explanations given to us in respect of statutory dues:
(a) The Company has been regular in depositing undisputed dues, including Provident Fund, Investor Education
and Protection Fund, Employees’ State Insurance, Income-tax, Sales Tax/Value Added Tax, Wealth Tax,
Service Tax, Custom Duty, Excise Duty, Cess and other material statutory dues applicable to it with the
appropriate authorities.
(b) There were no undisputed amounts payable in respect of Income-tax, Wealth Tax, Custom Duty, Excise
Duty, Cess and other material statutory dues in arrears as at 31st March, 2012 for a period of more than
six months from the date they became payable.
(c) Details of dues of Income-tax, Sales Tax/Value Added Tax, Wealth Tax, Service Tax, Custom Duty, Excise Duty
and Cess which have not been deposited as on 31st March, 2012 on account of disputes are given below:
Name of the Statue Nature of Dues Forum where Dispute is pending
Period to which the amount relates
Amount involved Rs. in Lakhs
The Customs Act, 1962 Customs duty Various appellate Authorities Various years 15.27
Income Tax Act, 1961 Income Tax Various appellate Authorities Assessment years
2005-06 to 2008-09
585.62
Sales Tax Act of various
states
Sales Tax Various appellate Authorities 2002-03, 2004-05 to
2009-10
426.65
Central Sales Tax Act, 1956 Sales Tax Various appellate Authorities 2002-03, 2006-07 to
2009-10, 2011-12
448.83
(ix) In our opinion and according to the information and explanations given to us, the Company has not defaulted
in the repayment of dues to banks.
(x) In our opinion and according to the information and explanations given to us, the terms and conditions of the
guarantees given by the Company for loans taken by others from banks are not prima facie prejudicial to the
interests of the Company.
(xi) In our opinion and according to the information and explanations given to us and on an overall examination
of the Balance Sheet, we report that funds raised on short-term basis have not been used during the year for
long- term investment.
(xii) To the best of our knowledge and according to the information and explanations given to us, no fraud by the
Company and no fraud on the Company has been noticed or reported during the year.
For DELOITTE HASKINS & SELLSChartered Accountants
(Registration No.008072S)
B. Ramaratnam
Partner
(Membership No. 21209)
CHENNAI, May 25, 2012

Annual Report 2011–2012
55Annual Report
2011–2012
54
1 TO CONTENTS PAGE 3 CLOSE
Balance Sheet as at March 31, 2012(` in Lakhs)
Particulars Note No. 31-March-2012 31-March-2011
I. EQUITY AND LIABILITIES
Shareholders’ fundsShare capital 3 7,971.56 7,926.60
Reserves and surplus 4 82,925.78 68,479.80
90,897.34 76,406.40
Non-current liabilitiesLong-term provisions 5 663.70 525.90
663.70 525.90
Current liabilitiesShort-term borrowings 6 62,071.50 51,502.84
Trade payables 7 96,439.11 91,658.19
Other current liabilities 8 12,148.77 13,244.81
Short-term provisions 9 1,937.73 5,151.89
172,597.11 161,557.73
TOTAL 264,158.15 238,490.03
II. ASSETSNon-current assetsFixed assets 10
(i) Tangible assets 7,171.06 6,520.49
(ii) Intangible assets 44.05 83.72
(iii) Capital work-in-progress 867.93 140.15
Non-current investments 11 59,042.89 46,300.09
Deferred tax assets (net) 12 506.85 404.85
Long-term loans and advances 13 3,739.27 3,178.86
71,372.05 56,628.16
Current assetsInventories 14 81,699.38 71,743.07
Trade receivables 15 83,417.46 85,426.80
Cash and cash equivalents 16 6,181.83 15,019.67
Short-term loans and advances 17 21,487.43 9,672.33
192,786.10 181,861.87
TOTAL 264,158.15 238,490.03
See accompanying notes forming part of fi nancial statements
In terms of our report attached For and on behalf of the Board of Directors
For Deloitte Haskins & SellsChartered Accountants
B Ramaratnam R Srinivasan Raj Shankar M RaghunandanPartner Managing Director Deputy Managing Director Whole Time Director
S V Krishnan M Muthukumarasamy Chief Financial Offi cer Company Secretary
Place : Chennai
Date : May 25, 2012
Statement of Profi t and Loss for the year ended March 31, 2012(` in Lakhs)
Particulars Note No.Year Ended
March 31,2012Year Ended
March 31,2011
Revenue from operations 18 984,040.52 813,194.94
Other income 19 3,107.51 1,289.30
Total Revenue 987,148.03 814,484.24
Expenses:
Purchases of trading stocks 938,045.80 797,484.45
Changes in inventories of trading stock (9,956.31) (29,501.86)
Employee benefi ts 20 9,753.27 8,310.37
Finance costs 21 7,740.43 4,305.28
Depreciation & amortisation 10 1,054.76 1,347.00
Other expenses 22 17,180.87 13,199.36
Total Expenses 963,818.82 795,144.60
Profi t Before Tax 23,329.21 19,339.64
Tax expense:
Current tax 7,750.00 6,650.69
Deferred tax (102.00) (155.09)
Profi t for the Year 15,681.21 12,844.04
Earnings per equity share:
Basic 3.94 3.25
Diluted 3.93 3.23
See accompanying notes forming part of fi nancial statements
In terms of our report attached For and on behalf of the Board of Directors
For Deloitte Haskins & SellsChartered Accountants
B Ramaratnam R Srinivasan Raj Shankar M RaghunandanPartner Managing Director Deputy Managing Director Whole Time Director
S V Krishnan M Muthukumarasamy Chief Financial Offi cer Company Secretary
Place : Chennai
Date : May 25, 2012
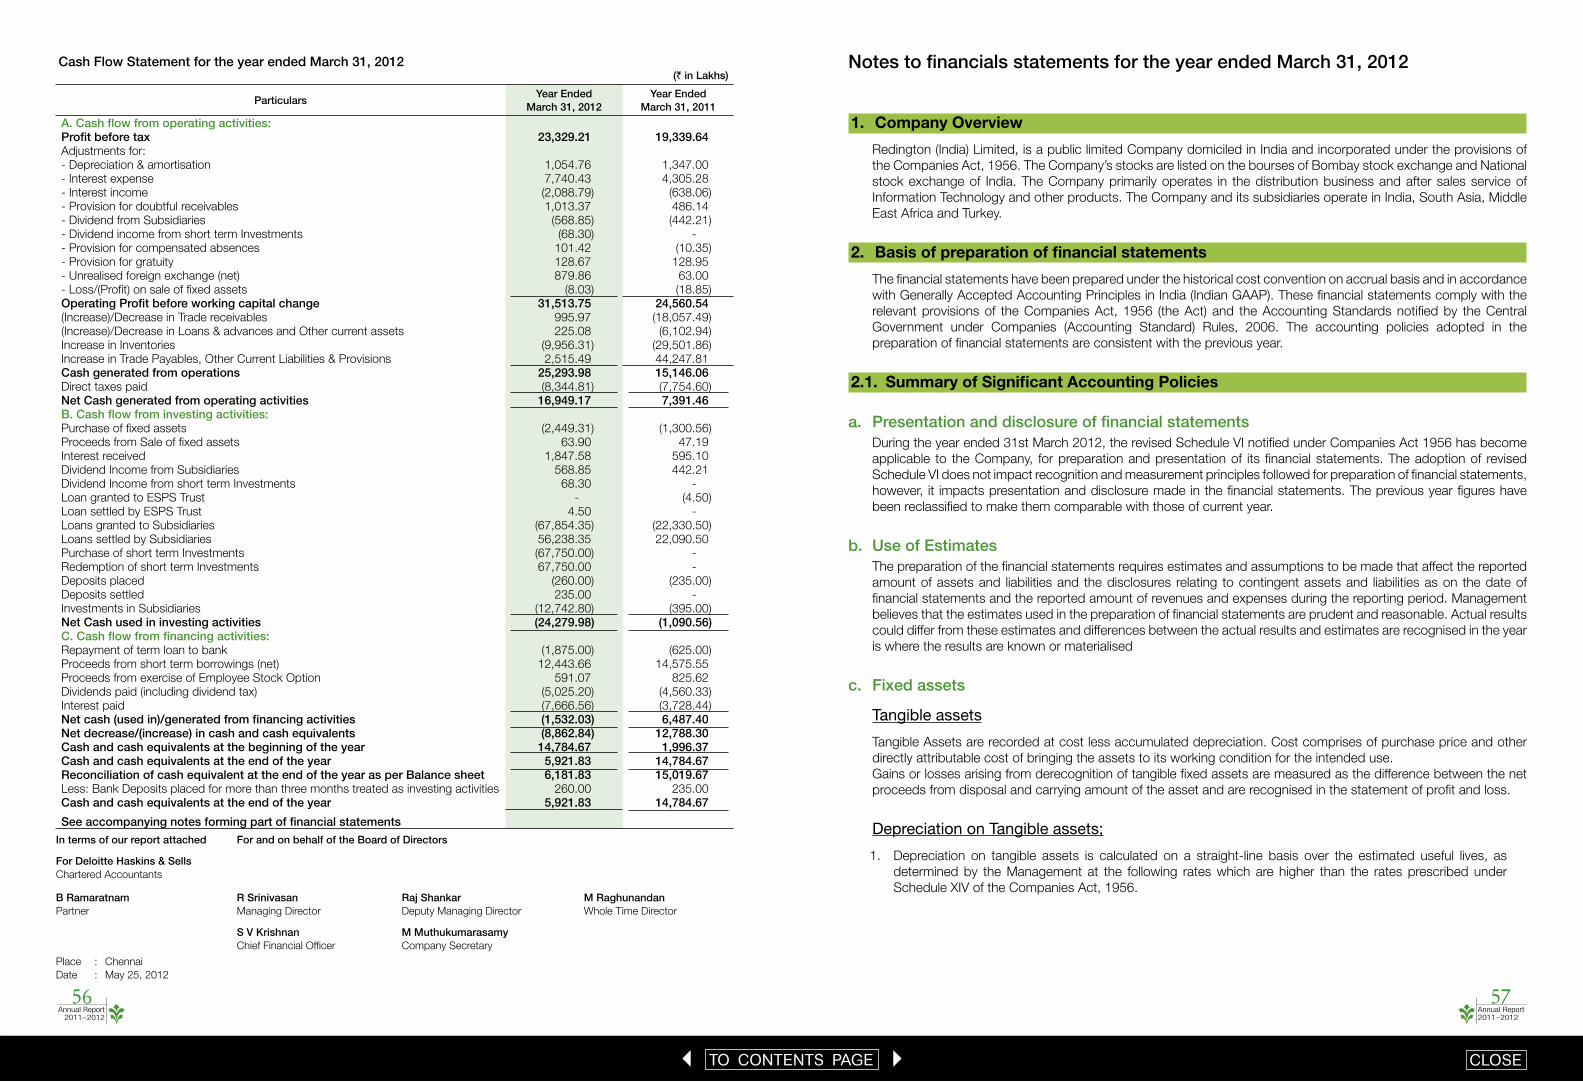
Annual Report 2011–2012
57Annual Report
2011–2012
56
1 TO CONTENTS PAGE 3 CLOSE
Cash Flow Statement for the year ended March 31, 2012(` in Lakhs)
ParticularsYear Ended
March 31, 2012Year Ended
March 31, 2011
A. Cash fl ow from operating activities:Profi t before tax 23,329.21 19,339.64Adjustments for:- Depreciation & amortisation 1,054.76 1,347.00- Interest expense 7,740.43 4,305.28- Interest income (2,088.79) (638.06)- Provision for doubtful receivables 1,013.37 486.14- Dividend from Subsidiaries (568.85) (442.21)- Dividend income from short term Investments (68.30) - - Provision for compensated absences 101.42 (10.35)- Provision for gratuity 128.67 128.95- Unrealised foreign exchange (net) 879.86 63.00- Loss/(Profi t) on sale of fi xed assets (8.03) (18.85)Operating Profi t before working capital change 31,513.75 24,560.54(Increase)/Decrease in Trade receivables 995.97 (18,057.49)(Increase)/Decrease in Loans & advances and Other current assets 225.08 (6,102.94)Increase in Inventories (9,956.31) (29,501.86)Increase in Trade Payables, Other Current Liabilities & Provisions 2,515.49 44,247.81Cash generated from operations 25,293.98 15,146.06Direct taxes paid (8,344.81) (7,754.60)Net Cash generated from operating activities 16,949.17 7,391.46B. Cash fl ow from investing activities:Purchase of fi xed assets (2,449.31) (1,300.56)Proceeds from Sale of fi xed assets 63.90 47.19Interest received 1,847.58 595.10Dividend Income from Subsidiaries 568.85 442.21Dividend Income from short term Investments 68.30 - Loan granted to ESPS Trust - (4.50)Loan settled by ESPS Trust 4.50 - Loans granted to Subsidiaries (67,854.35) (22,330.50)Loans settled by Subsidiaries 56,238.35 22,090.50Purchase of short term Investments (67,750.00) - Redemption of short term Investments 67,750.00 - Deposits placed (260.00) (235.00)Deposits settled 235.00 - Investments in Subsidiaries (12,742.80) (395.00)Net Cash used in investing activities (24,279.98) (1,090.56)C. Cash fl ow from fi nancing activities:Repayment of term loan to bank (1,875.00) (625.00)Proceeds from short term borrowings (net) 12,443.66 14,575.55Proceeds from exercise of Employee Stock Option 591.07 825.62Dividends paid (including dividend tax) (5,025.20) (4,560.33)Interest paid (7,666.56) (3,728.44)Net cash (used in)/generated from fi nancing activities (1,532.03) 6,487.40Net decrease/(increase) in cash and cash equivalents (8,862.84) 12,788.30Cash and cash equivalents at the beginning of the year 14,784.67 1,996.37Cash and cash equivalents at the end of the year 5,921.83 14,784.67Reconciliation of cash equivalent at the end of the year as per Balance sheet 6,181.83 15,019.67Less: Bank Deposits placed for more than three months treated as investing activities 260.00 235.00Cash and cash equivalents at the end of the year 5,921.83 14,784.67
See accompanying notes forming part of fi nancial statements
In terms of our report attached For and on behalf of the Board of Directors
For Deloitte Haskins & SellsChartered Accountants
B Ramaratnam R Srinivasan Raj Shankar M RaghunandanPartner Managing Director Deputy Managing Director Whole Time Director
S V Krishnan M Muthukumarasamy Chief Financial Offi cer Company Secretary
Place : Chennai
Date : May 25, 2012
Notes to fi nancials statements for the year ended March 31, 2012
1. Company Overview
Redington (India) Limited, is a public limited Company domiciled in India and incorporated under the provisions of
the Companies Act, 1956. The Company’s stocks are listed on the bourses of Bombay stock exchange and National
stock exchange of India. The Company primarily operates in the distribution business and after sales service of
Information Technology and other products. The Company and its subsidiaries operate in India, South Asia, Middle
East Africa and Turkey.
2. Basis of preparation of fi nancial statements
The fi nancial statements have been prepared under the historical cost convention on accrual basis and in accordance
with Generally Accepted Accounting Principles in India (Indian GAAP). These fi nancial statements comply with the
relevant provisions of the Companies Act, 1956 (the Act) and the Accounting Standards notifi ed by the Central
Government under Companies (Accounting Standard) Rules, 2006. The accounting policies adopted in the
preparation of fi nancial statements are consistent with the previous year.
2.1. Summary of Signifi cant Accounting Policies
a. Presentation and disclosure of fi nancial statementsDuring the year ended 31st March 2012, the revised Schedule VI notifi ed under Companies Act 1956 has become
applicable to the Company, for preparation and presentation of its fi nancial statements. The adoption of revised
Schedule VI does not impact recognition and measurement principles followed for preparation of fi nancial statements,
however, it impacts presentation and disclosure made in the fi nancial statements. The previous year fi gures have
been reclassifi ed to make them comparable with those of current year.
b. Use of EstimatesThe preparation of the fi nancial statements requires estimates and assumptions to be made that affect the reported
amount of assets and liabilities and the disclosures relating to contingent assets and liabilities as on the date of
fi nancial statements and the reported amount of revenues and expenses during the reporting period. Management
believes that the estimates used in the preparation of fi nancial statements are prudent and reasonable. Actual results
could differ from these estimates and differences between the actual results and estimates are recognised in the year
is where the results are known or materialised
c. Fixed assets
Tangible assets
Tangible Assets are recorded at cost less accumulated depreciation. Cost comprises of purchase price and other
directly attributable cost of bringing the assets to its working condition for the intended use.
Gains or losses arising from derecognition of tangible fi xed assets are measured as the difference between the net
proceeds from disposal and carrying amount of the asset and are recognised in the statement of profi t and loss.
Depreciation on Tangible assets;
1. Depreciation on tangible assets is calculated on a straight-line basis over the estimated useful lives, as
determined by the Management at the following rates which are higher than the rates prescribed under
Schedule XIV of the Companies Act, 1956.
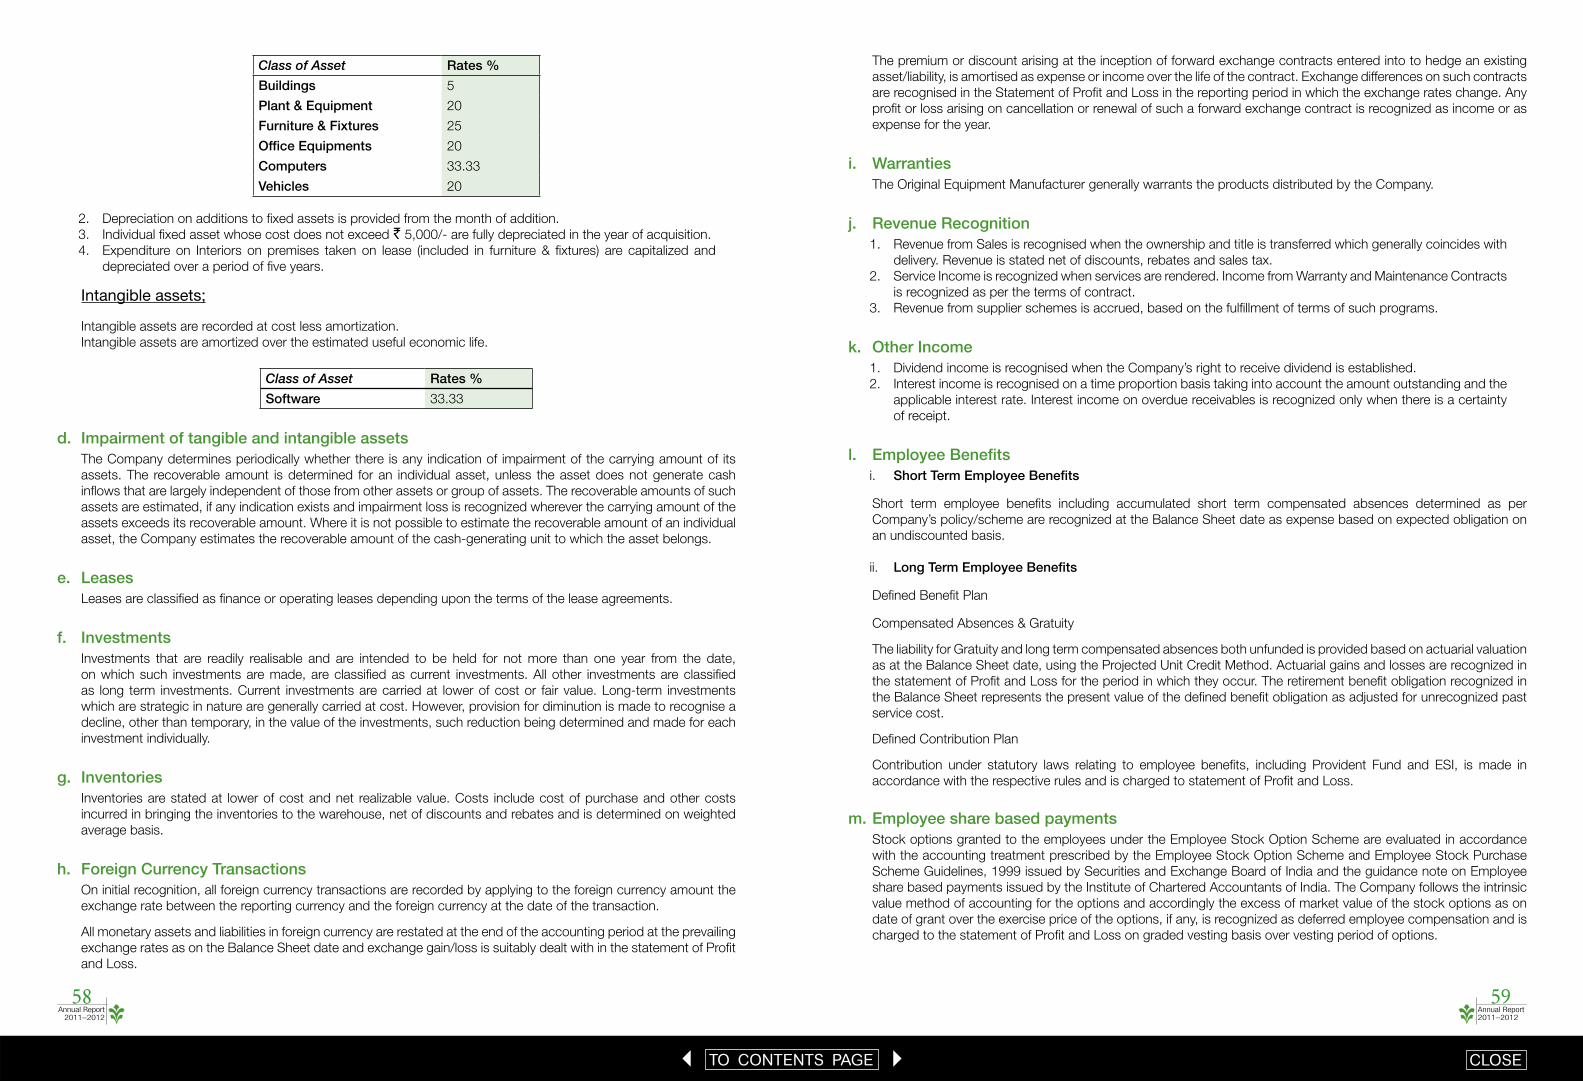
Annual Report 2011–2012
59Annual Report
2011–2012
58
1 TO CONTENTS PAGE 3 CLOSE
Class of Asset Rates %
Buildings 5
Plant & Equipment 20
Furniture & Fixtures 25
Offi ce Equipments 20
Computers 33.33
Vehicles 20
2. Depreciation on additions to fi xed assets is provided from the month of addition.
3. Individual fi xed asset whose cost does not exceed ` 5,000/- are fully depreciated in the year of acquisition.
4. Expenditure on Interiors on premises taken on lease (included in furniture & fi xtures) are capitalized and
depreciated over a period of fi ve years.
Intangible assets;
Intangible assets are recorded at cost less amortization.
Intangible assets are amortized over the estimated useful economic life.
Class of Asset Rates %
Software 33.33
d. Impairment of tangible and intangible assetsThe Company determines periodically whether there is any indication of impairment of the carrying amount of its
assets. The recoverable amount is determined for an individual asset, unless the asset does not generate cash
infl ows that are largely independent of those from other assets or group of assets. The recoverable amounts of such
assets are estimated, if any indication exists and impairment loss is recognized wherever the carrying amount of the
assets exceeds its recoverable amount. Where it is not possible to estimate the recoverable amount of an individual
asset, the Company estimates the recoverable amount of the cash-generating unit to which the asset belongs.
e. LeasesLeases are classifi ed as fi nance or operating leases depending upon the terms of the lease agreements.
f. InvestmentsInvestments that are readily realisable and are intended to be held for not more than one year from the date,
on which such investments are made, are classifi ed as current investments. All other investments are classifi ed
as long term investments. Current investments are carried at lower of cost or fair value. Long-term investments
which are strategic in nature are generally carried at cost. However, provision for diminution is made to recognise a
decline, other than temporary, in the value of the investments, such reduction being determined and made for each
investment individually.
g. InventoriesInventories are stated at lower of cost and net realizable value. Costs include cost of purchase and other costs
incurred in bringing the inventories to the warehouse, net of discounts and rebates and is determined on weighted
average basis.
h. Foreign Currency TransactionsOn initial recognition, all foreign currency transactions are recorded by applying to the foreign currency amount the
exchange rate between the reporting currency and the foreign currency at the date of the transaction.
All monetary assets and liabilities in foreign currency are restated at the end of the accounting period at the prevailing
exchange rates as on the Balance Sheet date and exchange gain/loss is suitably dealt with in the statement of Profi t
and Loss.
The premium or discount arising at the inception of forward exchange contracts entered into to hedge an existing
asset/liability, is amortised as expense or income over the life of the contract. Exchange differences on such contracts
are recognised in the Statement of Profi t and Loss in the reporting period in which the exchange rates change. Any
profi t or loss arising on cancellation or renewal of such a forward exchange contract is recognized as income or as
expense for the year.
i. WarrantiesThe Original Equipment Manufacturer generally warrants the products distributed by the Company.
j. Revenue Recognition1. Revenue from Sales is recognised when the ownership and title is transferred which generally coincides with
delivery. Revenue is stated net of discounts, rebates and sales tax.
2. Service Income is recognized when services are rendered. Income from Warranty and Maintenance Contracts
is recognized as per the terms of contract.
3. Revenue from supplier schemes is accrued, based on the fulfi llment of terms of such programs.
k. Other Income1. Dividend income is recognised when the Company’s right to receive dividend is established.
2. Interest income is recognised on a time proportion basis taking into account the amount outstanding and the
applicable interest rate. Interest income on overdue receivables is recognized only when there is a certainty
of receipt.
l. Employee Benefi tsi. Short Term Employee Benefi ts
Short term employee benefi ts including accumulated short term compensated absences determined as per
Company’s policy/scheme are recognized at the Balance Sheet date as expense based on expected obligation on
an undiscounted basis.
ii. Long Term Employee Benefi ts
Defi ned Benefi t Plan
Compensated Absences & Gratuity
The liability for Gratuity and long term compensated absences both unfunded is provided based on actuarial valuation
as at the Balance Sheet date, using the Projected Unit Credit Method. Actuarial gains and losses are recognized in
the statement of Profi t and Loss for the period in which they occur. The retirement benefi t obligation recognized in
the Balance Sheet represents the present value of the defi ned benefi t obligation as adjusted for unrecognized past
service cost.
Defi ned Contribution Plan
Contribution under statutory laws relating to employee benefi ts, including Provident Fund and ESI, is made in
accordance with the respective rules and is charged to statement of Profi t and Loss.
m. Employee share based paymentsStock options granted to the employees under the Employee Stock Option Scheme are evaluated in accordance
with the accounting treatment prescribed by the Employee Stock Option Scheme and Employee Stock Purchase
Scheme Guidelines, 1999 issued by Securities and Exchange Board of India and the guidance note on Employee
share based payments issued by the Institute of Chartered Accountants of India. The Company follows the intrinsic
value method of accounting for the options and accordingly the excess of market value of the stock options as on
date of grant over the exercise price of the options, if any, is recognized as deferred employee compensation and is
charged to the statement of Profi t and Loss on graded vesting basis over vesting period of options.

Annual Report 2011–2012
61Annual Report
2011–2012
60
1 TO CONTENTS PAGE 3 CLOSE
n. Current and deferred taxi. Tax expense for the period, comprising current tax and deferred tax, are included in the determination of the
net profi t for the year.
ii. Current tax is measured at the amount expected to be paid to the tax authorities in accordance with the
provisions of the Income Tax Act, 1961, on the income for the year chargeable to tax.
iii. Deferred tax assets and liabilities are recognized for the future tax consequences of timing differences between
the carrying values of the assets and liabilities and their respective tax bases using enacted or substantially
enacted tax rates. The tax rates and tax laws used to compute the amount are those that are enacted or
substantively enacted, at the reporting date. Deferred tax assets, subject to consideration of prudence, are
recognized and carried forward to the extent they can be realized.
o. Provisions, Contingent Liabilities and Contingent AssetsProvisions are recognized only when there is a present obligation as a result of past events and when a reliable
estimate of the amount of obligation can be made. Contingent liability is disclosed for
(i) Possible obligation which will be confi rmed only by future events not wholly within the control of the Company or
(ii) Present obligations arising from past events where it is not probable that an outfl ow of resources will be
required to settle the obligation or a reliable estimate of the amount of the obligation cannot be made.
Contingent assets are not recognized in the fi nancial statements.
p. Segment ReportingThe Company prepares its segment information in conformity with the accounting policies adopted for presenting
the fi nancial statements of the Company as a whole.
q. Cash and cash equivalents;Cash comprises cash on hand and demand deposits with banks. Cash equivalents are short-term, highly liquid
investments that are readily convertible into known amounts of cash.
r. Earnings per shareThe earnings considered in ascertaining the Company’s earnings per share comprise the net profi t after tax. The
number of shares used in computing basic earnings per share is the weighted average number of shares outstanding
during the year. The number of shares used in computing diluted earnings per share comprises the weighted average
number of shares considered for deriving basic earnings per share and also the weighted average number of shares,
if any, which would have been issued on the conversion of all dilutive potential equity shares.
s. Derivative Instruments and Hedge AccountingThe Company uses foreign currency forward contracts to hedge its risks associated with foreign currency fl uctuations
relating to certain fi rm commitments and highly probable forecast transactions. The Company does not hold derivative
fi nancial instruments for speculative purposes. The Company has applied to all such contracts outstanding as
on March 31, 2012 the hedge accounting principles set out in Accounting Standard 30 “Financial Instruments :
Recognition and Measurement” (AS30) by marking them to market. Changes in the fair value of the contracts that
are designated and effective hedges of future cash fl ows are recognised directly in Hedging Reserve Account.
3. Share Capital
i. The Company has only one class of shares referred to as equity shares having a par value of ` 2/-
` in Lakhs
31-Mar-2012 31-Mar-2011
Authorized shares
425,000,000 (Previous Year 425,000,000) Equity Shares of ` 2/- each 8,500.00 8,500.00
Issued, Subscribed and fully paid up
398,578,195 (Previous Year 396,330,055) Equity Shares of ` 2/- each fully paid
up
7,971.56 7,926.60
ii. Reconciliation of the shares outstanding at the beginning and at the end of the reporting period;
31-Mar-2012 31-Mar-2011
No of shares ` in Lakhs No of shares ` in Lakhs
At the beginning of the year 396,330,055 7,926.60 393,179,830 7,863.60
Allotted during the year under – ESOP, 2008 2,248,140 44.96 3,150,225 63.00
Outstanding at the end of the year 398,578,195 7,971.56 396,330,055 7,926.60
iii. Terms/rights attached to equity shares;
Each holder of equity share is entitled to one vote per share. The Company declares and pays dividends in Indian
rupees. For the year ended March 31, 2012 a dividend of ` 0.40 per equity share has been proposed by the
Board of Directors (Previous year ` 1.10 per share). The dividend proposed by the Board of Directors is subject
to the approval of the shareholders at the ensuing Annual General Meeting.
iv. Shares held by shareholders holding more than 5 %
31-Mar-2012 31-Mar-2011
No of shares % of Share holding
No of shares % of Share holding
Redington (Mauritius) Limited 84,027,302 21.08 114,507,975 28.89
Synnex (Mauritius) Limited 94,295,940 23.66 110,190,940 27.80
Standard Chartered Private Equity (Mauritius)
Limited
47,686,500 11.96 - -
T Rowe Price International - - 35,243,841 8.89
4. Reserves & Surplus` in Lakhs
i. Securities Premium Reserve 31-Mar-2012 31-Mar-2011
Balance as per the last Balance sheet 34,489.26 33,726.64
Add: Share issued on exercise of ESOP,2008 546.11 762.62
Balance at the end of the year 35,035.37 34,489.26
` in Lakhs
ii. General Reserve 31-Mar-2012 31-Mar-2011
Balance as per the last Balance sheet 4,181.17 2,896.77
Add: Transfer from surplus in statement of profi t and loss 1,176.09 1,284.40
Balance at the end of the year 5,357.26 4,181.17
` in Lakhs
iii. Hedge Accounting Reserve 31-Mar-2012 31-Mar-2011
Balance as per the last Balance sheet (2.09) (184.77)
Add: Net movement during the year 19.61 182.68
Balance at the end of the year 17.52 (2.09)

Annual Report 2011–2012
63Annual Report
2011–2012
62
1 TO CONTENTS PAGE 3 CLOSE
` in Lakhs
iv. Surplus in the Statement of profi t and loss 31-Mar-2012 31-Mar-2011
Balance as per the last Balance sheet 29,811.46 23,295.51
Profi t for the year 15,681.21 12,844.04
Sub total 45,492.67 36,139.55
Less: Appropriations
Proposed fi nal equity dividend for the year 1,595.22 4,370.95
Dividend Distribution Tax on the Proposed Dividend 197.53 658.91
Dividend including Dividend distribution tax for previous year (6,41,310, Previous
Year 237,235 equity shares issued under Employee Stock Option Plan 2008)
8.20 13.83
Transfer to general reserve 1,176.09 1,284.40
Balance at the end of the year 42,515.63 29,811.46
Total reserves and surplus 82,925.78 68,479.80
5. Long Term Provisions` in Lakhs
31-Mar-2012 31-Mar-2011
Compensated Absences 196.20 154.53
Gratuity 467.50 371.37
Total 663.70 525.90
Gratuity
The Company's obligation towards Gratuity fund is a Defi ned Benefi t Plan and the details of actuarial valuation as at the
year end is given below:
a. Movement` in Lakhs
Particulars 2011-12 2010-11
Projected Benefi t Obligation at the beginning of the year 401.14 313.64
Service cost 101.68 125.36
Interest Cost 28.83 22.00
Actuarial (gain) / loss (1.84) (18.41)
Benefi ts paid (34.53) (41.45)
Projected Benefi t Obligation at the end of the year 495.28 401.14
Amount recognized in the Balance Sheet:
Projected benefi t obligation at the end of the year 495.28 401.14
Liability recognized in the Balance Sheet 495.28 401.14
Particulars 2011-12 2010-11
Cost of the defi ned plan for the year:
Current service cost 101.68 125.36
Interest on obligation 28.83 22.00
Net actuarial loss recognized in the year (1.84) (18.41)
Net cost recognized in the Statement of Profi t and Loss 128.67 128.95
b. Assumptions
Particulars 2011-12 2010-11
Discount Rate 7.5% 7.5%
Salary escalation rate 5% 5%
Demographic assumptions – Mortality LIC 94-96 rates LIC 94-96 rates
Demographic assumptions – Withdrawal 3% 3%
The amount provided for gratuity as per actuarial valuation has been arrived after considering future salary increase,
infl ation, seniority and promotion.
6. Short-term borrowings` in Lakhs
31-Mar-12 31-Mar-11
Secured Loan from Banks
- Repayable on demand 21,700.06 -
- Others 22,286.93 33,877.21
Secured - Term Loan from Banks - 1,875.00
Unsecured Loan from Banks
- Repayable on demand 157.86 -
- Others 17,926.65 15,750.63
Total 62,071.50 51,502.84
a. Loans from Banks are secured by pari-passu charge on fi xed assets, Inventory, and trade receivables.b. The Company placed Commercial Paper during the year, there are no amounts outstanding as at March 31, 2012 and the
maximum amount outstanding any time during the year was ` 29,000 Lakhs (Previous Year ` 27,500 Lakhs).
7. Trade Payables` in Lakhs
31-Mar-2012 31-Mar-2011
Trade Payables* 92,737.19 88,667.64
Other Payables 3,701.92 2,990.55
Total 96,439.11 91,658.19
Trade payables are dues in respect of goods purchases or services received (including from employees) in the
normal course of business.
* Trade Payables includes due to Micro and Small Enterprises
` in Lakhs
31-Mar-2012 31-Mar-2011
Due to Micro and Small Enterprises 16.39 19.20
Total 16.39 19.20
The Company has circulated the letters and based on confi rmation from the parties necessary disclosures relating to
Micro and Small Enterprises as defi ned under the Micro, Small and Medium Development Act, 2006 are made in the
fi nancials in accordance with the Notifi cation No: GSR 719 (E) dated 16.11.2007 issued by the Ministry of Corporate
Affairs. There is no overdue outstanding (including interest) payable to these enterprises.

Annual Report 2011–2012
65Annual Report
2011–2012
64
1 TO CONTENTS PAGE 3 CLOSE
8. Other current liabilities` in Lakhs
31-Mar-2012 31-Mar-2011
Expenses Payable 4,028.64 4,676.98
Statutory Liabilities 5,220.37 4,939.05
Other Liabilities 1,279.59 2,210.00
Interest accrued but not due on loans 829.71 755.84
Deferred Revenue 785.89 660.14
Unclaimed Dividend* 4.57 2.80
Total 12,148.77 13,244.81* No Amount is due and outstanding to be credited to Investor Education and Protection Fund as on March 31, 2012
9. Short-term provisions` in Lakhs
31-Mar-2012 31-Mar-2011
Provision for Compensated absences 55.95 42.09
Provision for Gratuity 27.78 29.77
Proposed Dividend 1,595.22 4,370.95
Dividend Tax on Proposed Dividend 258.78 709.08
Total 1,937.73 5,151.89
10. Fixed Assets
` in Lakhs
Description
Gross Block Depreciation Net Block
01-April-2011 Additions Deletions 31-Mar-2012 01-April-2011For the
YearDeletions 31-Mar-2012 31-Mar-2012 31-Mar-2011
i. Tangible Assets
Land 2,615.55 164.09 2,779.64 - - 2,779.64 2,615.55
Buildings 2,564.26 40.74 - 2,605.00 319.14 147.94 - 467.08 2,137.92 2,245.12
Plant and Equipment 1,114.64 163.09 42.01 1,235.72 665.48 169.35 31.58 803.25 432.47 449.16
Furniture & Fixtures 2,253.71 736.64 292.37 2,697.98 1,608.65 372.10 266.03 1,714.72 983.26 645.06
Offi ce Equipment 452.21 85.92 35.18 502.95 316.76 56.25 33.41 339.60 163.35 135.45
Computers 1,687.60 328.00 98.29 1,917.31 1,490.21 136.68 93.66 1,533.23 384.08 197.39
Vehicles 305.92 137.09 30.04 412.97 73.16 66.81 17.34 122.63 290.34 232.76
Sub total 10,993.89 1,655.57 497.89 12,151.57 4,473.40 949.13 442.02 4,980.51 7,171.06 6,520.49
Previous year 9,884.50 1,201.84 92.45 10,993.89 3,264.83 1,272.68 64.11 4,473.40 6,520.49 6,619.67
ii. Intangible Assets
Software 663.87 65.96 - 729.83 580.15 105.63 - 685.78 44.05 83.72
Sub total 663.87 65.96 - 729.83 580.15 105.63 - 685.78 44.05 83.72
Previous year 593.46 70.41 - 663.87 505.83 74.32 580.15 83.72 87.63
Grand total 11,657.76 1,721.53 497.89 12,881.40 5,053.55 1,054.76 442.02 5,666.29 7,215.11 6,604.21
Previous year 10,477.96 1,272.25 92.45 11,657.76 3,770.66 1,347.00 64.11 5,053.55 6,604.21 6,707.30
11. Non-current Investments
Investment in Equity Instruments - Unquoted
Investment in Subsidiaries & Associates:
Investment in Subsidiaries` in Lakhs
Name of the Corporate Body 31-Mar-2012 31-Mar-2011
1,301,294 (Previous Year 1,301,294) Equity Shares of ` 10/- each fully paid-
up in Cadensworth (India) Limited
612.27 612.27
151,030,000 (Previous Year 151,030,000) Equity Shares of ` 10/- each fully
paid-up in Easyaccess Financial Services Limited
22,074.74 22,074.74
10,000,000 (Previous Year 4,000,000) Equity Shares of ` 10/- each fully
paid-up in Nook Micro Distribution Limited (6,000,000 shares acquired
during the year)
1,010.32 410.32
Redington International Holdings Ltd 21,412.33 21,412.33
24,050,000 (Previous Year 50,000) Equity Shares of US$ 1 each fully paid-
up in Redington International Mauritius Limited (24,000,000 shares acquired
during the year)
12,165.42 22.62
3,800,000 (Previous Year 3,800,000) Equity Shares of US$ 1 each fully paid-
up in Redington Distribution Pte Limited
1,762.81 1,762.81
50,000 (Previous Year 50,000) Equity Shares of ` 10/- each fully paid-up in
Redington (India) Investments Limited*
NIL 5.00
Total 59,037.89 46,300.09
Investment in associate:
Name of the Corporate Body 31-Mar-2012 31-Mar-2011
50,000 (Previous Year 50,000) Equity Shares of ` 10/- each fully paid-up in
Redington (India) Investments Limited*
5.00 NIL
* Became an Associate from 8th June 2011
Total Investments 59,042.89 46,300.09
12. Deferred Tax
Break-up of Deferred Tax Assets and Deferred Tax Liabilities arising on account of timing differences:
` in Lakhs
Particulars 31-Mar-2012 31-Mar-2011i. Deferred Tax Assets: Provision for doubtful trade Receivables 364.55 218.08 Gratuity 160.69 130.15 Leave encashment 81.81 63.79Total 607.05 412.02
ii. Deferred Tax Liability:
Depreciation 100.20 7.17
Total 100.20 7.17
Deferred Tax Asset (Net) 506.85 404.85

Annual Report 2011–2012
67Annual Report
2011–2012
66
1 TO CONTENTS PAGE 3 CLOSE
13. Long Term loans and advances` in Lakhs
31-Mar-2012 31-Mar-2011
Unsecured & Considered Good
Capital Advances 97.43 19.53
Advance Taxes (Net of Provisions) 2,381.09 1,659.94
Deposits 410.72 374.30
Receivable from Customs Department 850.03 1,125.09
Total 3,739.27 3,178.86
14. Inventories` in Lakhs
31-Mar-2012 31-Mar-2011
Trading Stocks 72,040.88 57,451.91
Goods in Transit 9,201.67 13,848.68
Service Spares 456.83 442.48
Total 81,699.38 71,743.07
15. Trade Receivables – Unsecured` in Lakhs
31-Mar-2012 31-Mar-2011
Trade receivables outstanding for a period exceeding six months from the
date they were due for payment
Considered Good 8,372.29 5,453.53
Considered Doubtful 1,123.58 672.14
9,495.87 6,125.67
Other trade receivables – Considered Good 75,045.17 79,973.27
84,541.04 86,098.94
Less :- Provision for doubtful trade receivables 1,123.58 672.14
Total 83,417.46 85,426.80
16. Cash and Cash Equivalents` in Lakhs
31-Mar-2012 31-Mar-2011
Cash on hand 18.17 21.37
Balances with Banks
On Current Account 5,897.92 14,749.81
On Deposit Account 260.00 235.00
Earmarked Balances – Unclaimed Dividend account 4.57 2.80
Margin Money with Banks 1.17 10.69
Total 6,181.83 15,019.67
17. Short term loans & advances` in Lakhs
31-Mar-2012 31-Mar-2011
Unsecured & Considered Good
Loans and Advances to related parties
Easyaccess Financial Services Limited 7.33 -
Nook Micro Distribution Limited 18.10 240.00
Cadensworth India Limited 0.92 -
Redington International Mauritius Limited 12,119.06 -
Others
Receivables from Customs authorities 4,654.69 4,928.21
Service tax receivable 2,422.31 1,331.28
Others Advances 373.45 1,126.50
Prepaid expenses 626.82 653.73
Deposits 1,264.75 1,392.61
Total 21,487.43 9,672.33
18. Revenue from Operations` in Lakhs
31-Mar-2012 31-Mar-2011
Sales 943,696.62 780,739.27
Service Income 13,065.99 9,774.58
Rebates 27,258.64 22,665.89
Other operating revenues 19.27 15.20
Total 984,040.52 813,194.94
19. Other Income` in Lakhs
31-Mar-2012 31-Mar-2011
Dividend from subsidiaries 568.85 442.21
Interest on loan 979.69 185.37
Interest from dealers 1,017.41 439.91
Interest on Bank deposits 91.69 12.78
Dividend from Short term Investments 68.30 -
Profi t/(Loss) on Sale of Fixed Assets 8.03 18.85
Bad Debts Written off in earlier years recovered 45.66 24.06
Exchange gain/(loss) Net 246.23 101.35
Others 81.65 64.77
Total 3,107.51 1,289.30

Annual Report 2011–2012
69Annual Report
2011–2012
68
1 TO CONTENTS PAGE 3 CLOSE
20. Employee Benefi ts` in Lakhs
31-Mar-2012 31-Mar-2011
Salaries & Bonus 8,608.56 7,451.20
Contribution to Provident Fund & Other Funds 419.33 351.06
Welfare Expenses (including compensated absences) 596.71 379.16
Gratuity 128.67 128.95
Total 9,753.27 8,310.37
21. Finance Costs` in Lakhs
31-Mar-2012 31-Mar-2011
Interest on loan 6,586.54 3,792.16
Other Borrowing Costs 1,153.89 513.12
Total 7,740.43 4,305.28
22. Other Expenses` in Lakhs
31-Mar-2012 31-Mar -2011
Rent 2,440.77 1,960.62
Freight 2,252.17 1,696.67
Commercial Taxes 3,062.55 1,584.52
Repairs & Maintenance 741.95 584.25
Utilities 369.80 323.58
Insurance 398.89 306.86
Rates and Taxes 44.03 40.28
Communication 678.83 629.75
Travel 790.21 532.60
Conveyance 336.45 255.02
Bad Debts 588.33 729.37
Less :-Written off against provision 561.93 26.40 412.52 316.85
Provision for doubtful receivables 1,013.37 486.14
Auditor’s Remuneration (Refer details below) 50.69 45.91
Factoring Expenses 2,224.72 2,328.63
Trade Mark License Fees 107.53 181.52
Director’s remuneration 55.80 56.30
Outsourced Resource Cost 526.97 407.96
Bank charges 369.94 388.64
Miscellaneous Expenses 1,689.80 1,073.26
Total 17,180.87 13,199.36
Auditor’s Remuneration` in Lakhs
Particulars 31-Mar-2012 31-Mar-2011
Audit Fees 21.00 17.50
Taxation Matters 1.50 1.00
Certifi cation 22.60 22.42
Reimbursement of Expenses including taxes 5.59 4.99
Total 50.69 45.91
23. Earnings per Share
The calculation of the Basic and Diluted Earning per share is based on the following data:-
Description 31-Mar-2012 31-Mar-2011
Profi t after Tax (` in Lakhs) 15,681.21 12,844.04
Weighted Average Number of equity shares (Basic) 398,024,290 395,348,997
Earning per share- Basic ` 3.94 3.25
Weighted Average Number of equity shares on account of Employee Stock
Option Plan 2008 (Diluted)
399,072,457 397,931,703
Earning per share- Diluted ` 3.93 3.23
Face Value per share in ` 2/- 2/-
24. Contingent Liabilities & Commitments` in Lakhs
Particulars 31-Mar-2012 31-Mar-2011
i. Corporate Guarantees outstanding
On behalf of subsidiaries 59,269.38 39,484.08
Others NIL 321.68
ii. Bills Discounted 3,665.34 7,347.12
iii. Factoring 7,272.50 5,750.00
iv. Claims against the Company not acknowledged as debts 185.83 563.63
v. The Company has in addition to the above issued letters of comfort /awareness to banks for the facilities granted to
its subsidiaries.
vi. Disputed Income Tax/Sales Tax/Customs Duty demands
` in Lakhs
Nature of Dues 31-Mar-2012 31-Mar-2011
Customs duty 169.64 315.79
Income Tax 795.39 520.56
Sales Tax 1,204.25 1,229.18
The Company has paid ` 495.73 lakhs under protest (Previous Year ` 631.23 Lakhs), which is included under Long-
term loans and advances.
vii. Capital Commitments
Estimated amount of contracts remaining to be executed on capital account and not provided for (net of advances)
is ` 2,575.90 Lakhs (Previous Year ` 406.34 Lakhs).

Annual Report 2011–2012
71Annual Report
2011–2012
70
1 TO CONTENTS PAGE 3 CLOSE
25. Operating LeasesThe Company has taken cancelable operating lease for its offi ce premises, which are for a period ranging from 11
months to 9 years.
26. Segment ReportingThe Company primarily operates in distribution business and after sales services of IT and other products and as the
revenue from service segment is less than 10% of the total revenue, there are no reportable segments as required
to be disclosed under the Accounting Standard 17 “Segment Reporting”. Although the Company’s operations
cover various States in India, the State laws have no signifi cant impact on profi tability. Accordingly there are no
geographical segments to be reported.
27. Accounting for Financial InstrumentsPursuant to the announcement of the Institute of Chartered Accountants of India (ICAI) in respect of “Accounting for
Derivatives”, the Company had opted to follow the recognition and measurement principles relating to derivatives
as specifi ed in AS 30 “Financial Instruments, Recognition and Measurement”, issued by the ICAI, and from the year
ended 31 March 2008.
Consequently, as of 31 March 2012, the Company has recognised Mark to Market (MTM) Gain of ` 17.52 lakhs.
(Previous Year loss of ` 2.09 lakhs) relating to forward contracts and other derivatives entered into to hedge the
foreign currency risk of highly probable forecast transactions that are designated as effective cash fl ow hedges, in
the Hedge Reserve Account as part of the Shareholders Funds.
The MTM net loss on undesignated / ineffective forward contracts amounting to ` Nil (Previous Year ` 111.55 lakhs)
has been recognised in the Statement of Profi t and Loss.
The Contracts in Hedge Reserve Account are expected to be recognised in the Statement of Profi t and Loss on
occurrence of transactions which are expected to take place over the next 12 months.
Details of Derivative Exposures are as under:
Type of DerivativeContacts
Booked for
31-Mar-2012 31-Mar-2011
No of Contracts
$ in Lakhs
` in Lakhs
No of Contracts
$ in Lakhs
` in Lakhs
Forward Contracts
entered into to hedge the
foreign currency risk of
highly probable forecast
transactions
Imports 188 67.00 3429.39 98 200.15 9096.29
28. Events occurring after the balance sheet datei. Equity shares of ̀ 2/- each fully paid up were issued and allotted pursuant to the exercise of stock options under
Employee Stock Option Plan 2008.
Date of allotment No of Shares
20th April 2012 2,26,000
29. Related party disclosures
1) Key Management Personnel
Mr. R.Srinivasan, Managing Director
Mr. Raj Shankar, Deputy Managing Director
Mr. M.Raghunandan, Wholetime Director
Refer below Note 30 for remuneration
2) Names of the related parties
Party where control exists Redington Employee Share Purchase Trust *
Parties having Signifi cant Infl uence Redington (Mauritius) Limited, Mauritius *
Synnex Mauritius Limited, Mauritius *
Subsidiary Companies Nook Micro Distribution Limited, India *
Cadensworth (India) Limited, India*
Easyaccess Financial Services Limited, India*
Redington International Mauritius Limited, Mauritius*
Redington International (Holdings) Limited, Cayman Islands
Redington Gulf FZE, Dubai
Cadensworth FZE, Dubai
Redington Gulf & Co. LLC, Oman
Redington Nigeria Ltd, Nigeria
Redington Egypt Ltd, Egypt
Redington Kenya Ltd, Kenya
Redington Middle East LLC, Dubai
Redington Qatar WLL, Qatar
Redington Arabia Limited, Saudi Arabia
Redington Africa Distribution FZE. Dubai
Redington Bahrain SPC, Bahrain
Redington Distribution Pte Ltd, Singapore *
Redington Bangladesh Limited, Bangladesh
Redington Qatar Distribution WLL, Qatar
Redington Kenya (EPZ) Ltd., Kenya
Redington Limited, Ghana
Redington Uganda Limited, Uganda
Africa Joint Technical Services, Libya
RGF Private Trust Company Limited, Cayman Islands
Redington Gulf FZE Co, Iraq
Cadensworth United Arab Emirates LLC, Dubai
Redington Morocco Limited, Morocco.
Redington Tanzania Ltd., Tanzania
Redington SL Pvt Limted, Sri lanka
Redington Angola ADA, Angola
Redington Turkey Holdings S.A.R.L
Arena Bilgisayar Sanayi Ve Ticaret Anonim Sirketi, Turkey#
Arena International FZE, Dubai
Redington IT Services (PTY) Limited, South Africa
Associates Redington (India) Investments Limited, India*
Currents Technology Retail (India) Limited, India*
* Represents companies with whom transactions have taken place during the year.
# As Redington Turkey Holdings S.A.R.L. has effective control over the composition of Board of directors Arena is considered as
subsidiary.
Related Parties have been identifi ed by the management.

Annual Report 2011–2012
73Annual Report
2011–2012
72
1 TO CONTENTS PAGE 3 CLOSE
3) Nature of Transactions
` in Lakhs
Nature of Transactions 31-Mar-2012 31-Mar-2011
Party Where
Control Exists
Party Where
Control Exists
Redington Employees Share Purchase Trust
Loan Granted NIL 4.50
Loan re-paid 4.50 NIL
Dividend Paid 0.54 0.10
Loan Outstanding NIL 4.50
` in Lakhs
Nature of Transactions 31-Mar-2012 31-Mar-2011
Parties having
Signifi cant
Infl uence
Parties having
Signifi cant
Infl uence
Redington (Mauritius) Limited
Dividend Paid 924.30 1145.08
Synnex Mauritius Limited
Dividend Paid 1,037.26 1101.91
` in Lakhs
Nature of Transactions 31-Mar-2012 31-Mar-2011
Subsidiary
Companies
Subsidiary
Companies
Cadensworth (India) Limited
Sales/Service Charges – Expense 3.21 11.83
Sales/Service Charges – Income 6.76 4.61
Amount Payable at year end 0.07 0.56
Amount Receivable at year end 2.09 NIL
Cadensworth FZE
Corporate Guarantees at year end NIL 4,459.50
Easyaccess Financial Services Ltd
Sales/Service Charges – Income 59.04 50.04
Sale of fi xed assets – Income 32.50 NIL
Receivables Factored 196,126.40 297,055.87
Factoring Expenses 2,105.27 2175.58
Interest Income 750.02 179.93
Dividend received – Income 377.58 302.06
Rent received 0.12 0.12
Rent Paid 27.65 NIL
Amount Receivable at year end 7.33 NIL
Loan Granted 40,750.00 22,000.00
Loan Repaid 40,750.00 22,000.00
Nook Micro Distribution Limited
Rent Paid 8.40 7.13
Rent received 12.69 2.88
Interest Income 25.69 5.44
Rebates – Expenses NIL 10.19
Loan Granted 250.00 330.50
Loan Repaid 490.00 90.50
Equity Contribution 600.00 395.00
Sales/Service Charges- Income 1,481.61 339.89
Purchases 0.08 1.00
Amount Receivable at year end (Net) 150.73 63.34
Loan outstanding at the year end NIL 240.00
Redington Distribution Pte Limited
Trading Purchases 4,526.45 1,224.44
Sales/Service Charges 674.52 248.46
Dividend received – Income 191.27 140.15
Trade Mark License Fees 97.85 181.52
Amount Receivable at year end 246.47 191.69
Amount Payable at year end 136.13 173.39
Corporate Guarantees at year end 13,481.88 10,836.59
Redington International (Mauritius) Limited
Equity Contribution 12,142.80 NIL
Interest Income 203.98 NIL
Loan Granted 27,007.42 NIL
Loan repaid 14,998.35 NIL
Amount Receivable at year end 109.99 NIL
Loan outstanding at the year end 12,009.07 NIL
Corporate Guarantees at year end 45,787.50 NIL
Redington Gulf FZE
Corporate Guarantees at year end NIL 24,187.99
Nature of Transactions 31-Mar-2012 31-Mar-2011
Associate
Companies
Associate
Companies
Redington (India) Investments Limited
Sales/Service Charges – Income 0.10 NIL
Amount Receivable at year end (Net) 0.10 NIL
Currents Technology Retail (India) Limited
Sales/Service Charges – Income 515.58 NIL
Amount Receivable at year end 308.63 NIL

Annual Report 2011–2012
75Annual Report
2011–2012
74
1 TO CONTENTS PAGE 3 CLOSE
30. Managerial remuneration;` in Lakhs
Particulars 31-Mar-2012 31-Mar-2011
(a) Computation of net profi t under section 349 of the Companies Act, 1956
Profi t before Taxation 23,329.21 19,339.64
Add:
Whole Time Director Remuneration 40.00 39.41
Directors’ Sitting Fees 5.80 6.30
Directors’ Commission 50.00 50.00
Provision for Doubtful Receivable 1,013.37 1,109.17 486.14 581.85
24,438.38 19,921.49
Less :Profi t on Disposal of Fixed Assets (Net) 8.03 18.85
Receivable written off against previous year’s provision
and not debited to Statement of Profi t & Loss
588.33 596.36 412.52 431.37
23,842.02 19,490.12
Commission @ 1% there on 238.42 194.90
Restricted to 50.00 50.00
(b) Remuneration to Whole time Director
1) Salaries, Allowances & Bonus 36.76 36.30
2) Contribution to Provident Fund* 1.44 1.44
3) Perquisites 1.80 1.67
Total 40.00 39.41
(c) Remuneration to Non-Whole time Directors
Sitting Fees 5.80 6.30
Commission# 50.00 50.00
Total 55.80 56.30
* Excludes contribution to gratuity & compensated absences since employee wise valuation is not available
# For FY 2011-12 requires approval of the Shareholders at the ensuing Annual General Meeting
(d) Remuneration drawn by the Managing Director and Deputy Managing Director from wholly owned overseas subsidiary
` in Lakhs
Particulars 31-Mar-2012 31-Mar-2011
Salary, Allowances and Bonus 573.34 551.74
Contribution to provident fund 5.18 4.52
Total 578.52 556.26
31. CIF Value of Imports
` in Lakhs
Particulars 31-Mar-2012 31-Mar-2011
Trading Stocks 355,490.37 292,209.63
32. Expenditure in Foreign Currency` in Lakhs
Particulars 31-Mar-2012 31-Mar-2011
Royalty (Cost of Software) 1,549.34 1,534.88
Trade Mark License Fees 97.85 181.52
Travel 13.02 13.96
License fee 1.86 11.44
Consultancy charges NIL 2.58
33. Earnings in Foreign Currency` in Lakhs
Particulars 31-Mar-2012 31-Mar-2011
Supplier rebates and discounts 15,932.98 11,986.15
Dividend Income 191.27 140.15
FOB Value of Exports 674.52 248.46
34. Dividend remitted in Foreign Currency
Particulars 2011-12 2010-11
No. of non-resident shareholders 10 6
No. of Equity shares held (Face value of ` 2) 179,610,582 225,747,755
Amount remitted (` in Lakhs) 1,975.72 2,257.48
Financial Year to which it relates 2010-11 2009-10
35. Employee Stock Option Plan 2008As the Company follows intrinsic value method of accounting, no compensation costs have been recognized in
these accounts as the options have been granted at the prevailing market prices.
Particulars Grant I Grant II Grant III Grant IV Grant V
Date of Grant 29-Feb-08 25-Jul-08 28-Jan-09 22-May-09 5-Dec-11
Exercise Price(` )* 348.05 319.90 130.00 165.00 396.50
Vesting commences on 28-Feb-09 24-Jul-09 27-Jan-10 21-May-10 4-Dec-12
Options granted 2,335,973 11,000 276,143 25,000 173,212
Options lapsed 488,889 - - - 10,550
Options vested 1,847,084 11,000 276,143 18,750 -
Options exercised at the beginning of the
year
1,226,407 4,250 157,108 12,500 -
Options exercised during the year 372,343 2,000 69,035 6,250 -
Total options outstanding and not
exercised as on 31st March 2012
248,334 4,750 50,000 6,250 162,662
* Out of the total grant of options in 2008, 19,59,830 options were repriced at ` 130/- on 28th January 2009 and 75,000 options
were repriced at ` 165/- on 22nd May 2009

Annual Report 2011–2012
77Annual Report
2011–2012
76
1 TO CONTENTS PAGE 3 CLOSE
Out of the lapsed options the Board/Committee of directors at their meetings had approved reissue of options as
follows
Date of Grant July 25, 2008 January 28, 2009 May 22, 2009 December 5, 2011
No. of options 11,000 276,143 25,000 173,212
The fair value of options based on the valuation of the independent valuer as of the respective dates of grant are
given below:
Grant Date 29-Feb-08Repriced on
28-Jan-09
Repriced on
22-May-0925-Jul-08
Repriced on
28-Jan-0928-Jan-09 22-May-09 5-Dec-11
Fair Value 171.33 25.56 33.04 159.71 23.77 47.46 79.82 171.72
The variables used for calculating the Fair Values and their rationale are as follows:
A. Stock priceThe closing market price on the date prior to the date of grant on National Stock Exchange (NSE) has been considered
for the purpose of option valuation.
B. VolatilityVolatility is a measure of the amount by which a price has fl uctuated or is expected to fl uctuate during a period.
The measure of volatility used in the Black-Scholes option-pricing model is the annualized standard deviation of the
continuously compounded rates of return on the stock over a period of time.
The period to be considered for volatility has to be adequate to represent a consistent trend in the price movements.
It is also important that movements due to abnormal events get evened out.
There is no research that demonstrates conclusively how long the historical period used to estimate expected long-
term future volatility should be. However, Guidance note on Accounting for Employee Share-based Payments issued
by the Institute of Chartered Accountants of India recommends including the historical volatility of the stock over the
most recent period that is generally commensurate with the expected life of the option being valued.
The entity’s stocks have been publicly traded on NSE and BSE. For calculating Volatility, we have considered the
daily volatility of the stock prices on NSE, over a period prior to the date of grant, corresponding with the expected
life of the options.
The Fair value of an option is very sensitive to this variable. Higher the volatility, higher is the Fair value. The rationale
being, the more volatile a stock is, the more is its potential to go up (or come down), and the more is the probability
to gain from the movement in the price. Accordingly, an option to buy a highly volatile stock is more valuable than the
one to buy a less volatile stock, for the probability of gaining is lesser in the latter case.
C. Risk free interest rateThe risk-free interest rate being considered for the calculation is the interest rate applicable for maturity equal to the
expected life of the options based on the zero-coupon yield curve for Government Securities.
D. Exercise PriceOptions have been granted primarily at a price of ` 348.05 on 29th February 2008. Subsequently, 19,59,830 and
75,000 options were re-priced at a Market price of ` 130/- and ` 165/- on 28th January 2009 and 22nd May 2009
respectively. On December 5, 2011 1,73,212 options were granted at a price of ` 396.50 per option.
E. Time to Maturity / Expected Life of optionsTime to Maturity / Expected Life of options is the period for which the Company expects the options to be live.
The minimum life of a stock option is the minimum period before which the options cannot be exercised and the
maximum life is the period after which the options cannot be exercised.
According to SEBI Guidelines, the expected life of an award of stock options shall take into account the following
factors –
i. The expected life must at least include the vesting period.
ii. The average lengths of time of similar grants have remained outstanding in the past. If the Company does not
have a suffi ciently long history of stock option grants, the experience of an appropriately comparable peer
group may be taken into consideration.
iii. The expected life of stock options should not be less than half of the exercise period of the stock options
issued until and unless the same is supported by historical evidences with respect to stock options issued by
the Company earlier.
The fair value of each award has been determined based on different expected lives of the options that vest each
year, as it would be if the award were viewed as several separate awards, each with a different vesting date. A
weighted average of all vests has been calculated to arrive at the value of the options.
The time to maturity has been estimated as illustrated by the following example. In case of the grant made on
December 5, 2011, the earliest date of exercise is December 5, 2012 i.e. one year from the date of grant. The
exercise period is fi ve years from the date of vest.
Hence, the time to maturity for the fi rst vest is equal to the average of the minimum period plus the maximum period
i.e. 1 year + 6 Years = 3.5 years. Time to Maturity has been estimated on a similar basis for the remaining vests.
Expected Dividend yield: Expected dividend yield has been calculated as an average of dividend yields for the
preceding 2 years to the year of grant.
The impact on the profi t of the Company as at the year end and the basic and diluted earnings per share, had the
Company followed the fair value method of accounting for stock options is set out below:
` in Lakhs
Particulars 2011-12 2010-11
Profi t after tax as per statement of Profi t and Loss (a) 15,681.21 12,844.04
Add: Employee Stock Compensation Expense as per Intrinsic Value Method NIL NIL
Less: Employee Stock Compensation Expense as per Fair Value Method 37.69 225.76
Profi t after tax recomputed for recognition of employee stock compensation
expense under fair value method (b)
15,643.52 12,618.28
Earnings per share based on earnings as per (a) above
– Basic
– Diluted
3.94
3.93
3.25
3.23
Earnings per share had fair value method been employed
for accounting of employee stock options as per (b) above
– Basic
– Diluted
3.93
3.92
3.19
3.17
For and on behalf of the Board of Directors
R Srinivasan Raj Shankar M Raghunandan Managing Director Deputy Managing Director Whole Time Director
S V Krishnan M Muthukumarasamy Chief Financial Offi cer Company Secretary
Place : Chennai
Date : May 25, 2012
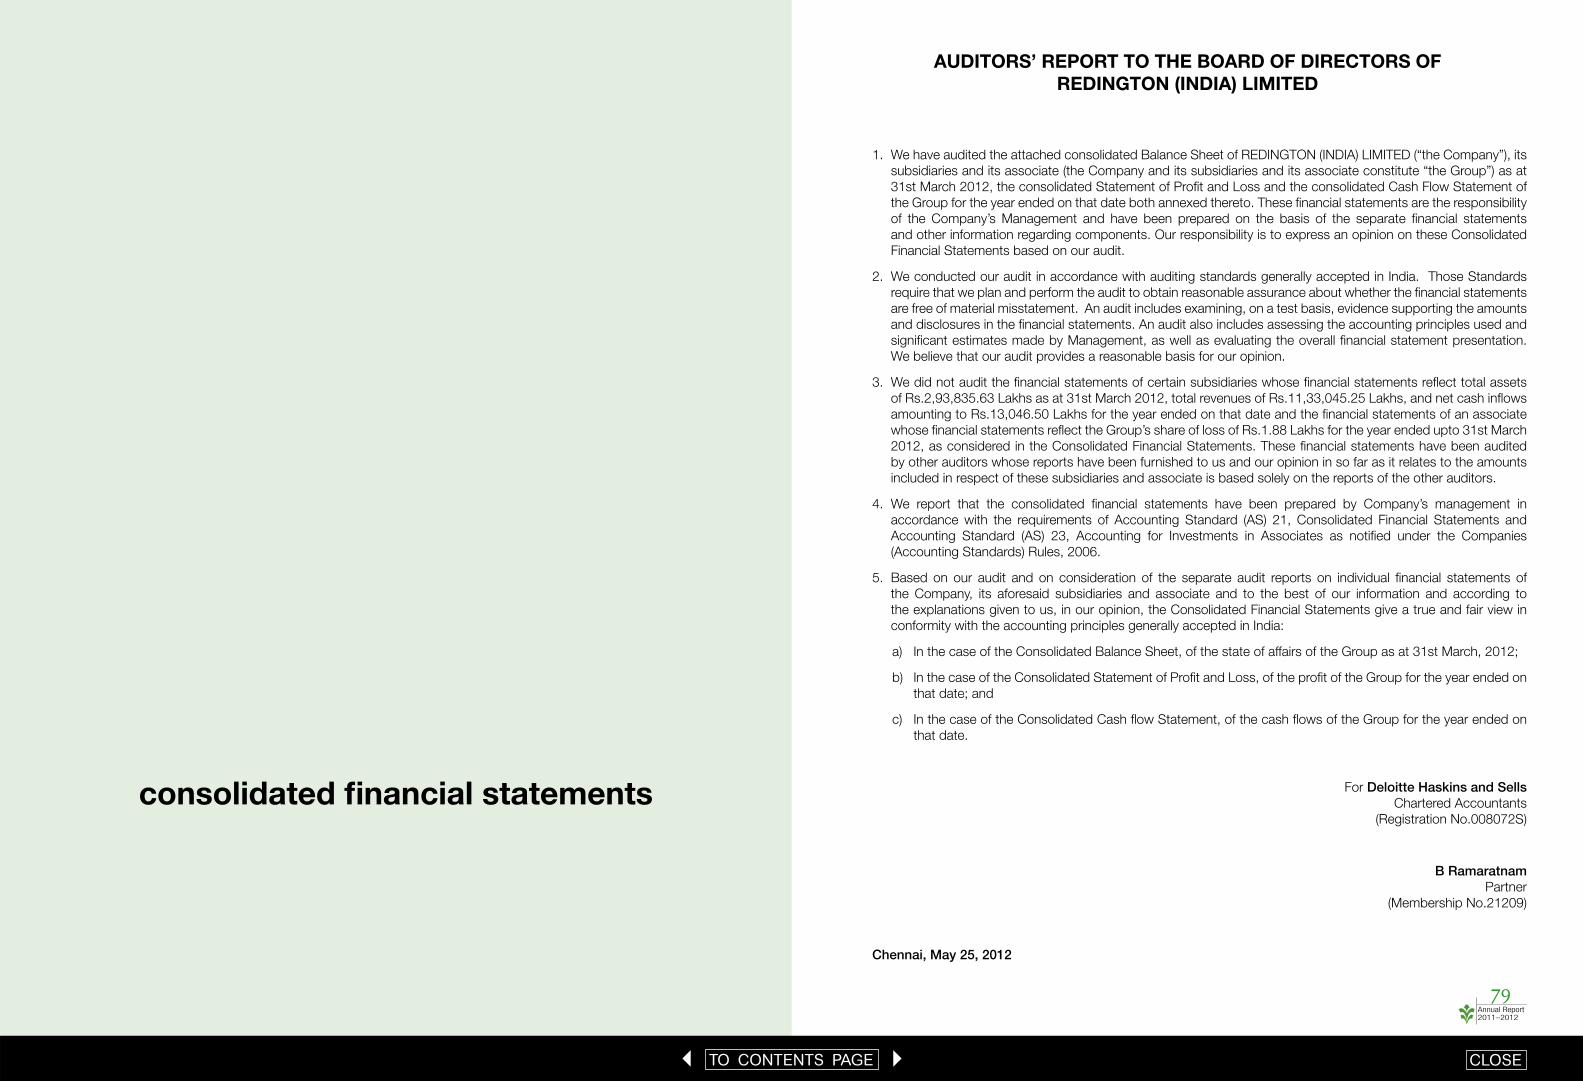
Annual Report 2011–2012
79
consolidated fi nancial statements
AUDITORS’ REPORT TO THE BOARD OF DIRECTORS OF REDINGTON (INDIA) LIMITED
1. We have audited the attached consolidated Balance Sheet of REDINGTON (INDIA) LIMITED (“the Company”), its
subsidiaries and its associate (the Company and its subsidiaries and its associate constitute “the Group”) as at
31st March 2012, the consolidated Statement of Profi t and Loss and the consolidated Cash Flow Statement of
the Group for the year ended on that date both annexed thereto. These fi nancial statements are the responsibility
of the Company’s Management and have been prepared on the basis of the separate fi nancial statements
and other information regarding components. Our responsibility is to express an opinion on these Consolidated
Financial Statements based on our audit.
2. We conducted our audit in accordance with auditing standards generally accepted in India. Those Standards
require that we plan and perform the audit to obtain reasonable assurance about whether the fi nancial statements
are free of material misstatement. An audit includes examining, on a test basis, evidence supporting the amounts
and disclosures in the fi nancial statements. An audit also includes assessing the accounting principles used and
signifi cant estimates made by Management, as well as evaluating the overall fi nancial statement presentation.
We believe that our audit provides a reasonable basis for our opinion.
3. We did not audit the fi nancial statements of certain subsidiaries whose fi nancial statements refl ect total assets
of Rs.2,93,835.63 Lakhs as at 31st March 2012, total revenues of Rs.11,33,045.25 Lakhs, and net cash infl ows
amounting to Rs.13,046.50 Lakhs for the year ended on that date and the fi nancial statements of an associate
whose fi nancial statements refl ect the Group’s share of loss of Rs.1.88 Lakhs for the year ended upto 31st March
2012, as considered in the Consolidated Financial Statements. These fi nancial statements have been audited
by other auditors whose reports have been furnished to us and our opinion in so far as it relates to the amounts
included in respect of these subsidiaries and associate is based solely on the reports of the other auditors.
4. We report that the consolidated fi nancial statements have been prepared by Company’s management in
accordance with the requirements of Accounting Standard (AS) 21, Consolidated Financial Statements and
Accounting Standard (AS) 23, Accounting for Investments in Associates as notifi ed under the Companies
(Accounting Standards) Rules, 2006.
5. Based on our audit and on consideration of the separate audit reports on individual fi nancial statements of
the Company, its aforesaid subsidiaries and associate and to the best of our information and according to
the explanations given to us, in our opinion, the Consolidated Financial Statements give a true and fair view in
conformity with the accounting principles generally accepted in India:
a) In the case of the Consolidated Balance Sheet, of the state of affairs of the Group as at 31st March, 2012;
b) In the case of the Consolidated Statement of Profi t and Loss, of the profi t of the Group for the year ended on
that date; and
c) In the case of the Consolidated Cash fl ow Statement, of the cash fl ows of the Group for the year ended on
that date.
For Deloitte Haskins and SellsChartered Accountants
(Registration No.008072S)
B RamaratnamPartner
(Membership No.21209)
Chennai, May 25, 2012
1 TO CONTENTS PAGE 3 CLOSE
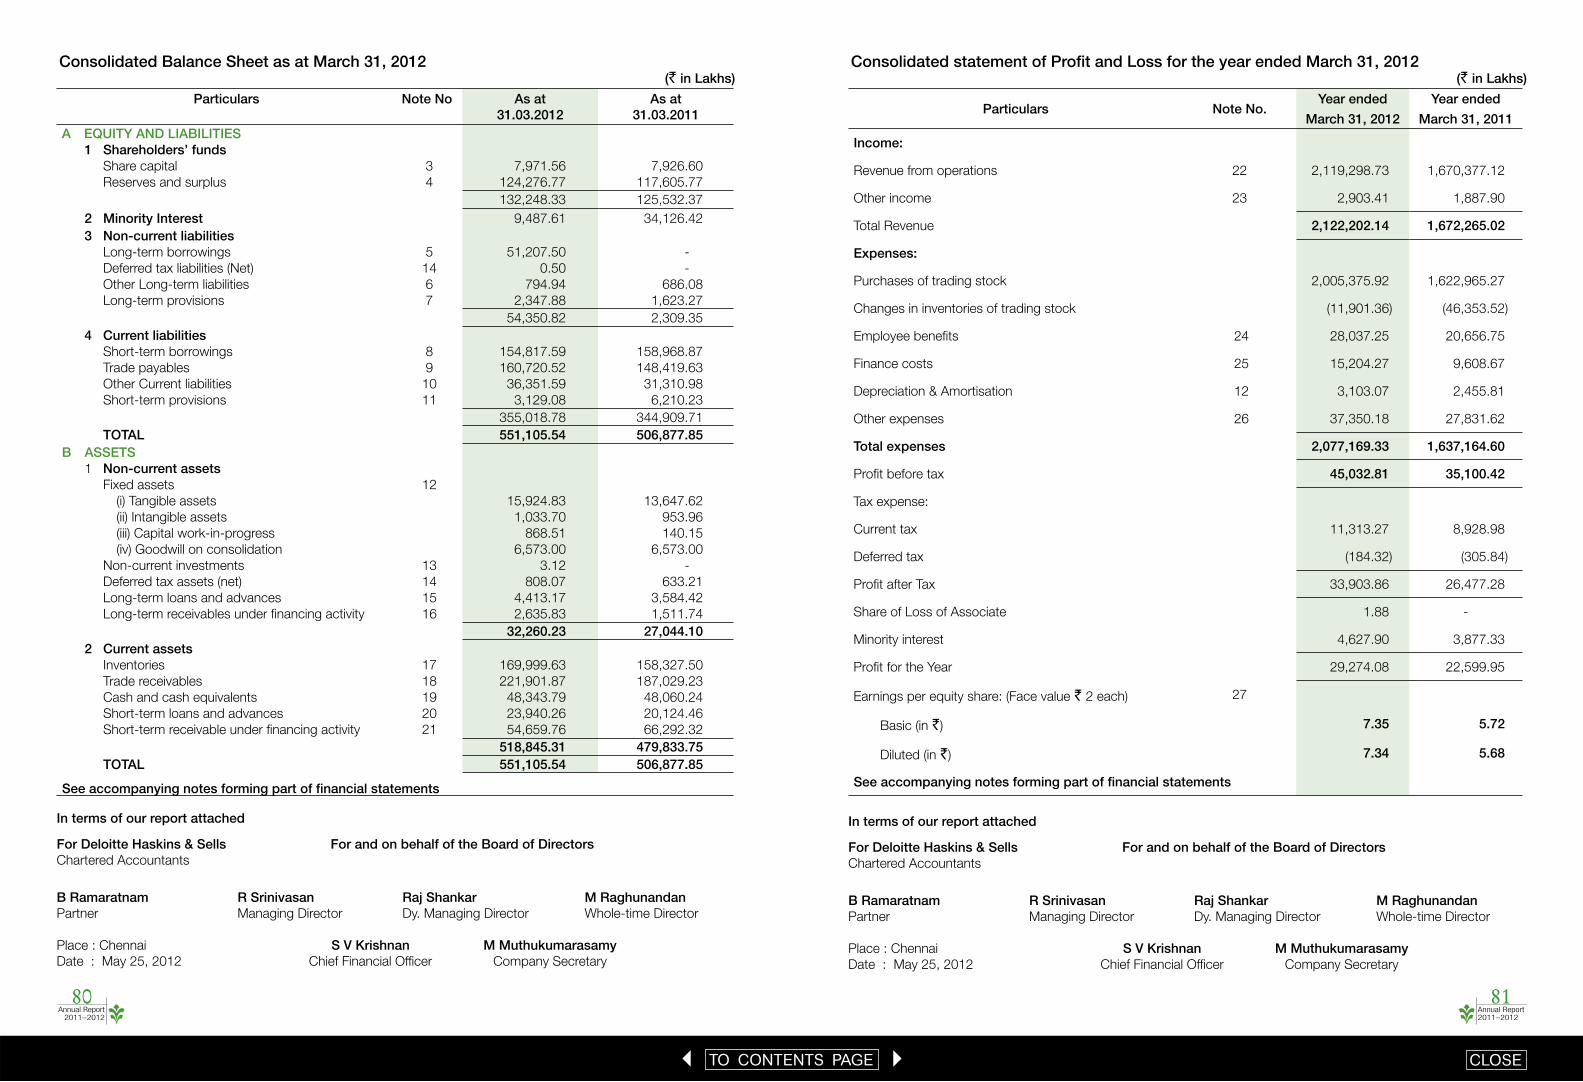
Annual Report 2011–2012
81Annual Report
2011–2012
80
1 TO CONTENTS PAGE 3 CLOSE
Consolidated Balance Sheet as at March 31, 2012(` in Lakhs)
Particulars Note No As at31.03.2012
As at31.03.2011
A EQUITY AND LIABILITIES 1 Shareholders’ funds Share capital 3 7,971.56 7,926.60
Reserves and surplus 4 124,276.77 117,605.77
132,248.33 125,532.37
2 Minority Interest 9,487.61 34,126.42
3 Non-current liabilities Long-term borrowings 5 51,207.50 -
Deferred tax liabilities (Net) 14 0.50 -
Other Long-term liabilities 6 794.94 686.08
Long-term provisions 7 2,347.88 1,623.27
54,350.82 2,309.35
4 Current liabilities Short-term borrowings 8 154,817.59 158,968.87
Trade payables 9 160,720.52 148,419.63
Other Current liabilities 10 36,351.59 31,310.98
Short-term provisions 11 3,129.08 6,210.23
355,018.78 344,909.71
TOTAL 551,105.54 506,877.85B ASSETS 1 Non-current assets Fixed assets 12
(i) Tangible assets 15,924.83 13,647.62
(ii) Intangible assets 1,033.70 953.96
(iii) Capital work-in-progress 868.51 140.15
(iv) Goodwill on consolidation 6,573.00 6,573.00
Non-current investments 13 3.12 -
Deferred tax assets (net) 14 808.07 633.21
Long-term loans and advances 15 4,413.17 3,584.42
Long-term receivables under fi nancing activity 16 2,635.83 1,511.74
32,260.23 27,044.10 2 Current assets Inventories 17 169,999.63 158,327.50
Trade receivables 18 221,901.87 187,029.23
Cash and cash equivalents 19 48,343.79 48,060.24
Short-term loans and advances 20 23,940.26 20,124.46
Short-term receivable under fi nancing activity 21 54,659.76 66,292.32
518,845.31 479,833.75 TOTAL 551,105.54 506,877.85
See accompanying notes forming part of fi nancial statements
In terms of our report attached
For Deloitte Haskins & Sells For and on behalf of the Board of DirectorsChartered Accountants
B Ramaratnam R Srinivasan Raj Shankar M RaghunandanPartner Managing Director Dy. Managing Director Whole-time Director
Place : Chennai S V Krishnan M MuthukumarasamyDate : May 25, 2012 Chief Financial Offi cer Company Secretary
Consolidated statement of Profi t and Loss for the year ended March 31, 2012(` in Lakhs)
Particulars Note No.Year ended Year ended
March 31, 2012 March 31, 2011
Income:
Revenue from operations 22 2,119,298.73 1,670,377.12
Other income 23 2,903.41 1,887.90
Total Revenue 2,122,202.14 1,672,265.02
Expenses:
Purchases of trading stock 2,005,375.92 1,622,965.27
Changes in inventories of trading stock (11,901.36) (46,353.52)
Employee benefi ts 24 28,037.25 20,656.75
Finance costs 25 15,204.27 9,608.67
Depreciation & Amortisation 12 3,103.07 2,455.81
Other expenses 26 37,350.18 27,831.62
Total expenses 2,077,169.33 1,637,164.60
Profi t before tax 45,032.81 35,100.42
Tax expense:
Current tax 11,313.27 8,928.98
Deferred tax (184.32) (305.84)
Profi t after Tax 33,903.86 26,477.28
Share of Loss of Associate 1.88 -
Minority interest 4,627.90 3,877.33
Profi t for the Year 29,274.08 22,599.95
Earnings per equity share: (Face value ` 2 each) 27
Basic (in `) 7.35 5.72
Diluted (in `) 7.34 5.68
See accompanying notes forming part of fi nancial statements
In terms of our report attached
For Deloitte Haskins & Sells For and on behalf of the Board of DirectorsChartered Accountants
B Ramaratnam R Srinivasan Raj Shankar M RaghunandanPartner Managing Director Dy. Managing Director Whole-time Director
Place : Chennai S V Krishnan M MuthukumarasamyDate : May 25, 2012 Chief Financial Offi cer Company Secretary

Annual Report 2011–2012
83
1 TO CONTENTS PAGE 3 CLOSE
Consolidated Cash Flow Statement for the year ended March 31, 2012(` in Lakhs)
Particulars Year EndedMarch 31, 2012
Year EndedMarch 31, 2011
A. Cash fl ow from operating activities:Net Profi t before taxation 45,032.81 35,100.42Adjustments for: –Depreciation and Amortisation 3,103.07 2,455.81 – Finance costs 15,204.27 9,608.67 – Interest Income (1,576.19) (1,526.37) – Provision for doubtful receivables 2,244.97 2,085.43 – Bad debts written off 32.86 319.94 – Dividend income from short term investments (68.30) - – Provision for compensated absences 104.09 (9.46) – Provision for gratuity 752.57 551.25 – Rent equalisation reserve 12.56 - – Provision for standard assets 185.00 195.00 – Unrealised foreign exchange (net) 849.86 67.11 – Loss / (Profi t) on sale of fi xed assets 18.75 (55.61)Operating Profi t before working capital changes 65,896.32 48,792.19Increase in Trade receivables (37,150.47) (37,070.35)Decrease / (Increase) in Loans & advances and Other current assets 5,968.78 (8,030.21)Increase in Inventories (11,672.13) (38,151.44)Increase in Trade Payables, Other Current Liabilities & Provisions 16,889.40 38,121.49Cash generated from operations 39,931.90 3,661.68Interest Paid by Financial Services Subsidiary (1,575.24) (1,476.59)Direct taxes paid (12,514.64) (9,272.44)Net Cash generated from / (used in) operating activities 25,842.02 (7,087.35)B. Cash fl ow from investing activities:Purchase of fi xed assets (5,212.11) (5,644.00)Proceeds from sale of fi xed assets 123.12 86.47Interest received 1,296.48 1,494.43Dividend income from short-term investments 68.30 -Deposits placed (20,922.86) (1,398.27)Deposits settled 1,397.17 -Consideration paid for acquisition of Minority interest in a step-down subsidiary by a subsidiary
(59,552.91) -
Investment in overseas step down subsidiaries - (18,163.46)Net Cash used in investing activities (82,802.81) (23,624.83)C. Cash fl ow from fi nancing activities:Proceeds from exercise of Employee Stock Option 591.07 825.62Proceeds from issue of share capital by an overseas step-down subsidiary
83.42 -
Proceeds from long-term borrowings 51,207.50 -(Repayment of) / Proceeds from short-term borrowings (4,151.28) 31,548.80 Dividend paid by step down subsidiary to minority shareholders (1,571.79) (506.78)Dividends Paid (including dividend tax) (5,025.20) (4,560.33)Finance costs paid (12,961.55) (7,508.02)Net Cash generated from fi nancing activities 28,172.17 19,799.29Net decrease in Cash and Cash Equivalents (28,788.62) (10,912.89)Cash and Cash Equivalents at the beginning of the year 46,661.97 58,260.21Add / (Less): Translation adjustment on Opening Cash and Cash Equivalents of foreign subsidiaries
4,628.46 (376.46)
Add / (Less): Translation adjustment of reserves of foreign subsidiaries 4,926.59 (308.89)Less: Opening Cash and Cash Equivalents relating to erstwhile subsidiary
(8.57) -
Cash and Cash Equivalents at the end of the year 27,419.83 46,661.97Reconciliation of Cash and Cash EquivalentsCash and Cash Equivalents at the end of the year (as per Balance Sheet) 48,343.79 48,060.24Less: Bank deposit under lien 1.10 1.10Less: Bank deposits held for more than three months 20,922.86 1,397.17Cash and Cash Equivalents at the end of the year 27,419.83 46,661.97See accompanying notes forming part of fi nancial statements
In terms of our report attached For and on behalf of the Board of Directors
For Deloitte Haskins & SellsChartered Accountants
B Ramaratnam R Srinivasan Raj Shankar M RaghunandanPartner Managing Director Dy. Managing Director Whole-time Director
Place : Chennai S V Krishnan M MuthukumarasamyDate : May 25, 2012 Chief Financial Offi cer Company Secretary
Notes to fi nancial statements for the year ended March 31, 2012
1. Company Overview
Redington (India) Limited, is a public limited company incorporated under the provisions of the Companies Act,
1956. The company’s stocks are listed at Bombay stock exchange and National stock exchange of India. The
company is in the distribution business and after sales service of IT and other products. The company and its
subsidiaries operate in India, South Asia, Middle East Africa and Turkey. The Company, through its wholly owned
subsidiary Easyaccess Financial Services Limited, also operates in fi nancial services segment.
2. Basis of Consolidation
The consolidated fi nancial statements encompasses fi nancials of Redington (India) Limited and its subsidiaries
(Collectively called “the Group”), for the year ended March 31, 2012. These consolidated fi nancial statements have
been prepared in accordance with Indian Accounting Standard 21, “Consolidated Financial Statements”
and Indian Accounting Standard 23 “Accounting for investments in Associates in Consolidated fi nancial statements”, which are not materially different from International Financial Reporting Standards or Singapore
Financial Reporting Standards. Necessary adjustments have been made in the consolidated fi nancial statement
to bring them in line with Indian GAAP. Subsidiary companies included in the consolidated fi nancial statement
are:
A. Direct Subsidiaries
Name of the CompanyCountry of
incorporation
Ownership Interest %
Nook Micro Distribution Limited India 100
Redington International Mauritius Limited (RIML) Mauritius 100
Redington Distribution Pte. Limited Singapore 100
Cadensworth (India) Limited India 100
Easyaccess Financial Services Limited India 100
Redington (India) Investments Limited (Associate w.e.f June 8, 2011) India 47.62
B. Subsidiary of Redington International Mauritius Limited
Name of the Company Country of
incorporation
Ownership
Interest %
Benefi cial
Interest %
Redington International Holdings Limited Cayman Islands 100 100
C. Subsidiaries of Redington International Holdings Limited
Name of the Company Country of
incorporation
Ownership
Interest %
Benefi cial
Interest %
Redington Gulf FZE Dubai, UAE 100 100
Redington Turkey Holdings S.A.R.L. Luxembourg 100 100

Annual Report 2011–2012
85Annual Report
2011–2012
84
1 TO CONTENTS PAGE 3 CLOSE
D. Subsidiaries of Redington Gulf FZE
Name of the Company Country of
incorporation
Ownership
Interest %
Benefi cial
Interest %
Redington Egypt Ltd Egypt 100 100
Redington Nigeria Ltd Nigeria 100 100
Redington Gulf & Co. LLC Oman 70 100
Redington Kenya Ltd Kenya 100 100
Cadensworth FZE Dubai, UAE 100 100
Redington Middle East LLC ^ Dubai 49 100
Redington Arabia Limited Saudi Arabia 100 100
Redington Africa Distribution FZE Dubai, UAE 100 100
Redington Qatar WLL ^ Qatar 49 100
Redington Bahrain SPC Bahrain 100 100
Redington Qatar distribution WLL ^ Qatar 49 100
Redington Limited Ghana 100 100
Redington Kenya EPZ Ltd Kenya 100 100
Africa Joint technical Services Libya 65 100
Redington Uganda Ltd Uganda 100 100
RGF Private Trust Company Limited** Cayman Islands 100 100
Cadensworth UAE LLC ^ Dubai 49 100
Redington Tanzania Limited Tanzania 100 100
Redington Morocco Limited Morocco 100 100
Redington Angola ADA** Angola 100 100
Redington IT services (PTY LTD) Johannesburg 100 100
Redington Gulf FZE** Iraq 100 100
^ Although the percentage of holding is less than 50, the Company has the power to govern the strategic operating and fi nancial
policies and exercise control. Consequently, the above-mentioned entities are consolidated with the Group’s fi nancial statements.
** Yet to commence operations.
E. Subsidiary of Redington Turkey Holdings S.A.R.L
Name of the Company Country of
incorporation
Ownership
Interest %
Benefi cial
Interest %
Arena Bilgisayar Sanayi Ve Ticaret Anonim S ̧ irketi # Turkey 49.40 49.40
# As Redington Turkey Holdings S.A.R.L, Luxembourg has effective control over the composition of Arena Bilgisayar’s Board of
Directors, Arena Bilgisayar is considered as a subsidiary for the purpose of preparation of consolidated fi nancial statements.
F. Subsidiary of Arena Bilgisayar Sanayi Ve Ticaret Anonim Sirketi
Name of the Company Country of
incorporation
Ownership
Interest %
Benefi cial
Interest %
Arena International FZE Jebel Ali, Dubai, UAE 100 100
Subsequent to the Balance Sheet date, following overseas step-down subsidiaries have been incorporated with a
benefi cial interest of 100%:
i) Sensonet Teknoloji Elelektronik Ve Bilisim Hizmetleri Sanayi Ve Ticaret Limited Sirketi, Turkey
ii) Redington Rwanda Limited, Rwanda
iii) Redington Kazakhstan LLP, Kazakhstan Republic
G. Subsidiaries of Redington Distribution Pte. Ltd.
Name of the Company Country of
incorporation
Ownership
Interest %
Benefi cial
Interest %
Redington Bangladesh Limited Bangladesh 99 100
Redington SL (Private) Ltd Sri Lanka 100 100
H. Associate of the company
Name of the Company Country of
incorporation
Ownership
Interest %
Benefi cial
Interest %
Redington (India) Investments Limited India 47.62 47.62
Formerly a subsidiary of the holding company, became an associate w.e.f June 8, 2011
The following have been considered in preparing the consolidated fi nancial statements:
a. Financial Statements of Redington (India) Limited and Easyaccess Financial Services Limited prepared
in accordance with Indian Generally Accepted Accounting Principles (Indian GAAP) under historical cost
convention on the accrual basis and audited by Deloitte Haskins and Sells, Chartered Accountants, Chennai.
b. Financial statements of Cadensworth (India) Limited and Nook Micro Distribution Limited prepared in
accordance with Indian Generally Accepted Accounting Principles (Indian GAAP) under historical cost
convention on the accrual basis and audited by M/s. A S Varadharajan & Co., Chartered Accountants,
Chennai.
c. Consolidated fi nancial statements of Redington International Mauritius Limited prepared in accordance with
International Financial Reporting Standards (IFRS) and audited by Deloitte & Touche (M.E.).
d. Consolidated fi nancial statements of Redington Distribution Pte. Limited prepared under Singapore Financial
Reporting Standards and audited by Ernst & Young, Singapore.
Necessary adjustments have been made in the consolidated fi nancial statements to conform to Indian GAAP wherever
there are signifi cant differences between Indian GAAP / Singapore Financial Reporting Standards / International
Financial Reporting Standards.
The audited fi nancial statements of the holding company and its Indian subsidiaries and the consolidated fi nancial
statements of Redington International Mauritius Limited and Redington Distribution Pte Limited used in the
consolidation are drawn up to the same reporting date as of the Company.
The consolidated fi nancial statements have been prepared using uniform Accounting Policies and on the following
basis:
a) The fi nancial information of the Company and its subsidiaries have been combined on a line-by-line basis of
assets, liabilities, income and expenses. Inter Company balances and transactions and unrealized profi ts or
losses have been eliminated.
b) Capital reserve arising on consolidation represents excess of net worth over the carrying cost of acquisition
of the respective subsidiaries.
c) Goodwill arising on consolidation represents: (a) excess of carrying cost of acquisition of subsidiaries after
adjusting the capital reserve to the extent available (b) excess of carrying cost of acquisition of subsidiaries
over the net worth of the respective subsidiaries.
d) The notes to the consolidated fi nancial statements are prepared in accordance with the requirements of
Indian GAAP.
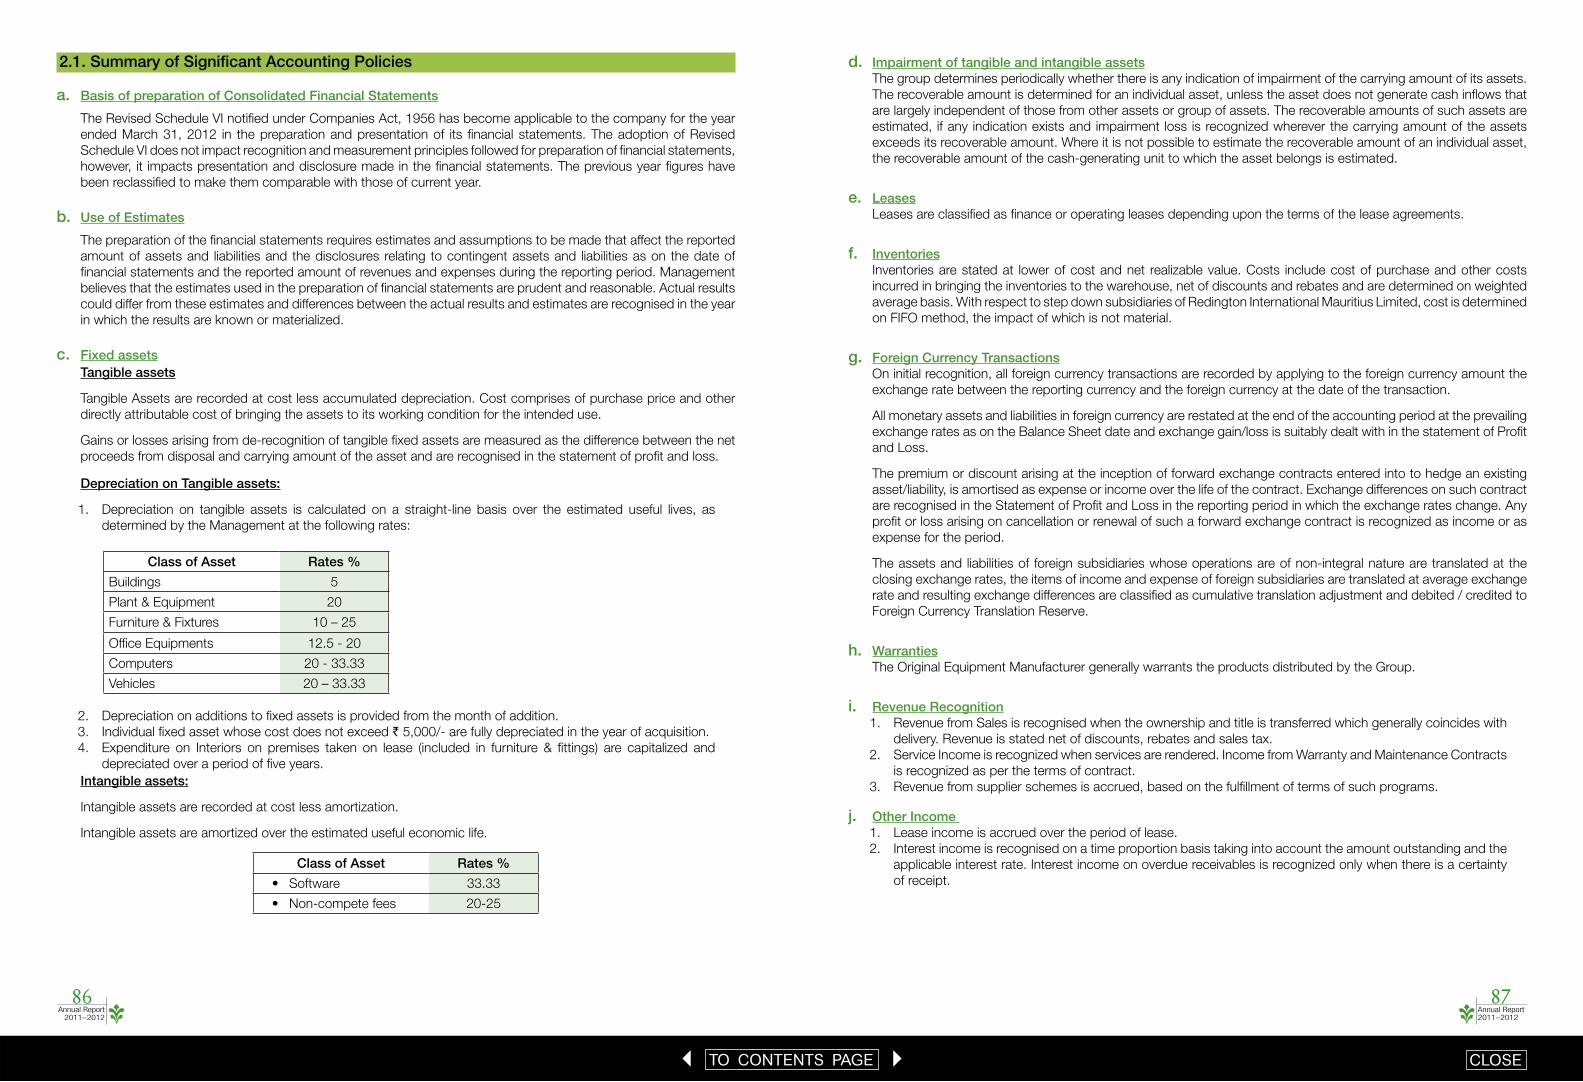
Annual Report 2011–2012
87Annual Report
2011–2012
86
1 TO CONTENTS PAGE 3 CLOSE
2.1. Summary of Signifi cant Accounting Policies
a. Basis of preparation of Consolidated Financial Statements
The Revised Schedule VI notifi ed under Companies Act, 1956 has become applicable to the company for the year
ended March 31, 2012 in the preparation and presentation of its fi nancial statements. The adoption of Revised
Schedule VI does not impact recognition and measurement principles followed for preparation of fi nancial statements,
however, it impacts presentation and disclosure made in the fi nancial statements. The previous year fi gures have
been reclassifi ed to make them comparable with those of current year.
b. Use of Estimates
The preparation of the fi nancial statements requires estimates and assumptions to be made that affect the reported
amount of assets and liabilities and the disclosures relating to contingent assets and liabilities as on the date of
fi nancial statements and the reported amount of revenues and expenses during the reporting period. Management
believes that the estimates used in the preparation of fi nancial statements are prudent and reasonable. Actual results
could differ from these estimates and differences between the actual results and estimates are recognised in the year
in which the results are known or materialized.
c. Fixed assetsTangible assets
Tangible Assets are recorded at cost less accumulated depreciation. Cost comprises of purchase price and other
directly attributable cost of bringing the assets to its working condition for the intended use.
Gains or losses arising from de-recognition of tangible fi xed assets are measured as the difference between the net
proceeds from disposal and carrying amount of the asset and are recognised in the statement of profi t and loss.
Depreciation on Tangible assets:
1. Depreciation on tangible assets is calculated on a straight-line basis over the estimated useful lives, as
determined by the Management at the following rates:
Class of Asset Rates %
Buildings 5
Plant & Equipment 20
Furniture & Fixtures 10 – 25
Offi ce Equipments 12.5 - 20
Computers 20 - 33.33
Vehicles 20 – 33.33
2. Depreciation on additions to fi xed assets is provided from the month of addition.
3. Individual fi xed asset whose cost does not exceed ` 5,000/- are fully depreciated in the year of acquisition.
4. Expenditure on Interiors on premises taken on lease (included in furniture & fi ttings) are capitalized and
depreciated over a period of fi ve years.
Intangible assets:
Intangible assets are recorded at cost less amortization.
Intangible assets are amortized over the estimated useful economic life.
Class of Asset Rates %
• Software 33.33
• Non-compete fees 20-25
d. Impairment of tangible and intangible assetsThe group determines periodically whether there is any indication of impairment of the carrying amount of its assets.
The recoverable amount is determined for an individual asset, unless the asset does not generate cash infl ows that
are largely independent of those from other assets or group of assets. The recoverable amounts of such assets are
estimated, if any indication exists and impairment loss is recognized wherever the carrying amount of the assets
exceeds its recoverable amount. Where it is not possible to estimate the recoverable amount of an individual asset,
the recoverable amount of the cash-generating unit to which the asset belongs is estimated.
e. LeasesLeases are classifi ed as fi nance or operating leases depending upon the terms of the lease agreements.
f. InventoriesInventories are stated at lower of cost and net realizable value. Costs include cost of purchase and other costs
incurred in bringing the inventories to the warehouse, net of discounts and rebates and are determined on weighted
average basis. With respect to step down subsidiaries of Redington International Mauritius Limited, cost is determined
on FIFO method, the impact of which is not material.
g. Foreign Currency TransactionsOn initial recognition, all foreign currency transactions are recorded by applying to the foreign currency amount the
exchange rate between the reporting currency and the foreign currency at the date of the transaction.
All monetary assets and liabilities in foreign currency are restated at the end of the accounting period at the prevailing
exchange rates as on the Balance Sheet date and exchange gain/loss is suitably dealt with in the statement of Profi t
and Loss.
The premium or discount arising at the inception of forward exchange contracts entered into to hedge an existing
asset/liability, is amortised as expense or income over the life of the contract. Exchange differences on such contract
are recognised in the Statement of Profi t and Loss in the reporting period in which the exchange rates change. Any
profi t or loss arising on cancellation or renewal of such a forward exchange contract is recognized as income or as
expense for the period.
The assets and liabilities of foreign subsidiaries whose operations are of non-integral nature are translated at the
closing exchange rates, the items of income and expense of foreign subsidiaries are translated at average exchange
rate and resulting exchange differences are classifi ed as cumulative translation adjustment and debited / credited to
Foreign Currency Translation Reserve.
h. WarrantiesThe Original Equipment Manufacturer generally warrants the products distributed by the Group.
i. Revenue Recognition1. Revenue from Sales is recognised when the ownership and title is transferred which generally coincides with
delivery. Revenue is stated net of discounts, rebates and sales tax.
2. Service Income is recognized when services are rendered. Income from Warranty and Maintenance Contracts
is recognized as per the terms of contract.
3. Revenue from supplier schemes is accrued, based on the fulfi llment of terms of such programs.
j. Other Income 1. Lease income is accrued over the period of lease.
2. Interest income is recognised on a time proportion basis taking into account the amount outstanding and the
applicable interest rate. Interest income on overdue receivables is recognized only when there is a certainty
of receipt.
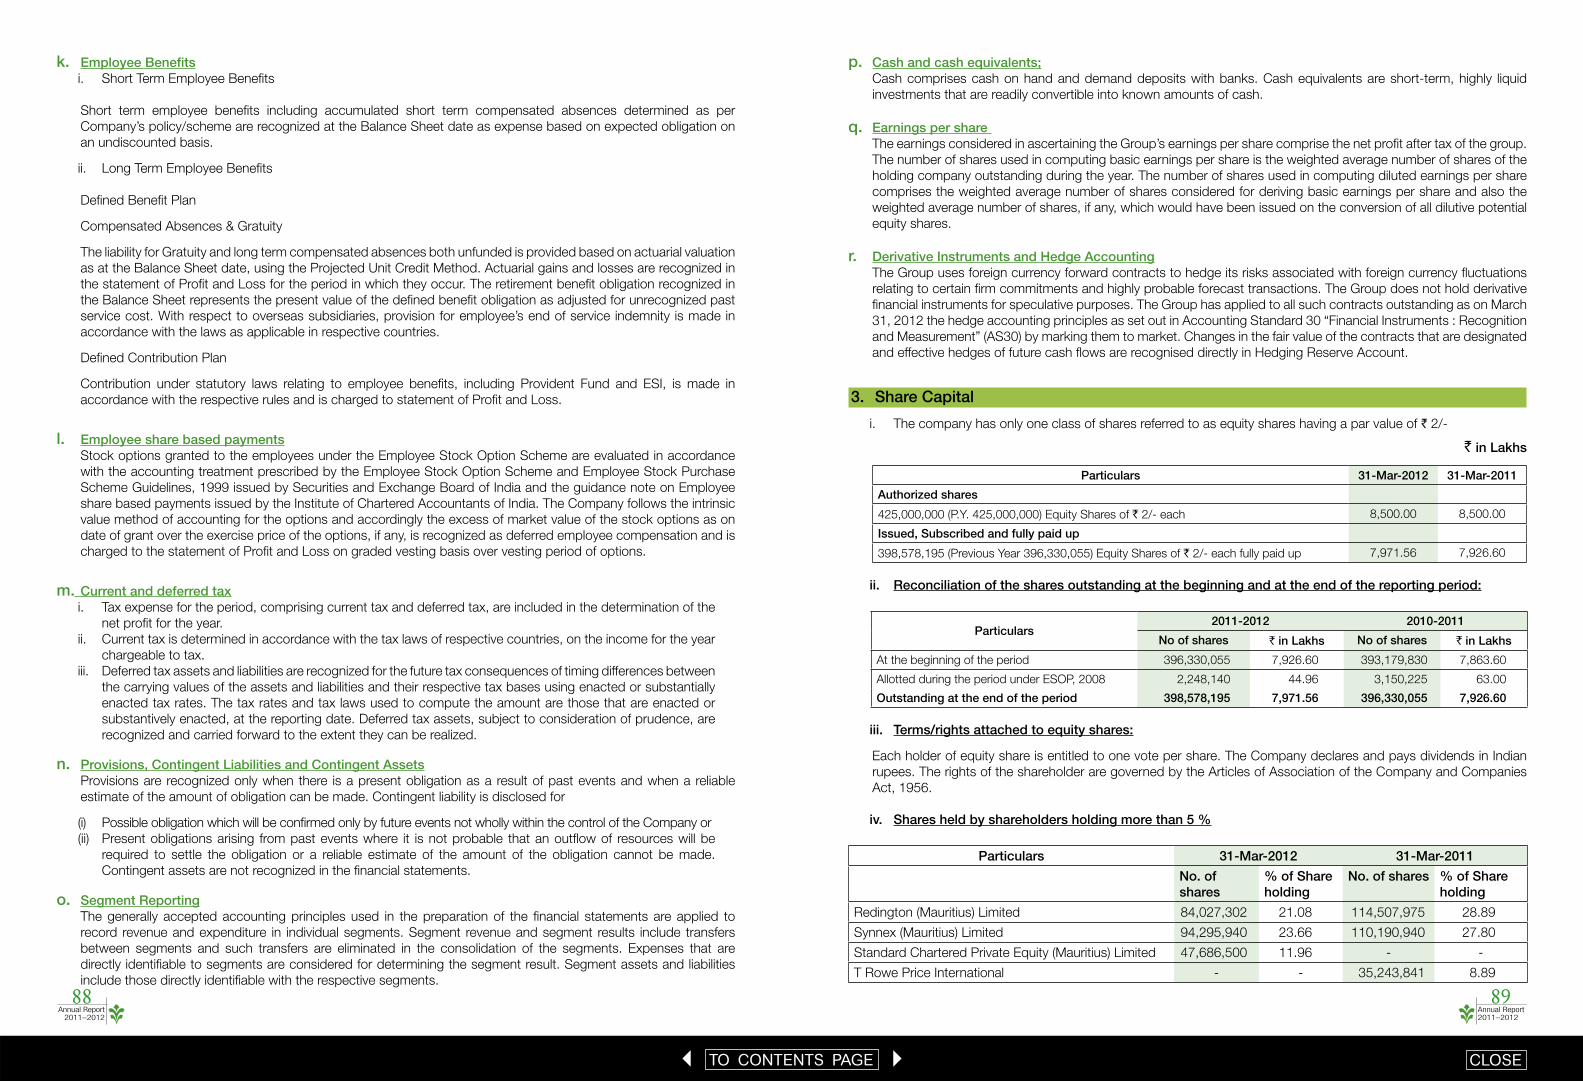
Annual Report 2011–2012
89Annual Report
2011–2012
88
1 TO CONTENTS PAGE 3 CLOSE
k. Employee Benefi tsi. Short Term Employee Benefi ts
Short term employee benefi ts including accumulated short term compensated absences determined as per
Company’s policy/scheme are recognized at the Balance Sheet date as expense based on expected obligation on
an undiscounted basis.
ii. Long Term Employee Benefi ts
Defi ned Benefi t Plan
Compensated Absences & Gratuity
The liability for Gratuity and long term compensated absences both unfunded is provided based on actuarial valuation
as at the Balance Sheet date, using the Projected Unit Credit Method. Actuarial gains and losses are recognized in
the statement of Profi t and Loss for the period in which they occur. The retirement benefi t obligation recognized in
the Balance Sheet represents the present value of the defi ned benefi t obligation as adjusted for unrecognized past
service cost. With respect to overseas subsidiaries, provision for employee’s end of service indemnity is made in
accordance with the laws as applicable in respective countries.
Defi ned Contribution Plan
Contribution under statutory laws relating to employee benefi ts, including Provident Fund and ESI, is made in
accordance with the respective rules and is charged to statement of Profi t and Loss.
l. Employee share based paymentsStock options granted to the employees under the Employee Stock Option Scheme are evaluated in accordance
with the accounting treatment prescribed by the Employee Stock Option Scheme and Employee Stock Purchase
Scheme Guidelines, 1999 issued by Securities and Exchange Board of India and the guidance note on Employee
share based payments issued by the Institute of Chartered Accountants of India. The Company follows the intrinsic
value method of accounting for the options and accordingly the excess of market value of the stock options as on
date of grant over the exercise price of the options, if any, is recognized as deferred employee compensation and is
charged to the statement of Profi t and Loss on graded vesting basis over vesting period of options.
m. Current and deferred taxi. Tax expense for the period, comprising current tax and deferred tax, are included in the determination of the
net profi t for the year.
ii. Current tax is determined in accordance with the tax laws of respective countries, on the income for the year
chargeable to tax.
iii. Deferred tax assets and liabilities are recognized for the future tax consequences of timing differences between
the carrying values of the assets and liabilities and their respective tax bases using enacted or substantially
enacted tax rates. The tax rates and tax laws used to compute the amount are those that are enacted or
substantively enacted, at the reporting date. Deferred tax assets, subject to consideration of prudence, are
recognized and carried forward to the extent they can be realized.
n. Provisions, Contingent Liabilities and Contingent AssetsProvisions are recognized only when there is a present obligation as a result of past events and when a reliable
estimate of the amount of obligation can be made. Contingent liability is disclosed for
(i) Possible obligation which will be confi rmed only by future events not wholly within the control of the Company or
(ii) Present obligations arising from past events where it is not probable that an outfl ow of resources will be
required to settle the obligation or a reliable estimate of the amount of the obligation cannot be made.
Contingent assets are not recognized in the fi nancial statements.
o. Segment ReportingThe generally accepted accounting principles used in the preparation of the fi nancial statements are applied to
record revenue and expenditure in individual segments. Segment revenue and segment results include transfers
between segments and such transfers are eliminated in the consolidation of the segments. Expenses that are
directly identifi able to segments are considered for determining the segment result. Segment assets and liabilities
include those directly identifi able with the respective segments.
p. Cash and cash equivalents;Cash comprises cash on hand and demand deposits with banks. Cash equivalents are short-term, highly liquid
investments that are readily convertible into known amounts of cash.
q. Earnings per share The earnings considered in ascertaining the Group’s earnings per share comprise the net profi t after tax of the group.
The number of shares used in computing basic earnings per share is the weighted average number of shares of the
holding company outstanding during the year. The number of shares used in computing diluted earnings per share
comprises the weighted average number of shares considered for deriving basic earnings per share and also the
weighted average number of shares, if any, which would have been issued on the conversion of all dilutive potential
equity shares.
r. Derivative Instruments and Hedge AccountingThe Group uses foreign currency forward contracts to hedge its risks associated with foreign currency fl uctuations
relating to certain fi rm commitments and highly probable forecast transactions. The Group does not hold derivative
fi nancial instruments for speculative purposes. The Group has applied to all such contracts outstanding as on March
31, 2012 the hedge accounting principles as set out in Accounting Standard 30 “Financial Instruments : Recognition
and Measurement” (AS30) by marking them to market. Changes in the fair value of the contracts that are designated
and effective hedges of future cash fl ows are recognised directly in Hedging Reserve Account.
3. Share Capital
i. The company has only one class of shares referred to as equity shares having a par value of ` 2/-
` in Lakhs
Particulars 31-Mar-2012 31-Mar-2011
Authorized shares
425,000,000 (P.Y. 425,000,000) Equity Shares of ` 2/- each 8,500.00 8,500.00
Issued, Subscribed and fully paid up
398,578,195 (Previous Year 396,330,055) Equity Shares of ` 2/- each fully paid up 7,971.56 7,926.60
ii. Reconciliation of the shares outstanding at the beginning and at the end of the reporting period:
Particulars2011-2012 2010-2011
No of shares ` in Lakhs No of shares ` in Lakhs
At the beginning of the period 396,330,055 7,926.60 393,179,830 7,863.60
Allotted during the period under ESOP, 2008 2,248,140 44.96 3,150,225 63.00
Outstanding at the end of the period 398,578,195 7,971.56 396,330,055 7,926.60
iii. Terms/rights attached to equity shares:
Each holder of equity share is entitled to one vote per share. The Company declares and pays dividends in Indian
rupees. The rights of the shareholder are governed by the Articles of Association of the Company and Companies
Act, 1956.
iv. Shares held by shareholders holding more than 5 %
Particulars 31-Mar-2012 31-Mar-2011
No. of shares
% of Share holding
No. of shares % of Share holding
Redington (Mauritius) Limited 84,027,302 21.08 114,507,975 28.89
Synnex (Mauritius) Limited 94,295,940 23.66 110,190,940 27.80
Standard Chartered Private Equity (Mauritius) Limited 47,686,500 11.96 - -
T Rowe Price International - - 35,243,841 8.89

Annual Report 2011–2012
91Annual Report
2011–2012
90
1 TO CONTENTS PAGE 3 CLOSE
4. Reserves & Surplus
` in Lakhs
(a) Capital reserve 31-Mar-2012 31-Mar-2011
Balance as per last Balance sheet date 28,408.43 28,408.43
Add / (Less): Adjustment of goodwill arising on purchase of minority interest of
step-down subsidiary by RIML (28,387.09) -
Balance at the end of the year 21.34 28,408.43
(b) Securities Premium Account 31-Mar-2012 31-Mar-2011
Balance as per last Balance sheet date 34,489.26 33,726.64
Add: Shares issued on exercise of ESOP, 2008 546.11 762.62
Balance at the end of the year 35,035.37 34,489.26
(c) General Reserve 31-Mar-2012 31-Mar-2011
Balance as per last Balance sheet date 4,181.17 2,896.77
Add: Transfer from surplus in statement of profi t and loss 1,176.09 1,284.40
Balance at the end of the year 5,357.26 4,181.17
(d) Hedge Accounting Reserve 31-Mar-2012 31-Mar-2011
Balance as per last Balance sheet date (2.09) (184.77)
Add: Net movement during the year 19.61 182.68
Balance at the end of the year 17.52 (2.09)
(e) Surplus in the Statement of profi t and loss 31-Mar-2012 31-Mar-2011
Balance as per last Balance sheet date 50,664.00 34,834.09
Profi t for the year 29,274.08 22,599.95
Sub total 79,938.08 57,434.04
Less: Appropriations
Proposed fi nal equity dividend for the year (1,595.22) (4,370.95)
Dividend Distribution Tax (442.54) (720.16)
Dividend including dividend distribution tax for previous year (641,310; Previous
Year 237,235 equity shares issued under Employee Stock Option Plan 2008)
(8.20) (13.83)
Transfer to general reserve (1,176.09) (1,284.40)
Transfer to statutory reserve (609.88) (380.70)
Transfer from employee share purchase reserve 10.97 -
Balance at the end of the year 76,117.12 50,664.00
(f) Statutory Reserves 31-Mar-2012 31-Mar-2011
Balance as per last Balance sheet date 803.72 423.02
Transfer from statement of Profi t and loss account 609.88 380.70
Balance at the end of the year 1,413.60 803.72
(g) Foreign Currency Translation Reserve 31-Mar-2012 31-Mar-2011
Balance as per last Balance sheet date (949.69) (226.40)
Movement during the year 7,264.25 (723.29)
Balance at the end of the year 6,314.56 (949.69)
(h) Employee Share Purchase Reserve 31-Mar-2012 31-Mar-2011
Balance as per last Balance sheet date 10.97 10.97
Transfer to statement of Profi t and loss (10.97) -
Balance at the end of the year - 10.97
Total Reserves and Surplus 124,276.77 117,605.77
5. Long term Borrowings (Secured)
` in Lakhs
Particulars 31-Mar-2012 31-Mar-2011
Loan from Banks 49,857.50 -
Loan from others 1,350.00 -
Total 51,207.50 -
The above loans are guaranteed by the holding company. Repayment to bank commences from June 2013 and is
secured by inventories of certain subsidiaries.
6. Other Long term Liabilities
` in Lakhs
Particulars Non –Current
31-Mar-2012 31-Mar-2011
Non- Compete Fee* 782.70 686.08
Others 12.24 -
Total 794.94 686.08
* One of the overseas subsidiaries of the Group signed a non-competition agreement with its chief executive offi cer. Based on the
terms of the non-competition agreement, the chief executive offi cer agreed not to compete with the subsidiary and not to engage
in any business transaction which may harm the subsidiary’s relations with its business partners until June 30, 2015. In return, the
subsidiary has committed to pay a non-competition fee to the chief executive on June 30, 2013. The non-competition agreement
has been accounted for as an intangible asset with a corresponding liability recorded under other non-current liability.
7. Long Term Provisions
` in Lakhs
Particulars Non Current
31-Mar-2012 31-Mar-2011
(a) Provision for employment benefi ts
(i) Compensated Absences 203.67 158.83
(ii) Gratuity* 2,108.65 1,457.41
(b) Others
(i) Provision for standard assets 23.00 7.03
(ii) Rent equalization reserve 12.56 -
Total 2,347.88 1,623.27
* In respect of the holding company and its Indian subsidiaries, the obligation towards Gratuity fund is a Defi ned Benefi t Plan.

Annual Report 2011–2012
93Annual Report
2011–2012
92
1 TO CONTENTS PAGE 3 CLOSE
Gratuity relating to holding company and certain subsidiaries
Details of actuarial valuation as at the year end is given below (Not funded):
a. Movement
` in Lakhs
Particulars 2011-12 2010-11
Projected Benefi t Obligation at the beginning of the year 410.49 321.23
Service cost 105.97 128.08
Interest Cost 29.50 22.53
Actuarial (gain) / loss (2.07) (19.24)
Benefi ts paid (36.46) (42.11)
Projected Benefi t Obligation at the end of the year 507.43 410.49
Amount recognized in the Balance Sheet:
Projected benefi t obligation at the end of the year 507.43 410.49
Liability recognized in the Balance Sheet 507.43 410.49
Particulars
Cost of the defi ned plan for the year:
Current service cost 105.97 128.08
Interest on obligation 29.50 22.53
Net actuarial loss recognized in the year (2.07) (19.24)
Net cost/(gain) recognized in the statement of Profi t and Loss 133.40 131.37
b. Assumptions Particulars 2011-12 2010-11
Discount Rate 7.5% 7.5%
Salary escalation rate 5% 5%
Demographic assumptions – Mortality LIC 94-96 rates LIC 94-96 rates
Demographic assumptions – Withdrawal 3% - 5% 3%
The amount provided for gratuity as per actuarial valuation has been arrived after considering future salary increase,
infl ation, seniority and promotion.
Gratuity relating to Redington International Mauritius Limited (Not funded):
` in Lakhs
Particulars 2011-12 2010-11
Balance at the beginning of the year 1,076.69 758.80
Amount charged to the statement of Profi t and Loss 619.17 419.88
Amount paid during the year (66.39) (101.99)
Balance at the end of the year 1,629.47 1,076.69
8. Short-term borrowings
` in Lakhs
Particulars 31-Mar-2012 31-Mar-2011
Secured Loan from Banks
– Repayable on demand 48,669.35 105,536.26
– Others 22,286.93 35,806.98
Secured - Term Loan from Banks 65,776.80 1,875.00
Unsecured Loan from Banks
– Repayable on demand 157.86 -
– Others 17,926.65 15,750.63
Total 154,817.59 158,968.87
a. Loan from Banks are secured by pari-passu charge on fi xed and current assets.
b. The holding company placed Commercial Paper during the year, there are no amounts outstanding as
at March 31, 2012 and the maximum amount outstanding any time during the year was ` 29,000 Lakhs
(Previous Year ` 27,500 Lakhs).
9. Trade Payables
` in Lakhs
Particulars 31-Mar-2012 31-Mar-2011
Trade Payables* 156,795.55 145,477.15
Other Payables 3,924.97 2,942.48
Total 160,720.52 148,419.63
* Trade payables are dues in respect of goods purchased or services received (including from employees) in the normal course of
business.
10. Other current liabilities
` in Lakhs
Particulars 31-Mar-2012 31-Mar-2011
Expenses payable 19,960.37 18,849.14
Interest accrued but not due on loans 829.71 755.84
Unclaimed dividend* 4.57 2.80
Deferred revenue 835.09 660.14
Statutory liabilities 5,598.63 4,954.67
Advances from customers 4,924.82 2,528.32
Others liabilities 4,198.40 3,560.07
Total 36,351.59 31,310.98
* No amount is due and outstanding to be credited to Investor Education and Protection Fund as on March 31, 2012.

Annual Report 2011–2012
95Annual Report
2011–2012
94
1 TO CONTENTS PAGE 3 CLOSE
11. Short-term provisions
` in Lakhs
Particulars 31-Mar-2012 31-Mar-2011
(a) Provision for employment benefi ts
(i) Compensated absences 56.53 42.09
(ii) Gratuity 28.25 29.77
(b) Others
(i) Provision for Taxation 468.29 689.12
(ii) Contingent provision for standard assets * 477.00 307.97
(iii) Proposed dividend 1,595.22 4,370.95
(iv) Tax on Proposed Dividend 503.79 770.33
Total 3,129.08 6,210.23
* Provision for Standard assets
As a matter of prudence, the company’s subsidiary carrying NBFC activities is carrying a cumulative Provision
for Standard Assets higher than the percentage prescribed by the Reserve Bank of India (RBI) vide Notifi cation
No.DNBS.PD.CC.No.207/03.02.002/2010-11.
12 . Fixed Assets
` in Lakhs
Description Gross Block Depreciation Net Block
As at
01.04.11
Additions Disposal Translation
Adjustment*
As at
31.03.12
As at
01.04.11
For the
Year
Deletion Translation
Adjustment*
As at
31.03.12
As at
31.03.12
As at
31.03.11
A. Tangible Assets
Land 2,615.54 165.09 - - 2,780.63 - - - - - 2,780.63 2,615.54
Building 5,591.56 41.74 - 422.16 6,055.46 419.69 311.48 - 22.66 753.83 5,301.63 5,171.87
Plant and Equipment 1,977.76 291.37 68.85 72.07 2,272.35 1,050.36 321.81 49.00 15.59 1,338.76 933.59 927.40
Furniture & Fixtures 7,065.66 1,752.24 431.20 704.27 9,090.97 4,689.35 1,156.87 373.55 456.01 5,928.68 3,162.29 2,376.31
Offi ce Equipment 3,360.89 609.11 364.52 415.51 4,020.99 1,608.01 414.17 322.49 181.71 1,881.40 2,139.59 1,752.88
Computers 2,152.59 921.54 100.50 88.98 3,062.61 1,781.01 311.45 95.75 39.85 2,036.56 1,026.05 371.58
Vehicles 895.70 311.31 91.56 86.18 1,201.63 463.66 173.80 73.98 57.10 620.58 581.05 432.04
Total 23,659.70 4,092.40 1,056.63 1,789.17 28,484.64 10,012.08 2,689.58 914.77 772.92 12,559.81 15,924.83 13,647.62
Previous year 18,110.41 5,846.25 110.93 (186.03) 23,659.70 7,860.88 2,297.93 80.07 (66.66) 10,012.08 13,647.62 8,326.48
* With respect to overseas subsidiaries, additions have been converted at average rate and closing balance at closing rate
` in Lakhs
Description Gross Block Depreciation Net Block
As at
01.04.11
Additions Disposal Translation
Adjustment*
As at
31.03.12
As at
01.04.11
For the
Year
Deletion Translation
Adjustment*
As at
31.03.12
As at
31.03.12
As at
31.03.11
B. Intangible Assets
Software 2,158.36 391.35 30.41 218.78 2,738.08 1,865.23 290.97 30.41 187.36 2,313.15 424.93 293.13
Non-Compete fee 699.70 - - 83.00 782.70 38.87 122.52 - 12.54 173.93 608.77 660.83
Total 2,858.06 391.35 30.41 301.78 3,520.78 1,904.10 413.49 30.41 199.90 2,487.08 1,033.70 953.96
Previous year 2,039.75 848.42 - (30.11) 2,858.06 1,761.12 157.88 - (14.90) 1,904.10 953.96 143.88
* With respect to overseas subsidiaries, additions have been converted at average rate and closing balance at closing rate
13. Non Current Investments
Investment in associate
` in Lakhs
Name of the Corporate Body 31- Mar- 2012 31- Mar- 2011
50,000 Equity Shares of ` 10/- each fully paid-up in Redington (India)
Investments Limited*
5.00 -
Less: Share of Loss (1.88) -
Total 3.12 -
* Became an Associate from June 8, 2011
14. Deferred Tax
Break-up of Deferred Tax Assets arising on account of timing differences (In respect of the holding company and certain subsidiaries)
` in Lakhs
Particulars 31- Mar-2012 31-Mar-2011
i. Deferred Tax Assets:
Provision for doubtful trade receivables 364.83 218.08
Gratuity 163.91 133.21
Leave encashment 83.33 65.19
Depreciation 81.32 73.66
Others 219.20 505.50
Total 912.59 995.64
ii. Deferred Tax Liability:
Depreciation 104.52 362.43
Total 104.52 362.43
Deferred Tax Asset (Net) 808.07 633.21
Break up of Deferred Tax liability arising on account of timing difference (In respect of a subsidiary)
` in Lakhs
Particulars 31-Mar-2012 31-Mar-2011
i. Deferred Tax Liability:
Depreciation (6.77) -
Total (6.77) -
ii. Deferred Tax Asset:
Provision for doubtful trade receivables 4.67 -
Gratuity 0.62
Leave encashment 0.98
Total 6.27 -
Deferred Tax Liability (Net) (0.50) -
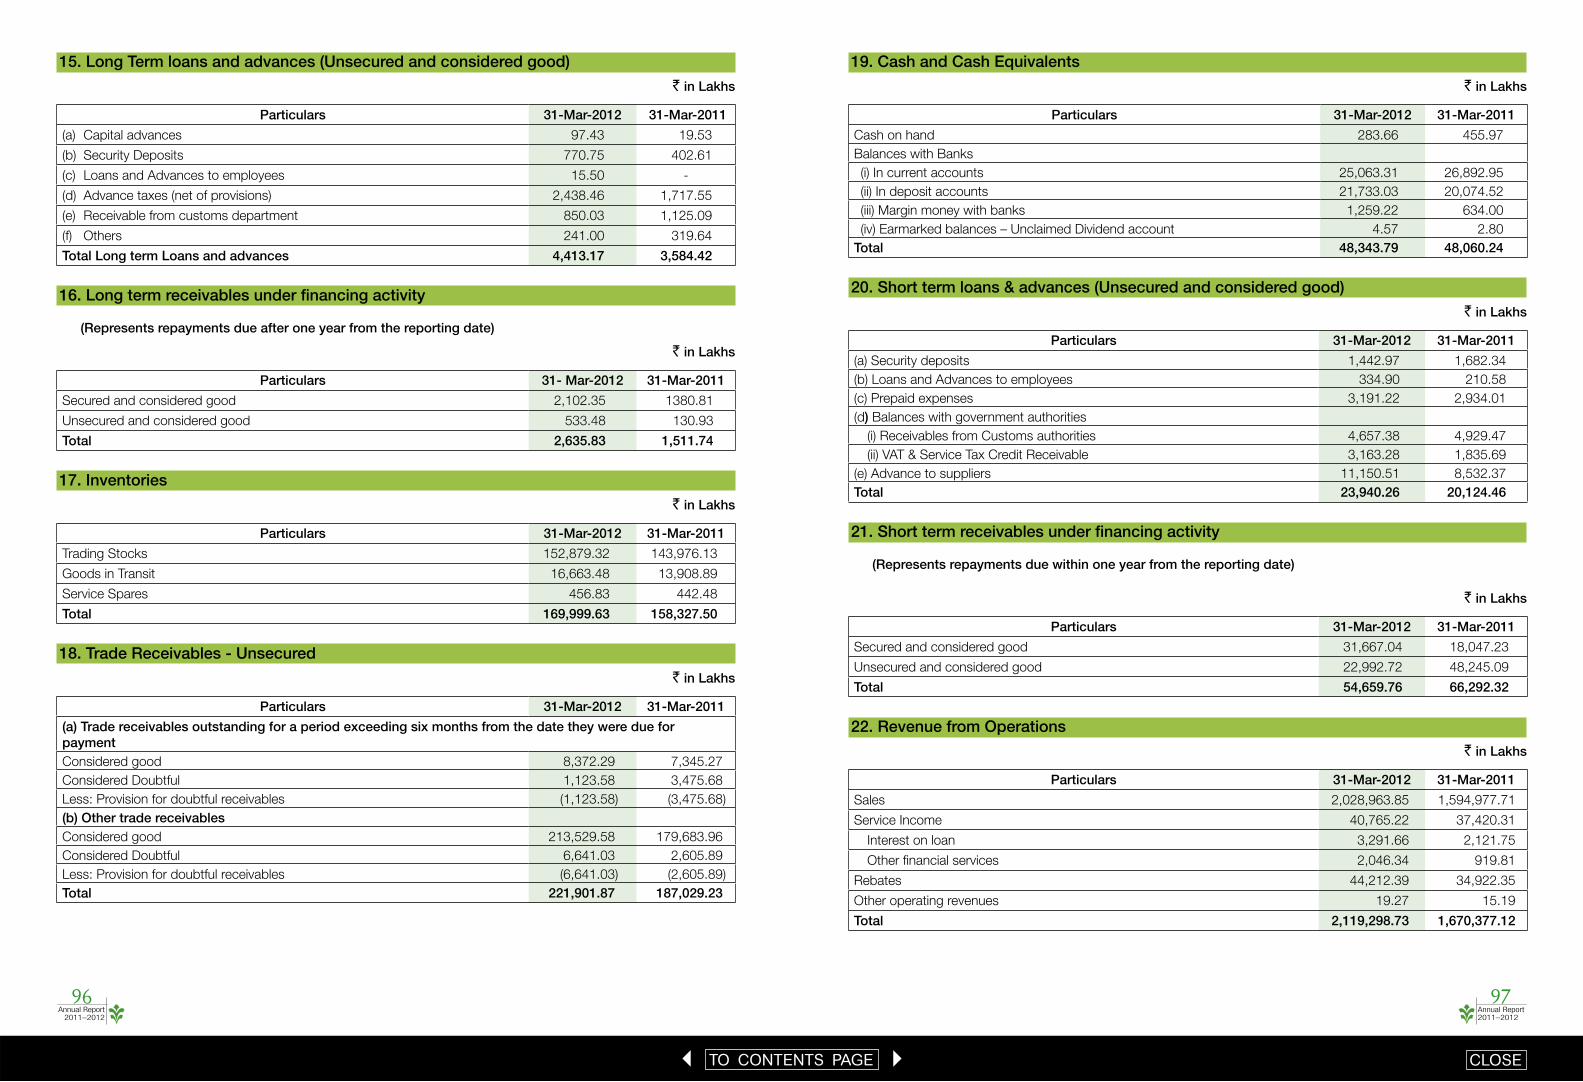
Annual Report 2011–2012
97Annual Report
2011–2012
96
1 TO CONTENTS PAGE 3 CLOSE
15. Long Term loans and advances (Unsecured and considered good)
` in Lakhs
Particulars 31-Mar-2012 31-Mar-2011
(a) Capital advances 97.43 19.53
(b) Security Deposits 770.75 402.61
(c) Loans and Advances to employees 15.50 -
(d) Advance taxes (net of provisions) 2,438.46 1,717.55
(e) Receivable from customs department 850.03 1,125.09
(f) Others 241.00 319.64
Total Long term Loans and advances 4,413.17 3,584.42
16. Long term receivables under fi nancing activity
(Represents repayments due after one year from the reporting date)
` in Lakhs
Particulars 31- Mar-2012 31-Mar-2011
Secured and considered good 2,102.35 1380.81
Unsecured and considered good 533.48 130.93
Total 2,635.83 1,511.74
17. Inventories
` in Lakhs
Particulars 31-Mar-2012 31-Mar-2011
Trading Stocks 152,879.32 143,976.13
Goods in Transit 16,663.48 13,908.89
Service Spares 456.83 442.48
Total 169,999.63 158,327.50
18. Trade Receivables - Unsecured
` in Lakhs
Particulars 31-Mar-2012 31-Mar-2011
(a) Trade receivables outstanding for a period exceeding six months from the date they were due for paymentConsidered good 8,372.29 7,345.27
Considered Doubtful 1,123.58 3,475.68
Less: Provision for doubtful receivables (1,123.58) (3,475.68)
(b) Other trade receivablesConsidered good 213,529.58 179,683.96
Considered Doubtful 6,641.03 2,605.89
Less: Provision for doubtful receivables (6,641.03) (2,605.89)
Total 221,901.87 187,029.23
19. Cash and Cash Equivalents
` in Lakhs
Particulars 31-Mar-2012 31-Mar-2011
Cash on hand 283.66 455.97
Balances with Banks
(i) In current accounts 25,063.31 26,892.95
(ii) In deposit accounts 21,733.03 20,074.52
(iii) Margin money with banks 1,259.22 634.00
(iv) Earmarked balances – Unclaimed Dividend account 4.57 2.80
Total 48,343.79 48,060.24
20. Short term loans & advances (Unsecured and considered good)
` in Lakhs
Particulars 31-Mar-2012 31-Mar-2011
(a) Security deposits 1,442.97 1,682.34
(b) Loans and Advances to employees 334.90 210.58
(c) Prepaid expenses 3,191.22 2,934.01
(d) Balances with government authorities
(i) Receivables from Customs authorities 4,657.38 4,929.47
(ii) VAT & Service Tax Credit Receivable 3,163.28 1,835.69
(e) Advance to suppliers 11,150.51 8,532.37
Total 23,940.26 20,124.46
21. Short term receivables under fi nancing activity
(Represents repayments due within one year from the reporting date)
` in Lakhs
Particulars 31-Mar-2012 31-Mar-2011
Secured and considered good 31,667.04 18,047.23
Unsecured and considered good 22,992.72 48,245.09
Total 54,659.76 66,292.32
22. Revenue from Operations
` in Lakhs
Particulars 31-Mar-2012 31-Mar-2011
Sales 2,028,963.85 1,594,977.71
Service Income 40,765.22 37,420.31
Interest on loan 3,291.66 2,121.75
Other fi nancial services 2,046.34 919.81
Rebates 44,212.39 34,922.35
Other operating revenues 19.27 15.19
Total 2,119,298.73 1,670,377.12

Annual Report 2011–2012
99Annual Report
2011–2012
98
1 TO CONTENTS PAGE 3 CLOSE
23. Other Income
` in Lakhs
Particulars 31-Mar-2012 31-Mar-2011
Interest on loan 109.99 1,071.75
Interest from dealers 1,017.41 439.91
Interest on overdue trade receivables 1.23 -
Interest on Bank deposits 447.56 14.71
Dividend from Short term Investments 68.30 -
Bad Debts Written off in earlier years recovered 45.66 24.06
Exchange Gain/(Loss) Net 562.38 256.75
Other Non-operating income 650.88 80.72
Total 2,903.41 1,887.90
24. Employee benefi ts
` in Lakhs
Particulars 31-Mar-2012 31-Mar-2011Salaries & Bonus 26,062.75 19,190.84
Contribution to Provident Fund & Other Funds 503.16 397.54
Welfare Expenses 718.77 517.12
Gratuity 752.57 551.25
Total 28,037.25 20,656.75
25. Finance Costs
` in Lakhs
Particulars 31-Mar-2012 31-Mar-2011Interest on loan 14,003.99 8,842.22
Other Borrowing Costs 1,200.28 766.45
Total 15,204.27 9,608.67
26. Other Expenses
` in Lakhs
Particulars 31-Mar -2012 31-Mar-2011Rent 5,625.93 4,198.96
Freight 4,993.30 3,712.11
Commercial Taxes 3,117.25 1,782.17
Repairs and maintenance 1,790.92 1,350.54
Utilities 760.48 553.84
Insurance 1,976.89 1,583.16
Communication 1,761.05 1,680.77
Advertisement 2,714.63 2,332.65
Travel 2,567.57 1,747.35
Professional Charges 1,547.18 699.49
Bad Debts 594.79 732.46
Less :-Written off against provision 561.93 32.86 412.52 319.94
Provision for doubtful receivables 2,244.97 2,085.43
Audit remuneration (including remuneration to
subsidiaries’ auditors)
408.37 332.24
Factoring Charges 119.45 153.05
Directors’ Fee* 85.60 82.35
Loss on Sale of Fixed Assets 18.75 (55.61)
Outsourced resource cost 526.97 407.96
Security Charges 508.69 272.59
Packing Charges 283.69 193.07
Provision for standard assets 185.00 195.00
Software expenses 659.85 497.45
Guarantee charges 1,096.31 521.66
Bank Charges 1,681.68 2,164.72
Miscellaneous expenses 2,642.79 1,020.73
Total 37,350.18 27,831.62
* includes commission Paid to Non wholetime Directors:
Commission of ̀ 50 Lakhs to Non whole-time directors provided in the accounts, requires the approval of the shareholders
at the ensuing Annual General Meeting.
27. Earnings per Share
The calculation of the Basic and Diluted Earning per share is based on the following data:
Description 31-Mar -2012 31-Mar-2011
Profi t after Tax (` In Lakhs) 29,274.08 22,599.95
Weighted Average Number of equity shares (Basic) 398,024,290 395,348,997
Earning per share- Basic ` 7.35 5.72
Weighted Average Number of equity shares on account of Employee Stock
Option Plan 2008 (Diluted)
399,072,457 397,931,703
Earning per share- Diluted ` 7.34 5.68
Face Value per share in ` 2/- 2/-
28. Contingent Liabilities & Commitments
` in Lakhs
Particulars 31-Mar -2012 31-Mar-2011
i. Corporate Guarantees issued to others - 321.68
ii. Letter of Credit 2,620.06 2,566.01
iii. Bills Discounted* 2,165.34 6,939.49
iv. Factoring* 4,422.50 2,000.00
v. Claims against Company not acknowledged as debts 187.34 564.43
* Net of inter group transaction
vi. The holding company has in addition to the above issued letters of comfort /awareness to banks for the facilities
granted to their subsidiaries.

Annual Report 2011–2012
101Annual Report
2011–2012
100
1 TO CONTENTS PAGE 3 CLOSE
vii. Disputed Income Tax/Sales Tax/Customs Duty demands
` in Lakhs
Nature of Dues 31-Mar-2012 31-Mar-2011
Customs duty 169.64 315.79
Income Tax 847.13 554.74
Sales Tax 1,204.25 1,229.18
The holding company has paid ` 495.73 lakhs under protest (P.Y. ` 631.23 Lakhs), which is included under Long
term loans & advances.
viii. As at March 31, 2012, Redington Turkey Holdings, S.A.R.L. (RTHS), a step – down subsidiary of Redington
(India) Limited, is a party to an administrative lawsuit fi led before the 8th Administrative Court of Ankara, as the
plaintiff, requesting the stay of execution and cancellation of the decision of the Capital Market Board (“CMB”)
dated August 25, 2011 requiring RTHS to fi le an application with the aim to conduct a mandatory tender offer
towards the shareholders of Arena Bilgisayar Sanayi ve Ticaret A.S. (“Arena”) in connection with its purchase
of 49.40% stake in Arena on November 29, 2010 which would require RTHS to purchase the remaining
16,192,000 shares of Arena at a price which, in the absence of appropriate precedent, cannot be determined
as of the date of this report. The request for the stay of execution of the CMB’s decision at the onset of the
lawsuit was rejected by the 8th Administrative Court of Ankara on February 29, 2012 and this rejection was
subsequently challenged before the Ankara Regional Administrative Courts which is currently reviewing the
challenge (requesting once more the stay of execution of the CMB’s decision) fi led by the Company. The
court has not yet reviewed the merits of the lawsuit.
The CMB’s decision is based on an injunction decision given by the 13th Chamber of the Council of State
on July 18, 2011, as a result of a lawsuit fi led by an individual investor against the CMB requesting injunction
on and the cancellation of certain provisions of the CMB Communique regulating tender offers in Turkish
public companies and the CMB decision turning down the request of the investor seeking a tender offer to
be launched by the Company in connection with its purchase of 49.40% stake in Arena on November 29,
2010. The injunction decision given by the 13th Chamber of the Council of State was challenged by the
CMB before the Council of Administrative Chambers of the Council of State which is currently reviewing the
objection (requesting the injunction to be revoked). The Company applied to the 13th Chamber of the Council
of State on 10 October 2011 to join and become a party in this lawsuit on the side of the defendant CMB.
The Company also submitted a detailed petition explaining why the challenge by the CMB should be upheld.
However, as of March 31, 2012 the court had not resolved on the Company’s request or the subsequent
petition that was submitted by the Company to the arguments of the CMB.
ix. Capital Commitments
Estimated amount of contracts remaining to be executed on capital account and not provided for (net of advances)
is ` 2,575.90 Lakhs (P.Y. ` 406.34 Lakhs).
29. Statutory Reserve
(i) Statutory Reserve represents the Reserve created under Section 45-IC of the Reserve Bank of India Act,
1934 by the Company’s subsidiary carrying NBFC activities.
(ii) Statement of Profi t and Loss include ̀ 33.68 lakhs (P.Y. ̀ 30.11 lakhs) representing statutory reserves required
by the local laws of the countries where overseas subsidiaries are domiciled, created by allocating a certain
percentage of net profi ts for the year. These reserves are not distributable except as provided by the relevant
country’s law.
30. Operating Leases
The holding company has taken cancellable operating lease for its offi ce premises, which are for a period ranging
from 11 months to 9 years.
31. Segment Reporting
The Company has identifi ed geographical segment as its primary segment. Geographical segments are reported
viz., India and Overseas. Secondary segment identifi ed are Distribution & Service business and Financial Service
business.
PRIMARY SEGMENT
` in Lakhs
ParticularsIndia Overseas Eliminations Total
2012 2011 2012 2011 2012 2011 2012 2011
Revenue
External 996,096.50 817,841.06 1,126,105.64 854,423.96 2,122,202.14 1,672,265.02
Inter-segment 959.78 388.61 4,591.47 1,405.30 (5,551.25) (1,793.91)
Total 997,056.28 818,229.67 1,130,697.11 855,829.26 (5,551.25) (1,793.91) 2,122,202.14 1,672,265.02
Profi t before tax 27,607.68 21,977.05 17,616.40 13,263.52 (191.27) (140.15) 45,032.81 35,100.42
Segment Assets 272,842.48 261,651.16 297,535.00 239,018.80 (19,271.94) 6,207.88 551,105.54 506,877.84
Segment Liabilities 204,067.22 204,251.91 218,001.29 143,332.22 (12,698.91) (365.08) 409,369.60 347,219.05
Other Information
Depreciation 1,187.20 1,471.72 1,915.87 984.09 3,103.07 2,455.81
Capital Expenditure 2,674.54 1,405.75 2,537.57 4,238.25 5,212.11 5,644.00
SECONDARY SEGMENT ` in Lakhs
ParticularsDistribution & Service Financial Services Eliminations Total
2012 2011 2012 2011 2012 2011 2012 2011
Revenue
External 2,116,856.84 1,669,524.88 5,345.30 2,740.14 2,122,202.14 1,672,265.02
Inter-segment 2,132.92 2,477.64 (2,132.92) (2,447.64)
Total 2,116,856.84 1,669,524.88 7,478.22 5,217.78 (2,132.92) (2,477.64) 2,122,202.14 1,672,265.02
Profi t before tax 40,766.60 32,238.86 4,266.21 2,861.56 45,032.81 35,100.42
Segment Assets 493,057.09 439,475.31 58,055.78 68,187.53 (7.33) (785.00) 551,105.54 506,877.84
Segment Liabilities 380,525.87 305,437.94 31,686.36 42,943.69 (2,842.63) (1,162.58) 409,369.60 347,219.05
Other Information
Depreciation 3,032.24 2,400.88 70.83 54.93 3,103.07 2,455.81
Capital Expenditure 5,138.98 5,567.43 73.13 76.57 5,212.11 5,644.00
32. Accounting for Financial Instruments
The holding company has recognized Mark to Market (MTM) gain/(loss) of ` Nil Lakhs (Previous Year loss of ` 2.09
Lakhs) relating to forward contracts entered into to hedge the foreign currency risk of highly probable transactions
that are designated as effective cash fl ow hedges, in the Hedge Reserve Account. The holding Company has not
entered into any speculative/other derivative transaction.
33. Events occurring after the balance sheet date
Equity shares of ` 2/- each fully paid up were issued and allotted pursuant to the exercise of stock options under
Employee Stock Option Plan 2008.
Date of allotment No of Shares
April 20, 2012 226,000

Annual Report 2011–2012
103Annual Report
2011–2012
102
1 TO CONTENTS PAGE 3 CLOSE
34. Related party disclosures
1) Key Management Personnel
Mr. R Srinivasan, Managing Director
Mr. Raj Shankar, Deputy Managing Director
Mr. M Raghunandan, Whole-time Director
2) Names of the related parties
Party where control exists Redington Employee Share Purchase Trust
Parties having Signifi cant Infl uence Redington (Mauritius) Limited, Mauritius
Synnex Mauritius Limited, Mauritius
3) Nature of Transactions
` in Lakhs
Nature of Transactions 31-Mar-2012 31-Mar-2011Parties where control exists:Redington Employees Share Purchase TrustLoan Granted - 4.50
Loan re-paid 4.50 -
Dividend Paid 0.54 0.10
Loan Outstanding - 4.50
Nature of Transactions 31-Mar-2012 31-Mar-2011Parties having signifi cant infl uence:Redington (Mauritius) Limited
Dividend Paid 924.30 1,145.08
Synnex Mauritius LimitedDividend Paid 1,037.26 1,101.91
Related parties have been identifi ed by the management
35. Employee Stock Option Plan 2008
As the company follows intrinsic value method of accounting, no compensation costs have been recognized in these
accounts as the options have been granted at the prevailing market prices.
Particulars Grant I Grant II Grant III Grant IV Grant VDate of Grant 29-Feb-08 25-Jul-08 28-Jan-09 22-May-09 5-Dec-11
Exercise Price (`)* 348.05 319.90 130.00 165.00 396.50
Vesting commences on 28-Feb-09 24-Jul-09 27-Jan-10 21-May-10 4-Dec-12
Options granted 2,335,973 11,000 276,143 25,000 173,212
Options lapsed 488,889 - - - 10,550
Options vested 1,847,084 11,000 276,143 18,750 -
Options exercised at the beginning of the year 1,226,407 4,250 157,108 12,500 -
Options exercised during the year 372,343 2,000 69,035 6,250 -
Total options outstanding and not exercised as
on March 31, 2012
248,334
4,750
50,000 6,250 162,662
* Out of the total grant of options in 2008, 19,59,830 options were repriced at ` 130/- on January 28, 2009 and 75,000 options
were repriced at ` 165/- on May 22, 2009
Out of the lapsed options the Board/Committee of directors at their meetings had approved reissue of options as follows
Date of Grant July 25, 2008 January 28, 2009 May 22, 2009 December 5, 2011
No. of options 11,000 276,143 25,000 173,212
The fair value of options based on the valuation of the independent valuer as of the respective dates of grant are given
below:
Grant Date
Feb 29, 2008
Repriced on Jan 28,
2009
Repriced on May 22, 2009
Jul 25, 2008
Repriced on Jan 28,
2009
Jan 28, 2009
May 22, 2009
Dec 5, 2011
Fair Value 171.33 25.56 33.04 159.71 23.77 47.46 79.82 171.72
The variables used for calculating the Fair Values and their rationale are as follows:
A. Stock price
The closing market price on the date prior to the date of grant on National Stock Exchange (NSE) has been considered
for the purpose of option valuation.
B. Volatility
Volatility is a measure of the amount by which a price has fl uctuated or is expected to fl uctuate during a period.
The measure of volatility used in the Black-Scholes option-pricing model is the annualized standard deviation of the
continuously compounded rates of return on the stock over a period of time.
The period to be considered for volatility has to be adequate to represent a consistent trend in the price movements.
It is also important that movements due to abnormal events get evened out.
There is no research that demonstrates conclusively how long the historical period used to estimate expected long-
term future volatility should be. However, Guidance note on Accounting for Employee Share-based Payments issued
by the Institute of Chartered Accountants of India recommends including the historical volatility of the stock over the
most recent period that is generally commensurate with the expected life of the option being valued.
The entity’s stocks have been publicly traded on NSE and BSE. For calculating Volatility, we have considered the
daily volatility of the stock prices on NSE, over a period prior to the date of grant, corresponding with the expected
life of the options.
The Fair value of an option is very sensitive to this variable. Higher the volatility, higher is the Fair value. The rationale
being, the more volatile a stock is, the more is its potential to go up (or come down), and the more is the probability
to gain from the movement in the price. Accordingly, an option to buy a highly volatile stock is more valuable than the
one to buy a less volatile stock, for the probability of gaining is lesser in the latter case.
C. Risk free interest rate
The risk-free interest rate being considered for the calculation is the interest rate applicable for maturity equal to the
expected life of the options based on the zero-coupon yield curve for Government Securities.
D. Exercise Price
Options have been granted primarily at a price of ` 348.05 on February 29, 2008. Subsequently, 1,959,830 and
75,000 options were re-priced at a Market price of ` 130/- and ` 165/- on January 28, 2009 and May 22, 2009
respectively. On December 5, 2011 173,212 options were granted at a price of ` 396.50 per option.
E. Time to Maturity / Expected Life of options
Time to Maturity / Expected Life of options is the period for which the Company expects the options to be live.
The minimum life of a stock option is the minimum period before which the options cannot be exercised and the
maximum life is the period after which the options cannot be exercised.
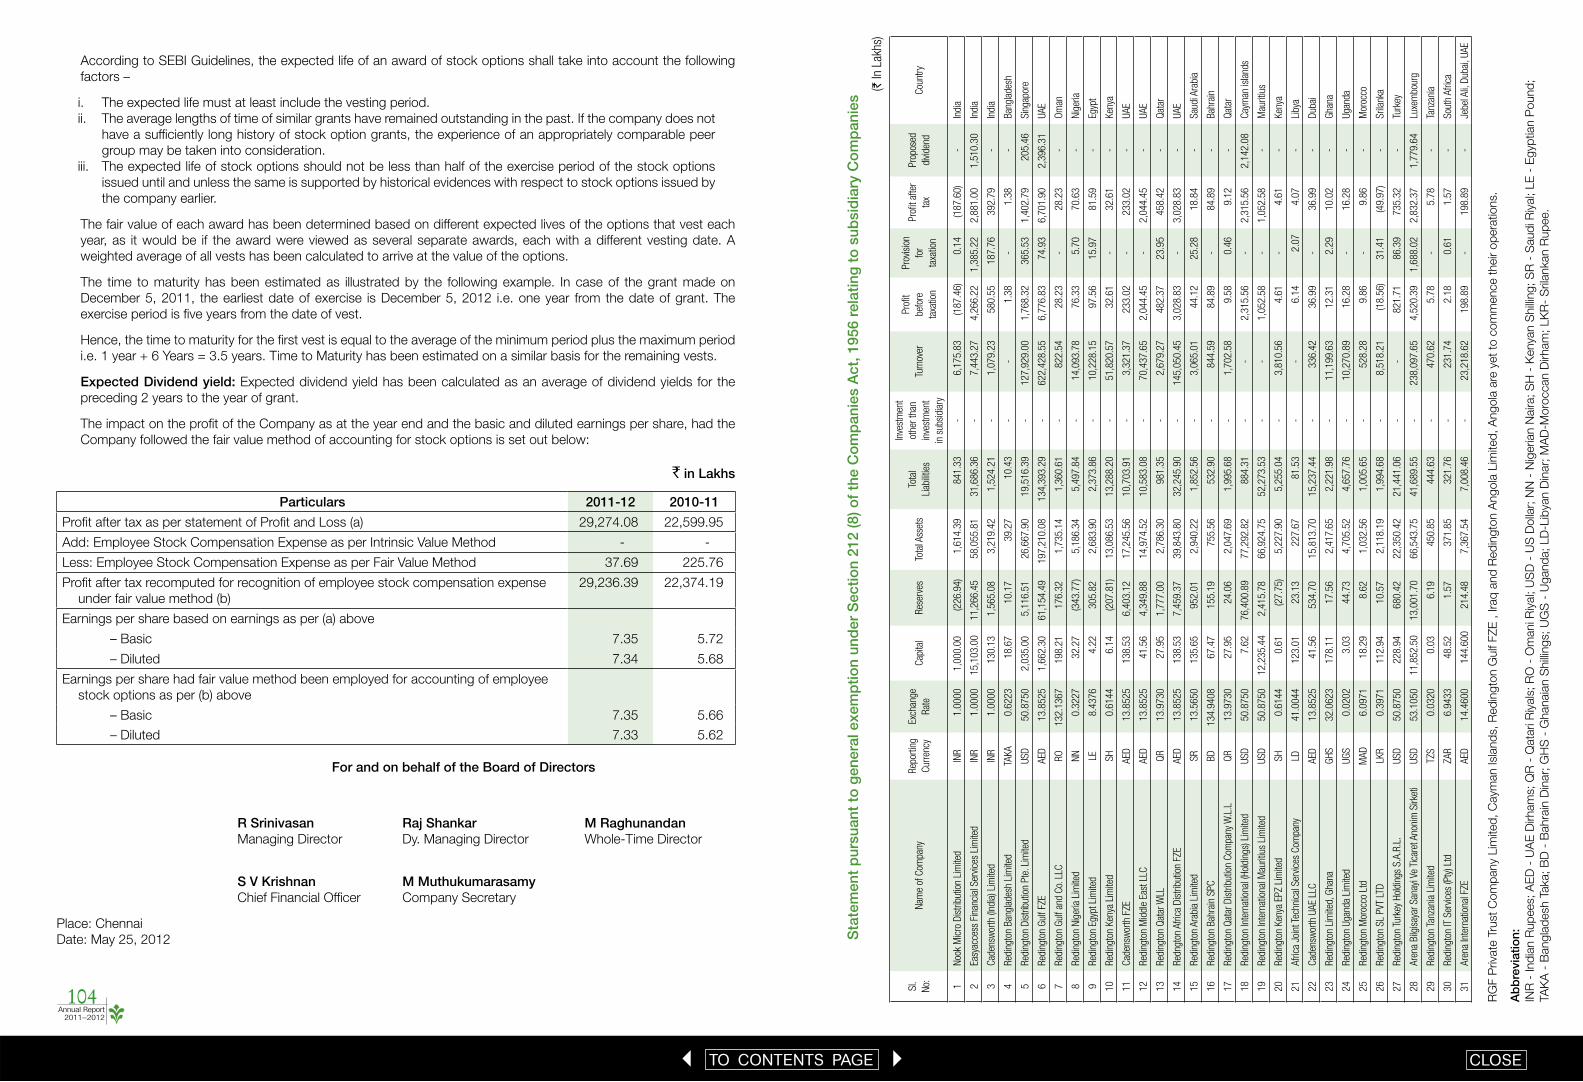
Annual Report 2011–2012
104
1 TO CONTENTS PAGE 3 CLOSE
According to SEBI Guidelines, the expected life of an award of stock options shall take into account the following
factors –
i. The expected life must at least include the vesting period.
ii. The average lengths of time of similar grants have remained outstanding in the past. If the company does not
have a suffi ciently long history of stock option grants, the experience of an appropriately comparable peer
group may be taken into consideration.
iii. The expected life of stock options should not be less than half of the exercise period of the stock options
issued until and unless the same is supported by historical evidences with respect to stock options issued by
the company earlier.
The fair value of each award has been determined based on different expected lives of the options that vest each
year, as it would be if the award were viewed as several separate awards, each with a different vesting date. A
weighted average of all vests has been calculated to arrive at the value of the options.
The time to maturity has been estimated as illustrated by the following example. In case of the grant made on
December 5, 2011, the earliest date of exercise is December 5, 2012 i.e. one year from the date of grant. The
exercise period is fi ve years from the date of vest.
Hence, the time to maturity for the fi rst vest is equal to the average of the minimum period plus the maximum period
i.e. 1 year + 6 Years = 3.5 years. Time to Maturity has been estimated on a similar basis for the remaining vests.
Expected Dividend yield: Expected dividend yield has been calculated as an average of dividend yields for the
preceding 2 years to the year of grant.
The impact on the profi t of the Company as at the year end and the basic and diluted earnings per share, had the
Company followed the fair value method of accounting for stock options is set out below:
` in Lakhs
Particulars 2011-12 2010-11
Profi t after tax as per statement of Profi t and Loss (a) 29,274.08 22,599.95
Add: Employee Stock Compensation Expense as per Intrinsic Value Method - -
Less: Employee Stock Compensation Expense as per Fair Value Method 37.69 225.76
Profi t after tax recomputed for recognition of employee stock compensation expense
under fair value method (b)
29,236.39 22,374.19
Earnings per share based on earnings as per (a) above
– Basic 7.35 5.72
– Diluted 7.34 5.68
Earnings per share had fair value method been employed for accounting of employee
stock options as per (b) above
– Basic 7.35 5.66
– Diluted 7.33 5.62
For and on behalf of the Board of Directors
R Srinivasan Raj Shankar M Raghunandan Managing Director Dy. Managing Director Whole-Time Director
S V Krishnan M Muthukumarasamy Chief Financial Offi cer Company Secretary
Place: Chennai
Date: May 25, 2012
Sta
tem
ent
pur
suan
t to
gen
eral
exe
mp
tion
und
er S
ectio
n 21
2 (8
) of
the
Co
mp
anie
s A
ct, 1
956
rela
ting
to
sub
sid
iary
Co
mp
anie
s
RG
F P
riva
te T
rust
Com
pany
Lim
ited
, C
aym
an Isla
nd
s,
Red
ingto
n G
ulf
FZ
E ,
Ira
q a
nd
Red
ingto
n A
ngola
Lim
ited
, A
ngola
are
yet
to c
om
mence t
heir o
pera
tio
ns.
Ab
bre
viat
ion:
INR
- Ind
ian R
up
ees; A
ED
- U
AE
Dirham
s; Q
R -
Qata
ri R
iyals
; R
O -
Om
ani R
iyal;
US
D -
US
Dolla
r; N
N -
Nig
erian N
aira;
SH
- K
enya
n S
hillin
g;
SR
- S
aud
i Riy
al;
LE
- E
gyp
tian P
ound
;
TA
KA
- B
angla
desh T
aka; B
D -
Bahra
in D
inar;
GH
S -
Ghanaia
n S
hillin
gs;
UG
S -
Ugand
a;
LD
-Lib
yan D
inar;
MA
D-M
oro
ccan D
irham
; LK
R-
Srila
nkan R
up
ee.
Sl.
No:
Nam
e of
Com
pany
Rep
ortin
g
Cur
renc
y
Exch
ange
Rat
eC
apita
lR
eser
ves
Tota
l Ass
ets
Tota
l
Liab
ilitie
s
Inve
stm
ent
othe
r th
an
inve
stm
ent
in s
ubsi
diar
y
Turn
over
Pro
fi t
befo
re
taxa
tion
Pro
visi
on
for
taxa
tion
Pro
fi t a
fter
tax
Pro
pose
d
divi
dend
Cou
ntry
1N
ook
Mic
ro D
istr
ibut
ion
Lim
ited
INR
1.0
000
1,0
00.0
0(2
26.9
4)
1,6
14.3
9841.3
3-
6,1
75.8
3(1
87.4
6)
0.1
4(1
87.6
0)
-In
dia
2Ea
syac
cess
Fin
anci
al S
ervi
ces
Lim
ited
INR
1.0
000
15,1
03.0
011,2
66.4
558,0
55.8
131,6
86.3
6-
7,4
43.2
74,2
66.2
21,3
85.2
22,8
81.0
01,5
10.3
0In
dia
3C
aden
swor
th (I
ndia
) Lim
ited
INR
1.0
000
130.1
31,5
65.0
83,2
19.4
21,5
24.2
1-
1,0
79.2
3580.5
5187.7
6392.7
9-
Indi
a
4R
edin
gton
Ban
glad
esh
Lim
ited
TAKA
0.6
223
18.6
710.1
739.2
710.4
3-
-1.3
8-
1.3
8-
Ban
glad
esh
5R
edin
gton
Dis
trib
utio
n Pte
. Lim
ited
USD
50.8
750
2,0
35.0
05,1
16.5
126,6
67.9
019,5
16.3
9-
127,9
29.0
01,7
68.3
2365.5
31,4
02.7
9205.4
6Sin
gapo
re
6R
edin
gton
Gul
f FZE
AED
13.8
525
1,6
62.3
061,1
54.4
9197,2
10.0
8134,3
93.2
9-
622,4
28.5
56,7
76.8
374.9
36,7
01.9
02,3
96.3
1U
AE
7R
edin
gton
Gul
f and
Co.
LLC
RO
132.1
367
198.2
1176.3
21,7
35.1
41,3
60.6
1-
822.5
428.2
3-
28.2
3-
Om
an
8R
edin
gton
Nig
eria
Lim
ited
NN
0.3
227
32.2
7(3
43.7
7)
5,1
86.3
45,4
97.8
4-
14,0
93.7
876.3
35.7
070.6
3-
Nig
eria
9R
edin
gton
Egy
pt L
imite
dLE
8.4
376
4.2
2305.8
22,6
83.9
02,3
73.8
6-
10,2
28.1
597.5
615.9
781.5
9-
Egyp
t
10
Red
ingt
on K
enya
Lim
ited
SH
0.6
144
6.1
4(2
07.8
1)
13,0
86.5
313,2
88.2
0-
51,8
20.5
732.6
1-
32.6
1-
Ken
ya
11
Cad
ensw
orth
FZE
AED
13.8
525
138.5
36,4
03.1
217,2
45.5
610,7
03.9
1-
3,3
21.3
7233.0
2-
233.0
2-
UA
E
12
Red
ingt
on M
iddl
e Ea
st L
LCA
ED13.8
525
41.5
64,3
49.8
814,9
74.5
210,5
83.0
8-
70,4
37.6
52,0
44.4
5-
2,0
44.4
5-
UA
E
13
Red
ingt
on Q
atar
WLL
QR
13.9
730
27.9
51,7
77.0
02,7
86.3
0981.3
5-
2,6
79.2
7482.3
723.9
5458.4
2-
Qat
ar
14
Red
ngto
n A
fric
a D
istr
ibut
ion
FZE
AED
13.8
525
138.5
37,4
59.3
739,8
43.8
032,2
45.9
0-
145,0
50.4
53,0
28.8
3-
3,0
28.8
3-
UA
E
15
Red
ingt
on A
rabi
a Li
mite
dSR
13.5
650
135.6
5952.0
12,9
40.2
21,8
52.5
6-
3,0
65.0
144.1
225.2
818.8
4-
Sau
di A
rabi
a
16
Red
ingt
on B
ahra
in S
PC
BD
134.9
408
67.4
7155.1
9755.5
6532.9
0-
844.5
984.8
9-
84.8
9-
Bah
rain
17
Red
ingt
on Q
atar
Dis
trib
utio
n C
ompa
ny W
.L.L
QR
13.9
730
27.9
524.0
62,0
47.6
91,9
95.6
8-
1,7
02.5
89.5
80.4
69.1
2-
Qat
ar
18
Red
ingt
on In
tern
atio
nal (
Hol
ding
s) L
imite
dU
SD
50.8
750
7.6
276,4
00.8
977,2
92.8
2884.3
1-
-2,3
15.5
6-
2,3
15.5
62,1
42.0
8C
aym
an is
land
s
19
Red
ingt
on In
tern
atio
nal M
aurit
ius
Lim
ited
USD
50.8
750
12,2
35.4
42,4
15.7
866,9
24.7
552,2
73.5
3-
-1,0
52.5
8-
1,0
52.5
8-
Mau
ritiu
s
20
Red
ingt
on K
enya
EPZ
Lim
ited
SH
0.6
144
0.6
1(2
7.7
5)
5,2
27.9
05,2
55.0
4-
3,8
10.5
64.6
1-
4.6
1-
Ken
ya
21
Afr
ica
Join
t Tec
hnic
al S
ervi
ces
Com
pany
LD
41.0
044
123.0
123.1
3227.6
781.5
3-
-6.1
42.0
74.0
7-
Liby
a
22
Cad
ensw
orth
UA
E LL
CA
ED13.8
525
41.5
6534.7
015,8
13.7
015,2
37.4
4-
336.4
236.9
9-
36.9
9-
Dub
ai
23
Red
ingt
on L
imite
d, G
hana
GH
S32.0
623
178.1
117.5
62,4
17.6
52,2
21.9
8-
11,1
99.6
312.3
12.2
910.0
2-
Gha
na
24
Red
ingt
on U
gand
a Li
mite
dU
GS
0.0
202
3.0
344.7
34,7
05.5
24,6
57.7
6-
10,2
70.8
916.2
8-
16.2
8-
Uga
nda
25
Red
ingt
on M
oroc
co L
tdM
AD
6.0
971
18.2
98.6
21,0
32.5
61,0
05.6
5-
528.2
89.8
6-
9.8
6-
Mor
occo
26
Red
ingt
on S
L PVT
LTD
LKR
0.3
971
112.9
410.5
72,1
18.1
91,9
94.6
8-
8,5
18.2
1(1
8.5
6)
31.4
1(4
9.9
7)
-Sril
anka
27
Red
ingt
on T
urke
y H
oldi
ngs
S.A
.R.L
.U
SD
50.8
750
228.9
4680.4
222,3
50.4
221,4
41.0
6-
-821.7
186.3
9735.3
2-
Turk
ey
28
Are
na B
ilgis
ayar
San
ayi V
e Ti
care
t Ano
nim
Sirk
eti
USD
53.1
050
11,8
52.5
013,0
01.7
066,5
43.7
541,6
89.5
5-
238,0
97.6
54,5
20.3
91,6
88.0
22,8
32.3
71,7
79.6
4Lu
xem
bour
g
29
Red
ingt
on T
anza
nia
Lim
ited
TZS
0.0
320
0.0
36.1
9450.8
5444.6
3-
470.6
25.7
8-
5.7
8-
Tanz
ania
30
Red
ingt
on IT
Ser
vice
s (P
ty) L
tdZA
R6.9
433
48.5
21.5
7371.8
5321.7
6-
231.7
42.1
80.6
11.5
7-
Sou
th A
fric
a
31
Are
na In
tern
atio
nal F
ZEA
ED14.4
600
144.6
00
214.4
87,3
67.5
47,0
08.4
6-
23,2
18.6
2198.8
9-
198.8
9-
Jebe
l Ali,
Dub
ai, U
AE
(` In
Lak
hs)

Annual Report 2011–2012
107Annual Report
2011–2012
106
1 TO CONTENTS PAGE 3 CLOSE
REDINGTON (INDIA) LTD.
Regd. Offi ce: SPL Guindy House, 95, Mount Road, Guindy, Chennai 600 032
NOTICENOTICE is hereby given that the NINETEENTH ANNUAL GENERAL MEETING of the Company will be held on
Tuesday, the 31st day of July 2012 at 10.00 A.M at the Mini Hall, Narada Gana Sabha, No. 314 (Old No. 254), T.T.K.
Road, Alwarpet, Chennai 600 018, to transact the following business:
ORDINARY BUSINESS:1. To receive, consider and adopt the audited Balance Sheet of the Company as at March 31, 2012, the statement
of Profi t and Loss for the fi nancial year ended on that date, and the Reports of the Directors and Auditors thereon.
2. To declare Dividend for the year ended 31st March 2012.
3. To appoint a Director in place of Mr. R. Jayachandran, who retires by rotation and being eligible, offers himself
for re-appointment.
4. To appoint a Director in place of Prof. J. Ramachandran, who retires by rotation and being eligible, offers himself
for re-appointment.
5. To appoint Auditors to hold offi ce from the conclusion of this Meeting until the conclusion of the next Annual
General Meeting on such remuneration to be fi xed by the Board of Directors. M/s. Deloitte Haskins & Sells, Chartered Accountants, the retiring Auditors, being eligible, offer themselves for re-appointment.
SPECIAL BUSINESS:6. To consider and if thought fi t, to pass, with or without modifi cation(s) the following as an Ordinary Resolution:
“RESOLVED that Mr. Nainesh Jaisingh, who was appointed as an Additional Director, in terms of Section 260 of
the Companies Act, 1956 to hold offi ce till the conclusion of this Annual General Meeting and in respect of whom
the Company has received a notice in writing from a member under Section 257 of the said Act proposing his
appointment, be and is hereby appointed as Director of the Company liable to retirement by rotation.”
7. To consider and if thought fi t, to pass, with or without modifi cation(s) the following as an Ordinary Resolution:
“RESOLVED that Mr. Lin Tai – Yang, who was appointed as an Additional Director, in terms of Section 260 of the
Companies Act,1956 to hold offi ce till the conclusion of this Annual General Meeting and in respect of whom
the Company has received a notice in writing from a member under Section 257 of the said Act proposing his
appointment, be and is hereby appointed as Director of the Company liable to retirement by rotation.”
8. To consider and if thought fi t, to pass, with or without modifi cation(s) the following as an Ordinary Resolution:
“RESOLVED that in accordance with the provisions of Section 269 and other applicable provisions if any, of the
Companies Act, 1956 (including any statutory modifi cation or re-enactment thereof, for the time being in force)
and subject to approval of the Central Government, approval of the Company be and is hereby accorded for
the re-appointment of Mr. Raj Shankar as Deputy Managing Director of the Company for a period of fi ve years
with effect from 26th July, 2012 without payment of any remuneration excepting reimbursement of the expenses
incurred by him in connection with the business of the company and on the terms contained in the Agreement
entered between Mr. Raj Shankar and the Company.”
9. To consider and if thought fi t, to pass, with or without modifi cation(s) the following as a Special Resolution
“RESOLVED that pursuant to the provisions of Section 198, 309 and other applicable provisions, if any, of the
Companies Act,1956 (including any statutory modifi cation or re-enactment thereof, for the time being in force)
approval of the company be and is hereby accorded for payment of remuneration to the Directors of the Company
other than the Whole-time Directors, by way of Commission up to an aggregate limit of 1% of the net profi ts of
the Company computed in accordance with the provisions of Section 349/350 Companies Act, 1956 for each
fi nancial year and subject to such limits as may be determined from time to time by the Board of Directors, for a
period of fi ve years commencing from fi nancial year ended 31st March 2012”.
By Order of the Board
For Redington (India) Limited
Chennai M. Muthukumarasamy
May 25, 2012 Company Secretary
Notes :1. The relative explanatory statement, pursuant to Section 173(2) of the Companies Act, 1956 in respect of the
business under items 6 to 9 is attached hereto.
2. A MEMBER ENTITLED TO ATTEND AND VOTE AT THE MEETING IS ENTITLED TO APPOINT A PROXY TO
ATTEND AND VOTE INSTEAD OF HIMSELF AND THE PROXY NEED NOT BE A MEMBER. A BLANK PROXY
FORM IS ENCLOSED FOR USE BY MEMBERS, IF REQUIRED. THIS MUST BE SUBMITTED WITH THE
COMPANY’S REGISTERED OFFICE AT LEAST 48 HOURS BEFORE THE COMMENCEMENT OF THE MEETING.
3. The Register of Members and the Share Transfer Books of the Company will remain closed from Wednesday,
25th July 2012 to Tuesday, 31st July 2012 (both days inclusive) for the purpose of payment of Dividend.
4. The Dividend as recommended by Board of Directors if approved at the meeting, will be paid as under :-
to all benefi cial owners in electronic form as per data made available by NSDL and CDSL.
to all shareholders in respect of shares held in physical form after giving effect to valid transfers in respect
of transfer requests lodged with the Company on or before the close of business hours on 24th July 2012.
5. All correspondence with regard to share transfers/dividends and matters related therewith may be addressed
directly to the Company’s Registrar and Share Transfer Agents at M/s. Cameo Corporate Services Limited,
‘Subramanian Building’, No. 1, Club House Road, Chennai - 600 002.
6. Members are requested to lodge/notify the transfer deeds, communication for change of address, Bank details,
ECS details, wherever applicable, mandates (if any) with the Company’s Registrars and Share Transfer Agents,
M/s. Cameo Corporate Services Ltd., for shares held in physical mode.
7. Members holding shares in electronic form are requested to lodge the above details to their depository participants
and not to the Company or to the Registrar and Share Transfer Agents of the Company as the Company is
obliged to use only the data provided by the Depositories while making payment of dividend.
8. In case of joint holders attending the Meeting, only such joint holder who is higher in the order of names will be
entitled to vote.
9. Pursuant to the “Green Initiative” move taken by the Ministry of Corporate affairs, the Company is required to
send all statutory communications via email to the shareholders who have registered their email IDs. Towards this
Green Initiative, the Company, requests
a. Members who are holding shares in Physical mode to submit their valid email ID to M/s. Cameo Corporate
Services Limited, the Registrar and Share Transfer Agents, by quoting their folio number and also any change
therein from time to time and
b. Members holding shares in dematerialized form are also requested to inform/update their valid email IDs to
their respective depository participants from time to time.

Annual Report 2011–2012
109Annual Report
2011–2012
108
1 TO CONTENTS PAGE 3 CLOSE
10. Members/Proxy holders are requested to produce the enclosed admission slip duly completed and signed at
the entrance of the auditorium.
11. Members who have not yet en-cashed the dividend warrants for the fi nancial years from 2006-07 to 2010-11
are requested to present the same for revalidation to our Registrar and Share Transfer Agents.
12. Brief particulars of the Directors retiring by rotation, Deputy Managing Director and of other directors seeking
appointment/re-appointment are given in the Corporate Governance Report forming part of the Annual Report.
13. The Ministry of Corporate Affairs, Government of India, vide their General Circular No: 2/2011 dated 8th
February 2011 has granted general exemption from annexing the accounts of the subsidiary companies with
the accounts of the Company in view of the consolidated accounts being made available to the members.
14. The detailed annual accounts of the Company and its subsidiaries are available to the Members of the Company
on any working day at the Registered Offi ce of the Company. The annual accounts of the subsidiary companies
are also available at the Registered Offi ce of the Company and the respective subsidiary companies.
Explanatory Statement
PURSUANT TO SECTION 173(2) OF THE COMPANIES ACT, 1956
Item No. 6 & 7
Mr. Nainesh Jaisingh and Mr. Lin Tai-Yang were appointed as Additional Directors with effect from 5th August 2011
and 28th October 2011 respectively in accordance with the provisions of Section 260 of the Companies Act, 1956
and Article 26 (c) of the Articles of Association of the Company. Pursuant to Section 260 of the Companies Act,
1956, M/s Nainesh Jaisingh and Lin Tin-Yang, hold offi ce up to the date of the ensuing Annual General Meeting.
The Company has received notices in writing from members of the Company together with the requisite deposit
amount, as per the provisions of Section 257 of the Companies Act, 1956 proposing the above candidates for the
offi ce of Director subject to retirement by rotation.
Brief particulars of M/s Nainesh Jaisingh and Lin Tin-Yang are given in the Report on Corporate Governance forming
part of the Annual Report.
Your Directors recommend the said resolutions for your approval.
The aforesaid Directors may be deemed to be concerned or interested in the resolution relating to their respective
appointments. None of the other Directors are in any way concerned or interested in the said resolution.
Item No. 8
Mr. Raj Shankar was appointed as Deputy Managing Director with effect from 26th July 2007 for a period of fi ve
years and his appointment was approved by the Members at the Extra-Ordinary General Meeting held on 27th
February 2008. The tenure of his appointment is until 25th July 2012.
Considering Mr. Raj Shankar’s vast experience in the fi eld of Information Technology and his contribution to the
Company, the Board of Directors at their meeting held on 25th May 2012 approved the re-appointment of Mr. Raj
Shankar as Deputy Managing Director of the Company for a further period of fi ve years with effect from 26th July
2012 without payment of any remuneration excepting reimbursement of the expenses incurred by him in connection
with the business of the Company and on the terms and conditions contained in the agreement as entered between
Mr. Raj Shankar and the Company subject to the approval of members and the Central Government.
Brief particulars of Mr. Raj Shankar is given in the Report on Corporate Governance forming part of the Annual
Report.
As Mr. Raj Shankar has not been staying in India for a continuous period of twelve months immediately preceding
the days of his appointment as Deputy Managing Director, an application for approval of the Central Government for
his re-appointment as Deputy Managing Director under Section 269 read with requirements of Schedule XIII of the
Companies Act, 1956 would be made, post approval of the members.
The Directors recommend the Resolution as Item No: 8 of the Notice for the approval of members.
None of the Directors except Mr. Raj Shankar is interested in this resolution.
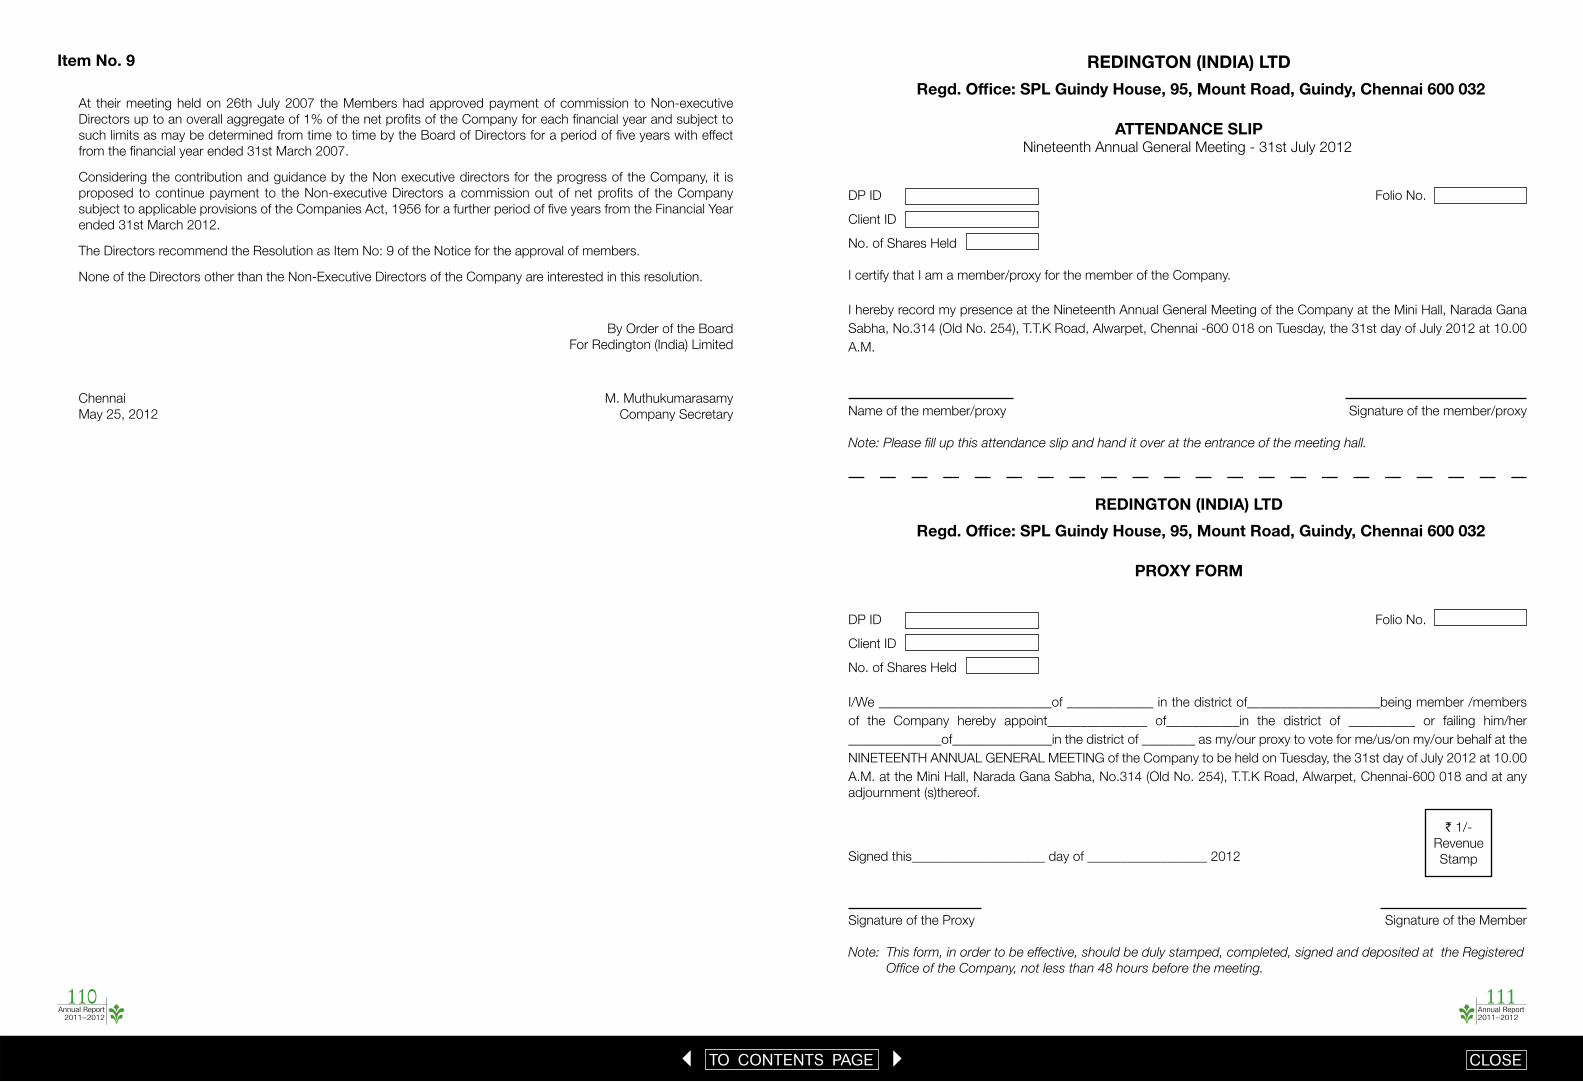
Annual Report 2011–2012
111Annual Report
2011–2012
110
1 TO CONTENTS PAGE 3 CLOSE
REDINGTON (INDIA) LTD
Regd. Offi ce: SPL Guindy House, 95, Mount Road, Guindy, Chennai 600 032
ATTENDANCE SLIPNineteenth Annual General Meeting - 31st July 2012
DP ID Folio No.
Client ID
No. of Shares Held
I certify that I am a member/proxy for the member of the Company.
I hereby record my presence at the Nineteenth Annual General Meeting of the Company at the Mini Hall, Narada Gana
Sabha, No.314 (Old No. 254), T.T.K Road, Alwarpet, Chennai -600 018 on Tuesday, the 31st day of July 2012 at 10.00
A.M.
Name of the member/proxy Signature of the member/proxy
Note: Please fi ll up this attendance slip and hand it over at the entrance of the meeting hall.
REDINGTON (INDIA) LTD
Regd. Offi ce: SPL Guindy House, 95, Mount Road, Guindy, Chennai 600 032
PROXY FORM
DP ID Folio No.
Client ID
No. of Shares Held
I/We __________________________of _____________ in the district of____________________being member /members
of the Company hereby appoint_______________ of___________in the district of __________ or failing him/her
______________of_______________in the district of ________ as my/our proxy to vote for me/us/on my/our behalf at the
NINETEENTH ANNUAL GENERAL MEETING of the Company to be held on Tuesday, the 31st day of July 2012 at 10.00
A.M. at the Mini Hall, Narada Gana Sabha, No.314 (Old No. 254), T.T.K Road, Alwarpet, Chennai-600 018 and at any
adjournment (s)thereof.
Signed this____________________ day of __________________ 2012
Signature of the Proxy Signature of the Member
Note: This form, in order to be effective, should be duly stamped, completed, signed and deposited at the Registered
Offi ce of the Company, not less than 48 hours before the meeting.
` 1/-
Revenue
Stamp
Item No. 9
At their meeting held on 26th July 2007 the Members had approved payment of commission to Non-executive
Directors up to an overall aggregate of 1% of the net profi ts of the Company for each fi nancial year and subject to
such limits as may be determined from time to time by the Board of Directors for a period of fi ve years with effect
from the fi nancial year ended 31st March 2007.
Considering the contribution and guidance by the Non executive directors for the progress of the Company, it is
proposed to continue payment to the Non-executive Directors a commission out of net profi ts of the Company
subject to applicable provisions of the Companies Act, 1956 for a further period of fi ve years from the Financial Year
ended 31st March 2012.
The Directors recommend the Resolution as Item No: 9 of the Notice for the approval of members.
None of the Directors other than the Non-Executive Directors of the Company are interested in this resolution.
By Order of the Board
For Redington (India) Limited
Chennai M. Muthukumarasamy
May 25, 2012 Company Secretary

1 TO CONTENTS PAGE 3 CLOSE
in recognitionINDIADun and Bradstreet Award for Corporate Excellence at the Rolta Corporate Awards 2011Outstanding Performance in Indigo Business for HP’s H1 FY2011HP Indigo-Highest Page growth channel Partner Year – 2011Award of Excellence for BENQ projector business.“Best after sales support” – Editor’s choice among National distributors from ITPVHP STORAGE
HP Storage Dat Champion -H1 FY11HP Storage Autoloader Champion - H1 FY11HP Storage EVA Modular Champion - H1 FY11HP Storage MSL Tape Library Champion - H1 FY11HP Storage P4000 iSCSI Champion -H1 FY11
ORACLEVAD of the Year FY11 - Fusion MiddlewareVAD of the Year FY11 - Technology Database SoftwareVAD of the Year FY11 - SystemsDistributor of the Year FY11
Ncomputing - Excellence Award for Value Added Distribution'2011 - APAC RegionIBM
Distributor with Highest Storage Run Rate Revenues In 2010 -IBM ISA BP Summit 2011Distributor with Highest Overall Stg Revenues In 2010 -IBM ISA BP Summit 2011
IBM Software - Critical Contributor for Channel Business – 2010CITRIX- Distributor for the Year 2011-2012HITACHI - Distributor for the Year 2011-2012WD Internal Drives – For Customer Breadth Growth AwardWD External Drives – For Fastest Year-on-Year Growth AwardEMC – Best Distributor in APJC region
MEAChannel Executive of the Year 2011 Award for Mr. Raj Shankar.Volume Distributor of the Year Award from MERETAIL ACADEMY 2011.The Top Performing Distributor and Best Marketing Contribution Award for Redington Saudi Arabia from HP.Best Networking Distributor of the Year in the Network Innovation Awards 2011 organized by ITP.Best Partner Excellence Distributor Award at the Reseller Middle East Awards 2011. ESSN Distributor of the year – Redington Value in the HP Middle East Channel Awards Nite 2011.The Best Distributor Award in the Sonicwall Partner Summit.The Outstanding Sales Performance Award – Africa from APC.The Best Growth Initiative by a Distributor by Channel Middle East Awards 2012.Best Partner Excellence Distributor Award at the Reseller Middle East Awards 2011 at the Westin, Dubai.The Outstanding Distributor Award for the third consecutive year from Imation.Best Networking Value Added Distributor in the Network Middle East Awards.Best After Sales from VAR Choice of Channel – 2011Champion distributor of the year VAR Choice of Channel – 2011Middle East and North Africa Distributor of the Year – EMEA Channel Academy Awards 2012 HBN Distributor of the year Award from APCThe Outstanding Sales Performance Award from APC Disti meet in Malaysia.Business Development Initiative of the Year Award 2011from APCBest Distributor Award for East & Southern Africa LSU - at the Nokia MEA Partner ConferenceRanked No.1 in the 2012 Power List by Channel Middle East Magazine
D&B Award for Corporate Excellence at the Rolta Corporate Awards 2011

Registered Offi ce:
Redington (India) LimitedSPL Guindy House
95, Mount Road, Guindy, Chennai - 600 032.
Tel : + 91 44 4224 3353 / 3028 7901
Fax : +91 44 2235 2790
www.redingtonindia.com
desig
n a
nd
layo
ut
at
STA
MPA
, chennai (
info
@sta
mp
a.c
o.in
)
p
rinte
d a
t N
agara
j and
Co. P
vt L
td., c
hennai
1 CLOSE