Bridging scales from molecular simulations to classical thermodynamics: density functional theory of...
20
This content has been downloaded from IOPscience. Please scroll down to see the full text. Download details: IP Address: 93.180.53.211 This content was downloaded on 06/02/2014 at 14:32 Please note that terms and conditions apply. Bridging scales from molecular simulations to classical thermodynamics: density functional theory of capillary condensation in nanopores View the table of contents for this issue, or go to the journal homepage for more 2003 J. Phys.: Condens. Matter 15 347 (http://iopscience.iop.org/0953-8984/15/3/303) Home Search Collections Journals About Contact us My IOPscience
Transcript of Bridging scales from molecular simulations to classical thermodynamics: density functional theory of...

This content has been downloaded from IOPscience. Please scroll down to see the full text.
Download details:
IP Address: 93.180.53.211
This content was downloaded on 06/02/2014 at 14:32
Please note that terms and conditions apply.
Bridging scales from molecular simulations to classical thermodynamics: density functional
theory of capillary condensation in nanopores
View the table of contents for this issue, or go to the journal homepage for more
2003 J. Phys.: Condens. Matter 15 347
(http://iopscience.iop.org/0953-8984/15/3/303)
Home Search Collections Journals About Contact us My IOPscience

INSTITUTE OF PHYSICS PUBLISHING JOURNAL OF PHYSICS: CONDENSED MATTER
J. Phys.: Condens. Matter 15 (2003) 347–365 PII: S0953-8984(03)53179-4
Bridging scales from molecular simulations to classicalthermodynamics: density functional theory ofcapillary condensation in nanopores
Alexander V Neimark1, Peter I Ravikovitch and Aleksey Vishnyakov
The Center for Modeling and Characterization of Nanoporous Materials, TRI/Princeton,601 Prospect Avenue, Princeton, NJ 08542, USA
E-mail: [email protected]
Received 9 September 2002, in final form 7 November 2002Published 13 January 2003Online at stacks.iop.org/JPhysCM/15/347
AbstractWith the example of the capillary condensation of Lennard-Jones fluid innanopores ranging from 1 to 10 nm, we show that the non-local densityfunctional theory (NLDFT) with properly chosen parameters of intermolecularinteractions bridges the scale gap from molecular simulations to macroscopicthermodynamics. On the one hand, NLDFT correctly approximates the resultsof Monte Carlo simulations (shift of vapour–liquid equilibrium, spinodals,density profiles, adsorption isotherms) for pores wider than about 2 nm. On theother hand, NLDFT smoothly merges (above 7–10 nm) with the Derjaguin–Broekhoff–de Boer equations which represent augmented Laplace–Kelvinequations of capillary condensation and desorption.
1. Introduction
In studies of nanoscale systems, researchers confront two fundamental problems:
(i) how to reconcile molecular simulations dealing with an ensemble of interacting moleculesconfined by potential fields and classical thermodynamics operating with homogeneousphases separated by suitably defined interfaces; and
(ii) how to establish the limits of applicability of macroscopic equations of capillarity.
In this paper, we address these problems with the example of capillary condensation of theLennard-Jones (LJ) fluid in nanopores with cylindrical LJ walls. We show that the non-localdensity functional theory (NLDFT) [1–3] with properly chosen parameters of intermolecularinteractions [4, 5] bridges scales from molecular simulations to classical thermodynamics:NLDFT approximates the results of Monte Carlo (MC) simulations [6] for pores wider than1 Author to whom any correspondence should be addressed.
0953-8984/03/030347+19$30.00 © 2003 IOP Publishing Ltd Printed in the UK 347
348 A V Neimark et al
about 2 nm and, in turn, can be approximated by the macroscopic Derjaguin–Broekhoff–deBoer (DBdB) equations [7–9] for pores wider than 7–10 nm. Thus, the density functionaltheory, which operates with inhomogeneous phases characterized by coarse-grained densities,provides a reasonable compromise between the discrete approach of molecular simulationsand the homogeneous representation of classical thermodynamics.
The paper is organized as follows. In section 2 we describe the phenomenon of capillarycondensation in nanopores, present instructive experimental examples, and discuss generalproblems of experimental observations and theoretical analyses of metastable states andhysteretic phase transitions inherent to confined fluids. Special attention is paid to the role ofconstraints in the thermodynamics of hysteresis and to the specifics of phase equilibrium andcriticality. In section 3, we discuss MC simulations of capillary condensation and focus on thegauge cell MC method [6, 10] designed for simulations of multiple metastable and labile statesunder appropriate constraints. In section 4, we present the canonical ensemble version of theNLDFT model of capillary condensation. In section 5, we compare the NLDFT results with theMC simulation data. Good agreement is found for sorption isotherms, density profiles, pointsof condensation transitions, and spinodals. A comparison of the NLDFT and MC results withthe macroscopic Laplace–Kelvin and DBdB equations is made in section 6. In section 7, wedemonstrate correlations with experimental data. Final conclusions are formulated in section 8.
2. Experimental specifics of capillary condensation. What do we want to understand?
Capillary condensation of vapours in pores of solids represents a prominent example of phasetransitions in confined fluids. When a porous solid is exposed to the vapour of a wetting fluid,the latter condenses in pores at a vapour pressure lower than the saturation pressure at the giventemperature. The pressure of condensation depends on the liquid–vapour interfacial tension,the adhesion interaction between the solid and the fluid, and the pore geometry, its size andshape. Capillary condensation is usually characterized by a step in the adsorption isotherm. Inmaterials with a uniform pore size distribution, the capillary condensation step is notably sharp,as exemplified by the adsorption of vapours on ordered mesoporous molecular sieves templatedon regular surfactant or block-copolymermesophases. In figure 1 we present a typical exampleof argon adsorption at its boiling temperature 87 K on a series of MCM-41-type samplespossessing regular arrays of cylindrical channels of different diameters [11, 12]. In pores widerthan about 5 nm,capillary condensation is associated with an apparent hysteresis: as the vapourpressure decreases, the desorption occurs at a pressure lower that the pressure of condensation.Everett [13] has named this irreversible behaviour a permanent hysteresis, emphasizing thatthe hysteresis loop is reproducible in adsorption experiments performed with a sufficientequilibration time and does not depend on the number of repeatable sorption–desorptioncycles. Here, we are dealing with long-living metastable states separated from the stablestates by insurmountable, at given experimental conditions, energy barriers. The permanenthysteresis takes place when the observation time is much larger than the time of relaxationto a given metastable state and is much smaller than the characteristic time of nucleationof the stable phase. This situation is typical for confined fluids which are characterized bymultiple equilibrium states, metastability, and hysteretic phase transformations [14]. Indeed,the constraints imposed by confinement reduce the level of thermal density fluctuations, sothe nucleation is severely suppressed and the system remains in a metastable state over theexperimentally ‘infinite’ time. As the pore size decreases, the experimental hysteresis loopgradually narrows, and finally disappears for pores smaller than about 4 nm.
According to a traditional viewpoint [15, 16], the disappearance of hysteresis indicatesthe critical conditions of capillary condensation as the first-order phase transition and thus

Bridging scales: DFT of capillary condensation 349
0
15
30
45
60
75
90
105
0 0.2 0.4 0.6 0.8 1P/P0
Ad
sorp
tio
n, m
mo
l/cm
3
3.1 nm
3.6 nm
4.4 nm
4.0 nm
5.1 nm
5.8 nm
Figure 1. Experimental adsorption and desorption isotherms of Ar at 87 K on a series of mesoporousmolecular sieves with cylindrical pores of characteristic diameter 3.1, 3.6, 4.0, and 4.4 nm [11],and 5.1 and 5.8 nm [73].
determines the shift of the critical temperature for a pore from the bulk value Tc to a lowertemperature Tcc, which is called the pore critical temperature. The smaller the pore, the lowerthe pore critical temperature Tcc. Consequently, during adsorption isothermal measurementsat a given subcritical temperature T , liquid–vapour phase separation is possible only in poreswider than the critical pore size Dcc. The critical pore size Dcc decreases as the temperaturedecreases. Thus, under this assumption the critical pore size Dcc for argon adsorption at 87 Kfrom experimental data given in figure 1 is estimated as ∼4 nm.
However, reliable experimental verifications of the capillary condensation theory fornanopores were not available prior to the early 1990s due to the lack of materials with awell characterized pore structure. Theoretical hypotheses and conclusions were supported byexperiments with silica gels, porous glasses, and other systems with a disordered pore structurethat prevented an unambiguous theoretical treatment. The discovery in 1992 [17, 18] of theordered mesoporous molecular sieves of MCM-41 type has opened a unique opportunity totest theoretical predictions. MCM-41-type materials possess a uniform system of cylindricalchannels of controlled diameter, which can be evaluated independently. These materials areconsidered now as the most suitable references for adsorption measurements.
The first experiments of Ravikovitch et al [4] with reference MCM-41 samples have shownthat the disappearance of hysteresis cannot be explained as the achievement of the criticalconditions of capillary condensation as the first-order phase transition. It was demonstratedthat at elevated temperatures and/or in sufficiently narrow pores the capillary condensationin open-ended cylindrical pores occurs reversibly without a hysteresis. This concept waselaborated by Morishige and Shikimi [19] who, in addition to the pore critical temperature Tcc

350 A V Neimark et al
and the critical pore size Dcc, introduced the hysteresis critical temperature Tch, which is lowerthan Tcc, and the hysteresis critical pore size Dch, which is larger than Dcc. The authors [19]proposed a special protocol for experimental determination of the critical temperature ofcapillary condensation as the first-order phase transition, Tcc, and showed that it exceedsthe hysteresis critical temperature, Tch. For example, for Ar sorption on a sample of MCM-41 material with channels of 2.2 nm, the hysteresis critical temperature and the pore criticaltemperature were estimated as Tch ≈ 62 K and Tcc ≈ 98 K [19]; see also the latest paperof Morishige and Masataka [20]. Thus, it is implied that for a given fluid–solid pair, threeregimes of sorption are distinguished experimentally, depending on the temperature T and thepore diameter D:
(i) at T > Tcc, D < Dcc, adsorption occurs at supercritical conditions without a stepwisetransition from a low-density vapour-like phase to a high-density liquid-like state;
(ii) at Tch < T < Tcc, Dcc < D < Dch, a stepwise capillary condensation transition takesplace reversibly without hysteresis;
(iii) at Tc < T < Tch, Dch < D, capillary condensation exhibits hysteresis.
These three regimes of sorption were qualitatively confirmed in MC simulations (see section 5below).
To avoid possible misinterpretations of the notions of the pore critical temperature Tcc andthe hysteresis critical temperature Tch, let us recall that we study vapour–liquid transformationin essentially finite-volume systems and the experiments and simulations that we analyseare performed over a finite time. There is neither true phase equilibrium in terms of thethermodynamic limit, nor a true critical point with the infinite correlation length. By phaseequilibrium in a finite system we mean the conditions at which there exist two equilibrium statesof different density (vapour-like and liquid-like) with equal grand thermodynamic potentials.Consequently, by the pore critical temperature Tcc we mean the temperature at which thesetwo states merge and above which there exists just one ‘supercritical’ equilibrium state. Inthis paper, we consider phase transitions in cylindrical pores that may seem to be in apparentcontradiction with the Landau theorem [21], which forbids true phase transitions in one-dimensional systems with short-range interactions. Here, we deal with cylindrical pores offinite length, and as shown in [6] and recently in [22],even when the ratio L/D of the pore lengthto the pore diameter is large (for pores in MCM-41 materials, L/D ∼ 103), this geometrycannot be treated as quasi-one-dimensional since at T < Tcc the equilibrium concentrationof interfaces, which is reciprocal to the exponent of the interfacial free energy, is extremelylow—many orders of magnitude less than practically relevant values (L/D)−1. Near Tcc, thisstrong inequality is no longer valid, and equilibrium configurations in long pores consist ofsequences of liquid bridges and bubbles, as shown in numerous simulations of phase separationin cylindrical geometry [23–28]. However, at T < Tcc this domain structure was not observedin MC simulations of quite long cylindrical capillaries of L/D = 36 [22].
To study metastable states and hysteretic phase transformations one has to control the levelof allowed fluctuations by imposing certain constraints on the system under consideration. Inmacroscopic thermodynamic theories and mean-field approximations of statistical mechanicssuch as the density functional theories [15], which operate with a finite number of averagedquantities and functions, the constraints are enforced explicitly. In particular, if we restrictthe probe functions in the canonical ensemble density functional theory to spatially uniformdistributions possessing a symmetry compliant with the confinement geometry, the solution ofthe Euler equation at the fixed averaged density gives a continuous trajectory of states in theform of the adsorption isotherm which, in the coordinates density versus chemical potential orpressure, has a sigmoid shape similar to that of the van der Waals equation of state.

Bridging scales: DFT of capillary condensation 351
3. Monte Carlo simulations of capillary condensation. The gauge cell method
In molecular simulations, the metastable states can be stabilized by restricting, in one wayor another, the sampling in order to avoid non-uniform configurations which may give riseto the development of critical nuclei. Following the pioneering papers of Penrose andLebowitz [29, 30], several attempts were made to formulate the statistical mechanics ofmetastable phases using restricted ensembles [31–33]. MC simulations in restricted ensembleswere performed for modelling metastable states in bulk fluids [31]. We have recently developeda new method for MC simulations of confined fluids in the region of metastability [6, 10]. In thismethod, called the gauge cell method, the density fluctuations are suppressed by consideringthe finite-volume system under study in equilibrium with a reference gauge cell which has alimited capacity. The level of density fluctuations in the system is controlled by the capacity ofthe gauge cell. In the limiting cases of infinitely large and infinitesimally small capacities, thegauge cell method corresponds respectively to the conventional schemes of grand canonicalensemble and canonical ensemble simulations.
In [6, 10], the gauge cell method was applied to study capillary condensation of LJ fluids incylindrical nanopores with wetting walls. The simulations were performed with the parametersof fluid–fluid and fluid–solid interactions chosen to mimic adsorption of argon and nitrogenin cylindrical pores of siliceous mesoporous molecular sieves of MCM-41 type. For a seriesof pores of different diameters, we have determined the adsorption isotherms, the density ofadsorbed fluid as a function of the chemical potential or of the vapour pressure. The constraintsimposed on the system ensured that the states constructed in simulations corresponded tolaterally uniform configurations. For relatively wide pores, the adsorption isotherm forms acontinuous sigmoid-shaped trajectory similarly to the van der Waals loop typical for a first-order transition.
The sorption isotherm constructed, a typical example of which is presented in figure 2, iscomprised of three parts:
(a) the adsorption branch ABSV corresponds to uniform adsorption films on pore walls; theselow-density states are called vapour-like since the density in the pore centre is close to thebulk vapour density;
(b) the desorption branch HFSL corresponds to the condensed fluid; these states are calledliquid-like since their density is close to the bulk liquid density;
(c) the backward trajectory SVDSL consists of states which would be unstable if the constraintsimposed were removed.
The chemical potential µe of the equilibrium transition between the vapour-like B and liquid-like E states is determined by the thermodynamic integration in accord with the Maxwell rule:area BSVB equals area FSLD. The chemical potential µe of the equilibrium transition separatesstable and metastable states. At µ < µe, the adsorption branch AB corresponds to the stableadsorption films while the desorption branch FSL corresponds to the metastable stretched liquid.The turnover point SL is the liquid-like spinodal, which represents the limit of mechanicalstability of a stretched condensed liquid. At µ > µe, the desorption branch HF correspondsto the stable condensed liquid while the adsorption branch BSV corresponds to the metastableadsorption films. The turnover point SV is the vapour-like spinodal, which represents the limitof mechanical stability of metastable adsorption films. In an unconstrained system, the pointsof spontaneous condensation and desorption are determined by the nucleation barriers at givenexperimental conditions.
For comparison, in the same figure we present the results of GCMC simulations: pointC corresponds to the spontaneous condensation and point E corresponds to the spontaneous

352 A V Neimark et al
0.1
0.2
0.3
0.4
0.5
0.6
0.7
0.8
-10.5 -10.25 -10 -9.75 -9.5
GCMC
gauge cell
A
B
C
D
SV
SL
EF
G H
3
Figure 2. Nitrogen adsorption isotherms for a 6.9 nm cylindrical pore at 77.4 K (kT/ε = 0.762)calculated using the GCMC and gauge cell methods [10]. Vertical lines show the vapour–liquid coexistence in pores calculated with the gauge cell method (bold dashed line) and thethermodynamic integration technique of Peterson and Gubbins [74] (thin solid curve). Points:B—the vapour-like state at vapour–liquid coexistence; C—the limit of stability of the vapour-likephase in the GCMC method (the fluid undergoes a spontaneous transition to point G); SV—thevapour-like spinodal; D—an unstable state, SL—the liquid-like spinodal; E—the limit of stabilityof the liquid-like phase in the GCMC method (the fluid undergoes a spontaneous transition topoint A); F—the liquid-like state at vapour–liquid coexistence; H—the stable liquid-like state atvapour–liquid coexistence for bulk fluid.
evaporation. While the metastable states in the vicinities of spinodals, CSV and ESL, werenot accessible in GCMC simulations, the results of the gauge cell and GCMC simulationsare in remarkable agreement. The dotted line indicates the point of equilibrium transitiondetermined from the hysteretic GCMC isotherm determined by the Peterson–Gubbins methodof thermodynamic integration [14], circumventing the spontaneous transitions through thesupercritical region.
In the simulations considered below, the number of molecules in the pore cell variedfrom 2000 in the largest pore to 300 in the smallest. The number of molecules in the gaugecell was 30–60 in all simulations. In the simulation conditions, the fluid in the gauge cellbehaved as an ideal gas. Thus, since the fluctuations in the pore cell and in the gauge cell arecoupled, the variations of the number of molecules in the pore cell did not exceed about 2%.In these conditions, the average values of thermodynamic quantities obtained in the gaugecell simulation were indistinguishable from those in the CEMC method, and also from theresults of the GCMC method in the case of hysteresis at T < Tch, as illustrated in figure 2.The discrepancies between the results for different ensembles identify the regime of reversiblecondensation at Tch < T < Tcc.
As shown in [6], MC simulations quantitatively describe the experimental sorptionisotherms for reference nanoporous materials such as those shown in figure 1. However,

Bridging scales: DFT of capillary condensation 353
detailed MC simulations for larger pores require prohibitively long computation times. At thesame time, one expects that for sufficiently wide pores the capillary condensation should followthe macroscopic laws of capillarity, such as Laplace and Kelvin equations, which becomeprogressively more inaccurate as the pore diameter decreases to the nanometre range [4, 34–38]. In order to reconcile the molecular simulations and the macroscopic theory of capillarity,we apply the NLDFT in the canonical ensemble.
4. Canonical ensemble density functional theory
The DFT implies that the Helmholtz free energy, F , of a confined fluid is represented as afunctional of the spatially varying fluid density ρ(r). Introduction of the spatially varyingdensity of molecules seems to be a reasonable compromise between the abrupt densitychanges in classical thermodynamics and the discrete enumeration of fluctuations in molecularsimulations. Several versions of DFT for inhomogeneous fluids were formulated [3, 39–42].They differ in how they account for intermolecular correlations. The basic formulations of theDFT of inhomogeneousfluids can be found in [1, 43, 44]. However, almost any version of DFTtreats attractive interactions in a mean-field approximation, whose validity for a quantitativedescription of a given phenomenon can be justified only by comparing with direct molecularsimulations.
Different DFT models were proposed for studies of vapour–liquid equilibrium, wettingand layering transitions, structure of simple fluids, and single-component and binary mixtureadsorption (see [1, 14, 45] for reviews). In this paper we employ the NLDFT with the functionaldeveloped by Tarazona [2, 3] and known as the smoothed density approximation (SDA). Thisversion of NLDFT was used efficiently for studying adsorption in model pores [46, 47]. Inparticular, in our earlier papers we have shown that this model, implemented for a LJ fluidconfined by solid layers of immobile LJ centres with suitably chosen parameters of fluid–fluidand fluid–solid intermolecular potentials, gives good agreement with experimental data oncapillary condensation of argon and nitrogen in cylindrical [4, 35, 36, 48] and spherical [38]pores of mesoporous molecular sieves, and adsorption of nitrogen, methane, krypton, and othergases in slit-shaped pores of carbons [49–51]. The NLDFT model constitutes a basis of the newmethods for pore size distribution analysis of nanoporous materials [34, 36, 37, 46, 47, 51].
Conventional versions of the DFT imply minimization of the grand thermodynamicpotential with respect to the fluid density within fixed solid boundaries at given temperatureT and chemical potential µ [1]. They correspond to the grand canonical (µ–V –T ) ensemble.In order to generate continuous isotherms, which, similarly to the gauge cell MC simulations(figure 2), trace stable, metastable, and labile states in a van der Waals manner, we apply theDFT in the canonical (N–V –T ) ensemble. While the canonical ensemble DFT was efficientlyused for modelling nucleation in the bulk fluids [52], its application to capillary condensationwas suggested first in [53]. Several lattice and off-lattice versions of DFT in the canonicalensemble have been reported and discussed recently [54–62].
We consider a closed system consisting of N molecules of fluid confined in a volume Vsurrounded by solid walls. The system is embedded in a bath of constant temperature T . Thefluid is modelled as a soft-sphere fluid with a given pairwise attractive potential, �ff(r1, r2).The fluid–solid interactions are modelled by a given spatially varying external potential,�sf(r).Equilibrium states of the closed system are defined by minimization of the Helmholtz freeenergy functional at constant N , V , and T . The DFT implies that the intrinsic Helmholtz freeenergy, Fint , depends entirely upon given fluid–fluid interaction potential(s), �ff(r1, r2), and isrepresented as a functional of the spatially varying fluid density ρ(r). The external solid–fluidinteraction potential, �sf(r), does not affect the expression for intrinsic Helmholtz free energy

354 A V Neimark et al
functional, Fint[ρ(r), �ff ], and makes an additive contribution, Fext[ρ(r), �sf ], to the totalHelmholtz free energy, F :
F[ρ(r)] = Fint[ρ(r),�ff ] + Fext[ρ(r),�sf ]. (1)
Equilibrium states in the canonical ensemble are obtained by minimization of theHelmholtz free energy functional (1) with respect to the fluid density ρ(r), provided thatthe total number of molecules is a given constant N :∫
Vρ(r) dr = N. (2)
To find a solution of this conditional extremum problem,one has to solve the Euler equationfor the functional
�[ρ(r)] = F[ρ(r)] − µ
∫V
ρ(r) dr. (3)
Here, an additional unknown parameter, µ, is introduced. The Euler equation for thefunctional (5) reads
µ = δF
δρ. (4)
Here, δ/δρ denotes the functional derivative. The right-hand side of the equation (4)depends on the representation employed for the intrinsic Helmholtz free energy functional,Fint[ρ(r)]. Equations (4) and (2) represent a closed system for determination of twounknowns, a function ρ(r) and a constant µ. The solution gives the equilibrium density profileρ(r, N, V , T ) and the value of µ(N, V , T), which turns out to be equal to the chemical potentialof the corresponding N, V , T state. Hence, the functional �[ρ(r, N, V , T ), µ(N, V , T )]is equal to the grand potential. Note that the system does not imply a unique solution atgiven N [63]. The chemical potential obtained, µ, is not necessarily a single-valued functionof N . In the region of a phase transition there may exist multiple equilibrium states andan additional analysis is required to select between stable, metastable, and labile states.Constraints imposed on trial functions reduce the number of admissible states. For example,while considering capillary condensation in cylindrical channels we restrict ourselves tolaterally uniform symmetric configurations assuming that the fluid density is one-dimensionaland depends on the distance to the pore centre. Because of this, non-uniform equilibriumconfigurations such as menisci, liquid bridges, and bubbles are ruled out of consideration.Typically, the functions N(µ) determined within constraints of uniformity consistent with thechannel symmetry are non-monotonic and exhibit S-shaped swings in the regions of first-orderphase transitions.
It should be noted that the CEDFT procedure described above is not rigorously consistentwith the statistical mechanics foundations behind the density functional theory [64, 65]. Weapply in CEDFT the same free energy functional as in GCDFT, restricting the density to a givenconstant. This procedure gives exactly the same equilibrium states as GCDFT and provides ananalytical extension over the region of labile states, thus spanning the gap between equilibriumadsorption and desorption isotherms. Indeed, in finite-volume systems the radial distributionfunctions in the canonical and grand canonical ensembles differ [66], as well as the mean-density profiles in the CE and GC for the states of equal density. To address this problem,Gonzalez et al [58, 60, 62] suggested a rationale for recalculating the GC density profiles astheir CE counterparts. Recently, White et al [61] augmented the free energy functional ofGCDFT to provide consistent results in CEDFT. Hernando and Blum [58] and Hernando [62]attempted to construct a rigorous approach to CEDFT based on a hierarchy of correlation anddistribution functions. However, appreciable deviations between CEDFT and GCDFT were

Bridging scales: DFT of capillary condensation 355
found in extreme confinements such as a spherical pore, which can accommodate just a fewguest molecules [54, 60, 61]. The smallest confinement considered here is significantly larger,so the approach that we use is justified. The extension of the mean-field density functionalover the region of labile states naturally produces continuous loops of van der Waals type.
5. Capillary condensation of Ar in cylindrical pores. Comparison of DFT and MCresults
As an example of CEDFT calculations, we present in figure 3 the capillary condensationisotherms of Ar in a series of cylindrical pores mimicking pore channels in MCM-41mesoporous molecular sieves. The isotherms are presented in the coordinates adsorptionN versus relative pressure P/P0. Calculations were performed at 87 K for internal diametersranging from 1.43 to 100 nm. We used Tarazona’s SDA representation of the Helmholtz freeenergy [2, 3] with parameters for fluid–fluid and solid–fluid interaction potentials, which werevalidated in our previous papers [11]. A detailed description of the model can be found in [5].The density profiles were determined by solving the Euler equation (4) with the condition (2)by means of the Broiden method [67]. It is important to note that the fluid–fluid interactionparameters were chosen to give the best fit to the bulk equilibrium experimental data includingthe vapour and liquid densities and also the liquid surface tension at the given temperature.They differ somewhat from the fluid–fluid parameters used in MC simulations which in turnprovided the best fit to the bulk equilibrium data. The fluid–solid interaction parameters werechosen to reproduce a reference Ar isotherm for non-porous silica. For a justification of theparameters employed, see [5].
The isotherms presented in figure 3 correspond to the pore sizes for which we performedMC simulations earlier [6]. The pore dimensions in figure 3 represent internal diameters ofchannels. The results of the GCMC and gauge cell MC simulations are given for comparison.For pores wider than 3 nm (figure 3, right panel), the NLDFT and MC isotherms agreeremarkably well. NLDFT isotherms reproduce well the density of condensed fluid on thedesorption branch HSL, the thickness of an adsorbed layer on the adsorption branch ASV,and also the density of the labile states on the unstable backward branch SLSV. Figure 4demonstrates a typical example of almost identical density profiles determined by NLDFT andconstructed in MC simulations. The positions of equilibrium transitions and vapour-like aswell as liquid-like spinodals coincide within an experimentally negligible error; see figure 5.In figure 6 we show plots of the grand thermodynamic potential along the NLDFT and MCisotherms for 5.54 nm pores. The NLDFT grand thermodynamic potential was determineddirectly from equation (3), while the MC grand thermodynamic potential was calculated bythermodynamic integration along the continuous MC isotherm. The intersection point E infigure 6, which corresponds to the merging points B on the adsorption branch and F on thedesorption branch (see figures 2 and 3), indicates the equality of the grand thermodynamicpotentials of vapour-like and liquid-like states at equilibrium. The equilibrium chemicalpotential, µe, at point E can be defined from Maxwell’s rule of equal areas by integratingalong the S-shaped isotherm in coordinates N versus µ between the coexisting states:∫ NF(µe)
NB(µe)
µ dN = µe(NF − NB). (5)
The results of GCMC simulations are given in the same plots (figures 2, 3). Since inGCMC simulations, fluid within the pore is considered as an open system without imposingspecial constraints on density fluctuations, adsorption and desorption trajectories of GCMCstates form a hysteresis loop with abrupt capillary condensation and desorption transitions. In

356 A V Neimark et al
Figure 3. Argon adsorption isotherms for cylindrical pores at 87.3 K obtained using MC simulationsand NLDFT. Vertical solid lines indicate spontaneous condensation and desorption in GCMCsimulations. The thick solid vertical line shows the vapour–liquid coexistence in the pores obtainedusing the gauge cell method; the vertical broken line shows the vapour–liquid equilibrium obtainedfrom NLDFT.
Figure 4. Local density profiles of Ar in an 11 σ (3.4 nm internal diameter) cylindrical pore at87.3 K and P = P0.
wider pores, these spontaneous transitions occur near the spinodal points. As the pore sizedecreases, the hysteresis loop of GCMC states narrows and disappears for a ∼2 nm pore, which

Bridging scales: DFT of capillary condensation 357
0
0.1
0.2
0.3
0.4
0.5
0.6
0.7
0.8
0 1 2 3 4 5 6 7 8
Pore diameter, [Å]
P/P
0
NLDFT, vapour spinodalNLDFT, equilibriumNLDFT, liquid spinodalMC, vapour spinodalMC, equilibriumMC, liquid spinodal
Figure 5. The conditions of spinodal condensation, desorption, and vapour–liquid coexistence ofargon in a series of cylindrical pores at 87.3 K obtained using NLDFT and MC simulations.
-0.4
-0.35
-0.3
-0.25
-0.2
-0.15
-0.1
-0.05
0.2 0.3 0.4 0.5 0.6 0.7P /P 0
kTÅ
CE DFT
gauge MC
E
SL
SV
Figure 6. Isotherms of the grand potential of argon in a 5.54 nm cylindrical pore at 87.3 K obtainedfrom thermodynamic integration along the MC and NLDFT adsorption isotherms. The intersectionof the adsorption and desorption branches (point E) determines the vapour–liquid equilibrium.
is still subcritical, since both the gauge cell MC simulation and the CEDFT method distinguishlow-density (adsorption, or vapour-like) and high-density (desorption, or liquid-like) states.
358 A V Neimark et al
For supercritical pores, narrower than ∼1.5 nm, the MC isotherm is reversible, regardless tothe simulation method.
Thus, in GCMC simulations, which mimic sorption from a vapour reservoir, we observethe same qualitative picture of three regimes of sorption as that observed experimentally:hysteretic condensation–evaporation in pores of D > Dch ≈ 2 nm, supercritical sorption inpores of D < Dcc ≈ 1.5 nm, and reversible condensation in intermediate pores. In the lattercase, the GCMC isotherm is rounded and, as shown in [6], the system during the simulationrun jumps up and down, overcoming nucleation barriers from the low-density state to the high-density state. Note that while the value of the critical pore size Dcc is an objective quantity, thecritical size of the hysteresis Dch depends on the length of the simulation run (or the time ofobservation): the longer the run, the larger the probability of nucleation—and, consequently,Dch increases. In the mathematical limit of infinite time of observation, there is no room forhysteresis in a finite size system at all. A quantitative analysis of spontaneous transitions andhysteresis in open systems is related to the nucleation phenomena [6] and is beyond the scopeof this paper.
From figures 3–6, we conclude that CEDFT gives, in general, good agreement with thegauge cell and GCMC simulations for pores wider than about 3 nm. For smaller poresdeviations become progressively more pronounced as expected. However, even for poresas small as 1–2 nm, the characteristic features of capillary condensation are still captured byCEDFT quite well. Note that the DFT adsorption isotherms feature the consecutive formationof adsorption layers associated with sigmoid swings indicating layering transitions. Thesetransitions are common artefacts of the complete neglect of local density fluctuations in DFT.While these layering transitions make DFT isotherms visibly different from MC isotherms,the quantitative differences in integral parameters are negligible. Also, while the positions ofspinodals in MC simulations and DFT practically coincide, DFT produces states of smallerdensity and larger compressibility in the vicinity of the liquid-like spinodal. This leads toexaggeration of the so-called superspinodal behaviour [63] associated with the existence ofmultiple states of equal average density which are seen in the DFT isotherm for the 5.54 nmpore.
6. Comparison of DFT and MC results with macroscopic capillary condensation theory
The classical scenario of capillary hysteresis [8, 13, 68, 69] in cylindrical geometry impliesthat the equilibrium capillary condensation and desorption are associated with the formationof a hemispherical meniscus in the channel while the spontaneous capillary condensation isassociated with the formation of a cylindrical liquid film on the channel wall. The conditions ofequilibrium and spontaneous condensation are given by the Kelvin–Cohan (KC) equations [68]:
RT ln(Pe/P0) = − 2γ VL
RP − he(6)
RT ln(Pc/P0) = − γ VL
RP − hc. (7)
Here Pe/P0 and Pc/P0 are the relative pressures of equilibrium condensation/desorption andspontaneous condensation, respectively; γ and VL are the surface tension and the molar volumeof the bulk liquid; RP is the pore radius; and he and hc are the adsorption film thicknesses atthe relative pressures Pe/P0 and Pc/P0 respectively.
Let us return to figure 5. There are several features worth noticing. As the pore sizeincreases, the line of liquid-like spinodal saturates at the value corresponding to the spinodalof the bulk liquid. DFT calculations performed for larger pores (up to 50 nm) show that
Bridging scales: DFT of capillary condensation 359
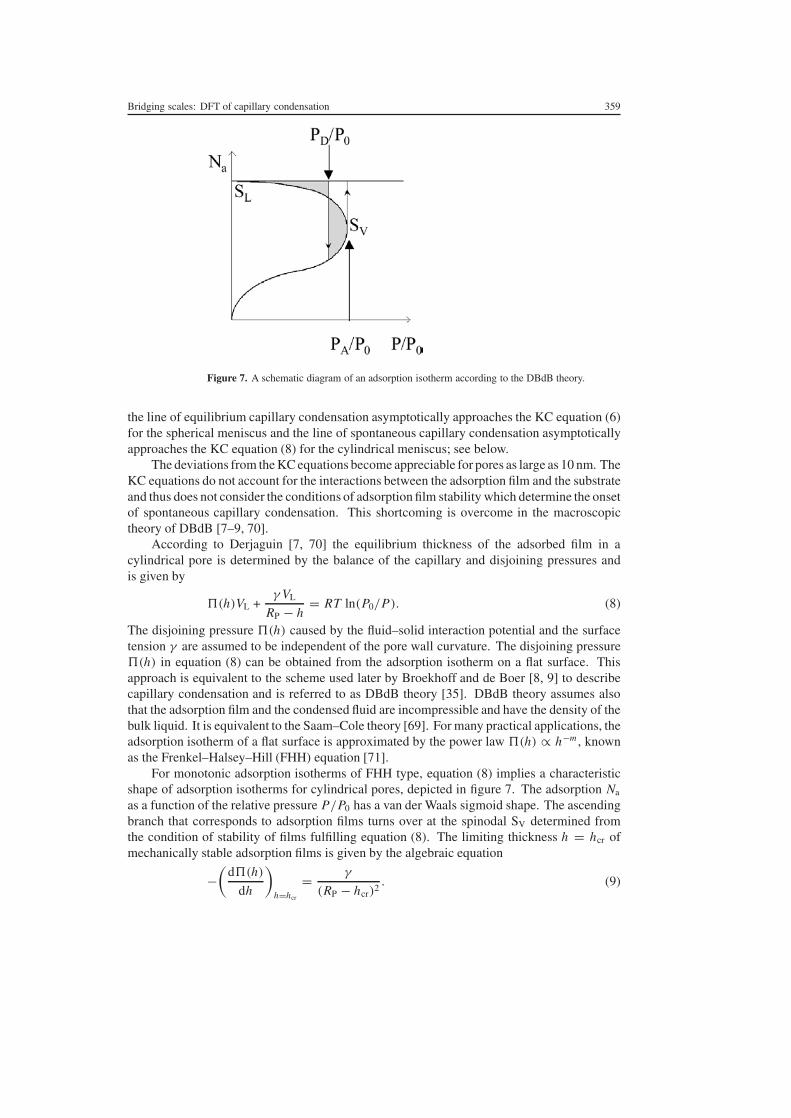
Figure 7. A schematic diagram of an adsorption isotherm according to the DBdB theory.
the line of equilibrium capillary condensation asymptotically approaches the KC equation (6)for the spherical meniscus and the line of spontaneous capillary condensation asymptoticallyapproaches the KC equation (8) for the cylindrical meniscus; see below.
The deviations from the KC equations become appreciable for pores as large as 10 nm. TheKC equations do not account for the interactions between the adsorption film and the substrateand thus does not consider the conditions of adsorption film stability which determine the onsetof spontaneous capillary condensation. This shortcoming is overcome in the macroscopictheory of DBdB [7–9, 70].
According to Derjaguin [7, 70] the equilibrium thickness of the adsorbed film in acylindrical pore is determined by the balance of the capillary and disjoining pressures andis given by
�(h)VL +γ VL
RP − h= RT ln(P0/P). (8)
The disjoining pressure �(h) caused by the fluid–solid interaction potential and the surfacetension γ are assumed to be independent of the pore wall curvature. The disjoining pressure�(h) in equation (8) can be obtained from the adsorption isotherm on a flat surface. Thisapproach is equivalent to the scheme used later by Broekhoff and de Boer [8, 9] to describecapillary condensation and is referred to as DBdB theory [35]. DBdB theory assumes alsothat the adsorption film and the condensed fluid are incompressible and have the density of thebulk liquid. It is equivalent to the Saam–Cole theory [69]. For many practical applications, theadsorption isotherm of a flat surface is approximated by the power law �(h) ∝ h−m , knownas the Frenkel–Halsey–Hill (FHH) equation [71].
For monotonic adsorption isotherms of FHH type, equation (8) implies a characteristicshape of adsorption isotherms for cylindrical pores, depicted in figure 7. The adsorption Na
as a function of the relative pressure P/P0 has a van der Waals sigmoid shape. The ascendingbranch that corresponds to adsorption films turns over at the spinodal SV determined fromthe condition of stability of films fulfilling equation (8). The limiting thickness h = hcr ofmechanically stable adsorption films is given by the algebraic equation
−(
d�(h)
dh
)h=hcr
= γ
(RP − hcr)2. (9)

360 A V Neimark et al
In the DBdB method it is assumed that, as the vapour pressure increases, condensationoccurs spontaneously when the limit of stability of the adsorbed films is achieved, i.e. at thespinodal SV. Thus, the conditions of capillary condensation in an open-ended cylindrical poreare determined by the system of two equations (8) and (9).
The descending branch SVSL corresponds to unstable cylindrical films with a progressivelydecreasing internal radius. This branch merges with the desorption branch as the vapourpressure vanishes. The desorption branch is represented by a plateau at the bulk liquid densitydue to the assumption of fluid incompressibility. The behaviour of the isotherm at low pressureis obviously unphysical; however, this region does not contribute appreciably to the results ofthermodynamic integration for relatively wide pores.
Similarly to the classical KC scenario, desorption takes place at the equilibrium betweenthe condensed fluid and the adsorption film. The condition of equilibrium is determined fromthe equality of grand thermodynamic potentials, or the Maxwell rule (5). Thus, desorptionfrom an open-ended cylindrical capillary is determined by the condition of formation ofthe equilibrium meniscus given by the augmented Kelvin equation, known as the Derjaguinequation [7]:
RT ln(P0/P) = 2γ VL + 2VL(RP−he)
∫ RP
he(RP − h)�(h) dh
RP − he. (10)
Here, he is the thickness of the adsorbed film in equilibrium with the meniscus, given byequation (8).
In our previous paper [35], we showed that the NLDFT adsorption isotherm of a flatsurface can be approximated by the FHH equation in the region of polymolecular adsorption,and thus the effective disjoining pressure is given by
�(h) = RT
VL
K
hm. (11)
For our case study, Ar on silica, K = 73.17 and m = 2.665, with h in Å andVL = 34.66 cm3 mol−1, were chosen from the best fit of the NLDFT isotherm with theFHH equation [35].
Using equation (11) with the above parameters, we have determined the conditions ofspontaneous capillary condensation from equations (8) and (9),and the conditions of desorptionfrom equations (8) and (10). The results are presented in figure 8. The predictions of theDBdB theory smoothly merge with the NLDFT calculations for pores of 7–10 nm and larger.It is worth noting that the DBdB theory significantly extends the range of applicability ofmacroscopic theories compared with KC equations (1) and (2). However, the departure fromthe MC data for pores of 5 nm and smaller is quite appreciable. The macroscopic theory canbe further improved by taking into account the fluid compressibility and dependences of thesurface tension and the disjoining pressure on the pore wall curvature.
7. Correspondence of NLDFT results to experimental data
In a series of earlier publications [35–37], we demonstrated with various examples of capillarycondensation of argon and nitrogen in open-ended cylindrical pores of mesoporous molecularsieves of MCM-41 [17, 18] and SBA-15 [72] types that the capillary condensation anddesorption isotherms predicted by NLDFT agree remarkably well with experimental hystereticdata for pores wider than ∼5 nm. For pores smaller than ∼4 nm, experimental isotherms arereversible and the position of capillary condensation is predicted by the condition of equilibriummeniscus formation, equation (5). For intermediate pores, ∼4–5 nm, the experimental

Bridging scales: DFT of capillary condensation 361
0
1
2
3
4
5
6
7
8
9
10
0 0.2 0.4 0.6 0.8 1
P/P0
Po
re d
iam
eter
, [n
m]
Monte Carlo (equilibrium)
Monte Carlo (condensation)
NLDFT (equilibrium)
NLDFT (spinodal condensation)
DBdB (equilibrium)
DBdB (condensation)
Figure 8. Bridging scales: capillary hysteresis of argon in cylindrical pores at 87.3 K. The pressuresof condensation and desorption predicted by the NLDFT, gauge cell method, and DBdB theory.
hysteresis loop is narrower than that predicted by NLDFT, yet the experimental and theoreticaldesorption branches are quite close.
These conclusions are illustrated in figure 9, where we collected available experimentaldata on N2 sorption on MCM-41 and SBA-15 types of material from different sources andcompared with the NLDFT predictions of spontaneous and equilibrium capillary condensationtransitions. The details of NLDFT calculations for this system were given in [11, 36, 37].To show the prominent departures from conventional equations, the predictions of KCequations (6) and (7) are also given.
8. Conclusions
We show that the NLDFT efficiently spans the gap between the molecular simulationsperformed at the scale below ∼5 nm and the macroscopic thermodynamic equations. Weapplied NLDFT in the canonical ensemble to generate continuous adsorption isotherms which,at subcritical conditions, form sigmoid curves of van der Waals type. Tarazona’s smooth densityapproximation was implemented to construct the free energy functional. The calculationswere carried out for a series of cylindrical pores from 1 to 100 nm. The fluid–fluid and solid–fluid interaction parameters were chosen to represent argon and nitrogen sorption on silica.Capillary condensation of argon at its boiling temperature was selected as a case study due to theavailability of MC data generated recently by the gauge cell MC method and also experimentaldata collected on reference mesoporous molecular sieves with uniform cylindrical pores.
The NLDFT isotherms agree remarkably well with the MC isotherms for pores widerthan ∼3 nm. The condensed fluid density and the positions of equilibrium transitions andspinodals coincide within an experimentally negligible error. The density profiles are almost

362 A V Neimark et al
1
10
100
0 0.2 0.4 0.6 0.8 1
P/Po
Po
re d
iam
eter
, [n
m]
NLDFT equilibrium transitionNLDFT spinodal condensationKelvin-Cohan, hemispherical meniscusKelvin-Cohan, cylindrical meniscusNeimark et al, 1998, no hysteresisCarrott et al, 2001, no hysteresisKruk et al, 1997, no hysteresis or DESKruk et al, 1997, ADSZhao et al, 1998, DESZhao et al, 1998, ADSLukens et al, 1999, DESLukens et al, 1999, ADSYue et al, 2000, DESYue et al, 2000, ADSKruk et al, 2001, DESKruk et al, 2001, ADSVan der Voort et al, 2002, DESVan der Voort et al, 2002, ADS
Figure 9. Relative pressures of the adsorption and desorption for N2 at 77 K in open cylindricalpores in comparison with the experimental data [11, 73, 75–79] on ordered MCM-41 and SBA-15nanoporous materials with cylindrical pores. Predictions of the macroscopic KC equation are alsoshown.
identical. Some deviations are found in the vicinity of the liquid-like spinodal; NLDFTliquid-like states are of lower density and larger compressibility. The overall behaviour of theisotherms in the regions of monolayer and multilayer formation is also quite good. However,the NLDFT isotherm exaggerates layering transitions producing artificial ‘first-order’ loops,whose contributions are luckily cancelled out during thermodynamic integration; thus theydo not affect the overall course of the grand thermodynamic potential. Surprisingly, thetwo methods produce quantitatively similar labile states on the unstable backward branch ofthe isotherm. For sufficiently wide pores, canonical ensemble NLDFT revealed a peculiarbehaviour: the existence of multiple states of equal density in the vicinity of the liquid-like spinodal. This observation was confirmed by MC simulations and is discussed in detailelsewhere [63]. For pores narrower than ∼3 nm, agreement between the theoretical andsimulated isotherms progressively worsens; however, the major features, such as the positionsof the equilibrium capillary condensation and spinodals, are captured satisfactorily even forpores as narrow as ∼2 nm.
The comparison of the results of GCMC simulations, which are performed withoutconstraints on density fluctuations, with the CEDFT and gauge cell MC data provides aqualitative description of three experimentally observed regimes of capillary condensation:

Bridging scales: DFT of capillary condensation 363
supercritical, reversible, and hysteretic. Indeed, similarly to the experimental observations forGCMC simulations of Ar sorption at 87.4 K, the hysteresis critical pore size Dch ≈ 2 nmexceeds the critical pore size Dcc ≈ 1.5 nm. While the critical pore size is determinedby the temperature, pore geometry, and fluid–solid interactions, and does not depend on theexperimental conditions, such as the observation time and the system size, the hysteresis criticalpore size does depend on the scales of time and size which determine the level of admissiblefluctuations and, consequently, the probability of nucleation. Thus, it is not surprising thatsince the level of fluctuations in experiments is drastically larger than in GCMC simulations,the experimental hysteresis critical pore size estimated as ∼4 nm significantly exceeds thehysteresis critical pore size obtained in simulations.
The MC and NLDFT results were compared with macroscopic theories of capillarycondensation. Appreciable departures from the classical KC equations were found for poresas large as 10 nm. We checked the applicability of the DBdB theory, which employs thedisjoining pressure to characterize the fluid–solid interactions. The isotherm of disjoiningpressure for argon on silica was constructed from the adsorption isotherm on a flat surfacecalculated by means of NLDFT. The DBdB equations for the relations between the pressuresof capillary condensation and desorption and the pore diameter agree fairly accurate with theNLDFT calculations for pores of 7–8 nm and larger.
We have also presented a comprehensive collection of experimental data on capillarycondensation of nitrogen on mesoporous molecular sieves of MCM-41 and SBA-15 types,which contain uniform cylindrical pores, and demonstrated good agreement of NLDFTpredictions with experimental data.
That is, we draw a final conclusion that NLDFT with properly chosen parameters forintermolecular interactions correctly approximates results of MC simulations (shift of vapour–liquid equilibrium, spinodals, density profiles, adsorption isotherms) for pores wider than about2 nm. On the other hand, NLDFT smoothly merges (above 7–10 nm) with the DBdB equationsof capillary condensation and desorption, thus bridging scales from molecular simulations tomacroscopic description.
Acknowledgments
This work was supported in parts by the TRI/Princeton exploratory research program, EPA(grant R825959-010), and Quantachrome Corporation.
References
[1] Evans R 1992 Fundamentals of Inhomogeneous Fluids ed D Henderson (New York: Dekker) ch 5[2] Tarazona P, Marconi U M B and Evans R 1987 Mol. Phys. 60 573–95[3] Tarazona P 1985 Phys. Rev. A 31 2672–9[4] Ravikovitch P I, O’Domhnail S C, Neimark A V, Schuth F and Unger K K 1995 Langmuir 11 4765–72[5] Ravikovitch P I, Vishnyakov A and Neimark A V 2001 Phys. Rev. E 6401 011602[6] Vishnyakov A and Neimark A V 2001 J. Phys. Chem. B 105 7009–20[7] Derjaguin B V 1940 Acta Phys.-Chim. 12 181–200[8] Broekhoff J and de Boer J H 1967 J. Catal. 9 8–28[9] Broekhoff J and de Boer J H 1968 J. Catal. 10 368–480
[10] Neimark A V and Vishnyakov A 2000 Phys. Rev. E 62 4611–22[11] Neimark A V, Ravikovitch P I, Grun M, Schuth F and Unger K K 1998 J. Colloid Interface Sci. 207 159–69[12] Kruk M and Jaroniec M 2000 Chem. Mater. 12 222–30[13] Everett D H 1967 The Solid–Gas Interface vol 2, ed E A Flood (New York: Dekker) ch 36[14] Gelb L D, Gubbins K E, Radhakrishnan R and Sliwinska-Bartkowiak M 1999 Rep. Prog. Phys. 62 1573–659[15] Evans R, Marconi U M B and Tarazona P 1986 J. Chem. Soc. Faraday Trans. 82 1763–87[16] Ball P C and Evans R 1989 Langmuir 5 714–23
364 A V Neimark et al
[17] Kresge C T, Leonowicz M E, Roth W J, Vartuli J C and Beck J S 1992 Nature 359 710–12[18] Beck J S, Vartuli J C, Roth W J, Leonowicz M E, Kresge C T, Schmitt K D, Chu C T W, Olson D H, Sheppard E
W, McCullen S B, Higgins J B and Schlenker J L 1992 J. Am. Chem. Soc. 114 10834–43[19] Morishige K and Shikimi M 1998 J. Chem. Phys. 108 7821–4[20] Morishige K and Masataka I 2002 J. Chem. Phys. 117 8036–41[21] Landau L D and Lifshitz E M 1959 Statistical Physics vol 1 (Oxford: Pergamon)[22] Gelb L D 2002 Mol. Phys. 100 2049–57[23] Liu A J and Grest G S 1991 Phys. Rev. A 44 R7894–7[24] Liu A J, Durian D J, Herbolzheimer E and Safran S A 1990 Phys. Rev. Lett. 65 1897–900[25] Lin M Y, Sinha S K, Drake J M, Wu X I, Thiyagarajan P and Stanley H B 1994 Phys. Rev. Lett. 72 2207–10[26] Gelb L D and Gubbins K E 1997 Phys. Rev. E 56 3185–96[27] Gelb L D and Gubbins K E 1997 Abstracts of Papers of the American Chemical Society 213 349-PHYS[28] Gelb L D and Gubbins K E 1997 Phys. Rev. E 55 R1290–3[29] Penrose O and Lebowitz J L 1971 J. Stat. Phys. 3 211[30] Penrose O and Lebowitz J L 1987 Towards a rigorous molecular theory of metastability Fluctuation Phenomena
ed J L Lebowitz and E Montroll (Amsterdam: North-Holland)[31] Corti D S and Debenedetti P G 1994 Chem. Eng. Sci. 49 2717–34[32] Stillinger F H 1995 Phys. Rev. E 52 4685[33] Corti D S, Debenedetti P G, Sastry S and Stillinger F H 1997 Phys. Rev. E 55 5522[34] Ravikovitch P I, Wei D, Chueh W T, Haller G L and Neimark A V 1997 J. Phys. Chem. B 101 3671–9[35] Neimark A V and Ravikovitch P I 2001 Microporous Mesoporous Mater. 44 697–707[36] Ravikovitch P I and Neimark A V 2001 Colloids Surf. A 187 11–21[37] Ravikovitch P I and Neimark A V 2001 J. Phys. Chem. B 105 6817–23[38] Ravikovitch P I and Neimark A V 2002 Langmuir 18 1550–60[39] Rosenfeld Y 1989 Phys. Rev. Lett. 63 980–3[40] Kierlik E and Rosinberg M L 1990 Phys. Rev. A 42 3382–7[41] Curtin W A and Ashcroft N W 1985 Phys. Rev. A 32 2909–19[42] Rosenfeld Y, Schmidt M, Lowen H and Tarazona P 1997 Phys. Rev. E 55 4245–63[43] Evans R 1979 Adv. Phys. 28 143–200[44] Davis H T 1996 Statistical Mechanics of Phases, Interfaces, and Thin Films (New York: Wiley)[45] Evans R 1990 J. Phys.: Condens. Matter 2 8989–9007[46] Lastoskie C, Gubbins K E and Quirke N 1993 J. Phys. Chem. 97 4786–96[47] Olivier J P 1995 J. Porous Mater. 2 217[48] Ravikovitch P I, Haller G L and Neimark A V 1998 Adv. Colloid Interface Sci. 77 203–26[49] Neimark A V and Ravikovitch P I 1997 Langmuir 13 5148–60[50] Vishnyakov A, Ravikovitch P I and Neimark A V 1999 Langmuir 15 8736–42[51] Ravikovitch P I, Vishnyakov A, Russo R and Neimark A V 2000 Langmuir 16 2311–20[52] Talanquer V and Oxtoby D W 1995 J. Phys. Chem. 99 2865–74[53] Neimark A V and Ravikovitch P I 1998 Density functional theory for studies of multiple states of inhomogeneous
fluids at solid surfaces and in pores Microscopic Simulation of Interfacial Phenomena in Solids and Liquidsvol 492, ed S R Phillpot, P D Bristowe, D G Stroud and J R Smith (Warrendale, PA: Materials ResearchSociety) pp 27–33
[54] Gonzalez A, White J A, Roman F L, Velasco S and Evans R 1997 Phys. Rev. Lett. 79 2466–9[55] Aranovich G L and Donohue M D 1999 Phys. Rev. E 60 5552–60[56] Malanoski A P and Swol F V 2000 Paper 157a The AIChE 2000 Annual Mtg (Los Angeles, CA)[57] Frink L J D and Salinger A G 2002 J. Phys.: Condens. Matter 14 2167–87[58] Hernando J A and Blum L 2001 J. Phys.: Condens. Matter 13 L577–82[59] Maier R W and Stadtherr M A 2001 AICHE J. 47 1874–84[60] Gonzalez A, White J A and Roman F L 1998 J. Chem. Phys. 109 3637–50[61] White J A, Gonzalez A, Roman F L and Velasco S 2000 Phys. Rev. Lett. 84 1220–3[62] Hernando J A 2002 J. Phys.: Condens. Matter 14 303–17[63] Neimark A V, Ravikovitch P I and Vishnyakov A 2002 Phys. Rev. E 65 031505[64] Hohenberg P and Kohn W 1964 Phys. Rev. B 136 B864[65] Kohn W, Becke A D and Parr R G 1996 J. Phys. Chem. 100 12974–80[66] Lebowitz J L and Percus J K 1961 Phys. Rev. 122 1675[67] Press W H, Teukolsky S A, Vetterling W T and Flannery B P 1992 Numerical Recipes in C. The Art of Scientific
Computing 2nd edn (Cambridge: Cambridge University Press)[68] Cohan L J 1938 J. Am. Chem. Soc. 60 433
Bridging scales: DFT of capillary condensation 365
[69] Saam W F and Cole M W 1975 Phys. Rev. B 11 1086–105[70] Derjaguin B V and Churaev N V 1976 J. Colloid Interface Sci. 54 157[71] Gregg S J and Sing K S W 1982 Adsorption, Surface Area and Porosity (New York: Academic)[72] Zhao D Y, Feng J L, Huo Q S, Melosh N, Fredrickson G H, Chmelka B F and Stucky G D 1998 Science 279
548–52[73] Kruk M, Jaroniec M and Sayari A 1997 J. Phys. Chem. B 101 583–9[74] Peterson B K and Gubbins K E 1987 Mol. Phys. 62 215–26[75] Lukens W W, Schmidt-Winkel P, Zhao D Y, Feng J L and Stucky G D 1999 Langmuir 15 5403–9[76] Yue Y H, Gedeon A, Bonardet J L, D’Espinose J B, Melosh N and Fraissard J 2000 Stud. Surf. Sci. Catal. 129
209–18[77] Sayari A, Liu P, Kruk M and Jaroniec M 1997 Chem. Mater. 9 2499–506[78] Carrott M, Candeias A J E, Carrott P J M, Ravikovitch P I, Neimark A V and Sequeira A D 2001 Microporous
Mesoporous Mater. 47 323–37[79] Van Der Voort P, Ravikovitch P I, De Jong K P, Benjelloun M, Van Bavel E, Janssen A H, Neimark A V,
Weckhuysen B M and Vansant E F 2002 J. Phys. Chem. B 106 5873–7

![Capillary thermostatting in capillary electrophoresis · Capillary thermostatting in capillary electrophoresis ... 75 µm BF 3 Injection: ... 25-µm id BF 5 capillary. Voltage [kV]](https://static.fdocuments.us/doc/165x107/5c176ff509d3f27a578bf33a/capillary-thermostatting-in-capillary-electrophoresis-capillary-thermostatting.jpg)