Bridging Climate Research Data and the Needs of the … II: Workshop ... statistical downscaling. 8....
52
Bridging Climate Research Data and the Needs of the Impact Community 11-12 January 2011 EEA/Copenhagen Version Date: 16 May, 2011 Proceedings of the IS-ENES/EEA/CIRCLE-2 Workshop Please use the following reference to the whole report when cited: Swart, R.J. and Avelar, D. (eds.). 2011. Bridging Climate Research Data and the Needs of the Impact Community - Proceedings of IS-ENES/EEA/CIRCLE-2 Workshop, 11-12 January 2011. EEA, Copenhagen.
Transcript of Bridging Climate Research Data and the Needs of the … II: Workshop ... statistical downscaling. 8....

Bridging Climate Research Data and
the Needs of the Impact Community 11-12 January 2011
EEA/Copenhagen Version Date: 16 May, 2011
Proceedings of the
IS-ENES/EEA/CIRCLE-2 Workshop
Please use the following reference to the whole report when cited:
Swart, R.J. and Avelar, D. (eds.). 2011. Bridging Climate Research Data and the Needs
of the Impact Community - Proceedings of IS-ENES/EEA/CIRCLE-2 Workshop, 11-12
January 2011. EEA, Copenhagen.

Bridging Climate Research Data and the Needs of the Impact Community - January 2011 1
List of contents:
1. Workshop overview _____________________________________________________ 1
2. Workshop summary _____________________________________________________ 1
2.1. The workshop ____________________________________________________________ 1
2.2. Who are the users? ________________________________________________________ 2
2.3. What do the users need? ___________________________________________________ 3
2.4. How should the demand be met? ____________________________________________ 4
3. Workshop sessions ______________________________________________________ 5
3.1. Session 1: Setting the stage _________________________________________________ 5
3.2. Session 2: User needs ______________________________________________________ 7
3.2.1. Session 2A: Parallel sessions on user needs: sectoral definition of types of data required (variables,
post-processing, accessibility) ______________________________________________________________ 7
3.2.2. Session 2B: How can the cooperation between the climate modelling and climate impacts
community be improved? ________________________________________________________________ 15
3.3. Session 3: Plenary session on data supply options ______________________________ 16
3.4. Session 4: Plenary session on wider network of climate and climate impacts services _ 17
3.5. Session 5: Two parallel sessions on future recommendations (IS-ENES strategy) ______ 19
3.5.1. Session 5a: Formulating recommendations for connecting climate modelling and impact research:
organizational arrangements - barriers and opportunities. ______________________________________ 19
3.5.2. Session 5b: Formulating recommendations for connecting climate modelling and impact research:
identification of need for direct and processed output data – managing expectations for the proposed IS-
ENES e-portal. __________________________________________________________________________ 20
Annex I: Workshop Programme _______________________________________________ 23
Annex II: Workshop Participants ______________________________________________ 25
Annex III: Discussion Paper __________________________________________________ 27
Annex IV: Summary of results from questionnaire ________________________________ 38

Bridging Climate Research Data and the Needs of the Impact Community - January 2011 1
1. Workshop overview
The workshop‘s main objective was to focus future climate modeling analysis in Europe on the
climate data needs of the user community. The workshop brought together climate modelers,
impact researchers and policy advisors at regional, national, trans-boundary and EU levels
using climate data. The workshop addressed data needs in various sectors, notably water
management, ecosystems and agriculture, coastal management, and urban development.
The workshop was organized by IS-ENES (the infrastructure project of the European Network
for Earth System Modeling) in collaboration with the European Environment Agency (EEA) and
the CIRCLE-2 ERA network of the national climate change impacts, vulnerability and adaptation
research programmes in Europe. Both IS-ENES and CIRCLE-2 are supported by the EU’s 7th
framework programme. ENES coordinates the European climate and earth system modeling
community working on understanding and projection of future climate change and is strongly
involved in the assessments of the IPCC and provides the model-based climate scenarios on
which EU mitigation and adaptation policies are founded.
The results of the workshop feed into the IS-ENES strategy for the coming years, and were
presented during a Foresight Meeting held in Hamburg in February 2011, This activity can also
support the development of the European Clearinghouse on Climate Change Impacts
Vulnerability and Adaptation, one of the elements of a new European Climate Change
Adaptation Strategy to be developed following the EU White Paper on Adaptation.
2. Workshop summary
2.1. The workshop
The workshop‘s main objective was to clarify the climate data needs of the user community in
the area of climate change impacts, vulnerability and adaptation (IVA) in support of future
climate modeling analysis in Europe. The workshop brought together 38 climate modelers and
impact researchers using climate data. Involvement of policy makers, practitioners and other
end users of climate information is planned for a next stage. The workshop addressed data
needs in various sectors, notably water management, ecosystems and agriculture, coastal
management, and urban development. This paper summarizes the main recommendations of
the workshop that could be implemented in a stepwise fashion.
The workshop was organized by IS-ENES in collaboration with the European Environment
Agency (EEA) and the CIRCLE-2 ERA network of the national climate change impacts,
vulnerability and adaptation research programmes in Europe. Both IS-ENES and CIRCLE-2 are
supported by the EU’s 7th framework programme. The results of the workshop aim at
supporting the development of the IS-ENES strategy, and were discussed in an IS-ENES

Bridging Climate Research Data and the Needs of the Impact Community - January 2011 2
Foresight meeting held from 2-4 February 2011 in Hamburg, as well as setting the stage for the
development of a pan-European e-impact portal prototype to deliver climate scenarios for
impacts, vulnerability and adaptation. They can also support the development of a European
network of climate services as well as the European Clearing House on Climate Change Impacts,
Vulnerability and Adaptation, one of the elements of a new European Climate Change
Adaptation Strategy to be developed following the EU White Paper on Adaptation. CIRCLE-2
will use the outcomes of the workshop to further develop joint initiatives in support of climate
change IVA research programming in Europe.
2.2. Who are the users?
1. Account for diversity of users. Climate modeling, climate monitoring and other climate research activities should account for an increasingly diverse group of users, in terms of types of sectoral impacts and in terms of their functions (from impact modelers to governments at different levels to consultants and private sector decision makers). Also, it should be taken into account that different European regions have a very different level of knowledge, especially central and eastern European countries are as yet poorly represented in climate research networks. Data needs in sectors other than water and land management tend to be less well articulated and require special attention. As a first step in a process, the workshop mainly targeted IVA researchers, and there is a need for additional IS-ENES efforts to engage the actual end users in the various sectors and regions together with the IVA research and climate modeling communities.
2. Distinguish between non-specialist, specialist and niche user communities. Climate modeling output could distinguish between the needs of the impacts community for non-specialized, specialized, and niche users, both in terms of data volume, guidance and support provided. These types of services require different levels of expertise and resources - while non-specialized users may be served by largely more generic information, specialist and niche users require tailored information and arguably more interaction.
3. Organize and maintain a user involvement mechanism. Past efforts to improve the communication between the climate modeling and impacts communities at national and European levels have often failed because of the lack of resources and of a sustained interaction mechanism. A concerted effort is needed to develop such a mechanism, possibly in the context of a system of European climate services (see below). Required interactions include collaborative strategy development, regular feedback on evolving climate information portals, the joint development of guidance, periodic (e.g., bi-annual) European conferences, and management of expectations to avoid unrealistic demands.

Bridging Climate Research Data and the Needs of the Impact Community - January 2011 3
2.3. What do the users need?
4. Provide information in form of processed date (climate indices). To better connect with the users, there is a need to focus on transferring information in terms of derived climate indices, some of which could be generically provided to non-specialist users, while other should be responding to the needs of specialists. While for the first user group these indices may be an end product, for specialist they are also a means to further select additional basic data for specific scenario-model combinations. Particularly indices on extreme events and on worst or best case scenarios are relevant from an impact perspective. Spatially explicit information (maps) and first order delta indices are particularly relevant. A much more active role of the user community is required to guide this process. Tools should be provided to support users to calculate specific indices themselves to allow greater flexibility.
5. Provide post-processing tools (statistics, conversion, visualization). To better respond to the needs of the impacts community, simple post-processing tools should be developed and made available, e.g. for simple statistics, data conversions, or visualization, accompanied by guidance on how to use and interpret the information with proper account of uncertainties and data limitations. However, for many applications, specific tailor-made information is required that cannot be meaningfully made available in a generic way and not only data and tools but also processing capacity should be available at data provider to support users.
6. Provide (basic) error/bias correction of models. Many impact modelers are not aware of the importance of bias corrections. Application of raw data can lead to wrong conclusions and bias correction leads to much improved results. A guidance document is required explaining the origin of these biases (model error, location, mismatch in initial conditions), and providing methods and tools on how to implement error or bias correction. Training of impact modelers on how to correctly use the data will improve the quality of their research. In consultation with impact researchers, climate modelers should urgently explore the feasibility to provide well-documented example datasets with bias correction, also including parameters other than precipitation and temperature, such as radiation and air humidity.
7. Develop guidance on understanding and interpretation of uncertainties with impact community. The climate modeling and impacts communities should jointly work on developing guidance for the wide variety of impact researchers and practitioners on how to deal with the different type, levels and relevance of uncertainties, especially those related to climate model uncertainties in a broader context that involves also other pertinent uncertainties. Because impact researchers work with downscaled data, the guidance should pay attention to uncertainties related to global models as well as dynamic and statistical downscaling.
8. Support access to consistent information on socio-economic and land-use scenarios. Impact researchers use climate model results in combination with other information, including climate observations, land-use information and socio-economic projections. Users of climate projections should be aided to access this information that is often also used as input for the climate model experiments. Examples of projects using the different data sources consistently should be provided. Also other data (e.g. discharge data, CO2) should be made accessible in a coordinated fashion.

Bridging Climate Research Data and the Needs of the Impact Community - January 2011 4
9. Develop guidance on adequate selection of climate data jointly with the impacts community. Impact modelers may in the future do ensemble runs themselves, but most researchers and practitioners will continue to work with a limited set of climate scenarios and models. The climate modeling and impacts communities should jointly work on developing guidance on how to select and interpret climate scenarios in a way that best matches their needs. Guidance should describe the models, summary statistics, model differences, comparisons with observations, using references to overview papers (e.g., ENSEMBLES, PRUDENCE, CORDEX). The eventual responsibility for the selection of models and scenarios, and the use of climate scenarios ensembles, should remain within the impact community.
2.4. How should the demand be met?
10. Eventually provide different climate information in one linked system (monitoring, global and regional modeling). Different types of climate information (observations, global climate model output, dynamically or statistically downscaled climate projections, derived climate indices, tools and guidance) should all be available through a network of seamlessly linked systems with appropriate guidance for users to find what they need, preferably through one entry point. The current project-based search strategy familiar to specialists only should be changed into the facilitation of more problem-based search facilities also targeting non-specialists. Ideally, the impact community should find the required information through one entry point (e.g., a virtual portal). At the same time, the impact community should be encouraged to also enhance their coordination, either by sector or maybe under some more generic umbrella (cf., the UNEP initiative PRO-IVA at the global level).
11. Start discussing the European Climate Service System now. To gradually work towards the required linked climate information systems, it is time to start a discussion on the characteristics of a pan-European Climate Service System. Synergies should be explored between various initiatives, such as the climate services component of the Global Monitoring of Environment and Security programme (GMES), the activities of EUMETNET, the CIRCLE-2 ERA-net, the “European Clearing House on Climate Change Impacts, Vulnerability and Adaptation”, the Joint Programming Initiative Clik’ EU, the Climate Knowledge and Innovation Community (KIC), national climate service institutions and others.
12. Explore conditions and requirements for a European climate services system. To support the development of a shared and linked European system of climate services many issues remain to be addressed. These include the possible definition of rules for database management at the European level. Also the legal and financial aspects of the provision of data and derived products for commercial use of research results should be elaborated, taking prior experiences of other initiatives, such as GMES, into account. A third set of questions relates to the links between a European system with national portals and other types of climate services, national databases having added value because of the higher resolution of scenarios, better validation and easy international access to national data.
13. Develop the IS-ENES E-impact portal as a component of a wider European system. During the lifetime of IS-ENES, the project’s E-impact portal will be developed as a proof of

Bridging Climate Research Data and the Needs of the Impact Community - January 2011 5
concept stepwise filled with a limited number of use cases, not yet as an operational service. The portal does not intend to replace other (national) initiatives. The portal will not only provide access to raw data, indices and maps, but also provide bias correction examples, downscaled data from use cases, harmonized documentation and tools, and other relevant information. It should provide guidance to select models and projections. An impact user group will be set up, and a contact point for questions established.
14. Improve accessibility of data by better integration/harmonization and user-friendly interfaces, removing barriers. Access to climate scenario also beyond experienced expert users should be improved by better integration/harmonization of data sources at different geographic levels, guidance for selection of scenarios and interpretation of model uncertainties, and user friendly interfaces offering various data formats, removing as much as possible institutional or financial constraints. In several countries, access to climate data is hampered by financial, institutional, technical or other practical reasons. While raw data and common statistical output in useable format should be available for free, for services including specific post-processing activities payment could be appropriate.
15. Develop training programmes on use and interpretation of climate modeling results. The number of researchers and practitioners working with climate data is rapidly increasing, and the volume and complexity of climate model output will increase as new results become available (CMIP5, CORDEX). With notable exceptions, the user community is not well trained to use and interpret this information correctly and effectively. An urgent need exists to develop and implement training programmes for impacts researchers, for practitioners, and for students. Main messages and materials could be harmonized at the European level, using and integrating input from various related FP7 and other projects. Funding sources are to be identified for supporting such crucial programmes.
3. Workshop sessions
3.1. Session 1: Setting the stage Chair Guy Brasseur
Workshop introduction by Rob Swart
This presentation lays out the workshop objectives and how these are translated into the workshop
programme as well as a summary of the results of a user needs questionnaire exercise after the
summer of 2010. The workshop aim is not only to make an inventory of climate data needs for
impacts analysis, but also to support the ENES long-term strategy and position IS-ENES in the
dynamic climate services landscape, which includes global, European and national portals as well as
the new EU Adaptation Clearinghouse. The possible “users” are defined, as well as what the
questionnaire suggests that do they want and how they want it. It is established that data are not
enough. Also, easy guidance on the use and interpretation of complex climate model output is
required, as well as integration and/or harmonization of data at different geographic levels. It
becomes clear that just building and maintaining a website should be complemented by services for
tailoring information for many specialist applications, for linking climate with non-climate scenarios,
and continue to invest in the connection between the climate and impacts communities.
Bridging Climate Research Data and the Needs of the Impact Community - January 2011 6
EEA information needs and European Clearing House on Climate Change Impacts, Vulnerability
and Adaptation by André Jol (EEA/ Denmark)
The presentation summarizes the mandate and members of the EEA and desxribes the EIONET
system. The 2009 White Paper on climate change adaptation provides the basis for the EEA’s work
on adaptation. It was four pillars: Strengthen the knowledge/evidence base; Mainstream climate
adaptation into key policy areas; Policy instruments for adaption financing; and Stepping up
International cooperation on adaptation. Key EU policy processes with (climate change) information
needs are described, including water, nature protection and marine issues. The Commission will
discuss mainstreaming in all relevant EU policies in 2011. The presentation then explains the
“European Clearing House on Climate Change Impacts, Vulnerability and Adaptation” that is being
developed in collaboration with EEA and JRC. The first version is due in early 2012, focusing mainly
on decision makers, working on the development and implementation of strategies for adaptation to
climate change, national and regional policy-makers, agencies, boundary organizations and research
projects. Several national policy activities and portals are noted. An overview is provided of
publications and ongoing relevant work at the EEA. An update of the 2008 indicator-based climate
impacts report is scheduled for 2012. In this context, a need is identified for climate change
monitoring and reanalysis and for high resolution climate scenarios at right scales with propoer
communication of uncertainties. There is also a need for enhanced monitoring and reporting of
climate change impacts to raise awareness and help identify sectors/regions most vulnerable/at risk.
The consistency between climate and socio-economic scenarios (vulnerability/risk) should be
improved. Data and information should be shared through national platforms and the planned EU
Clearinghouse, and the link with Climate Services (national and EU; IS-ENES and possible future
GMES should be clarified.
Lessons learned from IS-ENES use cases by Céline Déandreis and IS-ENES WP11 partners
As part of the IS-ENES EU-project, the objective of WP11 is to build an e-service (e-impact portal) to
bridge the gap between climate researcher and user community. For this purpose, 17 national and
representative case studies have been gathered and analysed. The objective is to precise user needs
and to determine the best way to provide information.
The presentation synthesised the results of the use cases analysis. It described:
- user requests (objectives, areas, periods, parameters, resolution, and final format);
- work that must be done to answer user requests (data processing, tools development,
uncertainty assessment);
- the manner to deliver climate information and discuss uncertainties for users from different
sectors such as water resources, forestry, or energy.
The presentation highlighted common practices and particulars of use cases. The common practices
will serve as a basis for the development of the e-impact portal.

Bridging Climate Research Data and the Needs of the Impact Community - January 2011 7
3.2. Session 2: User needs
Session 2A: Parallel sessions on user needs: sectoral definition of types of data 3.2.1.
required (variables, post-processing, accessibility)
3.1.1.1. Water management: floods, droughts, water scarcity, water quality, etc.
Chair: Martina Flörke (CESR/Germany)
Rapporteur: Martina Flörke /Céline Déandreis
Introduction
In this parallel session the demand for more detailed climate data to better estimate current and
future hydrological extremes was discussed. The climate information has been identified as the
important input for the analysis and assessment of impacts, vulnerability and adaptation options
(IVA). After reviewing the recommendations from the ECLAT workshop, it turned out, that most of
the recommendations given 10 years ago are still relevant today. Next to the climate data needs the
needs of different users (e.g. scientists, practitioner) was discussed, too. The discussion in this
session starts with the recommendation “It is worth doing!”, i.e. to continue the interaction
between climate modeling and climate impacts communities for supporting data needs.
Further discussion was guided by the following questions:
1. Which variables / indicators should be made available?
2. Where to go to find the required data?
3. How to deal with uncertainty?
4. Which problems did and may arise for the provision of climate data?
5. Which categories of users?
6. How can users be reached?
Question 1: Which variables / indicators should be made available?
With regards to Table 3 of the working paper (see Annex), the group identified all indicators listed
and marked as being of importance. These data should be easily made available in a minimum
resolution (temporal and spatial); higher temporal and spatial resolution data should be available on
request. Both, raw data and indices are needed and then the user should have the possibility to
make the decision which data is needed. The group mentioned that more detailed data is needed as
time series, especially regarding water quality, storm overflows, or groundwater. Here, the data
availability is already poor for the reference period. There is a high demand for bias-corrected data
on different scales.
Question 2: Where to go to find the required data?
The group identified the National Climate Service Centres as the central points of contact. Here users
can be guided to make their selection of climate data, etc. On their homepages, for example, the
user should find links to other national climate portals. Next to climate data hydrometeorological
services are needed to provide information on climate and hydrology. This service could be

Bridging Climate Research Data and the Needs of the Impact Community - January 2011 8
organized and coordinated in a networking format with sub-networks related to land use, water use,
etc. Overall, a high level of guidance on data on European level is needed.
Question 3: How to deal with uncertainty?
One has to deal with uncertainty (data, models, scenarios). But key issue of this question is to
understand the uncertainty. The provision of projections of different variables as calculated by
different models (ensembles) is as important as using different scenarios to describe the future.
Then the uncertainty can be bounded: e.g. use of upper and lower cases, range of model results,
time series instead of averages, etc. Additionally, information and detailed explanation for better
understanding of the data needs to be provided next to the data as well. Guidance on how to use
climate data is also needed.
Question 4: Which problems did and may arise for the provision of climate data?
The most important question was and still is: where to go? Waiting for data to be processed has
been identified as another problem that may occur. However, a basic problem is still the availability
of reference data, especially on water quality and groundwater.
Question 5: Which categories of users?
All possible users, from research communities to practitioners should be captured. The key users
could be identified by CIRCLE-2 (?).
Question 6: How can users be reached?
In order to supply data, E-portal tools could be used, but a harmonization of tools in terms of
architecture and technology would be essential. In this sense a common workflow as basis for
national climate services should be implemented (standardization?). Therefore a common standard
needs to be defined and here, INSPIRE could serve as a prototype. For example, indices of climate
data like minimum or maximum values could be calculated online.
3.1.1.2. Ecosystems, agriculture and forestry: droughts, growing season, etc.
Chair: Ronald Hutjes (UPM/Spain); rapporteur: Tiago Capela Lourenço
Introduction
This parallel session discussed the climate data needs for analysis and assessment of impacts,
vulnerability and adaptation options (IVA) for land-related sectors in Europe. The discussion started
by noting that recommendations from a similar workshop (ECLAT) in the late 1990s are still largely
relevant today:
compare and assess statistical and dynamical downscaling
easy access to GCMs and RCMs model data
selection from multiple scenarios and models
incorporate uncertainties
establish ‘European Climate Data Centre”
Bridging Climate Research Data and the Needs of the Impact Community - January 2011 9
The discussion then continued to address 5 questions: Which variables and tools are needed; How
are uncertainties and scenarios handled? Where can the data be found? Which problems are
experienced? And Who are the users and which type of users are missing in the workshop?
Variables and processing tools for raw data
IVA researchers working on land-related impacts need different types of climate information:
primary climate data;
gridded, time series, downscaled, bias corrected;
climate indices;
aggregate statistics;
tools (formatting, aggregating, subsetting, re-projection, stats, etc);
support and guidance (do’s and don’ts);
derived data, e.g. floods/droughts
The IS-ENES e-impact-portal should not only make raw data available, but also derived data and
tools (aggregation, resolution, statistics, etc.).
The following remarks about indices were made:
For IVA assessments, dt/dp plots with error bars, and dp and dt maps are useful, especially
in the selection process of specific model or scenario runs of which then more primary data
will be used in the IVA models
Indices made available should be harmonized as much as possible, which can be a problem –
one could start with harmonizing the global and continental indices;
Different IVA communities need different indices even for the same primary variable; E.g.
Wind energy engineers need winds at 100m elevation vs. butterfly dispersion ecologist need
winds at 10m.
Are the indices calculated with raw or biased corrected data? 10’ grid of bias corrected data
could be a major step fwd; Issues of bias correction via delta approach when using the
indices
However, preferably the IVA analyst should use all relevant models available (and not a
limited selection) – it is preferable to start with ensemble runs and not with a single model;
to facilitate this, a strong harmonization of climate data formats is needed; also the IVA
researchers need first a clear overview of what is available
Remarks on data/variables that are being made available:
Changes in annual winter and summer (or growing season) temperatures are required
preferably both monthly and daily;
Crop models require next to temperature also wind speed and evapotranspiration,
preferably daily data; also moisture in the atmosphere is relevant information in this context
evapotranspiration (actual and potential) is being calculated by many different people in
many different ways, so guidance would be useful;

Bridging Climate Research Data and the Needs of the Impact Community - January 2011 10
It is debated what the most appropriate variable is for calculating solar radiation (cloud
fraction or other);
Remarks on the role of, and ways to facilitate bias corrections
At least guidance is needed on bias corrections; (example) datasets should be prepared in
close interaction between climate and IVA modellers and made available for use by others
In bias correction, observations and model data are brought together: cross harmonization
(formats, resolution/projection etc) would facilitate the process; model gridded data is
usually compared with station data – by implementing bias correction in a standard way
information about observational systems is required;
It is discussed how far should one should go in correcting biases (st dev, med) and who
should do it; if bias is corrected, several model variables or the covariance structure
between different variables may be lost
There should always be information on distinction between “true model bias” and bias
related to initial conditions;
Statistical downscaling could be regarded as a bias correcting method (ENSEMBLES tool) – it
is debated if the tool should be provided or the processed data, the latter having the risk
that it would be a black box and the nature of the bias is not understood.
Remarks on the resolution of the data needed:
There is a need for quite high resolution data that are not usually provided by GCMs and
hence there is a need for downscaling that needs to be carefully applied;
It is questioned if for IVA analysis at the European level and below GCM output is still
needed - the IVA community prefers to use RCM output directly;
In this context: Global and Regional models are getting coordinated in CORDEX and may help
surpass difficulties of users (bias in GCM vs RCM 10x10 Europe and 50x50 others);
Other remarks include:
There is a time lag between what IVA assessments are using and available results from
climate models (IVA assessment lag behind and may often still use IPCC-TAR data while AR4
data are available) – the updating processes for impact assessment take some time which is
sometimes not compatible with new developments in climate models.
Future climate model runs will more and more include the role of ecosystems, hydrology,
etc., by online coupled (sub)models and hence may interest the IVA community directly;
attention to aspects of consistency between online and offline used models is needed
Summary statements variables ad tools: Simple indices (at least seasonal) are required for strategy
development and data selection, not necessarily for decision making. It should be noted that complex
indices are highly sensitive to bias correction procedures. It is of the utmost importance, to provide
tools for bias correction as well as easy to use reference datasets (observations), and because this is
highly complex, guidance is needed!

Bridging Climate Research Data and the Needs of the Impact Community - January 2011 11
Uncertainties & scenarios
Different sources of uncertainties were discussed: those related to the models and initial conditions,
and those originating from the scenarios and variants. The following points were made:
IPCC SRES scenarios and climate scenarios based on those are well developed, but new
climate scenarios based on Representative Concentration Pathways (RCPs) are under
development and will be added to the climate projections databases.
Especially for the long-term, consistency between socio-economic and climate scenarios
should be pursued; for the RCPs consistent socio economic scenarios may become available
only later
Policy questions often refer to the near future (e.g. EU 2020), which makes initial conditions
very important, dependent on the sector.
In addition to initial conditions, also all other sources of uncertainties (models, downscaling
methods, …) are very important. Guidance is needed to properly understand and interpret
the uncertainty information..
Decision-makers rather start with simpler approaches (robustness of the climate signal) and
then may move on to more complete information on uncertainties if that would be relevant
for their decisions (which it not always is).
The participants make a case for the need to develop a simple climate variable set to avoid
confusion and achieve more coordinated and comparable IVA assessments.
ENSEMBLES has made some initial attempts to prepare probabilistic scenarios for Europe,
but these were not yet used for IVA analysis. In a few years this may change, but not soon.
First step (in RCMs) is now to move on from PRUDENCE (one map per model; the PRUDENCE
overview paper provides very useful information).
The e-portal could help making the climate data fit impact models by standardizing and
allowing ensembles of IVA models.
IVA models carry their own (large) sources of uncertainties that always have to be
considered when talking about uncertainty.
It is questioned if current or planned exercises and national and European projects satisfy
the needs established during this workshop and further efforts have to be organized.
Summary statements uncertainties and scenarios: Access to all climate model ensemble members
(harmonization) for IVA ensembles should be facilitated. Summary information should be provided
that indicate the signal robustness, so it is more useful for strategy development. It should be realized
that climate change uncertainty is only one source of uncertainty for IVA models and not necessarily
the most relevant one. The uncertainties originating from the global models as compared to those
from regional models should be clarified.
Data sources
It appears still difficult for IVA researchers to find the appropriate climate data and indices. Points
made:

Bridging Climate Research Data and the Needs of the Impact Community - January 2011 12
A number of sources were identified: IPCC DDC, CMIP5, FPs (PRUDENCE, ENSEMBLES,
CORDEX in the future), National Met Services, national projects and programmes (e.g.
through UKCIP, KNMI).
Dataset search and access is generally still project or institute based instead of problem
based; you have to know which project or institute produced them in order to find them;
one central, problem oriented search portal would help
Most of the existing websites don’t provide enough descriptions to non-specialists (non-
climate modelers, e.g. IVA communities) and feedback would be useful (e.g a researcher
using PRUDENCE data because he/she cannot find ENSEMBLE data should be able to ask
someone of the project for it (help desk, user support centre).
The role of IS-ENES would be to complement national level sources, not replace them. Also,
the IS-ENES e-portal should facilitate access to international databases (CMIP5 and CORDEX
exercises).
Documentation is required on how to relate (and operate) data for different geographic
levels (global, European, national, regional).
Guidance is needed on scenario selection for transboundary issues, and probability functions
could become a source of ‘selection guidance” .
Summary statements data sources: Currently, IVA researchers search data via projects rather than
via the problem or question they have. The future e-portal should be question-based rather than
model or project based. Clear guidance is required to relate national to international sources.
Problems
The session discussed various problems related to identification and accessibility of data sources,
cross-boundary data needs, and the (lack of) feedback mechanisms between users and climate data
providers. Guidance is required and the following seven types of guidance were identified:
Guidance on climate scenario selection (information to support choices, e.g. what scenarios
are more useful for the near future and what are more useful for the long term?) and
uncertainty;
Guidance on harmonization of time horizons (IPCC already addresses this to some extent but
IS-ENES could do this for Europe);
Guidance on understanding the scope and limitations of models;
Guidance on errors and skills of different models
Guidance about scale relations (time-space);
Guidance on terminology and (trans disciplinary) glossaries;
Guidance on socio-economics scenarios, and scenarios for greenhouse gas emissions and air
pollution (non-meteo aspects);
Finally, cross-boundary data needs were considered as a source of problems. Ideally, national
climate service products and (implicit) messages should be harmonized, taking care of model
sensitivities across boundaries.

Bridging Climate Research Data and the Needs of the Impact Community - January 2011 13
Summary statements problems: Feedback mechanisms between users and climate data providers
should be intensified and sustained, and guidance, guidance, guidance should be provided, including
a (transdisciplinary) glossary and guidance on data selection and model scope, skill, scale, and errors.
Users
In addition to IVA researchers, the following categories of end users (policy, ngo, business) are
distinguished:
local planners and decision makers (important focus group);
consultants;
sector policy-makers;
economists (market agents);
energy sector experts.
Various mechanisms/channels were identified through which they could be reached: EUMETNET
(EUMET-grid); “European clearing house on climate change impacts, vulnerability and adaptation”;
CIRCLE-2; EEA / ETCs / EIONET; the Interest group of Environmental Protection Agencies.
Summary statement users: There is a strong need for intermediates (consultancy, extension services,
etc.) to get involved in the definition of climate services. Developers of socio-economic scenarios (e.g.
land use) would need to include feedbacks of climate change to their scenarios. For further
interactions between IVA researchers, end users and climate modelers, existing user consultation
mechanisms should be used (EUMETNET, CIRCLE-2, etc).
3.1.1.3. Other sectors: urban areas, health, coastal management.
Chair: André Jol (EEA/Denmark)
Process
The discussion focused on the problem of the wide gap between the users of climate information
and the raw data produced and stored by climate modellers. This demands work by other,
intermediate people (climate services) for which a new community would be needed acknowledging
that climate information infrastructure is more than IT. It is suggested that data should be processed
where they are stored. Private sector involvement is to be strengthened. It is agreed that there are
economic benefits of providing the information.
A core/nucleus for climate services should urgently be formed, to be co-sponsored by various
organizations such as GMES (expert group DG Enterprise-JRC), EUMETNET, FP7, EEA, EMWF possibly
triggered by ISENES. One could learn from national climate service development in the US. A
distinction should be made between core services (many users, easy to produce, high benefit if
provided) and downstream services (fewer users, more difficult to produce, lower benefit). It is also
stressed that it is insufficient if only the climate community further improves its organization, but
even more importantly, also the IVA should be mich better organized.

Bridging Climate Research Data and the Needs of the Impact Community - January 2011 14
Content
Information is required at different time scales- information on short time scales is required for
emergency action, 10-20 years for management, and longer for long-lifetime investments. For
various objectives also non-climate information is required, e.g. next to climate scenarios for
migration (desertification), scenarios for socio-economic conditions are required.
It is noted that also information beyond temperature and precipitation is needed, such as radiation
products. Relevant local level climate data include direct and diffuse radiation, temperature in the
ground, wave direction, urban heat island effect. For air quality analysis to analyze health impacts
(e.g. in projects such as PEGASUS/JRC TM5/IIASA) information about atmospheric chemistry is
required, coupling climate models with local air pollution models/smog episodes. Scenarios for
emissions of chemically active substances emissions are required globally.
The number of applications that is covered under “other sectors” is larger than can be
comprehensively discussed in the small-scale workshop. Therefore only an incomplete number of
data types are mentioned:
Heating degree days
Snow cover for tourism
Ecosystem variables related indicators
Morphological studies in coast – storm database – wave direction is crucial
3D atmospheric and ocean variables (Wegener Institut)
Seasonal/decadal prediction (still research issue)
Data for disaster analysis (CAPHAZARD/CONAHA projects)
Use and interpretation of climate model output
It is discussed which would be the most appropriate institutions for data provision and for providing
guidance to people to get the “best” information. One of the problems related to the proper
selection and use of climate model output is the lack of uniformity in scenario presentation.
Multimodel analysis should be provided (e.g., 5), indicating what the robustness of model outcomes
is – the output should not necessarily be weighted or graded. In addition to different GCM
experiments, also for dynamic and statistical downscaling various methods are available, and raw
model output should undergo bias-correction before application in impact analysis. Regional results
need additional computing power, and allows closer interaction with users. Distributed databases
offer direct access to distributed data which is relevant from the user perspective. Users should be
made aware where improvements are being made in new research projects. Schools, courses and
training modules are required for users of climate data, including social scientists and proper
coordination with other projects and national projects is required (e.g., through CIRCLE-2).
The session concludes:
Bridging Climate Research Data and the Needs of the Impact Community - January 2011 15
Data & tools. There is a need for further interactions to ensure that all variables (primary and
derived indicators) are easily accessible and that a clear and up-to-date overview what is
available is provided, e.g. by establishing a sustained user group.
Overcoming communication problems. One of the main problems for IVA researchers appears to
be to select or find the most appropriate scenarios, and identify what are often specific niche
variables.
Uncertainties & scenarios. There is a strong need for improvement in the presentation of
uncertainties, including common methods and terminology (urgent because of upcoming CMIP5
results), and smaller scales and ensembles runs with pdfs, using new software and computing
facilities.
Data sources. European climate services are urgent and should avoid duplication – ISENES
should take the initiative in consultation with GMES, Clik’EU, and full involvement of national
services
Users. The climate community should reach out to a broad set of users. This may involve expert
meetings with other EU projects, and with private sector users (practitioners/consultants). It
may also include the development and implementation of training courses on the proper use of
information including interpretation of uncertainty (e.g. with FP7 projects, CIRCLE-2).
Session 2B: How can the cooperation between the climate modelling and climate 3.2.2.
impacts community be improved?
Chair: Guy Brasseur
In the plenary session on the cooperation between the climate modelling and climate impacts
community it was suggested that the impacts modellers should run their impact models for an
ensemble of plausible climate scenarios. This may require developing software tools for
automatically running impacts models for ensembles of climate scenarios. It also presents challenges
for interpreting the results.
Because time and resource constraints may prevent all IVA researchers to do this, the selection of a
limited set of scenarios and experiments will continue to be common practice, but which scenarios
or experiments serve their purpose best? Is it sufficient to use only “corner” climate scenarios (i.e.,
upper and lower case)? In any case, it is agreed that the climate community should provide a large
ensemble of model results, which should be well documented and from which the IVA researchers
can make their selection in an informed manner. A good webpage is essential but also active
outreach to consultants who will not necessarily look for relevant information in the internet.
Bridging Climate Research Data and the Needs of the Impact Community - January 2011 16
The organization of climate services should take the process of interaction with the users into
account. The question is asked if we already at a stage where a coherent “building” of climate
services can be designed and how we should deal with the (potential) competition between a
European and national climate services. Also the benefit for users of the CORDEX database under
development over the existing ENSEMBLES database should be clarified.
It is suggested that next to “specialist” and “niche” users of climate data with a scientific/technical
background also “non-specialist” users may make use of climate scenarios, but the development of
climate services it should be explored who they are and what kind of information do they actually
need.
Within a few years, the amount of climate model data will be significantly increased by new CMIP5
data, making it even more complex for IVA users to select and interpret the best data for their
purposes. While making those data available, it should be made very clear what can be learned from
CMIP5.e.g., about the extent of and reasons for systematic biases in simulations of current climate.
Again, the need for appropriate guidance in Europe on management and communication of
uncertainties in climate projections was stressed. Impact researchers (and adaptation practitioners)
should not necessarily wait until the remaining uncertainties in precipitation projections are largely
resolved, because projections in some regions are already robust. Finally, it was noted that in
developing the IS-ENES e-impact portal, coordination with other European activities (e.g., CORDEX)
and international activities (e.g., CMIP5) is essential.
3.3. Session 3: Plenary session on data supply options
Chair: Paula Harrison
Developing and providing regional climate model output by Lars Barring
Recently concluded European projects has emphasized both coordination of regional climate
modelling experiments and systematic analysis of the resulting regional climate scenario ensembles,
as well as development and extension of the ensemble-based approaches to climate change impact
analyses. In this presentation some key aspects and conclusions of these projects will be presented
with a focus on aspects relevant to application of the ensemble data. These include design of
experimental matrix, spatial resolution, weighting, calibration of output. While these projects
focused on Europe the general concept of coordinated regional downscaling experiments are now
extended to provide ensembles of regional climate model data covering most the globe. An
overview will be given of this international collaborative effort, CORDEX, which focuses on
contributing to the IPCC AR5 process.
Climate and supporting scenarios for impact research by Rob Swart
The presentation gives an overview of the development and use of climate scenarios for impact
assessment. Key questions that are addressed are: for what purposes do impact researchers and
adaptation policy makers use climate scenarios, what has science been able to deliver so far and
what not? Various future climate model experiments are being planned today, many of which on
the basis of socio-economic and emissions scenarios. How can these experiments still be adjusted in
Bridging Climate Research Data and the Needs of the Impact Community - January 2011 17
terms of scope and format of the output to help the impact community and how can the results be
best made accessible? A plethora of climate portals exists already and will be expanded by new ones.
It is argued that there are different categories of users that require different scenarios and different
levels of detail. The mere amount and complexity of the model output requires adequate attention
to guidance on selection and usage of scenarios, notably including tail ends. Also the links with socio-
economic scenarios and between global, regional and local level scenarios is crucial for impact and
adaptation analysis. Probabilistic scenarios have advantages but also serious constraints in terms of
their interpretation: to avoid over-interpretation they should be presented with caution and proper
guidance.
Global models and uncertainties by Sylvie Joussaume and Pascale Braconnot (IPSL/France)
Global climate models are extensively used to investigate possible future climate changes under
different scenarios within IPCC Assessments. Their results, often downscaled at a more regional
scale, are at the basis of many impact studies. However, climate projections exhibit large
uncertainties, arising from 3 sources: socio-economic scenarios, internal climate variability and
models themselves. Their respective role evolves through the 21st century projections with a
dominant role of scenario uncertainties on the second half of the century. The various climate
models differ by their different representation of processes such as clouds and their interactions
with radiation which are the main cause of inter-model differences. Model uncertainties also vary
for different climate parameters, with a better agreement on temperature than precipitation. None
of these models can be qualified as best for all variables and all regions. Comparisons with
observations even show that multi-model averages perform better than individual models. The
Coupled Modelling Intercomparison Project 5 (CMIP5) will provide a large range of simulations for
the next IPCC Assessment report. They will use Representative Concentration Paths that differ from
the previous scenarios (SRES) and include a more complex forcing (aerosols, land-use). Collaboration
with the impact community is important to best use results from climate models, for example
through the production of specific indicators, through feedbacks from users on model performance
or through guidance to users on model capacity and on the processes underlying model biases.
3.4. Session 4: Plenary session on wider network of climate and climate impacts
services
Chair: Albert Klein Tank
Provision of Climate Services in Europe by Albert Klein Tank
Risk management and adaptation require reliable, science-based climate information. Most
promising are the information products and tools which blend observations and future climate
projections, and include uncertainty information. The present paper illustrates that the users of this
type of information will need to cope with a large variety of initiatives at the global, regional and
national/local level.At the global level, it has been decided in 2009 to build the WMO Global
Framework for Climate Services (GFCS). The emphasis is on capacity building in LDCs. Users should

Bridging Climate Research Data and the Needs of the Impact Community - January 2011 18
not expect results in the form of concrete products in the coming years, but global coordination is
important.
At the regional level, several ongoing EU-projects have links to climate services, including IS-ENES
and CIRCLE-2 (this workshop). Another ongoing EU-project is EURO4M, which aims to provide
reference hindcast datasets of ECVs plus near real time monitoring of the state and evolution of the
European climate. EURO4M is an important building block for a future GMES Climate Service. The
EU-projects ENSEMBLES and CIRCE are now (almost) finished but left an important legacy. In the
planning stage are the Climate Knowledge and Information Community (Climate-KIC) and the Joint
Programming Initiative (JPI) Clik’EU, as well as a new ESF/COST initiative on statistical downscaling.
Finally, two new EU-projects will start in 2011: CLIMRUN and ECLISE. These projects are fully
dedicated to underpinning work to enable the provision of local scale climate information services.
In parallel, the European Met Services have been providing operational climate services for various
application sectors (mainly practitioners) for decades, but without calling it this way. They are now in
the process of developing a roadmap for a joint EUMETNET climate capability.At the national/local
level, a large variety of national flavours for Climate Service Centre functionalities are being
developed. This is also illustrated by the large variety of portals and “national” climate change
scenarios for adaptation.
FP7 Climate Services CLIM-RUN by Paolo Ruti
CLIM-RUN aims at developing a protocol for applying new methodologies and improved modeling
and downscaling tools for the provision of adequate climate information at regional to local scale
that is relevant to and usable by different sectors of society (policymakers, industry, cities, etc.).
Differently from current approaches, CLIM-RUN will develop a bottom-up protocol directly involving
stakeholders early in the process with the aim of identifying well defined needs at the regional to
local scale. The improved modeling and downscaling tools will then be used to optimally respond to
these specific needs. The protocol is assessed by application to relevant case studies involving
interdependent sectors, primarily tourism and energy, and natural hazards (wild fires) for
representative target areas (mountainous regions, coastal areas, islands). The region of interest for
the project is the Greater Mediterranean area, which is particularly important for two reasons. First,
the Mediterranean is a recognized climate change hot-spot, i.e. a region particularly sensitive and
vulnerable to global warming. Second, while a number of countries in Central and Northern Europe
have already in place well developed climate service networks (e.g. the United Kingdom and
Germany), no such network is available in the Mediterranean.
Connecting climate research data and impact communities: CIRCLE-2 perspective and future
initiatives by Tiago Capela Lourenço (FFCUL/Portugal)
CIRCLE-2 (www.circle-era.eu) is a European Network (ERA-Net) of 34 institutions from 23 countries
committed to fund and share knowledge on climate adaptation research. It is CIRCLE-2’s goal to
design a long-term transnational collaborative programme that facilitates cooperation across
European Climate Change Impacts, Vulnerability and Adaptation (CCIVA) research programmes.

Bridging Climate Research Data and the Needs of the Impact Community - January 2011 19
More specific objectives involve establishing a network that is able to respond to policy-relevant
adaptation questions (WP1 - LEAD) by: aligning national and local climate adaptation agendas under
joint strategic science and policy areas (WP2 - DESIGN); funding joint initiatives and joint calls for
CCIVA research (WP3 - FUND); and sharing knowledge in support of Europe and CIRCLE-2 member
organisations (WP4 - SHARE). As part of this workplan, CIRCLE-2 has co-organized the present
workshop and is currently developing an InfoBase of national and sub-national adaptation projects
that can potentially play a role in bridging the gap between climate modelling communities and the
needs of climate impact and adaptation communities. The CIRCLE-2 adaptation InfoBase is being
developed in line with planned EU Adaptation Clearinghouse and can be used as a first step towards
a common European Research Area on climate adaptation research.
3.5. Session 5: Two parallel sessions on future recommendations (IS-ENES strategy)
Session 5a: Formulating recommendations for connecting climate modelling and 3.5.1.
impact research: organizational arrangements - barriers and opportunities.
Chair: Rob Swart (WUR/Netherlands)
First, it was agreed that it is time to start a discussion on The European Climate Service System . This
effort should take a step-wise approach. The participants proposed the following actions:
organize a meeting in 2011 on the synergies between IS-ENES, GMES, JPI, Clik’EU,
“European Clearing House on Climate Change Impacts, Vulnerability and Adaptation” and
ECRA;
blend global and regional data sets for model outcomes and observations (gridded data,
measurement stations), not forgetting results from the statistical downscaling community;
pay attention to short to medium term perspectives for impacts and adaptation;
define rules for database management at the European level;
strive for one entry point or a seamlessly linked system.
Secondly, the importance of a sustained user involvement mechanism was stressed, to be properly
organized. This mechanism should:
provide feedback on the proposed portal, guidance, strategy, kind of data – making it a joint
product between the data providers and user communities;
manage expectations (avoid unrealistic demands);
identify users in a wide set of other projects;
also target practitioners, including private firms and consultants, and invite them to the next
meetings (e.g., national and European networks/EIT-KIC);
include both national users (CIRCLE-2 infobase) and European networks (e.g., FP7).
Bridging Climate Research Data and the Needs of the Impact Community - January 2011 20
Thirdly, equitable involvement of all European countries should be pursued. This includes the
research and user communities and should take into account the differences between Eastern and
Western countries).
Four, a discussion on legal and financial aspects of the provision of data for commercial use is
required. The conditions for IPR for derived products should be explored. Here, learning from
experiences in the context of GMES could be helpful.
Five, European and national databases should be linked. European and national databases should
have added value as compared to the other. E.g. national databases have higher resolution
scenarios; they can provide validation, and have easier access (e.g. language), while national portals
can ensure visibility for national data.
Six, it was stressed that the impact community should be encouraged to also enhance their
coordination, because their fragmentation is part of the problem with communication between the
climate and IVA communities. This can be done on a sector-by-sector basis, but also through one
entry point (c.f. the new UNEP PRO-VIA initiative at the global level).
Seven, training programmes should be developed on the use and interpretation of climate modelling
results. Such programmes should address IVA researchers, practitioners, and students. The training
messages and materials should ideally be homogenised at the European level. One concrete idea is
to develop and integrate teaching materials from various relevant (FP7) projects that are currently
running. To do this well, additional funding sources should be identified.
Eight, it is crucial that interactions between climate modellers and IVA researchers are maintained
and strengthened, to avoid earlier experiences (e.g. the ECLAT recommendations from the 1990s are
still relevant today). For example, events could be organized every two years, possibly coupled to
other meetings (e.g., ECAC). The organization of periodic European conferences could be considered,
and the current CIRCLE-2 and JPI networks could play a role in this effort.
Session 5b: Formulating recommendations for connecting climate modelling and 3.5.2.
impact research: identification of need for direct and processed output data –
managing expectations for the proposed IS-ENES e-portal.
Chair: Pascale Braconnot (IPSL/France)
What is the e-impact portal?
It was agreed that the IS-ENES e-portal should not to replace the (national) initiatives. It should be
developed around common workflows and not only be about data, but also about tools and
information. There should be an attempt to harmonize documentation and tools. The e-portal
should build on CMIP-5 ESG data nodes, as part of a wider network. It was also agreed that within
Bridging Climate Research Data and the Needs of the Impact Community - January 2011 21
the limited timeframe of the project, the IS-ENES e-portal should not be an operational service, but a
prove of concept of the technology and the eventual platform.
Also common tools should be developed for deriving indices, for averaging, for plotting, and for
mapping. Standardization would be required: like in the METAFOR project for metadata, the e-
impact portal will try to do this for workflow and documentation.
What is needed for the e-impact portal?
First, guidance is required about the selection of which data or model to use:
provide examples of projects using the data;
provide tools for deriving parameters and indices;
provide documentation on the models, summary statistics, model differences, etc., including
overview papers (see Ensembles, Prudence),
do not only compare to observations, but also to sensitivity to climate trends (spread, etc.);
provide documentation on the projections and results;
list contact point for questions.
It was debated to what extent guidance should be provided with regard to the selection of the
number and choice of models and scenarios be given. It was suggested that the choice for the
selection the number of models and which models should be left to the impact community. This can
be done if the models are well documented.
Second, indices are required – which ones has to be gradually determined in a dialogue with the
users:
The background paper (annex 3) provides some guidance (estimated to be 95% correct, see
table 2);
Tools should be provide to compute selected indices;
Some generic analysis should be provided.
Third, (basic) error/bias correction of models should be provided, because raw data will result in
wrong usage by impact community. The extent to which this can be achieved was disputed. Some
detailed suggestions:
provide a short guidance document on how to do error/bias correction;
provide tools for doing the corrections;
document the biases of the data and how they are calculated;
explain where the biases come from (model errors, location, mismatch in initial conditions) –
while this is difficult, still bias corrections provide improved results;
note that many impact modellers are not aware of the importance of bias corrections;
provide example datasets, in dialogue with users, starting from the participants of the
workshop;
note that the ability to support bias correction is limited because all data is needed to
provide this information – however, by providing example workflows guidance can be
provided;

Bridging Climate Research Data and the Needs of the Impact Community - January 2011 22
training impact modellers on how to correctly use the data;
provide a solid core set of data with bias correction, not only for precipitation and
temperature, but also for other parameters.
Fourth, for maximum usability of model output, maps are needed for different regions, because
these are more informative than trend plots.
Fifth, the set of use cases selected for the e-impact portal should be updated. So far, the work was
limited to the running project and the number of use cases for implementation was limited, but an
attempt should be made to take into account new use cases.
Six, next to climate data, also other data (e.g. discharge data, CO2) should be made available (see
table 3 of background paper). This should be included in the IS-ENES strategy paper.
Finally, the question was discussed if access to Ensembles data should be provided. It was
acknowledged that CORDEX data will eventually replace it, but the “old” ENSEMBLES date would still
useful for comparison.
The e-impact portal is scheduled to be released in the summer of 2011. At that time, a workshop for
the evaluation of the portal will be held. The participants from the current workshop will be invited
to this workshop.
Bridging Climate Research Data and the Needs of the Impact Community - January 2011 23
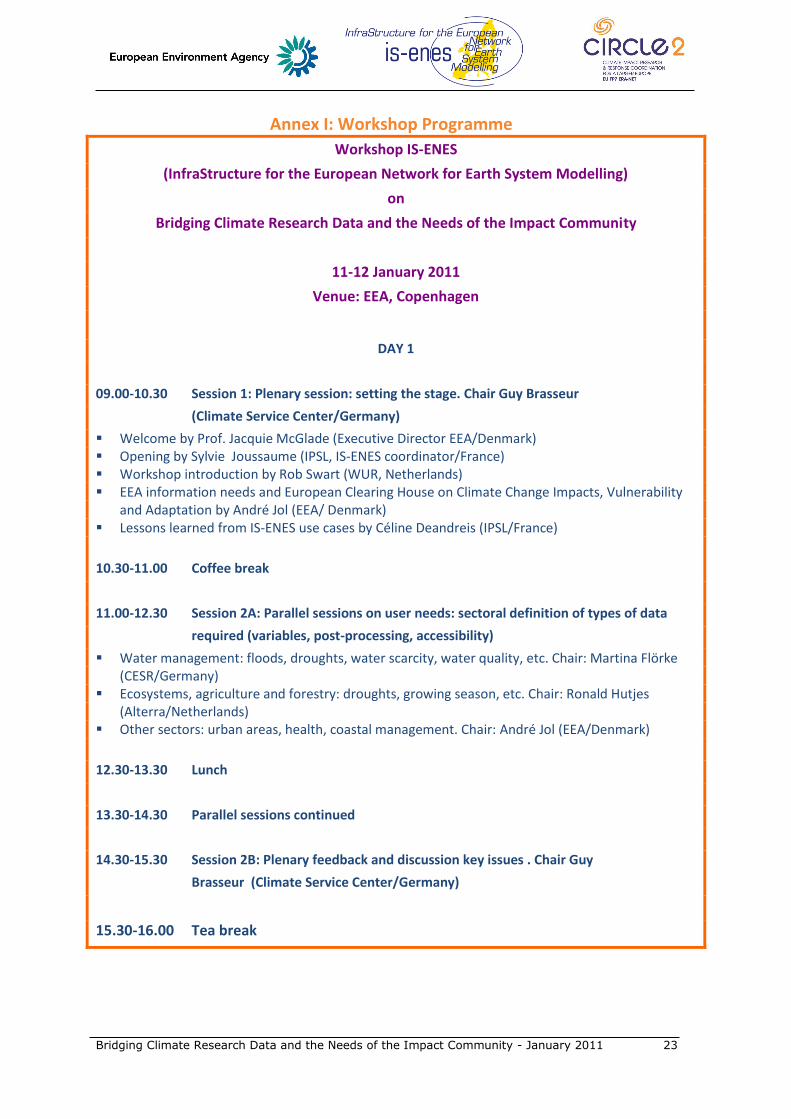
Annex I: Workshop Programme
Workshop IS-ENES
(InfraStructure for the European Network for Earth System Modelling)
on
Bridging Climate Research Data and the Needs of the Impact Community
11-12 January 2011
Venue: EEA, Copenhagen
DAY 1
09.00-10.30 Session 1: Plenary session: setting the stage. Chair Guy Brasseur
(Climate Service Center/Germany)
Welcome by Prof. Jacquie McGlade (Executive Director EEA/Denmark) Opening by Sylvie Joussaume (IPSL, IS-ENES coordinator/France) Workshop introduction by Rob Swart (WUR, Netherlands) EEA information needs and European Clearing House on Climate Change Impacts, Vulnerability
and Adaptation by André Jol (EEA/ Denmark) Lessons learned from IS-ENES use cases by Céline Deandreis (IPSL/France)
10.30-11.00 Coffee break
11.00-12.30 Session 2A: Parallel sessions on user needs: sectoral definition of types of data
required (variables, post-processing, accessibility)
Water management: floods, droughts, water scarcity, water quality, etc. Chair: Martina Flörke (CESR/Germany)
Ecosystems, agriculture and forestry: droughts, growing season, etc. Chair: Ronald Hutjes (Alterra/Netherlands)
Other sectors: urban areas, health, coastal management. Chair: André Jol (EEA/Denmark)
12.30-13.30 Lunch
13.30-14.30 Parallel sessions continued
14.30-15.30 Session 2B: Plenary feedback and discussion key issues . Chair Guy
Brasseur (Climate Service Center/Germany)
15.30-16.00 Tea break

Bridging Climate Research Data and the Needs of the Impact Community - January 2011 24
16.00-17.00 Session 3: Plenary session on data supply options. Chair: Paula
Harrison (Oxford University/United Kingdom)
Developing and providing regional climate model output by Lars Barring (SMHI/Sweden) Climate and supporting scenarios for impact research by Rob Swart (Alterra/Netherlands) Global models and uncertainties by Pascale Braconnot and Sylvie Joussome (IPSL/France)
19.00-21.00 Workshop dinner
DAY 2
09.00-10.30 Session 4: Plenary session on wider network of climate and climate impacts
services; chair: Albert Klein Tank (KNMI)
FP7 EURO4M/ECLISE/EUMETNET by Albert Klein Tank (KNMI/ Netherlands) FP7 Climate Services CLIM-RUN by Paolo Ruti (ENEA/Italy) Connecting climate research data and impact communities: CIRCLE-2 perspective and future
initiatives by Tiago Capela Lourenço (FFCUL/Portugal)
10.30-11.00 Coffee break
11.00-12.30 Session 5: Two parallel sessions on future recommendations (IS-ENES strategy),
Formulating recommendations for connecting climate modelling and impact research: organizational arrangements - barriers and opportunities. Chair: Rob Swart (WUR/Netherlands)
Formulating recommendations for connecting climate modelling and impact research: identification of need for direct and processed output data – managing expectations; chair Pascale Braconnot (IPSL/France)
12.30-13.30 Lunch
13.30-15.00 Session 6: Reporting back from parallel groups, follow-up discussion, closure and
conluding remarks. Chair: Sylvie Joussaume (IPSL/ France)
15.00-16.00 Meeting of position paper drafting team

Bridging Climate Research Data and the Needs of the Impact Community - January 2011 25
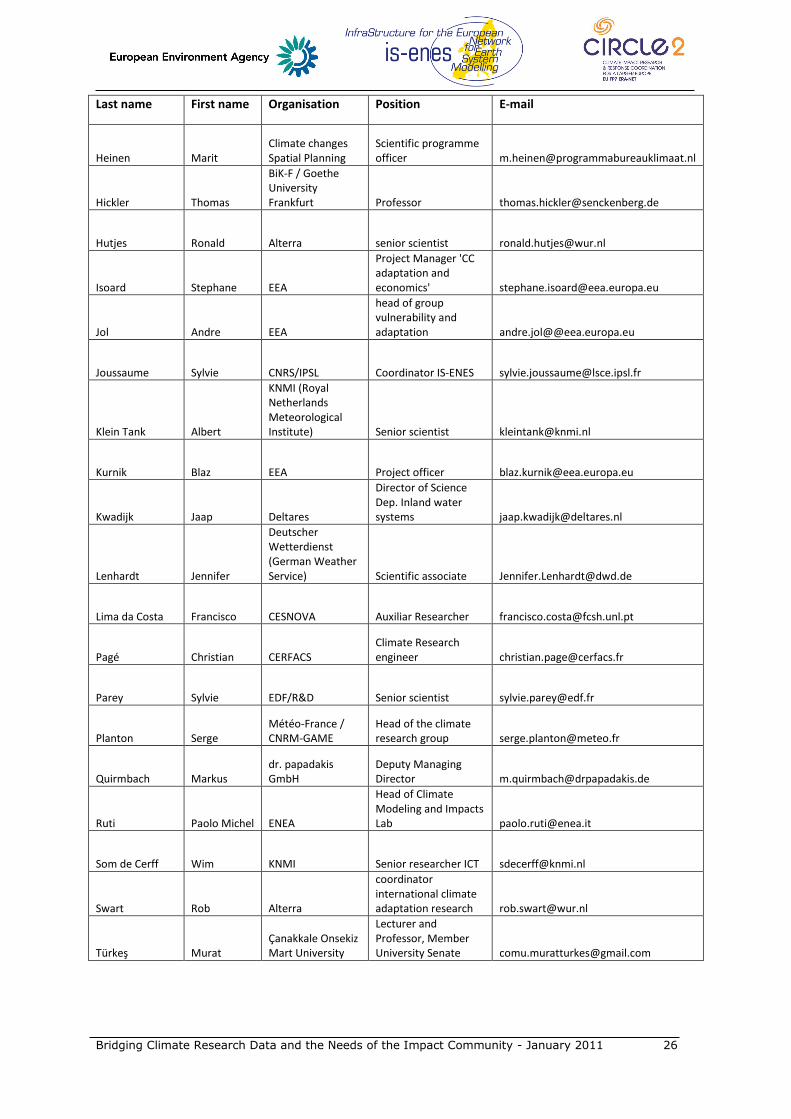
Annex II: Workshop Participants
Last name First name Organisation Position E-mail
Aguiar Ricardo
LNEG - Nat. Lab. for Energy and Geology, Portugal Senior Researcher [email protected]
Aardenne, van John
European Environment Agency
Project manager air and climate change mitigation [email protected]
Bärring Lars SMHI, Rossby Centre Senior scientist [email protected]
Braconnot Pascale LSCE Researcher at CEA pascale.braconnot
Brasseur Guy Climate Service Center Director [email protected]
Brisson Nadine INRA Research director [email protected]
Bucchignani Edoardo C.M.C.C. Research Scientist [email protected]
Capela Lourenço Tiago FFCUL C2 coordinator [email protected]
Christensen Ole B
Danish Meteorological Institute Senior scientist [email protected]
Ciavola Paolo
University of Ferrara/MICORE Project
Associate Professor/Project Coordinator [email protected]
Collins Rob EEA
Project Manager Agriculture and Water
Deandreis Celine IPSL Postdoc [email protected]
Flörke Martina
Center for Environmental Systems Research
Senior Scientist, Head of GRID Water group [email protected]
Füssel Hans-Martin EEA Project manager [email protected]
Gerdes Rüdiger Alfred Wegener Institute [email protected]
Gobiet Andreas
Univ. Graz / current: Climate Service Center Germany
Vice Director, Assist Prof, [email protected]
Gobin Anne VITO Project Manager [email protected]
Halenka Tomas Charles University, Prague associate professor [email protected]
Harrison Paula
Environmental Change Institute, University of Oxford
Senior Research Scientist [email protected]
Bridging Climate Research Data and the Needs of the Impact Community - January 2011 26
Last name First name Organisation Position E-mail
Heinen Marit Climate changes Spatial Planning
Scientific programme officer [email protected]
Hickler Thomas
BiK-F / Goethe University Frankfurt Professor [email protected]
Hutjes Ronald Alterra senior scientist [email protected]
Isoard Stephane EEA
Project Manager 'CC adaptation and economics' [email protected]
Jol Andre EEA
head of group vulnerability and adaptation andre.jol@@eea.europa.eu
Joussaume Sylvie CNRS/IPSL Coordinator IS-ENES [email protected]
Klein Tank Albert
KNMI (Royal Netherlands Meteorological Institute) Senior scientist [email protected]
Kurnik Blaz EEA Project officer [email protected]
Kwadijk Jaap Deltares
Director of Science Dep. Inland water systems [email protected]
Lenhardt Jennifer
Deutscher Wetterdienst (German Weather Service) Scientific associate [email protected]
Lima da Costa Francisco CESNOVA Auxiliar Researcher [email protected]
Pagé Christian CERFACS Climate Research engineer [email protected]
Parey Sylvie EDF/R&D Senior scientist [email protected]
Planton Serge Météo-France / CNRM-GAME
Head of the climate research group [email protected]
Quirmbach Markus dr. papadakis GmbH
Deputy Managing Director [email protected]
Ruti Paolo Michel ENEA
Head of Climate Modeling and Impacts Lab [email protected]
Som de Cerff Wim KNMI Senior researcher ICT [email protected]
Swart Rob Alterra
coordinator international climate adaptation research [email protected]
Türkeş Murat Çanakkale Onsekiz Mart University
Lecturer and Professor, Member University Senate [email protected]
Bridging Climate Research Data and the Needs of the Impact Community - January 2011 27
Annex III: Discussion Paper
Workshop IS-ENES/EEA/CIRCLE-2
on
Bridging Climate Research Data and the Needs of the Impact Community
11-12 January 2011, EEA/Copenhagen
Discussion Paper, 7 January 2011
Rob Swart
Workshop objective
The primary objective of the workshop is to make an inventory of climate data needs for analysis
and assessment of impacts, vulnerability and adaptation options (IVA) for different regions and
vulnerable sectors in Europe, to support the development of a long-term strategy for ENES (the
European Network for Earth System Modeling). ENES is developing a research infrastructure (IS-
ENES EU project, http://is.enes.org) including access to model results for future climate projections.
ENES would like to better serve needs of the IVA community. The workshop results will be taken into
account in a position paper that will be drafted in support of the ENES strategy and the development
and implementation of the Climate Adaptation Strategy that is planned for 2013. This discussion
paper proposes a number of issues that will be addressed during the workshop to guide the
discussions and will later provide input into the strategy.
In order to identify priority data needs and interest in different countries to strengthen the
interactions between the climate modeling and climate impacts communities, a questionnaire was
circulated in September 2010, using the networks of the ERA-Network CIRCLE-2 of national IVA
research programmes in Europe and a selected number of FP7 IVA projects. The results of this
questionnaire were used in support of this discussion paper. It should be noted that because of the
ENES context, the focus of the workshop and this background paper is on global climate modeling,
but from the perspective of the users global model output should be available in combination with
downscaled climate model information, climate observations, and non-climate data and scenarios.
History
Bridging the gap between the climate modeling and impact research and policy communities has a
long history. While the climate modeling community tends to be well organized because of a long
history of collaboration and a relatively small number of disciplines and methods involved, the
impacts community is much more fragmented and diverse. This has made progress in
communication between the two communities slow. Various attempts have been made at the
national and international level to close the gap, with mixed results. In this context, an important
Bridging Climate Research Data and the Needs of the Impact Community - January 2011 28
series of workshops was held in 1999-2000, in which representatives of the impact research
community discussed with climate modelers how the output of climate models could best be used
(Beersma et al., 1999; Carter et al., 2000; Cramer et al., 2000). The current effort is more pro-active
from the IVA community side: how can they influence the climate modelers’ strategy?
It seems that progress has been slow. Cramer et al. (2000) observe that 10 years ago “access to
climate data is still a significant problem for many groups working on climate impact studies”, and
“climate change scenarios for impact assessments are usually an offspring rather than an intended
result from such studies.” Beersma et al. (1999) recommend to systematically compare and assess
statistical and dynamical downscaling techniques, establish a centrally coordinated ‘European
Climate Data Centre”, provide easy access to climate model data from both GCMs and RCMs,
support the selection of relevant data from multiple scenarios and models, and properly incorporate
uncertainties in the analysis. Over the last 10 years, some modest steps have been taken to improve
this situation, particularly in the context of national and FP projects such as ENSEMBLES (FP6),
PRUDENCE (FP5), CIRCE (FP6) and many others, including the European Climate Assessment &
Dataset (ECA&D). These initiatives did however not lead to a Europe-wide, inclusive and continuous
mechanism to link the climate modeling and impact, vulnerability and adaptation communities. The
situation is hindered because in many sectors many researchers were as yet unable to adequately
articulate their needs, or do not sufficiently take data limitations into account, while data needs are
also changing over time. The responses to the questionnaire demonstrate that the problems are still
very much the same as 10 years ago. This IS-ENES initiative intends to take yet another step in the
direction of better matching climate modeling output and the needs of the impacts community.
In the context of the Global Monitoring for Environment and Security (GMES) programme, a
summary of data needs was presented in a working paper from the European Environment Agency
(EEA, 2010). This inventory shares many characteristics with the current, IS-ENES model-oriented
inventory . Key information needs for climate change impacts, vulnerability and adaptation
assessments include appropriate:
geographical coverage (the impacts of climate change transcend the boundaries of individual
countries, thus there is a need for alternative analysis units such as catchments, sea basins, bio-
geographic regions);
record length (increased length: allowing for the detection of significant trends/changes in the
environment);
consistency, in time (homogeneity considerations for time steps and reference period, to allow
for data comparability) and in space (e.g. in the analysis across national boundaries to allow for
pan-European comparability of assessments), and between variables/indicators (also for non-
physical and non-chemical variables such as socio-economic variables);
spatio-temporal resolution, (e.g. regional reanalysis, link with other spatial data);
quality (fit-for-purpose);
transparent format of data and accessible and available to stakeholders/users.
Bridging Climate Research Data and the Needs of the Impact Community - January 2011 29
The challenge for IS-ENES in collaboration with the impacts community is to expand and further
detail these requirements for future climate projections, reconciling information from national and
international sources and information systems.
Also relevant for the discussion are the 50 GCOS Essential Climate Variables (ECVs) that have been
defined to support the work of the UNFCCC and the IPCC (Table 1). While these ECVs have been
established to prioritize variables for climate and other observation systems, for the IVA community
they would be equally relevant for projections. Recently, an expert group was set up to prepare a
paper on the content of a future GMES climate service, due in spring 2011 and followed most likely
by a large stakeholder event in May/June. The service may be operational by 2013 and from an
impacts point of view may be linked to climate projections information systems (see also below).
Climate data user community
A wide variety of potential users of climate scenario data can be distinguished; varying from
IVA researchers and impact modelers,
policy advisors and experts in environmental protection agencies and other boundary
organizations
environmental consultants
policy makers working on the development and implementation of strategies,
experts from private firms vulnerable to climate change impacts (financial and insurance
sector, services infrastructure managers, etc.)
environmental and other societal NGOs.
The potential users can be identified in a large number of vulnerable sectors, e.g. as distinguished in
the “European Clearing House on Climate Change Impacts, Vulnerability and Adaptation”:
Water management;
Agriculture and forests;
Biodiversity/nature protection (terrestrial, freshwater);
Coastal areas;
Marine (biodiversity) and fisheries;
Health (human, animal, plant);
Infrastructure (transport, energy, other);
Financial instruments and insurance;
Urban and other types of spatial planning;
Disaster risk reduction.

Bridging Climate Research Data and the Needs of the Impact Community - January 2011 30
Table 1: The 50 GCOS Essential Climate Variables (ECVs, see: WMO/IOC/UNEP/ICSU, 2010)
Domain GCOS Essential Climate Variables
Atmospheric
(over land, sea
and ice)
Surface1: Air temperature, Wind speed and direction, Water vapour, Pressure, Surface radiation budget.
Upper-air 2 :Temperature, Wind speed and direction, Water vapour, Cloud properties, Earth radiation budget (including solar irradiance).
Composition: Carbon dioxide, Methane, and other long-lived greenhouse gases3, Ozone and Aerosol, supported by their precursors4.
Oceanic
Surface5: Sea-surface temperature, Sea-surface salinity, Sea level, Sea state, Sea ice, Surface current, Ocean colour, Carbon dioxide partial pressure, Ocean acidity, Phytoplankton.
Sub-surface: Temperature, Salinity, Current, Nutrients, Carbon dioxide partial pressure, Ocean acidity, Oxygen, Tracers.
Terrestrial
River discharge, Water use, Groundwater, Lakes, Snow cover, Glaciers and ice caps, Ice sheets, Permafrost, Albedo, Land cover (including vegetation type), Fraction of absorbed photosynthetically active radiation (FAPAR), Leaf area index (LAI), Above-ground biomass, Soil carbon, Fire disturbance, Soil moisture.
The type and level of specificity of data needs from these very different users and sectors will vary
according to their specific research or policy questions, and will evolve over time as one moves from
identification and analysis of potential climate threats to evaluation of the effectiveness of possible
climate response options. Some climate data needs will be similar across users and sectors, while
other needs will be very specific for particular kinds of users in different sectors. Some of these
users will have a specific goal or question in mind, others merely want to explore what is available.
The questionnaire results resulted to be rather biased in two ways, with interesting implications for
a long-term European ENES strategy. First, a majority of the respondents were from southern
Europe, with relatively few respondents from countries with an advanced scientific infrastructure
like the United Kingdom and Germany. While this could be partly related to a more effective and
eager distribution of the questionnaire by some persons on the initial mailing list, it could also be
explained by a smaller demand for a European climate data support system in those countries where
adequate national sources of information are available and interactions between climate modelers 1 Including measurements at standardized, but globally varying heights in close proximity to the surface.
2 Up to the stratopause
3 Including nitrous oxide (N2O), chlorofluorocarbons (CFCs), hydrochlorofluorocarbons (HCFCs),
hydrofluorocarbons (HFCs), sulphur hexafluoride (SF6), and perfluorocarbons (PFCs).
4 In particular nitrogen dioxide (NO2), sulphur dioxide (SO2), formaldehyde (HCHO) and carbon monoxide (CO).
5 Including measurements within the surface mixed layer, usually within the upper 15m.

Bridging Climate Research Data and the Needs of the Impact Community - January 2011 31
and IVA researchers are relatively well-established. The second bias reflects the dominant attention
to climate change impacts and adaptation in water and land-related sectors (like river floods, water
scarcity and drought, heat waves/health, and agriculture, forestry and ecosystems, respectively). The
research in the other sectors is much more limited, and also climate concerns are less important in
the policy debate in these other sectors (e.g., marine issues, spatial and urban planning, health,
tourism, energy, transport and infrastructure networks).
Proposition 1: In the coming years, climate modeling, climate monitoring and other climate research
activities should account for a much more diverse group of users, in terms of types of sectoral
impacts (not limited to land- and water-related impacts) and in terms of their functions (from impact
modelers to governments at different levels to private sector decision makers), covering all relevant
European regions with a very different level of knowledge. Data needs in sectors other than water
resource and land management tend to be less well articulated and require special attention.
Broad categories of climate data needs
The climate data needs of the impacts community vary widely. In both science and in policy the
emphasis is on potential climate impacts and adaptation in the areas of water safety and flooding,
water scarcity, and impacts on agriculture, ecosystems and forestry. Therefore climate model output
on extremes in temperatures and precipitation are most frequently demanded (see also annex).
Other variables, such as those related to marine and coastal variables (temperatures, waves, local
sea level rise) to air quality, or wind patterns are required for more specific applications, Carter
(2009) suggests to distinguish between data and tools for non-specialists, requiring relatively little
storage capacity because they mostly demand information about a limited number of derived
indices, and data and tools for more specialized users, requiring much more storage capacity
because of the full amount of raw and derived data. The former category may need more and more
clear guidance, the latter category may need less guidance, but may require more personalized
services.
Proposition 2: Climate modeling output could distinguish between the needs of the impacts
community for non-specialized and for specialized, niche users, both in terms of data volume and in
terms of guidance and support provided. These types of service require different levels of expertise
and resources - while non-specialized users may be served by largely generic information, niche users
may require tailored information that requires frequent interactions.
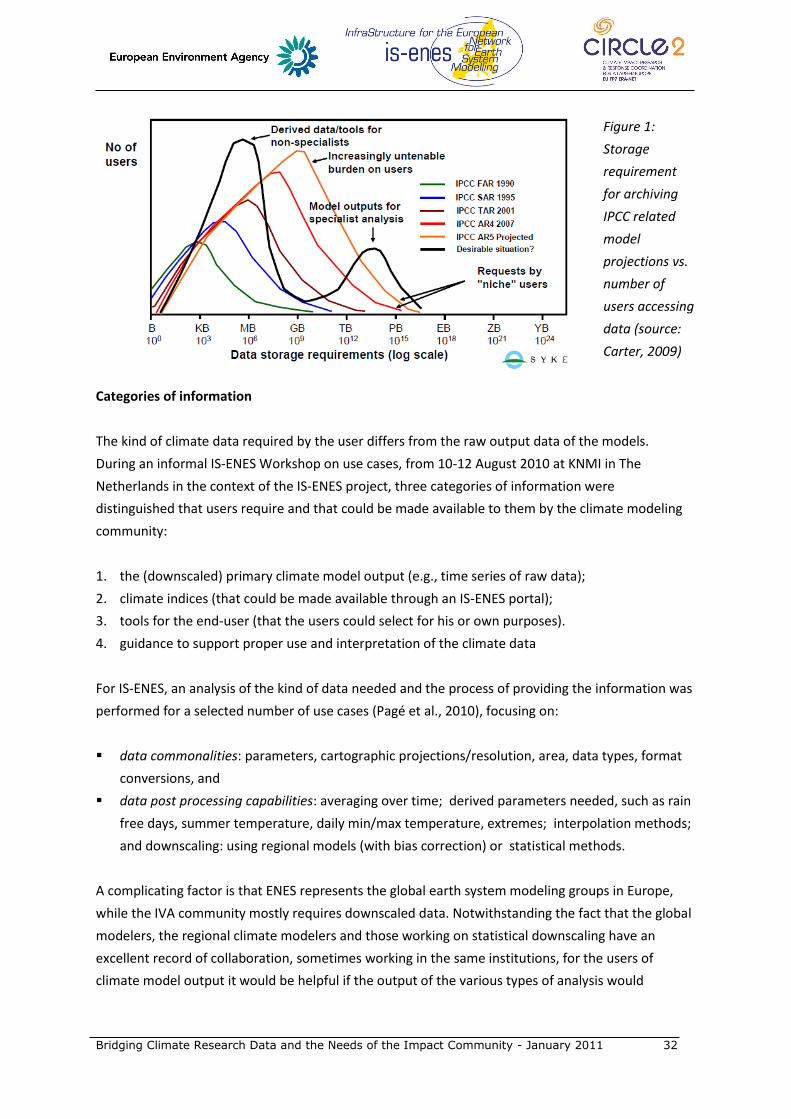
Bridging Climate Research Data and the Needs of the Impact Community - January 2011 32
Figure 1:
Storage
requirement
for archiving
IPCC related
model
projections vs.
number of
users accessing
data (source:
Carter, 2009)
Categories of information
The kind of climate data required by the user differs from the raw output data of the models.
During an informal IS-ENES Workshop on use cases, from 10-12 August 2010 at KNMI in The
Netherlands in the context of the IS-ENES project, three categories of information were
distinguished that users require and that could be made available to them by the climate modeling
community:
1. the (downscaled) primary climate model output (e.g., time series of raw data);
2. climate indices (that could be made available through an IS-ENES portal);
3. tools for the end-user (that the users could select for his or own purposes).
4. guidance to support proper use and interpretation of the climate data
For IS-ENES, an analysis of the kind of data needed and the process of providing the information was
performed for a selected number of use cases (Pagé et al., 2010), focusing on:
data commonalities: parameters, cartographic projections/resolution, area, data types, format
conversions, and
data post processing capabilities: averaging over time; derived parameters needed, such as rain
free days, summer temperature, daily min/max temperature, extremes; interpolation methods;
and downscaling: using regional models (with bias correction) or statistical methods.
A complicating factor is that ENES represents the global earth system modeling groups in Europe,
while the IVA community mostly requires downscaled data. Notwithstanding the fact that the global
modelers, the regional climate modelers and those working on statistical downscaling have an
excellent record of collaboration, sometimes working in the same institutions, for the users of
climate model output it would be helpful if the output of the various types of analysis would

Bridging Climate Research Data and the Needs of the Impact Community - January 2011 33
seamlessly be available through the same information system, accompanied by guidance on how to
use and interpret the various types of results.
Proposition 3: Different types of climate information (observations, global climate model output,
downscaled climate projections, derived climate indices, tools and guidance) should all be available
through one information system or a network of seamlessly linked systems with appropriate
guidance for users to find what they need.
Primary climate model data output
Earlier attempts to determine climate model data needs suggest that most, if not all, users working
on climate change impacts, vulnerability and adaptation require data that in some way have been
processed, preferably by the data providers. Table 1 gives a flavour of the kind of derived
parameters, as derived from the use cases. Data in the left column may need processing before they
can be used to derive the parameters in the 2nd column, e.g. to eliminate the bias in climate models,
or to adjust the spatial of temporal resolution. Please note that variables related to marine issues
such as sea surface temperature and sea level rise are missing from this inventory, because they
were not included in the use cases and only a selected number of ENES partners address these
issues. These variables would have to be added in the future.
Climate indices
The workshop at KNMI identified a number of options for the second category of “secondary output”
that could be made available trough an IS-ENES portal (see also Table 1):
Climate indices according to STARDEX (http://www.cru.uea.ac.uk/projects/stardex/) and/or
ECA&D WMO’s (http://eca.knmi.nl/) indices;
Daily/monthly/yearly (average) products from specific parameters to speed up calculations of
other indices;
Interpolation: nearest neighbor and bi-linear;
Visualization of maps (scene selection / comparison).
Downscaling and bias-correction would not be done in the portal but by the climate expert.
Available results could then become available again on the data portal. Supporting tools (see next
section) could be provided to assist users. If the portal would be part of an expanded climate
services centre with professional staff these activities could be performed by the centre as well
(possibly paid services).
Proposition 4: To better connect with the users, there is a need to focus on transferring information
in terms of derived climate indices, some of which could be generically provided to non-specialist
users, while other should be responding to the needs of specialists. Particularly indices on extreme
events and of extreme (worst or best case) scenarios for impact analysis are relevant from an
impacts and adaptation perspective. A much more active role of the user community is required to
guide this process.
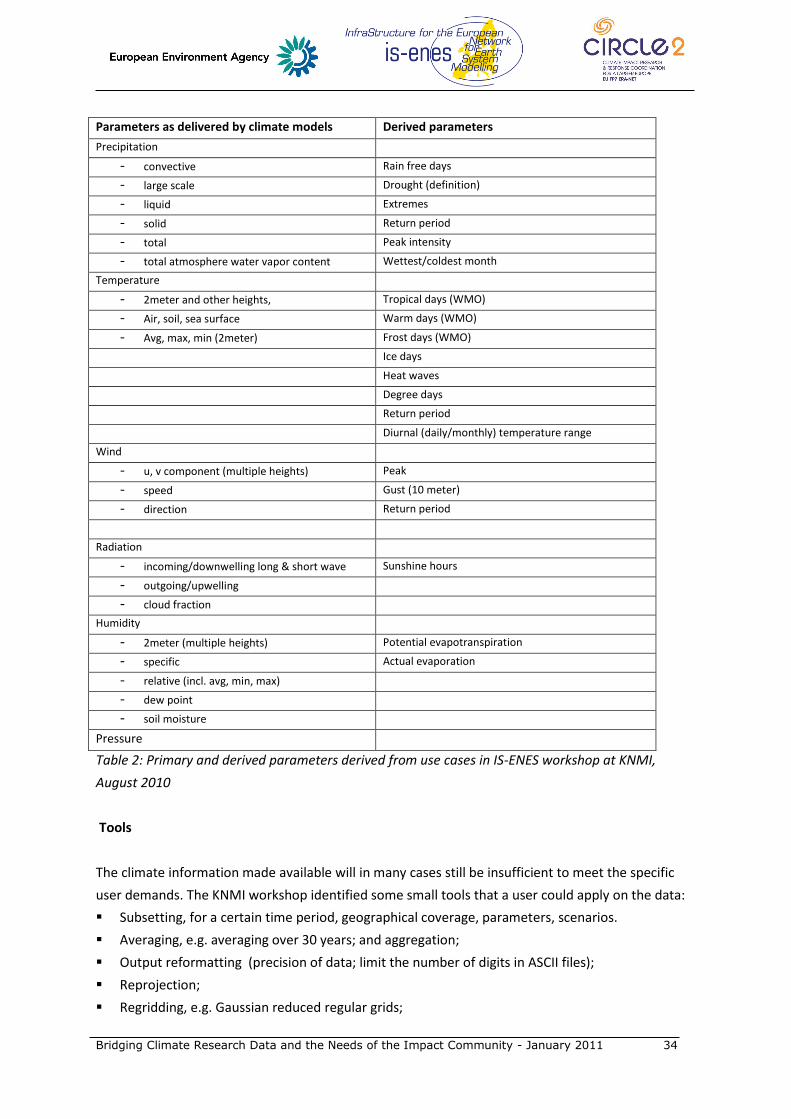
Bridging Climate Research Data and the Needs of the Impact Community - January 2011 34
Parameters as delivered by climate models Derived parameters
Precipitation
- convective Rain free days
- large scale Drought (definition)
- liquid Extremes
- solid Return period
- total Peak intensity
- total atmosphere water vapor content Wettest/coldest month
Temperature
- 2meter and other heights, Tropical days (WMO)
- Air, soil, sea surface Warm days (WMO)
- Avg, max, min (2meter) Frost days (WMO)
Ice days
Heat waves
Degree days
Return period
Diurnal (daily/monthly) temperature range
Wind
- u, v component (multiple heights) Peak
- speed Gust (10 meter)
- direction Return period
Radiation
- incoming/downwelling long & short wave Sunshine hours
- outgoing/upwelling
- cloud fraction
Humidity
- 2meter (multiple heights) Potential evapotranspiration
- specific Actual evaporation
- relative (incl. avg, min, max)
- dew point
- soil moisture
Pressure
Table 2: Primary and derived parameters derived from use cases in IS-ENES workshop at KNMI,
August 2010
Tools
The climate information made available will in many cases still be insufficient to meet the specific
user demands. The KNMI workshop identified some small tools that a user could apply on the data:
Subsetting, for a certain time period, geographical coverage, parameters, scenarios.
Averaging, e.g. averaging over 30 years; and aggregation;
Output reformatting (precision of data; limit the number of digits in ASCII files);
Reprojection;
Regridding, e.g. Gaussian reduced regular grids;
Bridging Climate Research Data and the Needs of the Impact Community - January 2011 35
Indices calculation (ECA&D WMO standard, using existing tools like CDO)
Comparison, e.g., parameters from different scenarios / ensembles
The questionnaire results confirm the need for information that has been processed into indices and
visualized through maps or otherwise.
Proposition 5: To better respond to the needs of the impacts community, In the future the climate
modeling activities should develop simple post-processing tools, e.g. for simple statistics, data
conversions, or visualization, accompanied by guidance on how to use and interpret the information
with proper account of uncertainties and data limitations. However, for many applications specific
tailor-made information is required that cannot be meaningfully made available in a generic way.
Different scenarios
Ideally, for impact analysis a relevant, broad range of possible future scenarios and of available
model output should be used. In practice, often only one or a very limited number of scenario runs
from one or just a few models are used for reasons of resource constraints and data accessibility.
Previous interactions between the impacts and climate modeling communities have focused on
understanding the climate scenarios that were produced for reasons other than impact analysis,
including very legitimate reasons such as scientific curiosity and resources limiting the number of
possible scenario runs. Currently, most of the new modeling runs are being performed on the basis
of the IPCC Representative Concentration Pathways (RCPs) in the context of CMIP5. These RCPs
cover a wide range of possible and policy-relevant future pathways, and will be complemented by a
new set of socio-economic scenarios in parallel to the climate modeling experiments.
It should be noted that for analysis of impacts and adaptation on short to medium time scales the
differences between different emissions scenario-based climate scenarios are relatively small since
they only start to diverge in the second half of the century. More important for impact, vulnerability
and adaptation analysis at these time scales would be a meaningful combination of the climate
change pathways with short- to medium term scenarios for socio-economic development that
determine future sensitivity and adaptive capacity, factors that are particularly important for
adaptation policy development.
The questionnaire results suggest that not only most impact researchers recognize the need for
covering the full range of future climate, many also specifically prioritize the outer ends of the range,
allowing for an evaluation of a worst case future and of a situation in which GHG concentrations
would be stabilized at a low level. Because the RCP runs are already being implemented, requests
from the impacts community for particular types of scenarios that may not be covered by the RCPs
seems to be relevant for the next round of experiments only. However, there seems to be an urgent
need to help impact researchers find their way in the multitude of climate modeling output that is
expected over the next few year. Especially less experienced researchers and practitioners in
resource-constrained situations would require such guidance.

Bridging Climate Research Data and the Needs of the Impact Community - January 2011 36
Proposition 6: The climate modeling and impacts communities should jointly work on developing
guidance for impact researchers and practitioners on how to select and interpret climate modeling
output and climate scenarios in a way that best matches their needs. In addition, coordination with
the provision or development of socio-economic and land-use scenarios required for IVA analysis is
important, in particular for short to medium time scales.
Dealing with uncertainties
The questionnaire shows that many respondents do not easily understand and interpret the
uncertainties involved in the climate model output. They recognize that uncertainties are often very
high for changes that are most relevant for them (eg precipitation, extreme events, local changes). In
this context also understanding the relative importance of uncertainty in the climate projections as
compared to uncertainties in other factors that determine impacts and vulnerability is crucial.
Uncertainties arise from different sources : scenarios (see above), internal climate variability, model
uncertainties (e.g., parameterization, spatial scales), and even knowledge uncertainties. Ensemble
simulations help address both internal climate variability and model uncertainties. They will even
better address the space scale uncertainties with the CMIP5/CORDEX simulations. However, how to
deal with all the information available will require adapted tools and guidance.
Proposition 7: The climate modeling and impacts communities should jointly work on developing
guidance for the wide variety of impact researchers and practitioners on how to deal with the
different type, levels and relevance of uncertainties, especially those related to climate model
uncertainties both at global and regional scale in a broader context that involves also other pertinent
uncertainties.
Climate projections data sources
According to the questionnaire results, users now get their climate modeling data from either global
sources as the IPCC DDC , European sources as ENSEMBLES or PRUDENCE sites, or from national
sources, such as national or regional climate modeling groups, in about equal numbers. It is unclear
to what extent this is an intentional choice or if it can be explained by the proximity or perceived
accessibility of these sources, the preferred type of information or by other reasons. Problems that
respondents to the questionnaire reported as to problems with data access can be categorized into
five groups: inadequate spatial and temporal resolution, problems with data format, uncertainty or
lack of reliability, specific local application needs, and poor accessibility or costs. It seems desirable
that IS-ENES contributes to a harmonization of all climate modeling sources, aiming at a seamless
integration of global, European and national information sources through one central entry point
Bridging Climate Research Data and the Needs of the Impact Community - January 2011 37
that also ensures guidance on selection and usage of data. Here, a lot is to be learned from national
experiences with making available climate projection information, notably in the United Kingdom.
Proposition 8: Access to climate scenario also beyond experienced expert users should be improved
by better integration/harmonization of data sources at different geographic level, guidance for
selection of scenarios and interpretation of model uncertainties, and user friendly interfaces offering
various data formats, removing any institutional or financial constraints.
Ackowledgements
Sylvie Joussaume, André Jol, Janette Bessembinder, Marit Heinen and Fons Jaspers provided
comments on an earlier version of this background note.
References
Beersma, J., M. Agnew, D. Viner and M. Hulme, 2000. Climate Scenarios for
Water-Related and Coastal Impacts, ECLAT-2 KNMI Workshop Report No. 3
(http://www.knmi.nl/onderzk/klimscen/papers/EW-3_Full.pdf)
KNMI, the Netherlands; published by the Climate Research Unit, UEA, Norwich, UK
Carter, T.R., M. Hulme and D. Viner, 1999. Representing Uncertainty in
Climate Change Scenarios and Impact Studies. ECLAT-2 Workshop Report No . 1
Helsinki, Finland, published by the Climate Research Unit, UEA, Norwich, UK
Carter, T. 2009. Bridging the gap between climate information and
impact/adaptation application. In: WCRP, 2009. Workshop Report Evaluating and Improving
Regional Climate Projections, Toulouse, France, 11-13 February 2009. WCRP Informal Report
No. 5/2009
Cramer, W., R. Doherty, M. Hulme and D. Viner, 2000. Climate scenarios for
agricultural, forest and ecosystem impacts. ECLAT-2 Workshop Report No. 2, Potsdam,
Germany, 13-15 October 1999. Published by the Climatic Research Unit, UEA, Norwich, UK
(http://www.pik-potsdam.de/members/cramer/publications/edited-books/ew-2_full.pdf)
EEA, 2010. Towards a possible GMES Contribution for Climate Change – EEA information needs for
environmental assessments as a basis for European policy making. Draft working paper.
European Environment Agency, Copenhagen, Denmark.
Pagé, C. et al., 2010. Final description of selected Use Cases including user requirements
specification. IS-ENES deliverable
WMO/IOC/UNEP/ICSU, 2010. Implementation Plan for the Global Observing System for Climate in
support of the UNFCCC (2010 update). GCOS-138

Bridging Climate Research Data and the Needs of the Impact Community - January 2011 38
Annex IV: Summary of results from questionnaire
Bridging Climate Research Data and the Needs of the Impact Community
Rob Swart and Fons Jaspers, Alterra
Draft 20 December 2010
1. Introduction and background
In September a questionnaire was distributed amongst climate data users in Europe in the
context of the IS-ENES project, the infrastructure project of the European Network for Earth
System Modeling, supported by the EU’s 7th framework programme. IS-ENES intends to focus
future climate modeling analysis in Europe on the climate data needs of the user community.
The largest group of climate scenario data users are expected to be researchers in the area of
climate change impacts, vulnerability and adaptation (CCIVA). The questionnaire was therefore
distributed mainly through the CIRCLE-2 ERA network of the national CCIVA research
programmes in Europe (see also http://www.circle-era.net/) and the coordinators of some 25
relevant EU FP7 projects. It is acknowledged that also practitioners (like consultants, experts in
science-policy boundary organizations, NGO’s) and some end users in the policy community may
use climate modeling output directly, but within the time constraints of the project they were
not explicitly targeted in this questionnaire exercise due to the fact that their community is even
more fragmented and dispersed over a very wide number of vulnerable sectors in all EU
countries at different geographic levels. In a later phase of the project it will be explored how
this community can be involved most effectively.
Through completion of the questionnaire respondents had an opportunity to influence future
climate model analysis in Europe and the way the results will be made available, because the
results will be used as input for the development of the IS-ENES strategy for the coming years
and for the organization of the IS-ENES workshop that will be held from 11-12 January 2011 in
Copenhagen in cooperation with the European Environmental Agency (EEA) and CIRCLE-2. The
output of the questionnaire has contributed to the development of the programme of the
workshop and the identification of participants. Eventually, this activity may also support the
development of the European Clearinghouse on Climate Change Impacts Vulnerability and
Adaptation, one of the elements of a new European Climate Change Adaptation Strategy to be
developed following the EU White Paper on Adaptation
(http://ec.europa.eu/environment/water/adaptation/index_en.htm).

Bridging Climate Research Data and the Needs of the Impact Community - January 2011 39
2. Nature, number and quality of responses
About 250 CCIVA experts filled in the questionnaire, but because several did not fill in the
question in a sufficiently complete or otherwise satisfactory way, we used only 225 responses as
the basis for this summary note. The results in this summary note should be viewed with caution,
because the respondents may not be fully representative of the full user community in Europe.
Regional distribution of respondents
The most important bias in the group of respondents was that a significant majority was from
only a limited number of countries, notably in Southern Europe (Spain, Portugal, to a lesser
extent France, Italy and Turkey), while only a limited number of responses came from countries
with an important CCIVA research community, such as the United Kingdom, Germany and
Scandinavian countries.
Mediterranean West Europe Central-north Europe
Spain 94 UK 4 Switzerland 1
Portugal 60 Netherlands 4 Sweden 5
Turkey 10 Germany 2 Estonia 1
Italy 9 Belgium 8 Slowak Rep 2
France 7 Ireland 6 Austria 12
Total 180 24 21
225=100% 80% 11% 9%
Table 1: Nationality of respondents (228)
We can only speculate about the reasons for this bias, but we offer three: (a) the distribution of
the questionnaire after the initial contacts in the southern European countries was much more
effective, (b) experts in countries like the UK, Germany and Scandinavian countries have less
interest in a European climate project like IS-ENES, since the climate data they need can easily
be accessed through advanced national sources, and, related, (c) many of the respondents in
Southern European countries appear to be researchers who only started recently to work on
climate change impacts research and appeared eager to become involved in Europe-level work.
The latter suggestion is also supported by the fact that especially representatives from this
regions were unaware of earlier exercises of this nature (see also 8). Since Southern Europe is
particularly vulnerable to climate change impacts, it seems important to explicitly account for
their input in the planned workshop and the IS-ENES strategy.
Jobs of the respondents

Bridging Climate Research Data and the Needs of the Impact Community - January 2011 40
The majority of the respondents are impact researchers and can be considered to be the core
group of the discussion about “climate data needs of the impacts community”. They play the key
role in using the climate modeling information (which in many cases is not directly relevant for
policymakers) for analysis of policy-relevant potential impacts and transfer the results to
decision-makers in the area of climate adaptation, bridging the gap between the long-term
climate projections and the political reality of short term policy making and between the global
and local and regional scale.
Figure 1: Jobs of the respondents
Sectoral distribution of respondents
If grouped in four main categories of vulnerable areas (Figures 2 and 3, Table 2), about two
thirds of the respondents were working on land- and water-related climate change impacts
(agriculture, forestry and ecosystems, and water safety and scarcity, respectively). Also a fair
number of respondents reported to work on marine and coastal issues, while relatively few
reported to work on other issues, mainly impacts in the urban environment, including health.
This is in line with the emphasis on land- and water-related issues in national climate change
adaptation planning (see, e.g., Swart et al., 2009; Massey, 2010). Within these main categories,
respondents show a wide distribution of specific subareas in which they specialize.
job of respondents
0
20
40
60
80
100
120
140
climate
modeler
impact
researcher
adaptation
expert
research
manager
policy maker
total of domains of 639 responses by 228 respondents
0
5
10
15
20
25
30
35
40
w ater 231 land 191 coast 98 urban 119

Bridging Climate Research Data and the Needs of the Impact Community - January 2011 41
Figure 2: Distribution of respondents over specific work areas in the a) water (231),b) land (191),
c) marine/coastal (98) and d) other categories (119). Main (upper panel) and sub (lower panel)
categories
Figure 3: Distribution of respondents over specific work areas in the water (a), land (b),
marine/coastal (c) and other (d) categories.
dominant domains for climate change data use
on 639 responses
0,0
2,0
4,0
6,0
8,0
10,0
12,0na
tura
l
ecos
yste
ms
wat
er
scar
city
and
drou
ght
river
bas
in
man
agem
ent
flood
ris
ks
agric
ultu
re
wat
er
quan
tity
wat
er q
ualit
y,
was
te w
ater
fore
stry
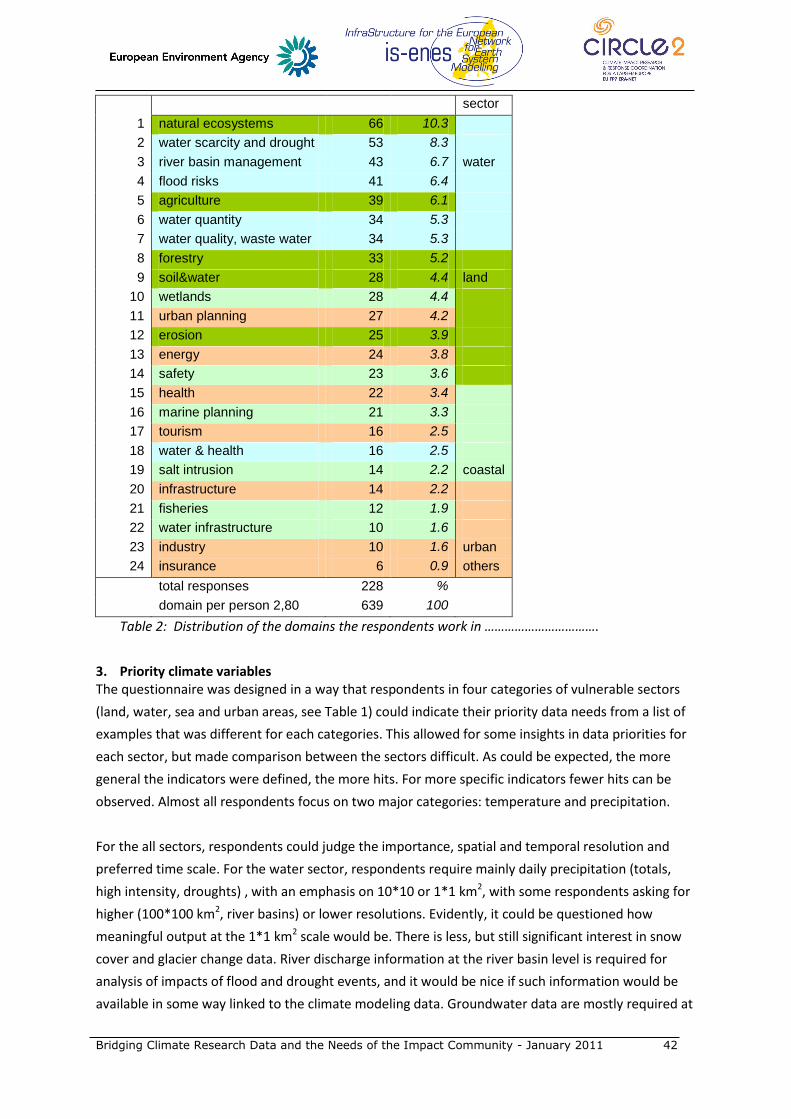
Bridging Climate Research Data and the Needs of the Impact Community - January 2011 42
sector
1 natural ecosystems 66 10.3
2 water scarcity and drought 53 8.3
3 river basin management 43 6.7 water
4 flood risks 41 6.4
5 agriculture 39 6.1
6 water quantity 34 5.3
7 water quality, waste water 34 5.3
8 forestry 33 5.2
9 soil&water 28 4.4 land
10 wetlands 28 4.4
11 urban planning 27 4.2
12 erosion 25 3.9
13 energy 24 3.8
14 safety 23 3.6
15 health 22 3.4
16 marine planning 21 3.3
17 tourism 16 2.5
18 water & health 16 2.5
19 salt intrusion 14 2.2 coastal
20 infrastructure 14 2.2
21 fisheries 12 1.9
22 water infrastructure 10 1.6
23 industry 10 1.6 urban
24 insurance 6 0.9 others
total responses 228 %
domain per person 2,80 639 100
Table 2: Distribution of the domains the respondents work in …………………………….
3. Priority climate variables The questionnaire was designed in a way that respondents in four categories of vulnerable sectors
(land, water, sea and urban areas, see Table 1) could indicate their priority data needs from a list of
examples that was different for each categories. This allowed for some insights in data priorities for
each sector, but made comparison between the sectors difficult. As could be expected, the more
general the indicators were defined, the more hits. For more specific indicators fewer hits can be
observed. Almost all respondents focus on two major categories: temperature and precipitation.
For the all sectors, respondents could judge the importance, spatial and temporal resolution and
preferred time scale. For the water sector, respondents require mainly daily precipitation (totals,
high intensity, droughts) , with an emphasis on 10*10 or 1*1 km2, with some respondents asking for
higher (100*100 km2, river basins) or lower resolutions. Evidently, it could be questioned how
meaningful output at the 1*1 km2 scale would be. There is less, but still significant interest in snow
cover and glacier change data. River discharge information at the river basin level is required for
analysis of impacts of flood and drought events, and it would be nice if such information would be
available in some way linked to the climate modeling data. Groundwater data are mostly required at

Bridging Climate Research Data and the Needs of the Impact Community - January 2011 43
the river basin level, for longer time scales (months, seasons). This group of respondents focused on
indicators related to water quantity rather than quality, with less interest in issues like water quality
and temperature.
The results for the sector related to land (agriculture, forestry, ecosystems) are very similar, with the
emphasis on spatial resolution in the categories 10*10 km2 or, to a lesser extent, 1*1 km2, and
temporal resolution of daily and monthly totals, with some expected demands for hourly data for
precipitation intensity (extreme events) serving run-off, soil and water management, agriculture,
forestry and ecosystem experts. Similar to water, also for this group of subjects the emphasis was on
air temperature and precipitation, less on air and water quality.
Again for coastal ands marine issues, results are very similar in terms of spatial and temporal
resolution. This group evidently shows a different set of required climate indicators, including
indicators related to wind, waves, and sea water characteristics, like salinity and temperature. It is to
be discussed how IS-ENES should address coastal and marine issues in its e-portal development,
because the emphasis of the experiments is often on ocean processes required to project
atmospheric and climatic changes rather than to service climate impact users who are interested in
the effects of climate change on marine ecosystems and coastal safety.
Even more than for the other sectors, users working on urban impacts and adaptation would like to
have the highest resolution possible, because of the small areas they focus on. An important
discussion item is for which type of particular scientific and policy questions such high resolution is
really needed, and for which question more general information is required.
Figure 4: Preferred technical data characteristics in terms of data transfer (a), data format (b), and
data transfer protocols GIS files (c)
4. Priority data format

Bridging Climate Research Data and the Needs of the Impact Community - January 2011 44
The questionnaire also addressed the way and format in which climate scenario data should be
made available. As to the question where they would go to get the data they need (Figure 4a), more
than half of the respondents prefer just to go to a public website, while more than a third is also
comfortable with ftp-sites or password protected intranets. Only a small minority still requires data
on dvd, reflecting the great improvement in electronic transfer of large data sources. As to the data
format, about half prefers Excel files (CSV), about one third ASCII and one sixth netCDF. As to
preferred transfer protocol for GIS files, most prefer WMS, while one sixth mentions WCS and an
equal number WFS. These results suggest that in order to serve this group of users, all of the
suggested formats should be taken into account by a future IS-ENES data portal, maybe with the
exception of a dvd service. No questions were asked about costs, but it is likely that many users
would not use those data that come at a high cost.
5. Preferred data sources
As to the current sources of climate scenario data, respondents report a mix of global, European and
national data sources in about equal numbers and overlapping (some using more than one source).
One half reports to use global sources, such as the IPCC DDC, while the other half mainly relies on
national (e.g. national meteorological institutes or other climate research institutions) or European
(e.g., ENSEMBLES, PRUDENCE) sources, dependent on the availability downscaled in specific projects.
Some (still) use only historical data rather than model outcomes. Some report other sources, which
include specific projects . Many respondent probably use combinations of the various sources - it
appears that the choice of data sources is rather ad hoc, probably related to existing and past
national and international research networks. Although the questionnaire had no explicit question
about this, one may surmise that this rather ad hoc character of selecting data sources may also be
related to the multitude of seemingly disparate sources on the web, and the many problems impact
researchers encounter with the accessibility of the various data sets (see section 8: Problems and
limitations related to current or past availability of climate data). This suggests that there is a clear
need for better streamlining and integration of available climate data sources, e.g. in the proposed
network of European climate services. Also 50% does not use the global data at all (82), partly
because they only rely on historical data sets (7).
6. Dealing with uncertainties and scenario selection
The questionnaire also tried to get an idea of the way the respondents address or would like to
address uncertainties through the selection and analysis of particular types of scenarios. In particular,
we asked if they would like to have probabilistic scenario information available as recently made
available in the UK for UK researchers. Of the respondents, about half was interested in probabilistic
scenario outcomes, while the other half responded to be comfortable with a range of scenarios. Of
course, it is uncertain to what extent the respondents asking for probabilistic data would also be
able to properly use and interpret these data, with a higher degree of complexity. In a recent

Bridging Climate Research Data and the Needs of the Impact Community - January 2011 45
workshop on dealing with uncertainties, this question was also addressed. Following the publication
of probabilistic scenarios for climatic change and selected impacts in the United Kingdom, the
demand for this kind of scenario output has increased. Indeed, such scenarios add some quantitative
idea of likelihood of future changes under particular emissions scenarios. However, producing and
communicating them well is very resource intensive, while they still do not capture all uncertainties,
and their complexity tends to make them difficult to interpret for practitioners and policy makers.
The interpretation of climate risk information and its use for adaptation decision making should be
carried out with extreme caution: over-interpretation of such projections could lead to mal-
adaptation (van Pelt et al., 2010). This issue will certainly be further discussed during the IS-ENES
workshop and beyond.
As to a question about particular selections of scenarios more than 40 % of the respondents referred
to the SRES or the new IPCC Representative Concentration Pathways (RCPs). About a quarter of the
respondents specifically referred to either “worst” and “best” case scenarios, the former referring to
high emissions scenario’s and the latter to stabilization scenarios related to the EU’s two degree
climate target (Figure 5). The rather ad hoc usage of what ever scenarios from whatever model
would be most easily accessible in past and current projects makes this an important issue for
further discussion. It should be noted however that for analysis of impacts and adaptation on short
to medium time scales the differences between different climate scenarios based on a range of
emissions scenarios are relatively small since they only start to diverge in the second half of the
century. As the current CMIP5 exercise and the range of RCPs will make an even greater amount of
climate scenario data available in the coming years, a proper selection of outcomes for impact
analysis that both represents cases relevant from an impacts point of view but also reflects the full
range of uncertainties is a large challenge.
Figure 5: Preference for
particular types of
scenarios in impacts
analysis
7. Earlier data needs inventories
prefered scenarios after 5 years
0
20
40
60
80
100
new many worst 2degree other
scenarios
rep
so
nd
en
ts
Bridging Climate Research Data and the Needs of the Impact Community - January 2011 46
The questionnaire also asked for information on possible earlier inventories of data needs. Less than
10% of respondents noted such earlier exercises at the national or international level, most of which
were not clearly specified or referenced, making it difficult to trace the results of these earlier efforts.
Those which were specified, often had a slightly different objective than IS-ENES. Nevertheless, this
seems to suggest that many of the respondents represent an emerging impact research community
which is not fully aware of earlier activities in this area. This also implies that the examples below do
probably not provide the full picture.
Global efforts
Reference is made by some respondents to WMO’s World Data Centre for Climate (WDCC) and the
IPCC Data Distribution Centre (IPCC-DDC). These facilities appear to archive and make available
climate information (the former focusing mainly on observations, the latter on climate modeling
output) rather than supporting the future design of climate model runs. Generally, it is
acknowledged that the fragmentation of the climate change impacts community is a major factor
complicating comprehensive and coordinated interactions between the climate modeling and
impact research communities. To redress the lack of organization and coordination within the CCIVA
community, UNEP in partnership with WMO, UNESCO and other partners is establishing an new
scientific Joint Programme, as part of the Global Framework for Climate Services called the
Programme of Research on Climate Change Vulnerability, Impacts and Adaptation (PRO-VIA). The
central objective of PRO-VIA is to prioritize, accelerate, harmonize, mobilize, and communicate
CCIVA research.
European efforts
Some respondents referred to ECLAT-2 (A Concerted Action Towards the Improved Understanding
and Application of Results from Climate Model Experiments in European Climate Change Impacts
Research). ECLAT-2 organized a series of workshops in 1999-2000, in which representatives of the
impact research community discussed with climate modelers how the output of climate models
could best be used (Beersma et al., 1999; Carter et al., 2000; Cranmer et al., 2000). ECLAT-2
recommends that the network of climate modelers, impact researchers, scenario developers and
stakeholders that has been established during the two ECLAT projects should be maintained and
extended. Even if some advances were made in connecting the climate modeling and impact
research communities, after ten years most of the ECLAT-2 recommendations are still valid today.
However they focused on how impact researchers should best used whatever information climate
modelers would provide, while the current IS-ENES effort aims at actually influencing the strategic
plans of the climate modeling community.
Evidently, the climate modeling and impacts communities interacted also in various EU FP6 and FP7
projects. For example, in projects such as PRUDENCE, ENSEMBLES, and CIRCE, partners were polled

Bridging Climate Research Data and the Needs of the Impact Community - January 2011 47
for their needs on climate data. Other projects and initiatives (ECLISE, CLIMRUN, EURO4M, JPI
EU’Clik, EUMETNET efforts) are working on this as well.
National or regional efforts
Some respondents referred to general efforts at the national or regional level, e.g. in France
(CERFACS, Météo France, CIHEAM), United Kingdom (CRU-MetOffice Climate Impacts LINK project
from 1992), the Netherlands (KNMI), Slovakia, Basque Country (Etortek project). These are just
selected examples of the interactions between CCIVA researchers and climate modelers that take
place at national and local level, and do generally focus on making climate scenario data available in
a tailored fashion to local CCIVA researchers rather than conversely trying to design climate
modeling exercises that best accommodate the needs of the impact researchers and end users. Such
a regional fine-tuning through co-production may be one of the approaches to be discussed in the
workshop to come to a more efficient and effective use of the efforts made in the climate change
modeling community.
8. Problems and limitations related to current or past availability of climate data Of the 225 respondents that we analyzed, 131 reported that they experienced difficulties and
limitations related to current or past availability of climate modeling information. This large share
may explain why this group in particular has taken the opportunity provided by this questionnaire
and workshop initiative. A large variety of reasons was given why the data to be made available
should be improved to serve the impacts community. We group them into five categories (numbers
in brackets, see also Figure 6):
a. Data format (58). For many impact researchers, the format in which the data are provided is suggested to pose major difficulties, and simple tools to convert the data to more easily useable format is recommended. Adequate guidance on how to use the data is often missing.
b. User-friendly access to data (52). Various respondents complain about institutional problems and poor user interfaces. E.g., in some countries permission to obtain data and/or payment is required. Data owners are not always sufficiently supportive. For many respondents it is difficult to identify the data that they need, and when they find the data sources, lack of documentation and transparent discussion of data quality make the access to the data user-unfriendly. Many impact researchers also do not realize how much time it takes to generate the climate data that they ask for. They sometimes expect data to become available the next day.
c. Required spatial and temporal resolution (34). The available data have inadequate spatial and/or temporal resolution to adequately analyze climate change impacts. This is a well-known problem for impact researchers often working at the local and regional level and related to the next point.
d. Reliability and uncertainties (36). Many respondents struggle with the fact that they can not easily understand and interpret the uncertainties involved in the climate model output, recognizing that uncertainties increase with temporal (extreme events) and spatial resolution (local changes), and are very high for changes that are most relevant for them (e.g. precipitation). They require a better understanding of the quality assurance procedures or guidance to enhance their trust in the model outcomes.
e. Specific local needs (28). Many respondents report specific data needs that are not addressed by the current data sets (sufficiently long time series, particular types of extremes, information on islands) or note that particular local factors are not or insufficiently taken into account (e.g., topography).
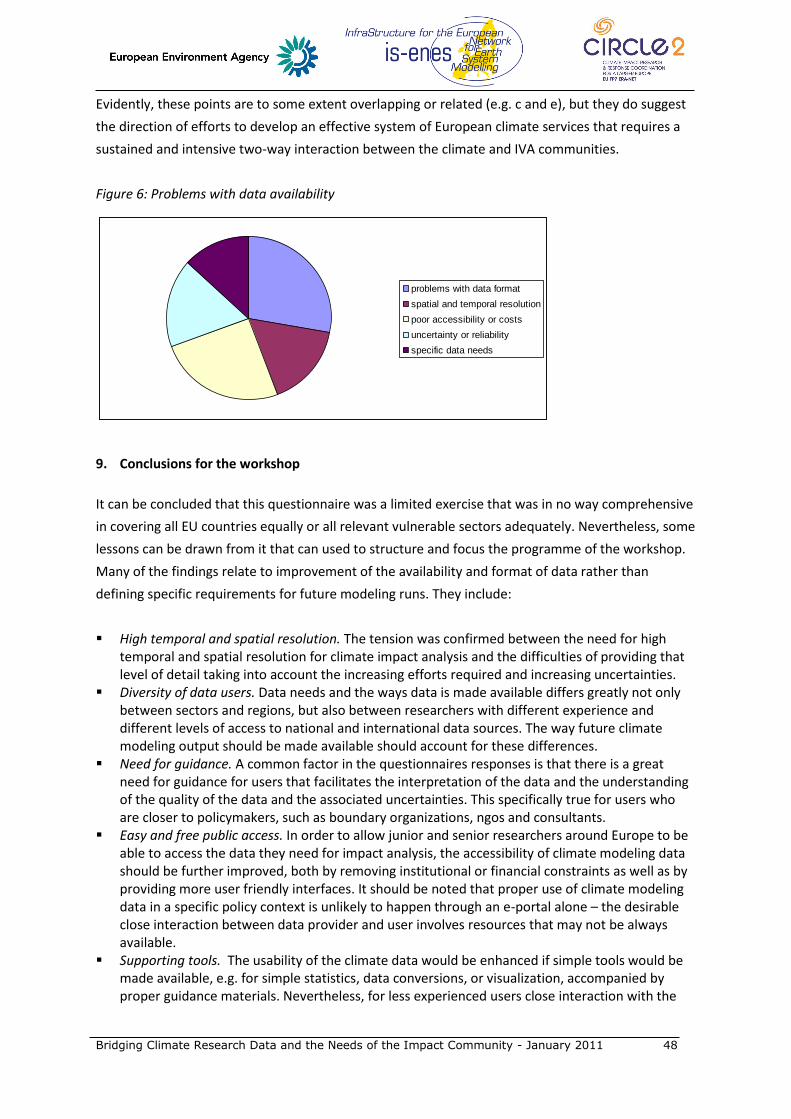
Bridging Climate Research Data and the Needs of the Impact Community - January 2011 48
Evidently, these points are to some extent overlapping or related (e.g. c and e), but they do suggest
the direction of efforts to develop an effective system of European climate services that requires a
sustained and intensive two-way interaction between the climate and IVA communities.
Figure 6: Problems with data availability
9. Conclusions for the workshop
It can be concluded that this questionnaire was a limited exercise that was in no way comprehensive
in covering all EU countries equally or all relevant vulnerable sectors adequately. Nevertheless, some
lessons can be drawn from it that can used to structure and focus the programme of the workshop.
Many of the findings relate to improvement of the availability and format of data rather than
defining specific requirements for future modeling runs. They include:
High temporal and spatial resolution. The tension was confirmed between the need for high temporal and spatial resolution for climate impact analysis and the difficulties of providing that level of detail taking into account the increasing efforts required and increasing uncertainties.
Diversity of data users. Data needs and the ways data is made available differs greatly not only between sectors and regions, but also between researchers with different experience and different levels of access to national and international data sources. The way future climate modeling output should be made available should account for these differences.
Need for guidance. A common factor in the questionnaires responses is that there is a great need for guidance for users that facilitates the interpretation of the data and the understanding of the quality of the data and the associated uncertainties. This specifically true for users who are closer to policymakers, such as boundary organizations, ngos and consultants.
Easy and free public access. In order to allow junior and senior researchers around Europe to be able to access the data they need for impact analysis, the accessibility of climate modeling data should be further improved, both by removing institutional or financial constraints as well as by providing more user friendly interfaces. It should be noted that proper use of climate modeling data in a specific policy context is unlikely to happen through an e-portal alone – the desirable close interaction between data provider and user involves resources that may not be always available.
Supporting tools. The usability of the climate data would be enhanced if simple tools would be made available, e.g. for simple statistics, data conversions, or visualization, accompanied by proper guidance materials. Nevertheless, for less experienced users close interaction with the
problems with data format
spatial and temporal resolution
poor accessibility or costs
uncertainty or reliability
specific data needs

Bridging Climate Research Data and the Needs of the Impact Community - January 2011 49
data providers tailoring information to context specific questions appears to be essential for proper use of the data, for which mechanisms are not yet available in most countries.
Extreme events and extreme scenarios. The questionnaire confirmed the relative importance of information on extreme events and of extreme (worst or best case) scenarios for impact analysis. More attention is required to better define the relevant outer bounds of the projections that make sense from a risk perspective.
Comprehensive coverage of sectors. It appears that both in climate impact research and adaptation policy there is a strong emphasis on issues related to land (agriculture, forestry, ecosystems), water (safety, scarcity, quality) and marine and coastal issues (safety, sea water intrusion). Data needs in other sectors (urban planning, health, tourism, energy, transport and infrastructure networks) tend to be less well articulated yet.
National or European climate data services. Availability of climate data differs between countries, and a future system of European climate services through which climate modeling data will be made available should also account for the data needs in countries with less advanced national systems
10. References
Beersma, J., M. Agnew, D. Viner and M. Hulme, 2000. Climate Scenarios for Water-Related and
Coastal Impacts, ECLAT-2 KNMI Workshop Report No. 3 KNMI, the Netherlands; published by the
Climate Research Unit, UEA, Norwich, UK
Carter, T.R., M. Hulme and D. Viner, 1999. Representing Uncertainty in Climate Change Scenarios
and Impact Studies. ECLAT-2 Workshop Report No . 1 Helsinki, Finland, published by the Climate
Research Unit, UEA, Norwich, UK
Cramer, W., R. Doherty, M. Hulme and D. Viner, 2000. Climate scenarios for agricultural, forest and
ecosystem impacts. ECLAT-2 Workshop Report No. 2, Potsdam, Germany, 13-15 October 1999.
Published by the Climatic Research Unit, UEA, Norwich, UK.
Massey, E., 2010. Assessing adaptation in the EU: an Update. Belgiam Pfresidency Conference on
Adaptation to the changing climate: time to intensify efforts, Brussels 23-24 November 2010.
Pelt, S. van, D. Avelar, T. Capela Lourenço, M. Desmond, M.Leitner, C. Nilsson and R. Swart, 2010.
Communicate uncertainties - design adaptation measures to be flexible and robust.. Proceedings
of CIRCLE-2 workshop on Uncertainties in Climate Change Impacts, Vulnerability and Adaptation,
Stockholm, 11-12 November 2010
Swart, R.J., Biesbroek, G.R., Binnerup, S. Carter, T.R., Cowan, C., Henrichs, T., Loquen, S., Mela, H.,
Morecroft, M.D., Reese, M., and D. Rey, (2009) ‘Europe Adapts to Climate Change: Comparing
National Adaptation Strategies. (no. 01/2009). Partnership for European Environmental Research
(PEER), Helsinki
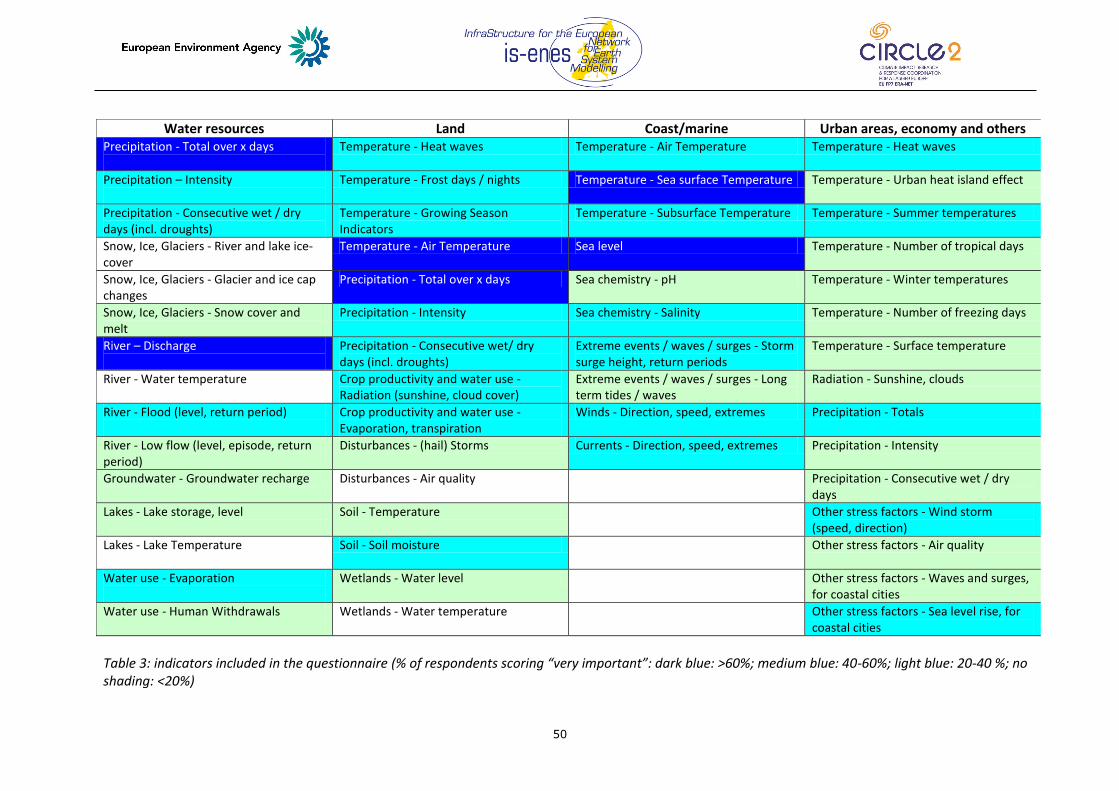
50
Water resources Land Coast/marine Urban areas, economy and others Precipitation - Total over x days
Temperature - Heat waves Temperature - Air Temperature Temperature - Heat waves
Precipitation – Intensity
Temperature - Frost days / nights Temperature - Sea surface Temperature Temperature - Urban heat island effect
Precipitation - Consecutive wet / dry days (incl. droughts)
Temperature - Growing Season Indicators
Temperature - Subsurface Temperature Temperature - Summer temperatures
Snow, Ice, Glaciers - River and lake ice-cover
Temperature - Air Temperature Sea level Temperature - Number of tropical days
Snow, Ice, Glaciers - Glacier and ice cap changes
Precipitation - Total over x days Sea chemistry - pH Temperature - Winter temperatures
Snow, Ice, Glaciers - Snow cover and melt
Precipitation - Intensity Sea chemistry - Salinity Temperature - Number of freezing days
River – Discharge
Precipitation - Consecutive wet/ dry days (incl. droughts)
Extreme events / waves / surges - Storm surge height, return periods
Temperature - Surface temperature
River - Water temperature
Crop productivity and water use - Radiation (sunshine, cloud cover)
Extreme events / waves / surges - Long term tides / waves
Radiation - Sunshine, clouds
River - Flood (level, return period)
Crop productivity and water use - Evaporation, transpiration
Winds - Direction, speed, extremes Precipitation - Totals
River - Low flow (level, episode, return period)
Disturbances - (hail) Storms Currents - Direction, speed, extremes Precipitation - Intensity
Groundwater - Groundwater recharge
Disturbances - Air quality Precipitation - Consecutive wet / dry days
Lakes - Lake storage, level
Soil - Temperature Other stress factors - Wind storm (speed, direction)
Lakes - Lake Temperature
Soil - Soil moisture Other stress factors - Air quality
Water use - Evaporation
Wetlands - Water level Other stress factors - Waves and surges, for coastal cities
Water use - Human Withdrawals
Wetlands - Water temperature Other stress factors - Sea level rise, for coastal cities
Table 3: indicators included in the questionnaire (% of respondents scoring “very important”: dark blue: >60%; medium blue: 40-60%; light blue: 20-40 %; no shading: <20%)