Bridge Economy and Life Cycle Costs of Steel & Concrete ... sssb... · Life Cycle Cost Data...
46
Bridge Economy and Life Cycle Costs of Steel & Concrete Bridges Short Span Steel Bridge Alliance NACE 2017 Short Span Steel Bridge Workshop Cincinnati, OH April 9, 2017 Michael Barker, PE University of Wyoming & SSSBA Bridge Technology Center
Transcript of Bridge Economy and Life Cycle Costs of Steel & Concrete ... sssb... · Life Cycle Cost Data...

Bridge Economy and Life Cycle Costs of Steel & Concrete Bridges
Short Span Steel Bridge Alliance
NACE 2017 Short Span Steel Bridge WorkshopCincinnati, OHApril 9, 2017
Michael Barker, PEUniversity of Wyoming & SSSBA Bridge Technology Center

Problem StatementPreconception that Concrete is Always Less Expensive for Short Span Bridges
Today’s PresentationDirect Cost Comparison Between Steel and Concrete Short Span Bridges
• Economical Comparison of two “Identical” Bridges• Life Cycle Cost Comparison of Steel & Concrete

Economics Case Study
Steel vs. Concrete CostsAudrain County, MO
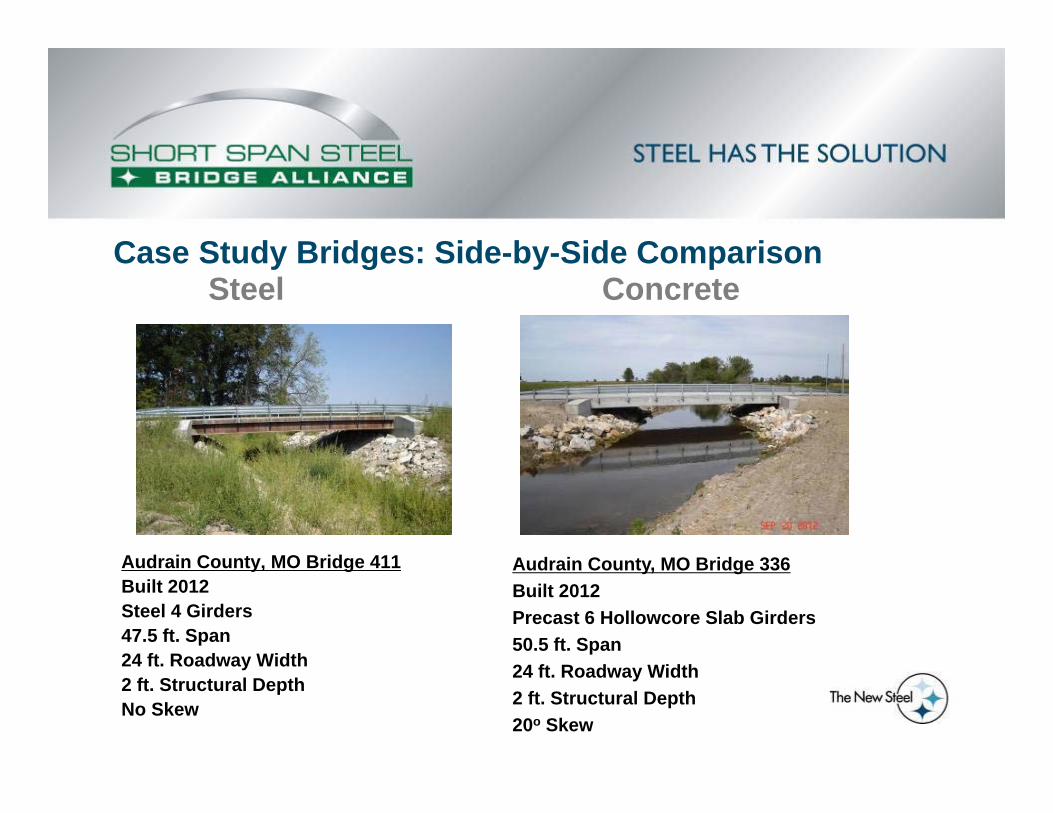
Case Study Bridges: Side-by-Side Comparison
Audrain County, MO Bridge 411Built 2012Steel 4 Girders47.5 ft. Span24 ft. Roadway Width2 ft. Structural DepthNo Skew
Audrain County, MO Bridge 336Built 2012Precast 6 Hollowcore Slab Girders50.5 ft. Span24 ft. Roadway Width2 ft. Structural Depth20o Skew
Steel Concrete

Total Bridge CostsMaterial = $41,764Labor = $24,125Equipment = $21,521Guard Rail = $ 7,895Rock = $ 8,302Engineering = $ 8,246TOTAL = $111,853 ($97.48 / sq. ft.)
Total Bridge CostsMaterial = $67,450Labor = $26,110Equipment = $24,966Guard Rail = $ 6,603Rock = $ 7,571Engineering = $21,335TOTAL = $154,035 ($120.83 / sq. ft.)
Case Study Bridges: Side-by-Side Comparison Total Cost of Structure
Steel Concrete
19.3% Total Bridge Cost Savings with
Steel

Total Bridge Costs per ft2
Total Cost = $97.48 / sq. ft. Total Construction Cost = $90.29 / sq. ft.
(no Engineering)Adjusted Construction Cost = $83.05 / sq. ft.
(no Engineering or Rock)
Total Bridge Costs per ft2
Total Cost = $120.83 / sq. ft. Total Construction Cost = $104.08 / sq. ft.
(no Engineering)Adjusted Construction Cost = $98.14 / sq. ft.
(no Engineering or Rock)
Case Study Bridges: Side-by-Side ComparisonSteel Concrete

Superstucture CostsMaterial
Girders = $21,463Deck Panels = $ 7,999Reinf Steel = $ 3,135Concrete = $ 4,180
Labor = $ 5,522Equipment* = $ 500SUPER TOTAL = $42,799
SUPER TOTAL = $37.54 / sq. ft.
Superstructure CostsMaterial
Slab Girders = $50,765Deck Panels = $ 0Reinf Steel = $ 724Concrete = $ 965
Labor = $ 4,884Equipment* = $ 4,000SUPER TOTAL = $61,338
SUPER TOTAL = $50.61 / sq. ft.
Case Study Bridges: Superstructure Only Comparison(Remove Site Prep, Abutment, Grading & Finishing, Guardrail, Engineering, Rock, Etc)
Steel Concrete
*County Crane (30 Ton) used for Steel, Larger Rented Crane (100 Ton) Required for Concrete (Equivalent County Crane Cost is $1520, would result in Steel Cost of $38.88 / sq. ft. )
*Added cost to use galvanized steel = $5,453.80 or $0.22 / lb. (includes est. 10% fabrication fee)** Cost to use weathering steel is approximately $0.04 / lb. (already included in cost in example)

Case Study Bridges: Audrain County, MOSteel: Superstructure $37.54 per sq. ft. Concrete: Superstructure Cost $50.61 per sq. ft.
Same bridge conditions:• Structural Depth = 2 ft. (No Difference in Approaches)• Roadway Width = 24 ft.• Same Abutments for Both Can be Used (Steel Could Use Lighter)• Same Guard Rail System• Same Work Crew
25.8% superstructure cost savings

Lighter Cranes Required (Owner Cranes Can Save Costs)
Steel Bridge - Advantages
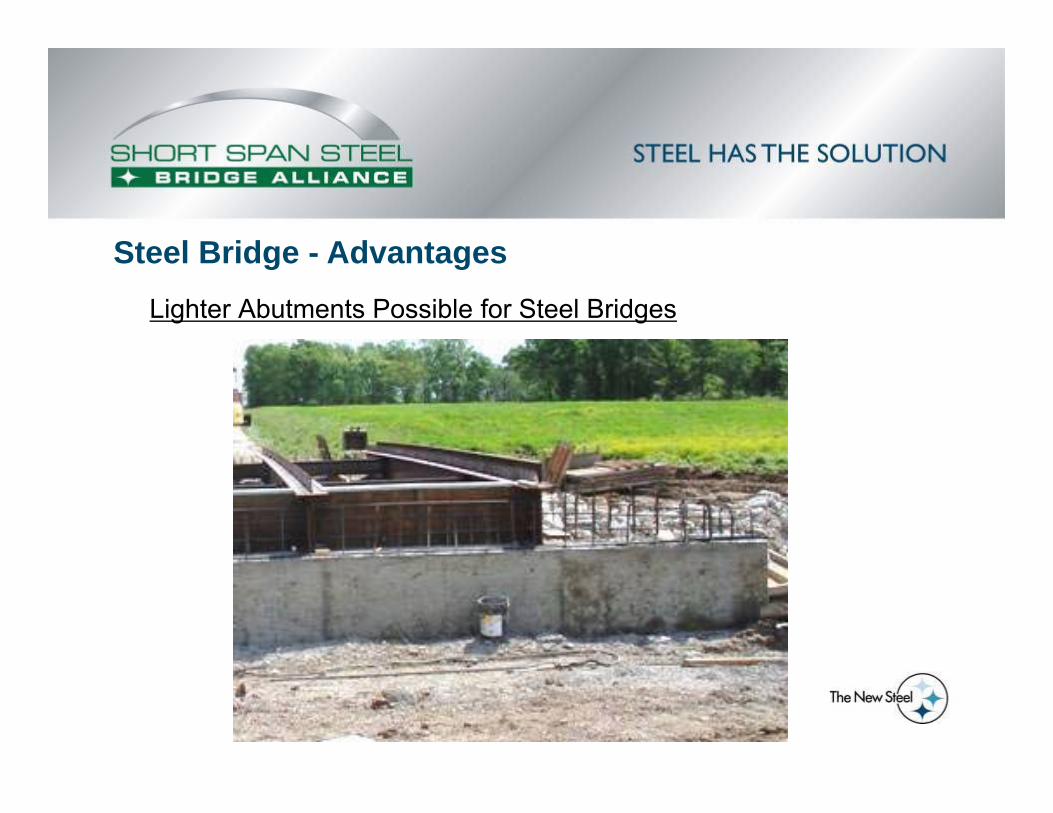
Lighter Abutments Possible for Steel Bridges
Steel Bridge - Advantages

Cast-in-Place Deck on Prestressed Concrete Deck Panels
Steel Bridge - Economy

Simple and Practical Details
Steel Bridge - Economy

Elastomeric Bearings & Integral Abutments
Steel Bridge - Economy
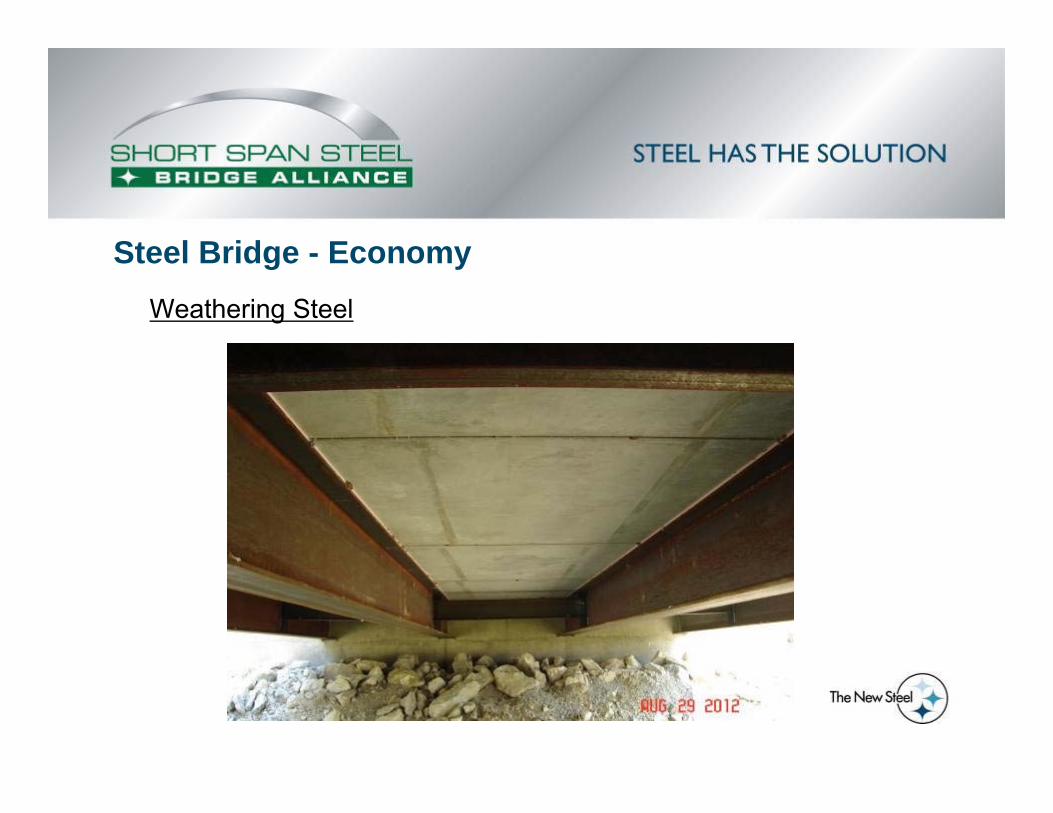
Weathering Steel
Steel Bridge - Economy

Case Study Bridges: Other Bridges in MOSuperstructure Steel Concrete
Bridge Number 061 140 149 152 710 AVG 028 057 069 520 AVG
Year Built 2008 2008 2008 2009 2010 AVG 2009 2010 2011 2006 AVG
Span Length 50 50 40 62 64 53.2 36 36 38 40 37.5
Skew 0 0 0 30 35 13 0 15 20 30 16.25
Cost Summary
- Labor $14,568 $21,705 $15,853 $24,765 $31,949 $21,768 $12,065 $15,379 $14,674 $19,044 $15,291
- Material $56,676 $53,593 $46,282 $92,821 $69,357 $63,746 $51,589 $54,450 $50,576 $46,850 $50,866
- Rock $6,170 $6,216 $3,694 $8,235 $6,501 $6,163 $5,135 $7,549 $5,378 $3,621 $5,421
- Equipment $7,487 $12,026 $7,017 $19,579 $15,266 $12,275 $5,568 $10,952 $11,093 $14,742 $10,589
- Guardrail $4,715 $7,146 $3,961 $7,003 $7,003 $5,966 $4,737 $4,663 $5,356 $3,323 $4,520
Construction Cost $89,616 $100,686 $76,807 $152,403 $130,076 $109,918 $79,094 $92,993 $87,077 $87,580 $86,686
CONST. COST PER FT2 $74.68 $83.91 $80.01 $102.42 $84.68 $86.09 $91.54 $107.63 $95.48 $91.23 $96.32

The Bottom Line…• Short span steel bridges compete and win!

What About Life Cycle Costs?
Historical Life Cycle Costs of Steel & Concrete Girder Bridges
Report on ShortSpanSteelBridges.org
Thank You to PennDOT professionals for their participation.Thanks to SMDI, NSBA and AGA for supporting the work.

Why the Study?As owners replace their bridge infrastructure, the question of Life Service and Life Cycle Costs routinely comes up between concrete and steel bridge options.
This is especially true for typical and short span bridge replacement projects.
The bridge industry does not have a good answer:Both steel and concrete bridge advocates claim an advantage.Anecdotal information is not convincing.

Study ObjectiveExamine Historical Life Service (Performance and Maintenance) and Agency Life Cycle Costs (True Agency Costs for a Bridge) of Steel and Concrete Bridges in Pennsylvania

Life Cycle Cost Data CollectionStart with a Comprehensive Inventory of Bridges
Initial Costs & Date BuiltMaintenance Costs and Date PerformedEnd of Service Date – End of Life Model

Life Cycle Cost Data CollectionStart with a Comprehensive Inventory of Bridges
Initial Costs & Date BuiltMaintenance Costs and Date PerformedEnd of Service Date – End of Life Model
Issues:
PennDOT Stepped Up to Participate
Availability of Historical Data
Large Amount of Time & Resources to Collect Data

Criteria to Develop LCC Bridge Database
Modern typical bridge structuresPrecast I-Beam, Box Adjacent, and Box Spread bridgesSteel Rolled Shape and Welded Plate Girder bridges
Bridges built between 1960 and 2010
Bridges with complete and accurate department maintenance recordsConsider any maintenance cost that is equal to or greater than $0.25/ft2
Bridges with known initial costs
Bridges with complete and accurate external contractor maintenance and rehabilitation
Initial cost limitation to bridges with initial cost less than $500/ft2 and greater than $100/ft2
Note: Total Recorded Initial and Maintenance Costs Used
PennDOT Database Development

All Bridges in PennDOT Inventory = 25,403Number of Type Bridges in Inventory = 8,466Number of Types Built 1960-2010 = 6,587
Bridges that Meet All Criteria
PennDOT Database Development
Table 8: Final LCC Database that Meets All Criteria
Bridge Type Numberof Bridges that Meet All criteria
Percentage of1960 – 2010 database
Steel I Beam 82 14.9% Steel I Girder 230 22.6% P/S Box ‐ Adjacent 400 27.8% P/S Box ‐ Spread 581 26.5% P/S I Beam 412 29.8% Total 1705 25.9%

NEEDED Notes on LimitationsDatabase Contains Only 25.9% of Eligible 1960 - 2010 Bridges
Large Percentage of Bridges Not IncludedBridges Removed Due To:
Unknown Dates and/or Costs of Department MaintenanceUnknown Dates and/or Costs of Contractor Maintenance
Therefore,Database is “Skewed” Towards Bridges with Lower Amounts of Maintenance

NEEDED Notes on LimitationsThe Systematic Nature of the Study Used
Total 1960-2010 PennDOT Database Average Deterioration Rates Based on Condition Ratings
The Study Does Not Predict Any Future Maintenance
Therefore,
Results, Comparisons & ConclusionsMust Be Taken In Context to
the Database and the Database Limitations

Bridge Life Model uses Average Deterioration Rates of Total PennDOT Inventory
PennDOT Database Bridge Life Model
2014 92014
3 2014
2014Table 9: Average Deterioration Rates
Bridge Type Number of Bridges1960 ‐ 2010
Deterioration Rate(Condition Rating
Loss/Year) Steel I Beam 550 ‐0.07114Steel I Girder 1017 ‐0.08144P/S Box ‐ Adjacent 1440 ‐0.08125P/S Box ‐ Spread 2196 ‐0.07988P/S I Beam 1384 ‐0.08383
Assume Bridge Replacement at Condition Rating = 3Super Structure Condition Rating Used
Steel RolledPrecast Box SpreadAll are “similar” with None “Way Out” of Balance

Precast Spread Box-Beam Bridge
Agency Life Cycle Costs – An Example
BrKey: 30570Bridge Type: P/S, Box Beam (Spread) County: Shuylkill Location: 0.75 mi. N of Exit 107(33) Year Built: 1969 Spans: 3 Length: 176 ft Deck Area: 7621 ft2
Super Cond Rating: 5
Average Precast Box Beam – Spread bridge deterioration rate = ‐0.07988
3 50.07988
25
2014 25 1969 70

Example Bridge CostsLife Cycle Costs
2014201419
19
Initial Cost: Year = 1969 Cost = $141475 ($18.56/ft2) Work: Bridge Construction
External Contract: Year = 1988 Cost = $58401 ($7.66/ft2) Work: Latex Overlay
Maintenance 1: Year = 2009 Cost = $1891 ($0.25/ft2) Work: Repair Concrete Deck
Maintenance 2: Year = 2013 Cost = $2510 ($0.33/ft2) Work: Repair Concrete Deck
Transform the costs to constant 2014 dollars using Construction Cost
Initial Cost: Year = 0 Cost = $18.56/ft2(9806/1269) = $143.45/ft2
External Contract: Year = 19 Cost = $7.66/ft2(9806/4519) = $ 16.63/ft2
Maintenance 1: Year = 40 Cost = $0.25/ft2(9806/8570) = $ 0.28/ft2
Maintenance 2: Year = 44 Cost = $0.33/ft2(9806/9547) = $ 0.34/ft2
ENR Construction Cost Indices
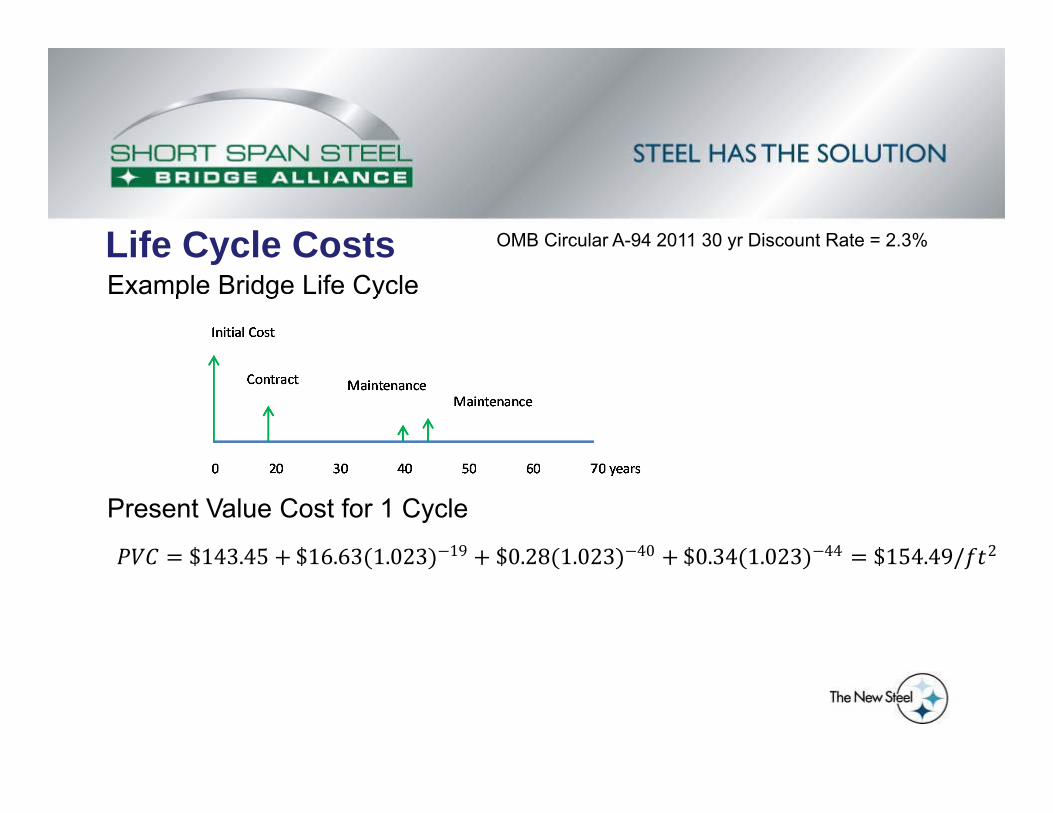
Example Bridge Life Cycle
Present Value Cost for 1 Cycle
Life Cycle Costs
$143.45 $16.63 1.023 19 $0.28 1.023 40 $0.34 1.023 44 $154.49/ 2
OMB Circular A-94 2011 30 yr Discount Rate = 2.3%

Example Bridge Life Cycle
Present Value Cost for 1 Cycle
Perpetual Present Value Cost
With PPVC, Can Compare Bridges Directly
Life Cycle Costs
$143.45 $16.63 1.023 19 $0.28 1.023 40 $0.34 1.023 44 $154.49/ 2
$154.491 0.023 70
1 0.023 70 11.256 $154.49 $193.97/ 2
OMB Circular A-94 2011 30 yr Discount Rate = 2.3%

Life Cycle Cost AnalysesThe Steel Plate Girder Bridge Data Base
General Information Maintenance & Contract Work Initial & LCC
The full history of the bridgeLocation, year built, spans, length, area, geometry, materialsDepartment and contractor maintenance performedInitial, perpetual present value, and future maintenance costs

Additional Bridges Removed Based on PPVC
To Consider “Typical” Bridges, Keep Bridges withPPVC within +/- 1 Standard Deviation of Overall Average
Bridges in the Life Cycle Cost Analyses
Life Cycle Cost Analyses
Table 13: Final Life Cycle Cost Database
Bridge Type Numberof Bridges in Table 11 Database
Numberof Bridges in LCC Study Database
Steel I Beam 82 54 Steel I Girder 230 144 P/S Box ‐ Adjacent 400 282 P/S Box ‐ Spread 581 397 P/S I Beam 412 309 1705 1186

Analysis and Variables Examined in this VideoBridge LifePPVC
Number of SpansBridge LengthPVC Future CostsDepartment MaintenanceExternal Contracts
For Steel BridgesCurved vs. StraightFracture-CriticalProtection (Painted, Weathering, Galvanized)
LCC Study
For the entire report:www.ShortSpanSteelBridges.org

Bridge Life
Table 10: Final LCC Database that Meets All Criteria
Bridge Type Numberof Bridges in Final LCC Database
Average Year Built
Average Bridge Life (years)
Steel I Beam 82 1981 81.3Steel I Girder 230 1977 79.2P/S Box ‐ Adjacent 400 1985 74.0P/S Box ‐ Spread 581 1984 79.9P/S I Beam 412 1984 74.5
Steel RolledPrecast Box - Spread
All are “similar” with None “Way Out” of Balance

Bridge Life

Perpetual Present Value Cost – All Bridges
Table 14: Life Cycle Cost Results Using Total Database
# Bridges PPVC Initial Cost Future Cost Avg Length Avg # Spans Avg Year Built Avg LifeSteel I Beam 54 $232.78 $194.78 $0.42 166 2.19 1980 82Steel I Girder 144 $273.71 $226.10 $0.21 406 4.07 1976 80P/S Box ‐ Adjacent 282 $278.30 $223.74 $0.96 89 1.31 1987 74P/S Box ‐ Spread 397 $256.11 $210.65 $2.06 89 1.56 1986 79P/S I Beam 309 $217.50 $174.10 $0.20 212 2.43 1985 73
Precast I BeamSteel Rolled
All are “similar” with None “Way Out” of Balance

Perpetual Present Value Cost – All Bridges

Perpetual Present Value Cost – Length<140 ft
Steel RolledPrecast Box Spread
Short Length Bridges
All are “similar” with None “Way Out” of Balance
Table 20: Life Cycle Cost Results for Bridge Length Maximum = 140 ft
# Bridges PPVC Initial Cost Future Cost Avg Length Avg # Spans Avg Year Built Avg LifeSteel I Beam 27 $266.24 $222.08 $0.16 84 1.26 1978 82Steel I Girder 18 $311.26 $257.19 $0.29 119 1.00 1977 81P/S Box ‐ Adjacent 240 $292.38 $235.03 $0.95 69 1.09 1987 74P/S Box ‐ Spread 325 $272.20 $225.14 $2.16 64 1.23 1986 81P/S I Beam 98 $281.64 $231.20 $0.05 104 1.08 1987 77

Future Costs
Table 22: Life Cycle Costs and PPVC/Initial Cost for Total Database
# Bridges PPVC Initial Cost Future Cost Avg Life PPVC/Initial CostSteel I Beam 54 $232.78 $194.78 $0.42 82 1.20Steel I Girder 144 $273.71 $226.10 $0.21 80 1.21P/S Box ‐ Adjacent 282 $278.30 $223.74 $0.96 74 1.24P/S Box ‐ Spread 397 $256.11 $210.65 $2.06 79 1.22P/S I Beam 309 $217.50 $174.10 $0.20 73 1.25
Steel RolledSteel Girder
Future Costs Compared to Initial Costs
All are “similar” with None “Way Out” of Balance

Which Type of Bridge is Best?

Which Type of Bridge is Best?All are “similar” with None “Way Out” of Balance
Overall Weighted Average PPVC = $252.40/ft2
Bridge Type within 14% of Weighted Average
Standard Deviation Range$48.02/ft2 - $65.60/ft2[COV ≈ 20% - 25%]
Any One Type of Bridge May BeMost Economical for a GivenBridge Project
There is No One Type of Bridge That Clearly Beats the Others

Summary
The report examines the Initial Costs, Life Cycle Costs, and Future Costs of the Bridges in the PennDOT Database
The database is limited to bridges that met the Criteria – It is Not as Comprehensive as Desired and Results must be Taken In Context of the Database and the Database Limitations
.

PennDOT Database ConclusionsTypical Concrete and Steel Bridges are Competitive on Initial Cost, Future Costs, Life Cycle Costs and Bridge Life
For any Given Bridge Project, Concrete or Steel Bridge Types May Be the Most Economical
Owners Should Consider Both Steel and Concrete Alternatives for Individual Bridge Projects

ClosingTypical Steel and Concrete Bridges are Competitive in the Short Span Range for Initial Costs and Life Cycle Costs
Preconception that Concrete is always Less Expensive is Incorrect
Preliminary Steel Bridge designs are now Easily Available
Owners Should Consider Both Steel and Concrete Alternatives for Individual Bridge Projects

Need More Information?
Rich TavolettiSteel Market Development Institute
Twitter: @ShortSpanSteelFacebook: Short Span Steel Bridge Alliance – SSSBA
Website: ShortSpanSteelBridges.org | eSPAN140.com
Thank You