Brian E. Haggard Director, Arkansas Water Resources Center
14
Water Quality Monitoring and Constituent Load Estimation in the Upper Illinois River Watershed, 2009 Brian E. Haggard Director, Arkansas Water Resources Center Funding provided by ANRC through the Illinois River Watershed Partnership
-
Upload
silas-castro -
Category
Documents
-
view
20 -
download
0
description
Water Quality Monitoring and Constituent Load Estimation in the Upper Illinois River Watershed, 2009. Brian E. Haggard Director, Arkansas Water Resources Center Funding provided by ANRC through the Illinois River Watershed Partnership. 2009 Summary Loads and Flow-Weighted Concentrations. - PowerPoint PPT Presentation
Transcript of Brian E. Haggard Director, Arkansas Water Resources Center
Water Quality Monitoring and Constituent Load Estimation in
the Upper Illinois River Watershed, 2009
Brian E. HaggardDirector,
Arkansas Water Resources Center
Funding provided by ANRC through the Illinois River
Watershed Partnership

2009 Summary Loads and Flow-Weighted Concentrations
Site Cl SO4 NH3-N NO3-N SRP TN TP TSS Ballard Creek 461,000 767,000 5,300 119,000 21,000 139,000 29,000 6,492,000 Baron Fork 258,000 748,000 2,800 81,000 6,100 117,000 9,800 1,290,000 Flint Creek (W. Siloam) 521,000 1,201,000 1,300 116,000 2,400 130,000 5,300 1,852,000 Flint Creek (Springtown) 101,000 92,000 1,300 56,000 1,700 62,000 2,600 447,000 Illinois River (AR59) 8,011,000 9,546,000 31,000 1,740,000 82,000 1,970,000 236,000 111,961,000 Illinois River (Savoy, AR) 1,656,000 3,144,000 21,000 392,000 39,000 530,000 72,000 20,556,000 Illinois River (Watts, OK) 7,694,000 9,434,000 38,300 1,861,000 85,500 2,194,000 241,000 77,038,000 Mud Creek Tributary 14,000 18,000 100 900 60 1,600 300 1,342,000 Osage Creek 3,200,000 3,310,000 16,500 607,000 15,300 670,000 40,700 24,900,000
Site Cl SO4 NH3-N NO3-N SRP TN TP TSS Ballard Creek 7.61 12.67 0.09 1.97 0.34 2.29 0.49 107 Baron Fork 4.63 13.45 0.05 1.46 0.11 2.10 0.18 23 Flint Creek (W. Siloam) 9.56 21.93 0.02 2.12 0.04 2.37 0.10 34 Flint Creek (Springtown) 5.76 5.21 0.07 3.18 0.10 3.52 0.15 322 Illinois River (AR59) 10.93 13.02 0.04 2.37 0.11 2.69 0.32 153 Illinois River (Savoy, AR) 6.97 13.24 0.09 1.65 0.16 2.23 0.30 87 Illinois River (Watts, OK) 9.41 11.54 0.05 2.28 0.10 2.68 0.30 94 Mud Creek Tributary 8.53 11.14 0.07 0.56 0.04 0.95 0.16 824 Osage Creek 16.25 16.81 0.08 3.08 0.08 3.40 0.21 126

Water samples were collected at seven sites in the UIRW.
Stage recorded in 30 minute intervals by USGS to estimate discharge.
Water samples were collected once a week and storm events were targeted
Water samples were analyzed at the AWRC WQL for:• Chloride• Sulfate• Nitrate-N• Ammonia-N• Soluble reactive P• Total N• Total P• Total Suspended Solids
Flint Creek
Osage Creek
IR@59IR@Savoy
Mud Creek
Ballard Creek
Baron Fork

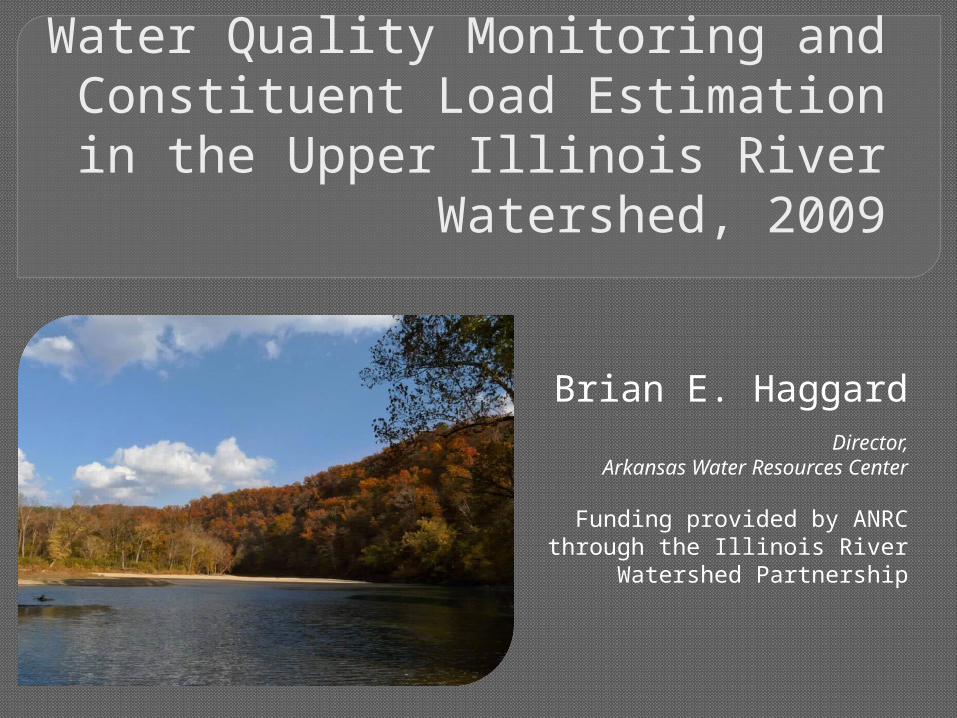
Load Determination
Linear regression was used to determine the relationship between daily load and daily flow:• ln(Ld) = βo + β1ln(Qd) —or—• ln(Ld) = βo + β1ln(Qd) + β2sin(2πT) + β3cos(2πT)
BCF was used to remove bias from log transformations:
BCF=∑er
n
Brian Edward Haggard
Prbably need a summary slide like UWRB, where you give the range in BCF, R-square, etc. by constituent... we want the audience to get a feel for the regression equations across all sites.
Load Determination
BCF R2
NH3 1.26-2.81 0.66-0.87
Cl 1.01-1.10 0.78-0.98
NO3 1.00-1.21 0.71-0.98
SRP 1.01-1.65 0.84-0.98
SO4 1.01-1.09 0.80-0.98
TN 1.01-1.11 0.87-0.99
TP 1.04-1.45 0.53-0.96
TSS 1.06-6.48 0.75-0.93
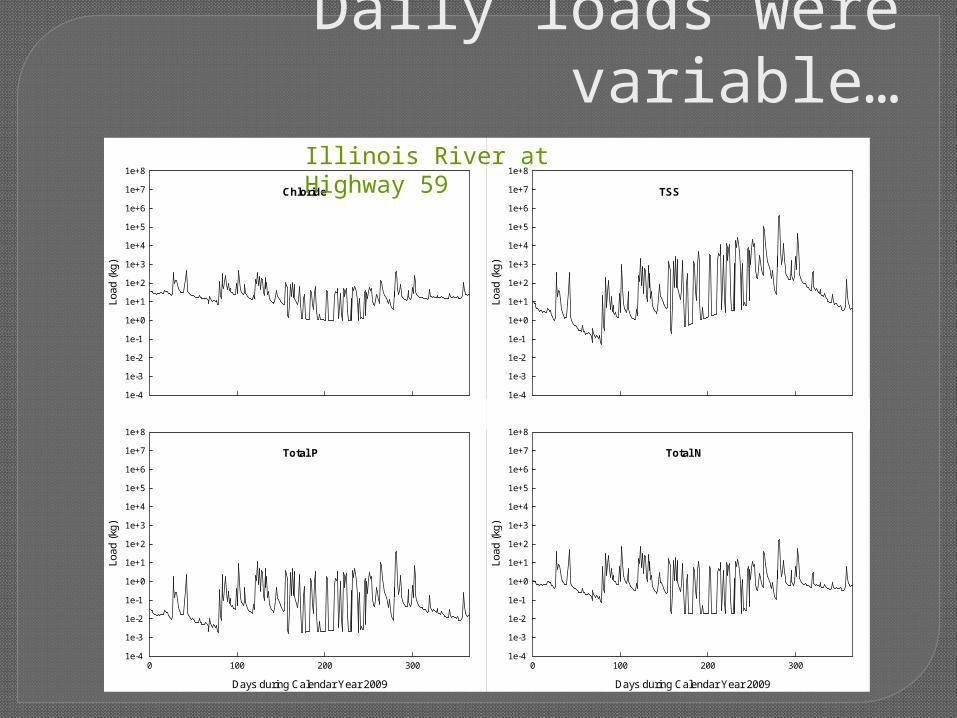
Daily loads were variable…
Days during Calendar Year 2009
0 100 200 300
Load
(kg
)
1e-4
1e-3
1e-2
1e-1
1e+0
1e+1
1e+2
1e+3
1e+4
1e+5
1e+6
1e+7
1e+8
TSS
Days during Calendar Year 2009
0 100 200 300
Load
(kg
)
1e-4
1e-3
1e-2
1e-1
1e+0
1e+1
1e+2
1e+3
1e+4
1e+5
1e+6
1e+7
1e+8
Chloride
Days during Calendar Year 2009
0 100 200 300
Load
(kg
)
1e-4
1e-3
1e-2
1e-1
1e+0
1e+1
1e+2
1e+3
1e+4
1e+5
1e+6
1e+7
1e+8
Total N
Days during Calendar Year 2009
0 100 200 300
Load
(kg
)
1e-4
1e-3
1e-2
1e-1
1e+0
1e+1
1e+2
1e+3
1e+4
1e+5
1e+6
1e+7
1e+8
Total P
Illinois River at Highway 59

Monthly loads were least during drier, summer months…
Load (
kg)
e0
e1
e2
e3
e4
e5
e6
e7
e8
e9
e10
e11
e12
e13
e14
e15
e16
e17
e18
Chloride
Lo
ad (
kg)
e0
e1
e2
e3
e4
e5
e6
e7
e8
e9
e10
e11
e12
e13
e14
e15
e16
e17
e18
Total Nitrogen
Load (
kg)
e0
e1
e2
e3
e4
e5
e6
e7
e8
e9
e10
e11
e12
e13
e14
e15
e16
e17
e18
Total Phosphorus
Load (
kg)
e0
e1
e2
e3
e4
e5
e6
e7
e8
e9
e10
e11
e12
e13
e14
e15
e16
e17
e18
Total Suspended Solids
Illinois River at Highway 59

Illinois River at Arkansas HWY59 is the watershed outlet…

Annual Total Nitrogen Loads at watershed outlet

Annual Total Phosphorus Loads at watershed outlet

We changed sampling methods in July 2009.
Historically, loads have been estimated using autosamplers.
In July 2009, we switched to collecting grab samples to estimate loads.
We used the regression equations to predict loads from January 2009 to July 2009.
But we also had autosampler data from IR59 and Ballard Creek from this time period.

Variation between sampling methods at the watershed outlet…
7%
16%
3%
Illinois River at AR59
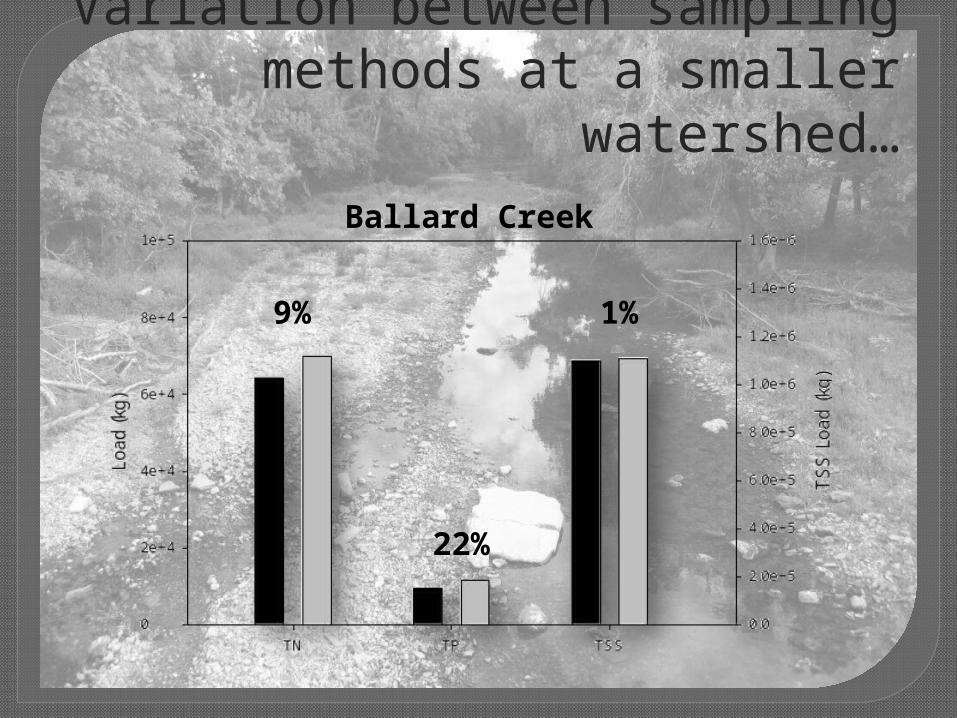
Variation between sampling methods at a smaller
watershed…
9%
22%
1%
Ballard Creek
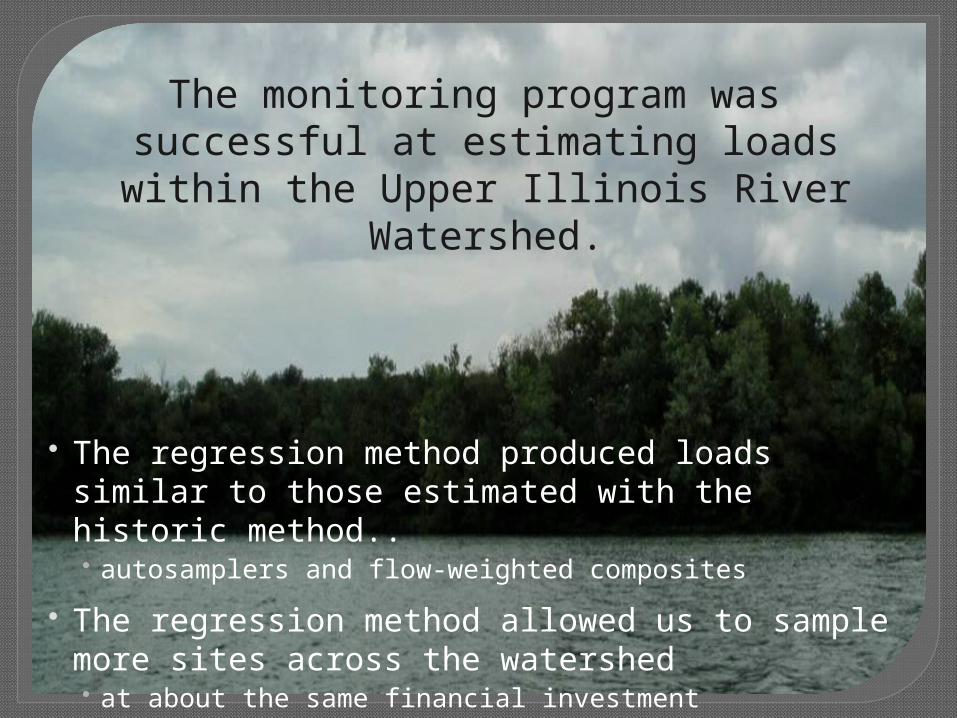
The monitoring program was successful at estimating loads within the Upper Illinois River Watershed.
The regression method produced loads similar to those estimated with the historic method..• autosamplers and flow-weighted composites
The regression method allowed us to sample more sites across the watershed• at about the same financial investment