Brf1 post transcriptionally regulates pluripotency and differentiation responses downstream of erk...
89
Brf1 Post-transcriptionally Regulates Pluripotency and Differentiation Responses Downstream of Erk MAP Kinase Thesis by Frederick Eng Houw Tan In Partial Fulfillment of the Requirements for the Degree of Doctor of Philosophy CALIFORNIA INSTITUTE OF TECHNOLOGY Pasadena, California 2014 (Defended May 19, 2014)
Transcript of Brf1 post transcriptionally regulates pluripotency and differentiation responses downstream of erk...

Brf1 Post-transcriptionally Regulates
Pluripotency and Differentiation Responses
Downstream of Erk MAP Kinase
Thesis by
Frederick Eng Houw Tan
In Partial Fulfillment of the Requirements for the Degree of
Doctor of Philosophy
CALIFORNIA INSTITUTE OF TECHNOLOGY
Pasadena, California
2014
(Defended May 19, 2014)

ii
2014
Frederick E. Tan
All Rights Reserved

iii
Abstract
FGF/Erk MAP Kinase Signaling is a central regulator of mouse embryonic stem
cell (mESC) self-renewal, pluripotency and differentiation. However, the mechanistic
connection between this signaling pathway activity and the gene circuits stabilizing
mESCs in vitro remain unclear. Here we show that FGF signaling post-transcriptionally
regulates the mESC transcription factor network by controlling the expression of Brf1
(zfp36l1), an AU-rich element mRNA binding protein. Changes in Brf1 level disrupts the
expression of core pluripotency-associated genes and attenuates mESC self-renewal
without inducing differentiation. These regulatory effects are mediated by rapid and
direct destabilization of Brf1 targets, such as Nanog mRNA. Interestingly, enhancing Brf1
expression does not compromise mESC pluripotency, but does preferentially regulate
differentiation to mesendoderm by accelerating the expression of primitive streak
markers. Together, these studies demonstrate that FGF signals utilize targeted mRNA
degradation by Brf1 to enable rapid post-transcriptional control of gene expression.

iv
Acknowledgements
Everything comes in threes, as some would have you believe. Then again, the
Rule of Three exists for a reason, and it’s a rule that all Elowitzians obey. So here we go…
This work would not have been possible without the steadfast support of my
advisor, Michael Elowitz. In all that I have done, he has been nothing but understanding,
patient, honest, optimistic … and so much more. Through him, I discovered that science
is an art, which demands both simplicity and beauty. I discovered that effective
communication is just as important as a well-executed research plan. I discovered that
making mistakes is part of the game, but that persistence and flexibility will get you
through the challenges. And finally, I discovered the reasons for my personal
commitment to science. I will always be eternally grateful for his mentorship.
This dissertation is the achievement of entire community, whose support guided
my research efforts every step of the way. I want to thank: Kathrin Plath, Ellen
Rothenberg and Angela Stathopolous for their advice, guidance and support as
members of my Thesis Committee; Shelley Diamond, Diana Perez and Josh Verceles at
the Caltech Flow Cytometry facility, for their technical support, advice and friendship;
Igor Antoshechkin and Vijaya Kumar from the Millard and Muriel Jacobs Genetics and
Genomics Laboratory at Caltech; Azim Surani for constructive feedback on our
manuscript; and Angie Rizzino, for fgf4-/- mouse embryonic stem cells, a cell line that I
could not have done without.

v
Finally, I want to dedicate this Thesis to my friends and family, which have made
every moment of this process enjoyable and rewarding. To my dearest chums: Brian,
Harry, Joe, John, Jon, Chiraj, Rashad, Ryenn, Sandy and Suvir, we’ve been through the
ups and downs together, and we helped each other weather the storm; thank you for
support. To my BMB mates: Kelly, Russ, Cam, Phil, John and Nick; I can now safely
declare that we’re all done, not that you guys waited up for me anyhow. To Mom and
Dad: I would not be here if not for your sacrifices; thank you for your constant
encouragement, and for keeping me on track. Although, at times, I do wonder what life
would have been like had I chosen to be a comic book artist instead. To Cisca, Mike, Lil’
Mikey and the soon to be: thank you for egging me on and keeping me going when I
needed it most. And last but not least, to Tracy: For your love and unwavering support; I
could never have done this without you. We started this Chapter together, and finally,
we can turn the page. Here’s looking forward to our next exciting adventure.

vi
Table of Contents
Chapter 1 Introduction
Page 1
Chapter 2 FGF/Erk MAP kinase signaling utilizes post-transcriptional regulatory mechanisms in mouse ESCs.
Page 16
Chapter 3 FGF/Erk MAP kinase signaling regulates the expression of Brf1, an AU-rich element RNA binding protein.
Page 34
Chapter 4 Brf1 binds many pluripotency associated genes in vitro.
Page 44
Chapter 5 Brf1 post-transcriptionally regulates Nanog in response to FGF/Erk MAP kinase.
Page 54
Chapter 6 Changes in Brf1 expression affect mouse ESC self-renewal and developmental potential.
Page 58
Concluding Remarks Page 65
References Page 67
Appendix A Supplemental Materials and Methods
Page 78
Appendix B Supplemental Information
Page 80

vii
List of Figures
1.1 The LIF/JAK Signaling Pathway
1.2 The BMP Signaling Pathway
1.3 The FGF Signaling Pathway
1.4 Signaling pathways regulating mouse ESCs
2.1 Fluorescent reporter of Nanog transcription
2.2 FGF/Erk MAP kinase signaling regulates Nanog protein expression faster than Nanog transcription
2.3 FGF regulates the Nanog proximal promoter
2.4 Nanog protein is phosphorylated
2.5 Nanog protein is not phosphorylated by Erk
2.6 FGF upregulates miR-296-3p expression
2.7 Anti-miR-296-3p cannot block FGF-dependent regulation of Nanog
2.8 miRNAs do not regulate Nanog mRNA or transcription levels
2.9 FGF/Erk MAP kinase signaling regulates Nanog mRNA expression faster than Nanog transcription
2.10 Nanog is regulated by AU-rich element RNA binding proteins
3.1 Erk MAP kinase signaling regulates AUBP expression in mESCs
3.2 FGF/Erk regulates the expression of Zfp36 RNA-binding proteins
3.3 Rapid changes in Zfp36 expression at the mRNA and protein level
3.4 Brf1 tracks changes in FGF/Erk during differentiation
4.1 Brf1 binds other pluripotency-associated mRNAs
4.2 Nanog is bound and regulated by Brf1
5.1 Brf1 regulates Nanog in response to FGF
5.2 Brf1 is strongly regulated by FGF/Erk MAP kinase signaling
6.1 Brf1 expression compromises mouse ESC self-renewal
6.2 Developmental potential of mouse ESCs
6.3 Brf1 expression promotes mesendoderm differentiation

viii
List of Tables
4.1 Frequency of ARE motifs among mouse protein coding genes

1
Chapter 1
Introduction
Embryonic stem cells (ESCs) hold great promise for the development of novel
therapeutic strategies (1). Owing to their capacity for multi-lineage differentiation,
diseased or damaged tissues can be replaced outright, rather than relying on palliative
care and the body’s tolerance for wound healing (2). The discovery of ESCs thus heralds
the age of regenerative medicine. ESCs can be used to rejuvenate non-regenerative
tissues, such as the central nervous system, to correct deformities in tissue architecture
and function (3). They can also serve as models for disease, and be modified for the
treatment of genetic deficiencies or disorders (4, 5), to significantly improve a patient’s
quality of life. The development of ESC based strategies should provide safe and
effective treatments for numerous pathologies.
However, while many potential medical applications for ESCs have been
proposed, few have been implemented (6). In the decades following their discovery, the
pace of clinical translation has lagged far behind the still basic science into what makes
ESCs tick. In cell culture, ESCs are prone to differentiation, and research remains heavily
focused on understanding the molecular basis of their pluripotency and self-renewal (7-
9). To fully achieve the dream of regenerative medicine, we must first identify and
control the regulatory factors which influence the biology and behavior of ESCs.
Here we focus on intercellular signaling and its regulation of pluripotency and
self-renewal. Changes in signaling pathway activity strongly regulate the stability of ESC
2
cultures, but the mechanisms through which these regulatory effects are mediated have
not been identified. Our goal was to characterize these mechanisms, and ascertain their
functional and developmental relevance.
What are Embryonic Stem Cells?
ESCs are derived from the mammalian blastocyst, a pre-implantation embryonic
structure composed of only 3 differentiated lineages: trophectoderm, primitive
endoderm and epiblast (10, 11). The mammalian blastocyst is first hatched from the
zona pellucida and attached to a bed of mouse embryonic fibroblasts in vitro. Under
these conditions, epiblast cells grow out from the site of attachment and expand in
great numbers, whereas extra-embryonic cells (trophectoderm and primitive endoderm)
fail to proliferate. Stably propagating cultures of these self-renewing epiblast cells are
called ‘embryonic stem cells’ because of their ability to differentiate into all somatic cell
types including the germ cell lineage in vitro (10, 11). They can also be genetically
modified using transgenic methods, and reintroduced into donor blastocysts to
generate transgenic embryos, thus providing researchers with the technology to modify
and propagate changes to the mammalian genome (12-14).
To circumvent the destruction of embryos, an alternative strategy was also
developed to derive pluripotent cells. Terminally differentiated cells could be
epigenetically reprogrammed to an ESC-like state by forced expression of pluripotency-
associated transcription factors (Oct4, Sox2, Kl4 and Myc in mouse cells; Oct4, Sox2,
Lin28 and Myc in human cells) (15). These reprogrammed cells exhibited many of the
characteristics of genuine embryonic stem cells (16). However, because of their distinct

3
method of derivation, they were called ‘induced pluripotent stem cells’ (iPSCs). The
derivation of patient specific iPSCs, which bypassed issues of immunological tolerance,
further encouraged the development of personalized medical treatments. However, like
ESCs, iPSCs are unstable cell types that frequently undergo spontaneous differentiation
in suboptimal cell culture conditions.
The Role of Intercellular Signaling in Pluripotent Cells
ESC and iPSC cultures are stabilized by defined cell culture media formulations
(17). The key constituents of these media formulations are factors that modulate
signaling pathway activity. Activation or inhibition of specific signaling pathways can
promote pluripotency and continued self-renewal, and reduce the incidence of
spontaneous differentiation in cell culture. We describe each of these signaling
pathways in greater detail, from a historical perspective, and discuss their possible
mechanistic connection to pluripotency and self-renewal genes.
Leukemia Inhibitory Factor Signaling
The derivation of the first ESC lines required embryonic fibroblast feeder layers
(10, 11). It was hypothesized that these feeder layers produced an unknown transacting
signaling factor which stabilized ESCs in culture. Leukemia Inhibitory Factor (LIF) was
identified in a screen for signaling ligands which could support the undifferentiated
growth of mouse ESCs (18, 19). Supplementing ESC cultures with LIF eliminated the
need for embryonic feeders.
4
LIF is part of the cytokine family of ligand/receptor systems, known to mediate
developmental and homeostatic responses in the embryonic and adult mouse. As a
cytokine, its regulation is often associated with the hematopoietic lineage, but it is
known to be broadly expressed by other cell and tissue types. For example, LIF is
secreted from the endometrium to promote an exit from embryonic diapause after
periods of nutrient stress (20), and is essential for blastocyst implantation (21). LIF is
also important for maintaining resident stem cell populations in the adult brain (22),
inhibiting angiogenesis (23), promoting muscle regeneration (24), and suppressing
inflammation associated pathologies (25).
LIF interacts with the heterodimeric cell surface receptor gp130/LIFR to activate
the intracellular non-receptor tyrosine Janus kinase (JAK) (26) (Figure 1.1). Activated JAK
then phosphorylates Stat protein second messengers, which shuttle to the nucleus to
act as transcription factors. JAK kinase can also activate other second messenger
pathways (27). For example, gp130/LIFR mediates a direct interaction with PI3 kinase,
which regulates gene expression by activating Protein kinase B (PKB). Cytokine receptors
can also associate with Ras via the adaptor protein SHC, which activates Erk MAP kinase
signaling responses.
The activation of multiple second messenger pathways can have different effects
on the maintenance of pluripotency and self-renewal. For example, upregulating Stat
activity maintains pluripotency in the absence of LIF, indicating that the signaling
pathway imparts its protective effects, in part, through Stat-mediated transactivation of
pluripotency-associated genes (28). A constitutively active form of PKB can also support

5
mESC culture in the absence of LIF, as well (29). However, enhancing Erk MAP kinase
signaling has been shown to rapidly induce mESC differentiation (30). These
observations indicate that LIF is capable of activating numerous intracellular responses,
which could have antagonistic functional and regulatory effects. However, with regards
to LIF, it would appear that its ability to support pluripotency and self-renewal outweigh
its destabilizing and differentiating effects.
Bone Morphogenic Protein Signaling
Even in the presence of LIF, mouse ESCs require serum, indicating additional
extrinsic signaling requirements. It was known that culturing mouse ESCs without serum
strongly promoted neural differentiation. Thus, this serum derived factor was expected
to be anti-neurogenic. These observations led researchers to Bone Morphogenic Protein
(BMP), which inhibits neural differentiation via Smad transcription factors, and is known
to be present in serum.
BMPs are a subdivision of the Transforming Growth Factor- (TGF-) superfamily
of ligands and receptors, first identified as potent inducers of bone formation, but are
now known to mediate diverse developmental processes in the embryonic and adult
mouse (31). BMP ligands are homodimers, but can exist as heterodimeric pairs. These
signaling ligands nucleate cell surface receptors to form a heterotetrameric receptor
complex composed of two Type I (BMPRIA/B, ALK1 or ALK2) and two Type II (BMPRII,
ACVR-I or ACVR-II) receptors (Figure 1.2). BMP ligands can exhibit a preference for
specific Type I and Type II receptor combinations, which influences the signaling activity

6
perceived by recipient cells. The formation of a heterotetrameric BMP receptor complex
activates intracellular serine/threonine kinase domains to permit phosphorylation and
activation of Smad (1/5/8) second messengers, which function as transcription factors
(Figure 1.2).
The BMP pathway is thought to prevent mouse ESC differentiation by inducing
the expression of Inhibitors of Differentiation (Id) proteins, which bind to and inhibit the
activity of pro-neural basic Helix-loop-Helix transcription factors that are expressed in
ESCs (32). However, it has also been shown to regulate the overall receptivity of mouse
ESCs to differentiation, by controlling the expression of pluripotency associated factors,
such as Cdh1 (33).
When ESCs were supplemented with LIF and BMP, self-renewal and pluripotency
are maintained even in basal media (N2B27) (32). Thus, the discovery of LIF and BMP
identified the minimal set of signaling pathway activities that were required to stabilize
mouse ESCs in culture.
Discrepancies between embryonic and cell culture signaling requirements
Knockout phenotypes in the early mouse embryo suggested a possible role for
Fibroblast Growth Factor (FGF) and Erk MAP kinase signaling as well (34). Loss of either
FGF or Erk MAP kinase signaling compromised normal pre-implantation development by
promoting epiblast at the expense of primitive endoderm (35, 36), while enhancing FGF
or Erk MAP kinase signaling had the opposite effect (37). By contrast, LIF and BMP
deficiencies had no effect on the development of pre-implantation mouse embryos.
7
How does the in vivo requirement for FGF and Erk MAP kinase relate to the in vitro
dependence of mouse ESCs on LIF and BMP?
Researchers discovered that inhibition of FGF and its second messenger pathway
Erk MAP kinase functionally replaced the requirement for LIF and BMP (38). LIF/Stat and
BMP/Smad coincidentally regulated similar sets of downstream targets as FGF/Erk, and
antagonized the differentiating effects of FGF/Erk MAP kinase signaling through indirect
mechanisms (39). Maintaining the activity of exogenous signaling pathways (i.e. LIF and
BMP) was therefore not required, as long as the activity of destabilizing signaling
pathways (i.e. FGF/Erk) remained suppressed.
In agreement with these observations, using FGF/Erk MAP kinase signaling
inhibitors enhanced the efficiency of ESC derivation from recalcitrant mouse strains (40,
41). FGF/Erk MAP kinase signaling inhibitors also permitted the first ever derivation of
Rat ESCs, which cannot be supported by LIF and BMP alone (42). It was thus proposed
that FGF/Erk MAP kinase was the key signaling pathway through which rodent ESCs are
controlled (43).
Fibroblast Growth Factor Signaling
FGFs are secreted growth factors, which bind to FGF-specific receptor tyrosine
kinases (FGFRs) (Figure 1.3). This interaction occurs in association with heparin sulfate
proteoglycans (HSPGs), which coat the surface of cells and are often regarded as
necessary cofactors for signaling. Upon receptor activation, docking proteins aggregate
on the intracellular side of the receptor in a phosphorylation-dependent manner, to
pass the activation signal to second messenger pathways.

8
The second messengers downstream of FGFR are intracellular kinase cascades
(44) (Figure 1.3). For example, FGFRs frequently activate the Erk MAP kinase pathway
via Ras, which is a Serine-Proline/Threonine-Proline directed kinase. Erk is known to
regulate numerous cellular functions and activities such as cell division, DNA replication,
gene expression and differentiation. FGFRs can also activate PI3 kinase directly. The
activity of PI3 kinase promotes cell survival by inhibiting apoptosis, increasing the
activity of nutrient sensing pathways and preventing differentiation via PKB.
The activation of both Erk MAP kinase and PI3 kinase signaling pathways could
yield antagonistic functional and regulatory effects. Erk MAP kinase signaling promotes
differentiation, whereas PI3 kinase maintains pluripotency and self-renewal.
Interestingly, researchers determined that even though FGFRs have the capacity to
signal through PI3 kinase, it does not appear to be a major regulator of this second
messenger system in mouse ESCs (38). This observation could explain why disrupting
FGF signaling primarily affects Erk MAP kinase signaling activity.
Erk MAP Kinase Signaling
The components of the Erk MAP kinase pathway are well conserved, consisting
of three kinases linearly activated in a cascade, invariant across all eukaryotes (45). For
mammalian cells, the Erk MAP kinase pathway receives inputs from Ras, a membrane
localized GTPase, which associates with activated cell surface receptors, such as FGFR.
Erk is the terminal kinase in the phosphorylation cascade, and it is the major
effector of the Erk MAP kinase signaling pathway (46). Erk binds and phosphorylates its
protein targets to regulate their function, stability and/or cellular localization. Binding

9
and phosphorylation are discrete events, as docking and phosphorylation are mediated
by separate protein domains. Although Erk post-translationally regulates its targets, it
phosphorylates transcription factors and post-transcriptional regulatory proteins, such
as components of the miRNA pathway and RNA binding proteins. Thus, Erk has the
capacity to regulate genes at all levels of expression.
Interestingly, even though Erk binding and phosphorylation motifs have been
extensively characterized in vitro (47), and the effects of signaling activation on mouse
ESCs are well studied (38), the identification of real and functionally important targets
which mediate these effects has been challenging. Erk can also activate other regulatory
kinases such as S6K and RSK, which have different target specificities. As such, the
mechanistic basis for how Erk MAP kinase signaling destabilizes pluripotency and self-
renewal remains unclear.
Pluripotency and self-renewal are maintained by a transcription factor network
Rapid progress has been made in identifying key regulatory signaling pathways,
such as FGF/Erk MAP kinase signaling. But the exact mechanisms through which these
signaling pathways regulate the activity of pluripotency, self-renewal or differentiation
factors have not been identified (48).
Pluripotency, self-renewal and differentiation are cellular properties which are
regulated by a network of transcription factors. The core members of this
transcriptional network include Oct4, Sox2, Nanog, Klf4, Nac1, Dax1 and Zfp281 which
form a module that regulates developmental genes, and Myc and Rex1, which support
proliferation and self-renewal (49). These transcription factors bind enhancer sequences

10
which drive the expression of hundreds of pluripotency and self-renewal associated
genes and can, in certain instances, promote the repression of differentiation factors
(50).
Compromising the expression of any core transcription factor can destabilize the
ESC transcription factor network. These regulatory effects may also be dose-dependent.
For example, enhancing Oct4 expression by 50% induces differentiation to
mesendoderm, but downregulation of Oct4 by 50% causes primitive endoderm
differentiation (51). In addition, controlling the expression of individual transcription
factors can compensate for a deficiency in others. For example, enhancing Oct4
expression maintains pluripotency in cells devoid of Sox2 (52). Finally, sustained
expression of specific factors can reinforce the expression of all others to maintain
pluripotency, as is the case with Nanog (53).
These observations indicate that signaling-dependent control of any core
transcription factor can strongly impact the stability of mouse ESCs (Figure 1.4).
The homeodomain protein Nanog is regulated by Erk MAP kinase signaling
FGF/Erk MAP kinase signaling strongly regulates the expression of Nanog (37).
The homeodomain protein Nanog was first identified in a screen for transcription
factors which, when overexpressed, could maintain pluripotency in the absence of LIF.
Since then, it has been shown that Nanog maintains the most naïve state of
pluripotency (54), and is absolutely required for germline differentiation (55).
Knockdown or knockout of Nanog greatly destabilizes their culture and promotes rapid
differentiation (55, 56). Although the regulation of Nanog has been extensively studied

11
at the promoter, mRNA and protein level, mechanisms that connect FGF/Erk MAP
kinase signaling to its regulation have not been identified (48).
To better understand how FGF/Erk MAP kinase signaling regulates pluripotency
and self-renewal gene circuits, we explored this specific regulatory relationship further,
to uncover novel mechanistic connections and molecular players, which could have a
broader role in the regulation of other key developmental transcription factors.

12
Figures
Figure 1.1 – The LIF/JAK Signaling Pathway. (1) LIF brings together gp130 and LIFR
surface receptors to form a heterodimeric receptor complex that activates JAK kinase
(green). (2) JAK kinase can phosphorylate Stat (red), (3) which can then forms dimers, (4)
and shuttle to the nucleus as a transcription factor. JAK can also activate PI3 kinase and
Erk MAP kinase second messenger pathways.

13
Figure 1.2 – The BMP Signaling Pathway. (1) BMP homodimers and heterodimers
nucleate four surface receptors (two Type I and two Type II receptors). (2) Type I
receptors within the heterotetrameric receptor complex can phosphorylate the C-
terminal domain of Smad1/5/8 proteins, (3) to permit their trimerization with co-Smads
(purple). (4) Activated Smad trimers shuttle to the nucleus to modulate transcription.

14
Figure 1.3 – The FGF Signaling Pathway. (1) FGF in association with heparin sulfate
proteoglycans permit homodimerization of FGFR. Homodimerization of cell surface
receptors greatly enhances their intrinsic tyrosine kinase activity, (2) leading to the
phosphorylation of several adaptor proteins (green) which dock the intracellular
domain. (3) Adaptor proteins channel the activation signal to Erk MAP kinase and PI3
kinase signaling pathways. (4) Terminal kinases within these pathways phosphorylate
transcription factors, among other possible protein targets.

15
Figure 1.4 – Signaling pathways regulating mouse ESCs. LIF/Stat, FGF, Erk MAP kinase,
BMP/Smad and WNT/-Catenin signaling influence the pluripotency, self-renewal and
differentiation in mouse ESCs. They can have stabilizing (green lines) or destabilizing
(red lines) effects. Signaling pathways are stimulated by providing exogenous signaling
ligand, such as for LIF and BMP. Alternatively, signaling pathway activity can also be
modulated using pharmacological inhibitors, such as CHIR (targets GSK3), PD173074
(targets FGF receptors) and PD184352 (targets MEK1/2). The mechanistic connection
between these signaling pathways and the molecular regulators of pluripotency, self-
renewal and differentiation (italicized) remains unclear.

16
Chapter 2
FGF/Erk MAP kinase signaling utilizes post-transcriptional regulatory mechanisms in
mouse ESCs.
(This chapter was adapted, in part, from (57))
Introduction
Mouse ESCs are trapped in a unique developmental state which allows them to
proliferate without differentiating. This developmental state is stabilized by
transcription factors, of which an increasing number have been shown to play
indispensable roles. A core network of less than 20 factors is thought to support the
most critical functions by driving the expression of pluripotency-associated genes, and
activating repressors of differentiation cues or markers.
Intercellular signaling regulates this transcription factor network via second
messenger proteins, which can have stabilizing or destabilizing effects. For example,
FGF/Erk MAP kinase signaling is known to destabilize mESC pluripotency and self-
renewal, but it may do so through numerous transcriptional, post-transcriptional and
post-translational mechanisms. FGF/Erk MAP kinase signaling is a well-characterized
signaling pathway, but very little is known about how it is mechanistically connected to
the regulation of pluripotency genes.
How can candidate mechanisms be identified? Among the most well-
characterized pluripotency factors, Nanog expression is known to be strongly regulated
by FGF/Erk MAP kinase signaling (10). The anti-correlation between FGF/Erk MAP kinase
17
signaling activity and Nanog expression is well-documented in vitro and in vivo (37). To
connect FGF/Erk MAP kinase signaling to pluripotency and differentiation gene circuits,
we explored the dynamics of this regulatory relationship further to uncover novel
mechanistic connections and their molecular players.
Materials and Methods
Nanog Reporter Cell Line
We used mESCs carrying a histone2B-yfp reporter driven by the endogenous
nanog promoter [v6.5 mESCs, Strain: (C57BL/6 x 129S4/SvJae), F1] to explore the
connection between Nanog expression and FGF or Erk MAP kinase signaling (Figure 2.1).
Stable integration of the histone2B-yfp reporter into the nanog locus inactivated one of
the nanog alleles, which reduced overall Nanog expression levels in these cells.
However, these reporter cell lines are haplo-sufficient and remain pluripotent (58).
Immunohistochemistry and Quantitative Reverse Transcription Polymerase Chain
Reaction (qRT-PCR) Timecourses
To readout changes in protein level in response to FGFR or MEK1/2 inhibition,
with 200nM PD173074 or 5uM CI-1040, respectively, we immunostained inhibitor
treated reporter cell lines with a polyclonal Nanog antibody (Bethyl Labs, A300-397A,
1:1000). Cultures were harvested with 0.25% Trypsin-EDTA, dispersed into single cell
suspensions and added to an equal volume of 4% Formaldehyde. Cells were pelleted,
resuspended in 10% FBS in PBS to block, gently pelleted again, and then stained with

18
primary and secondary antibodies at 4C, overnight. Before flow cytometry analysis,
cells were pelleted and resuspended in 2.5 mg/ml BSA in 1xHBSS. All samples, stained
and unstained, were analyzed with a Miltenyi Biotech VYB flow cytometer.
Compensation and background correction were applied post-acquisition.
In parallel, we tracked mRNA level changes. Total RNA was harvested with QIAzol
reagent (Qiagen, 79306), after which cDNAs were amplified and analyzed using qRT-
PCR. A single qPCR reaction was composed of 0.5ul of cDNA, primers or primers with
probes, and qPCR reaction mix (diluted to a final volume of 10ul). For qPCR experiments
using TaqMan/hydrolysis probes (5’ Dye: FAM, 3’ Quencher: Zen/Iowa Black FQ) or
primers, cDNAs were profiled with SsoFast Supermix Reagent (Bio-Rad) using the
manufacturer recommended protocol. In brief, we employed a 2-step thermocycling
protocol (an initial 30 second 95C melt, followed by 40 cycles of 5 second 95C melt
and 10 second 60C anneal/extend).
Two-dimension (2D) gel electrophoresis
Two-dimension (2D) gel electrophoresis was used to detect phosphorylated
residues. Cells were harvested and lysed in detergent-free lysis buffer (8M Urea, 200mM
NaCl and 40mM HEPES pH 8.0) at a concentration of 2x10⁶ cells per 100ul. Lysates were
supplemented with Complete Protease Inhibitor (Roche) and Phosphatase Inhibitor
Cocktail I and II (Sigma) when appropriate. Samples were separated on a pH gradient
(pH 3.5 to pH 10) followed by molecular weight separation via SDS-PAGE. Samples
treated with calf intestinal phosphatase (CIP) were first dialyzed a thousand-fold using

19
Amicon Ultra Centrifugal Filter Units (3kDa) to remove Urea and inhibitors. Samples
were then incubated with 10 Units of CIP for 3hrs at 37°C in NEB Buffer “3” before
separation by 2D-gel electrophoresis.
In vitro Phosphorylation Assay
Direct phosphorylation by Erk MAP kinase was screened in vitro. A total of 5ug of
NiNTA purified, recombinant produced Nanog/Myc-6His, was incubated with 200ng
Human Erk1 (Cell Signaling Technologies) in Kinase Buffer (25mM Tris-HCl, 5mM -
glycerophosphate, 2mM DTT, 0.1mM Na3VO4, 10mM MgCl2) supplemented with 100uM
ATP, [-32P]. Radioactive labeling was screened using a phosphorimager.
Nanog mRNA half-life Measurement
To measure changes in Nanog mRNA half-life, mESC cultures were co-transfected
with a reverse Tet (rTet) expression plasmid (PGK-H2B-mCherry/T2A/rTet) and either
CMV(2xTetO)-H2B-YFP or CMV(2xTetO)-Nanog (with or without AREs) at 19:1 ratio by
mass. Culture media was then transitioned to media containing FGF4 and Heparin
(10ng/ml and 10ug/ml respectively) or PBS to determine the regulatory effect of ERK
MAP kinase signaling in fgf4-/- cells. To stop transcription from the CMV-TO promoter,
Doxycycline was added to obtain a final concentration of 1ug/ml which permits binding
of rTet to Tet operator sequences. Changes in the abundance of H2B-YFP or Nanog
mRNA relative to Gapdh, Sdha and Tbp housekeeping genes was measured using qRT-
PCR. To distinguish from endogenous Nanog mRNA, we developed a primer set that
20
specifically recognized the 5’UTR of Nanog expressed only from the CMV(2xTetO)
promoter.
Results and Discussion
We used pharmacological inhibitors of signaling to disrupt the regulation of
Nanog expression (Figure 2.2.A). We discovered that in response to FGFR inhibition,
Nanog protein levels increased in two distinct stages: An initial response was observed
within 5 hours, with a second, more gradual increase occurring over the next 20 hours
(Figure 2.2.B, blue solid line). Interestingly, the initial rapid increase in Nanog protein (≤
5hrs) could not be explained by a corresponding increase in transcription, as YFP
fluorescence increased only after a short delay (Figure 2.2.B, blue dotted line). We also
observed the same two-stage response to MEK1/2 inhibition (Figure 2.2.B, red solid and
dotted lines). These results indicate that in addition to transcriptionally regulating
Nanog expression, FGF and Erk MAP kinase signaling independently regulate Nanog
protein levels on a much faster timescale.
Previous work has shown that a cis-regulatory element in the proximal nanog
promoter is required for downregulating Nanog transcription by FGF/Erk MAP kinase
signaling (59) (Figure 2.3). This region of the nanog promoter contains a transcriptional
enhancer, composed of DNA sequences surrounding a conserved Oct4/Sox2 binding
motif (60). Ablating this Oct4/Sox2 enhancer compromises the transcriptional regulation
of Nanog by FGF/Erk MAP kinase signaling (59). Since Oct4 and Sox2 are known to
nucleate many pluripotency associated transcription factors, FGF/Erk MAP kinase
signaling thus mediates its repression by first downregulating one or more of these

21
activating transcription factors (Figure 2.3) (49). Nanog has been shown to auto-regulate
its own transcription. Post-translational regulation of Nanog could compromise
enhancer function to permit signaling dependent control over the nanog promoter, and
could explain why the transcriptional response to FGFR and MEK1/2 inhibitors is delayed
relative to protein level changes.
Erk may influence Nanog protein stability directly via phosphorylation (Figure
2.4.A). We determined that Nanog protein is phosphorylated (Figure 2.4.B), and multiply
phosphorylated Nanog accumulates when the proteasome is inhibited (Figure 2.4.C).
However, Nanog is not phosphorylated by Erk MAP kinase (Figure 2.5). These data do
not discount the possible role of other unidentified kinases, which operate downstream
of Erk1/2 activation, and for which consensus binding motifs have not been identified.
In the absence of a direct post-translational mechanism that could account for
protein level changes, another possible explanation is that regulation of Nanog mRNA
leads to corresponding changes in Nanog protein. Erk MAP kinase signaling might
regulate the biogenesis of microRNAs (61), which would then regulate Nanog mRNA
translation and stability directly. Recent studies implicate several miRNAs in the
maintenance of self-renewal and differentiation (62, 63), and a few have been shown to
target Nanog mRNA (64).
To explore this possibility, we profiled changes in mature miRNA expression in
fgf4-/- cells after brief stimulation with HrFgf4/Heparin using microarrays. Differentiation
associated miRNAs were upregulated after 5 hours of FGF signaling activation (Figure

22
2.6). Notably, miR-296-3p expression was upregulated 2-fold by FGF, which has been
shown in previous studies to directly regulate Nanog expression (64).
FGF signaling reduces Nanog mRNA levels (Figure 2.7). We discovered that
transfecting fgf4-/- mESCs with an antago-miR against miR-296-3p could not block the
downregulation of Nanog mRNA by FGF4/Heparin (Figure 2.7). Furthermore, transient
knockdown of Dicer and/or Drosha expression using siRNAs could not alter Nanog or
YFP mRNA levels after 36 hours (Figure 2.8). These data indicate that microRNAs may
not play a central role in the regulation of Nanog expression.
Interestingly, the response of Nanog mRNA to FGF or Erk MAP kinase signaling
inhibitors was similarly rapid. Using qRT-PCR, we compared Nanog transcript levels to
Histone2B-yfp mRNA levels. Here, we also observed a two-stage response to the
inhibition of FGFR or MEK1/2, with changes in mRNA occurring well before changes in
transcription, and on a similar timescale as protein level changes (compare Figure 2.2.B
and 2.9.B). We note strong similarities between Nanog mRNA and protein level changes
(compare Figure 2.2.B and 2.9.B). It is possible that changes in protein levels simply
reflect changes in mRNA abundance.
We hypothesized that FGF/Erk MAP kinase signaling rapidly activated or
enhanced the expression of an RNA binding protein, which then post-transcriptionally
regulated Nanog mRNA. We inspected the Nanog mRNA sequence for protein binding
motifs and discovered several AU-rich elements (AREs) in the 3’UTR (Figure 2.10.A). AU-
rich element RNA binding proteins (AUBPs) have been shown to regulate mRNA stability
and translational efficiency in other cellular contexts (65). To determine whether
23
Nanog’s AREs are post-transcriptionally regulated by AUBPs in response to FGF/Erk MAP
kinase signaling (Figure 2.10.B), we measured changes in the Nanog mRNA half-life in
the presence or absence of AREs, and in the presence or absence of FGF signaling. Using
fgf4-/- mESCs, we determined that the half-life of Nanog mRNA is 2.5 ± 0.4 hours (±
s.e.m.) without FGF4/Heparin and 1.5 ± 0.3 hours (± s.e.m.) with Fgf4/Heparin (Figure
2.10.C, left). Removing all 3’UTR ARE sites [ARE (1,2,3)] eliminated the post-
transcriptional regulation of Nanog mRNA by FGF signaling (Figure 2.10.C, middle). A
negative control mRNA (H2B-YFP) which does not have AREs is also insensitive to
changes in FGF signaling (Figure 2.10.C, right).
Together, these data show that Nanog’s AREs are post-transcriptionally
regulated by FGF signaling, highlighting the potential regulatory significance of AUBPs as
signaling intermediates and as regulators of development.

24
Figures
Figure 2.1 – Fluorescent reporter of Nanog transcription. A diagram of a histone2b-
IRES-puromycin-SV40pA knock-in cassette used to replace exon1 of the nanog gene.

25
Figure 2.2 – FGF/Erk MAP kinase signaling regulates Nanog protein expression faster
than Nanog transcription. (A) Cartoon of the FGF/Erk MAP kinase signaling pathway
and its connection to Nanog. This regulatory connection was explored using FGFR and
MEK1/2 inhibitors, PD173074 (100ng/ml) and CI-1040 (5uM), respectively. (B) The effect
of FGF or MEK inhibition on Nanog protein levels and transcription over a 20 hour time course [
SEM, n=4]. Values show fold change in concentration relative to an untreated negative control
(DMSO only).

26
Figure 2.3 – FGF regulates the Nanog proximal promoter. FGF regulates factors which
bind the Oct/Sox enhancer, approximately -180 from the transcription start site, to
downregulate Nanog transcription.

27
Figure 2.4 – Nanog protein is phosphorylated. (A) Erk could phosphorylate Nanog
protein directly. (B) 1-dimension SDS-PAGE blotting for endogenous Nanog in the
presence and absence of proteasome inhibitor (MG-132). Note the slight change in
electrophoretic mobility after proteasome inhibition. (C) Each panel shows 2-dimension
western blot for Nanog under the indicated conditions: Panels B and D include
proteasome inhibitor. Panels C and D include Calf Intestinal Phosphatase treatment.
Red arrows show that Nanog accumulates acidic post-translational modifications when
mESC cultures are grown with proteasome inhibitor. Blue arrows indicate the
accumulation of less acidic forms of Nanog protein after protein lysates are treated with
phosphatase, which confirms the existence of phospho-modifications.

28
Figure 2.5 – Nanog protein is not phosphorylated by Erk. Nanog protein contains kinase
docking sites (Erk and Cyclin) and phosphorylation motifs overlapping a PEST domain,
which could link phosphorylation events to protein destabilization. However,
recombinant Nanog-Myc/6His was not phosphorylated by Erk1 or Cdk1/CycB in vitro. By
contrast, the Erk1 and Cdk1/CycB targets, GST-Elk1 and GST-Rb1, respectively, could be
labeled with -32P-ATP.

29
Figure 2.6 – FGF upregulates miR-296-3p expression. Mature miRNA expression was
profiled in the presence (black bars) or absence (white bars) of FGF4/Heparin (5 hours)
in fgf4-/- R1 mESCs. Plotted is the expression of known differentiation associated
miRNAs, relative to miR-290-5p (positive control). Note the 2-fold change in miR-296-
3p, a miRNA that has been shown to post-transcriptionally regulate Nanog mRNA (64).

30
Figure 2.7 – Anti-miR-296-3p cannot block FGF-dependent regulation of Nanog. (A)
miR-296-3p may act as a regulatory intermediate of FGF/Erk MAP kinase signaling. (B)
Transfecting fgf4-/- R1 mESCs with anti-miR-296-3p [10nM] cannot prevent the
downregulation of Nanog mRNA by FGF4/Heparin (5 hours).

31
Figure 2.8 – miRNAs do not regulate Nanog mRNA and transcription levels. (A)
Western blots showing successful knockdown of Dicer and Drosha after 24 hours. (B)
Rbl2 is upregulated in response to Dicer and Drosha knockdown after 36 hours (positive
control). (C) Dicer or Drosha knockdown does not affect Nanog mRNA or transcription
levels in the Nanog reporter cell line [ SEM, n=4].
32
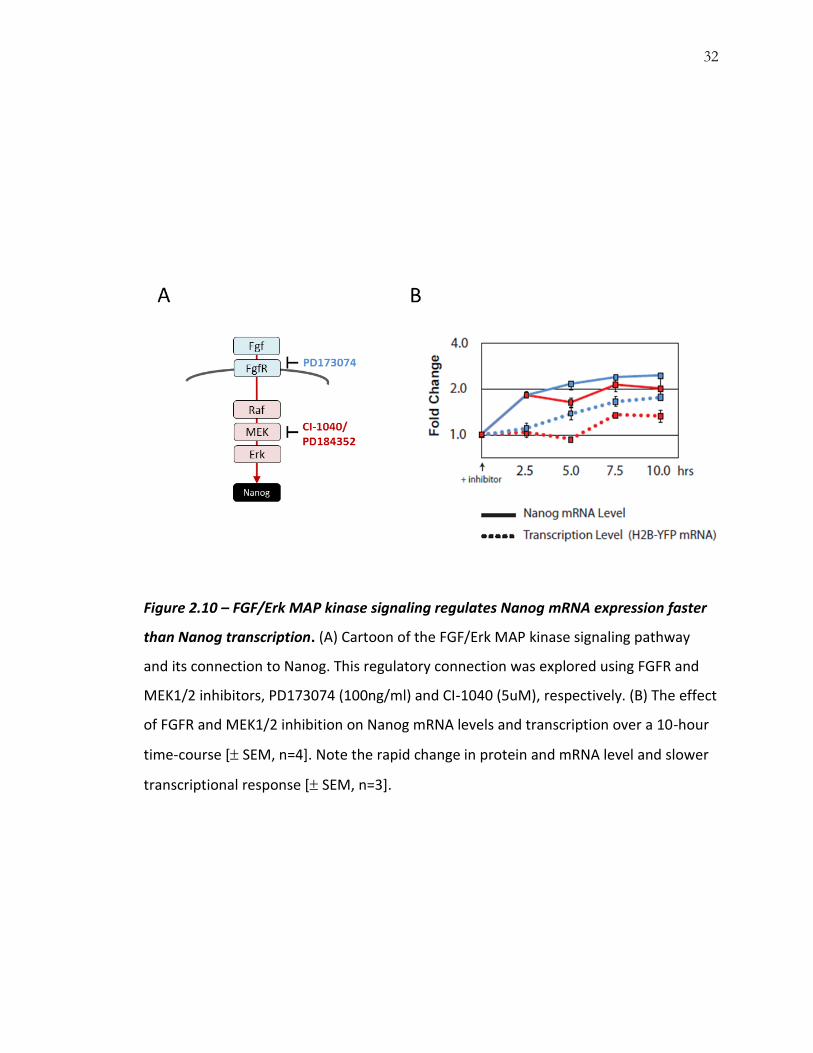
Figure 2.10 – FGF/Erk MAP kinase signaling regulates Nanog mRNA expression faster
than Nanog transcription. (A) Cartoon of the FGF/Erk MAP kinase signaling pathway
and its connection to Nanog. This regulatory connection was explored using FGFR and
MEK1/2 inhibitors, PD173074 (100ng/ml) and CI-1040 (5uM), respectively. (B) The effect
of FGFR and MEK1/2 inhibition on Nanog mRNA levels and transcription over a 10-hour
time-course [ SEM, n=4]. Note the rapid change in protein and mRNA level and slower
transcriptional response [ SEM, n=3].

33
Figure 2.10 – Nanog is regulated by AU-rich element RNA binding proteins. (A)
Illustration indicating the relative location and sequence of AU-rich elements in the
3’UTR of Nanog. (B) AUBPs may act as regulatory intermediates of FGF/Erk MAP kinase
signaling. (C) Changes in mRNA half-life were profiled in the presence (blue data points)
or absence (black data points) of FGF signaling in fgf4-/- mESCs for wild-type Nanog
mRNA (top), mutant Nanog mRNA with deleted AREs (ARE (1,2,3)) (middle), and H2B-
YFP mRNA (bottom) [ SEM, n = 4]. Red dashed lines indicate half the initial mRNA
concentration.

34
Chapter 3
FGF/Erk MAP kinase signaling regulates the expression of Brf1, an AU-rich element
RNA binding protein.
(This chapter was adapted, in part, from (57))
Introduction
AU-rich element mRNA binding proteins (AUBPs) represent an important class of
regulators required for the proper development of embryonic and adult tissues in the
mouse (66), but whether they have developmentally important roles in mouse
embryonic stem cells (mESCs) remains unclear. A recent proteomic survey identified
more than 500 mRNA binding proteins, several of which are AUBPs (67). Independent of
the microRNA pathway, AUBPs are known regulators of splicing, mRNA stability,
translational efficiency and RNA transport (68), and could provide an additional layer of
developmental regulation that complements other pluripotency and self-renewal
mechanisms. AUBPs are essential in many developmental systems, such as during
hematopoiesis, neurogenesis, germ cell commitment and placental morphogenesis (69-
71). Their absence or misregulation can be lethal, and often promotes disease
progression (72-74). Despite growing interest in the many functions of AUBPs, their
regulation and function in mESCs remains poorly understood.
The expression and activity of AUBPs is known to be regulated by growth factor
signaling in many cellular contexts (75, 76). In mESCs, the FGF/Erk MAP kinase signaling
pathway is a central regulator of self-renewal, pluripotency and differentiation (43, 48).

35
Although much is known about the developmental effects of FGF/Erk MAP kinase
signaling inhibition or activation (30, 38), the regulatory mechanisms employed
downstream of Erk1/2 often remain unclear. Various transcriptional, post-
transcriptional and post-translational mechanisms are engaged to regulate target genes
(44). As part of this signaling cascade, AUBPs could mediate rapid signaling-dependent
responses, but this potential role has not been investigated.
Materials and Methods
We measured changes in AUBP mRNA level using qRT-PCR. As described
previously, total RNA was harvested with QIAzol reagent (Qiagen), after which cDNAs
were amplified and analyzed using qRT-PCR. Further information regarding qRT-PCR
reaction conditions and reagents can be found in the Supplementary Methods section.
For Western blot analysis, cells were harvested and lysed with SDS Loading
Buffer (1% SDS, 10% glycerol, 0.01% bromphenol blue and 60mM Tris pH 6.8) at a
concentration of 1x10⁶ cells per 100ul. To profile nuclear and cytoplasmic protein
fractions, harvested cell pellets were first processed with NE-PER Nuclear Protein
Extraction Kit, before the addition of SDS Loading Buffer.
Results and Discussion
AUBP expression in mESCs has been documented by several groups (67, 74, 77).
The known sensitivity of AUBPs to growth factors suggested that these proteins could
be regulated by FGF/Erk MAP kinase signaling (76, 78). To explore this potential
regulatory connection, we first profiled the transcriptome of E14 mESCs using high-
36
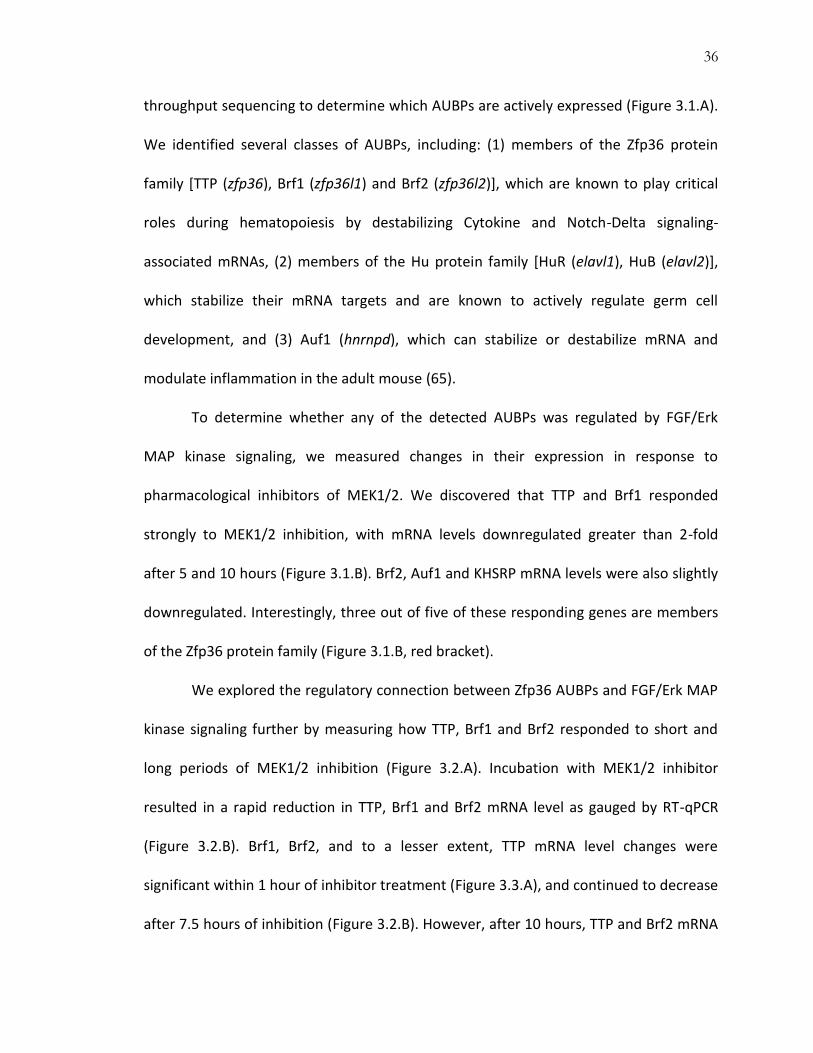
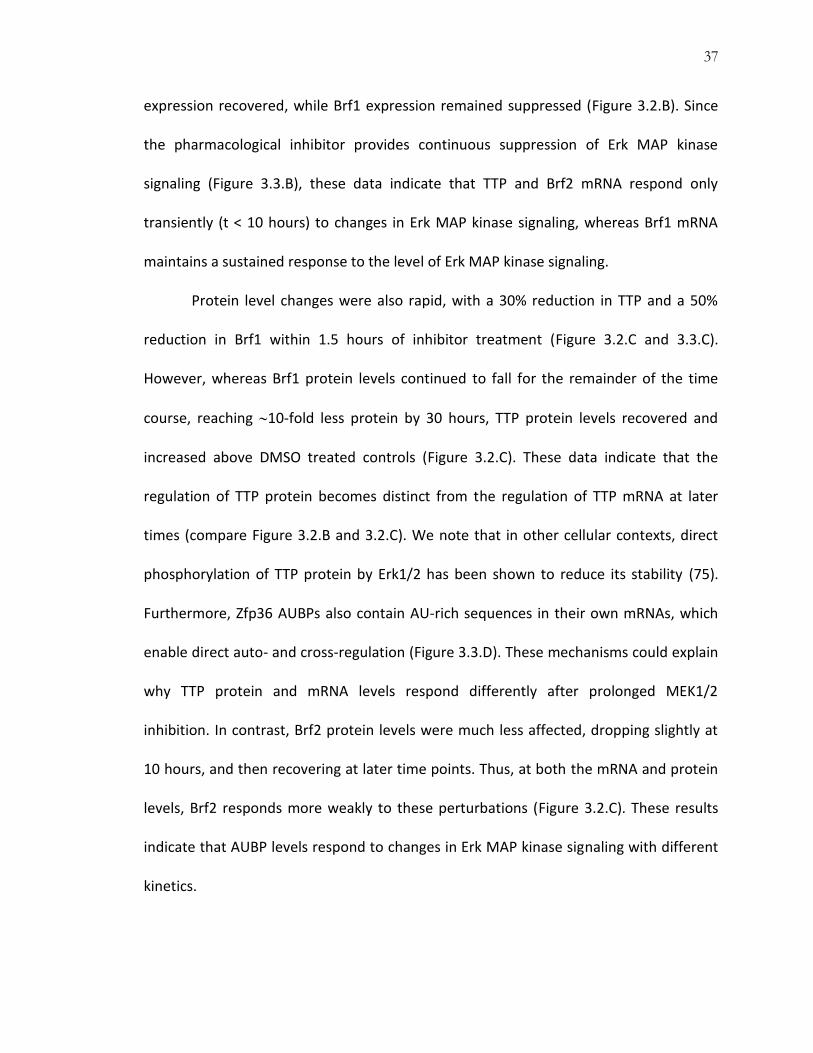
throughput sequencing to determine which AUBPs are actively expressed (Figure 3.1.A).
We identified several classes of AUBPs, including: (1) members of the Zfp36 protein
family [TTP (zfp36), Brf1 (zfp36l1) and Brf2 (zfp36l2)], which are known to play critical
roles during hematopoiesis by destabilizing Cytokine and Notch-Delta signaling-
associated mRNAs, (2) members of the Hu protein family [HuR (elavl1), HuB (elavl2)],
which stabilize their mRNA targets and are known to actively regulate germ cell
development, and (3) Auf1 (hnrnpd), which can stabilize or destabilize mRNA and
modulate inflammation in the adult mouse (65).
To determine whether any of the detected AUBPs was regulated by FGF/Erk
MAP kinase signaling, we measured changes in their expression in response to
pharmacological inhibitors of MEK1/2. We discovered that TTP and Brf1 responded
strongly to MEK1/2 inhibition, with mRNA levels downregulated greater than 2-fold
after 5 and 10 hours (Figure 3.1.B). Brf2, Auf1 and KHSRP mRNA levels were also slightly
downregulated. Interestingly, three out of five of these responding genes are members
of the Zfp36 protein family (Figure 3.1.B, red bracket).
We explored the regulatory connection between Zfp36 AUBPs and FGF/Erk MAP
kinase signaling further by measuring how TTP, Brf1 and Brf2 responded to short and
long periods of MEK1/2 inhibition (Figure 3.2.A). Incubation with MEK1/2 inhibitor
resulted in a rapid reduction in TTP, Brf1 and Brf2 mRNA level as gauged by RT-qPCR
(Figure 3.2.B). Brf1, Brf2, and to a lesser extent, TTP mRNA level changes were
significant within 1 hour of inhibitor treatment (Figure 3.3.A), and continued to decrease
after 7.5 hours of inhibition (Figure 3.2.B). However, after 10 hours, TTP and Brf2 mRNA
37
expression recovered, while Brf1 expression remained suppressed (Figure 3.2.B). Since
the pharmacological inhibitor provides continuous suppression of Erk MAP kinase
signaling (Figure 3.3.B), these data indicate that TTP and Brf2 mRNA respond only
transiently (t < 10 hours) to changes in Erk MAP kinase signaling, whereas Brf1 mRNA
maintains a sustained response to the level of Erk MAP kinase signaling.
Protein level changes were also rapid, with a 30% reduction in TTP and a 50%
reduction in Brf1 within 1.5 hours of inhibitor treatment (Figure 3.2.C and 3.3.C).
However, whereas Brf1 protein levels continued to fall for the remainder of the time
course, reaching 10-fold less protein by 30 hours, TTP protein levels recovered and
increased above DMSO treated controls (Figure 3.2.C). These data indicate that the
regulation of TTP protein becomes distinct from the regulation of TTP mRNA at later
times (compare Figure 3.2.B and 3.2.C). We note that in other cellular contexts, direct
phosphorylation of TTP protein by Erk1/2 has been shown to reduce its stability (75).
Furthermore, Zfp36 AUBPs also contain AU-rich sequences in their own mRNAs, which
enable direct auto- and cross-regulation (Figure 3.3.D). These mechanisms could explain
why TTP protein and mRNA levels respond differently after prolonged MEK1/2
inhibition. In contrast, Brf2 protein levels were much less affected, dropping slightly at
10 hours, and then recovering at later time points. Thus, at both the mRNA and protein
levels, Brf2 responds more weakly to these perturbations (Figure 3.2.C). These results
indicate that AUBP levels respond to changes in Erk MAP kinase signaling with different
kinetics.

38
To further validate these findings, we checked whether upregulating FGF
signaling could produce opposite results to inhibition. We added FGF4/Heparin to fgf4-
/- R1 mESCs (strain FD6), in order to activate Erk MAP kinase signaling (Figure 3.2.D)
(79). TTP, Brf1 and Brf2 mRNA levels increased within 5 hours of ligand addition, with
similar changes at the protein level (Figure 3.2.E and 3.2.F). These changes occurred
specifically within the cytoplasmic compartment, consistent with a role for these AUBPs
in regulating targeted degradation of mature mRNAs (Figure 3.2.F). Together, these
results indicate Zfp36 protein expression responds rapidly to both increases and
decreases in FGF/Erk MAP kinase signaling activity, leading to both transient (TTP, Brf2)
and sustained (Brf1) regulatory responses.
Among the Zfp36 AUBPs, FGF/Erk MAP kinase signaling most strongly regulated
the expression of Brf1 in pluripotent conditions (Figure 3.2). During differentiation, Brf1
expression is similarly dynamic, and continued to be regulated by FGF/Erk MAP kinase
signaling (Figure 3.4.A). The 2-fold reduction in Brf1 expression over 4 days of LIF
withdrawal (Figure 3.4.A) tracked concomitant changes in FGF4 expression (Figure
3.4.B), and the downregulation of the Erk MAP kinase target genes Spred2 and Spry2
(Figure 3.4.B). Could Brf1 mechanistically link FGF/Erk MAP kinase signaling to the post-
transcriptional regulation of Nanog mRNA?
39
Figures
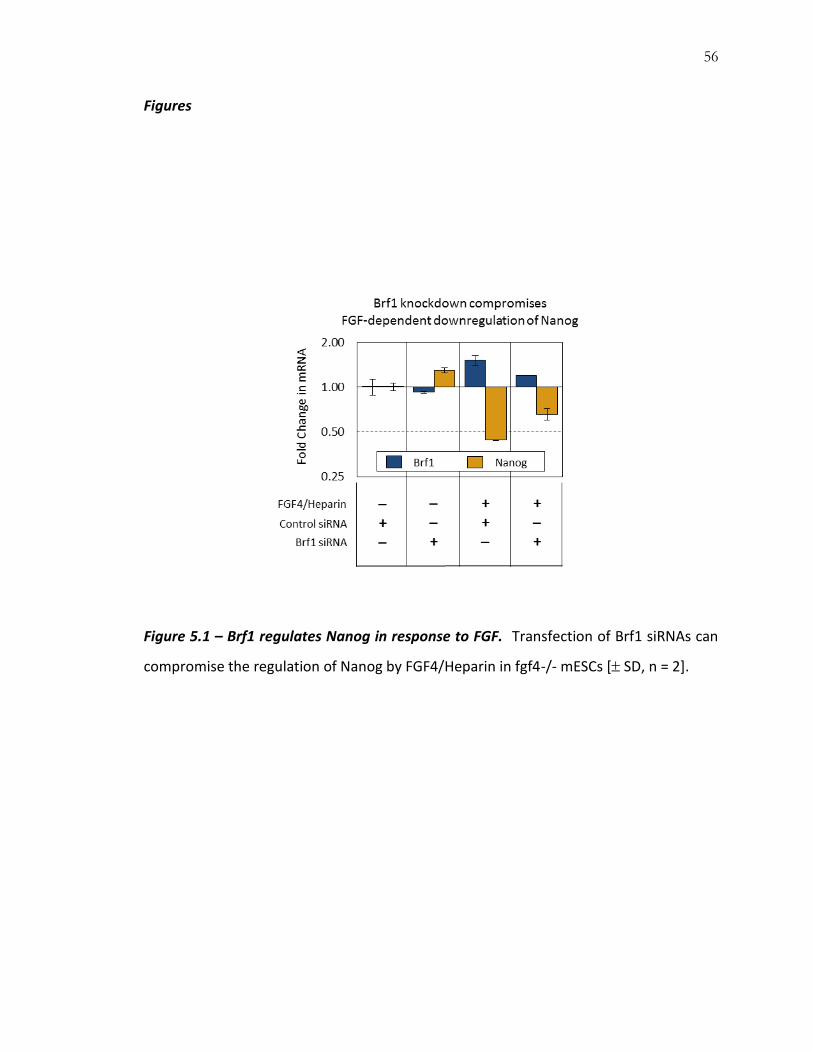
Figure 3.1 – Erk MAP kinase signaling regulates AUBP expression in mESCs. (A)
Distribution of average transcript abundances (FPKM) from two total RNA biological
replicates. Highlighted are notable mESC pluripotency and differentiation genes (gray
triangles), which were used to distinguish actively expressed genes (mean FPKM ≥ 5,
7,194 genes) from the gene expression background (mean FPKM < 5, 11,119 genes).
FPKM = 5 denoted by red dashed line. Well-characterized and actively expressed AUPBs
are highlighted (orange triangles). (B) Profiling changes in AUBP expression using RT-
qPCR in response to a pharmacological inhibitor of MEK1/2 (CI-1040/PD184352) after 5
and 10 hours.

40
Figure 3.2 - FGF/Erk regulates the expression of Zfp36 RNA-binding proteins. (A)
Cartoon depicting the potential relationship between FGF/Erk MAP kinase signaling and
AUBP expression. Whereas the addition of Fgf4/Heparin activates the FGF/Erk MAP
kinase pathway, culturing cells with 5 uM PD184352/CI-1040 inhibits Erk1/2 activation.
(B) A 30 hour RT-qPCR time course of TTP, Brf1, and Brf2 mRNA level changes in
response to MEK1/2 pharmacological inhibitors [ SEM; n=3 for all time points], and (C)
corresponding Western blots. (D) Western blot staining for Erk1/2 and phospho-Erk1/2
(Thr202/Tyr204) showing pathway activation in cells stimulated with 10ng/ml FGF4 +
10ug/ml Heparin for 15 minutes. (E) Changes in TTP, Brf1 and Brf2 after 5 hour

41
incubation with or without FGF4/Heparin as indicated [ SEM; n = 3]. (F) Western blot
profiling of changes in TTP, Brf1 and Brf2 protein level in fgf4-/- mESCs after stimulation
with FGF4/Heparin for 5 hours. To compare changes in intracellular localization,
proteins were harvested sequentially as cytoplasmic [cyto] or nuclear [nuc] fractions,
with -tubulin and TATA binding protein serving as localization controls.

42
Figure 3.3 – Rapid changes in Zfp36 expression at the mRNA and protein level. (A) A
2.5 hour qRT-PCR time course of TTP, Brf1, and Brf2 mRNA level changes in response to
MEK1/2 pharmacological inhibitors [ SEM; n=3 for t ≤ 2hrs; n=2 for t = 2.5hrs]. (B)
Pharmacological inhibition of MEK1/2 with 5 uM PD184352/CI-1040 inhibits Erk1/2
activation for >24 hours. (C) Representative Western blots of TTP, Brf1 and Brf2 protein
levels for a 2.5 hour time course. (D) Zfp36 AUBPs contain AREs within their own 3’UTRs,
and have the capacity to directly auto- and cross-regulate their own expression. siRNA
knockdown of individual Zfp36 AUBPs (10nM final siRNA concentration) leads to
corresponding protein level changes in the remaining Zfp36 AUBPs. Protein levels were
assayed 36 hours after siRNA transfection by Western blot.

43
Figure 3.4 – Brf1 tracks changes in FGF/Erk during differentiation. (A) Changes in Brf1
expression after LIF removal (blue line; light blue bounding boxes at each time point
represent SEM, n = 3), and its dependence on FGF or Erk MAP kinase signaling (white
and black boxes, 3 hour inhibitor treatment) [ SEM, n = 3]. (B) Changes in FGF4, FGF5,
FGFR1, Spred2 and Spry2 after LIF removal [ SD, n = 2].

44
Chapter 4
Brf1 binds many pluripotency associated genes in vitro.
(This chapter was adapted, in part, from (57))
Introduction
Several AUBP families exist and have the capacity to bind numerous mRNA
targets. AUBPs interact with mRNAs via a core (-UUAUUUAUU-) motif located in the
3’UTR (80). This sequence is common, and can be found in the 3’UTR of 6% of mouse
protein coding genes (Table 4.1). However, depending on the local sequence context
surrounding the binding site, variation in this minimal motif could exist, to increase or
decrease the association of AUBPs with target mRNAs. Previous work has already shown
the existence of non-canonical AREs that mediate AUBP binding and regulation (81). The
sequence determinants that permit regulation of target mRNAs have not been fully
characterized.
Transcriptome-wide identification of Brf1 targets has not been undertaken in any
developmental or cellular system. To better understand the functional and
developmental significance of Brf1 in mESCs, and to further characterize its mechanistic
connection to Nanog, we performed a number of different immunoprecipitation studies
which assayed for direct protein-to-RNA binding.
Materials and Methods
RNA immunoprecipitation sequencing (RIPseq) Procedure and Analysis

45
To identify Brf1 mRNA targets, we conducted RNA immunoprecipitation
sequencing (RIPseq) (Figure 4.1.A). Briefly, cytoplasmic extract from approximately
1x10⁷ E14 mESCs was distributed equally among 2 samples and 2 controls. For sample
reactions, 5ug of anti-Brf1/2 antibody was used for 50ul of magnetic protein A/G beads.
For control reactions, 5ug of rabbit IgG with no immunoreactivity was used for 50ul of
magnetic protein A/G beads. After stringency washes and proteinase K digestion, RNA
was isolated using Qiazol reagent.
RIP-purified RNAs and total RNA from E14 mESCs were prepared for sequencing
using a TruSeq RNA Sample Prep kit. RNAs were fragmented to generate lengths of
approximately 200 nucleotides, reverse transcribed with random hexameric primers to
generate double stranded DNA, blunted, adenylated and ligated to Illumina sequencing
adapters (150bp). DNA fragments were gel separated and all fragments running at
350bp were extracted and amplified. Amplified DNA fragments were then sequenced
using an Illumina HiSeq2000.
Raw sequencing reads were trimmed (of 13nts from 5’ end) prior to Bowtie
mapping using a mouse transcript annotation containing only protein coding genes
(18,313 genes), derived from the NCBI37/mm9 genome build. Mapping statistics were
generated using eXpress (82). For enrichment analysis, fragments per kilobase exon per
million mapped reads (FPKM) were used as a measure of transcript abundance (83).
We computed a statistic ( ) that represents the degree to which the
abundance of the transcript is enriched by antibody mediated RIP. This statistic uses
differences in a transcript’s abundance after Brf1/2 antibody RIP (mean FPKMBRF,n )

46
compared to rabbit IgG RIP (mean FPKMIgG,n), normalized by their initial abundance in
total RNA before RIP (mean FPKMTotal,n ). This difference was further normalized by a
penalty factor ( ), which accounts for a transcript’s tendency to be non-specifically
purified, and is thus a saturating function of transcript abundance in the IgG control
experiment:
Where,
( )
Although captures the level of non-specific association of a transcript with
assay components (i.e., protein A/G beads, rabbit IgG, etc.), non-specific association of
transcripts with immunoprecipitated RBP/RNA complexes could not be independently
quantified, and could contribute a background to these values.
AUBP Pull-down Assay

47
To isolate AUBPs from cytoplasmic extracts in vitro, IL-2 and Nanog RNAs were
produced in vitro using T7 Ampliscribe (Epicentre Technologies). These RNAs were then
hybridized to biotin-DNA oligonucleotides at their 3’ end. 200 pmoles of IL-2 or Nanog
RNA was used for 250 pmoles of biotin-DNA oligonucleotide. Hybridization reactions
were added to 1mg streptavidin magnetic agarose beads (New England Biolabs). Crude
cytoplasmic extracts used for protein pull down assays were obtained using NE-PER
reagents (Thermo Scientific). RNA/DNA-bead conjugates were incubated in crude
cytoplasmic extract for 1hr at 4°C, washed 5x with Binding Buffer [20mM Tris-HCl pH
7.5, 50mM KCl, 1mM EDTA, 1mM DTT, 0.5% Triton-X 100 with RNAse inhibitors] and
incubated in High Salt Elution Buffer [Binding Buffer + 1M NaCl] to collect RNA-bound
protein fractions. Protein pull downs were analyzed via Western blot.
Full description of high-throughput sequencing datasets can be found in (57).
Results and Discussion
We computed a statistic, denoted ERIP for each actively expressed transcript
purified via RIPseq. ERIP represents the amount of mRNA co-precipitated with Brf1
protein over non-specific background levels. Genes with high ERIP values were more
likely to have AREs in their 3’UTR (Figure 4.1.B). For example, considering the transcripts
most enriched by Brf1 immunoprecipitation (positive outliers, ERIP > 1.226, 418 genes),
25.1% contained the minimal full consensus ARE and 60.0% contained the minimal
partial consensus ARE. These percentages represent a 3 to 4-fold increase in ARE
abundance relative to their frequency among all protein coding genes (Figure 4.1.B).

48
Moreover, several of the most highly enriched target genes were previously
characterized as direct targets of Zfp36 proteins (e.g., Ier3, Mllt11 and Pim3), including
Zfp36 proteins themselves (84, 85). Interestingly, based on our definition of the minimal
ARE element, many highly enriched target genes do not contain consensus AREs.
However, the existence of non-canonical (though still poorly characterized) AU-rich
sequences has been documented, and could explain the enrichment of these mRNAs
(81). Thus, the RIPseq assay can selectively enrich for mRNAs containing AU-rich
elements.
Several pluripotency-associated factors were detected in the Brf1-RIP fraction,
potentially explaining the developmental effects of Brf1 overexpression. For example,
the core pluripotency regulators Nanog (ERIP = 0.58) and Klf2 (ERIP = 7.15) were both
enriched, and were within the top quartile of enriched targets. Nanog broadly inhibits
mESC differentiation, and its expression is reduced as cells lose pluripotency and
commit to extra-embryonic and somatic cell lineages in culture (53, 86). Klf2, along with
Klf4 and Klf5, inhibits mesendoderm differentiation. Knockdown of Klf factors up-
regulates primitive streak markers, as well as Cdx2, a gene expressed in trophectoderm
and extra-embryonic mesoderm (87). Also consistent with a role for Brf1 in promoting
mesendoderm, the pluripotency factors Kdm4c (ERIP = 0.63) and Zfp143 (ERIP = 0.99)
were enriched in the RIPseq assay. Knockdown of the lysine methyl-transferase Kdm4c
is known to upregulate mesendoderm and extra-embryonic mesoderm markers (88).
Zfp143 coordinates with Oct4 to transcriptionally activate Nanog. siRNA knockdown of
Zfp143 rapidly initiates differentiation and promotes the expression of Fgf5, Cdx2 and

49
Cdh3, which are expressed in trophectoderm and cells that commit to extra-embryonic
mesoderm (89). Understanding the regulation of these mRNAs may provide mechanistic
insights into the Brf1-dependent control of gene expression, as well as its
developmental effects in mESCs.
To corroborate these RIPseq results, we assayed for direct binding of Brf1 to an
enriched mRNA, in this case, Nanog (Figure 4.2.A). Previous work has shown that Nanog
is strongly regulated by FGF/Erk MAP kinase signaling (36), and these effects are
mediated, in part, by direct regulation of the Nanog promoter (59). Post-transcriptional
regulation by Brf1 would provide an alternative mechanism to repress Nanog
expression.
We conducted an AUBP pull-down assay using RNA as bait (Figure 4.2.B, left).
Wild-type RNA and variants with ARE sequence mutations were expressed in vitro and
hybridized at their 3’ ends to DNA oligonucleotides coupled to magnetic microbeads.
These RNA-microbead conjugates were then incubated with crude cytoplasmic protein
extracts, and all proteins capable of binding hybridized RNAs were magnetically isolated
and purified for further analysis.
We used the 3’UTR sequence of IL-2 as a positive control, since it contains
clusters of ARE sequences that are bound and regulated by Zfp36 AUBPs (90). Western
blots showed that Brf1 could be purified from mESC lysates using a conjugated wild-type
IL-2 sequence, but not using a mutant IL-2 lacking known AREs (Figure 4.2.B, right). Two
Brf1 bands of different sizes were detected, possibly indicating the purification of
different post-translationally modified forms of Brf1.
50
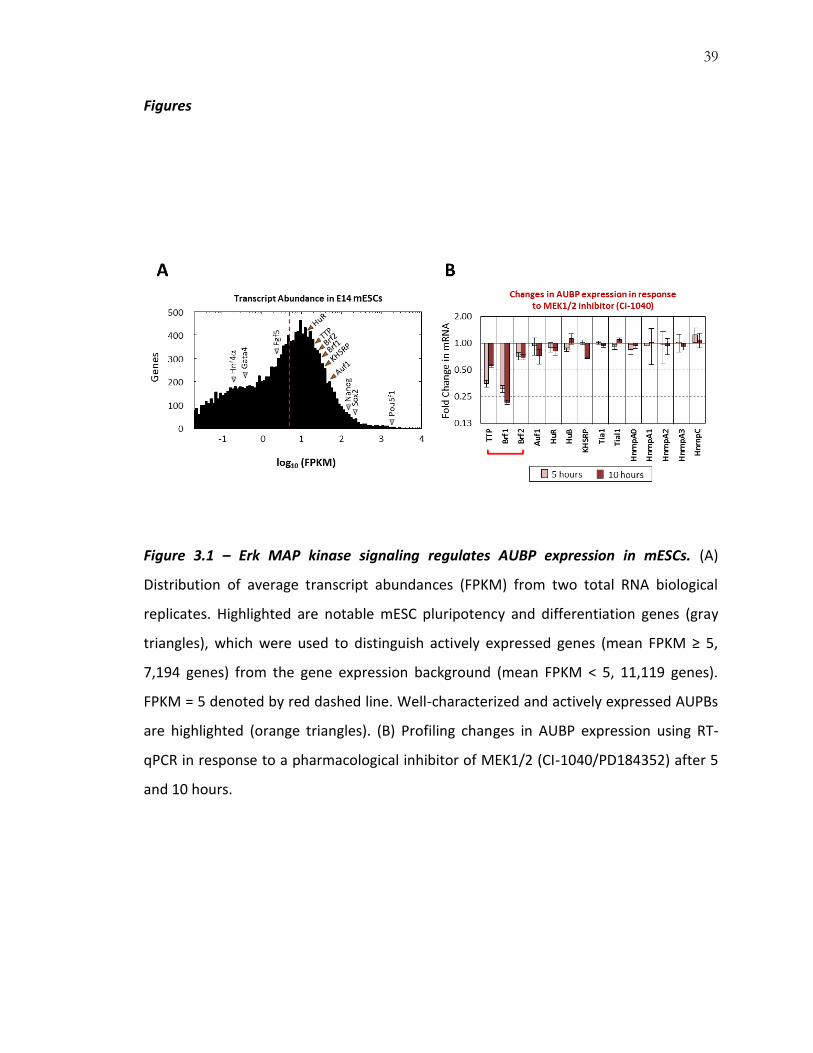
We next repeated the assay using Nanog mRNA as bait. The 3’UTR of Nanog
mRNA is approximately 1kb, and contains three potential ARE elements: one full
consensus (Site 1 in Figure 4.2.A) and two partial non-consensus sequences (Sites 2 and
3 in Figure 4.2.A). Western blotting of these protein pull-downs indicated that Brf1
bound to wild-type Nanog mRNA (Figure 4.2.B, right). Mutating the full-consensus ARE
(Site 1) significantly reduced Brf1 binding. Removing the remaining two partial non-
consensus AREs (Sites 2 and 3) did not appear to further reduce the Brf1 signal. In
contrast, the presence or absence of AREs did not affect the binding of other RNA
binding proteins. For example, addition of an androgen receptor 3’UTR sequence, which
contains a poly(C) RNA binding protein 1 (PCBP1) site, to Nanog mRNA permitted
isolation of PCBP1 protein (Figure 4.2.C). This binding was not affected by the presence
or absence of Nanog’s AREs. In contrast, a Nanog mRNA containing only a 120
nucleotide polyA without a PCBP1 site did not bind PCBP1 protein. Together, these
results confirm that Brf1 binds specifically to Nanog mRNA in an ARE-dependent
manner.
Regulation of these mRNA targets indicates that changes in Brf1 expression have
the potential to broadly affect the pluripotency transcription factor network to influence
the biology and behavior of mESCs.

51
Tables
Motif % of Annotation Consensus
-ATTTATTTATTTATTTATTTA- 0.08% Full
-ATTTATTTATTTATTTA- 0.2% Full
-ATTTATTTATTTA- 0.5% Full
-ATTTATTTA- 4.5% Full
-TTATTTATT- 6.0% Full (minimal)
-TATTTAT- 22.8% Partial (minimal)
-CTATTTATT- 2.2% Partial
-TTATTTATC- 1.0% Partial
-CTATTTATC- 0.5% Partial
Table 4.1 – Frequency of ARE motifs among mouse protein coding genes.

52
Figures
Figure 4.1 – Brf1 binds other pluripotency-associated mRNAs. (A) Method used for
RNA-RBP immunoprecipitation and RNA sequencing (RIPseq). Sequencing statistics for
two total RNA samples, two Brf1/2 antibody RIP derived samples and two rabbit IgG RIP
controls are presented. (B) Distribution of ERIP values for actively expressed genes (n =
7,194 genes). The location of several notable pluripotency associated transcripts is
highlighted. Box Plot Statistics: median (red line, ERIP = 0.17), lower quartile boundary
(ERIP = -0.04), upper quartile boundary (ERIP = 0.47) and statistical outliers (median ±
1.5 × [upper quartile – lower quartile]). Table: Frequency of full ARE motifs (-
UUAUUUAUU-) and partial ARE motifs (-UAUUUAU-) among genes classified as ERIP
outliers or in different ERIP quartiles.

53
Figure 4.2 – Nanog is bound and regulated by Brf1. (A) Cartoon illustration of IL-2 and
Nanog mRNA indicating the relative location and sequence of AU-rich elements in the
3’UTR. ARE mutants were generated by changing the core (-ATTTA-) motif to (-AGGGA-).
(B) Left: Schematic diagram of the assay used to extract RBPs from crude protein
extracts. Beads are conjugated to mRNAs with or without AU-rich elements. Right:
Western blot for Brf1 protein, present in IL-2 and Nanog mRNA protein isolates. ARE site
mutations reduced the extraction of Brf1 from crude protein lysates for both IL-2
sequence control and Nanog mRNA. (C) A Western blot for poly(C) RNA binding protein
1 (PCBP1) was performed as an RBP recovery control. We appended a 3’UTR sequence
from the androgen receptor (AR) gene which is known to bind PCBP1 (site underlined)
to the 3’ end of wild-type and ARE mutant versions of Nanog (cartoon, top). We show
that the presence or absence of ARE sequences does not inhibit the binding of PCBP1 to
its target sequence. Moreover, the absence of the AR derived 3’UTR sequence prevents
association with PCBP1 (as assayed using a polyA sequence of 120 nucleotides).

54
Chapter 5
Brf1 post-transcriptionally regulates Nanog in response to FGF/Erk MAP kinase.
(This chapter was adapted, in part, from (57))
Introduction
We showed that FGF/Erk MAP kinase signaling strongly regulates the expression
of Brf1, and that Brf1 binds Nanog mRNA in vitro. However, it remains unclear whether
FGF signaling uses Brf1 to regulate Nanog mRNA expression. Although we have shown
that post-transcriptional regulation of Nanog mRNA is ARE dependent, FGF could
regulate Nanog mRNA stability through other uncharacterized AUBPs. To test whether
Brf1 mediates FGF/Erk MAP kinase signaling-dependent regulation, we conducted an
epistasis assay.
Materials and Methods
Mock or Brf1 siRNAs were transfected into fgf4-/- R1 mESCs. After 36 hours,
changes in Brf1 or Nanog mRNA level, in the presence or absence of FGF4/Heparin,
were measured using qRT-PCR.
Results and Discussion
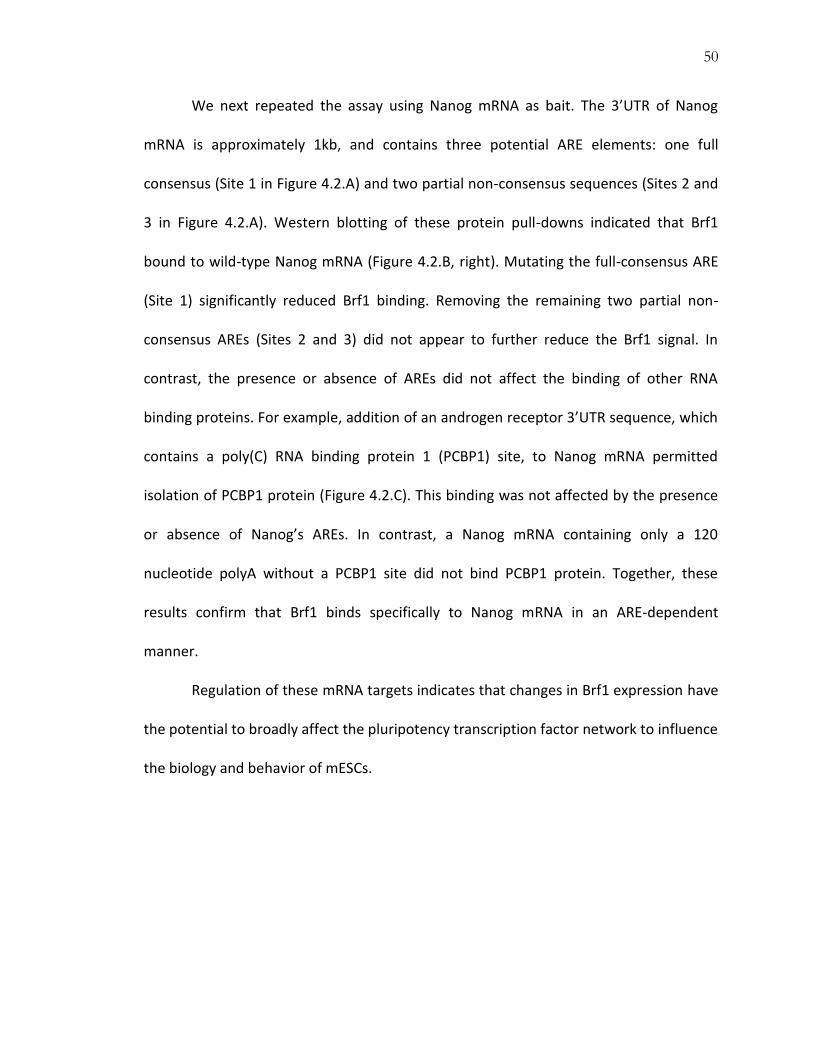
Relative to siRNA control (Figure 5.1, first column), Brf1 siRNAs caused a slight
(10%) downregulation of Brf1 and a corresponding increase in Nanog mRNA levels in
fgf4-/- R1 mESCs (Figure 5.1, second column). These data indicate that Brf1 is expressed,
albeit at a lower level, even when FGF signaling is absent (Figure 5.2) and that

55
alternative pathways support its basal expression. However, FGF signaling remains the
dominant regulator of Erk MAP kinase in mESCs (Figure 5.2), and Erk MAP kinase
appears to be the main driver of Brf1 expression (Figure 5.1).
Addition of FGF4/Heparin ligand increased Brf1 and decreased Nanog by greater
than 2-fold within 5 hours (Figure 5.1, third column). In agreement with its role as a
regulatory intermediate, the presence of Brf1 siRNAs reduced this regulation, yielding a
smaller upregulation of Brf1 and a smaller downregulation of Nanog (Figure 5.1). We
note that the inability of Brf1 siRNAs to fully block the downregulation of Nanog can be
partly explained by limited knockdown efficiency, but could also reflect Brf1-
independent regulatory mechanisms. In the absence of a more stringent test of epistasis
(i.e. zfp36l1-/- mESCs), these data are sufficient to demonstrate Brf1’s role as a
regulatory intermediate of the FGF signaling pathway.
56
Figures
Figure 5.1 – Brf1 regulates Nanog in response to FGF. Transfection of Brf1 siRNAs can
compromise the regulation of Nanog by FGF4/Heparin in fgf4-/- mESCs [ SD, n = 2].

57
Figure 5.2 – Brf1 is strongly regulated by FGF/Erk MAP kinase signaling. Shown are
relative differences in Brf1 expression level among different cell types and cell culture
conditions, as specified.

58
Chapter 6
Changes in Brf1 expression affect mouse ESC self-renewal and developmental
potential.
(This chapter was adapted, in part, from (57))
Introduction
FGF/Erk MAP kinase signaling destabilizes the expression of pluripotency factors,
and is required for mESC differentiation. Our RIPseq data connects Brf1 to the
regulation of numerous pluripotency factors. As a mediator of FGF/Erk MAP kinase
signaling, changes in Brf1 expression may strongly regulate self-renewal, pluripotency or
differentiation responses.
Materials and Methods
To determine the functional effect of Brf1 expression on pluripotent and
differentiating cells, we perturbed Brf1 expression using siRNAs, which produced a 4-
fold decrease in Brf1 protein relative to wild-type. We also created stable transgene-
mediated overexpression cell lines, which increased Brf1 protein levels 4-fold above
wild-type levels (Figure 6.1.A). For transgene expression in mESCs, clones expressing
H2B-YFP (Brf11x) or Brf1-T2A-H2B-YFP (Brf14x) were derived for these studies. Of these,
one control Brf11x clone that expressed wild-type levels of Brf1 protein, and one Brf14x
clone expressing 4-fold more Brf1 protein, was chosen for further analysis.
Results and Discussion
59
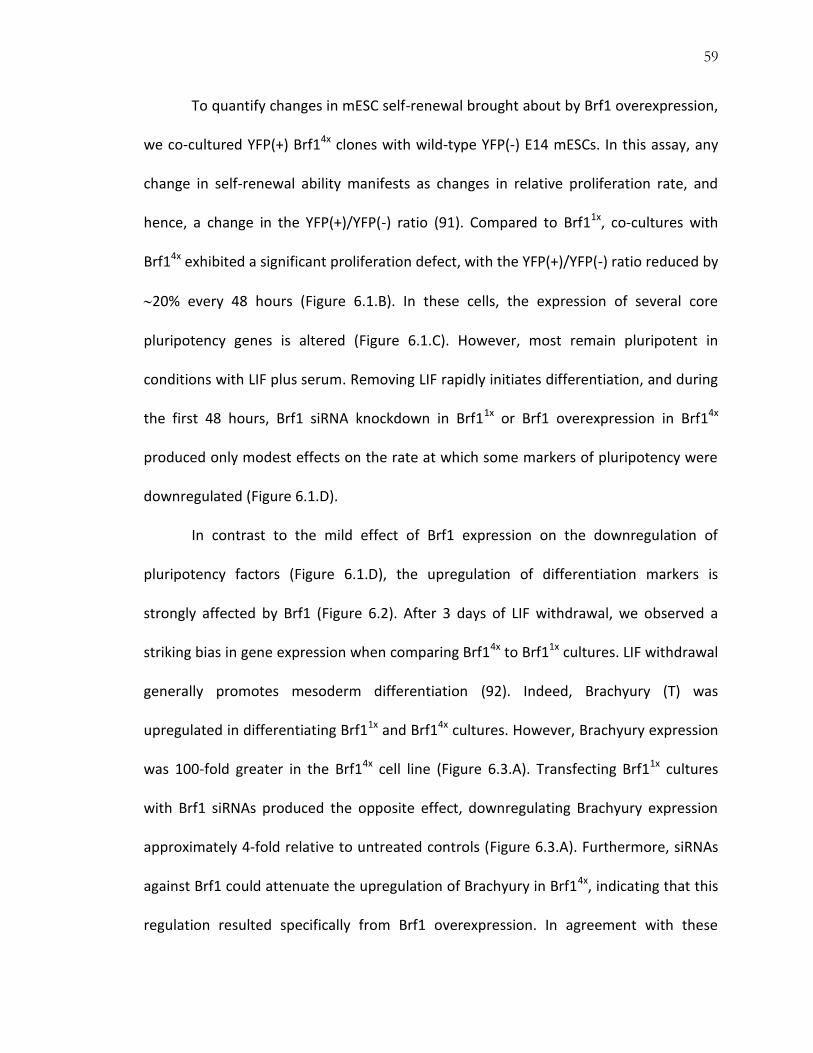
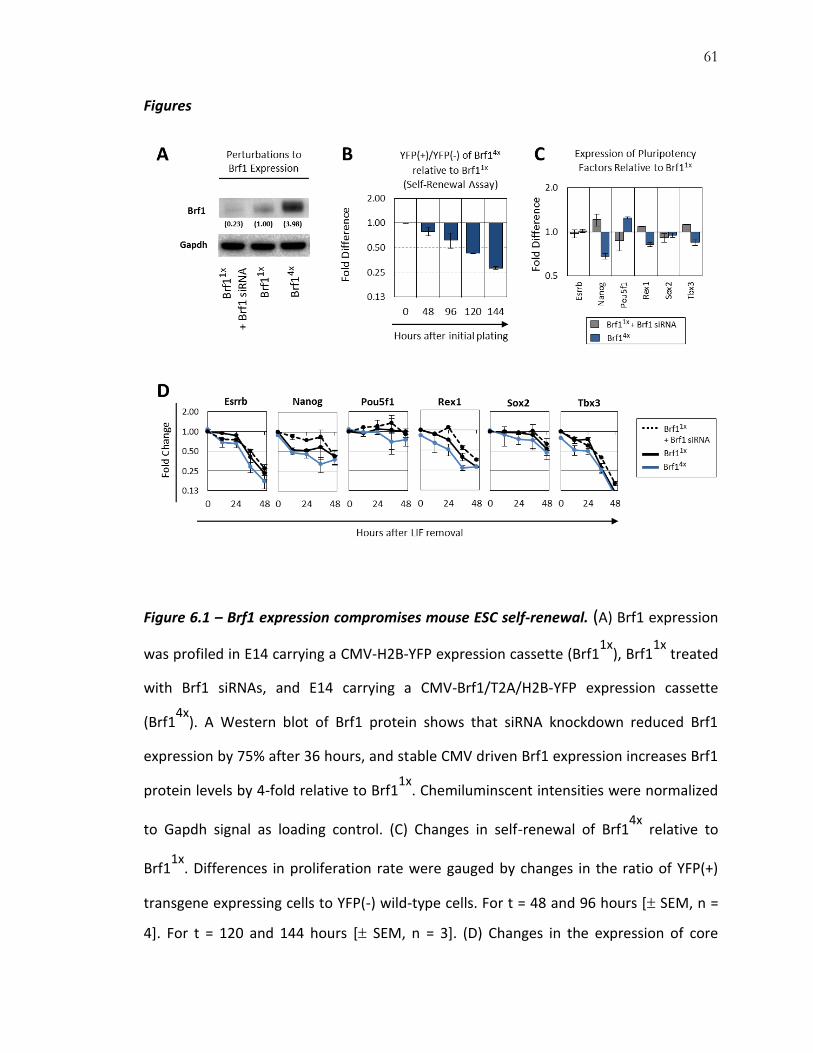
To quantify changes in mESC self-renewal brought about by Brf1 overexpression,
we co-cultured YFP(+) Brf14x clones with wild-type YFP(-) E14 mESCs. In this assay, any
change in self-renewal ability manifests as changes in relative proliferation rate, and
hence, a change in the YFP(+)/YFP(-) ratio (91). Compared to Brf11x, co-cultures with
Brf14x exhibited a significant proliferation defect, with the YFP(+)/YFP(-) ratio reduced by
20% every 48 hours (Figure 6.1.B). In these cells, the expression of several core
pluripotency genes is altered (Figure 6.1.C). However, most remain pluripotent in
conditions with LIF plus serum. Removing LIF rapidly initiates differentiation, and during
the first 48 hours, Brf1 siRNA knockdown in Brf11x or Brf1 overexpression in Brf14x
produced only modest effects on the rate at which some markers of pluripotency were
downregulated (Figure 6.1.D).
In contrast to the mild effect of Brf1 expression on the downregulation of
pluripotency factors (Figure 6.1.D), the upregulation of differentiation markers is
strongly affected by Brf1 (Figure 6.2). After 3 days of LIF withdrawal, we observed a
striking bias in gene expression when comparing Brf14x to Brf11x cultures. LIF withdrawal
generally promotes mesoderm differentiation (92). Indeed, Brachyury (T) was
upregulated in differentiating Brf11x and Brf14x cultures. However, Brachyury expression
was 100-fold greater in the Brf14x cell line (Figure 6.3.A). Transfecting Brf11x cultures
with Brf1 siRNAs produced the opposite effect, downregulating Brachyury expression
approximately 4-fold relative to untreated controls (Figure 6.3.A). Furthermore, siRNAs
against Brf1 could attenuate the upregulation of Brachyury in Brf14x, indicating that this
regulation resulted specifically from Brf1 overexpression. In agreement with these

60
results, flow cytometry profiling indicated that a larger fraction of Brf14x cells expressed
Brachyury protein by 84 hours compared to Brf11x (Figure 6.3.C). These findings were
further supported by the upregulation of mesendodermal markers Goosecoid (Gsc),
Mixl1, and Wnt3A (Figure 6.3.A), indicating that Brf1 accelerated commitment to
mesendodermal fates. Ectoderm markers (Nodal, Fgf5 and Gbx) were not affected,
whereas extra-embryonic and definitive endoderm markers (Gata6, Hnf4a and FoxA2)
showed weaker basal expression levels that responded differentially to Brf1 (Figure
6.3.A).
Brf1 expression did not influence neural differentiation. Because serum inhibits
neural differentiation (32), we cultured cells in N2B27 serum-free media without LIF and
BMP4. After 3 days in this media, most markers of differentiation appeared to be
unaffected by Brf1 (Figure 6.3.B). For example, Sox1 mRNA and protein was readily
detected, but its expression levels were similar in Brf11x and Brf14x cultures (Figure 6.3.B
and 6.3.C). Interestingly, even in N2B27, the basal expression of Brachyury was
upregulated in a Brf1-dependent manner. Thus, Brf1 appears to mainly affect
mesendodermal differentiation pathways.
61
Figures
Figure 6.1 – Brf1 expression compromises mouse ESC self-renewal. (A) Brf1 expression
was profiled in E14 carrying a CMV-H2B-YFP expression cassette (Brf11x
), Brf11x
treated
with Brf1 siRNAs, and E14 carrying a CMV-Brf1/T2A/H2B-YFP expression cassette
(Brf14x
). A Western blot of Brf1 protein shows that siRNA knockdown reduced Brf1
expression by 75% after 36 hours, and stable CMV driven Brf1 expression increases Brf1
protein levels by 4-fold relative to Brf11x
. Chemiluminscent intensities were normalized
to Gapdh signal as loading control. (C) Changes in self-renewal of Brf14x
relative to
Brf11x
. Differences in proliferation rate were gauged by changes in the ratio of YFP(+)
transgene expressing cells to YFP(-) wild-type cells. For t = 48 and 96 hours [ SEM, n =
4]. For t = 120 and 144 hours [ SEM, n = 3]. (D) Changes in the expression of core

62
pluripotency genes via RT-qPCR after Brf1 siRNA knockdown in Brf11x
(gray bars) or
enhanced Brf1 expression in Brf14x
(blue bars) over 36 hours [ SEM, n = 2]. (F) Profiling
changes in the expression of core pluripotency genes via RT-qPCR during the early
stages of differentiation (15% Serum, without LIF) in Brf11x
treated with Brf1 siRNAs
(dashed black line), Brf11x
(solid black line) and Brf14x
(solid blue line) [ SEM, n = 2].

63
Figure 6.2 – Developmental potential of mouse ESCs.

64
Figure 6.3 – Brf1 expression promotes mesendoderm differentiation. (A) Brf11x and
Brf14x were cultured in mesoderm differentiation media (15% Serum without LIF) for 3
days. Fold difference in the expression of several lineage specific differentiation markers
in Brf14x relative to Brf11x after 3 days of differentiation [ SEM, n = 3]. (B) Brf11x and
Brf14x were cultured in neuroectoderm differentiation media (N2B27) for 3 days. Fold
difference in the expression of several lineage specific differentiation markers in CMV-
Brf1 E14 relative to Control E14 after 3 days of differentiation [ SEM, n = 3]. (C) (Right)
Brachyury immunostain and associated flow cytometry data after 3.5 days of
differentiation (n = 2000 cells). (Left) Sox1 immunostain and associated flow cytometry
data after 5 days of differentiation (n = 1500 cells).

65
Concluding Remarks
AUBPs are critical regulators of developmental gene expression which respond
to inter- and intracellular signals. Some specific examples of this regulation include the
repression of Notch1 in response to PI3K/Erk MAP kinase signals during T-cell
development (93), repression of TNFalpha in response to p38/Erk MAP kinase signals
during inflammation (94), and the stabilization of p21 in response to ATR/ATM kinase
activation after DNA damage (95). Here we demonstrate AUBPs mechanistically connect
FGF/Erk MAP kinase signaling to the regulation of pluripotency, self-renewal and
differentiation in mESCs. More specifically, control over Brf1 expression rapidly
regulates the expression of key pluripotency-associated genes, reduces the capacity to
self-renew, and enhances mesendoderm differentiation upon LIF withdrawal.
Why has Brf1 been selected for implementing FGF-dependent cellular responses
in mESCs? One possibility is that, owing to its rapid transcriptional response to FGF
signaling and its short protein and mRNA half-life (1.5 hours and 1 hour, respectively),
Brf1 is capable of tracking dynamic changes in Erk MAP kinase activity. Brf1 directly
affects mRNA abundance, and provides stem cell populations with a mechanism to
quickly respond to changes in FGF signaling, without necessarily altering underlying
transcriptional states. However, the benefit of these dynamical properties to the biology
of pluripotent or differentiating mESCs still remains unclear. Brf1 also provides a
regulation that is similar to miRNAs, which also provide mRNA-level repression while
maintaining flexibility in target selection. Interestingly, Zfp36 AUBPs and miRNAs are
known to cooperate in regulating some mRNA targets (96), indicating a potential point

66
of convergence between these two regulatory mechanisms. Future work will address
why this system is particularly well adapted to serve as a regulator in mESCs, and as a
mediator of FGF/Erk MAP kinase signaling.
Whether Brf1 plays a similar role in the embryo is unclear. We note that the
regulatory effects of Brf1 in cell culture mimic the developmental response to FGF/Erk
MAP kinase signaling at different stages of embryonic development. For example, FGF4
signaling promotes extra-embryonic endoderm differentiation in the inner cell mass
partly by destabilizing the expression of pluripotency genes (97). Brf1 may participate in
this process by repressing Nanog and other pluripotency regulators. At a slightly later
developmental stage, and one that is more relevant to mESCs, both FGF4 and FGF8 are
required for mesoderm induction (98, 99). The expression of Brachyury, a regulator of
mesoderm morphogenesis, is enhanced by FGF4 and FGF8 signaling through unknown
mechanisms (100). Our results show that Brf1 expression during differentiation in
mESCs similarly enhances Brachyury and other primitive streak markers. This regulatory
connection could explain why Brf1 knockout mice also exhibit the same gross defects in
chorio-allantoic fusion, neural tube closure and placental organization at mid-gestation
(E11) as FGFR2 knockouts, an indication of shared regulation and function (74, 101).
Although the regulation of FGF/Erk MAP kinase signaling likely differs between the
embryonic and cell culture context, these observations implicate Brf1 as an important
FGF/Erk MAP kinase-inducible regulator of development in both systems.
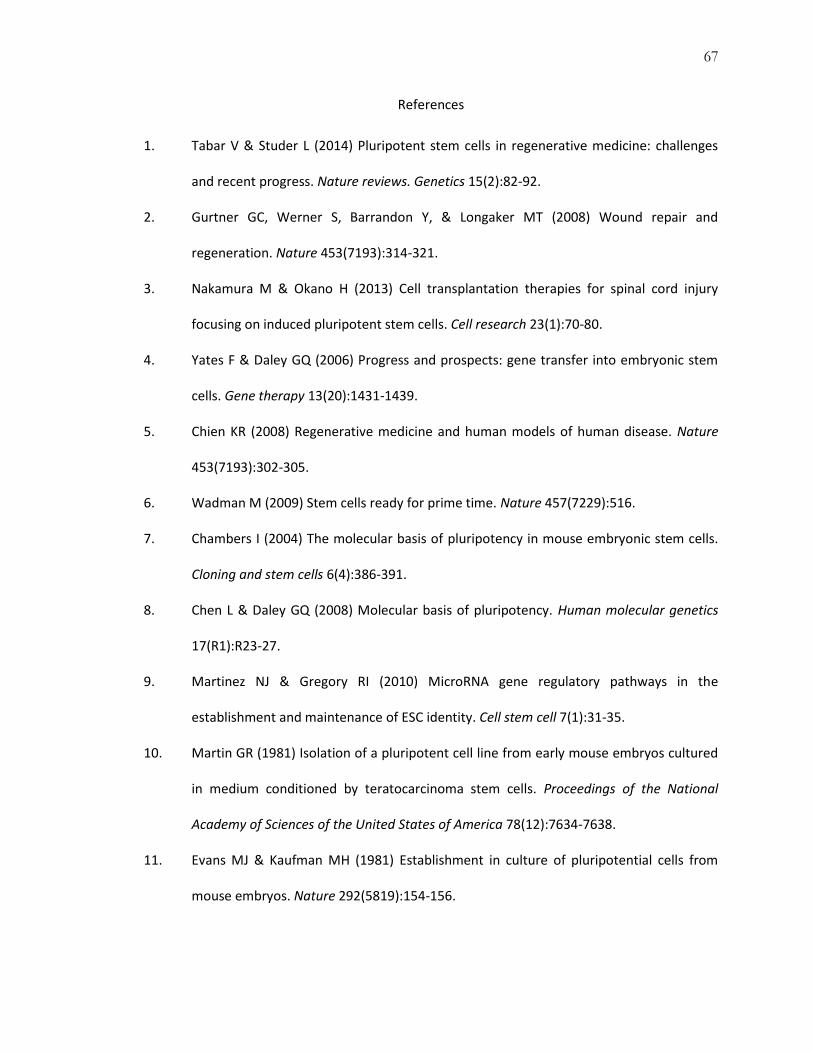
67
References
1. Tabar V & Studer L (2014) Pluripotent stem cells in regenerative medicine: challenges
and recent progress. Nature reviews. Genetics 15(2):82-92.
2. Gurtner GC, Werner S, Barrandon Y, & Longaker MT (2008) Wound repair and
regeneration. Nature 453(7193):314-321.
3. Nakamura M & Okano H (2013) Cell transplantation therapies for spinal cord injury
focusing on induced pluripotent stem cells. Cell research 23(1):70-80.
4. Yates F & Daley GQ (2006) Progress and prospects: gene transfer into embryonic stem
cells. Gene therapy 13(20):1431-1439.
5. Chien KR (2008) Regenerative medicine and human models of human disease. Nature
453(7193):302-305.
6. Wadman M (2009) Stem cells ready for prime time. Nature 457(7229):516.
7. Chambers I (2004) The molecular basis of pluripotency in mouse embryonic stem cells.
Cloning and stem cells 6(4):386-391.
8. Chen L & Daley GQ (2008) Molecular basis of pluripotency. Human molecular genetics
17(R1):R23-27.
9. Martinez NJ & Gregory RI (2010) MicroRNA gene regulatory pathways in the
establishment and maintenance of ESC identity. Cell stem cell 7(1):31-35.
10. Martin GR (1981) Isolation of a pluripotent cell line from early mouse embryos cultured
in medium conditioned by teratocarcinoma stem cells. Proceedings of the National
Academy of Sciences of the United States of America 78(12):7634-7638.
11. Evans MJ & Kaufman MH (1981) Establishment in culture of pluripotential cells from
mouse embryos. Nature 292(5819):154-156.

68
12. Thomas KR & Capecchi MR (1986) Introduction of homologous DNA sequences into
mammalian cells induces mutations in the cognate gene. Nature 324(6092):34-38.
13. Robertson E, Bradley A, Kuehn M, & Evans M (1986) Germ-line transmission of genes
introduced into cultured pluripotential cells by retroviral vector. Nature 323(6087):445-
448.
14. Smithies O, Gregg RG, Boggs SS, Koralewski MA, & Kucherlapati RS (1985) Insertion of
DNA sequences into the human chromosomal beta-globin locus by homologous
recombination. Nature 317(6034):230-234.
15. Takahashi K & Yamanaka S (2006) Induction of pluripotent stem cells from mouse
embryonic and adult fibroblast cultures by defined factors. Cell 126(4):663-676.
16. Yamanaka S (2012) Induced pluripotent stem cells: past, present, and future. Cell stem
cell 10(6):678-684.
17. Okita K & Yamanaka S (2006) Intracellular signaling pathways regulating pluripotency of
embryonic stem cells. Current stem cell research & therapy 1(1):103-111.
18. Williams RL, et al. (1988) Myeloid leukaemia inhibitory factor maintains the
developmental potential of embryonic stem cells. Nature 336(6200):684-687.
19. Smith AG, et al. (1988) Inhibition of pluripotential embryonic stem cell differentiation by
purified polypeptides. Nature 336(6200):688-690.
20. Lopes FL, Desmarais JA, & Murphy BD (2004) Embryonic diapause and its regulation.
Reproduction 128(6):669-678.
21. Dey SK, et al. (2004) Molecular cues to implantation. Endocrine reviews 25(3):341-373.
22. Bauer S & Patterson PH (2006) Leukemia inhibitory factor promotes neural stem cell
self-renewal in the adult brain. The Journal of neuroscience : the official journal of the
Society for Neuroscience 26(46):12089-12099.
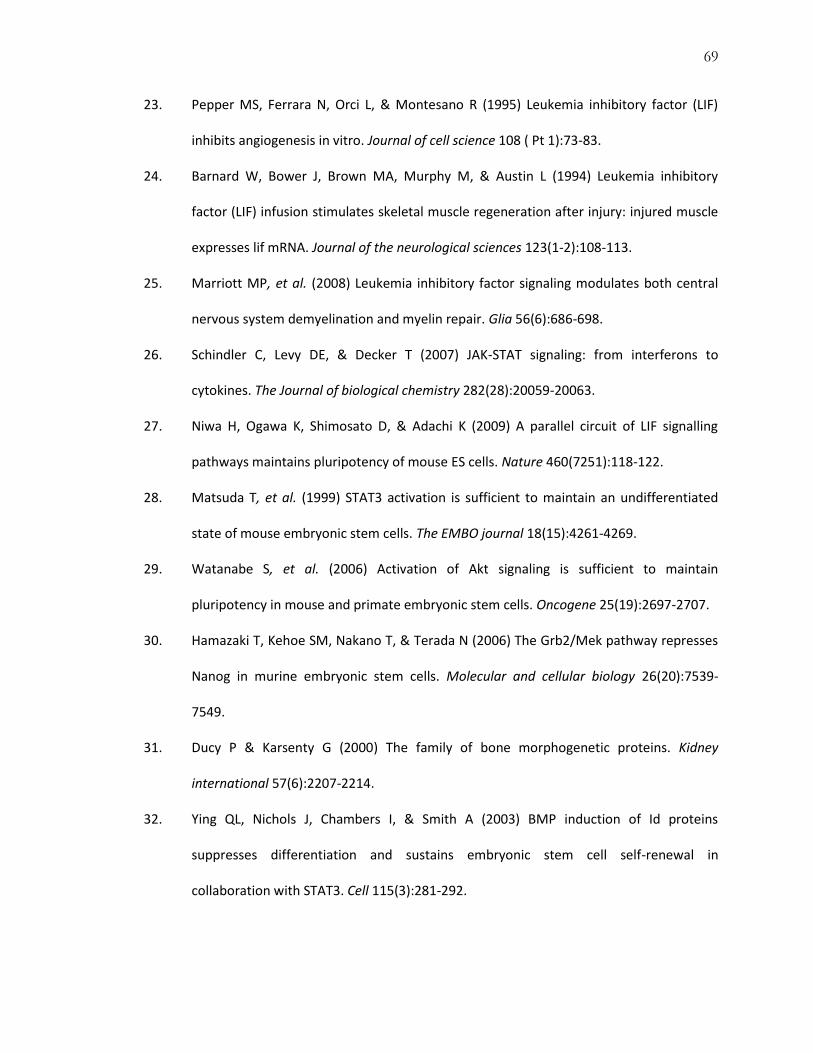
69
23. Pepper MS, Ferrara N, Orci L, & Montesano R (1995) Leukemia inhibitory factor (LIF)
inhibits angiogenesis in vitro. Journal of cell science 108 ( Pt 1):73-83.
24. Barnard W, Bower J, Brown MA, Murphy M, & Austin L (1994) Leukemia inhibitory
factor (LIF) infusion stimulates skeletal muscle regeneration after injury: injured muscle
expresses lif mRNA. Journal of the neurological sciences 123(1-2):108-113.
25. Marriott MP, et al. (2008) Leukemia inhibitory factor signaling modulates both central
nervous system demyelination and myelin repair. Glia 56(6):686-698.
26. Schindler C, Levy DE, & Decker T (2007) JAK-STAT signaling: from interferons to
cytokines. The Journal of biological chemistry 282(28):20059-20063.
27. Niwa H, Ogawa K, Shimosato D, & Adachi K (2009) A parallel circuit of LIF signalling
pathways maintains pluripotency of mouse ES cells. Nature 460(7251):118-122.
28. Matsuda T, et al. (1999) STAT3 activation is sufficient to maintain an undifferentiated
state of mouse embryonic stem cells. The EMBO journal 18(15):4261-4269.
29. Watanabe S, et al. (2006) Activation of Akt signaling is sufficient to maintain
pluripotency in mouse and primate embryonic stem cells. Oncogene 25(19):2697-2707.
30. Hamazaki T, Kehoe SM, Nakano T, & Terada N (2006) The Grb2/Mek pathway represses
Nanog in murine embryonic stem cells. Molecular and cellular biology 26(20):7539-
7549.
31. Ducy P & Karsenty G (2000) The family of bone morphogenetic proteins. Kidney
international 57(6):2207-2214.
32. Ying QL, Nichols J, Chambers I, & Smith A (2003) BMP induction of Id proteins
suppresses differentiation and sustains embryonic stem cell self-renewal in
collaboration with STAT3. Cell 115(3):281-292.

70
33. Malaguti M, et al. (2013) Bone morphogenic protein signalling suppresses
differentiation of pluripotent cells by maintaining expression of E-Cadherin. eLife
2:e01197.
34. Feldman B, Poueymirou W, Papaioannou VE, DeChiara TM, & Goldfarb M (1995)
Requirement of FGF-4 for postimplantation mouse development. Science
267(5195):246-249.
35. Arman E, Haffner-Krausz R, Chen Y, Heath JK, & Lonai P (1998) Targeted disruption of
fibroblast growth factor (FGF) receptor 2 suggests a role for FGF signaling in
pregastrulation mammalian development. Proceedings of the National Academy of
Sciences of the United States of America 95(9):5082-5087.
36. Chazaud C, Yamanaka Y, Pawson T, & Rossant J (2006) Early lineage segregation
between epiblast and primitive endoderm in mouse blastocysts through the Grb2-MAPK
pathway. Developmental cell 10(5):615-624.
37. Yamanaka Y, Lanner F, & Rossant J (2010) FGF signal-dependent segregation of primitive
endoderm and epiblast in the mouse blastocyst. Development 137(5):715-724.
38. Ying QL, et al. (2008) The ground state of embryonic stem cell self-renewal. Nature
453(7194):519-523.
39. Li Z, et al. (2012) BMP4 Signaling Acts via dual-specificity phosphatase 9 to control ERK
activity in mouse embryonic stem cells. Cell stem cell 10(2):171-182.
40. Batlle-Morera L, Smith A, & Nichols J (2008) Parameters influencing derivation of
embryonic stem cells from murine embryos. Genesis 46(12):758-767.
41. Prelle K, Vassiliev IM, Vassilieva SG, Wolf E, & Wobus AM (1999) Establishment of
pluripotent cell lines from vertebrate species--present status and future prospects. Cells,
tissues, organs 165(3-4):220-236.

71
42. Buehr M, et al. (2008) Capture of authentic embryonic stem cells from rat blastocysts.
Cell 135(7):1287-1298.
43. Nichols J & Smith A (2011) The origin and identity of embryonic stem cells. Development
138(1):3-8.
44. Dailey L, Ambrosetti D, Mansukhani A, & Basilico C (2005) Mechanisms underlying
differential responses to FGF signaling. Cytokine & growth factor reviews 16(2):233-247.
45. Widmann C, Gibson S, Jarpe MB, & Johnson GL (1999) Mitogen-activated protein kinase:
conservation of a three-kinase module from yeast to human. Physiological reviews
79(1):143-180.
46. Roskoski R, Jr. (2012) ERK1/2 MAP kinases: structure, function, and regulation.
Pharmacological research : the official journal of the Italian Pharmacological Society
66(2):105-143.
47. Burkhard KA, Chen F, & Shapiro P (2011) Quantitative analysis of ERK2 interactions with
substrate proteins: roles for kinase docking domains and activity in determining binding
affinity. The Journal of biological chemistry 286(4):2477-2485.
48. Lanner F & Rossant J (2010) The role of FGF/Erk signaling in pluripotent cells.
Development 137(20):3351-3360.
49. Kim J, Chu J, Shen X, Wang J, & Orkin SH (2008) An extended transcriptional network for
pluripotency of embryonic stem cells. Cell 132(6):1049-1061.
50. Liang J, et al. (2008) Nanog and Oct4 associate with unique transcriptional repression
complexes in embryonic stem cells. Nature cell biology 10(6):731-739.
51. Niwa H, Miyazaki J, & Smith AG (2000) Quantitative expression of Oct-3/4 defines
differentiation, dedifferentiation or self-renewal of ES cells. Nature genetics 24(4):372-
376.

72
52. Masui S, et al. (2007) Pluripotency governed by Sox2 via regulation of Oct3/4 expression
in mouse embryonic stem cells. Nature cell biology 9(6):625-635.
53. Chambers I, et al. (2003) Functional expression cloning of Nanog, a pluripotency
sustaining factor in embryonic stem cells. Cell 113(5):643-655.
54. Silva J, et al. (2009) Nanog is the gateway to the pluripotent ground state. Cell
138(4):722-737.
55. Chambers I, et al. (2007) Nanog safeguards pluripotency and mediates germline
development. Nature 450(7173):1230-1234.
56. Lee DF, et al. (2012) Combining competition assays with genetic complementation
strategies to dissect mouse embryonic stem cell self-renewal and pluripotency. Nature
protocols 7(4):729-748.
57. Tan FE & Elowitz MB (2014) Brf1 posttranscriptionally regulates pluripotency and
differentiation responses downstream of Erk MAP kinase. Proceedings of the National
Academy of Sciences of the United States of America.
58. Maherali N, et al. (2007) Directly reprogrammed fibroblasts show global epigenetic
remodeling and widespread tissue contribution. Cell stem cell 1(1):55-70.
59. Santostefano KE, Hamazaki T, Pardo CE, Kladde MP, & Terada N (2012) Fibroblast
growth factor receptor 2 homodimerization rapidly reduces transcription of the
pluripotency gene Nanog without dissociation of activating transcription factors. The
Journal of biological chemistry 287(36):30507-30517.
60. Wu da Y & Yao Z (2005) Isolation and characterization of the murine Nanog gene
promoter. Cell research 15(5):317-324.
61. Paroo Z, Ye X, Chen S, & Liu Q (2009) Phosphorylation of the human microRNA-
generating complex mediates MAPK/Erk signaling. Cell 139(1):112-122.
73
62. Melton C, Judson RL, & Blelloch R (2010) Opposing microRNA families regulate self-
renewal in mouse embryonic stem cells. Nature 463(7281):621-626.
63. Tarantino C, et al. (2010) miRNA 34a, 100, and 137 modulate differentiation of mouse
embryonic stem cells. FASEB journal : official publication of the Federation of American
Societies for Experimental Biology 24(9):3255-3263.
64. Tay Y, Zhang J, Thomson AM, Lim B, & Rigoutsos I (2008) MicroRNAs to Nanog, Oct4 and
Sox2 coding regions modulate embryonic stem cell differentiation. Nature
455(7216):1124-1128.
65. Barreau C, Paillard L, & Osborne HB (2005) AU-rich elements and associated factors: are
there unifying principles? Nucleic acids research 33(22):7138-7150.
66. Colegrove-Otero LJ, Minshall N, & Standart N (2005) RNA-binding proteins in early
development. Critical reviews in biochemistry and molecular biology 40(1):21-73.
67. Kwon SC, et al. (2013) The RNA-binding protein repertoire of embryonic stem cells.
Nature structural & molecular biology.
68. Glisovic T, Bachorik JL, Yong J, & Dreyfuss G (2008) RNA-binding proteins and post-
transcriptional gene regulation. FEBS letters 582(14):1977-1986.
69. Okano HJ & Darnell RB (1997) A hierarchy of Hu RNA binding proteins in developing and
adult neurons. The Journal of neuroscience : the official journal of the Society for
Neuroscience 17(9):3024-3037.
70. Baou M, Norton JD, & Murphy JJ (2011) AU-rich RNA binding proteins in hematopoiesis
and leukemogenesis. Blood 118(22):5732-5740.
71. Wiszniak SE, Dredge BK, & Jensen KB (2011) HuB (elavl2) mRNA is restricted to the germ
cells by post-transcriptional mechanisms including stabilisation of the message by DAZL.
PloS one 6(6):e20773.
74
72. Chi MN, et al. (2011) The RNA-binding protein ELAVL1/HuR is essential for mouse
spermatogenesis, acting both at meiotic and postmeiotic stages. Molecular biology of
the cell 22(16):2875-2885.
73. Katsanou V, et al. (2009) The RNA-binding protein Elavl1/HuR is essential for placental
branching morphogenesis and embryonic development. Molecular and cellular biology
29(10):2762-2776.
74. Stumpo DJ, et al. (2004) Chorioallantoic fusion defects and embryonic lethality resulting
from disruption of Zfp36L1, a gene encoding a CCCH tandem zinc finger protein of the
Tristetraprolin family. Molecular and cellular biology 24(14):6445-6455.
75. Bourcier C, et al. (2011) Constitutive ERK activity induces downregulation of
tristetraprolin, a major protein controlling interleukin8/CXCL8 mRNA stability in
melanoma cells. American journal of physiology. Cell physiology 301(3):C609-618.
76. Amit I, et al. (2007) A module of negative feedback regulators defines growth factor
signaling. Nature genetics 39(4):503-512.
77. Lu JY & Schneider RJ (2004) Tissue distribution of AU-rich mRNA-binding proteins
involved in regulation of mRNA decay. The Journal of biological chemistry
279(13):12974-12979.
78. Doller A, Pfeilschifter J, & Eberhardt W (2008) Signalling pathways regulating nucleo-
cytoplasmic shuttling of the mRNA-binding protein HuR. Cellular signalling 20(12):2165-
2173.
79. Wilder PJ, et al. (1997) Inactivation of the FGF-4 gene in embryonic stem cells alters the
growth and/or the survival of their early differentiated progeny. Developmental biology
192(2):614-629.

75
80. Zubiaga AM, Belasco JG, & Greenberg ME (1995) The nonamer UUAUUUAUU is the key
AU-rich sequence motif that mediates mRNA degradation. Molecular and cellular
biology 15(4):2219-2230.
81. Sarkar B, Xi Q, He C, & Schneider RJ (2003) Selective degradation of AU-rich mRNAs
promoted by the p37 AUF1 protein isoform. Molecular and cellular biology 23(18):6685-
6693.
82. Roberts A & Pachter L (2013) Streaming fragment assignment for real-time analysis of
sequencing experiments. Nature methods 10(1):71-73.
83. Trapnell C, et al. (2010) Transcript assembly and quantification by RNA-Seq reveals
unannotated transcripts and isoform switching during cell differentiation. Nature
biotechnology 28(5):511-515.
84. Lai WS, Parker JS, Grissom SF, Stumpo DJ, & Blackshear PJ (2006) Novel mRNA targets
for tristetraprolin (TTP) identified by global analysis of stabilized transcripts in TTP-
deficient fibroblasts. Molecular and cellular biology 26(24):9196-9208.
85. Tchen CR, Brook M, Saklatvala J, & Clark AR (2004) The stability of tristetraprolin mRNA
is regulated by mitogen-activated protein kinase p38 and by tristetraprolin itself. The
Journal of biological chemistry 279(31):32393-32400.
86. Mitsui K, et al. (2003) The homeoprotein Nanog is required for maintenance of
pluripotency in mouse epiblast and ES cells. Cell 113(5):631-642.
87. Jiang J, et al. (2008) A core Klf circuitry regulates self-renewal of embryonic stem cells.
Nature cell biology 10(3):353-360.
88. Loh YH, Zhang W, Chen X, George J, & Ng HH (2007) Jmjd1a and Jmjd2c histone H3 Lys 9
demethylases regulate self-renewal in embryonic stem cells. Genes & development
21(20):2545-2557.

76
89. Chen X, Fang F, Liou YC, & Ng HH (2008) Zfp143 regulates Nanog through modulation of
Oct4 binding. Stem cells 26(11):2759-2767.
90. Ogilvie RL, et al. (2005) Tristetraprolin down-regulates IL-2 gene expression through AU-
rich element-mediated mRNA decay. Journal of immunology 174(2):953-961.
91. Ivanova N, et al. (2006) Dissecting self-renewal in stem cells with RNA interference.
Nature 442(7102):533-538.
92. Nishikawa SI, Nishikawa S, Hirashima M, Matsuyoshi N, & Kodama H (1998) Progressive
lineage analysis by cell sorting and culture identifies FLK1+VE-cadherin+ cells at a
diverging point of endothelial and hemopoietic lineages. Development 125(9):1747-
1757.
93. Hodson DJ, et al. (2010) Deletion of the RNA-binding proteins ZFP36L1 and ZFP36L2
leads to perturbed thymic development and T lymphoblastic leukemia. Nature
immunology 11(8):717-724.
94. Deleault KM, Skinner SJ, & Brooks SA (2008) Tristetraprolin regulates TNF TNF-alpha
mRNA stability via a proteasome dependent mechanism involving the combined action
of the ERK and p38 pathways. Molecular immunology 45(1):13-24.
95. Wang W, et al. (2000) HuR regulates p21 mRNA stabilization by UV light. Molecular and
cellular biology 20(3):760-769.
96. Jing Q, et al. (2005) Involvement of microRNA in AU-rich element-mediated mRNA
instability. Cell 120(5):623-634.
97. Frankenberg S, et al. (2011) Primitive endoderm differentiates via a three-step
mechanism involving Nanog and RTK signaling. Developmental cell 21(6):1005-1013.
98. Boulet AM & Capecchi MR (2012) Signaling by FGF4 and FGF8 is required for axial
elongation of the mouse embryo. Developmental biology 371(2):235-245.

77
99. Sun X, Meyers EN, Lewandoski M, & Martin GR (1999) Targeted disruption of Fgf8
causes failure of cell migration in the gastrulating mouse embryo. Genes & development
13(14):1834-1846.
100. Schulte-Merker S & Smith JC (1995) Mesoderm formation in response to Brachyury
requires FGF signalling. Current biology : CB 5(1):62-67.
101. Xu X, et al. (1998) Fibroblast growth factor receptor 2 (FGFR2)-mediated reciprocal
regulation loop between FGF8 and FGF10 is essential for limb induction. Development
125(4):753-765.
102. Ying QL, Stavridis M, Griffiths D, Li M, & Smith A (2003) Conversion of embryonic stem
cells into neuroectodermal precursors in adherent monoculture. Nature biotechnology
21(2):183-186.

78
Appendix A
Supplemental Materials and Methods
Cell Lines and Cell Culture
fgf4-/- mESCs (strain FD6) were a kind gift ofrom Dr. Angie Rizzino, University of
Nebraska Medical Center.
Cultures were routinely passaged in complete ES culture medium (15% FBS, 1000U/ml
LIF, NEAA, Sodium Pyruvate and ME in DMEM) in the absence of feeders. Mesoderm
differentiation media: 15% FBS, NEAA, Sodium Pyruvate and ME in DMEM (92);
Neurectodermal differentiation media: N2B27 serum free media (102).
Reagents, Antibodies, Signaling Inhibitors and siRNAs
Qiazol reagent (Qiagen); iScript Kit (Bio-Rad); SsoFast Probes Supermix (Bio-Rad)
Mouse monoclonal (L34F12) anti-p44/p42 (Cell Signal, Cat# 4696, 1:2000); Rabbit
monoclonal (D13.14.4E) anti-phospho-p44/p42 (Cell Signal, Cat# 4370, 1:2000); Mouse
anti-TBP (Abcam, Cat# ab818, 1:1000); Rabbit anti-Beta Tubulin (Abcam, Cat# ab6046,
1:1000); Rabbit polyclonal anti-Brf1/2 (Cell Signal, Cat# 2119, 1:1000); Rabbit anti-Zfp36
(Protein Tech Group, Cat# 12737-1-AP, 1:500); Rabbit anti-hnRNP E1 (Cell Signal, Cat#
8534, 1:500); Goat anti-Brachyury (R & D Systems, Cat# AF2085, 1:200); Rabbit anti-Sox1
(GeneTex, Cat# GTX62974, 1:200); Mouse anti-Gapdh (Abcam, Cat# ab8245, 1:5000)

79
CI-1040 (also known as PD184352, Axon, 5uM); PD173074 (Sigma, 100ng/ml)
TTP siRNA (Santa Cruz Biotechnology, 10nM); Brf1 siRNA (Santa Cruz Biotechnology,
10nM); Brf2 siRNA (Santa Cruz Biotechnology, 10nM); All Stars Negative Control siRNA
(Qiagen, 10nM)
High Throughput Sequencing Data
Raw sequencing data discussed in this publication was deposited in the NCBI Gene
Expression Omnibus (Accession Number: GSE40104).

80
Appendix B
Supplemental Information
Primers and Probe Characterization:
Gene Name Accession Primers and Probe Slope/Efficiency/R2
Citrine (YFP) Primer1: 5’-CCACCTTCGGCTACGGCCTGA-3’
Primer2: 5’-GCCATGATATAGACGTTGTGG-3’
3.24/116%/0.998
Dab2 NM_023118.5 Primer1: 5’-TGTACTTTGTGGGTTCTGTCC-3’
Primer2: 5’-GGTTGTGCTTGTTTCTACTTCG-3’
Probe: 5’-CTGCTTGCCTTCCCGTCATGTCTAA-3’
3.59/90%/0.999
Esrr NM_011934.4 Primer1: 5’-CCTTTACTATCTGTGCCTGGTC-3’
Primer2: 5’-AGTGCTTCTCTTTGGTGCTG-3’
Probe: 5’-ACACGTCTGTCATCCTTGCCTGC-3’
3.27/102%/0.998
Fgf5 NM_010203.4 Primer1: 5’-TGACTGGAATGAGTGCATCTG-3’
Primer2: 5’-GGGTTTGGAATTTGGGTTGAG-3’
Probe: 5’-ATTAAGCTCCTGGGTCGCAAGGG-3’
3.40/97%/1.000
FoxA2 NM_010446.2 Primer1: 5’-GATGTACGAGTAGGGAGGTTTG-3’
Primer2: 5’-AACATGAACTCGATGAGCCC-3’
Probe: 5’-CCAAGACATACCGACGCAGCTACA-3’
3.21/105%/0.999
Gapdh NM_008084.2 Primer1: 5’-CTCCACGACATACTCAGCAC-3’
Primer2: 5’-CCACTCACGGCAAATTCAAC-3’
Probe: 5’-AGGAGCGAGACCCCACTAACATCA-3’
3.38/97%/0.999
Gata6 NM_010258.3 Primer1: 5’-AGCAAGATGAATGGCCTCAG-3’
Primer2: 5’-CTCACCCTCAGCATTTCTACG-3’
Probe: 5’-CAACTGTCACACCACAACCACTACCT-3’
3.35/99%/1.000
Gbx2 NM_010262.3 Primer1: 5’-GCAGTGTTTTGAAAGGGATAGG-3’
Primer2: 5’-TGTTTGTCCTTGTGTCTCCTG-3’
Probe: 5’-TTTGGGCACGTATGGGAAGGTGG-3’
3.63/89%/0.999
Hnf4 NM_008261.2 Primer1: 5’-GGGCAGGAGAAGGATAAGAAAG-3’
Primer2: 5’-GCAAAGCCATCAAGAGTCAAC-3’
Probe: 5’-TGGGAAGCTACAGTCAAGGTGCATT-3’
3.68/87%/0.996
Hprt NM_013556.2 Primer1: 5’-GCCCCAAAATGGTTAAGGTTG-3’
Primer2: 5’-AACAAAGTCTGGCCTGTATCC-3’
Probe: 5’-CTTGCTGGTGAAAAGGACCTCTCGAA-3’
3.36/98%/0.999
Nanog NM_028016.2 Primer1: 5’-CAAAGGATGAAGTGCAAGCG-3’
Primer2: 5’-CCAGATGCGTTCACCAGATAG-3’
Probe: 5’-CAGCACCAGTGGAGTATCCCAGC-3’
3.35/99%/0.999

81
Nodal NM_013611.4 Primer1: 5’-TTCACCGTCATTCCTTCTCAG-3’
Primer2: 5’-GATGCCAACACTTTTCTGCTC-3’
Probe: 5’-ACACCTGCTTTTCCAGTGCCCT-3’
3.38/98%/1.000
Oct4 NM_013633.3 Primer1: 5’-CACTCTACTCAGTCCCTTTTCC-3’
Primer2: 5’-GTTCTCTTGTCTACCTCCCTTG-3’
Probe: 5’-TTTCCCTCTGTTCCCGTCACTGC-3’
3.34/99%/1.000
Rex1 NM_009556.3 Primer1: 5’-ACATCCTAACCCACGCAAAG-3’
Primer2: 5’-CATTAAGACTACCCAGCCTGAG-3’
Probe: 5’-TGTCTCCACCTTCAGCATTTCTTCCC-3’
3.17/107%/1.000
Sdha NM_023281.1 Primer1: 5’-AGTGGGCTGTCTTCCTTAAC-3’
Primer2: 5’-GGATTGCTTCTGTTTGCTTGG-3’
Probe: 5’-TGGGCATGTCTCTGAGGGATTGG-3’
3.21/105%/1.000
Sox1 NM_009233.3 Primer1: 5’-TCTTTCCTGTGGTTCTGCC-3’
Primer2: 5’-GAAATCAAAGGCACGCTGTC-3’
Probe: 5’-TTGTCCCTATCCTTGGCCTTGTCC-3’
3.79/84%/0.999
Sox2 NM_011443.3 Primer1: 5’-CCAATCCCATCCAAATTAACGC-3’
Primer2: 5’-CTATACATGGTCCGATTCCCC-3’
Probe: 5’-CCGCCCTCAGGTTTTCTCTGTACAA-3’
3.78/84%/0.999
T NM_009309.2 Primer1: 5’-GCTGGAAATATGTGAACGGG-3’
Primer2: 5’-GTTGGTGAGTTTGACTTTGCTG-3’
Probe: 5’-AAAATTGGGCGAGTCTGGGTGGA-3’
3.87/81%/1.000
Tbp NM_013684.3 Primer1: 5’-TGATTGCTGTACTGAGGCTG-3’
Primer2: 5’-CTTACGGCACAGGACTTACTC-3’
Probe: 5’-ACTGTTGGTGTTCTGAATAGGCTGTGG-3’
3.24/104%/0.998
Tbx3 NM_011535.2 Primer1: 5’-TCCCATTATCCTCAACCTTGC-3’
Primer2: 5’-CACACGAAGCCCTCTACAAG-3’
Probe: 5’-CCATAGCTGCCCCTTTTACCCCA-3’
3.48/94%/0.998
Zfp36 (TTP) NM_011756.4 Primer1: 5’-CCCTGTCCTCTTGTTCCTTTTC-3’
Primer2: 5’-TGGTTAGGGTCTCTTCGAGTC-3’
Probe: 5’-CTTTCCCCTTCTGCCTTCTCTGCT-3’
3.14/108%/1.000
Zfp36l1
(Brf1)
NM_007564.5 Primer1: 5’-GCACACTCTTCCTCTTCCTTATAG-3’
Primer2: 5’-AGGCAAGATTAGTCAACAGGG-3’
Probe: 5’-ACCTTTTACTTCCCAGCCCGAACC-3’
3.23/104%/0.997
Zfp36l2
(Brf2)
NM_001001806.2 Primer1: 5’-TCGCCCGTTATTCATCTTGG-3’
Primer2: 5’-CGTAGAAGGGTGACAGAAGTG-3’
Probe: 5’-AAGCGTGGAGGTTGGGAGGT-3’
3.17/107%/1.000
½ life tag Primer1: 5’- CTGTTTTGACCTCCATAGAAGAC-3’
Primer2: 5’- AGATTGAGGATGCTGAGCGTC-3’
3.32/100%/0.999