Breakup Dynamics of Semi-dilute Polymer Solutions in a ...
14
micromachines Article Breakup Dynamics of Semi-dilute Polymer Solutions in a Microfluidic Flow-focusing Device Chun-Dong Xue 1, † , Xiao-Dong Chen 2, † , Yong-Jiang Li 1 , Guo-Qing Hu 3 , Tun Cao 1, * and Kai-Rong Qin 1, * 1 School of Optoelectronic Engineering and Instrumentation Science, Dalian University of Technology, Dalian 116024, China; [email protected] (C.-D.X.); [email protected] (Y.-J.L.) 2 School of Aerospace Engineering, Beijing Institute of Technology, Beijing 100081, China; [email protected] 3 Department of Engineering Mechanics, Zhejiang University, Hangzhou 310027, China; [email protected] * Correspondence: [email protected] (T.C.); [email protected] (K.-R.Q.) † These authors contributed equally to this work. Received: 14 March 2020; Accepted: 12 April 2020; Published: 14 April 2020 Abstract: Droplet microfluidics involving non-Newtonian fluids is of great importance in both fundamental mechanisms and practical applications. In the present study, breakup dynamics in droplet generation of semi-dilute polymer solutions in a microfluidic flow-focusing device were experimentally investigated. We found that the filament thinning experiences a transition from a flow-driven to a capillary-driven regime, analogous to that of purely elastic fluids, while the highly elevated viscosity and complex network structures in the semi-dilute polymer solutions induce the breakup stages with a smaller power-law exponent and extensional relaxation time. It is elucidated that the elevated viscosity of the semi-dilute solution decelerates filament thinning in the flow-driven regime and the incomplete stretch of polymer molecules results in the smaller extensional relaxation time in the capillary-driven regime. These results extend the understanding of breakup dynamics in droplet generation of non-Newtonian fluids and provide guidance for microfluidic synthesis applications involving dense polymeric fluids. Keywords: droplet microfluidics; breakup dynamics; filament thinning; non-Newtonian fluids; flow-focusing device; extensional flow; semi-dilute polymer solutions 1. Introduction Droplet microfluidics has been one of the fastest growing areas of microfluidics in the past two decades, with far-reaching applications [1–6]. Microdroplets provide isolated micro-scale compartments for versatile functions in chemical, biological, medical, and material sciences [1–4,7–12]. Precise control of droplet size is a prerequisite to establish a uniform microenvironment, to ensure homogeneous composition, and to deliver accurate dosing of a drug or chemical reactants in these scenarios [9,10,13]. As non-Newtonian fluids are ubiquitous in nature and industry, non-Newtonian droplets are frequently encountered in practical processes including pharmaceutical synthesis, cell encapsulation, drug screening and delivery [14–16]. Understanding of non-Newtonian droplet generation is imperative in both fundamental mechanisms and practical applications. Polymer solutions often exhibit non-Newtonian properties, i.e., elasticity, shear-thinning, or both. They have been frequently used as the model media in the laboratory due to their facile accessibility and easy-to-adjust rheology. Previous studies have demonstrated that a small amount of polymer added to a Newtonian fluid markedly affects the fluid rheology and, successively, the dynamics of breakup of the fluid threads in macroscopic experiments [17–19]. This kind of breakup can be observed Micromachines 2020, 11, 406; doi:10.3390/mi11040406 www.mdpi.com/journal/micromachines
Transcript of Breakup Dynamics of Semi-dilute Polymer Solutions in a ...
micromachines
Article
Breakup Dynamics of Semi-dilute Polymer Solutionsin a Microfluidic Flow-focusing Device
Chun-Dong Xue 1,† , Xiao-Dong Chen 2,† , Yong-Jiang Li 1 , Guo-Qing Hu 3, Tun Cao 1,* andKai-Rong Qin 1,*
1 School of Optoelectronic Engineering and Instrumentation Science, Dalian University of Technology,Dalian 116024, China; [email protected] (C.-D.X.); [email protected] (Y.-J.L.)
2 School of Aerospace Engineering, Beijing Institute of Technology, Beijing 100081, China;[email protected]
3 Department of Engineering Mechanics, Zhejiang University, Hangzhou 310027, China; [email protected]* Correspondence: [email protected] (T.C.); [email protected] (K.-R.Q.)† These authors contributed equally to this work.
Received: 14 March 2020; Accepted: 12 April 2020; Published: 14 April 2020
Abstract: Droplet microfluidics involving non-Newtonian fluids is of great importance in bothfundamental mechanisms and practical applications. In the present study, breakup dynamics indroplet generation of semi-dilute polymer solutions in a microfluidic flow-focusing device wereexperimentally investigated. We found that the filament thinning experiences a transition from aflow-driven to a capillary-driven regime, analogous to that of purely elastic fluids, while the highlyelevated viscosity and complex network structures in the semi-dilute polymer solutions induce thebreakup stages with a smaller power-law exponent and extensional relaxation time. It is elucidatedthat the elevated viscosity of the semi-dilute solution decelerates filament thinning in the flow-drivenregime and the incomplete stretch of polymer molecules results in the smaller extensional relaxationtime in the capillary-driven regime. These results extend the understanding of breakup dynamicsin droplet generation of non-Newtonian fluids and provide guidance for microfluidic synthesisapplications involving dense polymeric fluids.
Keywords: droplet microfluidics; breakup dynamics; filament thinning; non-Newtonian fluids;flow-focusing device; extensional flow; semi-dilute polymer solutions
1. Introduction
Droplet microfluidics has been one of the fastest growing areas of microfluidics in the pasttwo decades, with far-reaching applications [1–6]. Microdroplets provide isolated micro-scalecompartments for versatile functions in chemical, biological, medical, and material sciences [1–4,7–12].Precise control of droplet size is a prerequisite to establish a uniform microenvironment, to ensurehomogeneous composition, and to deliver accurate dosing of a drug or chemical reactants in thesescenarios [9,10,13]. As non-Newtonian fluids are ubiquitous in nature and industry, non-Newtoniandroplets are frequently encountered in practical processes including pharmaceutical synthesis, cellencapsulation, drug screening and delivery [14–16]. Understanding of non-Newtonian dropletgeneration is imperative in both fundamental mechanisms and practical applications.
Polymer solutions often exhibit non-Newtonian properties, i.e., elasticity, shear-thinning, or both.They have been frequently used as the model media in the laboratory due to their facile accessibilityand easy-to-adjust rheology. Previous studies have demonstrated that a small amount of polymeradded to a Newtonian fluid markedly affects the fluid rheology and, successively, the dynamics ofbreakup of the fluid threads in macroscopic experiments [17–19]. This kind of breakup can be observed
Micromachines 2020, 11, 406; doi:10.3390/mi11040406 www.mdpi.com/journal/micromachines
Micromachines 2020, 11, 406 2 of 14
in the experiments of capillary breakup extensional rheometry (CaBER), which has been developed as anovel method for rheology measurements of complex fluids [20–22]. Differing from the quiescent outerphase of free surface flows, the continuous phase fluid in droplet-based microfluidic devices deformsthe interface of the two immiscible liquids and promotes interfacial instabilities [23–25]. Microfluidicdevices with flow-focusing configuration are commonly used to generate microdroplets [23,26].Typically, two immiscible liquids flow coaxially into separate channels with the continuous fluidflowing on both sides of the dispersed fluid, after which the resulting elongation-dominated flow fieldin the continuous liquid drives the dispersed liquid into a thin filament that breaks into separateddroplets. The generation process becomes complicated when the dispersed phase is a non-Newtonianfluid, in which the delicate balance of capillary, inertial and viscous forces is influenced by extra factorssuch as the elastic stress [27–29].
The breakup dynamics of viscoelastic droplet generation in flow-focusing microchannels hasbeen experimentally investigated by several groups. Blended with a small quantity of linear polymers,e.g., polyethylene oxide (PEO), pure water can become a viscoelastic fluid without shear-thinning.On the whole, the breakup dynamics of the elastic filament can be divided into a flow-drivenregime and a capillary-driven regime based on transition time [30,31]. Initially, the thread headadvances and restricts the flow of continuous fluid, resulting in an increase of the hydrostaticpressure upstream [32]. The increased pressure mainly triggers a fast necking of filament, forming theflow-driven regime in which the minimum thread width scales with the remaining time as a power-lawrelation [30,33,34]. The distribution of the accumulated pressure upstream then changes as the filamentextends. The necking force decreases while the stretching force increases. Polymers in the dispersedthread are highly stretched while the elastic force starts to dominate and the necking enters into thelater capillary-driven regime [31,35]. At the later stage, the thread thinning shows an exponentialdecay over time [30,31,33–36]. The exponential decay allows measurements of both the extensionalrelaxation time and the steady extensional viscosity [31,33,35]. In addition, the molecular weights ofpolymer and the dimensions of the microchannel have been reported to impose effects on the dynamicsof filament breakup [31–33,35,37].
It is noted that most of the existing studies consider dilute polymer solutions, while moreconcentrated polymer solutions are frequently encounter in practical applications [5,14–16], which oftenexhibit non-Newtonian properties more than elasticity. Although several studies have also examined theeffect of shear-thinning on filament breakup [38,39], the breakup behavior of dense polymer solutionsexhibiting both elasticity and shear-thinning has rarely been addressed in microfluidic devices. In thepresent study, the breakup dynamics of semi-dilute polymer solutions in a flow-focusing microchannelare highlighted. The breakup morphology of semi-dilute PEO solutions is first characterized bycomparing with those of the dilute and Newtonian counterparts. Filament thinning is then quantifiedby tracking the evolution of the minimum thread width, by which the flow-driven and capillary-drivenregimes are identified. The characteristics in the breakup of the semi-dilute solutions are finallyclarified by analyzing the two regimes in detail.
2. Materials and Methods
2.1. Fluids
The continuous and dispersed phase fluids were the olive oil and the aqueous solution of PEO(Sigma-Aldrich, Shanghai, China), respectively. The molecular weight of PEO was Mw = 2 M·Da.PEO solutions were prepared by adding PEO powders in deionized water (Milli-Q, 18 MΩ·cm)and blending it sufficiently using a shaker with a rate of 60/min for 1–2 days. Unlike previousstudies focusing on dilute regimes, i.e., c/c* < 1, semi-dilute solutions were focused on in this study,i.e., c/c* = 2.5–10. The dilute cases, i.e., c/c* = 0.1–1, were also considered for comparison. Here, c* isthe overlap concentration calculated as c* = 3Mw/4πRg
3NA = 1000 ppm (parts per million), whereNA is the Avogadro constant and Rg = 0.02Mw
0.58 = 90 nm is the gyration radius of a single polymer
Micromachines 2020, 11, 406 3 of 14
molecule [40]. The density (ρc) and viscosity (ηc) of olive oil were 0.92 g/cm3 and 78 mPa·s, respectively.The interfacial tension (σ) of the continuous and droplet phase was measured as 20.3 ± 0.08 mN/musing the pendant droplet method (Theta, Attension Inc., Goteborg, Switzerland).
2.2. Rheological Characterization
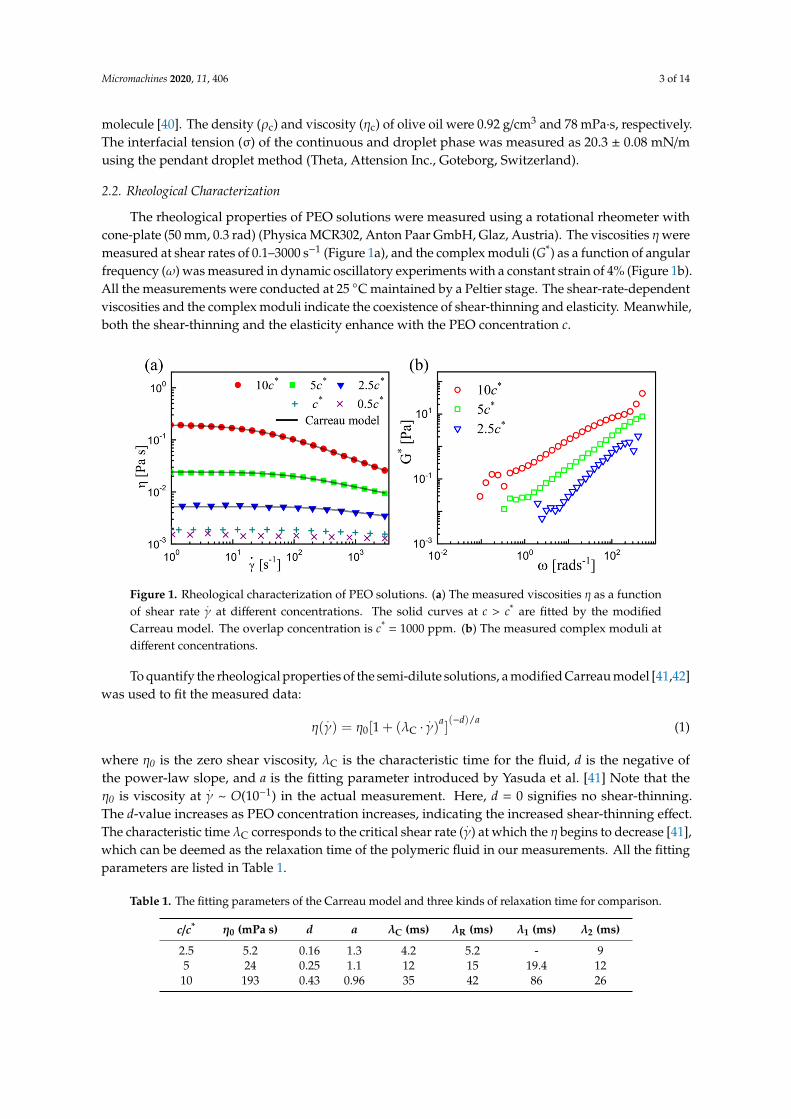
The rheological properties of PEO solutions were measured using a rotational rheometer withcone-plate (50 mm, 0.3 rad) (Physica MCR302, Anton Paar GmbH, Glaz, Austria). The viscosities ηweremeasured at shear rates of 0.1–3000 s−1 (Figure 1a), and the complex moduli (G*) as a function of angularfrequency (ω) was measured in dynamic oscillatory experiments with a constant strain of 4% (Figure 1b).All the measurements were conducted at 25 C maintained by a Peltier stage. The shear-rate-dependentviscosities and the complex moduli indicate the coexistence of shear-thinning and elasticity. Meanwhile,both the shear-thinning and the elasticity enhance with the PEO concentration c.
Micromachines 2020, 11, x FOR PEER REVIEW 3 of 14
[40]. The density (ρc) and viscosity (ηc) of olive oil were 0.92 g/cm3 and 78 mPa·s, respectively. The interfacial tension (σ) of the continuous and droplet phase was measured as 20.3 ± 0.08 mN/m using the pendant droplet method (Theta, Attension Inc., Goteborg, Switzerland).
2.2. Rheological Characterization
The rheological properties of PEO solutions were measured using a rotational rheometer with cone-plate (50 mm, 0.3 rad) (Physica MCR302, Anton Paar GmbH, Glaz, Austria). The viscosities η were measured at shear rates of 0.1–3000 s−1 (Figure 1a), and the complex moduli (G*) as a function of angular frequency (ω) was measured in dynamic oscillatory experiments with a constant strain of 4% (Figure 1b). All the measurements were conducted at 25 °C maintained by a Peltier stage. The shear-rate-dependent viscosities and the complex moduli indicate the coexistence of shear-thinning and elasticity. Meanwhile, both the shear-thinning and the elasticity enhance with the PEO concentration c.
To quantify the rheological properties of the semi-dilute solutions, a modified Carreau model [41,42] was used to fit the measured data:
( )0 C( ) [1 ( ) ]a -d / aη γ η λ γ= + ⋅ (1)
where η0 is the zero shear viscosity, λC is the characteristic time for the fluid, d is the negative of the power-law slope, and a is the fitting parameter introduced by Yasuda et al. [41] Note that the η0 is viscosity at ~ O(10−1) in the actual measurement. Here, d = 0 signifies no shear-thinning. The d-value increases as PEO concentration increases, indicating the increased shear-thinning effect. The characteristic time λC corresponds to the critical shear rate ( ) at which the η begins to decrease [41], which can be deemed as the relaxation time of the polymeric fluid in our measurements. All the fitting parameters are listed in Table 1.
Figure 1. Rheological characterization of PEO solutions. (a) The measured viscosities η as a function of shear rate at different concentrations. The solid curves at c > c* are fitted by the modified Carreau model. The overlap concentration is c* = 1000 ppm. (b) The measured complex moduli at different concentrations.
For comparison, values for Zimm relaxation time (λZ) and reptation time (λR) are provided. The Zimm relaxation time is calculated based on the Zimm model [33,43,44], which can describe the relaxation of dilute solutions well. The λZ values were estimated by
0.463[ ] w sZ
A B
MN k Tη ηλ = (2)
where [η] = 0.072Mw0.65 is the intrinsic viscosity of PEO solution, ηs is the solvent viscosity, NA is the Avogadro’s number, kB is the Boltzmann’s constant, and T is the absolute temperature. The prefactor 0.463 accounts for the solvent quality and the excluded volume parameter. Accordingly, λZ = 0.35 ms
Figure 1. Rheological characterization of PEO solutions. (a) The measured viscosities η as a functionof shear rate
.γ at different concentrations. The solid curves at c > c* are fitted by the modified
Carreau model. The overlap concentration is c* = 1000 ppm. (b) The measured complex moduli atdifferent concentrations.
To quantify the rheological properties of the semi-dilute solutions, a modified Carreau model [41,42]was used to fit the measured data:
η(.γ) = η0[1 + (λC ·
.γ)
a](−d)/a
(1)
where η0 is the zero shear viscosity, λC is the characteristic time for the fluid, d is the negative ofthe power-law slope, and a is the fitting parameter introduced by Yasuda et al. [41] Note that theη0 is viscosity at
.γ ~ O(10−1) in the actual measurement. Here, d = 0 signifies no shear-thinning.
The d-value increases as PEO concentration increases, indicating the increased shear-thinning effect.The characteristic time λC corresponds to the critical shear rate (
.γ) at which the η begins to decrease [41],
which can be deemed as the relaxation time of the polymeric fluid in our measurements. All the fittingparameters are listed in Table 1.
Table 1. The fitting parameters of the Carreau model and three kinds of relaxation time for comparison.
c/c* η0 (mPa s) d a λC (ms) λR (ms) λ1 (ms) λ2 (ms)
2.5 5.2 0.16 1.3 4.2 5.2 - 95 24 0.25 1.1 12 15 19.4 12
10 193 0.43 0.96 35 42 86 26
Micromachines 2020, 11, 406 4 of 14
For comparison, values for Zimm relaxation time (λZ) and reptation time (λR) are provided.The Zimm relaxation time is calculated based on the Zimm model [33,43,44], which can describe therelaxation of dilute solutions well. The λZ values were estimated by
λZ = 0.463[η]Mwηs
NAkBT(2)
where [η] = 0.072Mw0.65 is the intrinsic viscosity of PEO solution, ηs is the solvent viscosity, NA is the
Avogadro’s number, kB is the Boltzmann’s constant, and T is the absolute temperature. The prefactor0.463 accounts for the solvent quality and the excluded volume parameter. Accordingly, λZ = 0.35 msis obtained, independent of the polymer concentrations. In contrast, the reptation model takes thehydrodynamic interactions into account and can better depict the polymer dynamics in semi-dilutesolutions [45–47]. The λR value shows a concentration dependence, i.e.,
λR = τ0N3/Ne(1)c3(1−v)/(3v−1) (3)
where τ0 ≈ 0.2 ns is the monomer relaxation time at room temperature, N = Mw/M0 is the number ofKuhn monomers per chain (M0 = 140 for PEO), Ne(1) ≈ 14 is the number of Kuhn monomers in anentanglement strand in melts, and v = 0.588 is the solvent quality exponent. The estimated λR valuesagree well with the values of λC for the semi-dilute solutions, as shown in Table 1. The estimatedvalues of λC were also compared with those measured by other approaches, i.e., CaBER (λ1) [21] andDripping-onto-Substrate rheometry (DoSR) (λ2) [44]. The comparison suggests that our estimatedrelaxation time values accord with those reported in these works (Table 1).
2.3. Experimental Setup
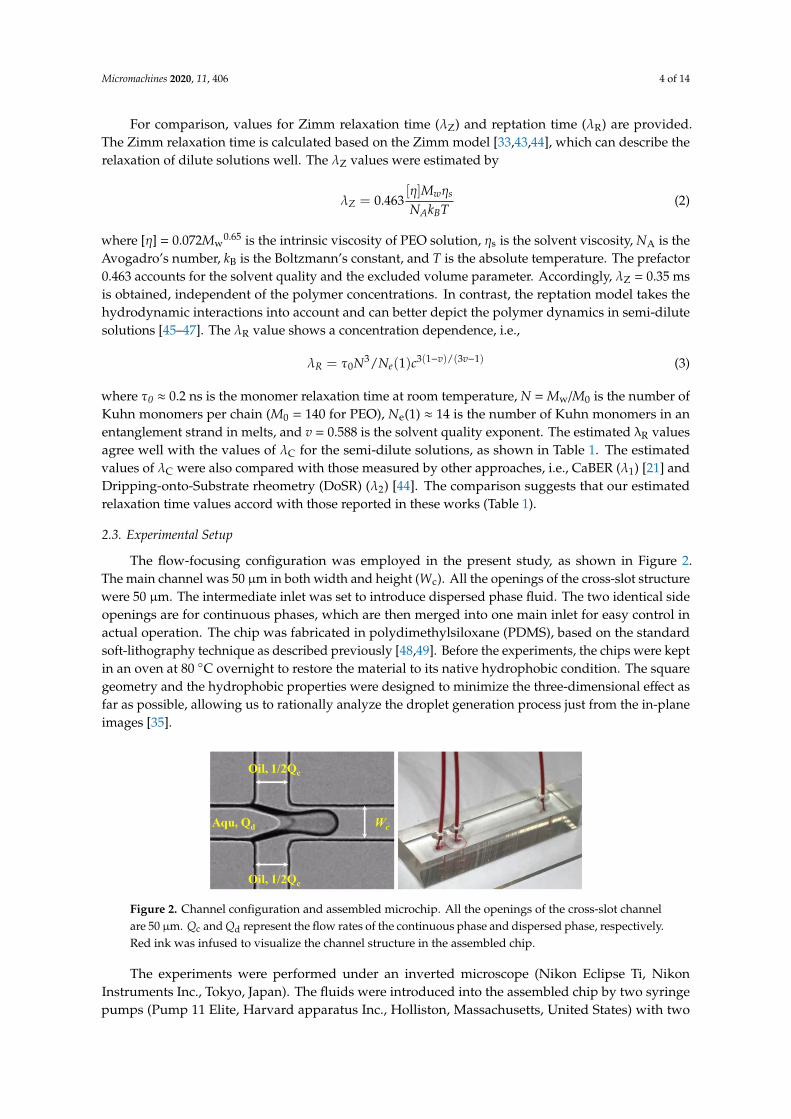
The flow-focusing configuration was employed in the present study, as shown in Figure 2.The main channel was 50 µm in both width and height (Wc). All the openings of the cross-slot structurewere 50 µm. The intermediate inlet was set to introduce dispersed phase fluid. The two identical sideopenings are for continuous phases, which are then merged into one main inlet for easy control inactual operation. The chip was fabricated in polydimethylsiloxane (PDMS), based on the standardsoft-lithography technique as described previously [48,49]. Before the experiments, the chips were keptin an oven at 80 C overnight to restore the material to its native hydrophobic condition. The squaregeometry and the hydrophobic properties were designed to minimize the three-dimensional effect asfar as possible, allowing us to rationally analyze the droplet generation process just from the in-planeimages [35].Micromachines 2020, 11, x FOR PEER REVIEW 5 of 14
Figure 2. Channel configuration and assembled microchip. All the openings of the cross-slot channel are 50 μm. Qc and Qd represent the flow rates of the continuous phase and dispersed phase, respectively. Red ink was infused to visualize the channel structure in the assembled chip.
The images of the droplet breakup process were recorded using a high-speed CCD camera (Phantom v7.3, Vision Research Inc., Birmingham, Alabama, United States) and the Phantom Camera Control software (PCC 2.14, Vision Research Inc., Birmingham, Alabama,, United States). Experimental videos were taken at 103–104 fps (frames per second). All of the experiments were conducted at the room temperature. The captured images were then processed and analyzed using the ImageJ software package (National Institute of Health, Bethesda, Maryland, USA). The maximum length error of image processing was estimated to be 4 μm, and the time error was less than the interval between two successive images, i.e., 100 μs.
3. Results and Discussion
3.1. Qualitative Observations
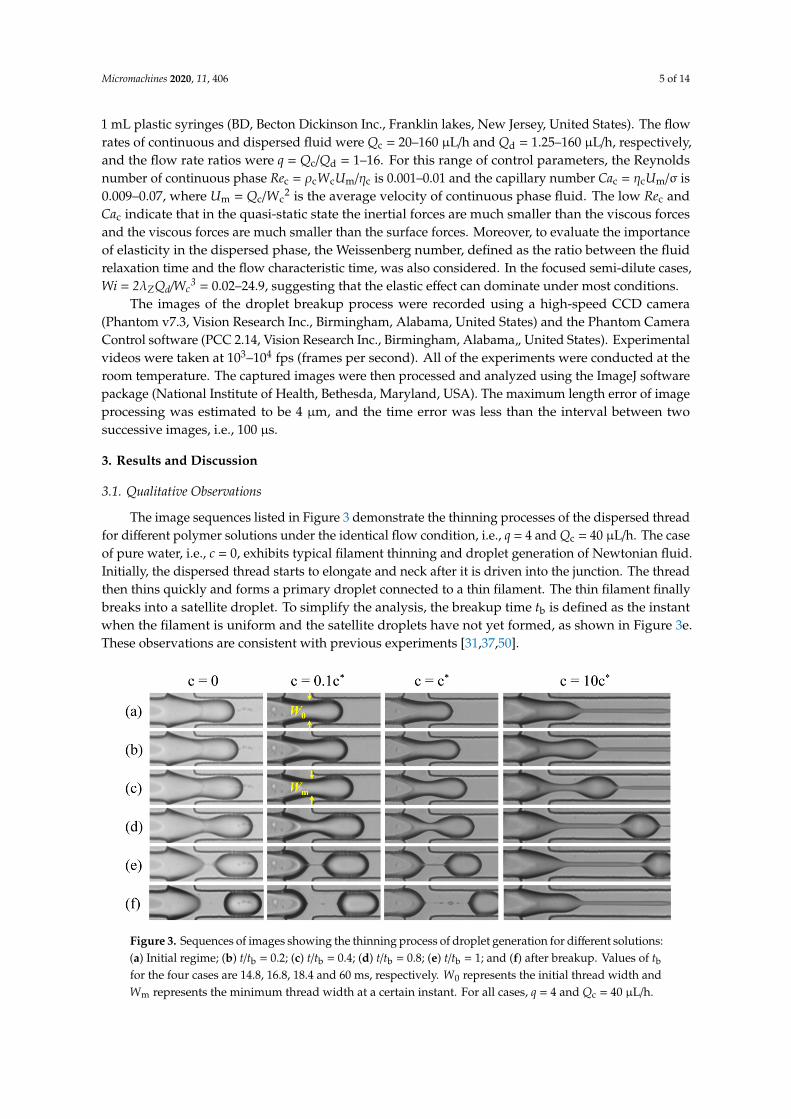
The image sequences listed in Figure 3 demonstrate the thinning processes of the dispersed thread for different polymer solutions under the identical flow condition, i.e., q = 4 and Qc = 40 μL/h. The case of pure water, i.e., c = 0, exhibits typical filament thinning and droplet generation of Newtonian fluid. Initially, the dispersed thread starts to elongate and neck after it is driven into the junction. The thread then thins quickly and forms a primary droplet connected to a thin filament. The thin filament finally breaks into a satellite droplet. To simplify the analysis, the breakup time tb is defined as the instant when the filament is uniform and the satellite droplets have not yet formed, as shown in Figure 3e. These observations are consistent with previous experiments [31,37,50].
Figure 3. Sequences of images showing the thinning process of droplet generation for different solutions:(a) Initial regime; (b) t/tb = 0.2; (c) t/tb = 0.4; (d) t/tb = 0.8; (e) t/tb = 1; and (f) after breakup. Values of tb for the four cases are 14.8, 16.8, 18.4 and 60 ms, respectively. W0 represents the initial
Figure 2. Channel configuration and assembled microchip. All the openings of the cross-slot channelare 50 µm. Qc and Qd represent the flow rates of the continuous phase and dispersed phase, respectively.Red ink was infused to visualize the channel structure in the assembled chip.
The experiments were performed under an inverted microscope (Nikon Eclipse Ti, NikonInstruments Inc., Tokyo, Japan). The fluids were introduced into the assembled chip by two syringepumps (Pump 11 Elite, Harvard apparatus Inc., Holliston, Massachusetts, United States) with two
Micromachines 2020, 11, 406 5 of 14
1 mL plastic syringes (BD, Becton Dickinson Inc., Franklin lakes, New Jersey, United States). The flowrates of continuous and dispersed fluid were Qc = 20–160 µL/h and Qd = 1.25–160 µL/h, respectively,and the flow rate ratios were q = Qc/Qd = 1–16. For this range of control parameters, the Reynoldsnumber of continuous phase Rec = ρcWcUm/ηc is 0.001–0.01 and the capillary number Cac = ηcUm/σ is0.009–0.07, where Um = Qc/Wc
2 is the average velocity of continuous phase fluid. The low Rec andCac indicate that in the quasi-static state the inertial forces are much smaller than the viscous forcesand the viscous forces are much smaller than the surface forces. Moreover, to evaluate the importanceof elasticity in the dispersed phase, the Weissenberg number, defined as the ratio between the fluidrelaxation time and the flow characteristic time, was also considered. In the focused semi-dilute cases,Wi = 2λZQd/Wc
3 = 0.02–24.9, suggesting that the elastic effect can dominate under most conditions.The images of the droplet breakup process were recorded using a high-speed CCD camera
(Phantom v7.3, Vision Research Inc., Birmingham, Alabama, United States) and the Phantom CameraControl software (PCC 2.14, Vision Research Inc., Birmingham, Alabama„ United States). Experimentalvideos were taken at 103–104 fps (frames per second). All of the experiments were conducted at theroom temperature. The captured images were then processed and analyzed using the ImageJ softwarepackage (National Institute of Health, Bethesda, Maryland, USA). The maximum length error of imageprocessing was estimated to be 4 µm, and the time error was less than the interval between twosuccessive images, i.e., 100 µs.
3. Results and Discussion
3.1. Qualitative Observations
The image sequences listed in Figure 3 demonstrate the thinning processes of the dispersed threadfor different polymer solutions under the identical flow condition, i.e., q = 4 and Qc = 40 µL/h. The caseof pure water, i.e., c = 0, exhibits typical filament thinning and droplet generation of Newtonian fluid.Initially, the dispersed thread starts to elongate and neck after it is driven into the junction. The threadthen thins quickly and forms a primary droplet connected to a thin filament. The thin filament finallybreaks into a satellite droplet. To simplify the analysis, the breakup time tb is defined as the instantwhen the filament is uniform and the satellite droplets have not yet formed, as shown in Figure 3e.These observations are consistent with previous experiments [31,37,50].
Micromachines 2020, 11, x FOR PEER REVIEW 5 of 14
Figure 2. Channel configuration and assembled microchip. All the openings of the cross-slot channel are 50 μm. Qc and Qd represent the flow rates of the continuous phase and dispersed phase, respectively. Red ink was infused to visualize the channel structure in the assembled chip.
The images of the droplet breakup process were recorded using a high-speed CCD camera (Phantom v7.3, Vision Research Inc., Birmingham, Alabama, United States) and the Phantom Camera Control software (PCC 2.14, Vision Research Inc., Birmingham, Alabama,, United States). Experimental videos were taken at 103–104 fps (frames per second). All of the experiments were conducted at the room temperature. The captured images were then processed and analyzed using the ImageJ software package (National Institute of Health, Bethesda, Maryland, USA). The maximum length error of image processing was estimated to be 4 μm, and the time error was less than the interval between two successive images, i.e., 100 μs.
3. Results and Discussion
3.1. Qualitative Observations
The image sequences listed in Figure 3 demonstrate the thinning processes of the dispersed thread for different polymer solutions under the identical flow condition, i.e., q = 4 and Qc = 40 μL/h. The case of pure water, i.e., c = 0, exhibits typical filament thinning and droplet generation of Newtonian fluid. Initially, the dispersed thread starts to elongate and neck after it is driven into the junction. The thread then thins quickly and forms a primary droplet connected to a thin filament. The thin filament finally breaks into a satellite droplet. To simplify the analysis, the breakup time tb is defined as the instant when the filament is uniform and the satellite droplets have not yet formed, as shown in Figure 3e. These observations are consistent with previous experiments [31,37,50].
Figure 3. Sequences of images showing the thinning process of droplet generation for different solutions:(a) Initial regime; (b) t/tb = 0.2; (c) t/tb = 0.4; (d) t/tb = 0.8; (e) t/tb = 1; and (f) after breakup. Values of tb for the four cases are 14.8, 16.8, 18.4 and 60 ms, respectively. W0 represents the initial
Figure 3. Sequences of images showing the thinning process of droplet generation for different solutions:(a) Initial regime; (b) t/tb = 0.2; (c) t/tb = 0.4; (d) t/tb = 0.8; (e) t/tb = 1; and (f) after breakup. Values of tb
for the four cases are 14.8, 16.8, 18.4 and 60 ms, respectively. W0 represents the initial thread width andWm represents the minimum thread width at a certain instant. For all cases, q = 4 and Qc = 40 µL/h.
Micromachines 2020, 11, 406 6 of 14
The polymeric cases exhibit different behavior at different polymer concentrations. The dilutesolutions, i.e., c = 0.1c* and c*, display behavior similar to the Newtonian counterpart. The dispersedfluid also develops into a thread that necks first and then breaks into a primary droplet and some tinysatellite droplets. The filament length and the breakup time in these polymeric cases are longer thanthose of the Newtonian counterpart, as previously reported [31,33]. Due to the low flow rate ratio q,the discrepancies here are not so large. Meanwhile, for the semi-dilute solution, i.e., c = 10c*, the threadthinning exhibits a very different behavior. During the early phase, the morphology is similar to thatof the Newtonian counterpart. As time elapses, the filament further elongates but thins at a muchlower rate. The filament elongation and breakup time tb are much longer. After breakup, the filamentdestabilizes and its width becomes non-uniform, leading to the well-known bead-on-a-string that formsmultiple satellite droplets successively [31,51]. This process occurs between two primary dropletsdownstream and is not shown in the image. Although the satellite droplets formed during filamentbreakup, the primary droplets on which we focused in the current study are highly uniform for allcases. Notably, the satellite droplets become larger as the PEO concentration increases or the flowrate of continuous phase increases, inevitably reducing the uniformity of the generated droplets.How to improve the uniformity of polymeric droplets is another issue that deserves to be addressed inthe future.
3.2. Quantitative Characterization
The observations above give us an intuitive impression. To capture more details, the process offilament thinning was quantitatively characterized by tracking the evolution of minimum width offilament Wm. The distinct interface of dispersed thread offers the chance to track the evolution offilament width. As denoted in Figure 3, the width at the instant when the thread starts to form is definedas the initial width W0, and this instant is defined as the initial time t = 0. As time elapses, the threaddeforms to form a necked filament. The distance between the two points with zero curvature in theneck is defined as the minimum width of filament Wm. As the thinning progresses, the measurementlocation of Wm shifts slightly but always maintains a location near the cross-slot. The time evolution ofWm is then extracted from the sequential images of individual thinning period. To ensure reliability,more than three measurements were carried out for each case.
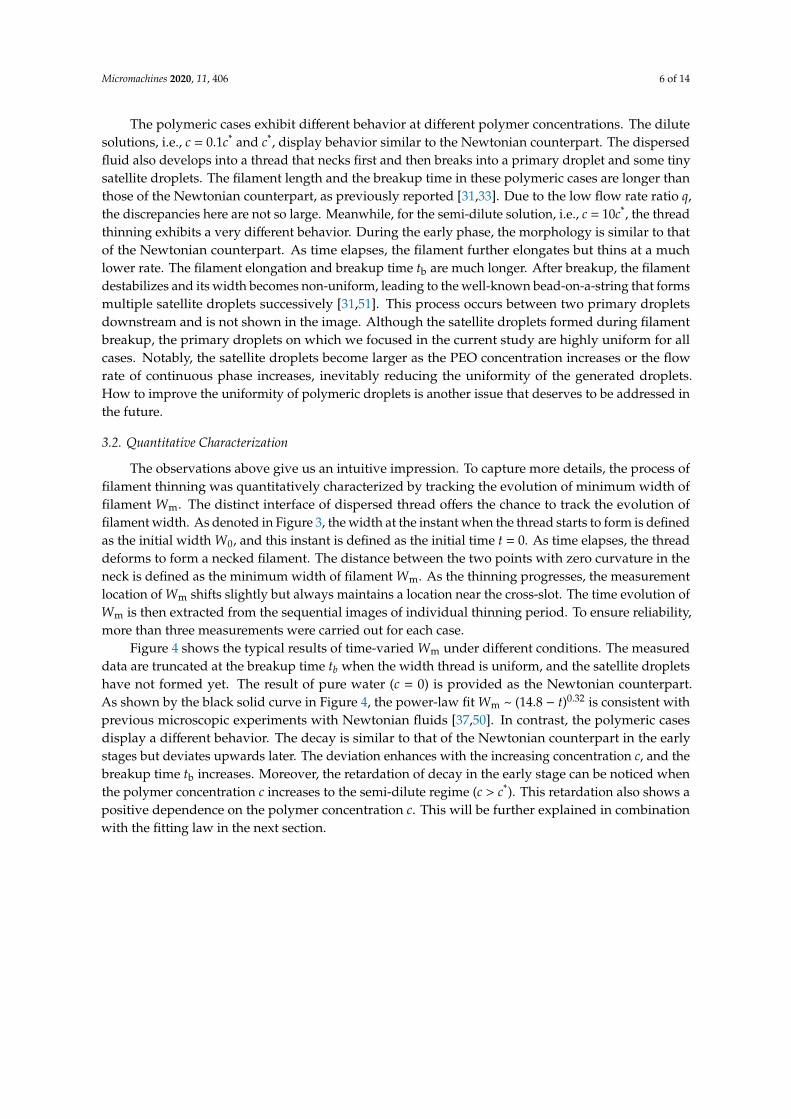
Figure 4 shows the typical results of time-varied Wm under different conditions. The measureddata are truncated at the breakup time tb when the width thread is uniform, and the satellite dropletshave not formed yet. The result of pure water (c = 0) is provided as the Newtonian counterpart.As shown by the black solid curve in Figure 4, the power-law fit Wm ~ (14.8 − t)0.32 is consistent withprevious microscopic experiments with Newtonian fluids [37,50]. In contrast, the polymeric casesdisplay a different behavior. The decay is similar to that of the Newtonian counterpart in the earlystages but deviates upwards later. The deviation enhances with the increasing concentration c, and thebreakup time tb increases. Moreover, the retardation of decay in the early stage can be noticed whenthe polymer concentration c increases to the semi-dilute regime (c > c*). This retardation also shows apositive dependence on the polymer concentration c. This will be further explained in combinationwith the fitting law in the next section.
Micromachines 2020, 11, 406 7 of 14
Micromachines 2020, 11, x FOR PEER REVIEW 7 of 14
Figure 4. Time evolution of the minimum filament width Wm at different PEO concentrations. The black solid curve Wm ~ (14.8 − t)0.32 is the fit for the Newtonian case, i.e., c = 0. The flow conditions are identical.
The instant when the deviation starts can be defined as the transition time tp. For the viscoelastic filament, the thinning process is divided into a flow-driven stage and an elasto-capillary stage based on the transition time tp [30,31], which can be captured by comparing the time-varied profiles of Wm between the polymeric fluid and the Newtonian counterpart [30,43]. As shown in Figure 4, it is valid for dilute solutions (c ≤ c*) but cannot be directly applied for semi-dilute solutions (c > c*) in the current study. Here, we propose a method to extract the values of tp based on the temporal variation of the extensional strain rates in the filament thinning. The extensional strain rates can be calculated by [30,31,43,52]
m
m
d2=dW
W tε − (4)
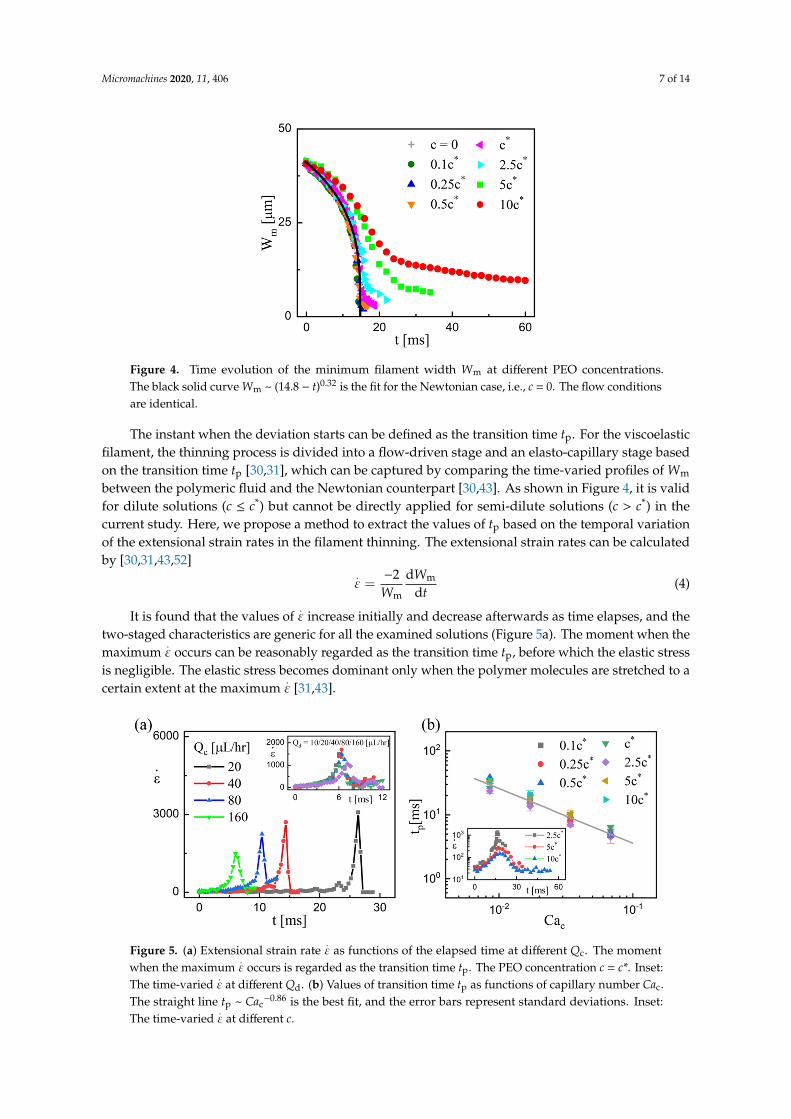
It is found that the values of ε increase initially and decrease afterwards as time elapses, and the two-staged characteristics are generic for all the examined solutions (Figure 5a). The moment when the maximum ε occurs can be reasonably regarded as the transition time tp, before which the elastic stress is negligible. The elastic stress becomes dominant only when the polymer molecules are stretched to a certain extent at the maximum ε [31,43].
Figure 5. (a) Extensional strain rate as functions of the elapsed time at different Qc. The moment when the maximum ε occurs is regarded as the transition time tp. The PEO concentration c = c*. Inset: The time-varied at different Qd. (b) Values of transition time tp as functions of capillary number Cac. The straight line tp ~ Cac-0.86 is the best fit, and the error bars represent standard deviations. Inset: The time-varied at different c.
Figure 4. Time evolution of the minimum filament width Wm at different PEO concentrations.The black solid curve Wm ~ (14.8 − t)0.32 is the fit for the Newtonian case, i.e., c = 0. The flow conditionsare identical.
The instant when the deviation starts can be defined as the transition time tp. For the viscoelasticfilament, the thinning process is divided into a flow-driven stage and an elasto-capillary stage basedon the transition time tp [30,31], which can be captured by comparing the time-varied profiles of Wm
between the polymeric fluid and the Newtonian counterpart [30,43]. As shown in Figure 4, it is validfor dilute solutions (c ≤ c*) but cannot be directly applied for semi-dilute solutions (c > c*) in thecurrent study. Here, we propose a method to extract the values of tp based on the temporal variationof the extensional strain rates in the filament thinning. The extensional strain rates can be calculatedby [30,31,43,52]
.ε =
−2Wm
dWm
dt(4)
It is found that the values of.ε increase initially and decrease afterwards as time elapses, and the
two-staged characteristics are generic for all the examined solutions (Figure 5a). The moment when themaximum
.ε occurs can be reasonably regarded as the transition time tp, before which the elastic stress
is negligible. The elastic stress becomes dominant only when the polymer molecules are stretched to acertain extent at the maximum
.ε [31,43].
Micromachines 2020, 11, x FOR PEER REVIEW 7 of 14
Figure 4. Time evolution of the minimum filament width Wm at different PEO concentrations. The black solid curve Wm ~ (14.8 − t)0.32 is the fit for the Newtonian case, i.e., c = 0. The flow conditions are identical.
The instant when the deviation starts can be defined as the transition time tp. For the viscoelastic filament, the thinning process is divided into a flow-driven stage and an elasto-capillary stage based on the transition time tp [30,31], which can be captured by comparing the time-varied profiles of Wm between the polymeric fluid and the Newtonian counterpart [30,43]. As shown in Figure 4, it is valid for dilute solutions (c ≤ c*) but cannot be directly applied for semi-dilute solutions (c > c*) in the current study. Here, we propose a method to extract the values of tp based on the temporal variation of the extensional strain rates in the filament thinning. The extensional strain rates can be calculated by [30,31,43,52]
m
m
d2=dW
W tε − (4)
It is found that the values of ε increase initially and decrease afterwards as time elapses, and the two-staged characteristics are generic for all the examined solutions (Figure 5a). The moment when the maximum ε occurs can be reasonably regarded as the transition time tp, before which the elastic stress is negligible. The elastic stress becomes dominant only when the polymer molecules are stretched to a certain extent at the maximum ε [31,43].
Figure 5. (a) Extensional strain rate as functions of the elapsed time at different Qc. The moment when the maximum ε occurs is regarded as the transition time tp. The PEO concentration c = c*. Inset: The time-varied at different Qd. (b) Values of transition time tp as functions of capillary number Cac. The straight line tp ~ Cac-0.86 is the best fit, and the error bars represent standard deviations. Inset: The time-varied at different c.
Figure 5. (a) Extensional strain rate.ε as functions of the elapsed time at different Qc. The moment
when the maximum.ε occurs is regarded as the transition time tp. The PEO concentration c = c*. Inset:
The time-varied.ε at different Qd. (b) Values of transition time tp as functions of capillary number Cac.
The straight line tp ~ Cac−0.86 is the best fit, and the error bars represent standard deviations. Inset:
The time-varied.ε at different c.
Micromachines 2020, 11, 406 8 of 14
Figure 5a shows the extensional strain rate.ε as a function of the elapsed time at different flow
rates of continuous phase Qc, and the variation of.ε at various flow rates of dispersed phase Qd
(inset). It is clear that the transition time tp inversely depends on Qc but is almost independent of Qd.Conceivably, the increasing Qc can accelerate the rate of droplet generation, in which the requiredtime for individual filament thinning deceases. The transition time tp decreases as a consequence.In contrast, the increasing Qd always enhances the droplet size but hardly affects the generation rate,thus imposing a negligible effect on tp. In addition, although the time evolution curves of Wm atdifferent PEO concentrations are different (Figure 4), the transition time tp varies slightly as the PEOconcentration increases (inset in Figure 5b). By analyzing all the experimentally captured values of tp,the relation of Qc and tp can be established, as shown in Figure 5b. The dimensionless parameter Cac
(proportional to Qc) is introduced to fit the relation tp ~ Cac−0.86.
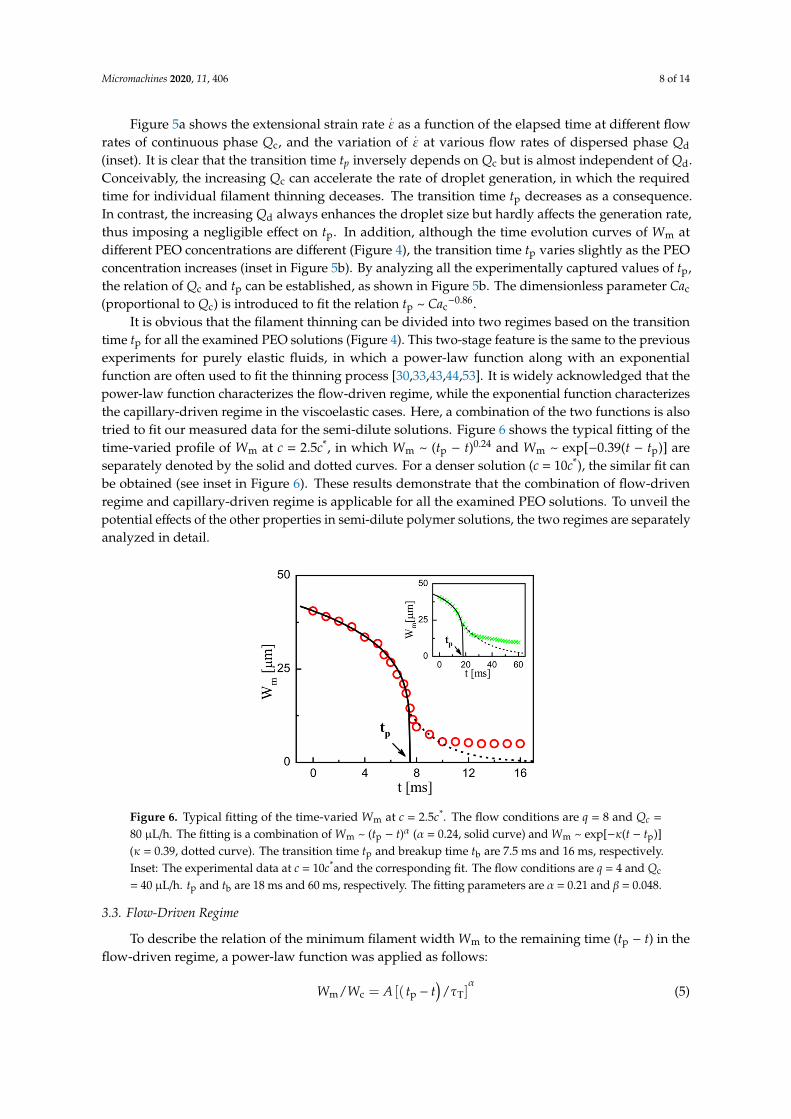
It is obvious that the filament thinning can be divided into two regimes based on the transitiontime tp for all the examined PEO solutions (Figure 4). This two-stage feature is the same to the previousexperiments for purely elastic fluids, in which a power-law function along with an exponentialfunction are often used to fit the thinning process [30,33,43,44,53]. It is widely acknowledged that thepower-law function characterizes the flow-driven regime, while the exponential function characterizesthe capillary-driven regime in the viscoelastic cases. Here, a combination of the two functions is alsotried to fit our measured data for the semi-dilute solutions. Figure 6 shows the typical fitting of thetime-varied profile of Wm at c = 2.5c*, in which Wm ~ (tp − t)0.24 and Wm ~ exp[−0.39(t − tp)] areseparately denoted by the solid and dotted curves. For a denser solution (c = 10c*), the similar fit canbe obtained (see inset in Figure 6). These results demonstrate that the combination of flow-drivenregime and capillary-driven regime is applicable for all the examined PEO solutions. To unveil thepotential effects of the other properties in semi-dilute polymer solutions, the two regimes are separatelyanalyzed in detail.
Micromachines 2020, 11, x FOR PEER REVIEW 8 of 14
Figure 5a shows the extensional strain rate as a function of the elapsed time at different flow rates of continuous phase Qc, and the variation of ε at various flow rates of dispersed phase Qd (inset). It is clear that the transition time tp inversely depends on Qc but is almost independent of Qd. Conceivably, the increasing Qc can accelerate the rate of droplet generation, in which the required time for individual filament thinning deceases. The transition time tp decreases as a consequence. In contrast, the increasing Qd always enhances the droplet size but hardly affects the generation rate, thus imposing a negligible effect on tp. In addition, although the time evolution curves of Wm at different PEO concentrations are different (Figure 4), the transition time tp varies slightly as the PEO concentration increases (inset in Figure 5b). By analyzing all the experimentally captured values of tp, the relation of Qc and tp can be established, as shown in Figure 5b. The dimensionless parameter Cac (proportional to Qc) is introduced to fit the relation tp ~ Cac−0.86.
It is obvious that the filament thinning can be divided into two regimes based on the transition time tp for all the examined PEO solutions (Figure 4). This two-stage feature is the same to the previous experiments for purely elastic fluids, in which a power-law function along with an exponential function are often used to fit the thinning process [30,33,43,44,53]. It is widely acknowledged that the power-law function characterizes the flow-driven regime, while the exponential function characterizes the capillary-driven regime in the viscoelastic cases. Here, a combination of the two functions is also tried to fit our measured data for the semi-dilute solutions. Figure 6 shows the typical fitting of the time-varied profile of Wm at c = 2.5c*, in which Wm ~ (tp − t)0.24 and Wm ~ exp[−0.39(t − tp)] are separately denoted by the solid and dotted curves. For a denser solution (c = 10c*), the similar fit can be obtained (see inset in Figure 6). These results demonstrate that the combination of flow-driven regime and capillary-driven regime is applicable for all the examined PEO solutions. To unveil the potential effects of the other properties in semi-dilute polymer solutions, the two regimes are separately analyzed in detail.
Figure 6. Typical fitting of the time-varied Wm at c = 2.5c*. The flow conditions are q = 8 and Qc = 80 μL/h. The fitting is a combination of Wm ~ (tp − t)α (α = 0.24, solid curve) and Wm ~ exp[−κ(t − tp)] (κ = 0.39, dotted curve). The transition time tp and breakup time tb are 7.5 ms and 16 ms, respectively. Inset: The experimental data at c = 10c*and the corresponding fit. The flow conditions are q = 4 and Qc = 40 μL/h. tp and tb are 18 ms and 60 ms, respectively. The fitting parameters are α = 0.21 and β = 0.048.
3.3. Flow-Driven Regime
To describe the relation of the minimum filament width Wm to the remaining time (tp − t) in the flow-driven regime, a power-law function was applied as follows:
m c p T/ = [( ) / ]W W A t t ατ− (5)
where Wc is the channel width and τT = ηdWc/σ is the characteristic viscous time, and they are used to build the dimensionless quantity. Figure 7 shows the experimental data and the corresponding fits.
Figure 6. Typical fitting of the time-varied Wm at c = 2.5c*. The flow conditions are q = 8 and Qc =
80 µL/h. The fitting is a combination of Wm ~ (tp − t)α (α = 0.24, solid curve) and Wm ~ exp[−κ(t − tp)](κ = 0.39, dotted curve). The transition time tp and breakup time tb are 7.5 ms and 16 ms, respectively.Inset: The experimental data at c = 10c*and the corresponding fit. The flow conditions are q = 4 and Qc
= 40 µL/h. tp and tb are 18 ms and 60 ms, respectively. The fitting parameters are α = 0.21 and β = 0.048.
3.3. Flow-Driven Regime
To describe the relation of the minimum filament width Wm to the remaining time (tp − t) in theflow-driven regime, a power-law function was applied as follows:
Wm/Wc = A [( tp − t)
/τT]α
(5)
Micromachines 2020, 11, 406 9 of 14
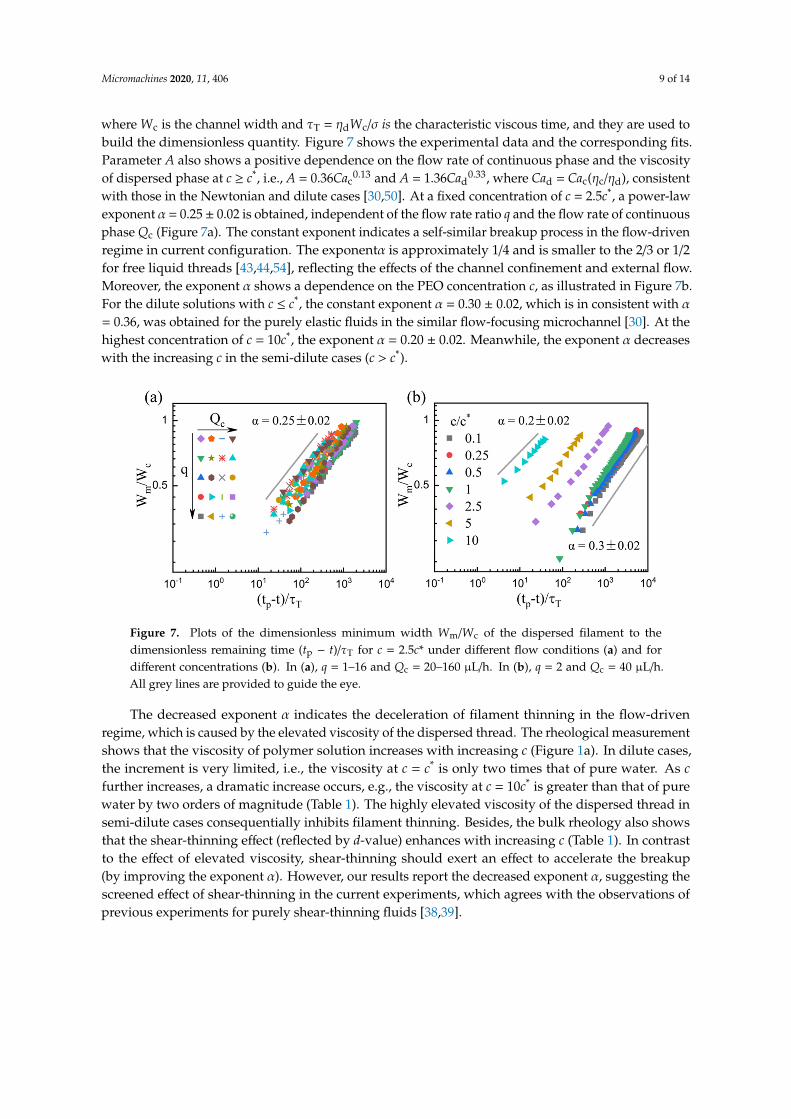
where Wc is the channel width and τT = ηdWc/σ is the characteristic viscous time, and they are used tobuild the dimensionless quantity. Figure 7 shows the experimental data and the corresponding fits.Parameter A also shows a positive dependence on the flow rate of continuous phase and the viscosityof dispersed phase at c ≥ c*, i.e., A = 0.36Cac
0.13 and A = 1.36Cad0.33, where Cad = Cac(ηc/ηd), consistent
with those in the Newtonian and dilute cases [30,50]. At a fixed concentration of c = 2.5c*, a power-lawexponent α = 0.25 ± 0.02 is obtained, independent of the flow rate ratio q and the flow rate of continuousphase Qc (Figure 7a). The constant exponent indicates a self-similar breakup process in the flow-drivenregime in current configuration. The exponentα is approximately 1/4 and is smaller to the 2/3 or 1/2for free liquid threads [43,44,54], reflecting the effects of the channel confinement and external flow.Moreover, the exponent α shows a dependence on the PEO concentration c, as illustrated in Figure 7b.For the dilute solutions with c ≤ c*, the constant exponent α = 0.30 ± 0.02, which is in consistent with α= 0.36, was obtained for the purely elastic fluids in the similar flow-focusing microchannel [30]. At thehighest concentration of c = 10c*, the exponent α = 0.20 ± 0.02. Meanwhile, the exponent α decreaseswith the increasing c in the semi-dilute cases (c > c*).
Micromachines 2020, 11, x FOR PEER REVIEW 9 of 14
Parameter A also shows a positive dependence on the flow rate of continuous phase and the viscosity of dispersed phase at c ≥ c*, i.e., A = 0.36Cac0.13 and A = 1.36Cad0.33, where Cad = Cac(ηc/ηd), consistent with those in the Newtonian and dilute cases [30,50]. At a fixed concentration of c = 2.5c*, a power-law exponent α = 0.25 ± 0.02 is obtained, independent of the flow rate ratio q and the flow rate of continuous phase Qc (Figure 7a). The constant exponent indicates a self-similar breakup process in the flow-driven regime in current configuration. The exponentα is approximately 1/4 and is smaller to the 2/3 or 1/2 for free liquid threads [43,44,54], reflecting the effects of the channel confinement and external flow. Moreover, the exponent α shows a dependence on the PEO concentration c, as illustrated in Figure 7b. For the dilute solutions with c ≤ c*, the constant exponent α = 0.30 ± 0.02, which is in consistent with α = 0.36, was obtained for the purely elastic fluids in the similar flow-focusing microchannel [30]. At the highest concentration of c = 10c*, the exponent α = 0.20 ± 0.02. Meanwhile, the exponent α decreases with the increasing c in the semi-dilute cases (c > c*).
Figure 7. Plots of the dimensionless minimum width Wm/Wc of the dispersed filament to the dimensionless remaining time (tp − t)/τT for c = 2.5c* under different flow conditions (a) and for different concentrations (b). In (a), q = 1–16 and Qc = 20–160 μL/h. In (b), q = 2 and Qc = 40 μL/h. All grey lines are provided to guide the eye.
The decreased exponent α indicates the deceleration of filament thinning in the flow-driven regime, which is caused by the elevated viscosity of the dispersed thread. The rheological measurement shows that the viscosity of polymer solution increases with increasing c (Figure 1a). In dilute cases, the increment is very limited, i.e., the viscosity at c = c* is only two times that of pure water. As c further increases, a dramatic increase occurs, e.g., the viscosity at c = 10c* is greater than that of pure water by two orders of magnitude (Table 1). The highly elevated viscosity of the dispersed thread in semi-dilute cases consequentially inhibits filament thinning. Besides, the bulk rheology also shows that the shear-thinning effect (reflected by d-value) enhances with increasing c (Table 1). In contrast to the effect of elevated viscosity, shear-thinning should exert an effect to accelerate the breakup (by improving the exponent α). However, our results report the decreased exponent α, suggesting the screened effect of shear-thinning in the current experiments, which agrees with the observations of previous experiments for purely shear-thinning fluids [38,39].
3.4. Capillary-Driven Regime
In the capillary-driven regime with t > tp, the relationship between dimensionless minimum filament width Wm/Wc to dimensionless remaining time (t − tp)/τT can be depicted by an exponential function:
m c p T/ exp[ ( ) / ]W W t tκ τ∝ − (6)
Figure 8a shows the experimental data at various PEO concentrations, which suggests that the exponential decay is genetic in both dilute and semi-dilute cases. The results are also in line with
Figure 7. Plots of the dimensionless minimum width Wm/Wc of the dispersed filament to thedimensionless remaining time (tp − t)/τT for c = 2.5c* under different flow conditions (a) and fordifferent concentrations (b). In (a), q = 1–16 and Qc = 20–160 µL/h. In (b), q = 2 and Qc = 40 µL/h.All grey lines are provided to guide the eye.
The decreased exponent α indicates the deceleration of filament thinning in the flow-drivenregime, which is caused by the elevated viscosity of the dispersed thread. The rheological measurementshows that the viscosity of polymer solution increases with increasing c (Figure 1a). In dilute cases,the increment is very limited, i.e., the viscosity at c = c* is only two times that of pure water. As cfurther increases, a dramatic increase occurs, e.g., the viscosity at c = 10c* is greater than that of purewater by two orders of magnitude (Table 1). The highly elevated viscosity of the dispersed thread insemi-dilute cases consequentially inhibits filament thinning. Besides, the bulk rheology also showsthat the shear-thinning effect (reflected by d-value) enhances with increasing c (Table 1). In contrastto the effect of elevated viscosity, shear-thinning should exert an effect to accelerate the breakup(by improving the exponent α). However, our results report the decreased exponent α, suggesting thescreened effect of shear-thinning in the current experiments, which agrees with the observations ofprevious experiments for purely shear-thinning fluids [38,39].

Micromachines 2020, 11, 406 10 of 14
3.4. Capillary-Driven Regime
In the capillary-driven regime with t > tp, the relationship between dimensionless minimumfilament width Wm/Wc to dimensionless remaining time (t − tp)/τT can be depicted by an exponentialfunction:
Wm/Wc ∝ exp[κ(t− tp)/τT] (6)
Figure 8a shows the experimental data at various PEO concentrations, which suggests that theexponential decay is genetic in both dilute and semi-dilute cases. The results are also in line with thosefor purely elastic fluids in previous experiments [30,33,35,43]. Moreover, the values of parameter κbarely depend on the flow conditions, as demonstrated in Figure 8b. Recalling the previous theory,the exponential regime for high viscosity elastic fluids based on the balance between elastic andcapillary forces follows the function [19,43,54]
Wm/Wc ∝ exp[−(t− tp)/3λE] (7)
where λE is the extensional relaxation time. The relation λE = −τT/(3κ) can be derived and the valuesof λE for all the examined solutions can be calculated. The latent distinction between dilute andsemi-dilute cases could be acquired by the analysis of λE.
Micromachines 2020, 11, x FOR PEER REVIEW 10 of 14
those for purely elastic fluids in previous experiments [30,33,35,43]. Moreover, the values of parameter κ barely depend on the flow conditions, as demonstrated in Figure 8b. Recalling the previous theory, the exponential regime for high viscosity elastic fluids based on the balance between elastic and capillary forces follows the function [19,43,54]
m c p E/ exp[ ( ) /3 ]W W t t λ∝ − − (7)
where λE is the extensional relaxation time. The relation λE = −τT/(3κ) can be derived and the values of λE for all the examined solutions can be calculated. The latent distinction between dilute and semi-dilute cases could be acquired by the analysis of λE.
Figure 8. Plot of the dimensionless minimum width Wm/Wc of the dispersed filament to the dimensionless shifted time (t − tp)/τT at (a) various c; and (b) c = 5c*. In (a), q = 8 and Qc = 80 μL/h. In (b), Qc = 80 μL/h. Inset: c = 0.5c* and Qd = 10 μL/h.
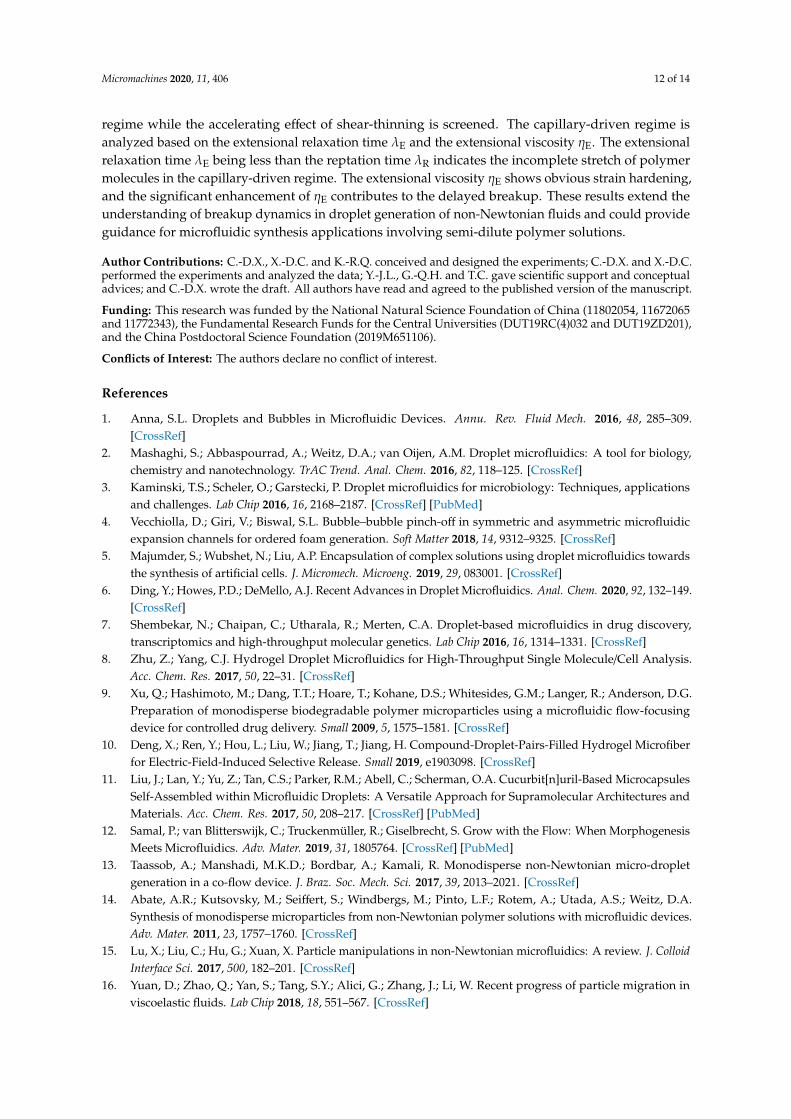
Figure 9a shows the estimated values of extensional relaxation time λE for all the examined solutions. For the dilute solutions, i.e., c ≤ c*, the λE values are several times greater than the Zimm relaxation time λZ (dotted line in Figure 9a), which agrees with the findings of previous similar experiments [33]. Due to the microchannel confinements and the continuous phase flow, these estimated λE values are generally smaller than those captured in the pinch-off experiments of free surface fluid [33,43,44]. For the semi-dilute solutions, i.e., c > c*, the estimated λE shows similar c-dependence (λE ~ c1.6) with the reptation time λR (λR ~ c1.5), while the λE values are obviously smaller than λR. These smaller λE values indicate the incomplete stretch of polymer molecules in the capillary-driven regime. This coincides with the result that the coil-stretch transition becomes milder for more concentrated polymer solutions in both macroscopic and microscopic extensional flows [44,55]. Moreover, the accumulated strain or Hencky strain ε can be calculated as ε = 2ln(W0/Wt), [35,52] where Wt denotes the time-varied Wm. It is thus found that the maximum strain εmax = [4.5–6] at c = 0.1c*, while εmax = [1–2] at c =10c*. This contrast supports the claim of incomplete stretch in the semi-dilute solutions.
Figure 8. Plot of the dimensionless minimum width Wm/Wc of the dispersed filament to thedimensionless shifted time (t − tp)/τT at (a) various c; and (b) c = 5c*. In (a), q = 8 and Qc =
80 µL/h. In (b), Qc = 80 µL/h. Inset: c = 0.5c* and Qd = 10 µL/h.
Figure 9a shows the estimated values of extensional relaxation time λE for all the examinedsolutions. For the dilute solutions, i.e., c ≤ c*, the λE values are several times greater than the Zimmrelaxation time λZ (dotted line in Figure 9a), which agrees with the findings of previous similarexperiments [33]. Due to the microchannel confinements and the continuous phase flow, theseestimated λE values are generally smaller than those captured in the pinch-off experiments of freesurface fluid [33,43,44]. For the semi-dilute solutions, i.e., c > c*, the estimated λE shows similarc-dependence (λE ~ c1.6) with the reptation time λR (λR ~ c1.5), while the λE values are obviouslysmaller than λR. These smaller λE values indicate the incomplete stretch of polymer molecules in thecapillary-driven regime. This coincides with the result that the coil-stretch transition becomes milderfor more concentrated polymer solutions in both macroscopic and microscopic extensional flows [44,55].Moreover, the accumulated strain or Hencky strain ε can be calculated as ε = 2ln(W0/Wt), [35,52]where Wt denotes the time-varied Wm. It is thus found that the maximum strain εmax = [4.5–6] at c= 0.1c*, while εmax = [1–2] at c = 10c*. This contrast supports the claim of incomplete stretch in thesemi-dilute solutions.
Micromachines 2020, 11, 406 11 of 14Micromachines 2020, 11, x FOR PEER REVIEW 11 of 14
Figure 9. Results of extensional relaxation time λE and extensional viscosity ηE. (a) Variation of extensional relaxation time values λE with PEO concentrations. The grey line represents the predicted values for reptation time λR, and the grey dashed line represents the predicted values for the Zimm relaxation time λZ. (b) Evolution of extensional viscosity ηE with Hencky strain ε at c = 5c*.
It is speculated that the incomplete stretch is due to the dense network structures in the semi-dilute solutions. According to the blob theory [45,47], each PEO molecule forms a blob when c is below c* and all the blobs do not contact with each other. As c increases above c*, blobs overlap with each other to form the networks and the network structures become denser with increasing polymer concentrations. For dilute polymer solutions, individual polymer blobs can be highly stretched in the filament. For semi-dilute polymer solutions, the networks are stretched as a whole and the individual polymer chains are just partially stretched, resulting in the lower strain ε, as stated above.
Furthermore, the extensional viscosity is introduced due to the polymer stretch. The extensional viscosity ηE is finally examined, which is calculated using the formula [30,44]
Et m
=2d / dW W t
σ σηε
=− (8)
Figure 9b illustrates the variation of extensional viscosity ηE with an increasing Hencky strain ε at c = 5c*. The extensional viscosity ηE increases with the strain ε, indicating the obvious strain hardening that has been reported in both macroscopic [53,54] and other microscopic experiments [30,31,33]. The absolute values of ηE are two to three orders of magnitude greater than their zero-shear viscosity η0, and this enhancement contributes to the delayed breakup. In the final stage, the filament further elongates and thins nearly linearly with time (Figures 4 and 6). The last regime allows the measurement of terminal steady extensional viscosity, which would be reached before all the chains are completely stretched out [44,56]. It is predicted that the final regime is maintained by the competitive effect between the continued stretch of the polymer chains and the drainage of the dispersed filament. This mechanism needs to be further validated by studying the polymer dynamics in the filament in the future work.
4. Conclusions
In summary, we experimentally investigate the filament breakup in droplet generation of semi-dilute PEO solutions in a flow-focusing microchannel. The breakup morphology of semi-dilute PEO solutions is analogous to that in dilute cases, which falls into a universal temporal profile in combination with a flow-driven regime and a capillary-driven regime. The transition time tp dividing the two regimes is extracted based on the temporal variation of the extensional strain rates. The power-law exponent α characterizing the flow-driven regime in semi-dilute cases is smaller than that in dilute cases and decreases with increasing PEO concentration. It is ascertained that the highly elevated viscosity of the semi-dilute solution decelerates the filament thinning in the flow-driven
Figure 9. Results of extensional relaxation time λE and extensional viscosity ηE. (a) Variation ofextensional relaxation time values λE with PEO concentrations. The grey line represents the predictedvalues for reptation time λR, and the grey dashed line represents the predicted values for the Zimmrelaxation time λZ. (b) Evolution of extensional viscosity ηE with Hencky strain ε at c = 5c*.
It is speculated that the incomplete stretch is due to the dense network structures in the semi-dilutesolutions. According to the blob theory [45,47], each PEO molecule forms a blob when c is belowc* and all the blobs do not contact with each other. As c increases above c*, blobs overlap witheach other to form the networks and the network structures become denser with increasing polymerconcentrations. For dilute polymer solutions, individual polymer blobs can be highly stretched in thefilament. For semi-dilute polymer solutions, the networks are stretched as a whole and the individualpolymer chains are just partially stretched, resulting in the lower strain ε, as stated above.
Furthermore, the extensional viscosity is introduced due to the polymer stretch. The extensionalviscosity ηE is finally examined, which is calculated using the formula [30,44]
ηE =σ
.εWt
=σ
−2dWm/dt(8)
Figure 9b illustrates the variation of extensional viscosity ηE with an increasing Hencky strain ε atc = 5c*. The extensional viscosity ηE increases with the strain ε, indicating the obvious strain hardeningthat has been reported in both macroscopic [53,54] and other microscopic experiments [30,31,33].The absolute values of ηE are two to three orders of magnitude greater than their zero-shear viscosityη0, and this enhancement contributes to the delayed breakup. In the final stage, the filament furtherelongates and thins nearly linearly with time (Figures 4 and 6). The last regime allows the measurementof terminal steady extensional viscosity, which would be reached before all the chains are completelystretched out [44,56]. It is predicted that the final regime is maintained by the competitive effectbetween the continued stretch of the polymer chains and the drainage of the dispersed filament.This mechanism needs to be further validated by studying the polymer dynamics in the filament in thefuture work.
4. Conclusions
In summary, we experimentally investigate the filament breakup in droplet generation ofsemi-dilute PEO solutions in a flow-focusing microchannel. The breakup morphology of semi-dilutePEO solutions is analogous to that in dilute cases, which falls into a universal temporal profilein combination with a flow-driven regime and a capillary-driven regime. The transition time tp
dividing the two regimes is extracted based on the temporal variation of the extensional strain rates.The power-law exponent α characterizing the flow-driven regime in semi-dilute cases is smaller thanthat in dilute cases and decreases with increasing PEO concentration. It is ascertained that the highlyelevated viscosity of the semi-dilute solution decelerates the filament thinning in the flow-driven
Micromachines 2020, 11, 406 12 of 14
regime while the accelerating effect of shear-thinning is screened. The capillary-driven regime isanalyzed based on the extensional relaxation time λE and the extensional viscosity ηE. The extensionalrelaxation time λE being less than the reptation time λR indicates the incomplete stretch of polymermolecules in the capillary-driven regime. The extensional viscosity ηE shows obvious strain hardening,and the significant enhancement of ηE contributes to the delayed breakup. These results extend theunderstanding of breakup dynamics in droplet generation of non-Newtonian fluids and could provideguidance for microfluidic synthesis applications involving semi-dilute polymer solutions.
Author Contributions: C.-D.X., X.-D.C. and K.-R.Q. conceived and designed the experiments; C.-D.X. and X.-D.C.performed the experiments and analyzed the data; Y.-J.L., G.-Q.H. and T.C. gave scientific support and conceptualadvices; and C.-D.X. wrote the draft. All authors have read and agreed to the published version of the manuscript.
Funding: This research was funded by the National Natural Science Foundation of China (11802054, 11672065and 11772343), the Fundamental Research Funds for the Central Universities (DUT19RC(4)032 and DUT19ZD201),and the China Postdoctoral Science Foundation (2019M651106).
Conflicts of Interest: The authors declare no conflict of interest.
References
1. Anna, S.L. Droplets and Bubbles in Microfluidic Devices. Annu. Rev. Fluid Mech. 2016, 48, 285–309.[CrossRef]
2. Mashaghi, S.; Abbaspourrad, A.; Weitz, D.A.; van Oijen, A.M. Droplet microfluidics: A tool for biology,chemistry and nanotechnology. TrAC Trend. Anal. Chem. 2016, 82, 118–125. [CrossRef]
3. Kaminski, T.S.; Scheler, O.; Garstecki, P. Droplet microfluidics for microbiology: Techniques, applicationsand challenges. Lab Chip 2016, 16, 2168–2187. [CrossRef] [PubMed]
4. Vecchiolla, D.; Giri, V.; Biswal, S.L. Bubble–bubble pinch-off in symmetric and asymmetric microfluidicexpansion channels for ordered foam generation. Soft Matter 2018, 14, 9312–9325. [CrossRef]
5. Majumder, S.; Wubshet, N.; Liu, A.P. Encapsulation of complex solutions using droplet microfluidics towardsthe synthesis of artificial cells. J. Micromech. Microeng. 2019, 29, 083001. [CrossRef]
6. Ding, Y.; Howes, P.D.; DeMello, A.J. Recent Advances in Droplet Microfluidics. Anal. Chem. 2020, 92, 132–149.[CrossRef]
7. Shembekar, N.; Chaipan, C.; Utharala, R.; Merten, C.A. Droplet-based microfluidics in drug discovery,transcriptomics and high-throughput molecular genetics. Lab Chip 2016, 16, 1314–1331. [CrossRef]
8. Zhu, Z.; Yang, C.J. Hydrogel Droplet Microfluidics for High-Throughput Single Molecule/Cell Analysis.Acc. Chem. Res. 2017, 50, 22–31. [CrossRef]
9. Xu, Q.; Hashimoto, M.; Dang, T.T.; Hoare, T.; Kohane, D.S.; Whitesides, G.M.; Langer, R.; Anderson, D.G.Preparation of monodisperse biodegradable polymer microparticles using a microfluidic flow-focusingdevice for controlled drug delivery. Small 2009, 5, 1575–1581. [CrossRef]
10. Deng, X.; Ren, Y.; Hou, L.; Liu, W.; Jiang, T.; Jiang, H. Compound-Droplet-Pairs-Filled Hydrogel Microfiberfor Electric-Field-Induced Selective Release. Small 2019, e1903098. [CrossRef]
11. Liu, J.; Lan, Y.; Yu, Z.; Tan, C.S.; Parker, R.M.; Abell, C.; Scherman, O.A. Cucurbit[n]uril-Based MicrocapsulesSelf-Assembled within Microfluidic Droplets: A Versatile Approach for Supramolecular Architectures andMaterials. Acc. Chem. Res. 2017, 50, 208–217. [CrossRef] [PubMed]
12. Samal, P.; van Blitterswijk, C.; Truckenmüller, R.; Giselbrecht, S. Grow with the Flow: When MorphogenesisMeets Microfluidics. Adv. Mater. 2019, 31, 1805764. [CrossRef] [PubMed]
13. Taassob, A.; Manshadi, M.K.D.; Bordbar, A.; Kamali, R. Monodisperse non-Newtonian micro-dropletgeneration in a co-flow device. J. Braz. Soc. Mech. Sci. 2017, 39, 2013–2021. [CrossRef]
14. Abate, A.R.; Kutsovsky, M.; Seiffert, S.; Windbergs, M.; Pinto, L.F.; Rotem, A.; Utada, A.S.; Weitz, D.A.Synthesis of monodisperse microparticles from non-Newtonian polymer solutions with microfluidic devices.Adv. Mater. 2011, 23, 1757–1760. [CrossRef]
15. Lu, X.; Liu, C.; Hu, G.; Xuan, X. Particle manipulations in non-Newtonian microfluidics: A review. J. ColloidInterface Sci. 2017, 500, 182–201. [CrossRef]
16. Yuan, D.; Zhao, Q.; Yan, S.; Tang, S.Y.; Alici, G.; Zhang, J.; Li, W. Recent progress of particle migration inviscoelastic fluids. Lab Chip 2018, 18, 551–567. [CrossRef]
Micromachines 2020, 11, 406 13 of 14
17. Wagner, C.; Amarouchene, Y.; Bonn, D.; Eggers, J. Droplet detachment and satellite bead formation inviscoelastic fluids. Phys. Rev. Lett. 2005, 95, 164504. [CrossRef]
18. Clasen, C.; Eggers, J.; Fontelos, M.A.; Li, J.I.E.; McKinley, G.H. The beads-on-string structure of viscoelasticthreads. J. Fluid Mech. 2006, 556, 283. [CrossRef]
19. Anna, S.L.; McKinley, G.H. Elasto-capillary thinning and breakup of model elastic liquids. J. Rheol. 2001, 45,115–138. [CrossRef]
20. Rodd, L.E.; Scott, T.P.; Cooper-White, J.J.; McKinley, G.H. Capillary Break-up Rheometry of Low-ViscosityElastic Fluids. Appl. Rheol. 2005, 15, 12–27. [CrossRef]
21. Arnolds, O.; Buggisch, H.; Sachsenheimer, D.; Willenbacher, N. Capillary breakup extensional rheometry(CaBER) on semi-dilute and concentrated polyethyleneoxide (PEO) solutions. Rheol. Acta 2010, 49, 1207–1217.[CrossRef]
22. Del Giudice, F.; D’Avino, G.; Greco, F.; De Santo, I.; Netti, P.A.; Maffettone, P.L. Rheometry-on-a-chip:Measuring the relaxation time of a viscoelastic liquid through particle migration in microchannel flows.Lab Chip 2015, 15, 783–792. [CrossRef] [PubMed]
23. Christopher, G.F.; Anna, S.L. Microfluidic methods for generating continuous droplet streams. J. Phys. DAppl. Phys. 2007, 40, R319–R336. [CrossRef]
24. van Hoeve, W.; Dollet, B.; Versluis, M.; Lohse, D. Microbubble formation and pinch-off scaling exponent inflow-focusing devices. Phys. Fluids 2011, 23, 092001. [CrossRef]
25. Chen, X.; Xue, C.; Hu, G. Confinements regulate capillary instabilities of fluid threads. J. Fluid Mech. 2019,873, 816–834. [CrossRef]
26. Carneiro, J.; Doutel, E.; Campos, J.B.L.M.; Miranda, J.M. PDMS droplet formation and characterization byhydrodynamic flow focusing technique in a PDMS square microchannel. J. Micromech. Microeng. 2016, 26,105013. [CrossRef]
27. Derzsi, L.; Kasprzyk, M.; Plog, J.P.; Garstecki, P. Flow focusing with viscoelastic liquids. Phys. Fluids 2013, 25,092001. [CrossRef]
28. Ren, Y.; Liu, Z.; Shum, H.C. Breakup dynamics and dripping-to-jetting transition in a Newtonian/shear-thinning multiphase microsystem. Lab Chip 2015, 15, 121–134. [CrossRef]
29. Dinic, J.; Sharma, V. Computational analysis of self-similar capillary-driven thinning and pinch-off dynamicsduring dripping using the volume-of-fluid method. Phys. Fluids 2019, 31, 021211. [CrossRef]
30. Du, W.; Fu, T.; Zhang, Q.; Zhu, C.; Ma, Y.; Li, H.Z. Breakup dynamics for droplet formation in a flow-focusingdevice: Rupture position of viscoelastic thread from matrix. Chem. Eng. Sci. 2016, 153, 255–269. [CrossRef]
31. Arratia, P.E.; Gollub, J.P.; Durian, D.J. Polymeric filament thinning and breakup in microchannels. Phys. Rev.E Stat. Nonlin. Soft Matter Phys. 2008, 77, 036309. [CrossRef] [PubMed]
32. Garstecki, P.; Stone, H.A.; Whitesides, G.M. Mechanism for flow-rate controlled breakup in confinedgeometries: A route to monodisperse emulsions. Phys. Rev. Lett. 2005, 94, 164501. [CrossRef] [PubMed]
33. Steinhaus, B.; Shen, A.Q.; Sureshkumar, R. Dynamics of viscoelastic fluid filaments in microfluidic devices.Phys. Fluids 2007, 19, 073103. [CrossRef]
34. Du, W.; Fu, T.; Zhang, Q.; Zhu, C.; Ma, Y.; Li, H.Z. Self-similar breakup of viscoelastic thread for dropletformation in flow-focusing devices. AIChE J. 2017, 63, 5196–5206. [CrossRef]
35. Arratia, P.E.; Cramer, L.A.; Gollub, J.P.; Durian, D.J. The effects of polymer molecular weight on filamentthinning and drop breakup in microchannels. New J. Phys. 2009, 11, 115006. [CrossRef]
36. Lee, W.; Walker, L.M.; Anna, S.L. Competition Between Viscoelasticity and Surfactant Dynamics in FlowFocusing Microfluidics. Macromol. Mater. Eng. 2011, 296, 203–213. [CrossRef]
37. Dollet, B.; van Hoeve, W.; Raven, J.P.; Marmottant, P.; Versluis, M. Role of the channel geometry on thebubble pinch-off in flow-focusing devices. Phys. Rev. Lett. 2008, 100, 034504. [CrossRef]
38. Aytouna, M.; Paredes, J.; Shahidzadeh-Bonn, N.; Moulinet, S.; Wagner, C.; Amarouchene, Y.; Eggers, J.;Bonn, D. Drop formation in non-Newtonian fluids. Phys. Rev. Lett. 2013, 110, 034501. [CrossRef]
39. Du, W.; Fu, T.; Duan, Y.; Zhu, C.; Ma, Y.; Li, H.Z. Breakup dynamics for droplet formation in shear-thinningfluids in a flow-focusing device. Chem. Eng. Sci. 2018, 176, 66–76. [CrossRef]
40. Xue, C.; Zheng, X.; Chen, K.; Tian, Y.; Hu, G. Probing Non-Gaussianity in Confined Diffusion of Nanoparticles.J. Phys. Chem. Lett. 2016, 7, 514–519. [CrossRef]
41. Yasuda, K.; Armstrong, R.C.; Cohen, R.E. Shear flow properties of concentrated solutions of linear and starbranched polystyrenes. Rheol. Acta 1981, 20, 163–178. [CrossRef]
Micromachines 2020, 11, 406 14 of 14
42. Li, D.; Xuan, X. Fluid rheological effects on particle migration in a straight rectangular microchannel.Microfluid. Nanofluid. 2018, 22, 49. [CrossRef]
43. Tirtaatmadja, V.; McKinley, G.H.; Cooper-White, J.J. Drop formation and breakup of low viscosity elasticfluids: Effects of molecular weight and concentration. Phys. Fluids 2006, 18, 043101. [CrossRef]
44. Dinic, J.; Biagioli, M.; Sharma, V. Pinch-off dynamics and extensional relaxation times of intrinsicallysemi-dilute polymer solutions characterized by dripping-onto-substrate rheometry. J. Polym. Sci. Part BPolym. Phys. 2017, 55, 1692–1704. [CrossRef]
45. Rubinstein, M.; Colby, R.H. Polymer Physics; Oxford University Press: Oxford, UK, 2003.46. de Kort, D.W.; Rombouts, W.H.; Hoeben, F.J.M.; Janssen, H.M.; Van As, H.; van Duynhoven, J.P.M. Scaling
Behavior of Dendritic Nanoparticle Mobility in Semidilute Polymer Solutions. Macromolecules 2015, 48,7585–7591. [CrossRef]
47. de Gennes, P.-G. Scaling Concepts in Polymer Physics; Cornell University Press: Ithaca, NY, USA, 1979.48. Xue, C.; Chen, X.; Liu, C.; Hu, G. Lateral migration of dual droplet trains in a double spiral microchannel.
Sci. China Phys. Mech. 2016, 59. [CrossRef]49. Liu, C.; Xue, C.; Chen, X.; Shan, L.; Tian, Y.; Hu, G. Size-Based Separation of Particles and Cells Utilizing
Viscoelastic Effects in Straight Microchannels. Anal. Chem. 2015, 87, 6041–6048. [CrossRef]50. Fu, T.; Wu, Y.; Ma, Y.; Li, H.Z. Droplet formation and breakup dynamics in microfluidic flow-focusing
devices: From dripping to jetting. Chem. Eng. Sci. 2012, 84, 207–217. [CrossRef]51. Deblais, A.; Velikov, K.P.; Bonn, D. Pearling Instabilities of a Viscoelastic Thread. Phys. Rev. Lett. 2018, 120,
194501. [CrossRef]52. McKinley, G.H.; Sridhar, T. Filament-Stretching rheometry of complex fluids. Annu. Rev. Fluid Mech. 2002,
34, 375–415. [CrossRef]53. Dinic, J.; Zhang, Y.; Jimenez, L.N.; Sharma, V. Extensional Relaxation Times of Dilute, Aqueous Polymer
Solutions. ACS Macro Lett. 2015, 4, 804–808. [CrossRef]54. Dinic, J.; Jimenez, L.N.; Sharma, V. Pinch-off dynamics and dripping-onto-substrate (DoS) rheometry of
complex fluids. Lab Chip 2017, 17, 460–473. [CrossRef] [PubMed]55. Hsiao, K.-W.; Sasmal, C.; Ravi Prakash, J.; Schroeder, C.M. Direct observation of DNA dynamics in semidilute
solutions in extensional flow. J. Rheol. 2017, 61, 151–167. [CrossRef]56. Stelter, M.; Brenn, G.; Yarin, A.; Singh, R.; Durst, F. Investigation of the elongational behavior of polymer
solutions by means of an elongational rheometer. J. Rheol. 2002, 46, 507–527. [CrossRef]
© 2020 by the authors. Licensee MDPI, Basel, Switzerland. This article is an open accessarticle distributed under the terms and conditions of the Creative Commons Attribution(CC BY) license (http://creativecommons.org/licenses/by/4.0/).