Breakthrough Engineering for a better world.
196
IMI plc Annual Report & Accounts 2020 Breakthrough Engineering for a better world.
Transcript of Breakthrough Engineering for a better world.

IMI plc Annual Report & Accounts 2020
Breakthrough Engineering for a better world.

Our business has many strengths. First and foremost, we employ great people. We are renowned for delivering world-class engineering expertise to solve customers’ problems and deliver value for all our stakeholders. In addition, our operations and processes are amongst the very best.
We are a specialist engineering company that designs, manufactures and services highly engineered products that control the precise movement of fluids. We aim to deliver great solutions that tackle the most demanding engineering challenges. We help some of the world’s leading industrial companies operate their processes safely, sustainably, cleanly, efficiently and cost effectively. We operate through three divisions – IMI Precision Engineering, IMI Critical Engineering and IMI Hydronic Engineering – and employ around 10,000 people in over 50 countries around the world.
Find out more: www.imiplc.com
Roy TwiteChief Executive
COVERIMI Precision Engineering Palézieux, SwitzerlandCHIPSOL is a specialist solenoid valve that enables the provision of rapid patient treatment and local diagnostics.
IMI plc Annual Report & Accounts 2020
Breakthrough Engineering for a better world.

We deliver our sustainable, customer-focused solutions ever mindful of our responsibilities to our employees, our suppliers, our wider communities, and the environment. We also constantly reference and reinforce IMI’s core values throughout our business.
Our business model: Turn to page 12
Coronavirus response Chief Executive’s reviewBusiness modelStrategic reviewEnvironmental, Social & GovernanceOur stakeholdersOperational review – IMI PrecisionOperational review – IMI CriticalOperational review – IMI HydronicFinancial reviewKey Performance IndicatorsHow we manage riskViability and going concern statements
Board of DirectorsChairman’s governance letterCorporate Governance ReportAudit Committee ReportNominations Committee ReportStatement from the Chair of the Remuneration CommitteeDirectors’ Remuneration Policy ReportAnnual Directors’ Remuneration ReportDirectors’ ReportStatement of directors’ responsibilities
Independent Auditor’s ReportPrimary statementsNotes to the consolidated financial statements
Group overviewChairman’s statement
Introduction Strategic Report Corporate Governance Financial Statements
06081214
2844464850525658
64
6668707680
82
85
93108
114
116124
128
0204
Our purposeOur purpose is our reason for being. It’s what motivates us all and makes us proud to work for IMI.
Our visionOur vision explains more about how we want to achieve our purpose.
Breakthrough Engineering for a better world.
IMI will create tremendous value by solving key industry problems in attractive markets and working with the best.
Our values
A mindset where the customer is at the heart of everything we do.
Customer intimacyAccesses the diversity of IMI in every sense, whether this is the diversity of talent, knowledge and experience that we have with our people, or the different technologies, processes and end markets across our businesses.
One big teamA growth mindset that is open to innovation and learning.
Playing to winBeing true to who we are and doing the right thing at all times.
Integrity
Introduction Strategic Report Corporate Governance Financial Statements
01

Adjusted revenue by geography
Gender mix across the Group*
Revenue by division
1 Europe 44%2 Americas 30%3 Asia Pacific 21%4 Middle East & Africa 5%
* Including agency and contractors.
** Includes direct reports to the Executive.
1 IMI Precision Engineering 48%2 IMI Critical Engineering 35%3 IMI Hydronic Engineering 17%
4
3
2
1
3
2
1
Group overview
Female Female % Male Male %
Board 3 37% 5 63%
Executive 2 29% 5 71%
Senior managers**
95 18% 439 82%
Managers 200 19% 844 81%
All employees
3,011 28% 7,765 72%
» Resilient organic revenue 4% lower than 2019.
» Improved margins in all three divisions.
» Strong adjusted operating cash flow, up 12%.
» Structural rationalisation programmes delivering expected efficiency gains.
» Final dividend of 15.0p reflects previously announced reset of earnings cover baseline.
» Net debt / EBITDA improved to 0.8x (2019: 1.2x).
» Cultural shift progressing well with increased resource dedicated to growth.
» Strong customer and employee engagement throughout the Coronavirus pandemic.
2020 highlightsStatutory revenue
£1,825m
Adjusted operating cash flow
£335m
Adjusted revenue
£1,825m
Adjusted operating margin
15.6%
3%
12%
3%
140bps
Statutory profit before tax
£214m
Statutory basic EPS
62.7p
Adjusted profit before tax
£274m
Adjusted basic earnings per share
79.7p
13%
9%
9%
9%
02 IMI plc Annual Report & Accounts 2020

IMI Precision Engineering specialises in developing motion and fluid control technologies for applications where precision, speed and reliability are essential.
IMI Critical Engineering’s highly specialised valves and actuators help control the flow of steam, gas and liquids in some of the world’s harshest environments. Our engineered solutions are designed to withstand extreme temperatures and pressures, as well as intensely abrasive or corrosive cyclical operations.
IMI Hydronic Engineering is a leading global supplier of products and solutions for HVAC systems. They deliver optimal and energy efficient heating and cooling solutions to the residential and commercial building sector.
Operational review:Turn to page 46
Operational review: Turn to page 48
Operational review: Turn to page 50
Find out more: www.imiplc.com/what-we-do
Key brandsNorgren, Bimba, Buschjost, FAS, Herion, Kloehn, Maxseal
Key brandsIMI Bopp & Reuther, IMI CCI, IMI Fluid Kinetics, IMI InterAtiva, IMI NH, IMI Orton, IMI PBM, IMI Remosa, IMI STI, IMI TH Jansen, IMI Truflo Marine, IMI Truflo Rona, IMI Truflo Italy, IMI Z&J, IMI Zikesch
Key brandsIMI Pneumatex, IMI TA, IMI Flow Design, IMI Heimeier, IMI Aero-Dynamiek
Adjusted revenue
£643mAdjusted revenue
£877mAdjusted revenue
£305m3% 1% 3%
Adjusted operating profit
£151m2%
Adjusted operating profit
£107m18%
Adjusted operating profit
£56m2%
Number of employees
5,30053%
Number of employees
2,90029%
Number of employees
1,80018%
Revenue by geography
1 Europe 44%2 Americas 37%3 Asia Pacific 18%4 Middle East & Africa 1%
Revenue by geography
1 Europe 22%2 Americas 30%3 Asia Pacific 34%4 Middle East & Africa 14%
Revenue by geography
1 Europe 88%2 Americas 7%3 Asia Pacific 4%4 Middle East & Africa 1%
4
2
1
3
3
41
2
1
23 4
Fluid Technologies 2020 revenue: £339m
Nuclear 2020 revenue: £49m
Pharmaceutical 2020 revenue: £12m
Marine 2020 revenue: £39m
Revenue by market
1 Motion Control 45%2 Fluid Technologies 39% 3 Commercial Vehicle 16%
Revenue by market
1 Refining & Petrochemical 31%
2 Fossil Power 27%3 Oil & Gas 18%4 Nuclear 8%5 Other 8%6 Marine 6%7 Pharmaceutical 2%
Revenue by market
1 Balancing & Control 48%2 Thermostatic Control 31%3 Pressurisation
& Water Quality 17%4 Other 4%
3
4
56 7
1
2
3
1
2
1
2
3
4
Balancing & Control 2020 revenue: £146m
Thermostatic Control2020 revenue: £95m
Pressurisation & Water Quality2020 revenue: £51m
Commercial Vehicle 2020 revenue: £140m
Motion Control 2020 revenue: £398m
Refining & Petrochemical 2020 revenue: £202m
Oil & Gas 2020 revenue: £114m
Fossil Power 2020 revenue: £177m
Introduction Strategic Report Corporate Governance Financial Statements
03

Chairman’s statement
Culture, values and purposeIMI has a long-standing, strong reputation for good governance, as well as for an inclusive, diverse and collaborative culture. Each characteristic is important for a business based upon integrity, fairness and opportunity – and for long-term value creation. That Governance reputation has been recognised by a number of external reviews, including the MSCI ESG survey, where we score an AA rating. But there is always more to do.
During the last year, we have revisited our core values so that they more clearly represent how we behave. We now identify these as: Customer intimacy, One big team, Playing to win, and, Integrity. Each represents a crucial characteristic in the pursuit of our strategy and our purpose: Breakthrough Engineering for a better world.
There is little question that significant drivers of our recent performance have been that unifying and empowering purpose, as well as a rejuvenated culture. It is the way in which these results were delivered that is particularly encouraging, and bodes well for continuing improvement.
2020 has been an extraordinary year in which IMI has demonstrated resilience, ambition and absolute commitment to supporting each other, our customers and our wider communities.
2020 revealed the best in IMI.
04 IMI plc Annual Report & Accounts 2020

CoronavirusThere was abundant evidence of the application of our values in IMI’s response to the Coronavirus pandemic; a response we describe in some detail in the following pages. Since the very start of the year, our operations around the world have moved swiftly and effectively to manage complex challenges. That mobilisation of resource started – and has continued – with the Chief Executive, members of the IMI Executive, the Divisional Managing Directors, and key functional leaders. Their ambition: to ensure personal wellbeing, close customer support and business continuity, throughout. So it was particularly gratifying to learn that several unannounced inspections of our sites had judged their Coronavirus protection measures to be ‘excellent’ or ‘best-in-class’.
Also encouraging was a recent internal survey of IMI employees where 85% of respondents believed IMI had supported its employees through the global pandemic. This was also the highest engagement score we have ever recorded in such a survey at IMI.
StrategyAs well as dealing with the obvious external challenges, IMI has also made good progress in the pursuit of our strategy; a strategy that was only launched in November 2019. Margins have improved in all divisions. Progress with our structural repositioning – to significantly reduce complexity – has continued substantially to plan. And the evolution of our structure and business model to deliver sustainable, profitable, long-term growth – particularly through a much clearer focus on solving significant customer problems – is already delivering early gains. Evidence of this progress can be found throughout this Report. We continue to investigate potential acquisition opportunities where those offer strategic advantage and deliver against our strict financial criteria.
Value creation for all stakeholdersConsidering the interests of all our stakeholders is of fundamental importance to us, whether they be employees, customers, our wider communities, or our investors. Different stakeholder groups have different ambitions for any business. We consider carefully all of those different perspectives in our planning. A topic of growing importance to all stakeholders is Environmental, Social & Governance (‘ESG’). Later in this Report, we clarify what ESG means to IMI and how ESG credentials are reflected in our values, our purpose, and our behaviours – rather than being mere adjuncts to them.
The BoardIn 2020, there were no developments in the structure of the Board or the Committees. However, during the year an independent Board culture review was conducted and I’m pleased to report that the conclusions were very positive. I have greatly appreciated the experience and counsel of my Board colleagues, especially throughout 2020.
DividendI’m delighted that during the year, having suspended payment of the 2019
dividend in the early, uncertain months of 2020, we then re-instated and paid that dividend in full. At the same time, we also re-based our planned dividend distributions to represent a baseline earnings per share cover of three times. This revision will allow more of our free cash flow to remain in the business to fuel growth, whilst still rewarding shareholders appropriately.
Reflecting the confidence we have in the Group’s prospects, as well as our new target distribution rate, the Board is recommending a final dividend of 15.0p, making a total dividend for the year of 22.5p (excluding 26.2p per share in respect of 2019 paid at the interim).
PeopleAs I have described, perhaps more than in any other year, the safe delivery of a successful performance in 2020 has involved the significant commitment and courage of all our people around the world, whether they were keeping factories running to support customers and industries, or working tirelessly from home to support operations.
On behalf of the Board, I thank them all for their considerable efforts.
Lord Smith of Kelvin Chairman
Coronavirus response
Protect our employeesEnsure our people are safe – inform, support, protect
COVID-19 response teamTo anticipate, react and plan response
Stabilising our supply chainEnsure our supply chain, stocks and materials flow is enabled
Work style changesSocial distancing, flexible working, changed work patterns
Communicating with our peopleCommunicate with and educate our people: weekly Chief Executive letters, leadership calls, intranet and IMI Learn modules
Delivering to our customersGreater customer interactions, understand pain points, deliver
Coronavirus: Turn to page 06
Introduction Strategic Report Corporate Governance Financial Statements
05

Coronavirus response
Protect our employees
First, we protect. No other considerations rank more highly than that. We supply the best PPE, we adopt and monitor the best hygiene practices, and we support people to protect both their physical and mental wellbeing both inside and outside work. In a recent survey, 85% believed IMI had supported its employees through the global pandemic. They should expect no less.
COVID-19 response team
Once the pandemic threat emerged, a Coronavirus response team was established to review constantly both risk and response. Comprising the Chief Executive, Finance Director, Divisional Managing Directors and cross-divisional leaders in Human Resources, Communications, HSE and Supply Chain, this initiative is a priority with the most senior participation. Initially meeting three times per week, the objectives were to assess and anticipate risk, co-ordinate protection through shared best-practice protocols, and the sourcing and distribution of PPE and any other equipment or support measures deemed necessary. The threat has not yet passed, so we maintain our vigilance.
IMI’s operational management responded well to the market challenges from the pandemic, keeping our supply chains up and running. This has allowed us to continue serving our customers and to respond quickly to opportunities.
Stabilising our supply chain
Ensuring stability in our supply chain has received close attention from the outset. Assessing potential supply bottlenecks, securing supply of key components, and arranging for alternate supply arrangements when necessary, have all been continuing priorities. The businesses have also invested in contingency stocks where needed to ensure we would always be able to support our customers.
Our values in action in unprecedented times.Here we summarise ways in which IMI has responded to Coronavirus to keep our people, our businesses and our stakeholders safe – living our values.
06 IMI plc Annual Report & Accounts 2020

Customer intimacy One big team Playing to win Integrity
Work style changes
We’ve made some big changes to how we operate. Only essential staff are permitted to enter our operations. We’ve put in place robust protocols that facilitate social distancing, routine sanitising and – where appropriate – temperature scanning and virus testing. And we’ve ensured all of our operations meet or exceed local government guidance on operating safely. Recent site inspections by local government agencies have all delivered ‘best-in-class’ or ‘excellent’ judgements.
For our employees who have moved to at home working, this creates its own challenges and stresses. Juggling domestic pressures and distractions while providing essential services to the rest of the organisation and to customers can be very challenging. In whatever setting, we support all of our employees with equipment, advice and regular guidance.
Communicating with our people
Once the Coronavirus threat became apparent, there was an increased focus on improving the quality and reach of our internal communications and delivering effective, relevant education.
For the first five months of the outbreak, the Chief Executive wrote a weekly letter to every IMI employee. In addition, a leadership call was held every month with the top 200 managers across the world, led by the Chief Executive and the Executive Committee. Within divisions, the Divisional Managing Directors and their teams have been leading regular, updated communications with their people. There is also a section of the intranet specifically for Coronavirus information. The communications narrative is evolving constantly.
Delivering to our customers
The rush by both customers and governments to prepare for rapidly increasing global ICU admissions was unprecedented. In response, IMI took its most sophisticated products it makes to 10x capacity, in a matter of a few months, in order to satisfy burgeoning global demand for critical care ventilators. Our rapid, effective and principled response to those urgent requirements has contributed saving many thousands of lives. The effort involved collaboration across different IMI divisions and sites, as well as outside organisations.
Other, broader initiatives have been equally important, as we’ve intensified our efforts to stay in close contact with customers to help them solve their biggest problems.
The ‘Making Friends in Adversity’ campaign within IMI Precision Engineering has given confidence to our customers and strengthened our relationships with them. Life Sciences customers have asked us to quote for business in wider medical equipment markets – including diagnostics and vaccine delivery.
In IMI Critical, we’ve made greater use of technology to conduct remote inspections and conduct remote site services, where possible – enabling customers to deliver important infrastructure projects and maintain the operation of essential plant.
And in IMI Hydronic, our businesses have created on-line communities to encourage and support collaboration across our installer customers, as they all seek to solve problems and support each other in this unprecedented environment.
IMI STI, part of IMI Critical, is an example of how one of our businesses adapted effectively during the pandemic.
In February 2020, eleven municipalities in northern Italy were identified as the centres of two main Italian clusters of COVID-19 and placed under quarantine. Our IMI STI site at Bergamo near Milan fell into the municipalities outlined.
IMI STI acted quickly, and within only a matter of days after the first case of Coronavirus had been registered in Italy, the team worked to anticipate and understand what was required within the company to cover all the mandated protocols and the protocols from the Government and the WHO.
IMI STI reviewed all its internal processes. Whilst working to guarantee maximum safety, the company endeavoured to ensure the continuity of work at the site as much as possible. To do this, IMI STI analysed the orders that were due to be delivered and, depending on the critical issues and needs of the customers, prioritised any orders that were considered the most critical.
To keep colleagues safe on-site, IMI STI put rigid health protocols in place. Some tasks were taken off-site and managed remotely.
Finally, IMI STI completely revised work patterns and tripled efforts to ensure the risk from the virus on production flow, the passage of documents and customer service, was minimised.
Case study
07
Introduction Strategic Report Corporate Governance Financial Statements

All three divisions have both advanced their strategic initiatives and improved their margins.
Whilst our culture change and growth initiatives are gaining traction, IMI has also advanced its ESG agenda as we work to build on the positive contribution our solutions make to the wider world. We expect further progress during 2021.
Chief Executive’s review
08 IMI plc Annual Report & Accounts 2020

Investment case» Clear customer-focused
strategy delivering Breakthrough Engineering with the best people and strong brands
» Increasingly exposed to attractive global markets, including through our Growth Accelerator programme
» Robust social and governance policies, for a stronger, more responsible business
» Differentiating environmental profile – particularly through our customer solutions targeting energy efficiency and safety
» A clear business model committed to delivering sustainable value to all our stakeholders
» Strong balance sheet offering strategic flexibility
Adjusted revenue
£1,825mAdjusted profit before tax
£274m
Results overview2020 was another important year of progress for IMI. All three of the divisions delivered robust results in the year. Despite the challenges of a global pandemic, the Group demonstrated its ability to protect its people, its businesses and its wider stakeholders. Whilst managing the short-term challenges, the Group has continued to strengthen its capability for growth.
CoronavirusThe protection of our people, our businesses and our stakeholders remains our absolute priority. Right at the start of the pandemic a Coronavirus response team was established – with meetings chaired by the Chief Executive – to monitor and manage employee welfare, our supply chain and how we communicate effectively with all of our stakeholders. Delivering appropriate protection remains an important function of this group – whether providing PPE or adjusting working practices to maximise safety and social distancing. The organisation also kept particularly close to our customers to support them as they incurred challenges brought on by the pandemic.
Environmental,Social & Governance (ESG)Many aspects of ESG – particularly those that relate to Social and Governance – represent disciplines in which IMI has long enjoyed a strong reputation as a business with a robust, ethical and sustainable model. In 2020, we continued to demonstrate our commitment, as evidenced by a reduction in workplace accidents by 9%, high levels of employee engagement and improved diversity within the business. But there is more to do, and with that in mind, IMI has extended its ESG efforts, and outlined a robust process and structure of accountability to reflect our ambitions, and to ensure delivery against them.
We start with a commitment to halve factory CO2 intensity by 2030 (based upon 2019 Scope 1 and Scope 2 emissions). With the support of a specialist external consultancy firm, we will establish additional, auditable targets as the year progresses. Many of our products already play an important role in reducing the environmental impact of our customers’ processes and products. All future product and strategic planning activities will include
ESG assessments as a significant influencing factor to ensure we continue to build our positive influence. These are challenges we embrace as an organisation as they directly reflect our purpose: Breakthrough Engineering for a better world.
We continue to support the Task Force on Climate-related Financial Disclosures (TCFD) recommendations on the disclosure of information about the risks and opportunities presented by climate change. More information about ESG – including all of our ESG policies and practices – can be found on our website www.imiplc.com and in this Annual Report.
3%
9%
Introduction Strategic Report Corporate Governance Financial Statements
09

Chief Executive’s Review
Strategy updateIn November 2019, we set out our plans to improve the strategic positioning of our business. We are pleased to report significant progress, despite the considerable market disruption caused by the Coronavirus pandemic.
Growth cultureInitiatives designed to effect a change in culture across the business remain fundamental to the Group achieving its strategic ambitions. These initiatives are aimed at driving innovation, customer intimacy and greater commercial accountability throughout the organisation. That shift is producing encouraging early signs of impact, including Growth Accelerator programmes that are delivering early commercial wins. Importantly, the levels of customer engagement and motivation across our employees are continuing to build momentum, and will be essential to our success.
Accelerating market-led innovationA key element of our growth strategy is our IMI Growth Hub. The Growth Hub delivers structure and guidance for Growth Accelerator and NPD Ignite projects – initiatives that evaluate brand new ideas or critical product developments. The number of active teams and participants in these
initiatives continues to increase and the enthusiasm across the organisation is high. This has resulted in a number of projects advancing successfully in the year, from developing engineered solutions to making severe service control valves safer and more effective, to developing parts that significantly improve hydrogen-fuelling infrastructure. At the end of 2020 we had over 20 active Growth Accelerator teams and £7m of orders already secured.
Reducing complexityThe work to drive complexity out of the organisation continues, which will ensure the long-term competitiveness of the business and support the delivery of our divisional margin targets as first set out in the strategy presentation of November 2019.
Benefits in 2020 from the rationalisation programme totalled £33m. Charges for 2020 were slightly below plan at £39m – partly reflecting the deferral of some activity into 2021 as a consequence of Coronavirus restrictions.
Short-term cost savingsIn addition to the structural cost savings described above, we also benefitted in the year from approximately £25m of short-term cost savings as a result of the pandemic. In 2021 we expect c.£17m of those costs to return.
PeopleOur top priority is the safety of our people. I could not be prouder of the commitment our employees made to keep our facilities and communities safe throughout 2020, whilst delivering resilient results in a tough year. I would like to thank all of our employees for their commitment and efforts during the year.
OutlookBased on current market conditions, and assuming no worsening impact from Coronavirus, we expect the Group to deliver 2021 adjusted earnings per share of between 75p and 82p.
Roy Twite Chief Executive
Ground breaking at the new IMI Truflo Marine factory construction site
10 IMI plc Annual Report & Accounts 2020

Executive Committee
Roy TwiteChief Executive
Phil CliftonDivisional Managing Director IMI Hydronic Engineering
Jackie HuDivisional Managing DirectorIMI Critical Engineering
Daniel ShookFinance Director
John O’SheaGroup Legal Director and Company Secretary
Beth FerreiraDivisional Managing Director IMI Precision Engineering
Liz RoseGroup Human Resources Director
IMI Precision Engineering Palézieux, Switzerland
Introduction Strategic Report Corporate Governance Financial Statements
11

Business model
Our values
Customer intimacy One big team Playing to win Integrity
Our purposeBreakthrough Engineering for a better world
Our visionIMI will create tremendous value by solving key industry
problems in attractive markets and working with the best
Value tomorrowGenerating growth through market-led
innovation
Value today
Improving returns through greater
customer intimacy, reduced complexity
and continuous improvement
The CoreEngineering & Applications
Expertise
Talent Development & Employee
Engagement
Environmental, Social &
Governance
Digital
Innovation model: Turn to page 16
More information on our values: Turn to page 40
Customer satisfaction
Continuous improvement
Aftermarket optimisation
Foresight Teams
Growth Accelerator
New Product Ignite
12 IMI plc Annual Report & Accounts 2020

Breakthrough Engineering for a better world
Strengthen value today and drive sustainable value for tomorrow
Design, manufacture and service highly engineered solutions that control the precise movement of fluids
Why
How
What
13
Introduction Strategic Report Corporate Governance Financial Statements

Technology and applications engineering
IMI’s vision is crystal clear and solving customer problems lies at its heart. To achieve that vision we rely on renowned expertise and continual innovation. These case studies illustrate some of the exceptional capabilities deployed in support of our customers, as well as how we succeed in delivering those solutions.
Increasingly, the challenges faced by our customers and by wider society are shared. With that in mind, IMI increasingly favours product development and innovation initiatives that help to solve those wider, often environmental, challenges. Breakthrough Engineering for a better world.
Innovation model: Turn to page 16
Solving industry problems.
Market-led innovation modelConstantly innovating to solve industry problems requires discipline, focus and care. This model represents both that important process, and a crucial shift in culture that is essential for growth to accelerate and be sustained.
14 IMI plc Annual Report & Accounts 2020

Application 1Our IMI Precision Life Sciences business successfully increased production of vital and highly-complex components for use in critical care ventilators ten-fold, whilst maintaining the highest standards of product quality and customer support throughout.
Turn to page 18
Application 2When customers experience problems with noisy or vibrating competitor valves, IMI Critical is able to design, produce via additive manufacturing, and replace with a much better solution – fast.
Turn to page 20
Application 3As the regulation governing energy efficient buildings continues to grow, IMI Hydronic engineers have developed valve solutions with much greater intelligence embedded – allowing significantly improved data capture and system control.
Turn to page 22
15
Introduction Strategic Report Corporate Governance Financial Statements

Scan the environment:» Unmet and emerging customer needs
» New technologies and business models
Gate 1 Gate 2
IMI Growth Advisory Board (External)
Divisional Growth Hub Leadership Governance, decision making transformational leadership
Growth Hub leadership to filter and prioritise the recommendations routinely
Assess potential: determine next steps
Increasing product-market fit tested at each gate
Technology and applications engineering
Market-led innovation model
Phase 1Problem identification
Phase 2Test
Create the pipeline and teams to test in Phase 2
Foresight teams continuously build and review pipeline
Link to the Growth Advisory Board and its external network engagement
Sprint teams test the potential of ideas using:
Only scalable projects stay in the Growth Hub
ForesightTeam
GrowthAcceleratorProgramme
NPD IgniteProgramme
16 IMI plc Annual Report & Accounts 2020

This model represents a significant shift in culture leveraging existing expertise, an accelerated innovation process, and extensive customer contact to deliver scalable solutions to industry problems.
Gate 3 Gate 4
» Updates on market trends, digital innovation and scaling processes
» Challenge to conventional thinking on problem solving, organisational structures and business models
» Connections, networks and access to talent outside of IMI
Assess potential: determine next steps
Sign-off Growth Hub exit
Increasing product-market fit tested at each gate
Phase 3Develop and assess
Phase 4Implement and scale
Validate proof of concept
Gain significant customer commitment
Implement scaling plan
Implement new business models
GrowthHub
Introduction Strategic Report Corporate Governance Financial Statements
17

Challenge:How do ventilator manufacturers meet burgeoning demand to help save thousands of lives?
Solution:The Coronavirus pandemic has placed pressure on hospitals worldwide to provide ICU ventilation equipment for thousands of patients. IMI Precision Engineering played a huge part in supplying major Intensive Care Ventilator OEMs with solenoid proportional valves, on/off valves, pressure regulators and sub-assemblies – all helping to provide much needed therapy to patients and ultimately saving lives.
One component they needed was IMI Precision’s FAS FLATPROP proportional valve, that regulates the flow of air and oxygen going into the lungs. FAS in Geneva is the world’s leading manufacturer of these valves. FLATPROP is assembled to a micron tolerance, while measuring, in real time, 23 critical performance parameters, at different pressures, in order to deliver the highest resolution and most reliable regulation capabilities of any valve of its size. To meet the high demand, IMI Precision’s production capacity increased ten-fold.
As a result of dedicated employees and strong customer partnerships, IMI Precision has created close relationships with the world’s leading ventilator OEMs, with some new relationships formed that had not been possible before. The product is also now designed into new systems that IMI Precision had previously not supported.
Technology and applications engineering
18 IMI plc Annual Report & Accounts 2020

IMI Precision Engineering Palézieux, Switzerland
Key benefits
» Contribution to saving thousands of lives during the Coronavirus pandemic
» Ensures repeatability and high level of resolution for medical device manufacturers
» Deeper partnerships with customers and increased market share
IMI Precision’s FAS FLATPROP proportional valve is used in the HAMILTON-T1
Image courtesy of Hamilton Medical
FAS FLATPROP – High flow pressure compensated proportional valve
19
Introduction Strategic Report Corporate Governance Financial Statements

Technology and applications engineering
Challenge:How do you keep your power or process plants running and performing at their peak, especially when valves are not performing as they should?
Solution:Valves experiencing erosion, flashing, cavitation, noise, and vibration very often lead to leakage, which ultimately impacts plant performance and results in low reliability and unnecessary cost. These problems can lead to constant, unplanned maintenance, or a requirement to replace the whole valve.
IMI Critical Engineering’s decades of experience and deep knowledge of both processes and valve products, means our Valve Doctors® and Application Engineers are able to use that know-how to deliver effective upgrade solutions, often without waiting for a major outage.
Our Retrofit3D engineered trim installation takes just hours instead of days. Our certified technicians can support installation as necessary, although our trim requires no onsite valve modification as a result of IMI’s precise engineering and state-of-the-art manufacturing processes. As a result, the plant gets back online quickly, avoiding unwanted downtime costs.
Through IMI Critical’s long-established engineering reputation, an innovative approach to finding and solving customer problems, these solutions are now being delivered successfully across the globe.
The use of local additive manufacturing replacement solutions also benefits the wider world. They require less raw material, less shipping and packaging, and make ‘upgrade versus replacement’ feasible whilst keeping the world’s plants running safely and efficiently.
20 IMI plc Annual Report & Accounts 2020

Key benefits
» IMI Critical’s 3D printed trims can be ready just 4 weeks from order, compared to the standard 26 weeks for a complete new valve
» The trim replacement upgrades competitor valve performance, with no long-term outage required to install the solution
» Such an upgrade reduces manufacturing waste and contributes to ‘repair not replace’, supporting the transition to a circular economy, whilst improving plant reliability
In combined cycle power plants, ensuring responsive and precise control is key to enable efficiency
IMI Critical Engineering IMI CCI RSM, USA
Bypass valves are some of the most critical valves, operating at very high temperature and pressure changes
21
Introduction Strategic Report Corporate Governance Financial Statements

Technology and applications engineering
Challenge:How do building owners address expanding environmental legislation targeting energy consumption?
Solution:To comply with increasing low carbon environmental legislation, building owners and tenants are presented with a problem. They need to be able to measure HVAC system performance in an accurate, easy and continuous way. They also need access to reliable data that will help reduce energy and maintenance costs and extend the life of the system.
Typically, HVAC monitoring involves manual measurement, and the data is captured locally, so fails to give a picture of overall system performance.
IMI Hydronic’s TA-Smart valve, a highly accurate balancing and control valve, has integrated measurement capabilities enabling continuous logging of key circuit parameters: flow, temperature and power. Fully compatible with all control systems, TA-Smart’s advanced built-in technology enables the valve to be configured digitally via a smartphone, making system set-up and adjustment easy and convenient. This technology also allows access to the data captured by the valve, making it very easy for building owners to monitor their complete systems.
TA-Smart was developed by the IMI Hydronic R&D teams collaborating across Slovenia, Sweden and Belgium.
22 IMI plc Annual Report & Accounts 2020

TA-Smart’s mechatronic design sets the benchmark in terms of measurement and control performances out performing competitive valves in the market
IMI Hydronic Engineering Ljung, Sweden
Key benefits
» IMI’s solution delivers the quality of data capture and component control that enables both hydronic circuit monitoring and optimises energy efficiency leading to reduced carbon emissions
» The customer gains critical space and cost savings from a simplified installation, new or retrofit
» IMI Hydronic Engineering’s solution provides class-leading accuracy to a greater range of flow applications, improving controllability and efficiency whilst maximising comfort
TA-Smart provides versatile ways to communicate with building management systems. This digital device feeds data to IMI Hydronic’s cloud
23
Introduction Strategic Report Corporate Governance Financial Statements

Value today.Improving returns through greater customer intimacy, reduced complexity and continuous improvement.
24 IMI plc Annual Report & Accounts 2020

To compliment an already strong digital offering, including a top-class website, Norgren Express App and online configurators, the IMI Precision team wanted to make sure customers felt they were fully supported during the Coronavirus pandemic on digital platforms.
The team kicked off a week-long sprint project to focus on a range of ideas to help customers access information, product content and training. They focused on getting closer to the customer by using targeted email marketing, holding product webinars to over 200 customers, increasing training support on the website, and increasing social media advertising. The team also added a virtual and augmented reality section to the website which received a high number of views within the first month. In addition, customers also benefitted from new distributor portals that offer services to make it easier to do business with IMI Precision.
Our customers purchase some of the most highly engineered products in the world which need to operate in extreme conditions, safeguarding their critical assets. With COVID-19 travel restrictions, it was not possible to send field service engineers to customer sites, and witness inspection testing at our sites was also not possible. IMI Critical Engineering responded with ‘Critical Connect’ – a system that allows remote access with audio and video, connecting our experts in one country to our field service engineers in another, or to our customers’ engineers. This helped our customers through servicing and commissioning and kept key infrastructure operational throughout the lockdowns.
In IMI Critical we continued to improve the quality and resilience of our supply chain, with increased best cost country sourcing, while at the same time effectively eliminating sole-sourcing. This added regional suppliers to ensure resilience due to COVID-19 restrictions. Enhanced employee safety programmes, and collaboration between plants in different regions, ensured our facilities continued to meet our customers needs, including when mandatory lockdowns in Asia and then in Europe affected other businesses.
To enhance its customer service offering and reduce operational and supply chain complexity, IMI Hydronic Engineering has consolidated its logistical operations into a single hub.
Warehousing and distribution operations located in Germany, Poland and Sweden are now centralised in a single 14,000 square metre facility, located in Ruda Slaska in Southern Poland.
Simplification of the division’s warehousing and distribution operations will significantly enhance the overall customer experience. In particular, product availability will be improved, delivery lead times shortened and service levels standardised. Reduced operational costs, increased warehousing efficiency and lower inventory levels, will also help drive margin growth.
The new hub has been fully operational since the end of January 2021. This centralisation project was successfully delivered as a result of effective collaboration across the division’s Polish, Swedish and German operations.
A leading global provider in life science instruments had been suffering with major quality and delivery issues with an existing supplier of acrylic bonded manifolds. Building upon an existing relationship with the customer, the IMI Precision team in Farmington, USA quickly responded to the customer’s challenge by creating a bespoke multi-layered manifold, delivering prototypes for testing. The resulting sales opportunity is significant.
The team worked to ensure that the customer’s quality issues were resolved in the prototypes and that they could commit to a delivery timeframe. The prototypes were successfully accepted, and IMI Precision are now working with the customer to meet demand.
IMI PBM rose to the challenge to support the rapid response needed for the supply of valves for COVID-19 related therapies and vaccines.
IMI PBM’s commercial and operational teams worked together to explore all options to satisfy customer requirements, in some cases, re-organising to ship within days of the order being placed. Through collaboration and flexibility, IMI PBM continued to maintain the high level of trust it enjoys in the pharmaceutical industry, by offering the best products for demanding applications, whilst also consistently delivering uncompromising customer service.
Value today in action around the Group
Introduction Strategic Report Corporate Governance Financial Statements
25

Value tomorrow.Generating growth through market-led innovation.
26 IMI plc Annual Report & Accounts 2020

IMI’s Hydrogreen team has been working on a solution to solve problems faced by hydrogen-fuelling infrastructure providers. In particular, they need less complex and more reliable systems to reduce operating costs. Over the last year the team has been developing a solution that allows IMI Precision to differentiate from the competition by introducing a modular solution with fully configurable components suited for hydrogen applications. If successful, the opportunity is likely to be significant and will demonstrate IMI’s expertise and capabilities.
IMI Critical Engineering has continued to develop its Growth Accelerator process, rolling out training for all employees on ‘The Growth Mindset’. There are now 19 Growth Accelerator projects in progress across the Group, and even more in Foresight development. These include three projects in the scaling phase, with £6m of bookings achieved in 2020, with significant further potential in forthcoming years.
As our world becomes more digitally connected, centres that manage and store data securely and effectively are now essential. As demand for their services grows, data centre owners are faced with the ongoing challenge of sourcing reliable, energy-efficient cooling that also keeps their centres safe and has a lower environmental impact.
IMI Hydronic’s balancing control solution fully addresses these challenges. The division’s pressure independent balancing and control valve technology enables stable and precise temperature control, delivering better system performance, increased cooling capacities and higher energy efficiency.
Having this innovative solution, IMI Hydronic’s Singapore team has won a number of data centre projects across Asia, which is one of the fastest-growing data centre regions in the world. The team’s deep understanding of the division’s technologies and extensive hydronic expertise ensure that customers are provided with the best advice and solutions, from project design through to system calibration.
IMI Hydronic’s Eclipse Automatic Flow Control technology regulates the maximum flow in both heating radiators and radiant manifolds irrespective of the differential pressure.
Launched back in 2015, this innovative solution was well-received albeit market penetration was limited. To grow IMI Hydronic’s position in several attractive markets worldwide, teams engaged with customers to build a better understanding of their needs. Based on valuable feedback gained, IMI Hydronic has enhanced its Eclipse technology, including making it easier for customers to use. This customer engagement has also strengthened commercial relationships and reinforced the division’s extensive hydronic expertise and solutions-focused approach.
Value tomorrow in action around the Group
27
Introduction Strategic Report Corporate Governance Financial Statements

Environmental, Social & Governance
Breakthrough Engineering for a better world.
Far from being a separate initiative, our ESG agenda forms an integral part of the way we do business, and is fully aligned with our purpose, Breakthrough Engineering for a better world. ESG is a topic that concerns all of our stakeholders and it affects how we engage with them as well as how we plan for our future. Evidence of this is presented throughout this Report. This approach is endorsed and monitored by the Board and Executive sponsors and supported by the recently formed Better World team with representatives from each division and key functions across the Group (see illustration on page 42).
ESG ambition: Turn to page 42
ESG ambitionIn this section, we seek to illustrate both our progress to date and our ambition for the future.
Find out more: www.imiplc.com/esg
28 IMI plc Annual Report & Accounts 2020

Environmental – Our sustainable approach
Turn to page 30
Social – Our wider responsibilities
Turn to page 33
Governance – Our ethical standards
Turn to page 39
29
Introduction Strategic Report Corporate Governance Financial Statements

Environmental, Social & Governance
IMI Hydronic Engineering Erwitte, Germany
Environmental – Our sustainable approach
30 IMI plc Annual Report & Accounts 2020

A better worldThe Better World team co-ordinates the Group approach to ESG with particular focus on three areas: our products, our carbon footprint, and our policies and governance. For more information on the Better World team, please refer to page 42.
Our products provide the greatest opportunity to contribute to a better world, be it in, for example, valves for critical care ventilators, anti-surge valves driving efficiency in LNG production, or systems for energy efficient heating. Understanding this impact, and ensuring our product development takes this into account, we will deliver our purpose through a competitive and sustainable future product portfolio.
We are committed to reducing our carbon footprint and have initiatives across the world to make our sites more energy efficient, to ensure we share best practice, and to commit to year-on-year reductions.
Our high standards of governance have been strengthened this year through the development of our Inclusion and Diversity initiative, our revised values and increased employee engagement. We have refreshed our external reporting to bring even greater transparency and focus to these areas.
We hold our purpose, Breakthrough Engineering for a better world at the heart of our strategy, delivering innovative solutions, a sustainable business and a great place to work and do business with.
Keeping our impact lowIMI is a global operation with manufacturing facilities in 18 countries. We are committed to operating these facilities in a sustainable way to minimise their impact on the environment by reducing energy and water use, pollution and waste. We monitor and report our environmental performance at monthly Executive meetings with a view to delivering continuous improvement, with an explicit goal of halving our factory CO2 intensity by 2030 (based upon 2019 Scope 1 and Scope 2 emissions). As part of our ESG ambition and planning, we are also considering how best to address Scope 3 emissions.
Energy efficiency To underpin our commitment to reduce our environmental impact, 25 of our 50 manufacturing facilities are certified to ISO 14001 Environmental Management and four are certified to ISO 50001 Energy Management standards.
These international accreditations help IMI to provide a framework of requirements for organisations to:
» Develop a policy;
» Fix targets and objectives to meet the policy;
» Use data to better understand and make decisions;
» Measure the results;
» Review how well the policy works, and
» Continually improve the processes.
Reducing our impact on the environment of both our operations and customer solutions is a fundamental objective of IMI’s strategy.
CO2 emissions We support the CDP (Carbon Disclosure Project) climate change initiative and submit annual CDP reports which cover our risk management approach to climate change and our emissions performance. Since 2016 we have reduced our CO2 emissions in line with our continuous improvement culture and investment in our operations.
2016 2017 2018 2019 2020*
40
80
0
20
60
‘000 tonnes CO2e
* Disruption associated with Coronavirus, including much lower occupancy of office space (including within factories), has driven some direct reductions in energy usage, which is reflected in the overall results.
Introduction Strategic Report Corporate Governance Financial Statements
31

Environmental, Social & Governance
Environmental reporting The below table and supporting narrative summarise the Streamlined Energy and Carbon Reporting (SECR) disclosure in line with the requirements for a quoted company, as per The Companies (Directors’ Report) and Limited Liability Partnerships (Energy and Carbon Report) Regulations 2018. 2020 is the first year IMI has followed SECR.
Methodology The adjacent greenhouse gas emissions estimates have been calculated to cover all material sources of emissions from the operations for which IMI plc is responsible. The methodology used was that of the Greenhouse Gas Protocol: A Corporate Accounting and Reporting Standard (revised edition, 2015). Responsibility for emissions sources was determined using the operational control approach. All emissions sources required under The Companies (Directors’ Report) and Limited Liability Partnerships (Energy and Carbon Report) Regulations 2018 are included.
The scope of emissions covers the following sources: natural gas, fuel oil, liquified petroleum gas (LPG), diesel, petrol, combined heat and power (CHP), electricity and business travel in employee-owned or hire vehicles.
The UL 360 Sustainability Software GHG (Greenhouse Gas) emission tool was used to calculate the Scope 1 and Scope 2 emissions adopting a location based approach, using the UK Government’s GHG Conversion Factors for Company Reporting 2020 and the International Energy Agency’s (IEA) conversion factors from 2020.
Our currently reported Scope 3* emissions were calculated by converting mileage into emissions using UK Government’s GHG Conversion Factors for Company Reporting 2020.
We are working to deliver a strategy for Scope 3* emissions.
* Scope 3 emissions currently only reflect business travel in rental cars or employee-owned vehicles.
Our carbon reporting statistics demonstrate that our recent performance of tCO2e has continued to improve. However, it is important to note that disruption associated with Coronavirus, including much lower occupancy of office space (including within factories), has driven some direct reductions in energy usage, which is reflected in the overall results. Nonetheless, on a like for like basis, we believe we achieved our target to keep emissions at or below 2019 levels for 2020.
Of the 2020 total:
» our direct Scope 1 emissions of tCO2e (essentially gas, diesel and fuel oil consumed) amounted to 12,465 tonnes; and
» our indirect Scope 2 emissions of tCO2e (essentially the emissions generated on our behalf to provide our electricity) amounted to 33,033 tonnes. The total represents a 20% reduction compared to 2019.
In addition to gross tonnes of CO2e, we report CO2e intensity relative to £million sales; our result for 2020 is 24.9 which is an improvement relative to the 30.7 we achieved in 2019 when restated on a constant currency basis (2019 reported figure of 31.2). Going forward, and in line with our 2020 SECR report, we will use the intensity metric of gross tCO2e per 1,000 hours worked as unit of comparison to better reflect our operational performance compared to carbon output.
Current reporting year1 January 2020 -
31 December 2020
Location UK Global
Emissions from activities for which the company own or control including combustion of fuel and operation of facilities (Scope 1) (tCO2)
840 12,465
Emissions from purchase of electricity, heat, steam and cooling purchased for own use (Scope 2) (tCO2)
1,918 33,033
Emissions from business travel in rental cars or employee-owned vehicles where IMI plc is responsible for purchasing the fuel (Scope 3*) (tCO2)
82 460
Total gross Scope 1, Scope 2 and Scope 3* emissions (tCO2)
2,840 45,958
Energy consumption used to calculate Scope 1 emissions (kWh)
4,423,632 61,951,252
Energy consumption used to calculate Scope 2 emissions (kWh)
8,227,092 103,870,106
Energy consumption used to calculate Scope 3* emissions (kWh)
331,441 1,857,022
Total gross energy consumption based on the above (kWh)
12,982,165 167,678,378
Intensity ratio: tCO2 (gross Scope 1, 2 + 3*) per 1,000 hours worked
1.5 2.4
32 IMI plc Annual Report & Accounts 2020

Social – Our wider responsibilities
IMI Critical Engineering Brno, Czech Republic
33
Introduction Strategic Report Corporate Governance Financial Statements

Environmental, Social & Governance
Safety firstAt IMI, we are all personally committed to protecting our people, the environment, the communities we operate in and our company. Keeping our employees safe at work is of the utmost importance and we do our absolute best to ensure everyone leaves work safe and well. This ethos is embedded in our IMI Way and Code of Conduct, which applies to all our employees and business partners.
Prioritising health and safety and keeping our employees, and any individual entering our sites, safe is our number one priority. To achieve this ambition, we take a proactive approach and strive to continuously improve our performance. Our Group Head of Health, Safety & Environment reports directly to the Chief Executive who has ultimate responsibility for health and safety. The Executive Committee reviews health and safety matters every month and regular reports are made to the Board.
Looking after the health of our employees is of paramount importance. To demonstrate our commitment in this area we initiated several ergonomic awareness campaigns throughout 2020. Topics included prevention of
musculoskeletal disorders, safe use of Display Screen Equipment, and Ergonomics Awareness in the workplace.
The Coronavirus pandemic added a further dimension to our health and safety initiatives in 2020. At IMI our operations maintained a consistently high level of availability, whilst still applying our rigorous safety programmes. We deployed innovative methods of virtual Gemba safety inspections, using a mix of technology and administrative tools that included a specially created ‘validation’ self-audit tool, based on the COVID-19 protection measures we deployed. Our measures were assessed in the year by three
external regulators in different countries, following unannounced visits. All of those assessments resulted in very positive conclusions.
We have installed 73 thermal imaging cameras at sites globally, along with supplying over 200 handheld temperature measuring devices, 1,900 litres of sanitiser, and in excess of 192,000 face masks for our employees. We also created and supplied 2,200 safety packs for use by our field service and sales functions, as well as for our suppliers and customers.
Seven of our 50 manufacturing sites are accredited to OHSAS 18001, the international standard for Health and Safety Management with 12 sites successfully transitioning to the new revised standard ISO 45001.
2020 saw several more of our manufacturing sites join the ‘million-hour club’. These sites have recorded over a million working hours without a Lost Time Accident (LTA). One of our locations has recorded nearly 2.5 million hours LTA free.
Health and safety monitoring and improvement is a core metric that is embedded at multiple levels across our entire reporting system. All parts of our business continuously assess their operations and, at least once a year, we undertake formal Group-wide health
Environmental, Social & Governance
Stop call waitStarting in 2018, IMI implemented a new process of employee-driven hazard concern reporting. This initiative empowered any employee, or any person visiting our locations, to report potential hazards, whilst expecting them to stop a process or an action, if they thought it was not correct or could lead to a hazardous situation. This proactive approach has led to a reduction in LTAs from 16 in 2019 to 14 in 2020.
Creating not only a safe but a stimulating and rewarding environment.
34 IMI plc Annual Report & Accounts 2020

and safety audits at every major operation to monitor progress against our formal improvement actions. We also conduct Health, Safety and Environment (‘HSE’) due diligence when establishing new operations or when acquiring businesses.
As part of our drive for safety and environmental excellence in 2021, an enhanced HSE management system will be introduced across the Group. This framework will drive leadership engagement and ownership whilst upskilling our employees, leaders and HSE teams.
We continuously use our data to drive focused activities to improve our safety and environmental performance. On this theme, we recently held a data analytics workshop with collaboration from Group and divisional HSE leads to use our data to objectively set goals and targets for the forthcoming year.
In 2021, we will also be introducing digital tools to help streamline the collection and reporting of leading safety indicators such as hazard reporting.
We report and record every safety incident and fully investigate those cases requiring more than first aid. In addition, a full root cause analysis is presented and reviewed with the relevant Divisional Managing Director and Group Head of Health, Safety & Environment. Following this formal review, a remediation plan is agreed, and countermeasures implemented. Safety alerts are issued to share lessons learned and increase safety awareness across the Group.
During the year the total number of LTAs reduced to 14 compared to 16 in 2019*, with no fatalities in either year. We include all employees, contractors and visitors in our accident reporting analysis.
An inclusive and diverse cultureInclusion and diversity are integral to the IMI values, driving the development of the business. The refreshed Inclusion and Diversity Strategy was presented to the Executive Committee and the Nominations Committee in March 2020, with a focus on driving growth through innovation and customer focus, as well as improving business performance. Diversity is seen in its broadest sense. Operating in over fifty countries, with different end-markets, industry sectors, technologies and manufacturing processes, IMI is a diverse business. We aim to leverage this diversity through collaboration, bringing elements together in new and different ways to solve customer problems.
As the world’s problems become increasingly complex, we require high levels of cognitive diversity to find solutions. This is a key criterion for teams in IMI. Beginning with the Growth Accelerator and NPD Ignite programmes, we now extend this approach across our business. Including people with a wealth of different life experiences, backgrounds and perspectives drives this diversity of thought. Gender, ethnicity, nationality,
sexual orientation, marital and family status, age, disability, socio-economic status and educational background all play an important part, as do a great many other attributes. Recognising that each employee contributes value through their complexity and uniqueness, means that Employee Engagement is a key driver for our Inclusion and Diversity agenda.
IMI supports the recommendations of the Hampton-Alexander Review, that 33% of the Board, Executive Committee, and direct reports to the Executive Committee should be female and during 2020 significant progress was made with the percentage of female Executive members increasing from 0% to 29%. IMI’s gender mix is shown in the table adjacent.
Gender pay at IMI: www.imiplc.com/esg
*** We are a global business employing around 10,000 people around the world, just under 1,000 of whom are employed in the UK. Further information about our UK gender pay gap, together with an explanation of these figures and the steps we are taking to narrow the gap can be viewed on our website.
2020 2019
Mean gap 25.1 34.5
Median gap 22.5 22.4
UK gender pay gap summary as at 5 April 2020***
Gender mix across the Group*
* Including agency and contractors.** Includes direct reports to the Executive.
Female Female% Male Male%
Board 3 37% 5 63%
Executive 2 29% 5 71%
Senior managers**
95 18% 439 82%
Managers 200 19% 844 81%
All employees
3,011 28% 7,765 72%
* The 2019 Lost Time Accident number has been restated to 16, from 15 reported in 2019, due to the reclassification of an injury and follow up treatment.
Further information on our improved LTA scores: Turn to page 56
Introduction Strategic Report Corporate Governance Financial Statements
35

Environmental, Social & Governance
IMI employs just under 1,000 people in the UK, 72% of whom are male and 28% female. The pay gap results from the proportion of women in senior roles, rather than reflecting an inherent inequality in pay systems. We have seen progress since reporting started in 2017. The narrowing of the mean gap in 2020 is primarily due to the appointment of more female hires into senior leadership roles below the Executive Committee level. The appointment of Beth Ferreira and Liz Rose to the Executive Committee will have a further positive impact in the 2021 results.
We aim to improve gender diversity in senior roles, supporting the Hampton-Alexander recommendation, that 33% are female. In order to achieve this sustainably, we are focused on building a strong pipeline of female talent. We have introduced a career acceleration programme, ‘Catalyst’, with a first cohort of 20 women. Female engineers are recruited through the Graduate Programme, in order to build the pipeline at all levels. This year, 56% of the graduates recruited were women. All recruitment is required to have a gender diverse shortlist.
IMI’s talent pipelines are reviewed by the Executive team twice a year.
Members of the Executive Committee have gender diversity objectives and these are then cascaded throughout the business. Communications are co-ordinated in order to celebrate success and share good practices. For example, the WISE Campaign (a UK initiative to increase the participation of women in science, technology, engineering and mathematics) has Ten Steps, which are useful guidelines applicable across the world.
IMI takes the opportunity to celebrate diversity in its broadest sense, communicating across the Group through channels such as the Inclusion and Diversity Hub on the IMI intranet. It is part of the Better World team’s remit, who lead the ESG agenda on behalf of the Executive Committee as an integral part of our purpose, vision and values, critical to achieving our aspirations.
36 IMI plc Annual Report & Accounts 2020

Effective engagement is an essential element of success.
Supporting our communitiesEmployee engagementEmployee engagement is a key strand of IMI’s strategy, across the Group. To deliver our purpose and plans, a customer-focused and collaborative culture at all levels of the business is fundamental. From day to day customer service provision within our operations, to technical problem-solving between engineers; from account management with our salespeople through to strategic partnering at a senior level, customer relationships are developed throughout.
Employee engagement is fully integrated within our established business management processes, included in all business plans and strategies, and tracked and managed as part of our business reviews. This keeps the process simple, sustainable and avoids introducing complexity. It allows managers to factor in feedback from the workforce, tailor plans to the key drivers of their business, and use employee engagement as a true strategic enabler.
The IMI Way DayAn engagement survey is undertaken with all employees every year during the IMI Way Day. This year, the day was very much driven by the experience of
the Coronavirus pandemic. It was an opportunity to engage with all our employees, to recognise the challenges they’ve faced at home as well as at work, and to recognise the impact this has had. Most importantly, it was important to thank each one of our employees for everything they have done in support of each other and of IMI.
With the uncertainty everyone has faced it was important to pause, align on future priorities, and then enable the whole organisation to move forward with purpose, clarity and confidence.
The employee survey results overall were positive, reflecting management focus this year. We continue to maintain a high percentage of employees that would recommend IMI as a good employer to family and friends. The highest scoring response was given to the support IMI provided employees through the Coronavirus pandemic, where 85% of respondents said they believed IMI had supported its employees through the global pandemic. Scores for health and safety and diversity were also in the top three most highly scored topics.
The biggest opportunity for improvement identified by the survey responses is to engage people more fully in site and divisional priorities.
Employee representationMany of our sites have union representation with whom we regularly engage and maintain good relations. We also hold an annual European Communications Forum (ECF). This took place virtually this year and was attended by employee representatives from all of our key European geographies. It provided an opportunity for management (including the Chief Executive, Finance Director and Group HR Director) to update on progress on key business and human resource issues. It also provided an opportunity to respond to a wide range of questions from the representatives on key matters of employee concern. Discussions and feedback from these engagement channels are then fed back to Group and divisional management with a view to continuously improving communication and engagement with employees on a global basis. In the year, we have managed major restructurings in many businesess and geographies with excellent co-operation from the workforce. Thomas Thune Andersen is the Board director designated with oversight of workforce engagement. In this role, Thomas attended the ECF this year. He has also joined various programmes such as the Graduate Induction and the Growth Accelerator pitches and met with the Inclusion and Diversity team, giving insights into these initiatives.
37
Introduction Strategic Report Corporate Governance Financial Statements

Environmental, Social & Governance
LeadershipLeadership has had a profound impact on employee engagement this year. In circumstances which were unfamiliar, constantly changing, and with an uncertain future, IMI set up a structure to provide the clear and consistent leadership, direction and support.
CommunicationBeyond our established external communications with our wider stakeholders, our internal communication efforts have been strengthened considerably over the last year – even before the additional challenges presented by Coronavirus became apparent (see page 06 for more on COVID-19 communications). The IMI intranet has been developed to be more relevant and engaging. As well as a section specifically addressing Coronavirus issues, a new Inclusion and Diversity Hub, a section for Growth Accelerator projects, and regular video communication from senior leadership, are all now accessible to employees. Intranet hit rates have significantly increased since the beginning of the year. There are still many opportunities to improve, and the Group continues to focus on this as a key business enabler.
Leadership developmentIMI continues to invest in and support leaders with their development throughout the Coronavirus pandemic, delivering our core programmes virtually, as well as offering additional support with specific learning modules to support managers in leading through a crisis. We continue to build capability and bench strength at all levels. The core management suite for senior and middle managers has been modified and refreshed to reflect the revised strategy, purpose, vision and values. In addition, a new programme has been developed for General Managers, supporting the objective of having business management and decision making close to the customer.
The eLearning system (IMI Learn) was refreshed in February, enabling the delivery of new content, which has been especially useful during the Coronavirus pandemic this year. A series of learning modules has been made available, with topics to support our purpose, vision and values. The subject areas cover issues such as innovation, Inclusion and Diversity, customer relationships and employee engagement.
Talent and successionThe success of internal promotions has been a theme this year with 74% of our 43 senior vacancies having been filled
internally, compared to 66% in 2019. We continue to build deeper talent reserves, improving our succession coverage for key positions.
We continue to focus on talent planning, with Executive reviews twice a year focusing on building strong, diverse talent pools throughout the organisation.
Community engagementOur communities are key stakeholders in IMI and how we engage with them illustrates our values. This is becoming increasingly important for our employees, with feedback from the IMI Way Day requesting more focus from IMI in this area.
Many of IMI’s businesses have a long history of supporting their local communities. This year many sites supported organisations through the challenges of the Coronavirus pandemic. In Italy, support for local hospitals was provided through donations during particularly stressful periods. In the UK, IMI donated to the Birmingham Nightingale Hospital.
Going forward, IMI will build on this platform, communicating its support for community engagement, including time, money and expertise, with more visibility for all employees of the activities across the Group.
38 IMI plc Annual Report & Accounts 2020

Governance – Our ethical standards
IMI Critical Engineering Brno, Czech Republic
39
Introduction Strategic Report Corporate Governance Financial Statements

Environmental, Social & Governance
Founded on integrityThe IMI values Our purpose, vision and values are all strongly interlinked with the strategy and mutually reinforcing. Our purpose describes who we are.
Breakthrough Engineering for a better world.
Our vision explains how we will achieve our purpose.
IMI will create tremendous value by solving key industry problems in attractive markets and working with the best.
Our values describe the mindset and culture needed to deliver on our ambitions. They were revised this year, to simplify and align more fully with the purpose and vision. Although formally introduced to the organisation during the October 2020 IMI Way Day, the concepts played a central role in communications throughout the year.
Customer intimacy – a mindset where the customer is at the heart of everything we do.
One big team – accesses the diversity of IMI in every sense, whether this is the diversity of talent, knowledge and experience that we have with our people, or the different technologies, processes and end markets across our businesses.
Playing to win – a growth mindset that is open to innovation and learning.
Integrity – being true to who we are and doing the right thing at all times.
The IMI values are key drivers of business success. That culture can be a source of competitive advantage has been evident this year through the Coronavirus pandemic. Responding quickly to safeguard employees; focusing on solving customer problems; and working together across the whole Group, have all supported us through the crisis.
Code of ConductIt is essential that we act with integrity and at all times run our business in an ethical way. Integrity is one of our core values and underpins everything we do.
It is a cornerstone of our culture. Our Code of Conduct (the ‘IMI Code’) sets out the standards we expect our employees to adhere to. It covers a range of issues including anti-bribery and anti-corruption and is available in thirteen languages.
Every employee receives a copy of the IMI Code upon joining the Group and specific training about the IMI Code is provided as part of our employee induction programme. On an annual basis we provide refresher training and updates on specific compliance issues to relevant employees.
The IMI Corporate Governance FrameworkOur governance framework and the practical workings of our Board and its committees are described in the Corporate Governance Report on pages 70 to 75.
40 IMI plc Annual Report & Accounts 2020

Policies and proceduresWe have a number of detailed policies underpinning the IMI Code and appropriate compliance processes. Around the Group there are 29 legal and compliance specialists supporting the businesses with training and implementation of compliance policies. Monitoring and review procedures include Internal Control Declarations, spot checks and regular on-site legal and compliance reviews, which are designed to help instil the highest standards of regulatory compliance. These policies and procedures are embedded in our risk assessment processes, further details of which are provided on page 58.
We encourage all employees to report any incident that is not in keeping with our values and behaviours through a confidential independent hotline in 12 languages, which allows anonymous reporting. The Group’s Ethics and Compliance Committee reviews hotline activity on a monthly basis. Reports are investigated thoroughly and, where
required, action is taken to resolve issues. The Board also monitors the operation of the hotline and checks that commensurate investigation and follow-up is carried out. During 2020, 33 cases were reported via the hotline which compared to 21 in 2019.
Ethical conductIntegrity is one of our four core values and forms the basis of IMI’s decision-making, including dealings with our stakeholders.
Whilst we commit to acting responsibly, sustainably and with integrity, we expect our extended supply chain to do the same. We actively choose suppliers that respect the environment, their employees and adhere to our strict IMI Supply Chain Code of Conduct. But our supply chains are often long and complex, so we also encourage our partners to adopt similar working practices regarding their own suppliers. We strive to positively influence ethical and sustainable trading throughout the world.
IMI is also committed to sourcing our raw materials responsibly. This means that we have a process to identify the origins of conflict minerals in our supplies, and are committed to ensuring they originate from legal, audited mines. We ask all of our suppliers of products containing conflict minerals (specifically tin, tantalum, tungsten and gold – otherwise known as 3TG) to take immediate action to identify the origins of 3TG in the products they supply to us.
Our full Modern Slavery Act statement, including detail about the steps we take to ensure that slavery and human trafficking do not take place within our supply chain or any part of our business, is available on our website. The other policies referred to in this section, including our Anti-Bribery, Compliance and Hotline policies, are also available to all employees.
Modern Slavery Act and Supply Chain Code of Conduct at IMI: www.imiplc.com/esg
Introduction Strategic Report Corporate Governance Financial Statements
41

Environmental, Social & Governance
ESG ambitions
Area Roles Responsibility
Board Chief Executive
ESG non-executive sponsor
To ensure ESG issues are considered as part of the Group purpose, strategy and objectives
Executive Executive ESG sponsor
Divisional Managing Directors
To set direction and ESG focus areas relevant to IMITo oversee ESG initiatives and provide regular updates to the Board
Better World team
IMI Precision divisional champion A cross divisional and functional team, co-ordinating Environmental, Social & Governance initiatives across the GroupResponsible for recommending ESG strategy, developing plans for its implementation, and establishing structures, measures and validation plans that deliver to Group targets. Routinely reports to Board and ExecutiveDeveloping external and internal communication plans in parallel to the aboveManaging IMI’s relationships with external consultants and agencies
IMI Critical divisional champion
IMI Hydronic divisional champion
Head of Health, Safety & Environment
Head of Investor Relations
Head of Risk
Head of Engagement & Communications
Head of Inclusion & Diversity
Many aspects of ESG have been successfully addressed by IMI in the past – including governance, emissions reporting and social responsibility. But the scope of issues has increased and the urgency to deliver improvement is growing.
Our starting point is positive. For example:
We enjoy a long-standing reputation for good governance (MSCI ‘AA’ rating in ESG), because doing business the right way has always been important to us. That’s a reputation we will fiercely protect.
A significant proportion of the products and solutions we supply are developed to help customers solve problems associated with emissions reduction, efficiency improvement, and other environmental improvement objectives.
Our Inclusion and Diversity agenda is driven by our desire to have a dynamic, effective and inclusive team; something we believe to be essential to success.
All of these and other objectives are embedded in our strategy and purpose and, where appropriate, included in the strategic and personal objectives of the annual incentive bonus (see pages 99 and 100). But whilst our ambitions haven’t changed, we want to expand our specific targets – as well as the actions and initiatives that will deliver them. It matters to us. It matters to our stakeholders.
In 2019, IMI changed how we report ESG, recognising that we are at the start of a significant and ambitious programme of development.
During 2020, we reviewed and confirmed what matters to IMI, and where we believe we can have a positive impact. We also formalised our approach to ESG, so that we may achieve our purpose, effectively.
» Led by the Chairman and the Chief Executive, there is Board level commitment to develop a strategy covering how we best deliver Breakthrough Engineering for a better world and how we report on our progress – for all our stakeholders.
» Thomas Thune Anderson was appointed as the non-executive director responsible for ESG matters at IMI. As Chairman of Orsted, a company voted in Corporate Knights as the world’s most sustainable, his experience is significant and relevant.
» The Board set ESG priorities and the IMI Executive is fully engaged with ESG matters.
» The Better World team was established with senior representation from around the business, each with a different perspective and expertise in ESG issues.
IMI has many stakeholders, each with different perspectives on what they’d like to see from us. Whether those are employees, partners, the communities we operate in, or people whose pensions are invested in IMI shares. One characteristic they all share is the growing importance they attach to ESG. That is why ESG considerations are embedded throughout our strategy and in our purpose.On pages 28 to 41 we have described what Environmental, Social & Governance (‘ESG’) means to IMI and how we address the various issues that ESG describes. It is a complex subject area, but in many ways it’s also quite simple. It’s about doing business the right, responsible way. It’s about minimising or eliminating any negative impact our businesses may have on our communities, our wider stakeholders, and on the environment. It’s also about how we help our customers solve problems to improve energy inefficiency, reduce harmful emissions – and drive sustainability. Breakthrough Engineering for a better world.
In this section, we set out our intent. Our ambition. We all need to set demanding targets which we will work hard to achieve. We will also report openly where we succeed – or not – in those ambitions.
1
Steps taken
22019: ESG evolved 2020: Scope and structure established
42 IMI plc Annual Report & Accounts 2020

Ricardo PLC was appointed by IMI to assist with ESG strategy planning and target setting. Ricardo’s perspective is important as a specialist and accredited engineering and environmental consultancy. Ricardo shares our high expectations, as well as our ambition to deliver a best in class performance in ESG. They are helping IMI to:
» Establish appropriate and demanding targets for our own business, as well as a strategy for achieving them.
» Establish relevant ESG performance characteristics and measures of the products and solutions we deliver for customers.
» Establish a strategy for effectively communicating our credentials, whether directly to our stakeholders, through our Annual Report, website, or via ratings agencies and specialist indices.
ESG is a wide-ranging topic, driving many workstreams that include maintaining our Governance reputation and advancing Social impact initiatives. Below, a few environmental priorities.
Develop more products that have positive environmental and social impacts, for a better world – by, for example, using less energy, creating less noise, delivering longer life-spans.
Reduce the environmental impact of our businesses – by incentivising them to make ESG a priority in their planning. By encouraging them to ‘act’, not wait.
» We have a clear understanding of our Scope 1 and Scope 2 carbon footprint and have self-improvement targets for all sites – audited externally.
» We are working to deliver a strategy for Scope 3 emissions.
» We are evaluating our products and solutions against both specific environmental impact, and their relevance to UN Sustainable Development Goals (‘SDGs’).
» We will also be working towards using the WBCSD Portfolio Sustainability Assessment methodology.
» All new product development programmes now prioritise ESG considerations.
Keep our stakeholders informed on progress – with relevant, meaningful and challenging targets.
» The work being undertaken on environmental assessment will support our goal to fully align with the recommendations from the Task Force on Climate-related Financial Disclosures (‘TCFD’).
» We provide data to outside agencies facilitating external assessments of ESG credentials.
In the 2021 Annual Report we will publish more detail on our ESG plan, including targets, methods and timescales by which we aim to reach them. These will be categorised into short, medium and long-term targets. We are adopting an approach in-line with science-based targets.
As a starting point, we have introduced an explicit goal of halving our factory CO2 intensity by 2030 (based upon 2019 Scope 1 and Scope 2 emissions).
We will also produce greater clarity on our own products’ beneficial impact on the environment.
We plan to deliver. And we plan to share the results of our analysis on an open and regular basis.
We will also regularly review our approach, in what is a rapidly evolving and important area – for us all.
Steps to follow
3 4Deliver ambition Set stretching targets
Expert guidance engaged
Introduction Strategic Report Corporate Governance Financial Statements
43

Our stakeholders
IMI Precision Engineering Alpen, Austria
Our ability to fulfil our purpose and generate sustainable value is dependent on a wide range of stakeholders. We run our business in a responsible way and proactively engage with and consider stakeholders when making decisions.
As we build on our progressive Environmental, Social & Governance platform and IMI becomes increasingly purpose driven, we are developing deeper relationships with all of our stakeholders. Fully understanding their needs feeds into and drives our business plans.
44 IMI plc Annual Report & Accounts 2020

Our stakeholders
Their priorities How we engage Further information
Customers Value enhancing products and solutions World-class customer service Market leading innovation Long-term partnerships
The Growth Accelerator programme involving hundreds of customer interactions Ongoing relationship management at strategic, sales and technical engineering levelsTechnical and product support, with access to our industry renowned experts, such as through the Hydronic College and Valve Doctor programmesIncreasing use of digital platforms to drive knowledge sharing, customer networking, and relationship buildingPerformance monitoring and improvement through customer driven metrics such as on time delivery and net promoter score
Our Growth Accelerator programme – see pages 14 to 27Examples of the use of digital platforms to drive knowledge sharing, customer networking, and relationship building can be found on pages 22 to 25 and 27
Employees Health, wellbeing and safety at workA positive culture that values the unique contribution of individuals and addresses their different requirements of workAn environment that engages all employeesOpportunities to grow and develop Reward
Comprehensive health, safety and wellbeing programmes that touch all employeesEmployee engagement actions, integrated within business plans, at every levelAnnual Group-wide IMI Way Day and employee surveyWorkforce engagement at Board and management levels. This includes staff representative and Union participation. The European Communications Forum meets annually, with representatives from our key European geographies Appropriate engagement takes place at local level in relation to restructuring changes affecting the workforceA suite of face to face and online training and development programmes, targeted at business and employee needs. Leadership conferences, town hall meetingsTargeted individual, team and group communications through the Poppulo and Intranet platforms Independent confidential hotlineIntranet for each division and the GroupCorporate website
Health and safety – see pages 34 to 35IMI Way Day – see page 37Employee engagement – see pages 37 and 38 Training and development – see page 38Executive remuneration reflective of remuneration for the wider workforce – see page 96
Shareholders Financial returns Strategy and execution Sustainable approach Capital allocation
Annual General Meeting Active Investor Relations programme Investor and analyst engagement Chair and senior independent director available to shareholders Investor communications and corporate website Remuneration related consultation
Investor Relations programme – see pages 73 to 74Remuneration related consultation – see page 73
Suppliers Long-term partnerships Fair and timely payment/ commercial terms Collaborative approach
Ongoing commercial dialogue Supplier audits Supplier summits
Supply chain management – see page 06Modern slavery statement, Supply Chain Code of Conduct and Responsible Minerals Sourcing policy – see our website
Society/community
Positive social impact Employment opportunities Environmental impact on the neighbourhood where we operate and on the global community
Local community support and charitable activities University partnerships and Graduate Programme Active management of emissions and reduction plans across IMI sites
Community activities – see page 38Environmental, Social & Governance section – see pages 28 to 43Environmental performance – see pages 30 to 32
Governments Employment Tax income Sustainable approach to business
Engagement in relation to specific issues on an ad hoc basis Good corporate citizen with on time tax filings and other submissions to regulators and governments
Tax strategy on our website www.imiplc.com/esg
The table below shows our key stakeholder groups and summarises their principal issues and how we engage with them.
For information about how stakeholder interests are addressed by our business model, see page 12 and the Environmental, Social and Governance section on pages 28 to 43.
Our statement pursuant to Section 172 of the Companies Act 2006, which references stakeholder considerations and other factors in Board decision-making appears on pages 75 and 76.
Introduction Strategic Report Corporate Governance Financial Statements
45

Adjusted revenue
£877mAdjusted operating profit
£151m Up 2%
Down 3%
Operational review
IMI Precision Engineering Noida, India
IMI Precision Engineering specialises in the design and manufacture of motion and fluid control technologies where precision, speed and reliability are essential to the processes in which they are involved.
New solutions to satisfy China emissions legislation
IMI Precision Engineering has an established reputation for the development of products that help reduce emissions from heavy truck engines, including Diesel Air Inlet Throttles and the Smart Waste Gate valve. In June 2018 China released new emission standards, ‘China 6’ for heavy vehicles, to come into force in July 2021 and IMI’s products will therefore contribute to a substantial reduction in transport emissions and associated improvement in air quality in China. To support new customers in Asia, IMI has already developed solutions dedicated to those local emissions and efficiency requirements.
46 IMI plc Annual Report & Accounts 2020

2020 performanceIn 2020 IMI Precision Engineering has delivered significant progress in its structural reorganisation as well as a strong operational performance. The response to an unprecedented surge in ventilator valve demand was exemplary, as the business quickly and reliably scaled-up production by a factor of 10x.
Revenue, on both an organic and adjusted basis, was 3% lower than in 2019 at £877m. That result reflected performances in Motion Control (down 11% vs 2019) and Commercial Vehicle (down 25% vs 2019) that followed the trends evident across their wider segments. However, in the final quarter of the year, both segments delivered sequential improvements in revenue. The Fluid Technologies business delivered revenues 24% ahead of 2019, largely driven by the surge in demand for ventilator valves to satisfy the urgent global need in light of the pandemic. Ventilator valve sales totalled £117m in the year, reflecting a temporary surge of £94m above the more normal level of demand experienced in 2019 (£23m). Current expectations are for overall sales to return to c.£35m in 2021.
Operating profit of £151m for the year was 2% higher than in 2019 (£148m) on both an adjusted and organic basis, which resulted in margins of 17.3% (2019: 16.3%). The benefits of rationalisation, effective operational management, and sales mix all contributed to that robust performance.
OutlookBased on current market conditions, and assuming no worsening impact from Coronavirus, we expect the reversal of the temporary surge of ventilator demand to be largely offset by improving markets in Motion Control and Commercial Vehicle. This will result in IMI Precision Engineering 2021 organic revenues being slightly lower than 2020. Profits and margins are expected to be flat to slightly down as rationalisation benefits will be offset by the reversal of 2020 temporary savings and the mix effect from lower Life Sciences sales.
Key achievements» The rapid increase in production
and delivery of critical ventilator valves by more than 10x.
» Effective operational and supply chain management during a period of significant market volatility.
» Increasing resource dedicated to Growth Hub initiatives.
» Continued complexity reduction including delivery of planned restructuring benefits.
Beth Ferreira Divisional Managing Director
Introduction Strategic Report Corporate Governance Financial Statements
47

Adjusted revenue
£643mAdjusted operating profit
£107m Up 18%
Down 1%
Operational review
IMI Critical Engineering Rancho Santa Margarita, USA
IMI Critical Engineering is a world-leading provider of flow control solutions that enable vital energy and process industries to operate safely, cleanly, reliably and more efficiently. Our products control the flow of steam, gas and liquids in harsh environments and are designed to withstand temperature and pressure extremes as well as intensely abrasive or corrosive cyclical operations.
Innovative products to curtail noise disturbance
As more of the world has switched away from coal production, greater demands are being made of gas, and the infrastructure that delivers it. One major environmental issue with intensive use of pipelines is the noise that affects local communities. IMI Critical’s new product, dBX Shield, combining our Drag technology with our ball valve expertise, solves this problem, stopping unacceptable noise and vibration which impacts both people and animals.
48 IMI plc Annual Report & Accounts 2020

2020 performanceIMI Critical Engineering has delivered a very strong financial performance for the year, while continuing to reposition its business toward more attractive markets.
When compared with 2019, order input for the year decreased by 8% on an organic basis with New Construction down 17% and Aftermarket flat to 2019. Both New Construction and Aftermarket Field Service activities were adversely impacted by the effects of the pandemic. The division was able to again deliver good growth in Aftermarket Upgrade valves by focusing on solving identified operational problems being experienced by both existing and new customers.
Oil & Gas orders of £134m were up 9% and were supported by £58m of New Construction LNG orders, as well as 11% growth in Parts. Refining and Petrochemical orders of £177m were down 20%, reflecting reduced new build activity and maintenance budgets in the year.
Power orders of £190m were up 5%, with good growth in New Construction coming from projects in gas-fired and concentrated solar power stations. Within Power, New Construction Coal orders totalled only £16m in the year, now less than 3% of division order activity. Coal Aftermarket Parts orders were largely flat in the year, reflecting the resilience of the division’s installed base. Over 60% of these orders relate to valves installed within modern and/or favourably located facilities, providing confidence that this important annuity will continue into the future.
Marine orders of £33m were 51% lower than last year, which was expected due to a large multi-year order received in 2019. This remains a highly attractive part of IMI Critical’s portfolio which will provide long-term growth given its expanding product offering and geographic reach.
Nuclear orders increased 38% in the year to £78m, with over 90% of activity within the Aftermarket. IMI Critical benefits from the ongoing investment to install the latest technologies into older nuclear power facilities to significantly extend the lives of those assets.
The 2020 closing order book was £522m – up 1% when compared to 2019.
Organic revenue at £643m was 4% lower than in the previous year, and 1% lower when including the results of PBM and currency movements. New Construction sales were £309m (+7% vs. 2019), whilst Aftermarket sales were 12% lower than the previous year at £334m.
Operating profit of £107m was 14% ahead of 2019 on an organic basis, despite the decline in volumes, delivering a significant improvement in margins to 16.6% (2019: 13.8%).
OutlookBased on the opening orderbook and current market conditions, and assuming no worsening impact from Coronavirus, we expect IMI Critical Engineering 2021 organic revenues and profits to be broadly flat when compared to 2020.
Key achievements» Early order success from
Growth Accelerator teams.
» Strong upgrade Aftermarket order delivery.
» Accelerated progress with restructuring programme.
Jackie HuDivisional Managing Director
Introduction Strategic Report Corporate Governance Financial Statements
49

Adjusted revenue
£305mAdjusted operating profit
£56m Down 2%
Down 3%
Operational review
IMI Hydronic Engineering Erwitte, Germany
IMI Hydronic Engineering is a leading provider of technologies that delivers energy efficient water-based heating and cooling systems for the residential and commercial building sectors.
Thermostatic radiator controls providing significant energy savings
IMI Hydronic Engineering has long-established expertise in delivering effective and reliable thermostatic radiator valves for both domestic and commercial applications. IMI Heimeier’s Halo B thermostatic head delivers material energy savings, particularly when compared with manual controls, and in a variety of different settings. The solution not only saves energy for its user but, by extension, also results in lower CO2 emissions for the environment.
50 IMI plc Annual Report & Accounts 2020

Phil CliftonDivisional Managing Director
2020 performanceIMI Hydronic was notably affected in the first half of 2020 by construction site and installer access restrictions, as governments responded to the Coronavirus pandemic. The division experienced better conditions in most markets as the year progressed, including modest growth in Q4. While managing effectively the significant volatility and uncertainty of the pandemic year, IMI Hydronic continued to drive forward its strategic plan of simplification and growth.
Organic revenue was £305m, 4% lower than in 2019, with declines experienced across all sectors. Operating profit of £56m was 5% lower on an organic basis versus the prior year, and resulted in an improvement to the operating margin to 18.3%. The division’s simplification project is now largely complete, and on track to deliver the targeted £3m of savings by the end of 2021.
OutlookBased on current market conditions, and no worsening impact from Coronavirus, IMI Hydronic Engineering’s 2021 organic revenues and margins are expected to be slightly higher than in 2020.
Key achievements» Strong operational
performance in volatile markets.
» Delivery of supply chain simplification and Slovenia factory closure.
» Continued progress with cultural shift and Growth Accelerator projects.
Introduction Strategic Report Corporate Governance Financial Statements
51

IMI achieved a good financial result in 2020, with improved margins in all divisions and strong cash generation despite the difficult trading environment.
Key highlightsContinuing operations:
Adjusted1 Statutory
2020 2019 Change Organic5 2020 2019 Change
Revenue £1,825m £1,873m -3% -4% £1,825m £1,873m -3%
Operating profit £285m £266m +7% +5% £227m £204m +11%
Operating margin 15.6% 14.2% +140bps
Profit before tax £274m £251m +9% £214m £189m +13%
Basic EPS2 79.7p 73.2p +9% 62.7p 57.6p +9%
Operating cash flow3 £335m £299m +12%
Dividend per share4 22.5p 41.1p -45%
Net debt £316m £438m
1 Excluding the effect of adjusting items as reported in the income statement.2 Statutory amounts for Basic EPS include both continuing and
discontinued operations.3 Operating cash flow, as described in Note 19 to the financial statements.
4 The 2019 Dividend per share includes the postponed dividend that was paid in September 2020.
5 Change shown after adjusting for exchange rates and excluding the impact of acquisitions (see Note 4).
Results summaryTo facilitate a more meaningful review of performance, certain alternative performance measures (‘APMs’) have been included within this Annual Report. These APMs are used by the Executive Committee to monitor and manage the performance of the Group, in order to ensure that decisions taken align with its long-term interests. Movements in adjusted revenue and operating profit are given on an organic basis (see definition in Note 3) so that performance is not distorted by acquisitions, disposals and movements in exchange rates. A table summarising the reconciliation of adjusted measures to statutory measures is included in Note 4.
The Group delivered a good financial result in the year, as both margins and cash flow improved despite the difficult trading conditions experienced in certain end markets. Revenue decreased by 3% to £1,825m (2019: £1,873m). The exchange rate adjustment was nil and after adjusting for £19m of sales for the first 9 months of 2020 in IMI PBM, that were not in the comparative period in 2019 as this was prior to the acquisition, organic revenue was 4% lower and reflects the challenging economic markets as a result of the global pandemic.
Adjusted operating profit of £285m (2019: £266m) was 7% higher, and after removing the £2m favourable impact of exchange rates and the inorganic element of the PBM acquisition was higher by 5%. The adjusted operating margin was 15.6% (2019: 14.2%) as the Group was able to manage effectively through the difficulties brought on by the pandemic. All three divisions grew margins in the year, supported by the benefits of ongoing restructuring programmes and value-pricing initiatives. Statutory operating profit was £227m (2019: £204m). We consider that the presentation of adjusted results allows for improved insight to the trading performance of the Group.
Adjusted net financing costs on net borrowings of £11.0m (2019: £14.9m) was lower due to the repayment of a US$100m loan in the second half of 2019 and a one-off benefit to interest from tax refunds, and includes the impact of £2.5m (2019: £2.3m) interest cost on leases. Adjusted net financing costs were covered 35 times (2019: 24 times) by continuing adjusted earnings before interest, tax, depreciation, amortisation, impairment and adjusting items of £380m (2019: £357m) and included £30m (2019: £32m) of depreciation on our leased assets. The net pension financing income under IAS 19 was £0.2m (2019: £0.5m expense).
Financial review
52 IMI plc Annual Report & Accounts 2020

Adjusted profit before taxation was £274m (2019: £251m), which is higher by 9% compared to 2019. Statutory profit before taxation increased 13% to £214m (2019: £189m) as the Group continued its restructuring activities to address current market realities and improve long-term competitiveness.
Adjusting items and discontinued operations
Adjusting items that are excluded from profit before tax are listed below:
» Changes in the fair value of economic hedges which are not designated as hedges for accounting purposes, together with the gains and losses on their settlements, are included in the adjusted revenues and operating profit of the relevant business segment with the net loss at £2m (2019: gain of £4m). The adjusting items at the operating level reverse this treatment. The net financing adjusting items reflect the change in value or settlement of these contracts with the financial institutions with whom they were transacted.
» The restructuring costs of £36m (2019: £52m) are a result of a number of significant restructuring projects across the Group. These include the continuation of a cost and footprint rationalisation programme within IMI Precision, £5m in Europe and £2m in the Americas, which include the closure of a manufacturing site in each region. In IMI Critical, adjusted restructuring costs related to a restructuring programme in the EMEA region of £23m, which included the closure of manufacturing at two Italian sites and restructuring at two German sites, and £2m in the Americas to right size the workforce. In IMI Hydronic, there were costs of £5m related to the closure of a manufacturing site in Slovenia and consolidation of the Swedish and German distribution hubs into one hub in Poland. There was a provision release of £1m related to the Corporate HQ following the closure of matters relating to previous projects. Details of 2019 projects are included in Note 3.
» In 2019, gains on special pension events were £9m. A gain in respect of an accounting adjustment for Swiss disability benefits was recognised for £5m. In addition, within Switzerland there was a gain of £3m in respect of a restructure of the pension benefits and curtailment and settlement gains of £1m.
» In 2020, the Group recorded an adjusting impairment charge of £2m (2019: £2m) associated with the restructuring programme ongoing in IMI Precision Engineering and IMI Critical Engineering.
» Acquired intangible amortisation is excluded from adjusted profits, to allow for better comparability of the performance across divisions. This allows users of the financial statements to gain a clearer understanding of the performance of the business, with the impact of amortisation identified separately in line with internal reporting to management. Acquired intangible amortisation reduced to £19m (2019: £20m), which largely relates to the amortisation of the intangible assets recognised on the acquisition of Bimba in 2018. In 2019 there was a release of the fair value uplift to inventory, recognised as part of the PBM acquisition accounting in accordance with IFRS 3 ‘Business Combinations’, of £1m.
» A net loss arose on the revaluation of financial instruments and derivatives under IFRS 9 of £2m (2019: £0.4m gain).
» There was a pre and post-tax gain of £3m in 2019 from discontinued operations relating to the finalisation of a number of matters relating to historical discontinued operations.
TaxationThe adjusted effective tax rate for the Group remained at 21% (2019: 21%). The total adjusted tax charge for the year on continuing operations was £58m (2019: £53m). The Group seeks to manage its tax affairs within its core tax principles of compliance, fairness, value and transparency, in accordance with the Group’s Tax Policy which is available on the Group’s corporate website.
Earnings per shareThe Board considers that a more meaningful indication of the performance of the Group is provided by adjusted earnings per share. Adjusted basic EPS was 79.7p (2019: 73.2p) and increased by 9%. Statutory basic EPS increased by 9% at 62.7p (2019: 57.6p) and statutory diluted EPS increased by 9% at 62.6p (2019: 57.6p).
Adjusting Items 2020£m
2019£m
Reversal of net economic hedge contract (gains)/losses (2) 4
Restructuring costs (36) (52)
Gains on special pension events - 9
Impairment losses (2) (2)
Acquired intangible amortisation and other acquisition items
(19) (21)
Net financing (costs)/income (2) -
Tax in connection with the above adjusting items 13 17
Introduction Strategic Report Corporate Governance Financial Statements
53

Financial review
Cash flow
Adjusted operating cash flow was £335m (2019: £299m). This represents a conversion rate of total Group adjusted operating profit to adjusted operating cash flow of 117% (2019: 112%).
Net working capital balances decreased £15m due to a reduction in receivables of £18m as a result of good cash collection across the Group and an increase in payables of £6m due to overall payment timing, partly offset by an increase in inventory of £9m. The decrease in 2019 of £13m was due to a decrease in receivables of £45m partly offset by an increase in inventory of £15m and a decrease in payables of £17m.
Cash spent on property, plant and equipment and other non-acquired intangibles in the year was £51m (2019: £66m) which was equivalent to 0.8 times (2019: 1.1 times) depreciation and amortisation thereon. Capital spending in 2020 was deliberately curtailed during the pandemic given the economic uncertainty; expectations are for a return to historical levels of £60-70m in the future. Research and development spend, including capitalised intangible development costs of £7m (2019: £9m), totalled £46m (2019: £52m).
In 2020 the Group paid tax of £41m (2019: £40m) which was 71% (2019: 76%) of the adjusted tax charge for the year.
Dividends paid to shareholders totalled £92m (2019: £111m), reflecting the Group’s decision to reduce its distribution to provide a dividend earnings cover baseline of three times Adjusted Earnings per Share, which will enable IMI to deliver more effectively on its long-term growth ambitions. In addition, there was a cash outflow of £9m (2019: £3m outflow) for net share purchases to satisfy employee share options.
Balance sheet
Net debt at the year end was £316m compared to £438m at the end of the previous year. The decrease reflects strong cash generation in the year including good working capital management. The net debt is composed of a cash balance of £208m (2019: £88m), a bank overdraft of £74m (2019: £60m), interest-bearing loans and borrowings of £362m (2019: £376m) and lease liabilities of £88m (2019: £90m).
The year end net debt to adjusted EBITDA ratio was 0.8 times (2019: 1.2 times) based on continuing adjusted EBITDA. At the end of 2020, loan notes totalled £362m (2019: £358m), with a weighted average maturity of 5.3 years (2019: 6.3 years) and other loans including bank overdrafts totalled £74m (2019: £78m). Total committed bank loan facilities available to the Group at the year end were £300m (2019: £300m), of which nil (2019: £17m) was drawn.
At 31 December 2020, the value of the Group’s intangible assets was £600m (2019: £619m). The decrease of £19m over the prior year was predominately due to amortisation and impairment of £39m offset by additions of £13m and an increase arising from exchange movements of £7m.
The net book value of the Group’s PPE at 31 December 2020 was £266m (2019: £271m). Capital expenditure on PPE amounted to £38m (2019: £47m), with the main capital expenditure focused on developing production facilities to support operational efficiency as well as to increase capacity to accommodate the increase in ventilator component demand. Including capitalised intangible assets, total capital expenditure was £51m (2019: £66m) and was 0.8 times (2019: 1.1 times) the depreciation and amortisation charge (excluding acquired intangible amortisation and lease asset depreciation) for the year of £63m (2019: £59m).
The net deficit for defined benefit obligations at 31 December 2020 was £22m (2019: £31m deficit). The UK surplus was £69m (2019: £48m surplus) and constituted 77% (2019: 76%) of the total defined benefit liabilities and 89% (2019: 88%) of the total defined benefit assets. The deficit in the overseas funds as at 31 December 2020 was £91m (2019: £79m deficit).
Movement in net debt 2020£m
2019£m
Adjusted EBITDA* from continuing operations 379.5 357.3
Working capital movements 14.6 12.9
Capital and development expenditure (50.7) (65.8)
Provisions and employee benefit movements** 8.5 6.5
Principal elements of lease payments (28.7) (31.3)
Other 11.3 19.2
Adjusted operating cash flow*** 334.5 298.8
Adjusting items**** (36.7) (26.2)
Interest (11.0) (14.9)
Derivatives (22.5) 16.1
Tax paid (41.0) (40.2)
Additional pension scheme funding (7.0) (7.0)
Free cash flow before corporate activity 216.3 226.6
Dividends paid to equity shareholders (91.6) (110.8)
Acquisition of subsidiaries - (69.0)
Net purchase of own shares (8.5) (3.4)
Net cash flow (excluding debt movements) 116.2 43.4
Reconciliation of net cash to movement in net borrowings
Net increase/(decrease) in cash and cash equivalents excluding foreign exchange
98.4 (19.5)
Repayment of borrowings excluding foreign exchange and net debt disposed/acquired
17.8 62.9
Decrease/(increase) in net debt before acquisitions, disposals and foreign exchange
116.2 43.4
Net cash/(debt) acquired - 1.0
Currency translation differences 3.3 12.7
Movement in lease creditors 2.1 (90.4)
Movement in net borrowings in the year 121.6 (33.3)
Net borrowings at the start of the year (437.8) (404.5)
Net borrowings at the end of the year (316.2) (437.8)
* Adjusted profit after tax (£216.4m) before interest (£10.8m), tax (£57.5m), depreciation (£76.1m), amortisation (£16.3m) and impairment (£2.4m).
** Movement in provisions and employee benefits as per the statement of cash flows (£7.9m) adjusted for the movement in restructuring provisions (£0.6m).
*** Adjusted operating cash flow is the cash generated from the operations shown in the statement of cash flows less cash spent acquiring property, plant and equipment, non-acquired intangible assets and investments; plus cash received from the sale of property, plant and equipment and the sale of investments, excluding the cash impact of adjusting items. This measure best reflects the operating cash flows of the Group.
**** Cash impact of adjusting items.
54 IMI plc Annual Report & Accounts 2020

Return on capital employed (‘ROCE’)The Group uses ROCE as an indication of IMI’s ability to deploy capital effectively. The Group’s definition is Adjusted Operating Profit after tax divided by Average Capital employed. Capital employed is defined as net assets adjusted to remove net debt, derivative assets/liabilities, defined pension position (net of deferred tax) and to reverse historical impairments of goodwill and amortisation of acquired intangibles. ROCE was 12.3% in 2020 (2019: 11.4%) which increased by 0.9%.
Foreign exchange The income statements of overseas operations are translated into sterling at average rates of exchange for the year, balance sheets are translated at year end rates. The most significant currencies are the euro and the US dollar – the relevant rates of exchange were:
The movement in average exchange rates between 2019 and 2020 provided no impact to our adjusted 2020 revenue and a 1% increase in adjusted operating profit, with the average US dollar rate flat and the Euro rate being 1% stronger.
If the exchange rates as at 12 February 2021 of US$1.39 and €1.14 were projected for the full year and applied to our 2020 results, it is estimated that both adjusted revenue and profits (including corporate costs) would be 3% lower.
TreasuryIMI has a centralised Treasury function that provides treasury services to Group companies including funding liquidity, credit, foreign exchange, interest rate and base metal commodity management. The Group Treasury function effectively manages financial risks in compliance with Board-approved policies. Further details of the Group’s financial risk management are included in Note 18.
BrexitThe Group generates 5% of sales in the United Kingdom. Whilst not a significant percentage of the Group’s revenue, the Group has taken steps to fully prepare for any potential impacts following the UK’s withdrawal from the EU on 31 December 2020. We have fine-tuned our Brexit mitigation plan and established a Brexit contingency stock of £3m at the year end. Developments are being monitored and further mitigation actions may be taken as appropriate. Brexit is also considered within our principal risks, see page 62.
Capital allocation & dividend policyThe Board determines the appropriate capital structure for the Group, specifically, how much cash is raised from shareholders (equity) and how much is borrowed from financial institutions (debt) in order to finance the Group’s activities both now and in the future.
The Board considers the Group’s capital structure and dividend policy at least twice a year ahead of announcing results in the context of its ability to continue as a going concern and deliver its business plan.
The Board is mindful that equity capital cannot be easily flexed and raising new equity would normally be likely only in the context of an acquisition. Debt can be issued and repurchased more easily, but frequent changes lead to high transaction costs and debt holders are under no obligation to accept repurchase offers.
At 31 December 2020, IMI plc (the company) had distributable reserves of £292m (2019: £303m).
Daniel Shook Finance Director
Average Rates
Balance Sheet Rates
Foreign Exchange 2020 2019 2020 2019
Euro 1.13 1.14 1.12 1.18
US Dollar 1.28 1.28 1.37 1.32
Note 2020£m
2019£m
Adjusted Operating Profit 284.7 266.1
Notional Tax charge (59.8) (55.9)
Net Adjusted Operating Profit after tax 224.9 210.2
Net Assets 799.5 709.9
Adjusted for:
Net debt 19 316.2 437.8
Restructuring provision 20 30.1 29.4
Net derivative assets / liabilities 17 (6.1) (4.3)
Net defined pension benefit 14 22.0 31.3
Deferred tax on employee benefits (7.0) (9.3)
Previously written-off / impaired goodwill 351.9 351.9
Acquired intangibles amortisation 11 311.5 285.6
Closing capital employed 1,818.1 1,832.3
Opening capital employed 1,832.3 1,848.0
Average capital employed 1,825.2 1,840.2
ROCE 12.3% 11.4%
Introduction Strategic Report Corporate Governance Financial Statements
55

Key Performance Indicators
The Key Performance Indicators (‘KPIs’) set out below represent financial and non-financial measures which are integral to the delivery of our strategy and are used to track progress.
Adjusted Operating Profit is a target for the 2020 & 2021 Annual Bonus. Return on Capital Employed and Adjusted Earnings per Share are performance targets for the 2020 & 2021 IIP. See page 107 for further details.
Lost Time Accidents
0.08 0.076 0.075
2019*2018 2020
0.2
0.15
0.1
0.05
Per 100,000 hours
Why is this a KPI?Growing our profits will ultimately generate value for our shareholders and create more opportunity to invest further.
DefinitionThe Group’s Operating Profit before the adjusting items described in Note 3, which ensures a consistent basis for comparison.
PerformanceAdjusted operating profit improved in 2020, despite the revenue fall, reflective of the commercial and operational focus during the year. Operating margins improved 140bps to 15.6%.
Why is this a KPI?The engagement of our employees is key to retaining the existing skills and promoting and attracting employees who bring new ideas and capabilities.
DefinitionWe carry out an annual employee survey as part of our ‘IMI Way Day’ and use the response to certain questions as the gauge of employee engagement. This score is in response to the percentage of employees who would recommend IMI as a good employer to family and friends.
PerformanceWe continue to maintain a high percentage of employees that would recommend IMI as a good employer to family and friend.
Adjusted Operating Profit
20192018 2020
265.5 266.1 284.7
300
200
100
£m
Employee Engagement
20192018 2020
100
75
50
25
%
71 74 73
Organic Sales Growth
Why is this a KPI?Delivering consistent growth is an important part of building sustainable value for shareholders.
DefinitionOrganic sales is stated at constant exchange rates and excludes the incremental effect of acquisitions and disposals. For 2020 that means we are excluding the 9 months of sales for PBM in 2020 where PBM was not owned in the comparative period.
PerformanceSales declined in 2020, reflective of the difficult market conditions partly brought on by the Coronavirus pandemic.
5-3 -4
20192018 2020
10
5
0
-5
%
Why is this a KPI?The health and safety of all who work at IMI is paramount. Ensuring a safe working environment is closely linked to our business success, including attracting and retaining the best talent.
DefinitionWe measure our progress in this area by tracking our >1 day lost time accident frequency rate (‘LTA rate’) per 100,000 hours. This includes visitors and contractors.
PerformanceIn 2020 our LTA rate reduced to 0.075 with no fatalities, reflecting the Group’s continued focus on identifying and reducing workplace hazards.
* The 2019 Lost Time Accident rate has been restated to 0.076, from 0.072 reported in 2019, due to the reclassification of an injury and follow up treatment.
56 IMI plc Annual Report & Accounts 2020

Business model: Turn to page 12
Annual Directors’ Remuneration Report: Turn to page 85
Our KPIs have been designed to drive the Group towards meeting our strategic objectives outlined in our business model. See pages 12 and 13 for details.
Why is this a KPI?The measure provides an indication of IMI’s ability to deploy capital effectively.
DefinitionAdjusted Operating Profit after tax divided by Average Capital employed. Capital employed is defined as net assets adjusted to remove net debt, derivative assets/liabilities, defined benefit pension position (net of deferred tax) and to reverse historical impairments of goodwill and amortisation of acquired intangible assets.
PerformanceThe Group’s Return on Capital Employed improved in 2020 to 12.3%, reflecting the profit improvement in the year and continued working capital management.
Why is this a KPI?Creating consistent long-term value for shareholders.
DefinitionAdjusted Profit after tax divided by the weighted average number of basic ordinary shares.
PerformanceAdjusted EPS increased in the year to 79.7p, despite the difficult market environment.
Why is this a KPI?Cash generation supports investment in our business and enables the Group to provide returns to shareholders through dividends. Strong cash generation also ensures a strong balance sheet, giving customers and suppliers confidence in the future of the Group.
DefinitionCash Conversion is the Adjusted Operating Cash flow as a percentage of the Adjusted Operating Profit.
PerformanceCash Conversion was again strong in 2020 at 117% supported by a working capital inflow of £15m and lower capital spend, with expectations for capital spend to return to historical levels in the future.
Adjusted Earnings Per Share
73.2 73.2 79.7
20192018 2020
100
75
50
25
Pence
Cash Conversion
83 112 117
20192018 2020
125
100
75
50
25
%
Return on Capital Employed
12.311.4
20192018 2020
20
15
10
5
%
Reflects proforma adjustment for IFRS 16
12.2
57
Introduction Strategic Report Corporate Governance Financial Statements

How we manage risk
Our risk management processes are embedded in all our businesses and are designed to identify, evaluate and manage the risks which could impact our performance, our reputation or our ability to successfully execute our strategy.Our risk management frameworkThe Board has overall responsibility for ensuring that we manage our risk exposure appropriately to achieve our strategic objectives and build sustainable shareholder value. This involves assessment of principal risks and emerging risks.
The Board determines our risk appetite and reviews the risk management processes we operate. The Board delegates responsibility for implementing and monitoring internal controls and other elements of risk management to the Chief Executive and the executive team. The Board has also tasked its committees with responsibility for key areas of risk, as follows:
» oversight of financial reporting, internal financial controls and assurance processes – the Audit Committee;
» talent and succession risk – the Nominations Committee; and
» remuneration and incentive structure risk – the Remuneration Committee.
Further information about the roles and responsibilities of the Board and each Committee is set out on page 73.
How we approach risk managementAcross the Group we operate a ‘top-down, bottom-up approach’ to risk management which is illustrated in the graphic below. This approach allows the Board and the Executive Committee to actively assess strategic risks and monitor the measures used to mitigate, transfer or avoid such risks. It also ensures that operational risks are identified and managed at multiple levels and that key risk information is communicated effectively across the Group.
Our risk management process is embedded in all our businesses and is a core element of our strategy review and monthly operational meetings. It provides guidance in relation to the identification, evaluation and management of risks, including emerging risks, which could impact our performance and our ability to implement our strategy.
Strategic risk management process Operational risk management process
» Determines risk appetite.
» Reviews principal risks.
» Monitors and reviews risk management processes.
Board » Reviews bi-annually a detailed analysis of the Group’s risk profile including supporting divisional data and the actions undertaken.
» Reviews annually the effectiveness of the Group’s internal controls.
» Responsible for ensuring risk management culture is integrated across their division and aligned to the Group’s objectives.
» Determines principal risks and mitigation strategies.
» Monitors changes in the risk profile.
» Monitors quality and effectiveness of business level risk management processes.
Divisional and Group Executive
» Risks, mitigating controls and outstanding actions presented and challenged at operation performance reviews.
» Develops bi-annually a detailed Group and divisional risk profile. This profile analyses each division’s most significant risks and outlines mitigation strategies.
» Horizon scans for new emerging risks using a number of mechanisms including divisional strategic and monthly reviews and market, competitor and product developments.
» Create risk profiles for each manufacturing operation either once or twice a year depending on the operation’s risk profile.
» Operates and monitors an active and effective risk management process.
» Operates reporting systems that increase management ownership and accountability.
Operating companies
» Maintains an up-to-date risk profile which identifies the key risks facing the business, assesses mitigating processes and controls, operates key performance indicators to validate the effectiveness of those controls and identifies areas for improvement.
» Provides monthly updates on key risks, mitigation and controls through incorporation of risk profile data in monthly management reporting process.
58 IMI plc Annual Report & Accounts 2020
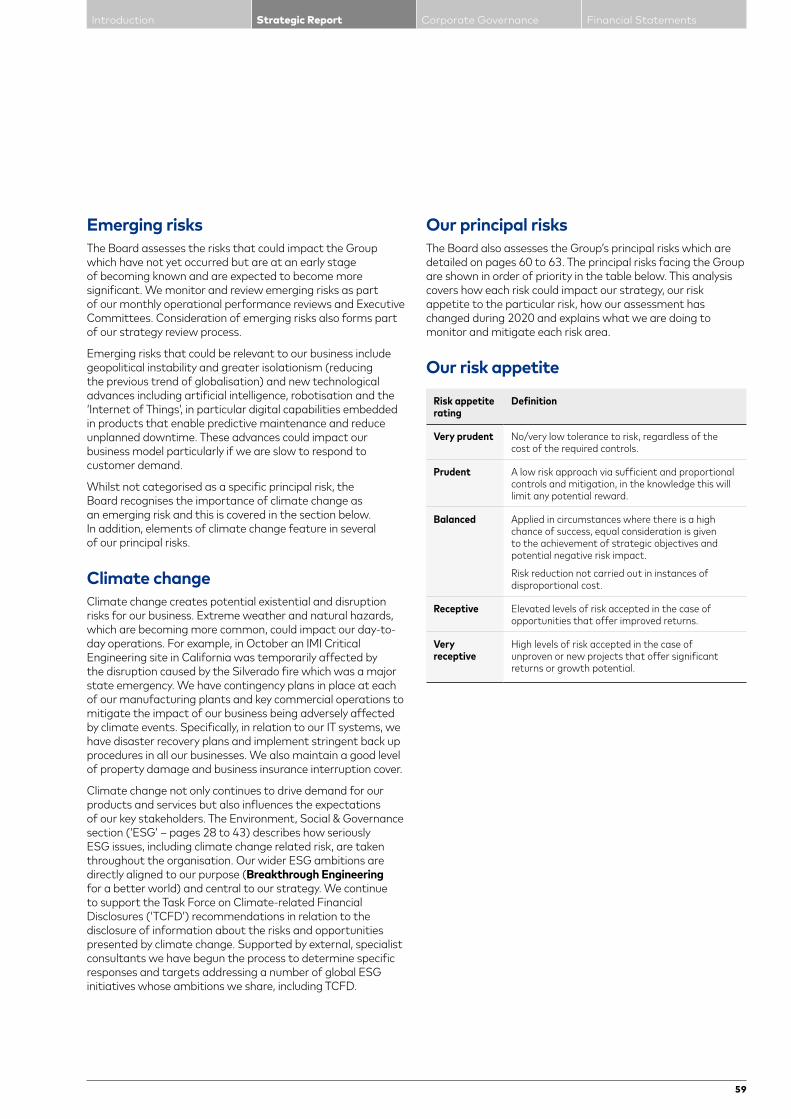
Emerging risksThe Board assesses the risks that could impact the Group which have not yet occurred but are at an early stage of becoming known and are expected to become more significant. We monitor and review emerging risks as part of our monthly operational performance reviews and Executive Committees. Consideration of emerging risks also forms part of our strategy review process.
Emerging risks that could be relevant to our business include geopolitical instability and greater isolationism (reducing the previous trend of globalisation) and new technological advances including artificial intelligence, robotisation and the ‘Internet of Things’, in particular digital capabilities embedded in products that enable predictive maintenance and reduce unplanned downtime. These advances could impact our business model particularly if we are slow to respond to customer demand.
Whilst not categorised as a specific principal risk, the Board recognises the importance of climate change as an emerging risk and this is covered in the section below. In addition, elements of climate change feature in several of our principal risks.
Climate changeClimate change creates potential existential and disruption risks for our business. Extreme weather and natural hazards, which are becoming more common, could impact our day-to-day operations. For example, in October an IMI Critical Engineering site in California was temporarily affected by the disruption caused by the Silverado fire which was a major state emergency. We have contingency plans in place at each of our manufacturing plants and key commercial operations to mitigate the impact of our business being adversely affected by climate events. Specifically, in relation to our IT systems, we have disaster recovery plans and implement stringent back up procedures in all our businesses. We also maintain a good level of property damage and business insurance interruption cover.
Climate change not only continues to drive demand for our products and services but also influences the expectations of our key stakeholders. The Environment, Social & Governance section (‘ESG’ – pages 28 to 43) describes how seriously ESG issues, including climate change related risk, are taken throughout the organisation. Our wider ESG ambitions are directly aligned to our purpose (Breakthrough Engineering for a better world) and central to our strategy. We continue to support the Task Force on Climate-related Financial Disclosures (‘TCFD’) recommendations in relation to the disclosure of information about the risks and opportunities presented by climate change. Supported by external, specialist consultants we have begun the process to determine specific responses and targets addressing a number of global ESG initiatives whose ambitions we share, including TCFD.
Our principal risksThe Board also assesses the Group’s principal risks which are detailed on pages 60 to 63. The principal risks facing the Group are shown in order of priority in the table below. This analysis covers how each risk could impact our strategy, our risk appetite to the particular risk, how our assessment has changed during 2020 and explains what we are doing to monitor and mitigate each risk area.
Our risk appetite
Risk appetite rating
Definition
Very prudent No/very low tolerance to risk, regardless of the cost of the required controls.
Prudent A low risk approach via sufficient and proportional controls and mitigation, in the knowledge this will limit any potential reward.
Balanced Applied in circumstances where there is a high chance of success, equal consideration is given to the achievement of strategic objectives and potential negative risk impact.
Risk reduction not carried out in instances of disproportional cost.
Receptive Elevated levels of risk accepted in the case of opportunities that offer improved returns.
Very receptive
High levels of risk accepted in the case of unproven or new projects that offer significant returns or growth potential.
Introduction Strategic Report Corporate Governance Financial Statements
59

Risk, link to strategy and risk appetite Change Risk mitigation including specific 2020 actions
1. Global economic or political uncertainty
The Group operates in diverse global markets and demand for our products is dependent on economic and sector-specific environments. A downturn in the global or a regional economy, brought on by economic cycles, political instability, health or environmental emergencies, could impact end market demand and as a result negatively impact revenue and our ability to deliver our strategy and achieve market expectations.
Link to strategyStrengthening customer intimacyReducing complexityDriving market-led innovation
Risk appetite
Balanced
No change
This continues to be one of the Group’s highest risks, as evidenced by the significant fall in demand for discretionary products in Q2 due to the Coronavirus pandemic.
Whilst IMI Precision saw a substantial increase in the demand for its life science products in 2020, in Q2, demand for Commercial Vehicles was down 51% and Motion Control was down 19% before improving.
IMI Critical continues to face highly competitive markets and faces a structural decline in the New Construction Fossil Power sector. The pandemic has also placed restrictions on the levels of field service work.
IMI Hydronic saw a decline in demand, for a period this year, as construction activity reduced due to the pandemic.
We compile annual strategic plans and maintain a balanced portfolio operating across a range of markets, sectors and geographies with no significant single dependency.
Our divisions ensure their forecasting processes include scenario stress testing, reviews of sector metrics and early indications of reduced customer demand to allow proactive and rapid management of plant output.
We have continued to improve our performance during the year through rationalisation and restructuring programmes. All three divisions are continuing with restructuring programmes to optimise their operational footprint. The Group has not closed down operations and declared redundancies as a direct result of the Coronavirus pandemic.
Brexit mitigation measures are in place to address supply chain issues and continue to serve customer needs.
2. Business disruption / Natural disasters
The risk to life or disruption to production caused by large scale events such as, pandemics, fires, floods, international conflicts etc.
Link to strategyStrengthening customer intimacyReducing complexityDigital
Risk appetite
Very prudent
Increased
Although this risk has partly been reflected within the global economic or political uncertainty risk above, it has specifically been added in response to the COVID-19 pandemic.
From the onset of the COVID-19 pandemic the Executive Committee, supported by a cross-function, cross divisional team has led the mitigation against this risk, initially meeting three times a week. Rapid changes were made to sites to ensure the wellbeing of our employees and to reduce the risk of disruption. Where possible home working has been supported for indirect employees. Site risk assessments were carried out and site response plans activated to ensure appropriate measures were in place (these included infection control measures, restriction of visitors, vastly reduced international travel, changes to the layout of some sites, increased communications, shutdown procedures, transfer of production to alternative sites, substitute suppliers etc).
We have been supporting our employees not only with the issuance of personal protective equipment, but also with information on working safely, mask usage guides and how employees can protect themselves and their families outside of the factories allowing them to undertake their own personal risk assessments. Whilst travel has been drastically curtailed, we have utilised video conferencing and devices like Google lens to assist in field service calls, remote site inspection & assurance walks and to facilitate customer acceptance testing.
Our principal risks
60 IMI plc Annual Report & Accounts 2020
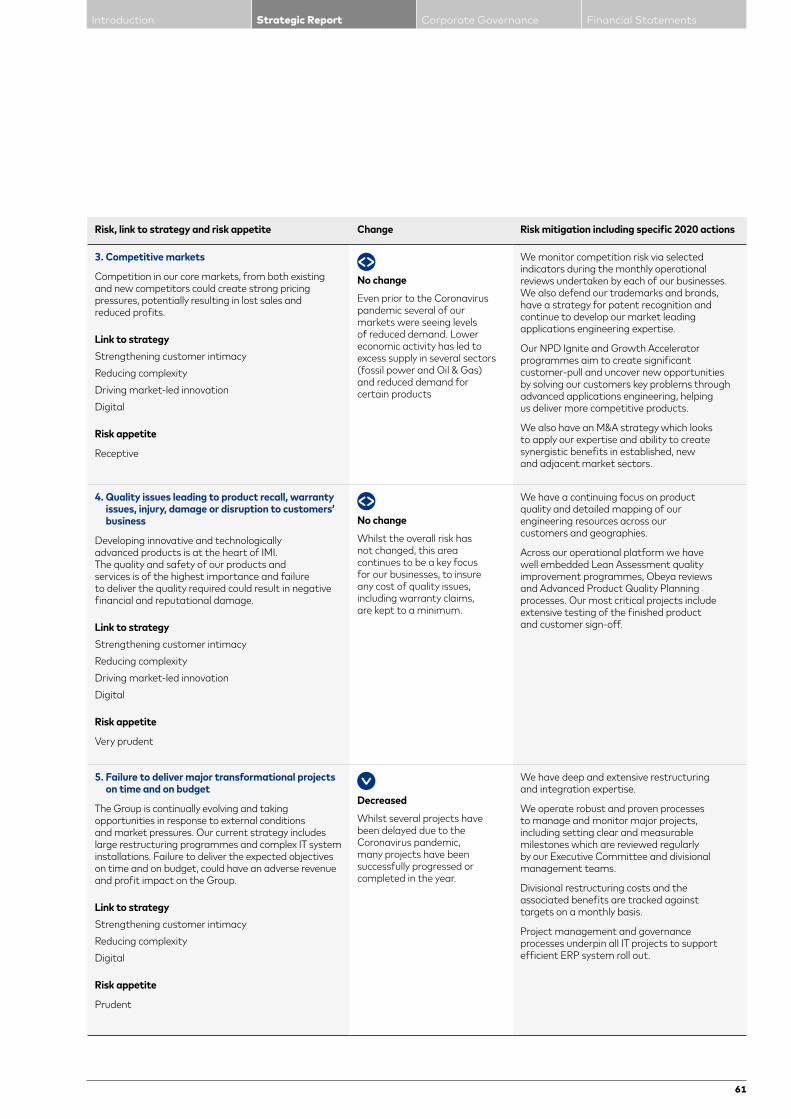
Risk, link to strategy and risk appetite Change Risk mitigation including specific 2020 actions
3. Competitive markets
Competition in our core markets, from both existing and new competitors could create strong pricing pressures, potentially resulting in lost sales and reduced profits.
Link to strategyStrengthening customer intimacyReducing complexityDriving market-led innovationDigital
Risk appetite
Receptive
No change
Even prior to the Coronavirus pandemic several of our markets were seeing levels of reduced demand. Lower economic activity has led to excess supply in several sectors (fossil power and Oil & Gas) and reduced demand for certain products
We monitor competition risk via selected indicators during the monthly operational reviews undertaken by each of our businesses. We also defend our trademarks and brands, have a strategy for patent recognition and continue to develop our market leading applications engineering expertise.
Our NPD Ignite and Growth Accelerator programmes aim to create significant customer-pull and uncover new opportunities by solving our customers key problems through advanced applications engineering, helping us deliver more competitive products.
We also have an M&A strategy which looks to apply our expertise and ability to create synergistic benefits in established, new and adjacent market sectors.
4. Quality issues leading to product recall, warranty issues, injury, damage or disruption to customers’ business
Developing innovative and technologically advanced products is at the heart of IMI. The quality and safety of our products and services is of the highest importance and failure to deliver the quality required could result in negative financial and reputational damage.
Link to strategyStrengthening customer intimacyReducing complexityDriving market-led innovationDigital
Risk appetite
Very prudent
No change
Whilst the overall risk has not changed, this area continues to be a key focus for our businesses, to insure any cost of quality issues, including warranty claims, are kept to a minimum.
We have a continuing focus on product quality and detailed mapping of our engineering resources across our customers and geographies.
Across our operational platform we have well embedded Lean Assessment quality improvement programmes, Obeya reviews and Advanced Product Quality Planning processes. Our most critical projects include extensive testing of the finished product and customer sign-off.
5. Failure to deliver major transformational projects on time and on budget
The Group is continually evolving and taking opportunities in response to external conditions and market pressures. Our current strategy includes large restructuring programmes and complex IT system installations. Failure to deliver the expected objectives on time and on budget, could have an adverse revenue and profit impact on the Group.
Link to strategyStrengthening customer intimacyReducing complexityDigital
Risk appetite
Prudent
Decreased
Whilst several projects have been delayed due to the Coronavirus pandemic, many projects have been successfully progressed or completed in the year.
We have deep and extensive restructuring and integration expertise.
We operate robust and proven processes to manage and monitor major projects, including setting clear and measurable milestones which are reviewed regularly by our Executive Committee and divisional management teams.
Divisional restructuring costs and the associated benefits are tracked against targets on a monthly basis.
Project management and governance processes underpin all IT projects to support efficient ERP system roll out.
Introduction Strategic Report Corporate Governance Financial Statements
61

Our principal risks
Risk, link to strategy and risk appetite Change Risk mitigation including specific 2020 actions
6. Failure to integrate acquisitions successfully and deliver the required synergies
Underperforming acquisitions deliver below expectation synergies and reduced profit. If material, this can significantly impact shareholder value.
Link to strategyReducing complexityDigital
Risk appetite
Receptive
No change
The acquisition of PBM (which gives us access to the Pharmaceutical and Food Processing markets) was completed in 2019. Bimba was acquired in 2018 and has been integrated into IMI Precision. We continue to manage these operations to ensure they deliver value and the planned synergies, and provide ongoing support and training for the local management teams.
We have in-house M&A expertise and, as highlighted previously, operate a proven structured integration process.
The strategic review process helps identify value enhancing acquisitions which would align with the Group’s strategy. Once identified, a formalised acquisition approval, due diligence and integration process is followed. Upon completion, a detailed 100-day process is used to ensure adequate resources are in place, progress is on schedule and the identified synergies (both hard and soft) are being realised.
7. Unauthorised access to our IT systems
Given the digital and security threat environment is constantly evolving, we can never fully guarantee that our actions will stop all external threats.
Unapproved access to our IT systems could result in loss of intellectual property, fraudulent activity, theft and business interruption.
Link to strategyReducing complexityDigital
Risk appetite
Very prudent
No change
During 2020, we continued to detect, block and remediate threats on an ongoing basis. The volume and complexity of threats continue to rise, these include malware, ransomware, attempted data theft, credential theft, phishing and external hacking attempts.
To counter the increase in threat activity we continue our significant investment in detective and preventative IT measures. With the increased amount of homeworking we have enhanced firewall protection.
We have a well-developed IT security strategy, which is reviewed monthly. Due to the increased homeworking during the Coronavirus pandemic the IT Security team met daily to safeguard the security perimeter of the network. We continue to implement improvements to our IT infrastructure to keep abreast of new threats.
We continue to strengthen our security baseline through the enablement of automated global software updates and automatic lockdown capabilities. We have also strengthened our digital forensic capabilities and remediation processes in the event of a cyber security incident occurring.
We regularly test our disaster recovery plans to ensure we have stringent system back up procedures in place.
8. Failure to manage the supply chain
Failure to manage the supply chain could have a material impact on our financial performance and reputation.
Link to strategyStrengthening customer intimacyReducing complexityDriving market-led innovationDigital
Risk appetite
Prudent
Increased
The reduced production capacity and increased cost of disruption caused to our business by COVID-19 (government import/export restrictions, reduced availability of product transportation and the downturn in the global economy) has increased the risks associated with receiving materials in the right place, at the right quality and at the right time.
The signing on 30 December 2020 of the EU-UK Trade and Cooperation Agreement does reduce materially the potential Brexit disruption, however there may be consequences of the UK leaving the EU which may still risk disrupting the supply chain (additional documentation, changes in taxation, changes in the way goods are delivered into Northern Ireland etc).
The divisional procurement teams, throughout the Coronavirus pandemic, performed thorough reviews of our supplier base, including reviewing our suppliers financial standing. Where appropriate the business created dual sourcing arrangements, moved the supply chain closer to our facilities, and created safety stocks.
Brexit is not expected to have a material impact on the Group’s businesses. IMI Precision Engineering, the division most exposed to Brexit has less than 10% of its cross-border trade potentially affected by Brexit. Buffer stocks and other mitigating actions are in place to reduce the potential disruption from Brexit.
Procurement teams also assess specific Supplier Code of Conduct risks across the divisional supply chains and audit high risk suppliers for all aspects of supply chain risk including Modern Slavery. The teams also have regular review meetings with key suppliers, and as required, deploy escalation meetings.
62 IMI plc Annual Report & Accounts 2020

Risk, link to strategy and risk appetite Change Risk mitigation including specific 2020 actions
9. Failure to comply with legislation or a breach of our own high standards of ethical behaviour
We have established a framework which demands the highest standards of ethics and regulatory compliance across all our businesses. As we expand our operations to achieve growth, it is essential that we maintain these standards. A breach of legislative requirements in relation to tax, anti-bribery, fraud and competition law could result in financial and reputational damage. The markets in which IMI operates, particularly in IMI Critical, make the risk of regulatory breach an area of focus.
Link to strategyStrengthening customer intimacyReducing complexityDigital
Risk appetite
Very prudent
No change
We continue to operate in similar markets as last year, with no significant changes in legislation.
Each division assesses its own compliance risk and formulates an annual divisional compliance plan which is implemented by each Division’s General Counsel, who report to the respective Divisional Managing Director. Due diligence on third parties, trade sanctions and customers are the subject of standard operating procedures and carried out by the divisions using Group-wide software.
Dedicated resources at both the Group and divisional level ensure employees are provided with the necessary training, guidelines and standard operating policies to ensure that everybody is aware of the conduct expected from them, in particular in relation to the key risk areas of anti-bribery & corruption, anti-trust and economic & trade sanctions.
In 2020 around half of the entire workforce – some 5,972 employees – completed online training modules on conflicts of interest, dealing with third parties and anti-competitive practices risk via eLearning. In addition, detailed training is given to staff in more commercial roles who have significant autonomy to contract with customers and suppliers.
We operate a confidential independent hotline to report concerns (see page 41).
10. New product development
Failure to deliver market leading products, on time and on budget, could impact our ability to grow.
Link to strategyStrengthening customer intimacyReducing complexityDriving market-led innovationDigital
Risk appetite
Receptive
No change
One of our core values is customer intimacy, ensuring unmet and emerging customer needs are at the core of our operations. The Growth Accelerator programmes rather than starting with existing products aims to start with the customer, working with them to understand their problems to work together to find the solution.
The use of the IMI Growth Advisory Board and the expansion of the Growth Hub aims to ensure appropriate processes and governance are in place to avoid new product concentration risk, projects are scalable and relevant teams have the bandwidth to deliver successful new products/services effectively.
The use of the NPD Ignite process allows a much shorter validation window to determine if the proposed solution to a customer problem has a viable business and value proposition. This shorter timetable allows efficient use of resources to ensure only the most appropriate solutions are developed.
We have established centres of design and technological excellence across our businesses. Each division has a New Product Development strategy which is regularly reviewed, with divisional engineering teams reporting on the performance of our existing products and new market or competitor developments.
Further details of the processes and governance of our new product development can be seen in the Technology and applications engineering sections on pages 14 to 23.
Strategy Turn to page 14
Introduction Strategic Report Corporate Governance Financial Statements
63
Viability and going concern statements
Viability statementThe directors have assessed the viability of the Group over a relevant period, taking into account the Group’s financial and trading position as summarised in this Annual Report, the principal risks and uncertainties set out on pages 58 to 63 and the five-year business plan reviewed by the Board in September 2020. Based on this assessment, and other matters considered and reviewed by the Board, the directors confirm that they have a reasonable expectation that the Company will be able to continue in operation and meet its liabilities as they fall due over the period from the date of this Annual Report to 31 December 2025.
The directors determined that the period to 31 December 2025 constituted an appropriate period over which to make its assessment of viability. Whilst the directors have no reason to believe the Company will not be viable over a longer timing horizon, the five-year period to 31 December 2025 was chosen as it was aligned with the Company’s business and strategic planning timing horizon and is a sensible period for such an assessment. It is believed this period provides readers of the Annual Report with an appropriately long-term view with which to assess the Company’s prospects although future outcomes cannot be predicted with certainty.
The business plan was used to assess the headroom on the Company’s facilities and to model stress tests for ongoing covenant compliance under scenarios where its principal risks materialise. The analysis considered both ‘running business’ risks, such as reducing revenues and margins, as well as one-off ‘event’ risks such as product recalls. The scenarios considered were as follows:
Finally, the Board considered a reverse stress test which demonstrated that a breach of covenants would not occur unless there was an extreme unforeseen event causing a revenue reduction of greater than 36%. Mitigating actions considered for this reverse stress test include, but are not limited to, reducing working capital, restricting capital expenditure, reducing overhead spend and employee costs and cutting or suspending dividend payments to shareholders. The mitigating actions do not assume any special governmental support other than normally available schemes such as short term working in certain countries.
The Board considered the Group’s liquidity, available banking facilities and banking covenants, details of which are included in the going concern statement below. The Board also considered the Company’s ability to raise capital in the future, as well as both the ongoing actions undertaken to prevent occurrence and the potential actions to mitigate the impact of any particular risk. In making its assessment, the Board recognised the principal risks facing the Company, including those that would threaten its business model, future performance, solvency or liquidity. A summary of these risks can be found on pages 58 to 63.
The directors’ assessment also recognised a number of key features of the Group’s operations. The Group’s wide geographical and sector diversification, and the spread of activities across many production sites, help minimise the risk of serious business interruption. Furthermore, our business model is structured so that the Group is not overly reliant on a few large customers. Our largest customer constitutes only 2% of Group revenue and our top 20 customers account for just under 14% of Group revenue. In addition, our ability to flex our cost base, as seen during 2020, reduces our exposure to sudden adverse economic conditions.Scenario 1: A modest global macroeconomic recession in
2021 representing a 5% reduction in revenues.Link to principal risks: global economic or political uncertainty
Scenario 2: A product recall with a one-off cost of £200m.Link to principal risks: Quality issues leading to product recall, warranty issues, injury, damage or disruption to customers’ business.
Scenario 3: A severe global macroeconomic recession in 2021 representing a 15% reduction in revenues. This scenario was considered to be reflective of the impact of a more serious further wave of COVID-19.Link to principal risks: global economic or political uncertainty; business disruption / Natural disaster
Scenario 4: This scenario considers the combined impact of scenario 2 and 3, both a £200m product recall and a 15% reduction in revenues due to macroeconomic recession.Link to principal risks: Quality issues leading to product recall, warranty issues, injury, damage or disruption to customers’ business; global economic or political uncertainty, business disruption / Natural disasters
64 IMI plc Annual Report & Accounts 2020

Going concern statementAccounting standards require that directors satisfy themselves that it is reasonable for them to conclude whether it is appropriate to prepare financial statements on a going concern basis. The Group’s business activities, together with the factors likely to affect its business development, performance and position are set out in the Strategic Report. Principal risks are detailed on pages 58 to 63. The financial position of the Group, its cash flows, liquidity position and borrowing facilities are described in the financial statements. In addition, Note 18 to the financial statements includes the Group’s objectives, policies and processes for managing its capital; its financial risk management objectives; details of its financial instruments and hedging activities; and its exposures to credit risk and liquidity risk. Note 14 to the financial statements addresses the management of the funding risks of the Group’s employee benefit obligations.
After making enquiries, the directors have a reasonable expectation that the Company and the Group have adequate resources to continue in operational existence for the foreseeable future and for a period of at least twelve months (28 February 2022) following the approval of the Annual Report & Accounts.
Accordingly, they continue to adopt the going concern basis in preparing the financial statements. The directors have considered the impact of Coronavirus and of the restrictions put in place by governments to contain the spread of the virus on the Group’s financial results and financial position. Immediate measures were taken to protect first and foremost the Group’s workforce, communities and customers. Actions were deployed to ensure strict adherence to social distancing measures and deep-cleaning protocols and these measures will be continued as needed to keep the workforce safe. Business disruption, so far, has been reasonably modest as the Group is well diversified and maintains a balanced portfolio operating across a range of markets, sectors and geographies with no single dependency. Performance in IMI Precision’s Commercial Vehicle segment has been affected and temporary construction site restrictions have impacted the results of IMI Hydronic, both of which have been mitigated to some extent by a temporary surge in orders within Life Sciences.
Across the Group, all sites have returned to normal levels of production. Supply chain disruptions have been minimal and alternative suppliers or contingency stocks have addressed the few instances of part shortages.
During this period of uncertainty, we continue to maintain a robust financial position. The balance sheet position has been protected by the actions taken to reduce costs and preserve cash, including the following:
» salary reductions for the Board;
» continuing, successful initiatives in rationalisation, value-pricing and material cost reduction; and
» reduction in temporary workers, increase in short time working, and tight controls on discretionary spending.
At 31 December 2020, the Group had cash and cash equivalents of £134m and undrawn committed facilities of £300m in the form of Revolving Credit Facilities (RCF), of which £150m is due for renewal in 2022, £75m in 2023 and £75m in 2024. Forecasts indicate that the Group can operate within the level of facilities in place without the need to obtain any new facilities in the twelve-month period following the approval of the Annual Report & Accounts.
The directors have assessed the viability of the Group and reviewed detailed cash flow forecasts for a period of at least twelve months following the date of approval of the Annual Report & Accounts. These revised forecasts factored in a decline in revenue based on slowdowns in various end markets, experiencing tough trading conditions. After applying a reverse stress test and making comparisons to the detailed forecasts, the directors have a reasonable expectation that the financial headroom will not be exhausted during this period. Covenant compliance reviews are undertaken to ensure that the Group remains fully within the covenant limits. Funding covenants currently require EBITDA to be no less than 4.0 times interest and net debt to be no more than 3.0 times EBITDA. Those covenant ratios, at 31 December 2020, were 34.5 times and 0.8 times, respectively. For there to be a breach of covenants during the twelve-month period following the approval of the Annual Report & Accounts forecast revenue would need to fall by 36%, and forecast EBITDA by 69%, after taking into account the mitigating actions that would be undertaken in these circumstances.
Introduction Strategic Report Corporate Governance Financial Statements
65

Nationality
Board of Directors
* Listed company directorship.
Key external appointments
Committee membership
Expertise
British
Lord Smith of KelvinChairman (76)
Non-executive Chairman of Scottish EnterpriseNon-executive Chairman of the British Business Bank plc
Nominations Committee – Chair
Significant UK and international board experienceExtensive knowledge of both engineering and manufacturingStrong track record in private equity, mergers and acquisitionsSpecialist capability in finance
American British
Daniel ShookFinance Director (53)
Non-executive director and Chair of Audit Committee of Ultra Electronics Holdings plc*
Executive Committee
Extensive financial management experienceExtensive knowledge of complex process manufacturing across a range of industrial sectorsStrong international perspective, having worked in a number of key geographies during his time with two leading global businesses
Carl-Peter ForsterSenior independent non-executive director (66)
German Non-executive director of Babcock International Group PLC*Chairman of Chemring Group plc*Chairman of the Shareholder Committee of HELLA GmbH & Co. KGaA
Audit CommitteeNominations CommitteeRemuneration Committee – Chair
Experienced international business leaderIn-depth knowledge of the automotive sectorExpert in operational excellence and Lean manufacturingSignificant experience in technology management
British
Roy TwiteChief Executive (53)
Non-executive director of Halma plc*
Executive Committee
Proven organisational and engineering expertiseManagement capability having run all of IMI’s divisionsExtensive knowledge of end-markets and customer base
Date of appointment
2015
2015
2012
2019 as Chief Executive and 2007 as director
66 IMI plc Annual Report & Accounts 2020
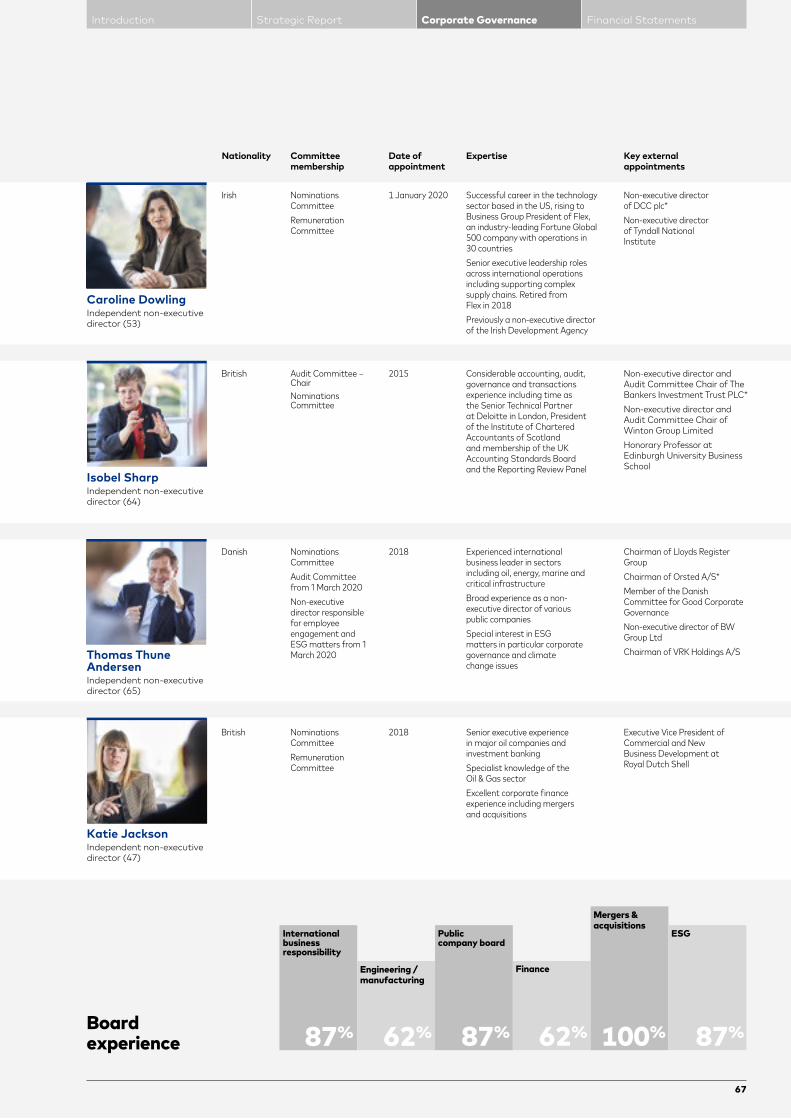
Nationality
Board experience
Key external appointments
Committee membership
Expertise
Caroline DowlingIndependent non-executive director (53)
Irish Non-executive director of DCC plc* Non-executive director of Tyndall National Institute
Nominations CommitteeRemuneration Committee
Successful career in the technology sector based in the US, rising to Business Group President of Flex, an industry-leading Fortune Global 500 company with operations in 30 countriesSenior executive leadership roles across international operations including supporting complex supply chains. Retired from Flex in 2018Previously a non-executive director of the Irish Development Agency
Thomas Thune AndersenIndependent non-executive director (65)
Danish Chairman of Lloyds Register GroupChairman of Orsted A/S*Member of the Danish Committee for Good Corporate GovernanceNon-executive director of BW Group LtdChairman of VRK Holdings A/S
Nominations CommitteeAudit Committee from 1 March 2020Non-executive director responsible for employee engagement and ESG matters from 1 March 2020
Experienced international business leader in sectors including oil, energy, marine and critical infrastructureBroad experience as a non-executive director of various public companiesSpecial interest in ESG matters in particular corporate governance and climate change issues
Katie JacksonIndependent non-executive director (47)
British Executive Vice President of Commercial and New Business Development at Royal Dutch Shell
Nominations CommitteeRemuneration Committee
Senior executive experience in major oil companies and investment bankingSpecialist knowledge of the Oil & Gas sectorExcellent corporate finance experience including mergers and acquisitions
British Non-executive director and Audit Committee Chair of The Bankers Investment Trust PLC*Non-executive director and Audit Committee Chair of Winton Group LimitedHonorary Professor at Edinburgh University Business School
Audit Committee – ChairNominations Committee
Considerable accounting, audit, governance and transactions experience including time as the Senior Technical Partner at Deloitte in London, President of the Institute of Chartered Accountants of Scotland and membership of the UK Accounting Standards Board and the Reporting Review Panel
Date of appointment
1 January 2020
2018
2018
2015
Isobel SharpIndependent non-executive director (64)
International business responsibility
87%
Engineering /manufacturing
62%
Public company board
87%
Finance
62%
Mergers & acquisitions
ESG
100% 87%
Introduction Strategic Report Corporate Governance Financial Statements
67
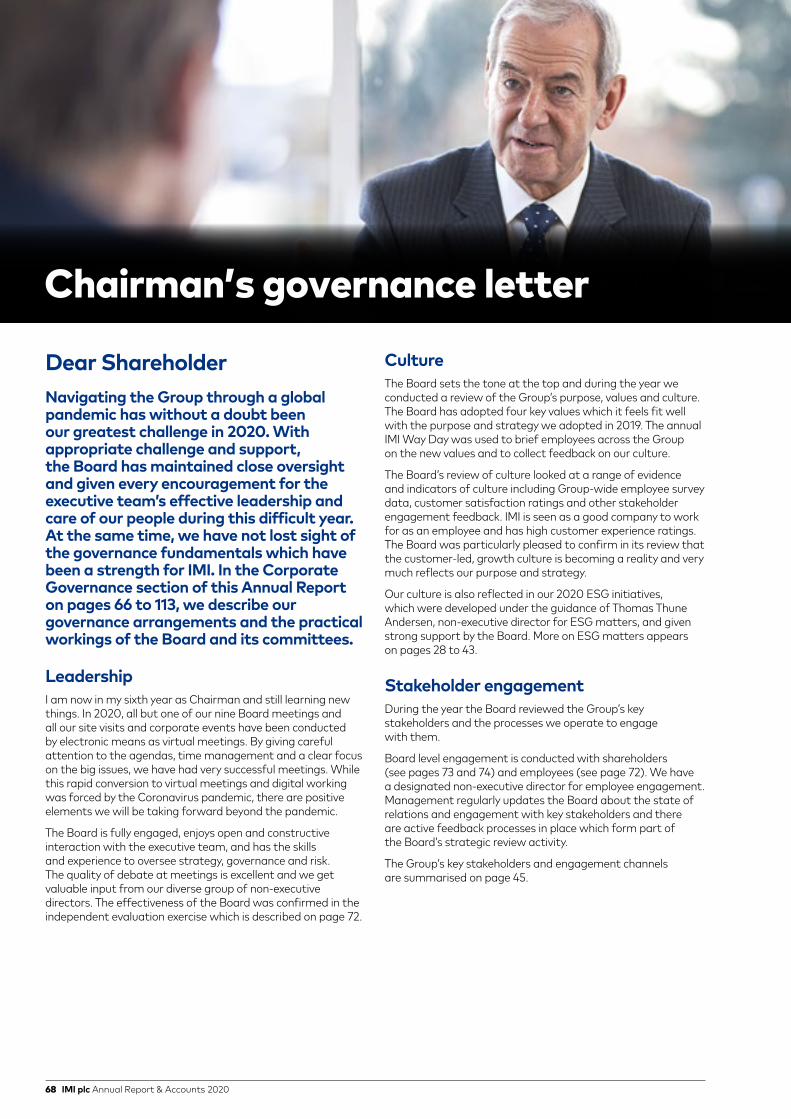
Chairman’s Governance letter.
Dear ShareholderNavigating the Group through a global pandemic has without a doubt been our greatest challenge in 2020. With appropriate challenge and support, the Board has maintained close oversight and given every encouragement for the executive team’s effective leadership and care of our people during this difficult year. At the same time, we have not lost sight of the governance fundamentals which have been a strength for IMI. In the Corporate Governance section of this Annual Report on pages 66 to 113, we describe our governance arrangements and the practical workings of the Board and its committees.
LeadershipI am now in my sixth year as Chairman and still learning new things. In 2020, all but one of our nine Board meetings and all our site visits and corporate events have been conducted by electronic means as virtual meetings. By giving careful attention to the agendas, time management and a clear focus on the big issues, we have had very successful meetings. While this rapid conversion to virtual meetings and digital working was forced by the Coronavirus pandemic, there are positive elements we will be taking forward beyond the pandemic.
The Board is fully engaged, enjoys open and constructive interaction with the executive team, and has the skills and experience to oversee strategy, governance and risk. The quality of debate at meetings is excellent and we get valuable input from our diverse group of non-executive directors. The effectiveness of the Board was confirmed in the independent evaluation exercise which is described on page 72.
CultureThe Board sets the tone at the top and during the year we conducted a review of the Group’s purpose, values and culture. The Board has adopted four key values which it feels fit well with the purpose and strategy we adopted in 2019. The annual IMI Way Day was used to brief employees across the Group on the new values and to collect feedback on our culture.
The Board’s review of culture looked at a range of evidence and indicators of culture including Group-wide employee survey data, customer satisfaction ratings and other stakeholder engagement feedback. IMI is seen as a good company to work for as an employee and has high customer experience ratings. The Board was particularly pleased to confirm in its review that the customer-led, growth culture is becoming a reality and very much reflects our purpose and strategy.
Our culture is also reflected in our 2020 ESG initiatives, which were developed under the guidance of Thomas Thune Andersen, non-executive director for ESG matters, and given strong support by the Board. More on ESG matters appears on pages 28 to 43.
Stakeholder engagementDuring the year the Board reviewed the Group’s key stakeholders and the processes we operate to engage with them.
Board level engagement is conducted with shareholders (see pages 73 and 74) and employees (see page 72). We have a designated non-executive director for employee engagement. Management regularly updates the Board about the state of relations and engagement with key stakeholders and there are active feedback processes in place which form part of the Board’s strategic review activity.
The Group’s key stakeholders and engagement channels are summarised on page 45.
Chairman’s governance letter
68 IMI plc Annual Report & Accounts 2020
Governance highlights» Continued to operate as an effective Board through
virtual meetings.
» Additional Board meetings held to facilitate close monitoring of developments during the Coronavirus pandemic.
» Reviewed capital allocation and rebased the dividend to retain cash for investment in the Group.
» Worked with the Chief Executive and the executive team to further refine the Group’s strategy.
» Approved key changes to the executive team while ensuring the succession enriched the diversity of talent: the Executive Committee is 29% female and includes four nationalities.
» Accelerated the Autumn Interim Management Statement to ensure the timely disclosure of a better than expected financial performance.
» Increased focus and activity around ESG matters.
» Externally facilitated Board evaluation completed.
Compliance with the 2018 UK Corporate Governance Code (the ‘Code’)I am pleased to confirm that we complied with the Code during the year as reported on page 70. In addition to the above highlights, I offer the following comments on key elements of the Code with cross-references to other sections of this Annual Report.
IndependenceOver half of the Board comprises independent non-executive directors and the composition of all Board committees complies with the Code. More information about the Board members is provided on pages 66 and 67.
Accountability and electionThere is a clear separation of duties between the roles of Chairman and Chief Executive. All the directors stand for re-election at each Annual General Meeting after their first election.
AttendanceAll directors have a good attendance record at Board and committee meetings, details of which appear on page 71 for the Board and in each of the committee reports.
Committee chair experienceThe Audit Committee chair has been in post since 2017 and meets the specific Code requirements for recent and relevant financial experience.
The Remuneration Committee chair has been in post since March 2020 and a member of the Committee since 2012.
I am the Nominations Committee chair and have been in post since 2015.
Governance Framework and Section 172 StatementWe have a detailed framework documenting the various roles of the Board members, the Board and its committees and the matters reserved to the Board. Further information appears on pages 110 to 111 of this Annual Report.
A statutory Section 172 Statement pursuant to the Companies Act 2006 appears on pages 74 and 75.
External auditorAs approved at our 2020 Annual General Meeting, EY was appointed as the Group’s external auditor in respect of the year ended 31 December 2020. EY is considered to be independent and receives little income from non-audit work for the Group as detailed on page 79. The Audit Committee led an audit tender process in 2020 which resulted in the decision to recommend the appointment of Deloitte as the external auditor for the year ended 31 December 2021. Further details are given in the Audit Committee Report on pages 76 and 79.
Executive remunerationOur current executive director remuneration policy was approved by shareholders in 2018 and its operation in practice complies with the Code as detailed in the Annual Directors’ Remuneration Report on pages 93 to 107.
The next three-yearly vote on remuneration policy is due to be put to the 2021 Annual General Meeting. Details of the policy to be put forward for shareholder approval are included in the Directors’ Remuneration Policy Report on pages 85 to 92.
Inclusion and DiversityInformation about the diversity of the people on the Board and the Executive Committee appears on pages 70 and 81. In planning for succession the Board is taking account of the guidance from the Parker Review Committee. I am delighted that Dr Ajai Puri will be joining the Board as a non-executive director with effect from 1 March 2021. The Group’s Inclusion and Diversity Policy and what the Group is doing to promote inclusion and diversity in areas like management succession and development are reported on pages 35 to 36.
I am particularly pleased to see that our 2020 graduate scheme intake reflects our diversity agenda with over half of the graduates joining us being female.
Strategy and riskThe Board conducts regular reviews in relation to strategy and risk, further details of which appear on pages 58 to 63 in relation to risk and 71 in relation to Strategy.
Yours faithfully
Lord Smith of Kelvin Chairman
25 February 2021
Introduction Strategic Report Corporate Governance Financial Statements
69

Corporate Governance Report
Share ownership for the Chairman and non-executive directorsThe Chairman and non-executive directors are encouraged to hold some shares in IMI within a reasonable period after their appointment. As at 31 December 2020, the Chairman and serving non-executive directors all held IMI shares as set out in the table on page 104.
Code compliance statementThe Board is committed to maintaining good governance and confirms that throughout the year ending 31 December 2020 the Company has applied the principles contained in the Code and complied with its best practice provisions. Highlights of our compliance with the Code are given in the Chairman’s governance letter on pages 68 and 69. Further details of how we have applied the Code appear below, in the Directors’ Report and other cross-referenced sections of this Annual Report, all of which are incorporated by reference into this report. A description of the main features of the Company’s internal control system and disclosures on other regulatory matters including statements on going concern and viability can be found on pages 64 to 65. A summary of our risk management systems and information about the risks and uncertainties that relate to our business is detailed on pages 58 to 63. Information on corporate responsibility can be found in the Environmental, Social and Governance section on pages 28 to 43.
Board compositionEight directors served on the Board throughout 2020: the Chairman; the Chief Executive; five independent non-executive directors and the Finance Director. Birgit Nørgaard was a director until 29 February 2020. All continuing directors will stand for re-election at each Annual General Meeting (or election if appointed since the previous Annual General Meeting).
Independence of non-executive directorsThe Board considers that all the non-executive directors are free from any business or other relationship which could materially interfere with the exercise of their independent judgement and all meet the criteria for independence under the Code. All the non-executive directors are regarded by the Board as independent. The Chairman was also regarded as independent at the date of his appointment.
Board diversityThe non-executive directors are a diverse group from different backgrounds and nationalities and bring with them a wide range of skills and experience in commerce, finance and industry from around the world. Half the Board are non-British born and there are five different nationalities on the Board. Three of the eight directors are female. Our approach to diversity is set out in more detail on pages 35 and 36 and in the Nominations Committee Report on pages 80 and 81. The charts below represent the Board membership as at the date of this Annual Report.
Non-executive /executive directors*
Gender
5 Independent non-executive directors2 Executive directors
5 Male3 Female
5 5
2 3
Date of first appointment
Date of current letter of appointment
Thomas Thune Andersen 1 July 2018 25 February 2021
Caroline Dowling 1 January 2020 25 February 2021
Carl-Peter Forster 1 October 2012 25 February 2021
Katie Jackson 1 July 2018 25 February 2021
Isobel Sharp 1 September 2015 25 February 2021
Lord Robert Smith 7 May 2015 25 February 2021
* Under the 2018 Code, the Chairman is excluded when considering the independent non-executive composition of the Board.
Nationality Age
4 Other 4 British born
1 40-493 50-594 60+
4
44
1
3
Dates of appointment
Thomas Thune AndersenCaroline Dowling
Carl-Peter ForsterKatie Jackson
Isobel SharpLord Robert Smith
Years0 1 2 3 4 5 6 7 8
Length of tenure at 31 December 2020
70 IMI plc Annual Report & Accounts 2020

Meetings and use of Board timeThe Board met on nine occasions during the year including two results reporting meetings, a day dedicated to strategy discussions and regular review meetings at which updates are provided as appropriate covering health and safety, operational and financial matters, investor relations, risk and legal affairs. In addition, there were several special meetings arranged to review developments during the Coronavirus pandemic.
2020 Board cycleIn addition to the regular agenda items for operational matters, business performance and corporate affairs including investor relations, the following matters were dealt with at Board meetings in the year:
To date in 2021 the Board has met twice with all members in attendance.
Board roles and reserved mattersA description of Board roles and reserved matters is included in the IMI Corporate Governance Framework and is summarised in the Directors’ Report on pages 110 to 111.
Induction and continuing development programmeA formal induction process for new non-executive directors is well established and is the responsibility of the Chairman with support from the Chief Executive and Company Secretary.
Business familiarisation is at the core of induction and continuing development for non-executive directors at IMI and is centred around gaining an understanding of the business and getting to know the wider management team. Caroline Dowling had induction meetings with all members of the Executive Committee and the auditor. There is also a committee induction process designed to brief new committee members on the relevant committee and the issues it faces. In addition, all new non-executive directors attend a corporate induction day for senior managers.
In normal circumstances, non-executive directors are expected to visit business units around the Group and to meet face-to-face with senior operating management and key corporate staff. Site visits allow business familiarisation and are also a good opportunity to engage with a wider range of employees. Virtual Board visits were arranged but due to the Coronavirus pandemic individual travel has been impractical for most of 2020.
Reflecting the strategic importance of our Growth Accelerator events, where innovation working groups present new product and business ideas, the non-executive directors have enjoyed active participation and engaged with the diverse teams involved from the businesses.
Appropriate training and other continuing professional development is available to all non-executive directors and regular updates are given during the year where relevant to the business arising at Board and committee meetings. For example, tailored best practice updates were provided to the Audit and Remuneration Committees during 2020. Non-executive directors are encouraged to undertake appropriate external training and several did attend external training during the year.
Board attendance
FebruaryApproval of the preliminary results announcement and Annual ReportApproval of the final dividend recommendationApproval of the Notice of Annual General MeetingReview of the first monthly phased forecast for 2020Strategy review processIMI Precision Engineering brand strategy
MarchUpdate on the Coronavirus pandemic and management response Financial sensitivity reviewApproval of a market update announcement
AprilUpdate on the Coronavirus pandemic and management responseTrading and financial updateAnnual General Meeting logistics and preparations
MayReview of trading and update on the Coronavirus pandemicReview of the Q2 ForecastApproval of the interim management statementFinal preparations for the Annual General MeetingStrategy review processBrokers’ market update and review of developments in relation to public company M&A and activist shareholdersReview of Environmental, Social and Governance agenda
JulyApproval of the half year results announcementApproval of the interim dividendReview of the Q3 ForecastInterim risk reviewStrategy review process
SeptemberStrategy review processFive-year business plan review
October (first meeting)Virtual site visit to operations in Life Sciences and the Hydronic CollegeReview of the Company’s purpose, values and cultureReview of stakeholder engagementStrategy review processProgress update on Environmental, Social and Governance agenda
October (second meeting)Review of the Q4 ForecastOctober trading update and management’s latest viewInterim Management Statement
DecemberBudget for 2021Annual risk reviewStrategy review processBoard evaluation with Egon ZehnderReview of Environment, Health and Safety agendaApproval of the proposed appointment of Deloitte as external auditor
Director Board meetings % attended where eligible
Thomas Thune Andersen* 8/9 100
Caroline Dowling 9/9 100
Carl-Peter Forster* 8/9 100
Katie Jackson 9/9 100
Birgit Nørgaard 1/1 100
Isobel Sharp 9/9 100
Lord Smith 9/9 100
Daniel Shook 9/9 100
Roy Twite 9/9 100
* Two directors were unavailable for a special Board meeting held at short notice due to urgent business.
Introduction Strategic Report Corporate Governance Financial Statements
71

Board visits to operationsSite visits are an important, regular feature of the Board calendar. They provide an excellent opportunity for the Board to engage with a wide group of employees and they also facilitate the non-executive directors’ understanding of the businesses.
Switzerland is home to business units across all three divisions and the Board visited two sites there in 2020. In October 2020, the Board made a virtual visit to IMI Precision Engineering’s manufacturing facility in FAS, the division’s principal manufacturing unit in Life Sciences. The Board also visited IMI Hydronic Engineering’s state-of-the-art Hydronic College in Switzerland. During both site visits members of the Board had the opportunity to review the operations and interact with local staff.
Board level employee engagementBirgit Nørgaard was the non-executive director for employee engagement until 29 February 2020, when she retired and was succeeded by Thomas Thune Andersen. In this role, Thomas has joined various programmes such as the Graduate Induction and Growth Accelerator pitches, met with the Inclusion and Diversity team and attended the European Communications Forum (ECF). Given the current COVID-19 pandemic, the ECF was held virtually and will be attended by employee representatives from all our key European geographies and provides an opportunity for management (including the Chief Executive and Group HR Director) to update on progress on key business and human resource issues, as well as field a wide range of questions from the representatives on key matters of employee concern. A cross-divisional team working on Inclusion and Diversity invited Thomas to meet with them and Thomas will continue to take an active role with this forum and give insights into employee engagement and inclusion and diversity initiatives.
Board evaluationThe Chairman arranged an externally facilitated evaluation process in 2020, which was carried out in conjunction with Egon Zehnder, who also facilitated the evaluation exercise carried out in 2017 and is an independent consultancy. A comprehensive brief was given to the assessment team by the Chairman. The evaluation also observed Board and committee meetings in July 2020 and subsequently detailed interviews were conducted with every director. In addition, representatives of Egon Zehnder interviewed members of the senior management team and selected advisers. All internal participants completed questionnaires and all participants were interviewed on an individual basis. Draft conclusions were discussed with the Chairman and subsequently reviewed with the whole Board at its meeting in December 2020 with Egon Zehnder. The Chairman received a report with feedback on individual directors which was discussed with them in person. The chairs of the three non-executive committees each received a report from the external evaluation exercise and reviewed that with their committee. Based on their review Egon Zehnder’s overriding conclusion
was that the Board is run in an effective manner and the Board was pleased with the highly positive outcome. Following discussion of the report by Egon Zehnder, the Board noted a small number of modest areas for development over the coming year. None of these areas for development, individually or collectively, were regarded by Egon Zehnder as significant and worthy of disclosure.
The directors are satisfied that the Board is fulfilling its responsibilities appropriately and that the Board and its committees were effective and that each continuing director demonstrated a valuable contribution and a commitment to their role.
As senior independent director, Carl-Peter Forster conducted a review of the Chairman with the other non-executive directors and shared the results with the Chairman. During the year the Chairman also met with the non-executive directors to review the performance of the Chief Executive. Carl-Peter also received a report on the Chairman by Egon Zehnder which he discussed with him along with other feedback. The Chairman passed on to the Chief Executive appropriate feedback from the review of his performance.
The evaluation actions from the prior year, as reported in the 2019 Annual Report, have resulted in more Board meeting time being set aside to discuss culture and associated matters and further updates for directors on developments in governance, audit and remuneration practice.
Corporate Governance Report
72 IMI plc Annual Report & Accounts 2020

Isobel SharpChair
Lord Smith of KelvinChair
Carl-Peter ForsterChair
Audit Committee Nominations Committee Remuneration Committee
MembershipThomas Thune Andersen Carl-Peter Forster
Main responsibilities» Oversight role in relation to financial statements» Reviewing significant areas of judgement and
accounting policies» Reviewing the proposed statements on going
concern and viability to appear in the Annual Report» Advising the Board on whether the draft Annual
Report is fair, balanced and understandable» Monitoring announcements in respect of
financial performance» Monitoring the effectiveness of internal
financial controls» Reviewing financial risks including fraud risk» Oversight of internal audit and other key
processes for monitoring internal financial control» Overseeing the external audit process, its
objectivity, effectiveness and cost with responsibility for setting the audit fee
» Making recommendations to the Board for the appointment of the auditor including oversight of any audit tender process
MembershipThomas Thune AndersenCaroline DowlingCarl-Peter ForsterKatie JacksonIsobel Sharp
Main responsibilities» Board and committee composition» Oversight of succession plans for the Board
and the Executive Committee» Search for and recommendation of candidates
for appointment as non-executive directors, Chief Executive and other executive director positions
» Diversity policy, promotion of diversity and monitoring of progress
Main responsibilities» Define and recommend the remuneration policy
for the Chairman and members of the Executive Committee
» Determine the individual remuneration packages for the Chairman and members of the Executive Committee within the policy approved by shareholders
» Set annual and long-term incentive metrics and awards and determine the outcomes for the members of the Executive Committee
» Report on remuneration matters and constructively engage with shareholders
» Assess risk in respect of remuneration and incentive structures in particular
MembershipCaroline Dowling Katie Jackson
Executive CommitteeThe Executive Committee is chaired by the Chief Executive and the other members are shown on page 11. The Committee meets monthly and more often as may be required.
The Committee is the senior management body for the Group and as part of the broad remit set by the Chief Executive it monitors and manages business performance, reviews progress against strategic objectives and formulates budgets and proposals on strategy and resource allocation for consideration by the Board. The Committee takes its authority from the Chief Executive and is not a committee of the Board.
The Committee plays a key part in risk assessment and risk management and monitoring processes and receives regular reports on human resources, health and safety, internal audit, compliance, legal, investor relations and other corporate affairs.
Investor relationsThe Board oversees shareholder engagement and maintains a balanced understanding of the issues and concerns of major shareholders. The Chief Executive and Finance Director have primary responsibility at Board level for investor relations and they, and the Head of Investor Relations, report to the Board on shareholder issues at every Board meeting during the year. Financial analysts’ notes are circulated to the directors, and the Board receives regular investor feedback reports from the Company’s brokers and public relations advisers as well as from management.
Dialogue is maintained with the principal shareholders and the executive directors meet regularly with institutional investors. Virtual investor meetings were arranged in 2020 to ensure appropriate engagement with major investors. During 2020 there were over 100 such interactions with institutional and other shareholders. The Chairman and the senior independent director also are available to shareholders as needed. The Chairman has actively engaged with several major shareholders at specifically arranged meetings. Carl-Peter Forster, in his role as chair of the Remuneration Committee, was actively engaged in consultation with larger shareholders in relation to the remuneration policy review.
Introduction Strategic Report Corporate Governance Financial Statements
73

Corporate Governance Report
Consultation with our larger investors is very much concerned with the performance and strategy of the Group and their feedback following engagement with shareholders is shared with the Board so that it can be taken into account in Board discussions. Institutional investors have shown increasing interest in ESG matters and these are now a common theme in investor relations meetings and information requests. We are also increasingly engaged in completing ESG rating questionnaires and surveys of particular interest to our investors. More information on ESG matters appears on pages 28 to 43.
Due to the impact of COVID-19 on the conduct of the Annual General Meeting, a minimalist meeting with three shareholders present was held at the registered office with the Chief Executive being the only Board member present. The 2020 Annual General Meeting was presided over by the Chief Executive in the chair and each substantively separate issue was put to the Annual General Meeting as an individual motion. Notice of the Annual General Meeting was issued more than twenty working days in advance of the meeting and the level of votes lodged for and against each resolution, together with details of abstentions, are shown on the IMI website. The Board values the support of shareholders and the poll results for all resolutions proposed at the Annual General Meeting were well above 90% in favour in every case.
In addition to the Annual Report, the Company issues preliminary results and half year results announcements, as well as two interim management statements between results announcements. The IMI website includes recordings of results presentations made by senior management, recent annual and half year reports, interim management statements, other corporate announcements and links to the websites of the Group’s businesses.
Stakeholder voice and Section 172 statementA statement pursuant to Section 172 of the Companies Act 2006 is required content for this Annual Report. The primary duty of the directors under Section 172 is to act in the way they consider would be most likely to promote the success of the Company for the benefit of its shareholders as a whole and to do so having regard as appropriate to certain statutory factors and other relevant matters.
All Board decisions are made with the Group’s long-term success in mind and, as can be seen from this Annual Report, the Board has regard to a broad range of matters including the voice of stakeholders. The oversight and monitoring activity of the Board includes maintaining an understanding of key stakeholders and being receptive to the voice of stakeholders. In response to the Coronavirus pandemic, communications with employees, customers and suppliers were intensified to ensure safety and continuity of operations. Further information on these special engagement efforts is provided on pages 06 and 07.
Major decisions made during the year by the Board included the response to the Coronavirus pandemic, the adoption of a new dividend policy and approval of further significant restructuring projects. In considering these proposals the Board had regard to the relevant statutory factors, which were helpfully referenced in specific Board papers and in discussions.
Board decision and stakeholders considered
Board decision Key considerations
COVID-19 responseEmployees, operating companies, customers, suppliers, society.
In February 2020, the Company formed a COVID-19 Response team to assist our operating companies in safety, operational, resourcing and legal matters arising from the COVID-19 situation.
Special meetings of the Board were convened to review the implications of the health and economic crisis, with the safety and wellbeing of our employees being paramount in that review. Regular updates were provided to the Board on the welfare of our employees, financial and operational disruption and the performance of our businesses.
Safety of employees was first and foremost. Maintaining the supply chain to keep operations running and serve customers came next. A third priority was protecting the Group from possible cash flow issues. Salary reductions for the directors and senior employees were volunteered in the first half. These measures were subsequently reversed with regards to employees, as the Group navigated its way through the Coronavirus pandemic. In addition, the final dividend envisaged to be paid in May 2020 in respect of 2019 was paid in September 2020, when the Board felt confident that it was appropriate to pay the amount in full.
Dividend rebasedShareholders, potential investors and lenders, employees, customers and suppliers.
The financial resources required to execute our strategy, including organic investment needs and acquisition opportunities; maintaining a prudent level of dividend cover and moderate indebtedness; equitable treatment of our stakeholders. The decision to rebase dividends at around 3x dividend cover was made by the Board. The Board decided that the policy on dividends ought to be commensurate with the Company’s financial performance and without detriment to the strength of the balance sheet and future sustainability.
Over time dividend cover had reduced to below 2.0x and the dividend was high compared with comparable companies. Investment opportunities in the Group and growth by acquisition called for a reassessment of dividends as a key element of capital allocation. The long-term burden of such high dividend payments was regarded as an issue and the Board wanted the greater flexibility which increased free cash flow would provide.
Restructuring projectsShareholders, potential investors and lenders, employees, customers, operating companies.
The Group’s budget and strategy, approved by the Board, sets the allocation of capital to deliver our growth strategy through investment in innovation, operational improvement and acquisitions. The weighting of each is determined by our strategic priorities and the rationalisation of the Group’s manufacturing footprint is a major part of the operational improvement plans.
Optimising the manufacturing footprint and business simplification are key considerations in deciding to invest in rationalisation. Given the strategy, the Board seeks to balance investment in operational improvement with investments in medium and long-term growth initiatives. Appropriate engagement takes place at local level in relation to restructuring changes affecting the workforce.
74 IMI plc Annual Report & Accounts 2020

Set out below is specific commentary in relation to each of the Section 172 factors:
a) the likely consequences of any decision in the long-term The Board has adopted an established business planning
process and sets strategy with a view to long-term success. The strategic emphasis is on creating great value through innovation processes such as the Growth Accelerator, through which we are building a pipeline of new products for the future success of the Group. Further information about this key strategic programme is included on pages 14 to 27. During strategy discussions, long-term considerations had a particular influence when assessing which are the most attractive businesses and markets for IMI to target for investment.
b) the interests of the Company’s employees The Group depends on its employees for its success and
invests considerable time and resources on employee engagement, training and development as summarised on pages 34 to 38. Investment decisions including rationalisation and relocation of activities are considered with due regard to the interests of employees. Consultations with employees are conducted in relation to the significant site closures and headcount reductions which are underway as part of the active and proposed rationalisation projects. The Board approves and tracks the progress of these programmes with regular updates being provided at Board meetings.
Health and safety of our employees is of paramount importance and receives appropriate Board and management attention and investments. Reflecting the importance of safety, we measure and track our performance. See pages 34 to 35 and 56 for an update on our progress in this area.
Group pension scheme participants benefit from the Group’s approach to pension provision and financial prudence in reducing the funding deficit in relation to defined benefit obligations. Further information on employee benefits and pensions is on pages 156 to 162.
c) the need to foster business relationships with suppliers, customers and others
Customer service and value are at the core of our business model and strategy. The Board monitors indicators of the customer experience and welcomes the increased emphasis on the customer which management is building. For example, the Board has attended presentations and received regular updates on our Growth Accelerator programme. Locating facilities nearer to customers in the most attractive growth markets is a key element in the Board’s thinking about the footprint of the businesses, as reflected in the Strategic Report.
Our businesses work collaboratively with partners including suppliers, distributors and agents who are closely managed from a commercial and compliance perspective. Further information can be found on page 41.
d) the impact of operations on the community and the environment
Our business units are positive contributors to their local communities as employers and through apprenticeships and employee training and community activities including the annual IMI Way Day, charitable activity and donations. The Group supports such community involvement, more detail on which can be found on page 38.
The Board approves and monitors the Group policy on minimising our impact on the environment, which is outlined on pages 30 to 32. Our continued progress depends upon the Board driving ESG initiatives and channelling investment to projects with due regard for the environment. During the year, more detailed consideration of ESG matters was added to the Board agenda and with the guidance of Thomas Thune Andersen, non-executive director for ESG matters, new initiatives were agreed around the positive contribution of our products to a better world and improving the environmental impact of our operations. Further information on ESG matters appears on pages 28 to 43.
e) the desirability of maintaining a reputation for high standards of business conduct
The Board is careful of the reputation of the Group and its decisions reflect this and the great importance attached to the Group’s reputation by all key stakeholders. The Board demands high standards of conduct from all directors and Group employees and expects management to be mindful of how and with whom business is conducted. For example, the Group has declined to have dealings with third parties who display poor business conduct. Further information about how we ensure we operate ethically at all times and our purpose, values and culture, can be found on pages 12 and 28 to 43. Similarly, our ESG initiatives are consistent with building our standing as a good corporate citizen looking to have a positive impact on the world.
f) the need to act fairly between shareholders of the Company
The Board understands the importance of treating shareholders fairly. IMI has only one class of share in issue and all shareholders individually enjoy the same shareholder rights as the others. Further information on shareholder engagement is provided on pages 73 and 74.
By order of the Board
John O’Shea Group Legal Director and Company Secretary
25 February 2021
Introduction Strategic Report Corporate Governance Financial Statements
75

Dear ShareholderI am pleased to give my fourth report as Chair of the Audit Committee. The Committee acts in an oversight role in respect of Annual Reports, financial statements and announcements with financial content, all of which are prepared by management. The Committee’s principal responsibilities are to monitor the integrity of the Group’s financial reporting and financial statements, to review the effectiveness of internal financial controls, to monitor and review the effectiveness of internal audit, and to make recommendations to the Board on the appointment of an external auditor. The full terms of reference of the Committee can be found in the IMI Corporate Governance Framework on the Company’s website.
In addition to our regular cycle of challenge and oversight activity, we have focused in particular in 2020, on the potential impacts of COVID-19 on our Group Assurance programme for the year and on the operation of the Company’s second line of defence. We have reviewed the accounting treatment for the 2019 acquisition of PBM, for which the assessment of the fair value of assets and liabilities acquired has been finalised. We have also reviewed the significant restructuring spend and the provisions for rationalisation at the year end and satisfied ourselves that the treatment of those disclosed as adjusting items is appropriate. We conducted an audit tender process in 2020 to ensure external auditor effectiveness remains at the highest level and as a result our recommendation is to appoint Deloitte as auditor for the 2021 year end audit. The Board has adopted our recommendation and a resolution for the appointment of Deloitte for the 2021 audit will accordingly be proposed at the forthcoming Annual General Meeting.
Members of the Audit CommitteeCarl-Peter Forster and I were members of the Audit Committee throughout the year. Thomas Thune Andersen joined the Committee on 1 March 2020, following the retirement of Birgit Nørgaard on 29 February 2020. All of the Committee members are regarded by the Board as independent non-executive directors. I have chaired the Audit Committee since 1 October 2017 and became a member on 1 September 2015. I spent my early career in the accounting and audit profession and the Committee, and the Board, are satisfied that I have significant recent and relevant financial experience. I also currently chair the audit committees at The Bankers Investment Trust PLC and at Winton Group Limited. In my role as Chair, I have significant interactions with key senior executives, review in advance papers and agendas for meetings of the Committee and meet, currently virtually, with our external auditor prior to Committee meetings.
The Board is also satisfied that the Committee members have experience at audit committee level and collectively the Committee has the financial, commercial and auditing skills, experience and objectivity to be an effective Audit Committee. Furthermore, Committee members attend as appropriate external training sessions to update our knowledge and in 2020 KPMG delivered a training and skills update session tailored for the Committee.
The Committee invites the following to join appropriate parts of its meetings: the Chief Executive, the Finance Director, the Group Financial Controller, the Group Assurance Director and the external auditor. In addition, the Chairman and other non-executive directors are welcome to attend and usually join the meetings.
The Committee meets alone with the external auditor and with the Group Assurance Director. The Committee has the power to call on any employee to attend. In 2020, two of the three Divisional Finance Directors attended meetings to discuss financial and internal control matters. The Secretary to the Committee is the Company Secretary, who is also the Group Legal Director.
Main areas of activityThe Audit Committee met four times in 2020, once in person and three times by video conference. For two meetings the focus was on the forthcoming results reporting and for the other two the focus was on planning and review matters. All meetings included a review of current accounting matters within the Group, with a focus on judgmental areas such as restructuring provisions, impairment reviews and contingencies.
Audit Committee Report
76 IMI plc Annual Report & Accounts 2020

In 2020, review meetings were held with management and the external auditor to discuss the challenges faced in delivering audited financial results in line with our normal timetable during the pandemic. The careful planning has ensured a satisfactory completion of the work required to finalise this Annual Report.
The Committee continues to seek out with management constructive opportunities for improvement in the effectiveness of internal financial controls. A number of relevant initiatives were implemented in 2020, including the simplification of internal reporting and forecasting and the IT investment and infrastructure programme, which facilitates improvements in external audit efficiency as well as in internal controls.
An update on tax affairs and compliance from the Head of Group Tax was received by the Committee and the Corporate Tax Strategy included in this Annual Report on page 144 was approved by the Committee.
This year’s discussion with the Group Treasurer focused on the special challenges for the treasury function arising from the increased focus on liquidity management and the operational risk with staff working out of the office. Arising from the discussion with the Committee, the committed minimum headroom parameter over a forward looking 12 month period was subsequently increased.
In 2020, the Committee made some deep dives into the divisional control structures, with two of the three divisional finance heads presenting to the Committee on financial controls. Group Assurance carried out a review of the second line of defence in IMI and presented the findings to the December Audit Committee meeting. These sessions helped the Committee build additional comfort around the quality of the finance teams in the divisions. Management has made changes to strengthen the finance function and refresh the talent pipeline for succession planning. The Committee monitors changes in senior finance roles and challenges management to ensure continuity of financial reporting standards following team changes. In 2020, management achieved successful internal transitions for several key leadership roles in finance, as well as the changes made to strengthen the finance function at several operating companies.
The Committee reviewed and approved for submission to the Board the statements on going concern and viability, which are on pages 64 to 65. During 2020, this involved regular assessment of the potential impact of the pandemic and the considerable associated uncertainties. The Committee was satisfied with the going concern and viability statements taking comfort in particular from the strength of the Company’s balance sheet, the borrowing facilities in place and the resilience of its businesses.
The Committee advises the Board on the fair, balanced and understandable requirements for the Annual Report and half year results statement. In the Annual Report, the fair, balanced and understandable criteria are also a review area for the external auditor who has not reported any exceptions. The Statement of directors’ responsibilities on page 114 includes confirmation by the Board that it considers this Annual Report, taken as a whole, to be fair, balanced and understandable.
As mentioned above, we carried out a tender process for the selection of an external audit for the year ended 31 December 2021. This was partly to ensure auditor effectiveness is maximised following the significant restructuring programmes
undertaken in the last two years and the ERP rollouts nearing completion in IMI Critical and IMI Hydronic. It was also undertaken to determine whether a refreshed approach to the audit should be adopted. To ensure time was allowed to complete a robust tender process ahead of the December Audit Committee, we launched a tender process in October 2020. The Committee has recommended the appointment of Deloitte for the 2021 audit.
Significant judgements and estimations in the financial statements In preparing the accounts, there are a number of areas requiring the exercise by management of judgement and estimation. These matters were the subject of appropriate detailed analysis and commentary in papers and reports to the Committee from management and the external auditor. The Committee reviewed the most significant accounting areas involving such judgements and estimates and these are described below.
Acquisition accounting for PBMThere is a 12-month measurement period after the date of acquisition to finalise the accounting for an acquisition. Management exercises judgement on the types of intangible assets acquired and estimates are made of the fair value of all assets and liabilities. As set out in Note 23 to the financial statements on page 178, provisional values in respect of PBM reflected in the 2019 financial statements have been adopted as final without revision. The Committee reviewed the judgements made by management in this respect, including the assumptions used to value the acquired intangibles and confirmed they are appropriate. The external auditor provided confirmation that the judgements made, including the basis used to value the acquired customer relationships and the PBM brand, were considered to be appropriate.
Impairment of goodwill and intangibles arising from acquisitionsThe Committee considered the level of goodwill and intangible assets held on the Group’s balance sheet in respect of a number of past acquisitions and whether, given the future prospects of these businesses, the carrying value in each case remained appropriate.
The year end balance sheet includes goodwill of £449.5m and intangible assets arising on acquisitions of £64.8m. During 2020, the Committee agreed that the grouping of cash-generating units (CGUs) as defined for the purpose of goodwill testing ought to be revised to reflect changes in the operational structures of IMI Critical Engineering and IMI Precision Engineering. A review of the revised grouping of CGUs was carried out by the Committee and the new grouping of CGUs were considered appropriate. In challenging management on the proposed changes, the Committee considered the developments in management and reporting structures and noted that no impairment issues were indicated whether the impairment review was based on the previous or the revised grouping of CGUs. Impairment was also a key audit matter for the external auditor who reported its findings to the Committee and also concurred with the assessment and the revised grouping of CGUs. Note 11 to the financial statements on page 149 provides details regarding the Group’s intangible assets and goodwill.
Introduction Strategic Report Corporate Governance Financial Statements
77

Revenue recognitionThe Committee discussed the timing of revenue recognition on some of the Group’s larger contracts. In addition, this is a key audit matter on which the external auditor reported to the Committee. The Divisional Finance Director for IMI Critical Engineering presented to the Committee on the approach to revenue recognition in respect of IFRS15 (contracts).
Having reviewed management’s process and the external auditor’s report, the Committee concluded that revenues were appropriately reflected in the financial statements. Note 2 to the financial statements on page 129 provides further information.
Inventory valuationThe year end balance sheet includes inventories of £293.3m after £42.8m of provisions. The Committee reviewed the judgements applied to standard costing valuations and provisions against excess and obsolete inventory and concurred with management’s assessment. The updated Group methodology on inventory provisioning introduced in 2019 has been adopted for a first full year bringing greater clarity regarding the judgements and estimates made by management in this connection, although this has not materially impacted the provisions. This was a key audit matter for the external auditor, in respect of which it reported to the Committee that inventory valuation across the Group is considered appropriate. Note 15 to the financial statements on page 163 provides details of inventory valuation.
Other judgement areas – restructuring, tax and pensionsThe Committee reviewed the amounts and appropriateness of restructuring costs of £36.1m and provisions of £30.1m disclosed as adjusting items. The Committee reviewed the restructuring costs incurred by project to seek confirmation that they were non-recurring. The Committee reviewed the adequacy of taxation provisions for uncertain matters. Further details on these areas can be found in Notes 3 and 9 respectively, on pages 132 and 144.
The Committee also reviewed the appropriateness of the accounting treatment in respect of pension scheme liabilities, including the actuarial assumptions used and the impact of one-off special pension events. The Committee also received a report reflecting appropriate expert input from the external auditor, which concluded that the accounting for pensions proposed by management was not materially misstated. The Committee supported management’s ongoing efforts to de-risk the Group’s pension obligations. Further details can be found in Note 14 on page 156.
Financial Reporting Council review of 2019 Annual Report As part of its routine work, the Corporate Reporting Review Team of the Financial Reporting Council (‘FRC’) reviewed IMI’s 2019 Annual Report. This review does not provide assurance that the report and accounts are correct in all material respects as the FRC’s role is not to verify the information but to consider compliance with reporting requirements. The FRC commented on two matters and has welcomed the changes proposed by the Group in response. The Group has extended its disclosures on the measurement of variable consideration for IMI Hydronic, which has been included in Note 2C to the consolidated financial statements on page 129. The Group has expanded the items
included in the Statement of comprehensive income to separate out certain items in the net investment hedging of foreign operations which were previously shown on a net basis (see the Statement of comprehensive income on page 125).
Internal auditThe Committee received reports from and monitored the work of the Group’s internal audit function, known as Group Assurance. Group Assurance has a direct reporting line to the Committee and also reports through the Finance Director to the Chief Executive. Group Assurance work is primarily directed towards financial control audits but also covers other selected areas including project planning and implementation for major business changes and internal control declarations.
The principal projects assured in 2020 were major IT system implementations in the divisions; a project margin review in IMI Critical Engineering; a review of the system and processes to report Carbon Emissions data; and financial control improvements at Bimba. Group Assurance works closely with the divisions to implement monitoring and review processes to complement the internal and external audit coverage.
During the year, 34 internal audit reviews were completed with 23 of these supported by divisional finance managers. In response to the pandemic, a flexible approach and greater use of remote audit procedures were used to deliver the internal audit plan in 2020, with the Audit Committee being consulted on the amendments at all of its meetings. The change two years ago to involve divisional financial managers in the internal audit process has proven to be great value in 2020 to cope with travel restrictions.
Group Assurance is continuing to develop its use of technology and automation to facilitate remote reviews, making use of the Group’s improved ERP and data warehouse systems. This included the setting up of an internal control dashboard for IMI Critical Engineering and further developing the ability to access information directly from systems for remote review. Data analytics were used to audit employee expenses and entertaining and to analyse data to carry out 18 remote balance sheet reviews.
The Group Assurance team is led centrally by experienced, senior internal audit professionals and across the Group there are over 100 staff trained to conduct internal financial control audits. The annual plan and resourcing for internal audit were approved by the Committee and take account of the enhanced monitoring and review activity within the divisions. The scope of internal audits covers certain operational and commercial risks in addition to financial controls. Experienced financial managers from the divisions work on combined audits covering financial, operational and commercial matters. Group Assurance has trained divisional finance managers in financial control auditing skills and provided a toolkit to enable them to carry out financial control audits at other sites in their division. Financial control evidence binders have been introduced across the Group to help improve internal controls and to make internal audits more efficient. The binders also support transition and continuity in the event of any changes in finance staff.
Locations to be reviewed each year are selected on a risk assessed basis, discussed and agreed with the Committee and take account of the external audit plan. In 2020, as in any other year, a small number of locations are changed during the year for business reasons and five 2020 planned visits were rescheduled for 2021. The completion of actions arising from
Audit Committee Report
78 IMI plc Annual Report & Accounts 2020

internal audits and reviews is monitored by the Committee and the track record is excellent.
The Committee reviewed the effectiveness of Group Assurance with management and received input from the external auditor. The Committee supports the co-sourcing model with the Group Assurance Team and experienced financial managers from the divisions working together to enhance the effectiveness of assurance processes. An area for improvement which was identified is for Group Assurance to continue to develop its capability to carry out operational and commercial risk reviews. The improvement action for 2020 was to do more to share best practice and progress has been made, most notably with the creation of evidence binders including best practice examples for key controls and how the best sites operate.
The Committee has welcomed the way in which staff involved in Group Assurance activities have coped with the challenging circumstances of 2020 so that the level of assurance gained from its activities during the year is at least equal to, and indeed may in some areas surpass, the previous year.
External audit independence and performance reviewThe Committee approved the proposed external audit approach and its scope based on the size and level of risk of the entities concerned. The Group and the external auditor take a risk-based approach to audit and other assurance activity. The key audit matters identified by EY are set out in its report on pages 116 to 123 and were reviewed by the Committee in approving the audit scope and plan.
The Committee considered the independence and objectivity of the external auditor to be satisfactory. In assessing auditor independence, the Committee had regard to the Financial Reporting Council’s (FRC) best practice guidance for audit committees. In addition, the external auditor confirmed that its ethics and independence policies complied with the requirements of the FRC’s Ethical Standard. To maintain the objectivity of the audit process, the external audit partner responsible for the Group is rotated within the audit firm at least every five years and the current Senior Statutory Auditor, Simon O’Neill, was first appointed in respect of the 2018 audit.
The policy on the engagement of the external auditor for non-audit work takes account of developments in regulatory requirements and was slightly revised to take account of changes in the FRC’s ethical standards effective from 15 March 2020: specifically, to confirm that contingent fees would not be acceptable. The policy requires approval by the Committee Chair for any non-audit engagement for which the estimated fees exceed £10,000. The Finance Director monitors any proposed non-audit engagements of EY and refers to the Chair for approval as appropriate. The policy does not allow work to be placed with the auditor if it could compromise auditor independence, such as functioning in the role of management or auditing its own work. Non-audit fees paid to the auditor were £0.1m (2019: £0.1m), which represents 3% of the audit fee and demonstrates the tight control which is maintained in this area. The only significant non-audit engagement during the year was in respect of the interim results review, which is technically not statutory audit work but is typically placed with the audit firm, and was approved by the Committee. The Committee considers the level and nature of non-audit work to be modest and not to compromise the independence of the external auditor. The Committee is satisfied that EY is fully independent from management and free of conflicts of interest.
Pursuant to the power granted at the 2020 Annual General Meeting, the Committee reviewed and approved the proposed audit fee payable to EY.
The Committee formally reviewed the effectiveness of the external audit process. As in other years, a questionnaire, sent to over 30 business unit finance directors, and interviews with members of the Committee and selected executives were used to review the external auditor’s performance. Based on the results of the questionnaire and feedback received, the Committee believes the external auditor’s performance has been good and effective. To enhance further the external audit process, certain improvement actions were agreed and plans were put in place by EY to address these during the 2020 audit. Following the 2019 review, EY made improvements in key action areas by providing more insight into lessons learned and best practices and giving more feedback on the quality of the finance teams around the Group. The Committee also reviewed the FRC’s Audit Quality Review report regarding EY as a firm.
Audit tenderingAs noted above, a formal audit tender process led by the Committee was completed in 2020 leading to a recommendation to the Board for the appointment of Deloitte. The tender process complied with the Competition and Market Authority’s Order. Current legislation will require an audit tender by not later than 2031 and the Company retains the freedom to tender earlier. The Committee considers it would be appropriate to conduct an external audit tender process commencing in the year before any change of auditor is made and therefore not later than 2030 in any event.
Committee attendance and evaluation
The Committee reviewed its own performance and terms of reference and received positive feedback, with no recommended changes, from the externally facilitated evaluation exercise carried out for the Board and each of its standing committees. The Committee is aware of the current external debates on the roles and responsibilities of auditors and audit committees. It will remain vigilant in reviewing its work to meeting changing business needs as well as external developments.
The Committee approved this report on its work.
Yours faithfully
Isobel Sharp Chair of the Audit Committee
25 February 2021
Director Audit Committee meetings
% attended where eligible
Thomas Thune Andersen* 3/3 100
Carl-Peter Forster 4/4 100
Birgit Nørgaard* 1/1 100
Isobel Sharp 4/4 100
* Birgit Nørgaard retired on 29 February 2020 and Thomas Thune Andersen joined on 1 March 2020.
Introduction Strategic Report Corporate Governance Financial Statements
79

Dear ShareholderI am pleased to make my report as Chair of the Nominations Committee. This report is intended to give an account of the Committee and its activity. The core responsibilities of the Committee are succession planning and appointments at Board level and oversight of appointments to the Executive Committee. The full terms of reference of the Committee can be found in the IMI Corporate Governance Framework on the Company’s website.
CompositionThomas Thune Andersen, Carl-Peter Forster, Katie Jackson, Isobel Sharp and I were members of the Committee throughout the year. Caroline Dowling joined the Committee on 1 January 2020 and Birgit Nørgaard retired on 29 February 2020. For the purposes of the Code, all of the non-executive directors on the Committee are regarded as independent non-executive directors.
Attendance
Main areas of activityBoard changes and recommendations for election and re-electionIn response to Birgit Nørgaard’s decision to step down on 29 February 2020, the Committee engaged Russell Reynolds to undertake a full search process to find a new non-executive director. The Committee recommended the appointment of Caroline Dowling which was approved by the Board and the appointment was made with effect from 1 January 2020.
Following Birgit’s retirement, Carl-Peter Forster became Chair of the Remuneration Committee and Thomas Thune Andersen assumed responsibility as the non-executive director for employee engagement and for ESG matters. Caroline Dowling joined the Remuneration Committee and, from 1 March 2020, Thomas joined the Audit Committee and stepped down from the Remuneration Committee. These appointments were also recommended by the Committee and approved by the Board.
All of the directors standing are recommended for re-election or election at the Annual General Meeting following Board approval of the recommendations made by the Committee in this connection.
Nominations Committee Report
Director Nominations Committee
meetings
% attended where eligible
Thomas Thune Andersen 3/4 75
Caroline Dowling 4/4 100
Carl-Peter Forster 4/4 100
Katie Jackson 4/4 100
Birgit Nørgaard* 1/1 100
Isobel Sharp 4/4 100
Lord Smith 4/4 100
* Birgit retired on 29 February 2020.
80 IMI plc Annual Report & Accounts 2020
Succession planningThe Committee reviews Board composition and has formulated a structured, medium-term plan for Board succession. In September 2021, Carl-Peter Forster will complete nine years as a director and it is envisaged that he will step down at that point unless special reasons for an extension arise. A search for a new non-executive director is underway in conjunction with Audeliss, consultants engaged by the Committee to help enrich diversity at Board level.
During the year, the Committee reviewed talent development and succession planning for the top 169 roles in the Group with the support of the Chief Executive and Group Human Resources Director. We were encouraged to see that significant progress continues to be made in terms of cultivating a stronger pipeline of high-calibre talent, as demonstrated by the increasing proportion of internal appointments now running at 75%. Details of our leadership development and succession planning processes are set out in the Environmental, Social & Governance section on pages 28 to 43.
Review of time commitments and contributionsThe appointments of the Chairman and non-executive directors are made on the basis of a formal letter of appointment including a stated minimum time commitment judged appropriate by the Committee. All significant external commitments of directors are approved by the Board. The Committee considers that the time given to IMI by each non-executive director is sufficient. The Board is satisfied that I have the necessary time to devote to my role as Chairman.
Inclusion and diversityThe Committee recognises the benefits a diverse pool of talent can bring to a boardroom and remains committed to increasing diversity across IMI. We will continue to review the composition of our management teams and the Board to ensure that we have the right mix of skills and experience while maintaining our effectiveness and execution capabilities. The Committee’s terms of reference and activity reflect its responsibility under the Code for promoting broader diversity at Board and senior management level.
At Board level, half the directors are non-British born and there are five nationalities. Three of the non-executive directors are female, representing 37.5% of the Board, and there is a broad mix of backgrounds and experience as detailed on pages 66 to 67 and 70. The Committee recognises the importance of broader diversity and is factoring the guidance from the Parker Review Committee into the search and selection process for new non-executive directors. I am delighted that Dr Ajai Puri will be joining the Board as a non-executive director with effect from 1 March 2021.
The Committee and management are supportive of the need to improve gender diverse representation at senior executive levels and two of the seven member Executive Committee are female, which represents 29%. The Executive Committee includes four nationalities. Further information about the initiatives we are implementing to increase inclusion and diversity across the Group are detailed in the Environmental, Social & Governance section on pages 28 to 43.
Committee evaluationThe Committee reviewed its own performance and terms of reference and received positive feedback, with no recommended changes, from the evaluation exercise carried out in respect of the Board and each of its committees.
The Committee approved this report on its work.
Yours faithfully
Lord Smith of Kelvin Chair of the Nominations Committee
25 February 2021
Introduction Strategic Report Corporate Governance Financial Statements
81

On behalf of the Board, I am pleased to present the Annual Directors’ Remuneration Report for the year ended 31 December 2020. This is my first report as Chair of the Remuneration Committee following my appointment on 1 March 2020.
Remuneration in 2020ContextAlthough 2020 has been a year of unique challenges, IMI plc has achieved the following:
» Significant progress towards strategic goals despite the impact of COVID-19
» Group adjusted profit before tax increased by 9% to £273.9m while adjusted revenue decreased by 3% to £1,825m
» Adjusted earnings per share of 79.7p increased by 9% in 2020
» Strong cash conversion of 117%
2020 was Roy Twite’s first full year as Chief Executive and included some unprecedented challenges presented by the pandemic. The rapid introduction of new ways of working to enable our employees to carry out their roles in safety was a priority. The resilience of the business and the success of the extraordinary measures taken to ensure the maintenance of near normal operations are reflected in the results. In addition, while economic conditions were difficult and activity in many of our key markets was lower as a result of the pandemic, profit, margins and cash generation all improved year-on-year. Throughout this period of uncertainty, the Remuneration Committee is confident that its decisions have been well judged and meaningful in ways that ensure that the success of the company fairly cascades down throughout the organisation and aligns the wider workforce with the Group’s executive.
During the year, I led the Committee in its review of IMI’s executive remuneration policy, with the objective of ensuring that it continues to support the delivery of our strategic growth plan and that there remains a strong pay for performance relationship. Following this review and consultation with institutional shareholders, we are proposing no major policy changes, but some adaptations to the existing executive director remuneration arrangements to further align executive and shareholder long-term interests. We will be
seeking your approval of this new remuneration policy at the forthcoming Annual General Meeting.
The Committee was pleased to see that 93.6% of shareholder votes at the 2020 Annual General Meeting supported the Committee’s implementation of the current Remuneration Policy.
COVID-19The seriousness of the pandemic became gradually more apparent towards the end of quarter one. In response to the increasing uncertainty, the Board took the decision to postpone the 2019 final dividend but also to take a 20% reduction in base salary and fees for a minimum of three months from 1 May 2020. Over 150 of our senior employees also volunteered to have a reduction in base pay for the same period.
As the Group navigated through the year, the business performance stabilised and the Board decided to pay the originally envisaged 2019 final dividend to shareholders as an addition to the interim dividend paid in September 2020. The Board also decided to make whole our senior employees who had volunteered for the 20% cut in pay. However, in the circumstances, the Directors declined to have any of the three month cut in remuneration repaid to them.
IMI has ultimately not benefitted in 2020 from the UK government furlough scheme.
Our stretching 2020 annual incentive targets were set without foreseeing the impact of COVID-19 and were not adjusted in the year by reason of the economic downturn caused by the pandemic. Similarly, our long-term incentive targets were not modified for the extraordinary event represented by the pandemic. Details of our incentive outcomes are described later in this section of the report.
Statement from the Chair of the Remuneration Committee
82 IMI plc Annual Report & Accounts 2020

Pay for performance Our focus this year has been twofold: to ensure consistent application of our Policy and to ensure our remuneration arrangements remain appropriate in the context of the challenging economic and market conditions we are continuing to face.
At the heart of our Policy is pay for performance and a high proportion of our executive directors’ remuneration is closely tied to business performance.
The Committee select performance measures that align to the strategy and when setting stretching performance targets take into account a number of factors, including the strategic plan, annual budget, analysts’ forecasts and economic conditions. Our objective is always to set stretching targets while at the same time ensuring that strong underlying performance, which can sometimes be obscured by external macro-economic conditions, is recognised. When assessing the level of performance achieved, the Committee takes into account wider circumstances to ensure incentive outcomes are a fair reflection of actual performance. Further information about the process we follow when setting targets and assessing performance is set out on page 97.
Results were ahead of expectations given the mixed economic and market headwinds.
» Group adjusted profit before tax increased from £250.7m to £273.9m while adjusted revenue decreased by 3% to £1,825m
» Operating margins increased from 14.2% to 15.6%
» Cash conversion increased to 117% in 2020 and shareholders will receive a total dividend of 22.5p – subject to approval at the forthcoming Annual General Meeting.
Incentive outcomes Annual incentives paid to executive directors in respect of performance in 2020 were based on achievement of stretching targets relating to Group adjusted profit before tax and strategic and personal objectives incorporating ESG metrics. The Committee determined annual incentive outcomes ranging between 72.9% and 73.0% of maximum for the executive directors, which fairly reflects business, individual performance and is aligned with the wider stakeholder experience.
The 2018 IMI Incentive Plan (‘IIP’) award which was subject to stretching Return on Capital Employed, Group adjusted profit before tax (PBT) growth and relative Total Shareholder Return (TSR) targets measured over three financial years will vest at 58.8% in March 2021.
As part of its determination of incentive outcomes, the Committee considered the impact of the IFRS 16 accounting change and the underlying performance of the business, external factors such as macro economic conditions and shareholder experience during the performance period. The Committee concluded that the above outcomes were a fair reflection of performance and did not consider it necessary to exercise its discretion to adjust the level of incentives payable according to the performance targets.
Full details on the targets set and performance against them can be found on pages 98 to 100 in respect of the annual incentive and page 101 for the 2018 IIP award.
New reporting requirementsThe transposition of the new Shareholder Rights Directive articles into UK law has brought new reporting requirements. IMI already meets a number of these requirements having reported in line with market best practice in prior years. The key requirements are:
Remuneration policy:» Detail on when shares awarded to directors may be granted
or exercised, applicable vesting periods, holding and/or deferral periods; page 87
» Directors’ service contracts duration; page 89
» The decision-making process through which the policy has been determined, and highlighted key changes compared to the previous policy; page 84
Remuneration report:» The annual change of each director’s pay to the annual
change in average employee pay, over a rolling five year period; page 105
» The split of fixed and variable pay for each director; page 95
» Any changes made to share options granted or offered, and the main conditions for the exercise of these rights including the exercise price and date, compared to the previous year; pages 101 and 102
» IMI’s remuneration reports do not include any sensitive personal data, revealing racial or ethnic origin, political opinions or religious beliefs.
Introduction Strategic Report Corporate Governance Financial Statements
83
Statement from the Chair of the Remuneration Committee
2021 Executive remuneration policyPolicy review activities Together with our internal team and our remuneration advisors, I led the Committee in its review of the current policy during 2020 in light of our latest strategy announced in November 2019, the evolving corporate governance environment in the UK, and also the difficulties caused by the COVID-19 pandemic. As part of the policy review process, I have had the opportunity to consult with a number of our shareholders and shareholder representative bodies who have helped shape our policy decisions. The policy was set in the context of the wider pay policies at IMI including those applicable to the wider workforce.
Any changes made to the policy will continue to support the delivery of our strategy whist maintaining a strong pay for performance relationship.
Following this review, we are proposing only minor changes and adaptations to the existing executive remuneration arrangements to further align executive and shareholder long-term interests. We will be seeking shareholder approval of this new remuneration policy at the forthcoming Annual General Meeting.
Policy review outcomes The material changes which are proposed to amend the policy framework are as follows:
Executive director pensions » With an established market precedent and clearly outlined
investor expectations in this area, the existing pension allowance of 20% for Daniel Shook is to gradually reduce to align it with the level provided to the workforce by the end of 2022. He will not be compensated for this change. Roy Twite’s pension provision is already at that level.
» All new executive directors will have pensions set at the average workforce level on appointment; currently an 11% contribution.
Shareholding guidelines» To align with market practice we propose to increase the
Finance Director’s shareholding guideline to 200% of base salary whilst maintaining current Chief Executive level (250% of base salary).
Post-employment shareholding requirement » We are recommending the adoption of a 2-year post-
employment shareholding guideline with holdings at the shareholding guideline level to be retained.
Malus and clawback » We are proposing expanded wording to include scenarios
of erroneous or misleading data, and misconduct to more specifically align with the 2018 UK Corporate Governance Code.
Remuneration in 2021Policy implementation Consistent with prior years, salary increases effective 1 January 2021 considered a range of factors including the increases for the wider workforce, the financial performance of the Group and prevailing economic conditions. For 2021 the Chief Executive and Finance Director received a 1.5% base salary increase which is below the increase awarded to the wider employee workforce for 2021 of 2.3% but aligned to the general increase applied to UK employees. The base salary for the Chief Executive will be increased to £730,800 in 2021 and for the Finance Director will be £464,500 effective from 1 January 2021. The Chairman and non-executive director fees were also reviewed and increased by 1.5%, with effect from 1 January 2021.
The Committee reviewed the metrics that applied to the annual bonus and IIP awards and considered whether any changes were appropriate in accordance with the policy. The Committee is aware of the recent prevalence of ESG-type metrics and is keen to support IMI’s sustainability agenda. Given the existing linkage of incentives to IMI’s sustainability agenda (see page 42), the Committee has determined that annual bonus for 2021 will continue to be contingent on a PBT growth metric alongside strategic and personal objectives for each executive director.
The weighting of 80% to financial metrics and 20% to strategic and personal objectives will remain. The free cash flow underpin will remain in place and will be reviewed alongside the annual bonus achievement each year. The environmental, social and governance (ESG) underpin will also remain in place taking into account any relevant health and safety, environmental, social or regulatory matters when determining remuneration outcomes. The long-term incentive targets will remain the same as they were in 2020, with TSR targets for IIP awards set to ⅓, Return on Capital Employed (ROCE) to ⅓ and adjusted Earnings Per Share (EPS) equal to ⅓ weighting.
Yours faithfully
Carl-Peter Forster Chair of the Remuneration Committee on behalf of the Board
25 February 2021
84 IMI plc Annual Report & Accounts 2020

Directors’ Remuneration Policy ReportThe Remuneration Committee (the ‘Committee’) presents the Directors’ Remuneration Policy Report, which will be put to shareholders for a binding vote at the Annual General Meeting (‘AGM’) to be held on 6 May 2021. Subject to shareholder approval, the effective date of this policy will be 6 May 2021. The intention of the Committee is that the policy will normally remain in place for three years.The Policy was determined following a robust decision-making process taking into account market, best practice and views of IMI’s shareholders and other stakeholders. The Policy was set in the context of the wider pay policies at IMI including those applicable to the wider workforce. If approved by shareholders at the AGM, the Committee will continue to review and implement the Policy in the above context, including measures to mitigate conflicts of interest.
Illustrations of the application of IMI’s remuneration policyTo illustrate the opportunity available to our executive directors, and the sensitivity of pay to performance, the graphs on this page set out pay outcomes under four performance scenarios:
» minimum, where pay is limited to fixed, non-performance components (based on 2020 salaries, the corresponding pension allowance and other benefits);
» ‘on-target’, where annual bonus and long-term incentives vest at on-target levels;
» maximum, where all variable pay components vest in full; and
» maximum, where all variable pay components vest in full including 50% share price growth
The charts are based on proposed IMI Incentive Plan awards for 2021. The assumptions made under the scenario including 50% share price growth is that all LTI awards increase in value by 50% and no annual bonus payments are deferred into shares. No dividend assumptions are made and all-employee share plans are excluded from the scenario tables.
Daniel Shook
Salary 465 465 465 465
Pension 17% 17% 17% 17%
Benefits 35 35 35 35
Annual bonus 0% 75% 150% 150%
IIP 0% 75% 150% 150%
2,500
3,000
2,000
1,500
1,000
500
Minimum
£000
On-target Maximum Maximum with share price growth
579
1,277
46%100%
27%
27%
1,974
30%
35%
35%
2,497
23%
35%
42%
Long-term incentivesAnnual bonusFixed remuneration
Roy Twite
Salary 731 731 731 731
Pension 11% 11% 11% 11%
Benefits 24 24 24 24
Annual Bonus 0% 100% 200% 200%
IIP 0% 125% 250% 250%
5,000
6,000
4,000
3,000
2,000
1,000
Minimum
£000
On-target Maximum Maximum with share price growth
835
2,479
34%100%
29%
37%
4,124
20%
35%
45%
5,403
15%
34%
51%
Long-term incentivesAnnual bonusFixed remuneration
Percentages in the above tables are percentages of salary.
Introduction Strategic Report Corporate Governance Financial Statements
85
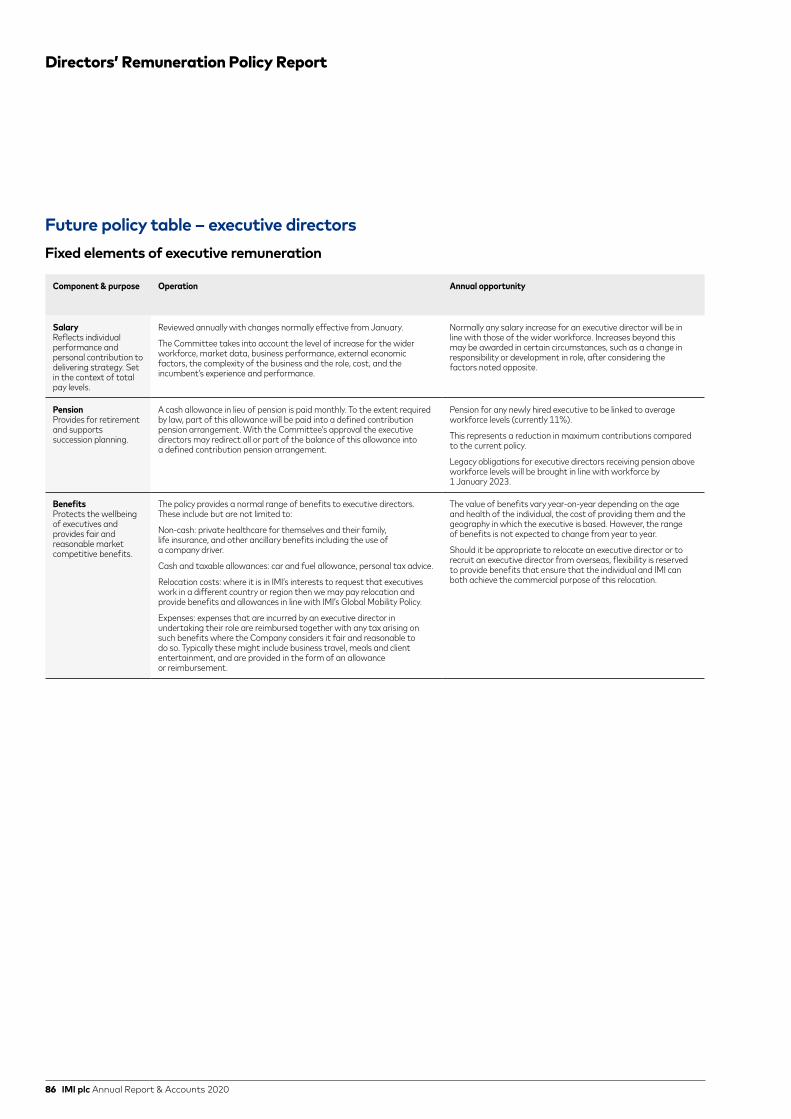
Future policy table – executive directors Fixed elements of executive remuneration
Component & purpose Operation Annual opportunity
SalaryReflects individual performance and personal contribution to delivering strategy. Set in the context of total pay levels.
Reviewed annually with changes normally effective from January.
The Committee takes into account the level of increase for the wider workforce, market data, business performance, external economic factors, the complexity of the business and the role, cost, and the incumbent’s experience and performance.
Normally any salary increase for an executive director will be in line with those of the wider workforce. Increases beyond this may be awarded in certain circumstances, such as a change in responsibility or development in role, after considering the factors noted opposite.
PensionProvides for retirement and supports succession planning.
A cash allowance in lieu of pension is paid monthly. To the extent required by law, part of this allowance will be paid into a defined contribution pension arrangement. With the Committee’s approval the executive directors may redirect all or part of the balance of this allowance into a defined contribution pension arrangement.
Pension for any newly hired executive to be linked to average workforce levels (currently 11%).
This represents a reduction in maximum contributions compared to the current policy.
Legacy obligations for executive directors receiving pension above workforce levels will be brought in line with workforce by 1 January 2023.
BenefitsProtects the wellbeing of executives and provides fair and reasonable market competitive benefits.
The policy provides a normal range of benefits to executive directors. These include but are not limited to:
Non-cash: private healthcare for themselves and their family, life insurance, and other ancillary benefits including the use of a company driver.
Cash and taxable allowances: car and fuel allowance, personal tax advice.
Relocation costs: where it is in IMI’s interests to request that executives work in a different country or region then we may pay relocation and provide benefits and allowances in line with IMI’s Global Mobility Policy.
Expenses: expenses that are incurred by an executive director in undertaking their role are reimbursed together with any tax arising on such benefits where the Company considers it fair and reasonable to do so. Typically these might include business travel, meals and client entertainment, and are provided in the form of an allowance or reimbursement.
The value of benefits vary year-on-year depending on the age and health of the individual, the cost of providing them and the geography in which the executive is based. However, the range of benefits is not expected to change from year to year.
Should it be appropriate to relocate an executive director or to recruit an executive director from overseas, flexibility is reserved to provide benefits that ensure that the individual and IMI can both achieve the commercial purpose of this relocation.
Directors’ Remuneration Policy Report
86 IMI plc Annual Report & Accounts 2020

Variable elements of executive remuneration
Component & purpose Operation Annual opportunity Performance
Annual IncentiveBonusDrives and rewardsperformance againstannual financial, strategicand operational goals,which are consistentwith the medium to long-term strategic goals ofIMI. Considersindividual behaviours and contributions.
Based on annual performance relative to set targets.
If the executive has not achieved their share ownership guideline, up to half of any bonus shall be invested into IMI shares for at least three years. Once the share ownership guideline is met, an executive can then elect to receive their bonus in cash and/or shares.
Dividends (or equivalent value payments) accrue and are payable in cash or shares when shares are released.
Recovery provisions are included in the plan rules allowing for malus and clawback.
Up to a maximum of 200% of salaryPercentage of award payable (straight-line between points):
Threshold 0-20%*Target 50% Maximum 100%
* Determined at the discretion of the Remuneration Committee at the outset of each award.
In 2021, the performance measures will be Group adjusted profit before tax (80%), and strategic and personal objectives (20%), with a health and safety and ESG underpin.1
The Committee has the discretion to determine the appropriate measures, targets, and ranges annually and also to ensure alignment with strategy. Normally these will be a combination of measures linked to the financial performance of IMI and non-financial personal objectives.
IMI Incentive Plan (‘IIP’)Incentivises long- term value creation, aligning the interests of executives and shareholders through share awards.
Performance metrics support the long-term strategy of IMI and the vehicle and time horizon provides a retention tool for key executives.
The Committee can make annual share-based awards. Dividends (or equivalent value payments) accrue and are payable in cash or shares in respect of vested awards.
Any vested performance share awards will be subject to a sale restriction for a period of 2 years from the date of vesting, subject to the executive being permitted to sell such number of shares as may be required to settle tax liabilities as they may arise. In addition the share ownership guidelines apply.
Recovery provisions are included in the plan rules allowing for malus and clawback.
Normal award: Up to 250% of salary
Maximum or Exceptional award: 400% of salary (to be used in exceptional circumstances only e.g. upon recruitment2)
If an award above the normal maximum is made, full details will be provided in the following year’s Annual Directors’ Remuneration Report.
Percentage of award payable (straight-line between points):Threshold 25%Maximum 100%
In 2021 the performance measures1 will be relative TSR (1/3), ROCE (1/3) and EPS (1/3).
The Committee has discretion to determine appropriate measures, targets and ranges in respect of each award when made.
Other executive director remuneration policiesShare ownership guidelinesIt is a requirement of the remuneration policy that executive directors are subject to guidelines which require them to build a shareholding in IMI worth at least 250% of salary for the Chief Executive, and 200% of salary for the Finance Director (and other executive directors if applicable). Policy permits the Committee to determine that up to 50% of any annual bonus earned may be deferred into shares until the share ownership guideline is achieved together with up to 50% of any vested performance share awards. Each executive is then required to maintain at least this share ownership guideline level (subject to allowances for share price fluctuations and changes in base salary thereafter). When assessing compliance with this guideline the Committee reviews both the level of beneficial share ownership and vested but unexercised share incentive awards on a post-tax basis.
Post-employment shareholding guidelinesPost-employment shareholding requirements will be formally introduced requiring executive directors to hold 100% of their shareholding requirement (or if less, all shares held) for two years following departure. This will be implemented by signed agreement. The Committee will have discretion to allow sale where there are exceptional reasons.
1 These are the same performance measures as 2020.2 Refer to page 89 for further details.
Introduction Strategic Report Corporate Governance Financial Statements
87

Additional notes to the future policy table
Setting of performance measures and targetsThe Committee reviews and selects performance measures, targets and ranges annually, which take account of the economic conditions and the priorities of IMI at the time. Details of the performance measures are included in the Annual Report each year. At the time of selecting performance measures, the Committee determines the performance targets that will apply in respect of each measure. Factors that the Committee may consider include the strategic plan, the annual budget, analysts’ forecasts, economic conditions, environmental considerations, social considerations, governance matters, individuals’ areas of responsibilities and the Committee’s expectations over the relevant period. Depending on the nature of the measure e.g. health and safety, the Committee may exercise judgement in assessing performance and determining the level of vesting.
Principles for the impact of corporate transactions The Committee has established principles that determine the way in which corporate transactions will impact remuneration. It is clear that any corporate transaction, which is in the best interests of IMI and its shareholders, should not have an adverse impact on remuneration. The principles include the need for management to be treated in a manner consistent with shareholders in respect to the rights to equity, that performance should be measured on a like-for-like basis, and that there should be no compensation for adverse or favourable tax consequences.
Recovery provisionsThe Committee has the power to operate malus and/or clawback provisions in the event that:
» the Company misstated financial results;
» the Company suffers serious reputational damage;
» if there was an error or miscalculation in determining the size of the award;
» gross misconduct by an executive; and/or
» the Remuneration Committee has made decisions using erroneous or misleading data.
The provisions enable the Committee to reduce future annual bonus payments, reduce the number of shares under any form of share award, and/or require the individual to make a payment to the Company on terms deemed to be fair and reasonable by the Committee.
All-employee share plansIMI operates a HMRC approved Savings Related Share Option Scheme which is open to all of the Group’s UK employees, including the UK-based executive directors. The scheme seeks to encourage share ownership amongst the broader employee population in a tax efficient manner and operates subject to statutory requirements including a limit on the level of savings that can be used to acquire shares. The Group also has a global share plan, the operation of which varies by geography, which executive directors can participate in on the same terms as other employees.
Differences in the remuneration policy for executives relative to the broader employee populationThe remuneration framework in place for the executive directors is informed by the remuneration structure that applies to the broader employee population. While absolute levels and the provision of certain components, benefits and allowances vary by geography and level, the overarching themes are consistent:
» we aim to offer competitive remuneration at all levels of the organisation to attract and retain highly qualified employees;
» salaries are reviewed annually with any increases made on a discretionary basis and informed by factors such as those set out in the policy table;
» consistent with executive directors, the leadership group participates in annual bonus plans with measures linked to corporate, divisional and/or local performance depending on seniority;
» a wider senior leadership population can be considered for awards under the IIP. IMI’s share plans are intended to encourage share ownership at all levels of the Group. The all-employee plans described above are offered on consistent terms to all employees in the geographies where the plans operate; and
» eligibility for and provision of benefits and allowances varies by level and local market practice. For senior managers, it is standard to receive a company car allowance. The Chief Executive is already aligned with the pension provision provided to the wider workforce as will be the Finance Director by the end of 2022.
Directors’ Remuneration Policy Report
88 IMI plc Annual Report & Accounts 2020
Appointments to the BoardBase salary will be set taking into account factors including market levels, experience, internal relativities and cost. The Committee may determine that an initial positioning below market is appropriate and in those circumstances, realign base salary in the years following appointment, which may result in an exceptional rate of increase in the short-term. Any reliance on this principle will be noted at the time of appointment. The theoretical maximum variable pay opportunity that can be awarded in one year will be up to 200% in annual bonus and up to 400% in an IIP award.
As part of the appointments policy the Committee may also:
» continue with the provision of existing legacy remuneration components relating to pension, benefits and allowances for internal appointments;
» provide benefits, allowances and/or payments related to relocation; and/or
» make a long-term incentive award on appointment, outside of the annual cycle, under the existing shareholder approved share plan to provide an immediate interest in company performance. The Committee will determine the level of any award, performance conditions and time horizon informed by the business circumstances at the time. The maximum value of such an award will be 400% of salary and will only be used in exceptional circumstances e.g. upon recruitment.
The Committee may consider ‘buying–out’ incentive awards, up to an equivalent value, that an individual forfeits in accepting the appointment. To achieve this, the Committee will use the shareholder approved plan wherever possible. When making their decision, the Committee will be informed by the vehicles, time horizons, value and performance targets associated with any forfeited awards.
Service contracts will be entered into on the following terms:
» Notice period: 12 months’ notice by either party
» Payment in lieu of notice: as determined by the Committee, but restricted to salary, benefits and pension.
Introduction Strategic Report Corporate Governance Financial Statements
89

The primary principle underpinning the determination of any payments on loss of office is that payments for failure will not be made. Service contracts and plan rules have been drafted in such a way that the Committee has the necessary powers to ensure this. On departure, the Committee will take into account factors including the reason for the executive leaving, performance during the time served in the year and contractual obligations when approving any payments. When an executive is terminated for cause there is no entitlement to salary, pension, benefits or an annual bonus and unvested share awards lapse.
The following table provides a summary of the treatment of each component of pay applicable for the current executive directors. It should be noted that the Committee applies judgement in determining whether an individual is classed as a good leaver or otherwise under the share plans and is authorised to reach compromise agreements with departing executives. Agreed departure can include death, ill health, redundancy or retirement.
Termination and loss of office
Payment Agreed departure Differences in a change in control situation
Salary, pension and benefits The Committee may make payment in lieu of notice. None.
Annual bonus Individuals can be considered for a bonus; factors such as time served during the performance period and performance can be taken into account.
Deferred bonuses vest.
Performance to the date of the event taking place will be considered in determining whether any bonus should be payable, subject to the overall maximum applicable to the relevant individual.
In certain situations (as defined in the plan rules) rollover awards of a broadly equivalent nature can be offered for deferred bonus awards.
IIPperformance share awards
Performance measured at the end of the performance period, or at the date of cessation of employment.
Pro-rating for time elapsed at cessation of employment will be considered by the Committee.
Vested awards which are subject to a holding period will not normally be forfeited on a termination and the holding period will continue to apply to such awards (although the Committee may release awards early from the holding period in appropriate cases). If the reason for termination is misconduct, vested awards which are subject to a holding period may be forfeited in whole or in part under the relevant provisions.
Similar to agreed departure with the following differences:
A reduction in the exercise period for vested but unexercised awards.
Performance and time elapsed will be taken into account, but the Committee may enable awards to vest in full.
In certain situations (as defined in the plan rules) rollover awards of a broadly equivalent nature can be offered.
Other The Committee may approve other limited payments which may include legal fees connected to the departure, untaken holiday, out-placement and repatriation.
Similar to agreed departure.
Directors’ Remuneration Policy Report
90 IMI plc Annual Report & Accounts 2020
Considerations taken into account when setting our directors’ remuneration
Employment conditions at IMIWhen setting the salaries for executive directors the Committee takes into account a number of factors (as noted in the future policy table on pages 86 and 87) and these include the broader employment conditions within IMI. More specifically:
» the Committee reviews budgeted salary increases across the Group on a country-by-country basis when assessing the appropriateness of any increases for the executive directors; and
» in making decisions the Committee also takes account of the internal relativities against the reference group and within the wider leadership group and the wider workforce.
Details of these comparison metrics will be included every year in the Annual Remuneration Report.
Shareholder viewsThe Committee has a standing annual agenda item whereby the feedback from shareholders and investor advisory bodies is presented and discussed following the Annual General Meeting. The feedback that the Committee receives informs discussions for the formulation of future policy and subsequent remuneration decisions. A formal shareholder consultation process was undertaken in the summer and autumn of 2020 to gather investor feedback on the proposed remuneration policy as set out herein. Shareholders were generally supportive of the proposals and their feedback has been taken into account during the development of the new remuneration policy set out here.
Chairman and non-executive directors
Letters of appointmentThe letters of appointment set out key duties, including appropriate time commitments, provisions for induction and familiarisation with the businesses and wider senior management team and require approval for other directorships and potential conflicts of interest.
There are no provisions for the Company to give notice, but the Chairman is required to give three months notice to the Company and non-executives one month. Subject to annual re-election at the Annual General Meeting, the initial period to first renewal is three years. After six years, renewal is considered on an annual basis.
The letters of appointment are available for inspection at the Annual General Meeting and the Company’s registered office. Details of the dates and unexpired terms are included in the Corporate Governance report on page 70.
Appointments to the boardAny contractual terms will be consistent with those currently adopted for existing non-executive directors updated as necessary for legal reasons and to reflect best practice. The Chairman and non-executive directors are not eligible to receive any variable pay. On appointment, fees for non-executive directors will be consistent with the policy in place at the time of appointment. If necessary, to secure the appointment of a new Chairman who is not based in the UK, payments relating to relocation and/or housing may be provided.
Chairman and non-executive directorsThe table over the page summarises the policy with respect to the remuneration of the Chairman and non-executive directors. No component of remuneration is linked to performance, there are no provisions for the recovery of sums paid or the withholding of any payments and there are no provisions for the Company to pay compensation on early termination.
Introduction Strategic Report Corporate Governance Financial Statements
91

Future policy table – Chairman and non-executive directors
Component & purpose
Operation Annual opportunity Performance
Base fees To attract and retain high-calibre individuals by offering market-competitive fees, commensurate to the time commitment and experience that is required.
Fees are reviewed annually and can be paid in cash and/or shares.
Benchmarked against companies of a similar size and complexity.
When setting fees, factors considered include the level of increase for employees more generally, market data, business performance, external economic factors, the skills required, time requirements and cost.
In respect of the Chairman, IMI also considers the individual’s profile and experience.
As of 31 December 2020, the Chairman’s fee was £333,500 paid in cash. Fees can be paid in a combination of cash and/or IMI shares.
At 31 December 2020 base fees for the non-executive directors were £66,800 paid in cash.
The fees were reviewed at the end of 2020 and increased by 1.5% with effect 1 January 2021.
Additional fees To reflect the additional time required when an individual chairs a committee, is appointed as senior independent director, or is otherwise required to assume additional duties.
Fees are reviewed annually and can be paid in cash and/or shares.The Chairman is not eligible to receive additional fees for his chairmanship of the Nominations Committee.Fees are benchmarked where appropriate and set in a manner consistent with base fees (see above).
Fee levels in place at 31 December 2020:
Audit and Remuneration Committee chairs: £16,700
Senior independent director: £11,100
Employee engagement non-executive director: £5,100
Non-executive director for ESG: £5,100
Benefits To reimburse reasonable business expenses.
Reimbursement in cash on production of receipts or other proof of payment of business expense.
All reasonable travel and other expenses incurred by the Chairman and non-executive directors in carrying out their duties together with any tax arising on such benefits, are reimbursed where the Company considers it fair and reasonable to do so. Typically these might include business travel, meals and entertainment, and are provided in the form of an allowance or reimbursement.
Directors’ Remuneration Policy Report
92 IMI plc Annual Report & Accounts 2020
Annual Directors’ Remuneration ReportOn behalf of the Board, the Remuneration Committee (the ‘Committee’) presents the Annual Directors’ Remuneration Report, which will be put to shareholders for an advisory (non-binding) vote at the Annual General Meeting to be held on 6 May 2021. The report includes details of the work of the Committee, the pay received during the year in accordance with our current directors’ remuneration policy, approved by shareholders at the Annual General Meeting in May 2018. A copy of the approved Directors’ Remuneration Policy is included in the 2017 Annual Report which can be found on the IMI website.
The CommitteeCompositionThe members of the Committee throughout the year were Birgit Nørgaard (Outgoing Chair), Carl-Peter Forster (Incoming Chair), Katie Jackson and Caroline Dowling. In accordance with the Code, all the non-executive directors are regarded by the Board as independent. As previously noted, Birgit Nørgaard stood down from the Board on 29 February 2020 and Carl-Peter Forster became chair of the Committee from 1 March 2020. Caroline Dowling, who joined the Board on 1 January 2020, was, from that date, also a member of the Committee. Thomas Thune Andersen stood down from 1 March 2020 when he joined the Audit Committee.
ResponsibilityThe Committee determines the remuneration policy and rewards for the executive directors and other members of the Executive Committee and the Chairman. The Committee also considers the levels of pay and benefits across the Group. A copy of the Committee’s terms of reference is included in the IMI Corporate Governance Framework and is available on our website.
Internal advisers to the CommitteeDuring the year, the Committee consulted the Chief Executive, regarding the packages of members of the Executive Committee. It also received support from the Finance Director, the Group Human Resources Director, the Head of Group Reward and the Company Secretary, who is also secretary to the Committee. None of these individuals were involved in determining their own remuneration.
External advisers to the CommitteeIndependent remuneration consultant, Willis Towers Watson, is formally appointed by the Committee and provided advice on executive remuneration to the Committee in 2020. The Committee noted that the firm are actuaries and administrators for IMI’s UK Pension arrangements. The Committee is comfortable that these activities do not represent a conflict of interest and that objective and independent advice continues to be received by the Committee from the dedicated team servicing it at Willis Towers Watson.
The fees charged by Willis Towers Watson in respect of advice and services to the Committee totalled £104,500 in 2020. Willis Towers Watson are signatories to the Remuneration Consultants’ Code of Conduct in the UK.
Introduction Strategic Report Corporate Governance Financial Statements
93

A summary of the Committee’s activities during 2020The Committee had three formal meetings during the year; attendance can be viewed in the table adjacent. The principal agenda items were as follows:
» review of the external market and executive pay actions in response to COVID-19;
» review of and implementation of a 20% salary reduction for the Board effective 1 May on a temporary basis (3 months) in response to COVID-19;
» review and approval of the 2021 directors’ remuneration policy;
» consideration of shareholder feedback in relation to the 2021 directors’ remuneration policy and amendments to policy design as appropriate;
» a review of total compensation packages of the members of the Executive Committee alongside a deep dive into the wider workforce remuneration and related policies;
» approval of achievements and outcomes for 2019 under the incentive plans;
» consideration of the fees for the Chairman;
» setting the target levels for the 2020 incentive cycle;
» approval of the 2020 share awards to members of the Executive Committee;
» prospective review of the performance metrics and targets for the 2021 incentive cycle;
» consideration of prevalence of ESG within strategy and current linkage to incentives;
» review of IMI’s gender pay gap data for 2020 against the prior years’ data;
» review of IMI’s pay ratio of the Chief Executive to UK employees and underlying calculation methodology;
» receipt of an update on the UK corporate governance and regulatory environment, and updated reporting regulations;
» review of the performance of the independent remuneration consultants to the Committee;
» review of risks as they relate to executive compensation;
» review of the Committee’s own performance, constitution and terms of reference; and
» review of executive director’s service agreements.
Attendance
Annual General Meeting 2020 voting outcomesThe following table summarises the details of votes cast for and against the 2019 Annual Directors’ Remuneration Report along with the number of votes withheld. The Committee will continue to consider the views of, and feedback from, shareholders when determining and reporting on remuneration arrangements.
Director Remuneration Committee meetings
% attended where eligible
Birgit Nørgaard1 1 100
Carl-Peter Forster 3 100
Thomas Thune Andersen2 1 100
Katie Jackson 3 100
Caroline Dowling 3 100
Voting item Votes for Votes against Votes withheld
Annual Directors’ Remuneration Report
93.6% 6.4% 0.7%
1 The February 2020 meeting was Birgit Nørgaard’s last meeting before she stood down from the Board.
2 The February 2020 meeting was Thomas Thune Anderson’s last meeting before he stood down from the Committee.
Annual Directors’ Remuneration Report
94 IMI plc Annual Report & Accounts 2020

Director
Fixed pay (£000)
Annual variable pay
(£000)
Long-term variable pay
(£000)
Other items in the nature of remuneration
(£000)
Total(£000)
Total fixed
pay(£000)
Total variable
pay(£000)
Base salary1 Pension2
Taxable benefits
Annual incentive bonus
IMI Incentive Plan (‘IIP’)
All-employee share plans
Dividend equivalent payments
See page Page 96 Page 96 Page96 Pages 97 to 100 Page 101 Page 103
Roy Twite2020 684 75 23 1,051 618 4 - 2,455 782 1,673
2019 636 112 30 516 409 4 - 1,707 778 929
Daniel Shook2020 435 87 35 500 428 4 - 1,489 557 932
2019 449 90 41 248 277 4 - 1,109 580 529
Executive single figure table (audited)
Roy Twite served on the Board of Halma plc during the year and received fees of £55,575 in respect of this appointment which he retained.Daniel Shook served on the Board of Ultra Electronics Holdings plc during the year and received fees of £63,500 in respect of his appointment which he retained.1 On 30 March the Board announced that both the Chief Executive and Finance Director agreed to a 20% salary reduction, effective 1 May, for three months ending
on 31 July. Pension allowance as a percentage of salary remained the same, and hence reduced in absolute terms, in line with the salary reduction.2 Daniel Shook continued to receive a pension allowance of 20% of salary during 2020. As previously stated, Daniel Shook’s pension allowance will reduce as per
the following schedule: from 1 January 2021: 17% of salary; from 1 January 2022: 14% of salary; and from 1 January 2023: 11% of salary.
These figures have been calculated as follows:
Base salary and fees: the actual salary receivable for the year including any payment in lieu of notice made.
Pension: the cash allowance paid in lieu of pension.
Taxable benefits: the gross value of all taxable benefits (or benefits that would be taxable for a person tax resident in the UK) received in the year.
Annual incentive bonus: the value of the annual incentive payable for performance in respect of the relevant financial year (up to half is automatically delivered in the form of deferred bonus share awards when the executive director does not meet their share ownership requirement) however, the plan rules permit payments to be made wholly in cash.
IMI Incentive Plan (‘IIP’): the value on vesting of the nil cost options that were subject to performance conditions over the three-year period ending on 31 December in the relevant financial year (see share price assumptions below).
Share price assumptions: for shares vesting in 2021, that related to performance in the three years to 31 December 2020, the average share price over the final three months of 2020 (1,121.00 pence) is used to estimate the value of shares on vesting. The value of the award shown in the table that is attributable to share price appreciation is nil.
All-employee share plans: the value of free shares at award and dividends under the Employee Share Ownership Plan in the relevant financial year and the intrinsic value of Save as You Earn share options on the date of grant in the relevant financial year (applying a 10% discount as permitted under the Save as You Earn Share Plan).
Dividend payments: For the IIP an additional number of shares proportional to the dividends paid between the date of the award and the date of vesting are delivered on the vesting date (no further dividends are accrued after the vesting date). This applies to both the performance share awards and deferred bonus share awards under the IIP.
Total fixed pay: Sum of fixed pay columns
Total variable pay: Sum of annual incentive bonus, IMI Incentive Plan (‘IIP’), all-employee share plans, and dividend equivalent payments (if applicable)
Introduction Strategic Report Corporate Governance Financial Statements
95

Annual Directors’ Remuneration Report
Base salarySalary increases effective 1 January 2020 took into account a range of factors including the increases for the wider workforce, the financial performance of the Group and prevailing economic conditions. The average increase for employees in 2020 was 2.8%. Going into 2020, the Chief Executive received no base salary increase and the Finance Director received a 2% base salary increase. Base salary levels were set at £720,000 for the Chief Executive and £457,650 for the Finance Director. On 30 March the Board announced that both the Chief Executive and Finance Director agreed to a 20% salary reduction, effective 1 May, for three months. The 20% salary reduction ended on 31 July.
PensionEffective from the date of his appointment as Chief Executive, Roy Twite received a cash allowance equivalent to 11% of base salary which is consistent with the average global employee pension opportunity for employees.
Daniel Shook received a cash allowance of 20% of salary and the Committee intends to review the appropriateness of this level as part of the policy review in 2020. His allowance will reduce 3% p.a. until 1 January 2023 where he will receive a cash allowance equivalent to 11% of base salary which is consistent with the average global employee pension opportunity for employees.
Pension benefits for past serviceRoy Twite was previously an active member of the defined benefit IMI Pension Fund, the assets and liabilities under which were transferred to either the IMI 2014 Pensioner Fund or the IMI 2014 Deferred Fund (‘the Fund’) in 2014. He opted out with effect from 1 February 2007, before he became an executive director, and as a result he retains past pensionable service up to that date in the Fund.
The key elements of the benefits in the Fund are summarised below:
» the normal retirement age under the Fund is 62 and Roy Twite may retire from employment with IMI any time after age 60 without an actuarial reduction applied to his pension.
» on death after retirement, a dependant’s pension is provided equal to 50% of the member’s pension.
» should he die within the first five years of retirement, the dependant’s pension is increased to 100% of the member’s pension for the remainder of the five-year period.
» pensions in payment more than any guaranteed minimum pension, are increased each year in line with price inflation up to a maximum of 5% in respect of pension built up before 1 January 2006, and 2.5% in respect of pension built up after 1 January 2006.
Executive remuneration received in respect of 2020BenefitsDuring the year the executive directors received several benefits, which are summarised below.
In addition to the above benefits and allowances that are included in the single figure table (refer to table on page 95), the executive directors are also beneficiaries of company policies that have no taxable value, including directors’ and officers’ insurance, death in service cover, travel insurance and personal accident cover.
Accrued pension in the Fund as at 31 December 2020
£000pa
Accrued pension in the Fund as at 31 December 2019
£000pa
Roy Twite 78 76
Roy Twite Daniel Shook
2020 2019 2020 2019
Non-cash benefits (£000)
3 11 21 27
Company car and fuel allowance (£000)
20 19 14 14
Allowances and reimbursement (£000)
- - - -
Total 23 30 35 41
96 IMI plc Annual Report & Accounts 2020

As per the Policy, the Committee reviews and selects performance measures, targets and ranges annually, which take account of the economic conditions, strategy and the priorities of IMI at the time.
1. Set performance measures aligned with strategy and budget
The Committee reviewed and selected performance measures for 2020 that were fully aligned to the business strategy and the annual budget as approved by the Board in December 2020 and communicated to our top ten shareholders. The 2020 annual incentive bonus focused on just one financial metric and non-financial metric. These included:
» Group adjusted profit before tax (80%)
» Strategic and personal objectives (20%)
Free cash flow was also monitored and, if it materially underperformed against budget, the Committee were required to automatically consider applying downward discretion.
There was also an Environmental, Social & Governance (ESG) underpin to provide discretion for the Committee to take into account any relevant ESG matters when determining bonus outcomes.
For 2021, see page 107 for information regarding the financial metrics.
2. Set stretching performance targets In setting stretching performance targets the Committee
considered a range of influencing factors that included the strategic plan, the annual budget, analysts’ forecasts, economic conditions, individuals’ areas of responsibilities and the Committee’s expectations over the relevant period. At the time of setting the performance targets, the Committee did not foresee the economic downturn caused by COVID-19. Nevertheless the Committee resolved to maintain the original stretching targets and consider the application of discretion at the end of the performance period if relevant.
The performance target range itself was established based on the annual budget and required significant outperformance for executive directors to achieve the maximum.
3. Assess performance Results were ahead of expectations given the downward
economic and market headwinds:
» Group adjusted profit before tax increased to £273.9m in 2020;
» Cash conversion was 117% in 2020, compared with 112% in 2019;
» Adjusted Basic EPS increased to 79.7p; » The interim 2020 dividend per share of 7.5p, and the final
2019 dividend per share of 26.2p was reinstated as of 24 July 2020; and
» The total dividend for 2020 was 22.5p compared to 41.1p for 2019 as a result of the resetting of the dividend as communicated at the 2020 half year results.
4. Take account of wider circumstances The Committee believes that the range of measures used
to assess performance of the annual incentive bonus ensures that performance is assessed using a balanced approach, that is fully aligned with the business strategy.
The Committee also considers the wider workforce remuneration and policies when making decisions on executive remuneration. Given the performance noted above and wider operational achievements, the Committee is comfortable that the 2020 annual incentive bonus outcomes represent a fair reward for performance delivered.
5. Discretion to override formulaic outcomes and to apply malus and clawback
Depending on the circumstances, the Committee may exercise judgement in assessing performance and determining the level of achievement.
The Committee has full discretion to override formulaic outcomes and to reduce the amount of any annual bonus, to reduce the number of shares subject to any form of share award and/or to require a repayment to the Company in the event it is discovered that the Company has misstated its financial results, there has been an error or miscalculation in respect of an award, there has been gross misconduct, there is erroneous or misleading data or in any other circumstances as the Committee sees fit. Such other circumstances may include, but are not limited to, serious reputational damage or corporate failure.
The Committee has considered the position and determined that for 2020 it is not appropriate for any reason to exercise the discretion to override formulaic outcomes or recover amounts previously awarded.
4. Take account of wider circumstances
1. Set performance measures aligned with strategy and budget
2. Set stretching performance targets
3. Assess performance
5. Apply discretion if required
Annual incentive bonus
In setting targets and assessing performance the following process is adopted by the Committee:
Introduction Strategic Report Corporate Governance Financial Statements
97

Summarised in the table below is the achievement against Group targets applicable for Roy Twite and Daniel Shook.
1 Adjusted Group profit before tax, as set out in the Income Statement on page 124, adjusted for the impact of IFRS 16, foreign exchange and acquisitions.
Director Measure Maximum opportunity (% of bonus
opportunity)
Performance targets Actual performance
(£m)
Actual performance
(% out of 100)
Actual performance as a percentage of metric
weightingThreshold Target Maximum
All executive directors
Group adjusted profit before tax1
80% £248.9m £262.3m £275.1m £266.9m 68.0% 54.4%
Strategic and personal objectives
20% See table adjacent
100%
Strategic and personal objectivesAs part of the strategic growth plan, the Committee sets each executive director several strategic and personal objectives each year. Performance against these objectives is assessed using a combination of quantitative and qualitative reference points to ensure a robust assessment process. Mid-way through the year the executive is reviewed against their progress towards achieving the strategic and personal objectives with a full review undertaken by the Committee at the end of the performance period. As well as performance against strategic and personal objectives, the Committee considers the wider performance of the Group.
Annual Directors’ Remuneration Report
IMI Critical Engineering Brno, Czech Republic
98 IMI plc Annual Report & Accounts 2020

Director Measure Maximum opportunity (% of bonus
opportunity)
Performance targets Actual performance
(£m)
Actual performance
(% out of 100)
Actual performance as a percentage of metric
weightingThreshold Target Maximum
All executive directors
Group adjusted profit before tax1
80% £248.9m £262.3m £275.1m £266.9m 68.0% 54.4%
Strategic and personal objectives
20% See table adjacent
100%
Director 2020 Strategic and personal objectives Commentary Weighting (% of maximum)
Performance achieved (% of maximum)
Roy Twite
Strategic growth: Fully deploy the agreed strategy. Execute major strategic projects such as rationalisation and footprint plans on time, to budget. Continue to develop acquisition options and relationships across all three divisions. Embed the Growth Accelerator principles into IMI’s new product generation processes. Focus the entire management team on profitable growth, ensuring each organisation can achieve this.
» New strategy deployed with a customer-centric culture of innovation being developed.
» Operating margins improved by 140bps. ROCE improved by 90bps and strong cash conversion of 117%.
» IMI Critical’s and IMI Precision’s rationalisation plans delivered ahead of budget with £33m total savings.
» Growth Accelerator processes embedded in all three divisions.
» Business Performance Reviews held with all key business units to renew focus on delivering improved health and safety, customer satisfaction, employee engagement and profitable growth.
20.0% 18.6%
Strengthen organisation: Continue to build the IMI Executive team and accelerate its performance. Develop training programmes to improve commercial skills and innovation delivery. Support increasing efforts to further improve employee communication and engagement.
» IMI Executive team diversity improved across organisation with two new female Executive Committee members.
» Recruitment of 32 graduates from 11 countries, 56% female for the first time in IMI’s history.
» Several pitch events for our Growth Accelerator and NPD Ignite innovation programmes and established Growth Advisory Board to improve digital capability.
» 85% employee engagement score in respect of employees feeling supported through the Coronavirus pandemic.
Deliver projects: Continue to embed the customer focus value throughout the business to drive profitable growth and aid strategy delivery. Optimise performance and critical execution capability in the divisions.
Via the IMI Way, business reviews, Growth Accelerator and the building of digital customer communities, our customer intimacy value is being embedded across the organisation. In addition, our new value is also included in personal objectives. Growth Accelerator aiding our execution capability in the divisions with new orders being won despite the impact of Coronavirus.
Environment: Demonstrate improvement in scores to achieving FTSE4Good status. Continue to monitor and review HSE, Quality and Risk improvement plans are robust and delivered across the divisions.
Thomas Thune Andersen appointed as ESG representative to help the focus on key areas for progress. FTSE4Good not yet scored our most recent report but we achieved AA rating from the MSCI. Significant improvements achieved in Lost Time Accidents (LTA) and hand injuries. IMI’s response to Coronavirus demonstrated excellent emergency planning and business resilience.
Social: Drive a proactive inclusive and diverse culture and ensure IMI meets the requirements of the Hampton-Alexander Review. Ensure that the Group’s values are lived by.
The Executive Committee now includes two female members out of a total of seven, as well as three female members on the Board. An Inclusion and Diversity programme was launched in 2020 and over half of the graduate intake were female, a first for IMI. Leading by example and performance management employed to ensure the highest values are maintained across IMI.
Governance: Ensure financial controls and reporting integrity are maintained at the highest levels. Continue to regularly update our key shareholders.
Financial controls improved in the year as per external auditors assessment. Over 100 interactions with institutional and other shareholders took place including meeting with 80% of top 20 shareholders.
A summary of the strategic and personal objectives set for 2020 and the performance against them is provided in the table below.
Introduction Strategic Report Corporate Governance Financial Statements
99

Annual Directors’ Remuneration Report
Performance under the financial metric (80% of the total annual incentive bonus achievement) and the strategic and personal objectives (20% of the total annual incentive bonus achievement) and the total achievement (% of maximum) is set out below:
Director Actual performance of financial metrics (%)
Performance achieved under the strategic and personal objectives (%)
2020 maximum bonus achieved (% of maximum)
Roy Twite 54.4% 18.6% 73.0%
Daniel Shook 54.4% 18.5% 72.9%
Based on the performance described above, the annual incentive bonus outcomes for 2020 are set out below:
Director 2020 maximum bonus opportunity
(% of salary)
2020 maximum bonus achieved
(% of maximum)
Total bonus awarded
(£000)
Total bonus awarded
(% of salary)
Achievement of share ownership guidelines
at 31 Dec 20201
Bonus delivered in form of cash
(£000)
Bonus delivered in form of share awards (£000)1
Roy Twite 200% 73.0% 1,051 146.0% 115% 1,051 -
Daniel Shook 150% 72.9% 500 109.4% 126% 500 -
1 Deferred bonus share awards are made where the executive director is yet to reach their share ownership guidance. Details of the share ownership guidelines can be found on page 102.
Director 2020 Strategic and personal objectives Commentary Weighting (% of maximum)
Performance achieved (% of maximum)
Daniel Shook
Strengthen finance organisation: Ensure new Finance/ IT Leadership Team is fully bedded down, with People Development plans aligned to new strategy. Develop data tools to support finance teams in analysing how to further accelerate growth, and determine/deploy commercial skills training into finance to enhance their leadership.
Key internal transitions successfully completed with minimal disruption. Significant number of audits completed with improved communication and incorporating feedback from the Audit Committee. Additional work focused on value pricing and revising finance skills for non-finance managers.
20.0% 18.5%
Deliver projects: Deliver the Simplification, Automation, & Education Programmes within Finance. Reduce finance complexity particularly in reporting and improve the business risk assessment process. Identify the most critical business risk areas for the organisation and develop/deploy process framework to ensure effective mitigation.
Key simplification actions delivered including currency rates and reporting, forecasting templates and monthly reporting. Divisional focus on risk areas combined with new business structures in two divisions have led to lower issues in critical projects.
Environment: Deliver improved employee engagement at the head office. Ensure activity & reporting in place for internal ESG review.
Improved engagement scores successfully achieved. ESG project team in place and internal reporting improved.
Social: Continue to champion diverse talent in the finance and wider organisation.
New recent hires into the Finance team have been female and new finance talent process promotes and ensures the visibility of our diverse talent.
Governance: Continue to ensure accuracy of internal and external reporting particularly with reference to FRC and external audit.
Annual Report process continues to be led and managed well. Communication from FRC continues to be positive and external audit has been clean and thorough.
100 IMI plc Annual Report & Accounts 2020

Awards vesting under the IIPIn March 2018, performance share awards were made to the executive directors under the IIP. The vesting of the awards was subject to the achievement of three independent performance conditions as described below, measured over the three-years ending 31 December 2020. The 2018 IIP award will vest in March 2021 at 58.8% of maximum.
Return on capital employed (ROCE)25% of the award was subject to the achievement of ROCE. This measure is defined as adjusted operating profit as a percentage of the average capital employed during the financial year ended 31 December 2020. Capital employed being Intangible Assets (excluding Acquired Intangibles and Goodwill), Property Plant and Equipment and Working Capital. It compares the earnings of the Group with the Capital invested. ROCE was chosen as a measure as it represents how well the Group has used its investment made by shareholders and capital from creditors to generate a profit.
The portion of the share award that will vest related to ROCE performance in the final year of the performance period. For ROCE of less than 40% no award under this element will vest. 25% of the award will vest for ROCE of 40%, rising on a straight-line basis to full vesting for ROCE of 50%. At the end of the performance period return on capital employed was 43.7% resulting in this element vesting at 13.2%.
Total Shareholder Return (TSR)25% of the award was subject to the achievement of a relative TSR performance measure against a defined group of companies adjusted during the performance period, to take account of merger and acquisition activity during the performance period in line with the Committee’s established guidelines. TSR is defined as the movement in share price during the performance period, measured in local currency, with adjustment to take account of changes in capital structure and dividends, which are assumed to be reinvested in shares on the ex-dividend date. TSR was chosen as a measure as it is an external, relative benchmark for performance that aligns executives’ rewards with the creation of shareholder value.
The portion of the award that will vest related to TSR depends on where IMI ranks in the comparator group. For a TSR rank that is below median, no award under this element will vest. 25% of the award will vest for median TSR, rising on a straight-line basis to full vesting for upper quartile TSR. At the end of the three-year performance period, the Group ranked 14th of the peer group. The resultant vesting outcome for this element of the award is nil.
Group adjusted profit before tax growth50% of the award was subject to the achievement of the Group adjusted profit before tax growth measure. This measure is defined as the profit before tax before adjusting items as shown in the audited accounts of the Group, adjusted for any exceptional items, including significant acquisition and disposal and foreign exchange movements, at the Committee’s discretion.
Adjusted profit before tax growth is a key measure for IMI as it gives an indication of the strength of the Group’s financial performance and shows the amount available to reinvest into the business and pay a return to shareholders through dividends. For growth of less than 2.5% per annum, no award under this element will vest. 25% of the award will vest for growth of 2.5% per annum rising on a straight-line basis to full vesting for growth of 7.5% per annum.
Over the three-year performance period ending 31 December 2020, IMI delivered Group profit before tax growth of 6.9%. The resultant vesting outcome for this element of the award is 45.6%.
Deferred bonus share awardsIn March 2018, deferred bonus share awards were also made under the IIP which vest in March 2021. These are the form of share award used for mandatory bonus deferral into shares of up to 50% of annual bonus payable, where the executive director is yet to reach their share ownership guideline.
1 The three-day average mid-market price on the date of award was 1,131.33 pence2 The price on vesting is unknown at this time and so the total number of shares vesting is valued at the average price over the last quarter of 2020 (1,121.00 pence)
Director Initial award Value on date of award¹ (£000)
Number of initial shares vesting
Additional dividend equivalent shares
Total shares vesting
Value of shares on vesting2 (£000)
Roy Twite 83,971 950 49,374 5,722 55,096 618
Daniel Shook 58,205 658 34,224 3,965 38,189 428
Introduction Strategic Report Corporate Governance Financial Statements
101

Annual Directors’ Remuneration Report
Discretion to override formulaic outcomes and to apply malus and clawbackDepending on the circumstances, the Committee may exercise judgement in assessing performance and determining the level of achievement.
The Committee has full discretion to override formulaic outcomes and to reduce the amount of any IIP award, to reduce the number of shares subject to any form of share award and/or to impose an obligation to make a payment to the Company in the event:
» the Company misstated financial results;
» the Company suffers serious reputational damage;
» if there was an error or miscalculation in determining the size of the award;
» gross misconduct by an executive; and/or
» the Remuneration Committee has made decisions using erroneous or misleading data; or
» in such other circumstances as the Committee sees fit.
The Committee has considered the position and determined that for 2020 it is not appropriate for any reason to exercise the discretion to override the formulaic outcome of the 2018 IIP awards or recover amounts previously awarded.
Share ownership guidelinesIt is a requirement of the Policy that executive directors are subject to guidelines which require them to build a shareholding in IMI worth at least 250% of salary for Roy Twite and 150% of salary for Daniel Shook.
The Policy permits the Committee discretion to determine that up to 50% of any annual bonus earned is deferred into shares until the share ownership guideline is achieved together with 50% of any vested share awards. Each executive is then required to maintain this share ownership guideline (subject to allowances for share price fluctuations and changes in base salary thereafter).
When assessing compliance with this guideline the Committee reviews both the level of beneficial share ownership and vested but unexercised share incentive awards on a post-tax basis.
The Committee has determined that as both Roy Twite and Daniel Shook have met their guideline (as at 31 December 2020) as outlined on page 100, their entire 2020 bonus will be delivered in cash. As per our revised remuneration policy on page 87, Daniel Shook’s share ownership guideline will increase to 200% subject to shareholder approval at the 2021 AGM held on 6 May 2021.
Share interests granted to executive directors during 2020 (audited)Grants made under the IIPPerformance share award grants under the IIP were made on 16 March 2020 in the form of nil-cost options. Awards are due to vest on 16 March 2023, subject to performance in three core areas aligned to our longer-term strategic priorities: Adjusted EPS growth (⅓), relative TSR (⅓), and ROCE (⅓). After vesting a holding period of two years applies subject to the sale of shares as required to meet tax liabilities arising on vesting.
The performance targets, which consider the Group’s approach to implementing accounting changes under IFRS 16, and vesting scale that apply to the 2020 IIP awards are as follows:
The following performance share award grants were approved and made in 2020:
The IIP is also used to grant deferred bonus awards exercisable after three years to satisfy bonuses delivered in the form of shares. Details of these additional IIP awards made in 2020 are shown in the table on page 104 under the ‘without performance conditions’ column. No performance conditions apply to these awards.
1 The three day average mid-market price on the date of award was 808.40 pence.
Adjusted EPS
Relative TSR ROCE Level of vesting
Threshold 3% Median 11.5% 25%
Maximum 10% Upper quartile 14.5% 100%
Weighting ⅓ ⅓ ⅓
IIP shares awarded
Value on date of award1
(£000)
Award as a percentage of
salary
Roy Twite 222,662 1,800 250%
Daniel Shook 84,917 686 150%
102 IMI plc Annual Report & Accounts 2020

For share awards granted in 2020 the TSR group included 18 companies to ensure complete alignment with our peers and comparison to companies with similar products, customers and global spread. The 2020 peer group includes the following companies which is broadly consistent with our 2019 peer group (changes in bold), and in line with the Committee’s guidelines:
All-employee share plansExecutive directors are eligible to participate in the all-employee share plans on the same terms as other eligible employees at IMI.
1 In 2020 free shares were awarded at a share price of 824.97 pence (1,000.64 pence in 2019).
TSR comparator group companies
Belimo Ingersoll-Rand SMC
Circor ITT Smiths Group
Curtiss-Wright Morgan Advanced Materials Spectris
Eaton Parker-Hannifin Spirax Sarco
Emerson Electric Rockwell Automation SPX
Flowserve Rotork The Weir Group
All Employee Share Ownership Plan IMI Sharesave Scheme
Dividends(£000)
Total value under the all-employee share
plans (£000)
Number of shares awarded
Value of free share award1
(£000)
Number of options awarded
Value of options(£000)
Roy Twite2020 436 4 - - - 4
2019 359 4 - - - 4
Daniel Shook2020 436 4 - - - 4
2019 359 4 - - - 4
Director 2020 (£000) 2019 (£000)
Base fees1 Additional fees
Taxable benefits2
Total Base fees Additional fees
Taxable benefits2
Total
Lord Smith of Kelvin 317 - 1 318 327 - 7 334
Carl-Peter Forster3,4 63 24 2 89 66 11 10 87
Birgit Nørgaard5 11 4 - 15 66 21 10 97
Isobel Sharp6 63 16 1 80 66 16 2 84
Thomas Thune Andersen7 63 4 1 68 66 - 8 74
Katie Jackson 63 - 1 64 66 - 4 70
Caroline Dowling 63 - 2 65 - - - -
Chairman’s and non-executive directors’ single figure table (audited)The following table summarises the total fixed fees and benefits paid to the Chairman and non-executive directors in respect of the financial years ending 31 December 2020 and 31 December 2019.
1 On 30 March the Board agreed to a 20% salary reduction in fees, effective 1 May, for three months ending on 31 July.2 Taxable benefits includes travel and hotel expenses plus tax costs associated with Board meetings held at IMI HQ.3 Includes fee for Senior Independent Director.4 Includes fee for being Chair of the Remuneration Committee (pro-rated).5 Includes fee for being Chair of the Remuneration Committee (pro-rated) and the non-executive director with responsibility for employee engagement.6 Includes fee for being Chair of the Audit Committee.7 Includes (pro-rated) fee for being non-executive director with responsibility for employee engagement and for ESG matters.
Introduction Strategic Report Corporate Governance Financial Statements
103

Annual Directors’ Remuneration Report
Relative importance of spend on pay The following information is intended to provide additional context regarding the total remuneration for executive directors.
In 2020, the total dividend for the year of 22.5 pence represented a decrease of 45% over last year’s 41.1 pence.
Relative percentage change in remuneration for the Chief ExecutiveThe Committee actively considers any increases in base pay for the Chief Executive relative to the broader IMI employee population. Benefits and bonus payments are not typically comparable given they are driven by a broad range of factors, such as geographical location, local practices, eligibility, individual circumstances and role.
1 The percentage change takes into account the appointment of a new Chief Executive in 2019.
2 All UK head office employees. This comparison excludes our international workforce which we feel would not provide a true comparision given differing local market factors.
2020(£m)
2019 (£m)
Change
Dividends 91.6 110.8 -17.3%
Total employment costs for Group (see Note 5 on page 138)
583.2 588.0 -0.8%Chief Executive1 Employees2
Base salary -5.0% 3.75%
Benefits -23.3% 0.1%
Annual bonus 103.7% 92%
Directors’ shareholdings and share interests (audited)The following table summarises the share interests of any director who served during the year as at 31 December 2020 or at the date of leaving the Board.
During the period 31 December 2020 to 25 February 2021 there were no changes in the interests of any current director from those shown save for purchases within the IMI All Employee Share Ownership Plan on 12 January 2021 of 10 shares each on behalf of Roy Twite and Daniel Shook at 1,256.00 pence per share, and 9 February 2021 of 9 shares each on behalf of Roy Twite and Daniel Shook at 1,316.00 pence per share.
Director Total interests
Beneficial interests
Scheme interests
Nil-cost options All-employee share plans
With performance conditions Without performance conditions (deferred bonus share awards)
Unvested1 Vested but unexercised
Unvested Vested but unexercised
Roy Twite 643,045 160,208 453,374 - 20,674 - 8,789
Daniel Shook 328,492 46,756 224,604 - 54,740 - 2,392
Lord Smith of Kelvin 14,300 14,300 - - - - -
Carl-Peter Forster 2,625 2,625 - - - - -
Birgit Nørgaard 2,625 2,625 - - - - -
Isobel Sharp 3,000 3,000 - - - - -
Thomas Thune Andersen 2,625 2,625 - - - - -
Katie Jackson 2,618 2,618 - - - - -
Caroline Dowling 1,714 1,714 - - - - -
1 Vesting dates of share awards are shown in Note 6, page 139.
104 IMI plc Annual Report & Accounts 2020

Historical performance and remuneration In addition to considering executive remuneration in the context of internal comparisons, the Committee reviews historical outcomes under the variable pay plans.
The graph below compares IMI’s TSR to the FTSE100 and FTSE250 over the last ten years. We compare performance to the FTSE100 as IMI has been included in the index in the past and it is a position where IMI aspires to be.
TSR measures the returns that a company has provided for its shareholders, reflecting share price movements and assuming reinvestment of dividends (source: CapIQ), with data averaged over the final 30 days of each financial year.
As the graph adjacent illustrates, IMI’s absolute and relative TSR performance has been strong over the last ten years.
The following table summarises the total remuneration for the Chief Executive over the last ten years, and the outcomes of short and long-term incentive plans as a percentage of maximum.
1 Represents remuneration for Martin Lamb, who was Chief Executive from before 2010 until 31 December 2013.2 Represents remuneration for Mark Selway, who was appointed Chief Executive on 1 January 2014.3 Represents remuneration for Roy Twite, who was appointed Chief Executive on 9 May 2019.
Financial year ended 31 December 20111 20121 20131 20142 20152 20162 20172 20182 20193 20203
Total remuneration (single figure, £000) 12,289 7,954 6,688 1,567 1,667 1,901 2,773 3,047 1,707 2,455
Annual variable pay (% of maximum) 85% 47% 62% 36% 40% 50% 95% 75% 43% 73%
Long-term variable pay (% of maximum) - Share Matching Plan
95% 100% 100% - - - - - - -
Long-term variable pay (% of maximum) - Performance Share Plan
100% 100% 82.6% - - 3.5% - - - -
Long-term variable pay (% of maximum) - IMI Incentive Plan
- - - - - - 6.55% 29.2% 47.1% 58.8%
Value of a hypothetical £100 investment
£300
£250
£200
£150
£100
£50
£02010 2011 2012 2013 2014 2015 2016 2017 2018 2019 2020
IMI FTSE100 FTSE250
The following table summarises the annual percentage change of each director’s remuneration compared to:» The annual percentage change of the average remuneration of the company’s employees, calculated on a full-time equivalent basis» The performance of the company over the same preceding financial year
Annual Salary/
Fees
Benefits Annual bonus
Executive DirectorsRoy Twite1 7.5% -23.3% 103.7%Daniel Shook -3.1% -14.6% 101.6%
ChairmanLord Smith of Kelvin -3.1% -85.7% -
Non-executive directors3
Carl-Peter Forster 13.0% -80.0% -Birgit Nørgaard2 -82.8% - -Isobel Sharp -3.7% -50.0% -Thomas Thune Andersen 1.5% -87.5% -Katie Jackson -4.5% -75.0% -
Average Pay of UK HQ employees 3.75% 0.1% 92.0%
1 Roy Twite appointed as Chief Executive in May 2019. The relative percentage change is based on the 2019 Directors single figure table which includes income earned before Roy was appointed as Chief Executive.
2 Birgit Nørgaard resigned from the board on 29 February 2020 and received pro rata fees with no benefits in the 2020 financial year. For the 2019 financial year, she received full year fees and benefits.
3 Caroline Dowling was appointed to the board on 1 January 2020. She received no fees and benefits in the 2019 financial year so has not been included in the table.
Introduction Strategic Report Corporate Governance Financial Statements
105

Annual Directors’ Remuneration Report
Financial year
Total remuneration
Methodology P25 (Lower Quartile) P50 (Median) P75 (Upper Quartile)
2020 Option C 85:1 67:1 45:1
2019 Option C 83:1 62:1 45:1
Pay ratio reporting Pay ratio legislation requires quoted companies with 250 or more employees to publish information on the pay ratio of the Group Chief Executive to UK employees. In line with the new regulatory requirements, the table below sets out the ratio at median, 25th and 75th percentile of the total remuneration received by the Group Chief Executive compared to the total remuneration received by our UK employees – as well as comparing to base salary only. Total remuneration reflects all remuneration received by an individual in respect of the relevant years, and includes salary, benefits, pension, and value received from incentive plans.
» The 2020 Chief Executive single figure is calculated considering the Chief Executive’s remuneration calculation includes base salary, fees, pension, taxable benefits, annual bonus and shares paid during FY 2020.
» As is permitted by Option C of the regulations the Gender Pay Gap data for 2020 based on a snapshot in April 2020 was used to identify our three quartile employees, P25, P50 and P75. Having identified P25, P50 and P75, we chose to review the single figure data for an additional 10 employees at each of the quartiles for the full year ended on 31 December 2020. The remuneration calculation included base salary, allowances, pension, taxable benefits, annual bonus and shares. This method provides a like for like comparison with the Chief Executive’s single figure total for the 2020 calendar year. Gathering data on more than 3 employees provides a better opportunity to capture all pay and benefits of employees to get a true median value at each of the three bandings.
» Our principles for pay setting and progression in our wider workforce are the same as for our executives – total reward being sufficiently competitive to attract and retain high-calibre individuals without over-paying and providing the opportunity for individual development and career progression to attract and retain great talent. The pay ratios reflect how remuneration arrangements differ as accountability increases for more senior roles within the organisation and the ratios reflect the weighting towards long-term value creation and alignment with shareholder interests for the Chief Executive.
» We are satisfied that the median pay ratio reported this year is consistent with our wider pay, reward and progression policies for employees. All IMI employees receive competitive pay and benefits and have the opportunity for annual pay increases and career progression and development opportunities.
» Changes to the ratio in 2020 compared to 2019 are largely attributable to the improved performance of the business and the subsequent impact on improved variable pay.
The total pay and benefits and base salary component of the total pay and benefits figures are as follows:
Base salary (£) Total pay and benefits (£)
Chief Executive remuneration 684,000 2,454,578
25th Percentile employee 26,036 28,893
50th Percentile employee 33,000 36,852
75th Percentile employee 50,803 54,247
106 IMI plc Annual Report & Accounts 2020

Application of the Policy for 2021 Executive director fixed payConsistent with prior years, salary increases effective 1 January 2021 considered a range of factors including the increases for the wider workforce, the financial performance of the Group and prevailing economic conditions.
For 2021 the Chief Executive received 1.5% and the Finance Director received 1.5%. The increase awarded to employees for 2021 was 2.3%.
The base salary for the Chief Executive will be £730,800 in 2021 and for the Finance Director it will be £464,500 effective from 1 January 2021.
The Finance Director will have his pension entitlement reduced by 3%. As such he will receive a cash allowance of 17% of base salary.
Other elements of fixed pay (benefits and allowances) will remain unchanged, although pension allowances are a fixed percentage of salary.
Incentive payAnnual bonusDuring 2020 the Committee reviewed the appropriateness of continuing with the metrics that applied to the 2020 annual bonus to ensure alignment with IMI’s strategy.
The Committee determined that the 2021 annual bonus will be contingent on a Profit Before Tax growth target alongside strategic and personal objectives for each executive director. There will be a weighting of 80% to financial metrics and 20% to strategic and personal objectives.
Free cash flow, if it should materially underperform against budget, will continue to be considered as an explicit reason for the Committee to apply downward discretion. The ESG underpin will continue to be considered to allow the Committee to take into account any relevant ESG matter when determining remuneration outcomes.
The Committee will continue to monitor the underlying performance of the business when determining bonus outcomes. Due to the commercially sensitive nature of the financial targets and strategic and personal objectives, they will be disclosed retrospectively in next year’s report along with performance against them.
The maximum bonus opportunity will be set at 200% of salary for Roy Twite. The annual bonus opportunity for the Finance Director will be set at 150% of base salary. On-target bonus is set at 50% of maximum bonus opportunity.
Performance share awards under the IIPAt the same time as the review of annual bonus metrics, the Committee also reviewed those attaching to IIP awards.
The Committee, also considering shareholder feedback, has decided to set the weighting on TSR, ROCE and EPS to ⅓.
The Committee continues to believe that this will ensure that executives are only rewarded if underlying earnings are increased over the performance period and shareholder returns outperform peers.
2021 awards will be set at 250% for Roy Twite and 150% for Daniel Shook and will be subject to a two-year post-vesting holding period, extending the total time horizon to five years from grant.
In light of wider global economic uncertainty owing to the impact of COVID-19 the Committee considered whether the performance metrics for LTIP awards remain appropriate before concluding that the metrics of TSR, EPS and ROCE, equally weighted, remain aligned with strategy and with the creation of shareholder value. TSR targets remain unchanged but having taken into account internal budgets and analyst consensus estimates the Committee decided the maximum target for EPS and ROCE should be slightly lower than the target set in 2020. However, threshold remains the same as 2020. The Committee believe that despite this reduction the maximum targets for ROCE and EPS remain extremely stretching in the context of the current operating environment. Further, the Committee retains discretion to determine, should the 2021 LTIP vest, whether the formulaic outcome is a fair reflection of underlying business performance and consistent with the shareholder experience over the performance period and if not, to adjust the formulaic outcome accordingly.
The performance targets that will apply to the 2021 IIP awards are as follows:
Service contractsThe unexpired terms of the non-executive directors’ service contracts can be reviewed in the Board’s Corporate Governance Report on page 70.
Fees for the Chairman and non-executive directorsThe Chairman and non-executive directors’ remuneration increased by 1.5%, with effect from 1 January 2021 and compares with a 2.3% increase across the wider workforce.
Committee evaluationThe Committee reviewed its own performance and terms of reference and received positive feedback, with no recommended changes, from the evaluation exercise carried out in respect of the Board and each of its committees.
Carl-Peter Forster Chair of the Remuneration Committee for and on behalf of the Board
25 February 2021
Relative TSR Adjusted EPS
ROCE Level of vesting
Threshold Median 3% 11.5% 25%
Maximum Upper quartile 7.5% 13.5% 100%
Weighting ⅓ ⅓ ⅓
Introduction Strategic Report Corporate Governance Financial Statements
107

Directors’ ReportThe directors present their report, together with the audited financial statements, for the year ended 31 December 2020.Strategic ReportThe Strategic Report is incorporated by reference and includes the content on pages 06 to 65.
Results and dividendThe Group consolidated income statement is shown on page 124. Adjusted operating profit amounted to £284.7m (2019: £266.1m), statutory profit before taxation and discontinued operations amounted to £214.3m (2019: £189.3m).
The directors recommend a final dividend of 15.0p per share on the ordinary share capital payable, subject to shareholder approval at the Annual General Meeting to be held on 6 May 2021, on 14 May 2021 to shareholders on the register at the close of business on 6 April 2021. Together with the dividend paid at the interim in respect of 2020 of 7.5p per share paid on 11 September 2020, this final dividend will bring the total distribution for the year to 22.5p per share. At the same time as paying the interim dividend in respect of 2020, the Company paid the 26.2p per share that was envisaged as a final dividend in respect of 2019 but which was suspended due to cash preservation measures put in place in March 2020.
Research and developmentSee Note 5 to the financial statements on page 138.
Shareholders’ fundsShareholders’ funds increased from £709.9m at the end of 2019 to £799.5m at 31 December 2020.
Share capitalAs at 31 December 2020, the Company’s share capital comprised a single class of share capital which was divided into ordinary shares of 28 4/7p each. Details of the share capital of the Company are set out in Note 22 to the financial statements on page 177. The Company’s ordinary shares are listed on the London Stock Exchange.
The Company has a Level 1 American Depositary Receipt (‘ADR’) programme for which Citibank, N.A. acts as depositary. See page 192 for further details.
As at 31 December 2020, 1,148,793 shares were held in an employee trust for use in relation to certain executive incentive plans representing 0.4% of the issued share capital (excluding treasury shares) at that time. The independent trustee of the trust has the same rights as any other shareholder other than as specifically restricted in the governing trust deed. The trust has agreed to waive any right to all dividend payments now and in the future. Participants in option schemes do not hold any voting rights on the shares until the date of exercise.
During 2020, 19,602 new ordinary shares were issued under employee share schemes: 19,602 under save as you earn plans and nil under executive share plans. Shares acquired through Company share schemes and plans rank equally with the shares in issue and have no special rights.
Pursuant to the Company’s articles of association a tracing exercise was conducted in an attempt to match beneficiaries with shares held by shareholders who had not claimed or cashed a single dividend payment from the Company over a period of at least the last twelve consecutive years. All shares held in the names of such shareholders and which are not matched with beneficiaries, will be forfeited and sold in March 2021 with sale proceeds being retained by the Company.
The rights and obligations attaching to the Company’s ordinary shares are set out in the Company’s articles of association, copies of which can be obtained from Companies House in the UK, from the Company’s website or by writing to the Company Secretary. Changes to the articles of association must be approved by a special resolution of the shareholders (75% majority required) in accordance with the legislation in force at the time. Subject to applicable statutes, shares may be issued with such rights and restrictions as the Company may by ordinary resolution decide or (if there is no such resolution or so far as it does not make specific provision) as the Board may decide.
Holders of ordinary shares are entitled to receive the Company’s report and accounts, to attend, speak and vote at general meetings of the Company, and to appoint proxies to exercise their rights. Holders of ordinary shares may receive a dividend and in a liquidation, may share in the assets of the Company.
Subject to meeting certain thresholds, holders of ordinary shares may requisition a general meeting of the Company or propose resolutions at Annual General Meetings. Voting rights for ordinary shares held in treasury are suspended and the treasury shares carry no rights to receive dividends or other distributions of assets.
There are no restrictions on the transfer of ordinary shares in the Company other than:
» certain restrictions as may from time to time be imposed by laws and regulations (for example insider trading laws); and
» pursuant to the Company’s share dealing code whereby the directors and certain employees of the Company require approval to deal in the Company’s shares.
The Company is not aware of any arrangements between shareholders that may result in restrictions on the transfer of ordinary shares or on voting rights. None of the ordinary shares carry any special rights with regard to control of the Company. The only restrictions on voting rights are those that apply to the ordinary shares held in treasury. Electronic and paper proxy appointments and voting instructions must be received by the Company’s registrars not later than 48 hours (excluding any non-working days) before a general meeting, or (subject to the Company’s articles of association) any adjournment thereof.
108 IMI plc Annual Report & Accounts 2020

Treasury sharesThe Company was granted authority at the Annual General Meeting held on 7 May 2020 to purchase up to 27,200,000 of its ordinary shares. This authority will expire at the conclusion of the next Annual General Meeting to be held on 6 May 2021, where shareholders will be asked to give a similar authority, details of which will be given in the Notice of Annual General Meeting.
As at 31 December 2020, 14,248,836 ordinary shares (nominal value £4,071,096) were held in treasury representing 5% of the issued share capital (excluding treasury shares) at that time. The number of shares held in treasury during the year ended 31 December 2020 was constant.
Substantial shareholdingsInformation provided to the Company pursuant to the Disclosure Guidance and Transparency Rules is published on a regulatory information service and on the Company’s website. As at 31 December 2020, the following voting interests in the ordinary share capital of the Company, disclosable under the Disclosure Guidance and Transparency Rules, had been notified to the Company:
Between 31 December 2020 and the date of this Annual Report, no changes in the voting interests have been notified to the Company in accordance with the Disclosure Guidance and Transparency Rules save for notifications received from Blackrock Inc., on 15 February 2021 that its interests totalled 5.03% and on 17 February 2021 that its interests totalled 5.06%.
Corporate governanceThe Corporate Governance Report on pages 66 to 113 is incorporated into this Directors’ Report by reference.
Employee mattersEvery effort is made to ensure that applications for employment from disabled employees are fully and fairly considered and that disabled employees have equal opportunity in training, succession planning and promotion. Further disclosures relating to employee diversity, employee engagement and related policies are set out on pages 37 to 38.
Details of employee share schemes are set out in Note 6 of the financial statements on pages 139 to 141.
Health, safety and the environmentIt is Group policy to improve continuously safe and healthy working conditions. It is Group policy to operate always in an environmentally responsible manner. More details on these policies and our relevant activities appear on pages 34 to 35 and are incorporated into this Director’s Report by reference.
Political donationsNo political donations were made during the year.
DirectorsThe membership of the Board and biographical details of the directors are given on pages 66 and 67 and are incorporated into this report by reference. In addition, Birgit Nørgaard was a director until 29 February 2020.
The rules for the appointment and replacement of directors are set out in the Company’s articles of association. Each new appointee to the Board is required to stand for election at the next Annual General Meeting following their appointment. In addition, the Company’s articles of association require each director to stand for re-election every year.
Qualifying indemnity provisions and liability insuranceThe Company maintains directors’ and officers’ liability insurance and all directors of the Company benefit from qualifying third party indemnity provisions which were in place during the financial year. At the date of this Annual Report there are such indemnity arrangements with each director in respect of the costs of defending civil, criminal and regulatory proceedings brought against them, as a director or employee, subject always to the limitations set by the Companies Act 2006.
The Group operates pension schemes in the UK which provide retirement and death benefits for employees and former employees of the Group. The corporate trustee of the pension schemes is IMI Pensions Trust Limited, a subsidiary of the Company. Qualifying pension scheme indemnity provisions, as defined in section 235 of the Companies Act 2006, were in force for the financial year ended 31 December 2020 and remain in force for the benefit of each of the directors of the corporate trustee of the pension schemes. These indemnity provisions cover, to the extent permitted by law, certain losses or liabilities incurred as a director or officer of the corporate trustee of the pension schemes.
The Group also has in place third party qualifying indemnity provisions, as defined in section 234 of the Companies Act 2006, in favour of certain employees who discharge responsibilities for various wholly-owned subsidiary companies and these indemnities are given on a similar basis to the above.
% Notified
Massachusetts Financial Services Company 9.89
Ameriprise Financial Inc 5.01
Standard Life Investments (Holdings) Limited 4.97
Legal & General Group plc 3.03
Introduction Strategic Report Corporate Governance Financial Statements
109

Role of the BoardThe role of the Board is:
» to promote the long-term success of the Company for the benefit of its members;
» to understand the views of key stakeholders and review engagement mechanisms;
» to set and monitor the Company’s values, purpose and strategy and ensure that these and its culture are aligned;
» to select and appoint the Executive Committee and ensure that the necessary resources are available to them;
» to ensure that the Company’s obligations to shareholders are understood and met;
» to demonstrate ethical leadership and high standards of behaviour and to oversee governance, risk and the control environment; and
» to ensure that the Board has the policies, processes, information, time and resources it needs to function effectively and efficiently.
The Board provides leadership, direction and governance for the Company and oversees business and management performance. The Board has adopted a corporate governance framework which defines Board roles and includes the list of matters reserved to it and written delegations of authority for its committees and the Executive Committee. Board reserved matters include strategy and key areas of policy, major operational and strategic risks, significant investment decisions and material changes in the organisation of the Group.
In the IMI Corporate Governance Framework, the Board has clearly defined in writing those matters which are reserved to it and the respective delegated authorities of its committees and it has also set written limits of authority for the Chief Executive. The Group has a clear organisational structure and well-established reporting and control disciplines. Managers of operating units assume responsibility for and exercise a high
degree of autonomy in running day-to-day trading activities. They do this within a framework of clear rules, policies and delegated authorities regarding business conduct, approval of proposals for investment and material changes in operations and are subject to regular senior management reviews of performance.
Division of responsibilities amongst directorsChairman:
» setting the Board agenda and shaping the culture in the boardroom;
» chairing meetings and encouraging the active engagement of all Board members;
» building a Board with a mix of people, skills, knowledge and experience and ensuring its effectiveness, including the quality of debate and decisions;
» developing a productive working relationship with the Chief Executive;
» seeking regular engagement with major shareholders; and
» getting the right executive leadership and succession plans in place.
There is a clear division of responsibility between the Chairman and Chief Executive, which is reflected in the IMI Corporate Governance Framework approved by the Board. In summary, the Chairman is responsible for the leadership and effectiveness of the Board but does not have any executive powers or responsibilities. The Chief Executive leads the Executive Committee in running the businesses and implementing operational and strategic plans under authority delegated by the Board.
The Chairman is responsible for ensuring that the Board meetings operate to an appropriate agenda, and that adequate information is provided sufficiently in advance of meetings to allow proper consideration. He is supported by the Company Secretary, who also assists in ensuring that the
IMI Critical Engineering IMI CCI, USA
Directors’ Report
110 IMI plc Annual Report & Accounts 2020

Board operates in accordance with good corporate governance under the Code and relevant regulatory requirements. The Company Secretary acts as secretary to all of the standing committees of the Board. The Board has a recognised procedure for any director to obtain independent professional advice at the Company’s expense and all directors have access to the Company Secretary who is a solicitor.
Chief Executive:
» leadership of the Executive Committee;
» developing business plans and strategy for consideration by the Board and implementing the same;
» communicating to the people within the Company the expectations of the Board in relation to the Company’s culture, values and behaviours, including ensuring the highest compliance and governance standards;
» building an effective operational management team and developing the organisation structure; and
» resourcing, talent development and succession plans.
Directors’ powersThe powers of the directors are determined by UK legislation and the articles of association of the Company in force from time to time. The directors were authorised to allot and issue ordinary shares and to make market purchases of the Company’s ordinary shares by resolutions of the Company passed at its Annual General Meeting held on 7 May 2020 by the passing of new resolutions. The current authorities will expire at the conclusion of the next Annual General Meeting to be held on 6 May 2021, at which new authorities will be sought.
Further details of authorities the Company is seeking for the allotment, issue and purchase of its ordinary shares will be set out in the separate Notice of Annual General Meeting.
Directors’ interestsThe interests of the persons (including the interests of any connected persons) who were directors at the end of the year, in the share capital of the Company, and their interests under share option and incentive schemes, are shown on page 104.
Management of conflicts of interestThe Company’s articles of association include certain provisions relevant to the activity of the Board and its committees and can be viewed on the Company’s website. These provisions include requirements for disclosure and approval by the Board of potential conflicts of interest. These procedures apply, inter alia, to external directorships and it is the Board’s view that they operated effectively during 2020.
Each director has a duty under the Companies Act 2006 to avoid a situation in which they have or may have a direct or indirect interest that conflicts or possibly may conflict with the interests of the Company. This duty is in addition to the duty that they owe to the Company to disclose to the Board any interest in any transaction or arrangement under consideration by the Company. If any director becomes aware
of any situation which may give rise to a conflict of interest, that director informs the rest of the Board and the Board is then permitted under the articles of association to decide to authorise such conflict. The information is recorded in the Company’s register of conflicts and a conflicts authorisation letter is issued to the relevant director.
Change of controlThe Company and its subsidiaries are party to a number of agreements that may allow the counterparties to alter or terminate the arrangements on a change of control of the Company following a takeover bid, such as commercial contracts and employee share plans. Other than as referred to in the next paragraph, none of these is considered by the Company to be significant in terms of its likely impact on the Group as a whole.
In the event of a change of control of the Company, the Group’s main funding agreements allow the lenders to renegotiate terms or give notice of repayment for all outstanding amounts under the relevant facilities.
The Company does not have agreements with any director or employee that would provide compensation for loss of office or employment specifically resulting from a takeover, although the provisions of the Company’s share schemes include a discretion to allow awards granted to directors and employees under such schemes to vest in those circumstances.
Information to be disclosed under Listing Rule 9.8.4R
Listing Rule statement Detail Note reference of financial statements/page number
9.8.4R (1-2)(6-14) Not applicable -
9.8.4R (4) Long-term incentive schemes
6 / page 139
9.8.4R (5) Directors’ waiver of emoluments
pages 95 and 103
Introduction Strategic Report Corporate Governance Financial Statements
111
Internal controlThe Board has responsibility for oversight of the Group’s system of internal control and confirms that the system of internal control takes into account the Code and relevant best practice guidance including the Financial Reporting Council’s September 2014 publication, ‘Guidance on Risk Management, Internal Control and Related Financial and Business Reporting’.
All operating units prepare forward plans and forecasts which are reviewed in detail by the Executive Committee and consolidated for review by the Board. Performance against forecast is continuously monitored at monthly meetings of the Executive Committee and, on a quarterly basis, by the Board. Minimum standards for accounting systems and controls, which are documented and monitored, are promulgated throughout the Group. Certified annual reports are required from senior executives of operating units, confirming compliance with Group financial reporting requirements. The internal audit function, Group Assurance, operates a rolling programme of internal assurance on site reviews at selected operating units. Additionally, visits to operations are carried out by senior Group finance personnel. These internal assurance processes are co-ordinated with the activity of the Company’s external auditor.
Capital investments are subject to a clear process for investment appraisal, authorisation and post-investment review, with major investment proposals referred for consideration by the Executive Committee and, according to their materiality, to the Board. In addition, the Executive Committee regularly reviews the operation of corporate policies and controls including those relating to ethics and compliance matters, treasury activities, environmental issues, health and safety, human resources and taxation. Compliance and internal audit reports summaries are made available to the Board, the Audit Committee and the Executive Committee, to enable control issues and developments to be monitored.
Control processes are dynamic and continuous improvements are made to adapt them to the changing risk profile of operations and to implement proportionate measures to address any identified weakness in the internal control system. More information in relation to risk is given on pages 58 to 63. The internal control declaration process is fully embedded and enables improvement in control. Action plans to improve controls as a result of these assessments are being tracked and reported to the Audit Committee.
Through the procedures outlined here, the Board has considered the effectiveness of all significant aspects of internal control for the year 2020 and up to the date of this Annual Report. The Board believes that the Group’s system of internal control, which is designed to manage rather than eliminate risk, provides reasonable but not absolute assurance against material misstatement or loss.
Financial reporting processesThe use of the Group’s accounting manual and prescribed reporting requirements for finance teams throughout the Group are important in ensuring that the Group’s accounting policies are clearly established and that information is appropriately reviewed and reconciled as part of the reporting process. The use of a standard reporting package by all entities in the Group ensures that information is presented in a consistent way that facilitates the production of the consolidated financial statements.
Compliance hotlineDuring 2020 the Board reviewed the operation of the independent compliance hotline for reporting concerns, reviewed the more significant reports received and considered how these are investigated and followed up. The Board believes that the hotline process and investigations are effective and that proportionate action is taken by management in response. Further information in relation to the hotline appears on page 41.
Statements on viability and going concernThe statements on viability and going concern on pages 64 and 65 are incorporated by reference in this Directors’ Report.
Non-financial information statementWe aim to comply with the Non-Financial Reporting requirements contained in sections 414CA and 414CB of the Companies Act 2006. The table set out on page 113, and the information it refers to, is intended to help stakeholders understand our position on key non-financial matters.
Directors’ Report
112 IMI plc Annual Report & Accounts 2020

Disclosure of information to the auditorEach director confirms that, so far as they are each aware, there is no relevant audit information of which the Company’s auditor is unaware and each director has taken all the steps that he or she ought to have taken as a director to make himself or herself aware of any relevant audit information and to establish that the Company’s auditor is aware of that information.
Annual General MeetingThe Annual General Meeting will be held on 6 May 2021. Notice of the Annual General Meeting will be published on the Company’s website.
By order of the Board
John O’Shea Company Secretary
25 February 2021
IMI is registered in England No. 714275
Reporting requirement Policies and standards which govern our approach Additional information
Environmental matters Environmental policy pages 30 to 32
Employees Code of Conduct page 40
Hotline for reporting concerns page 41
Health and Safety policy pages 34 to 35
Inclusion and Diversity pages 35 to 36 and 81
Human rights Modern Slavery Act page 41
Social matters IMI Way Day pages 37 and 38
Our purpose page 12
Contributing to communities page 38
Anti-corruption and anti-bribery Compliance policies including anti-bribery policy page 41
Description of principal risks - pages 58 to 63
Description of the business model - pages 12 and 13
Stakeholder engagement - pages 45 and 74 to 75
Outcome of non-financial policies and standards Carbon emissions reporting page 32
Employee engagement survey results page 37
Gender diversity reporting pages 35 and 70
Health and safety reporting pages 34 to 35 and 56
Due diligence processes implemented in pursuance of promoting non-financial policies and standards
Customer satisfaction surveys
Carbon emissions reporting and monitoring
Scrap and waste reduction measurement
Monitoring of expenses, hospitality and entertainment
Monitoring employee engagement surveys
All employees receive the Code of Conduct
Hotline reports reviewed by the Board
Health and safety reporting and monitoring
Modern slavery training and risk assessments
Compliance training
Compliance risk assessments and tailored programmes by division
Compliance implementation reviews and internal audits
Know your customer policy and due diligence reviews
Third party agent and distributors policy and due diligence reviews
Internal control declarations and compliance declarations
Introduction Strategic Report Corporate Governance Financial Statements
113

The directors are responsible for preparing the Annual Report, which includes the Directors’ Report, the Strategic Report, Remuneration Report and Corporate Governance Statement, and the Group and parent company financial statements in accordance with applicable law and regulations.
Company law requires the directors to prepare financial statements for each financial year. Under that law the directors are required to prepare the Group financial statements in accordance with those International Financial Reporting Standards as adopted pursuant to Regulation (EC) No. 1606/2002 as it applies in the European Union and the parent company financial statements in accordance with International Accounting Standards in conformity with the requirements of the Companies Act 2006 as applied in accordance with section 408 of the Companies Act 2006. Under company law the directors must not approve the financial statements unless they are satisfied that they present fairly the financial position, financial performance and cash flows for that period. In preparing those financial statements, the directors are required to:
» select suitable accounting policies and then apply them consistently;
» make judgements and estimates that are reasonable;
» present information, including accounting policies, in a manner that provides relevant, reliable, comparable and understandable information;
» state that the Group financial statements have complied with IFRSs adopted pursuant to Regulation (EC) No. 1606/2002 as it applies in the European Union, subject to any material departures disclosed and explained in the financial statements; and
» state for the parent company financial statements whether applicable International Accounting Standards in conformity with the requirements of the Companies Act 2006 as applied in accordance with section 408 of the Companies Act 2006.
The directors are responsible for keeping adequate accounting records that are sufficient to show and explain the Company’s transactions and disclose with reasonable accuracy at any time the financial position of the Group and the parent company and enable them to ensure that the Group and parent company financial statements comply with the Companies Act 2006 and International Financial Reporting Standards adopted pursuant to Regulation (EC) No. 1606/2002 as it applies to the European Union, as appropriate. They are also responsible for safeguarding the assets of the Group and the parent company and hence for taking reasonable steps for the prevention and detection of fraud and other irregularities.
The directors are responsible for the maintenance and integrity of the corporate and financial information included on the Company’s website. Legislation in the United Kingdom governing the preparation and dissemination of financial statements may differ from legislation in other jurisdictions.
Directors’ responsibility statement under the Disclosure and Transparency RulesEach of the directors, as at the date of this report, confirms that:
» the Group and parent company financial statements in this Annual Report, which have been prepared in accordance with applicable UK law and with the applicable set of accounting standards, give a true and fair view of the assets, liabilities, financial position and profit of the Group; and
» the Annual Report (which includes the Directors’ Report and the Strategic Report) includes a fair review of the development and performance of the business and the position of the Company and the Group taken as a whole, together with a description of the principal risks and uncertainties that they face.
The directors are responsible for preparing the Annual Report in accordance with applicable laws and regulations. Having taken advice from the Audit Committee, the Board considers the report and accounts, taken as a whole, are fair, balanced and understandable and provide the information necessary for shareholders to assess the Group’s performance, business model and strategy.
By order of the Board
John O’Shea Company Secretary
25 February 2021
Statement of directors’ responsibilitiesStatement of directors’ responsibilities in respect of the Annual Report and the financial statements.
114 IMI plc Annual Report & Accounts 2020

Financial Statements contents
Introduction Corporate Governance Financial StatementsStrategic Report
116 Independent Auditor’s Report to the Members of IMI plc
124 Consolidated income statement
125 Consolidated statement of comprehensive income
125 Consolidated statement of changes in equity
126 Consolidated balance sheet
127 Consolidated statement of cash flows
128 1. Basis of preparation
129 2. Significant accounting policies
132 3. Alternative Performance Measures (‘APMs’) & adjusting items
134 4. Segmental information
138 5. Operating costs
139 6. Share-based payments
142 7. Earnings per ordinary share
143 8. Net financing costs
144 9. Taxation
148 10. Dividends
149 11. Intangible assets
152 12. Property, plant and equipment
153 13. Leases
156 14. Retirement benefits
163 15. Inventories
164 16. Trade and other receivables
166 17. Financial assets and liabilities
168 18. Financial risk management
172 19. Net debt
175 20. Provisions
176 21. Trade and other payables
177 22. Share capital
178 23. Acquisitions
178 24. Disposals
178 25. Contingent liabilities
178 26. Related party transactions
179 27. Subsequent events
179 28. Discontinued operations
180 Company balance sheet
181 Company statement of changes in equity
182 Company notes to the financial statements
185 Subsidiary undertakings
189 Geographic distribution of employees
190 Five year summary
192 Shareholder and general information
115

Independent Auditor’s Report to the Members of IMI plc
OpinionIn our opinion:• IMI plc’s Group financial statements and parent company financial statements
(the “financial statements”) give a true and fair view of the state of the Group’s and of the parent company’s affairs as at 31 December 2020 and of the Group’s profit for the year then ended;
• the Group financial statements have been properly prepared in accordance with International Accounting Standards in conformity with the requirements of the Companies Act 2006 and International Financial Reporting Standards adopted pursuant to Regulation (EC) No. 1606/2002 as it applies in the European Union;
• the parent company financial statements have been properly prepared in accordance with International Accounting Standards in conformity with the requirements of the Companies Act 2006 as applied in accordance with section 408 of the Companies Act 2006; and
• the financial statements have been prepared in accordance with the requirements of the Companies Act 2006.
We have audited the financial statements of IMI plc (the ‘parent company’) and its subsidiaries (the ‘Group’) for the year ended 31 December 2020 which comprise:
Group Parent company
Consolidated balance sheet as at 31 December 2020 Balance sheet as at 31 December 2020 Consolidated income statement for the year then ended Statement of changes in equity for the year then ended Consolidated statement of comprehensive income for the year then ended Related notes C1 to C10 to the financial statements including a summary of significant accounting policies Consolidated statement of changes in equity for the year then ended Consolidated statement of cash flows for the year then ended Related notes 1 to 28 to the financial statements, including a summary of significant accounting policies
The financial reporting framework that has been applied in the preparation of the Group financial statements is applicable law and International Accounting Standards in conformity with the requirements of the Companies Act 2006 and International Financial Reporting Standards adopted pursuant to Regulation (EC) No. 1606/2002 as it applies in the European Union. The financial reporting framework that has been applied in the preparation of the parent company financial statements is applicable law and United Kingdom Accounting Standards, including FRS 101 “Reduced Disclosure Framework” (United Kingdom Generally Accepted Accounting Practice).
Basis for opinionWe conducted our audit in accordance with International Standards on Auditing (UK) (ISAs (UK)) and applicable law. Our responsibilities under those standards are further described in the Auditor’s responsibilities for the audit of the financial statements section of our report. We are independent of the Group in accordance with the ethical requirements that are relevant to our audit of the financial statements in the UK, including the FRC’s Ethical Standard as applied to listed public interest entities, and we have fulfilled our other ethical responsibilities in accordance with these requirements.
We believe that the audit evidence we have obtained is sufficient and appropriate to provide a basis for our opinion.
Conclusions relating to going concernIn auditing the financial statements, we have concluded that the directors’ use of the going concern basis of accounting in the preparation of the financial statements is appropriate. Our evaluation of the directors’ assessment of the Group and parent company’s ability to continue to adopt the going concern basis of accounting included the following procedures:
• Understanding and walking through management’s process for and controls related to assessing going concern including discussion with management to ensure all key factors were taken into account;
• Obtaining management’s going concern model, which is for a period of twelve months from the date of this report, and which includes details of facilities available, covenant calculations, and the results of management’s scenario planning, and testing its efficacy including clerical accuracy;
• Confirming to the debt agreements both the maturity profile of the debt and the covenants that are required to be met within the going concern period;
• Assessing the forecasts underpinning the going concern model which are based on the Board-approved budget for FY 2021 and the Board-approved strategic plan;
• Understanding how these forecasts have been revised to reflect the impact of COVID-19, although the impact to trading for the majority of the business has been limited;
• Comparing these forecasts to external economic forecasts for the key geographies in which IMI operates, as well as analysing the historical accuracy of budgets to actual results to determine whether forecast cash flows are reliable based on past experience, focusing on EBITDA (as the measure that directly impacts the key covenant calculation);
• Comparing management’s forecasts to actual results through the subsequent events period and performing inquiries to the date of this report;
• Considering other external factors including reliance on suppliers, recoverability of debtors, employees’ ability to continue to work safely, and the threat of potential litigations and claims;
• Considering the downside scenarios identified by management in their viability analysis on page 64, assessing whether there are any other scenarios which should be considered, and assessing whether the quantum of the impact of the downside scenario in the going concern period is supportable;
• Performing reverse stress testing on the going concern model by understanding what reduction in EBITDA would be required before covenants are breached and comparing this to the downside scenarios contemplated by management including considering the likelihood of the events required to breach the covenants, given covenants would be breached prior to liquidity being exhausted;
• Evaluating the Group’s ability to undertake mitigating actions should it experience a severe downside scenario, considering likely achievability of both timing and quantum; and
• Assessing the going concern disclosures in the financial statements to ensure they are in accordance with International Financial Reporting Standards.
116 IMI plc Annual Report & Accounts 2020

Based on the work we have performed, we have not identified any material uncertainties relating to events or conditions that, individually or collectively, may cast significant doubt on the Group and parent company’s ability to continue as a going concern for a period of at least twelve months from when the financial statements are authorised for issue.
In relation to the Group and parent company’s reporting on how they have applied the UK Corporate Governance Code, we have nothing material to add or draw attention to in relation to the directors’ statement in the financial statements about whether the directors considered it appropriate to adopt the going concern basis of accounting.
Our responsibilities and the responsibilities of the directors with respect to going concern are described in the relevant sections of this report. However, because not all future events or conditions can be predicted, this statement is not a guarantee as to the Group’s ability to continue as a going concern.
Overview of our audit approach
Audit scope - We performed an audit of the complete financial information of 14 components (including the parent company) and audit procedures on specific balances for a further 21 components (including three corporate entities).
- The components where we performed full or specific audit procedures accounted for 86% of Adjusted profit before tax, 78% of Revenue (including procedures on marketing companies) and 81% of Total assets.
Key audit matters - Revenue recognition – cut off in Critical Engineering and risk of management override of controls at all components - Inventory valuation - Carrying value of goodwill and acquired intangible assetsMateriality - Overall Group materiality of £13.1 million which represents approximately 5% of Adjusted profit before tax.
An overview of the scope of the parent company and Group audits
Tailoring the scopeOur assessment of audit risk, our evaluation of materiality and our allocation of performance materiality determine our audit scope for each company within the Group. Taken together, this enables us to form an opinion on the consolidated financial statements. We take into account the contribution to Group revenue and pre-tax income, risk profile (including country risk, risk determined to be associated based on the grading of internal audit findings, controls findings, historical knowledge and risk arising from change in the period including changes to IT systems and key management personnel), the number of significant accounts based on performance materiality and any other known factors such as instances of whistleblowing reports, impact on the Group in terms of financial size, and external sales forecasting accuracy when assessing the level of work to be performed at each entity.
In assessing the risk of material misstatement to the Group financial statements, and to ensure we had adequate quantitative coverage of significant accounts in the financial statements, of the 151 reporting components of the Group, we selected 35 components covering entities within Austria, China, Czech Republic, Germany, India, Italy, Japan, Poland, Singapore, South Korea, Sweden, Switzerland, UK and USA, which represent the principal business units within the Group.
Of the 35 components selected, we performed an audit of the complete financial information of 14 components (“full scope components”) which were selected based on their size or risk characteristics. For the remaining 21 components (“specific scope components”), we performed audit procedures on specific accounts within that component that we considered had the potential for
the greatest impact on the significant accounts in the financial statements either because of the size of these accounts or their risk profile.
The reporting components where we performed audit procedures accounted for 86% (2019: 83%) of the Group’s Adjusted profit before tax measure used to calculate materiality, 61% (2019: 63%) of the Group’s Revenue and 81% (2019: 84%) of the Group’s Total assets.
For the current year, the full scope components contributed 36% (2019: 45%) of the Group’s Adjusted profit before tax, 40% (2019: 45%) of the Group’s Revenue and 60% (2019: 66%) of the Group’s Total assets. The specific scope component contributed 50% (2019: 38%) of the Group’s Adjusted profit before tax, 21% (2019: 18%) of the Group’s Revenue and 21% (2019: 18%) of the Group’s Total assets. The audit scope of these components may not have included testing of all significant accounts of the component but will have contributed to the coverage of Adjusted profit before tax tested for the Group, the measure used to assess audit materiality.
Of the remaining 116 components that together represent 14% of the Group’s Adjusted profit before tax, none are individually greater than 4% of the Group’s Adjusted profit before tax. For these components, we performed other procedures, including analytical review, testing of consolidation journals, revenue cut-off, intercompany eliminations, foreign currency translation recalculations, and enquiring of management to respond to any potential risks of material misstatement to the Group financial statements.
117
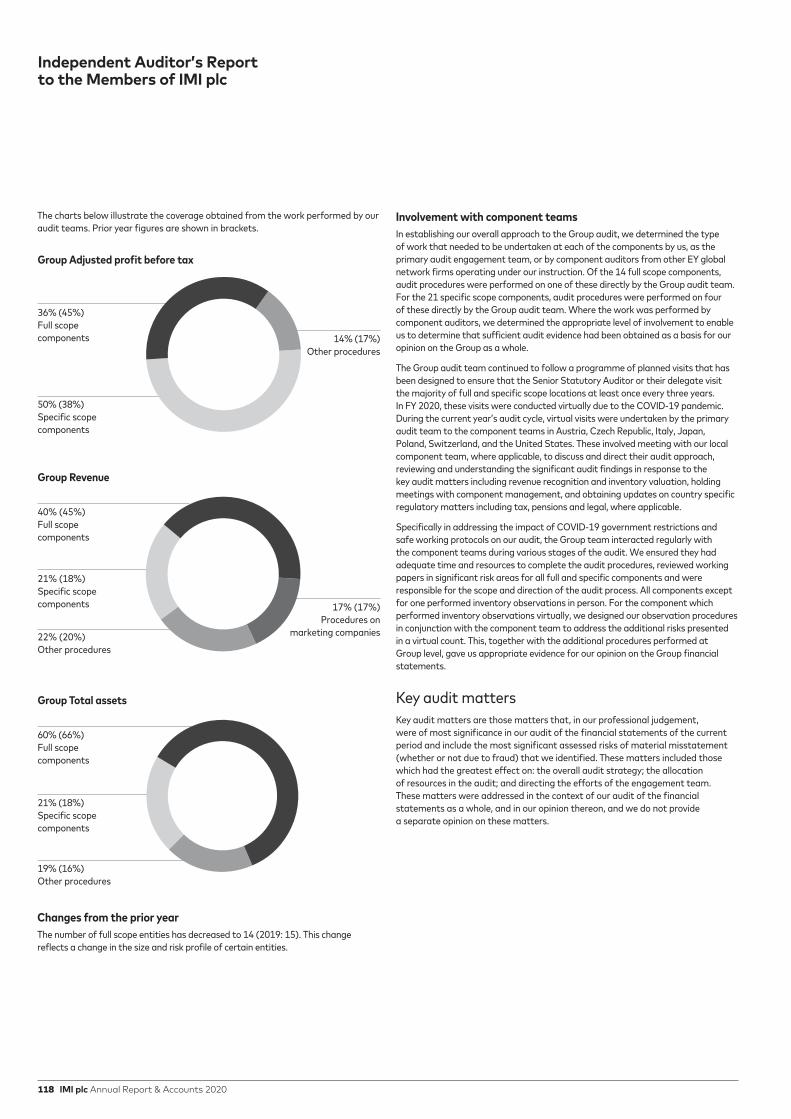
Independent Auditor’s Report to the Members of IMI plc
14% (17%)Other procedures
Changes from the prior year The number of full scope entities has decreased to 14 (2019: 15). This change reflects a change in the size and risk profile of certain entities.
Group Adjusted profit before tax
50% (38%) Specific scope components
36% (45%) Full scope components
Group Total assets
21% (18%) Specific scope components
19% (16%)Other procedures
60% (66%) Full scope components
Group Revenue
21% (18%)Specific scope components
22% (20%)Other procedures
17% (17%)Procedures on
marketing companies
40% (45%)Full scope components
The charts below illustrate the coverage obtained from the work performed by our audit teams. Prior year figures are shown in brackets.
Involvement with component teams In establishing our overall approach to the Group audit, we determined the type of work that needed to be undertaken at each of the components by us, as the primary audit engagement team, or by component auditors from other EY global network firms operating under our instruction. Of the 14 full scope components, audit procedures were performed on one of these directly by the Group audit team. For the 21 specific scope components, audit procedures were performed on four of these directly by the Group audit team. Where the work was performed by component auditors, we determined the appropriate level of involvement to enable us to determine that sufficient audit evidence had been obtained as a basis for our opinion on the Group as a whole.
The Group audit team continued to follow a programme of planned visits that has been designed to ensure that the Senior Statutory Auditor or their delegate visit the majority of full and specific scope locations at least once every three years. In FY 2020, these visits were conducted virtually due to the COVID-19 pandemic. During the current year’s audit cycle, virtual visits were undertaken by the primary audit team to the component teams in Austria, Czech Republic, Italy, Japan, Poland, Switzerland, and the United States. These involved meeting with our local component team, where applicable, to discuss and direct their audit approach, reviewing and understanding the significant audit findings in response to the key audit matters including revenue recognition and inventory valuation, holding meetings with component management, and obtaining updates on country specific regulatory matters including tax, pensions and legal, where applicable.
Specifically in addressing the impact of COVID-19 government restrictions and safe working protocols on our audit, the Group team interacted regularly with the component teams during various stages of the audit. We ensured they had adequate time and resources to complete the audit procedures, reviewed working papers in significant risk areas for all full and specific components and were responsible for the scope and direction of the audit process. All components except for one performed inventory observations in person. For the component which performed inventory observations virtually, we designed our observation procedures in conjunction with the component team to address the additional risks presented in a virtual count. This, together with the additional procedures performed at Group level, gave us appropriate evidence for our opinion on the Group financial statements.
Key audit matters Key audit matters are those matters that, in our professional judgement, were of most significance in our audit of the financial statements of the current period and include the most significant assessed risks of material misstatement (whether or not due to fraud) that we identified. These matters included those which had the greatest effect on: the overall audit strategy; the allocation of resources in the audit; and directing the efforts of the engagement team. These matters were addressed in the context of our audit of the financial statements as a whole, and in our opinion thereon, and we do not provide a separate opinion on these matters.
118 IMI plc Annual Report & Accounts 2020

Risk Our response to the risk
Revenue recognition (£1,825m, PY comparative £1,873m)
Refer to the Audit Committee Report (page 76); Accounting policies (page 129); and Note 4 of the Consolidated Financial Statements (page 134).
There is a risk in the Critical Engineering division of inappropriate revenue recognition if deliveries are recorded within the wrong accounting period. The cyclical nature and value of deliveries results in significant shipments near the December period end and an associated cut off risk.
There is a risk in all three divisions and during consolidation of inappropriate revenue being recognised if there is management override of controls through manual topside journal entries.
Cut-off We performed the following audit procedures at 8 full and 7 specific scope Critical Engineering locations where revenue is in scope. Revenue at these locations represents 79% of the total Critical Engineering revenue balance of £643m.
We performed walkthroughs of revenue at the 8 full and 7 specific scope locations and assessed the design effectiveness of key controls.
We performed cut-off testing by tracing a sample of transactions around the period end to third party delivery note documentation and customer acceptance.
We performed tests of detail for a sample of revenue transactions to confirm the transactions had been appropriately recorded in the income statement with reference to IFRS 15 and corroborated that control of the products had been transferred to the customer by: • analysing the contract and terms of the sale to determine that the Group had fulfilled the requirements of
the contract; • confirming revenue could be reliably measured by reference to underlying documentation; and• confirming collectability of the revenue was reasonably assured by agreeing to collections or collection history
if unpaid.
Cut off at components not in full or specific scopeFor the 12 Critical Engineering components considered as not significant to the Group we analysed December revenues in comparison to the other months of the year and the prior year. For a sample of entities, we performed specified procedures for a sample of transactions within these entities to test cut-off, by tracing a sample of transactions around the period end to third party delivery note documentation and customer acceptance.
We reviewed all significant bill and hold contracts held by components of the Group and evaluated whether the revenue was recognised in the appropriate period by inspecting contract terms and customer correspondence. For these contracts we tested whether the control transferred, to include obtaining the customer request for the Group to hold the products on their behalf.
Management override of controls At 14 full and 21 specific scope locations and at the consolidated Group level we obtained support for all material unusual manual journals to revenue. Revenue at the full and specific locations represents 61% of the total revenue balance.
For the components we considered as not significant to the Group we analysed the monthly revenues and gross margin recorded and obtained explanations for movements that we considered unusual, considering both any corroborative and/or contradictory evidence.
Key observations communicated to the Audit Committee:
Our audit procedures did not identify evidence of material misstatements in revenue recognition arising from the risk of cut-off in the Critical Engineering division or management override of controls through manual topside journal entries in any of the three divisions or at the consolidated Group level.
119

Independent Auditor’s Report to the Members of IMI plc
Risk Our response to the risk
Inventory valuation (£293m, PY comparative £281m)Refer to the Audit Committee Report (page 76); Accounting policies (page 129); and Note 15 of the Consolidated Financial Statements (page 163).
The valuation of inventory across the Group is dependent on establishing appropriate valuation processes. This includes the appropriate design of controls. Management performs formulaic calculations for standard costing and excess and obsolete inventory provisions and then applies judgement to adjust these calculations. If these judgements are not appropriate, then this increases the risk that inventory is incorrectly valued.
We performed the following audit procedures at 13 full and 14 specific scope locations where inventory is in scope. Inventory at these locations represents 75% of the total inventory balance.
We performed walkthroughs of inventory at 13 full and 14 specific scope locations and assessed the design effectiveness of key controls.
We performed tests of detail for a sample of inventory items to check the accumulation of cost within inventory and to confirm the valuation reflected the products’ stage of completion.
We obtained evidence to support the standard costs used and performed procedures to assess whether only normal production variances had been capitalised in the year end inventory balance and material abnormal inefficiencies had been appropriately expensed. This included comparing actual production rates to budget. We reperformed management’s calculations to check they were accurate.
We obtained evidence to support inventory is held at the lower of cost and net realisable value by auditing the adequacy of excess and obsolete provisions held against inventory. This included testing that management’s calculation process is applied consistently across components.
We tested the provision calculation by comparing forecast product usage to customer orders, testing the integrity of the historical usage data, considering historical accuracy of provisioning and understanding management’s future plans to utilise the inventory.
We performed clerical procedures on the formulaic calculations to evaluate the accuracy of the inventory provisioning. We performed procedures to consider the appropriateness of any management adjustments to the formulaic calculation including corroborating the amounts to specific usage plans from engineering.
For the components we considered as not significant to the Group we:• investigated any significant standard to actual cost variances posted to the income statement or recorded
within inventory and obtained supporting evidence for the adjustments; and• analysed the management judgement applied to the excess and obsolete provision and obtained supporting
evidence where this was significant.
Key observations communicated to the Audit Committee:
Inventory valuation across the Group is considered appropriate including the adequacy of the excess and obsolete provision. Our audit procedures confirmed variances between standard and actual costs and the overheads absorbed in the inventory valuation had been appropriately calculated and accounted for.
120 IMI plc Annual Report & Accounts 2020
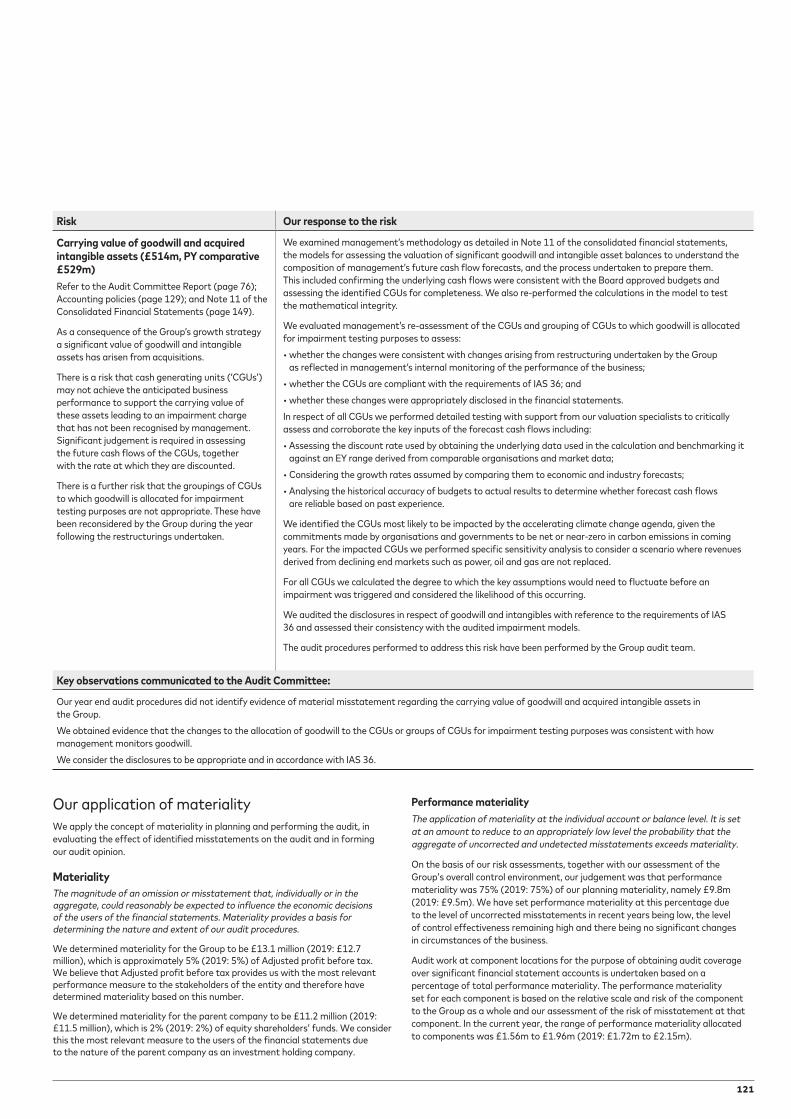
Risk Our response to the risk
Carrying value of goodwill and acquired intangible assets (£514m, PY comparative £529m)Refer to the Audit Committee Report (page 76); Accounting policies (page 129); and Note 11 of the Consolidated Financial Statements (page 149).
As a consequence of the Group’s growth strategy a significant value of goodwill and intangible assets has arisen from acquisitions.
There is a risk that cash generating units (‘CGUs’) may not achieve the anticipated business performance to support the carrying value of these assets leading to an impairment charge that has not been recognised by management. Significant judgement is required in assessing the future cash flows of the CGUs, together with the rate at which they are discounted.
There is a further risk that the groupings of CGUs to which goodwill is allocated for impairment testing purposes are not appropriate. These have been reconsidered by the Group during the year following the restructurings undertaken.
We examined management’s methodology as detailed in Note 11 of the consolidated financial statements, the models for assessing the valuation of significant goodwill and intangible asset balances to understand the composition of management’s future cash flow forecasts, and the process undertaken to prepare them. This included confirming the underlying cash flows were consistent with the Board approved budgets and assessing the identified CGUs for completeness. We also re-performed the calculations in the model to test the mathematical integrity.
We evaluated management’s re-assessment of the CGUs and grouping of CGUs to which goodwill is allocated for impairment testing purposes to assess: • whether the changes were consistent with changes arising from restructuring undertaken by the Group
as reflected in management’s internal monitoring of the performance of the business; • whether the CGUs are compliant with the requirements of IAS 36; and • whether these changes were appropriately disclosed in the financial statements.In respect of all CGUs we performed detailed testing with support from our valuation specialists to critically assess and corroborate the key inputs of the forecast cash flows including:• Assessing the discount rate used by obtaining the underlying data used in the calculation and benchmarking it
against an EY range derived from comparable organisations and market data;• Considering the growth rates assumed by comparing them to economic and industry forecasts; • Analysing the historical accuracy of budgets to actual results to determine whether forecast cash flows
are reliable based on past experience.
We identified the CGUs most likely to be impacted by the accelerating climate change agenda, given the commitments made by organisations and governments to be net or near-zero in carbon emissions in coming years. For the impacted CGUs we performed specific sensitivity analysis to consider a scenario where revenues derived from declining end markets such as power, oil and gas are not replaced.
For all CGUs we calculated the degree to which the key assumptions would need to fluctuate before an impairment was triggered and considered the likelihood of this occurring.
We audited the disclosures in respect of goodwill and intangibles with reference to the requirements of IAS 36 and assessed their consistency with the audited impairment models.
The audit procedures performed to address this risk have been performed by the Group audit team.
Key observations communicated to the Audit Committee:
Our year end audit procedures did not identify evidence of material misstatement regarding the carrying value of goodwill and acquired intangible assets in the Group. We obtained evidence that the changes to the allocation of goodwill to the CGUs or groups of CGUs for impairment testing purposes was consistent with how management monitors goodwill. We consider the disclosures to be appropriate and in accordance with IAS 36.
Our application of materiality We apply the concept of materiality in planning and performing the audit, in evaluating the effect of identified misstatements on the audit and in forming our audit opinion.
MaterialityThe magnitude of an omission or misstatement that, individually or in the aggregate, could reasonably be expected to influence the economic decisions of the users of the financial statements. Materiality provides a basis for determining the nature and extent of our audit procedures.
We determined materiality for the Group to be £13.1 million (2019: £12.7 million), which is approximately 5% (2019: 5%) of Adjusted profit before tax. We believe that Adjusted profit before tax provides us with the most relevant performance measure to the stakeholders of the entity and therefore have determined materiality based on this number.
We determined materiality for the parent company to be £11.2 million (2019: £11.5 million), which is 2% (2019: 2%) of equity shareholders’ funds. We consider this the most relevant measure to the users of the financial statements due to the nature of the parent company as an investment holding company.
Performance materialityThe application of materiality at the individual account or balance level. It is set at an amount to reduce to an appropriately low level the probability that the aggregate of uncorrected and undetected misstatements exceeds materiality.
On the basis of our risk assessments, together with our assessment of the Group’s overall control environment, our judgement was that performance materiality was 75% (2019: 75%) of our planning materiality, namely £9.8m (2019: £9.5m). We have set performance materiality at this percentage due to the level of uncorrected misstatements in recent years being low, the level of control effectiveness remaining high and there being no significant changes in circumstances of the business.
Audit work at component locations for the purpose of obtaining audit coverage over significant financial statement accounts is undertaken based on a percentage of total performance materiality. The performance materiality set for each component is based on the relative scale and risk of the component to the Group as a whole and our assessment of the risk of misstatement at that component. In the current year, the range of performance materiality allocated to components was £1.56m to £1.96m (2019: £1.72m to £2.15m).
121

Independent Auditor’s Report to the Members of IMI plc
Reporting thresholdAn amount below which identified misstatements are considered as being clearly trivial.
We agreed with the Audit Committee that we would report to them all uncorrected audit differences in excess of £0.5m (2019: £0.5m), which is set at approximately 5% of materiality, as well as differences below that threshold that, in our view, warranted reporting on qualitative grounds.
We evaluate any uncorrected misstatements against both the quantitative measures of materiality discussed above and in light of other relevant qualitative considerations in forming our opinion.
Other informationThe other information comprises the information included in the annual report set out on pages 1 to 115, including the Strategic report, the Corporate governance report, the Audit committee report, the Nominations committee report, the Annual directors' remuneration report, the Directors' report, and the Statement of directors' responsibilities, other than the financial statements and our auditor’s report thereon. The directors are responsible for the other information contained within the annual report.
Our opinion on the financial statements does not cover the other information and, except to the extent otherwise explicitly stated in this report, we do not express any form of assurance conclusion thereon.
Our responsibility is to read the other information and, in doing so, consider whether the other information is materially inconsistent with the financial statements or our knowledge obtained in the course of the audit, or otherwise appears to be materially misstated. If we identify such material inconsistencies or apparent material misstatements, we are required to determine whether there is a material misstatement in the financial statements themselves. If, based on the work we have performed, we conclude that there is a material misstatement of the other information, we are required to report that fact.
We have nothing to report in this regard.
Opinions on other matters prescribed by the Companies Act 2006In our opinion, the part of the directors’ remuneration report to be audited has been properly prepared in accordance with the Companies Act 2006.
In our opinion, based on the work undertaken in the course of the audit:• the information given in the strategic report and the directors’ report for the
financial year for which the financial statements are prepared is consistent with the financial statements; and
• the strategic report and the directors’ report have been prepared in accordance with applicable legal requirements.
Matters on which we are required to report by exceptionIn the light of the knowledge and understanding of the Group and the parent company and its environment obtained in the course of the audit, we have not identified material misstatements in the strategic report or the directors’ report.
We have nothing to report in respect of the following matters in relation to which the Companies Act 2006 requires us to report to you if, in our opinion:• adequate accounting records have not been kept by the parent company,
or returns adequate for our audit have not been received from branches not visited by us; or
• the parent company financial statements and the part of the Directors’ Remuneration Report to be audited are not in agreement with the accounting records and returns; or
• certain disclosures of directors’ remuneration specified by law are not made; or• we have not received all the information and explanations we require for our audit.
Corporate Governance StatementThe Listing Rules require us to review the directors’ statement in relation to going concern, longer-term viability and that part of the Corporate Governance Statement relating to the Group and company’s compliance with the provisions of the UK Corporate Governance Code specified for our review.
Based on the work undertaken as part of our audit, we have concluded that each of the following elements of the Corporate Governance Statement is materially consistent with the financial statements or our knowledge obtained during the audit:• Directors’ statement with regards to the appropriateness of adopting the going
concern basis of accounting and any material uncertainties identified set out on page 65;
• Directors’ explanation as to its assessment of the company’s prospects, the period this assessment covers and why the period is appropriate set out on page 64;
• Directors’ statement on fair, balanced and understandable set out on page 114;• Board’s confirmation that it has carried out a robust assessment of the
emerging and principal risks set out on page 58;• The section of the annual report that describes the review of effectiveness of
risk management and internal control systems set out on page 112; and;• The section describing the work of the audit committee set out on page 76.
Responsibilities of directorsAs explained more fully in the directors’ responsibilities statement set out on page 114, the directors are responsible for the preparation of the financial statements and for being satisfied that they give a true and fair view, and for such internal control as the directors determine is necessary to enable the preparation of financial statements that are free from material misstatement, whether due to fraud or error.
In preparing the financial statements, the directors are responsible for assessing the Group and parent company’s ability to continue as a going concern, disclosing, as applicable, matters related to going concern and using the going concern basis of accounting unless the directors either intend to liquidate the Group or the parent company or to cease operations, or have no realistic alternative but to do so.
Auditor’s responsibilities for the audit of the financial statements Our objectives are to obtain reasonable assurance about whether the financial statements as a whole are free from material misstatement, whether due to fraud or error, and to issue an auditor’s report that includes our opinion. Reasonable assurance is a high level of assurance, but is not a guarantee that an audit conducted in accordance with ISAs (UK) will always detect a material misstatement when it exists. Misstatements can arise from fraud or error and are considered material if, individually or in the aggregate, they could reasonably be expected to influence the economic decisions of users taken on the basis of these financial statements.
122 IMI plc Annual Report & Accounts 2020

Explanation as to what extent the audit was considered capable of detecting irregularities, including fraud Irregularities, including fraud, are instances of non-compliance with laws and regulations. We design procedures in line with our responsibilities, outlined below, to detect irregularities, including fraud. The risk of not detecting a material misstatement due to fraud is higher than the risk of not detecting one resulting from error, as fraud may involve deliberate concealment by, for example, forgery or intentional misrepresentations, or through collusion. The extent to which our procedures are capable of detecting irregularities, including fraud is detailed below.
However, the primary responsibility for the prevention and detection of fraud rests with both those charged with governance of the company and management.
Our approach was as follows: • We obtained an understanding of the legal and regulatory frameworks that
are applicable to the Group and determined that the most significant are frameworks which are directly relevant to specific assertions in the financial statements are those that relate to the reporting framework (IFRS, FRS 101, the Companies Act 2006 and UK Corporate Governance Code). In addition, we concluded that there are certain significant laws and regulations which may have an effect on the determination of the amounts and disclosures in the financial statements being the Listing Rules of the UK Listing Authority, and those laws and regulations relating to health and safety and employee matters.
• We understood how the Group is complying with those frameworks by making enquiries of management, internal audit, those responsible for legal and compliance procedures and the company secretary. We corroborated our enquiries through our review of Board minutes, papers provided to the Audit Committee and correspondence received from regulatory bodies.
• We assessed the susceptibility of the Group’s financial statements to material misstatement, including how fraud might occur by meeting with management from various parts of the business to understand where it considered there was susceptibility to fraud. We also considered performance targets and their influence on efforts that might be made by management to manage earnings or influence the perceptions of analysts. We considered the programmes and controls that the Group has established to address risks identified, or that otherwise prevent, deter and detect fraud; and how senior management monitors those programmes and controls. Where the risk was considered to be higher, we performed audit procedures to address each identified fraud risk. These procedures included testing material manual journals that had unusual characteristics and were designed to provide reasonable assurance that the financial statements were free from material misstatements arising from fraud.
• Based on this understanding we designed our audit procedures to identify non-compliance with such laws and regulations. Our procedures involved understanding management’s internal controls over compliance with laws and regulations; enquiring of legal counsel, Group management, internal audit, divisional management and full and specific scope management; reviewing internal audit reports and whistleblowing logs; and performing focused testing, as referred to in the key audit matters section above. At full and specific components in countries where the risk of increased bribery or corruption is assessed as higher, we supplemented our underlying audit procedures with additional inquiries of local management.
• The Group team communicated with component teams about any instances of non-compliance with laws and regulations through regular interactions with local EY teams. We instructed our component teams to perform procedures in accordance with those we described in the previous bullet as a part of our Group audit instructions. Component teams did not identify any instances of non-compliance with laws and regulations. There were no identified significant instances of non-compliance with laws and regulations at the Group level.
A further description of our responsibilities for the audit of the financial statements is located on the Financial Reporting Council’s website at https://www.frc.org.uk/auditorsresponsibilities. This description forms part of our auditor’s report.
Other matters we are required to address • Following the recommendation from the Audit Committee, we were appointed
by the company at the AGM on 7 May 2020 to audit the financial statements for the year ending 31 December 2020. We were appointed as auditors by the shareholders and signed an engagement letter on 23 June 2020 and further addendum on 3 February 2021.
The period of total uninterrupted engagement including previous renewals and reappointments is 12 years, covering the years ending 31 December 2009 to 31 December 2020.
• The non-audit services prohibited by the FRC’s Ethical Standard were not provided to the Group or the parent company and we remain independent of the Group and the parent company in conducting the audit.
• The audit opinion is consistent with the additional report to the Audit Committee
Use of our reportThis report is made solely to the company’s members, as a body, in accordance with Chapter 3 of Part 16 of the Companies Act 2006. Our audit work has been undertaken so that we might state to the company’s members those matters we are required to state to them in an auditor’s report and for no other purpose. To the fullest extent permitted by law, we do not accept or assume responsibility to anyone other than the company and the company’s members as a body, for our audit work, for this report, or for the opinions we have formed.
For and on behalf of Ernst & Young LLP, Statutory Auditor Birmingham 25 February 2021
Simon O’NeillSenior statutory auditor
123

2020 2019
Adjusting Adjusting Adjusted items Statutory Adjusted items Statutory (Note 3) (Note 3) Notes £m £m £m £m £m £m
Revenue 4 1,825 1,825 1,873 1,873Cost of sales (1,008.8) (1,008.8) (1,058.6) (1.1) (1,059.7)
Gross profit 816.2 - 816.2 814.4 (1.1) 813.3Operating costs 5 (531.5) (57.9) (589.4) (548.3) (60.7) (609.0)
Operating profit 284.7 (57.9) 226.8 266.1 (61.8) 204.3Financial income 8 3.8 14.1 17.9 4.5 13.4 17.9Financial expense 8 (14.8) (15.8) (30.6) (19.4) (13.0) (32.4)Net financial income/(expense) relating to defined benefit pension schemes 14 0.2 0.2 (0.5) (0.5)Net financial (expense)/income (10.8) (1.7) (12.5) (15.4) 0.4 (15.0)
Profit before tax 273.9 (59.6) 214.3 250.7 (61.4) 189.3Taxation 9 (57.5) 13.4 (44.1) (52.6) 16.6 (36.0)
Profit of continuing operations after tax 216.4 (46.2) 170.2 198.1 (44.8) 153.3Profit from discontinued operations after tax 28 - - 2.8 2.8
Total profit for the year 216.4 (46.2) 170.2 198.1 (42.0) 156.1
Earnings per share 7 Basic – from profit for the year 62.7p 57.6p Diluted – from profit for the year 62.6p 57.6p Basic – from continuing operations 62.7p 56.6p Diluted – from continuing operations 62.6p 56.5p
Consolidated income statementFor the year ended 31 December 2020
124 IMI plc Annual Report & Accounts 2020
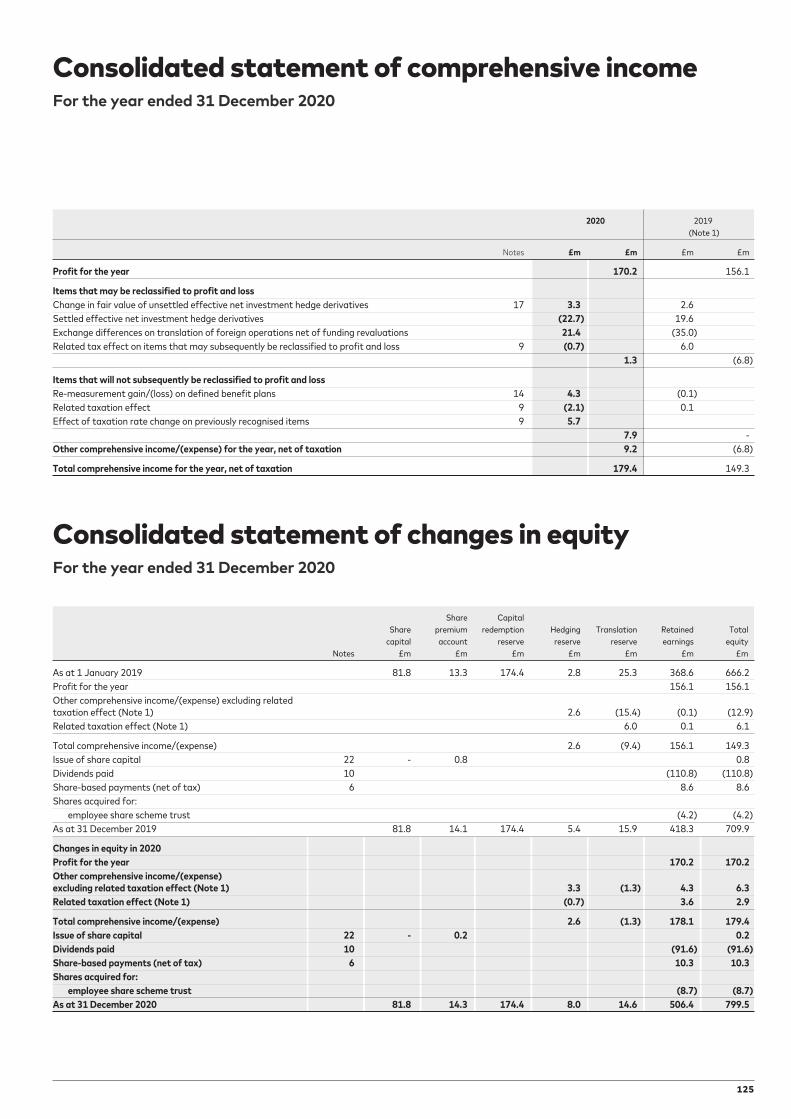
2020 2019 (Note 1)
Notes £m £m £m £m
Profit for the year 170.2 156.1
Items that may be reclassified to profit and loss Change in fair value of unsettled effective net investment hedge derivatives 17 3.3 2.6Settled effective net investment hedge derivatives (22.7) 19.6Exchange differences on translation of foreign operations net of funding revaluations 21.4 (35.0) Related tax effect on items that may subsequently be reclassified to profit and loss 9 (0.7) 6.0 1.3 (6.8)
Items that will not subsequently be reclassified to profit and loss Re-measurement gain/(loss) on defined benefit plans 14 4.3 (0.1) Related taxation effect 9 (2.1) 0.1 Effect of taxation rate change on previously recognised items 9 5.7 7.9 -Other comprehensive income/(expense) for the year, net of taxation 9.2 (6.8)
Total comprehensive income for the year, net of taxation 179.4 149.3
Consolidated statement of comprehensive income For the year ended 31 December 2020
Share Capital Share premium redemption Hedging Translation Retained Total capital account reserve reserve reserve earnings equity Notes £m £m £m £m £m £m £m
As at 1 January 2019 81.8 13.3 174.4 2.8 25.3 368.6 666.2Profit for the year 156.1 156.1Other comprehensive income/(expense) excluding related taxation effect (Note 1) 2.6 (15.4) (0.1) (12.9)Related taxation effect (Note 1) 6.0 0.1 6.1
Total comprehensive income/(expense) 2.6 (9.4) 156.1 149.3Issue of share capital 22 - 0.8 0.8Dividends paid 10 (110.8) (110.8)Share-based payments (net of tax) 6 8.6 8.6Shares acquired for: employee share scheme trust (4.2) (4.2)As at 31 December 2019 81.8 14.1 174.4 5.4 15.9 418.3 709.9
Changes in equity in 2020 Profit for the year 170.2 170.2Other comprehensive income/(expense) excluding related taxation effect (Note 1) 3.3 (1.3) 4.3 6.3Related taxation effect (Note 1) (0.7) 3.6 2.9
Total comprehensive income/(expense) 2.6 (1.3) 178.1 179.4Issue of share capital 22 - 0.2 0.2Dividends paid 10 (91.6) (91.6)Share-based payments (net of tax) 6 10.3 10.3Shares acquired for: employee share scheme trust (8.7) (8.7)As at 31 December 2020 81.8 14.3 174.4 8.0 14.6 506.4 799.5
Consolidated statement of changes in equityFor the year ended 31 December 2020
125

2020 2019 Notes £m £m
Assets Intangible assets 11 599.8 618.8Property, plant and equipment 12 266.0 271.3Right of use assets 13 85.6 90.1Employee benefit assets 14 69.1 47.9Deferred tax assets 9 36.3 22.2Other receivables 3.4 2.3Total non-current assets 1,060.2 1,052.6
Inventories 15 293.3 280.8Trade and other receivables 16 378.9 389.7Other current financial assets 17 10.8 6.2Current tax 9 3.3 2.5Investments 17 3.1 3.6Cash and cash equivalents 19 207.9 88.2Total current assets 897.3 771.0Total assets 1,957.5 1,823.6
Liabilities Trade and other payables 21 (371.9) (359.4)Bank overdraft 19 (73.5) (60.1)Interest-bearing loans and borrowings 19 - (17.6)Lease liabilities 13 (26.3) (25.6)Provisions 20 (43.9) (39.8)Current tax 9 (66.3) (57.7)Other current financial liabilities 17 (4.7) (1.9)Total current liabilities (586.6) (562.1)
Interest-bearing loans and borrowings 19 (362.3) (357.9)Lease liabilities 13 (62.0) (64.8)Employee benefit obligations 14 (91.1) (79.2)Provisions 20 (15.1) (13.0)Deferred tax liabilities 9 (33.9) (27.5)Other payables 21 (7.0) (9.2)Total non-current liabilities (571.4) (551.6)Total liabilities (1,158.0) (1,113.7)Net assets 799.5 709.9
Share capital 22 81.8 81.8Share premium 14.3 14.1Other reserves 197.0 195.7Retained earnings 506.4 418.3Total equity 799.5 709.9
Approved by the Board of Directors on 25 February 2021 and signed on its behalf by:
Lord Smith of KelvinChairman
Consolidated balance sheetAt 31 December 2020
126 IMI plc Annual Report & Accounts 2020

2020 2019 Notes £m £m
Cash flows from operating activitiesOperating profit for the year from continuing operations 226.8 204.3Operating profit for the year from discontinued operations - 2.8Adjustments for: Depreciation and amortisation 11, 12, 13 111.1 110.7 Impairment of property, plant and equipment and intangible assets 11, 12 4.0 1.5 Other acquisition items 3 - 1.1 Gain on special pension events 14 - (8.6)Loss/(profit) on sale of property, plant and equipment 12 2.3 (0.7)Equity-settled share-based payment expense 6 10.3 8.8Increase in inventories 15 (8.8) (14.7)Decrease in trade and other receivables 16 17.2 44.9Increase/(decrease) in trade and other payables 21 6.2 (17.3)Increase in provisions and employee benefits 14, 20 7.9 29.2
Cash generated from operations 377.0 362.0Income taxes paid 9 (41.0) (40.2)
Cash generated from operations after tax 336.0 321.8Additional pension scheme funding 14 (7.0) (7.0)Net cash from operating activities 329.0 314.8
Cash flows from investing activities Interest received 8 3.8 4.5Proceeds from sale of property, plant and equipment 12 0.2 7.7Settlement of transactional derivatives 17 0.2 (3.5)Settlement of effective net investment hedge derivatives 17 (22.7) 19.6Acquisitions of subsidiaries net of cash 23 - (68.0)Acquisition of property, plant and equipment and non-acquired intangibles 11, 12 (50.7) (65.8)Net cash from investing activities (69.2) (105.5)
Cash flows from financing activities Interest paid 8 (14.8) (19.4)Shares acquired for employee share scheme trust 22 (8.7) (4.2)Proceeds from the issue of share capital for employee share schemes 22 0.2 0.8Repayment of borrowings 19 (17.8) (63.9)Principal elements of lease payments 13 (28.7) (31.3)Dividends paid to equity shareholders 10 (91.6) (110.8)Net cash from financing activities (161.4) (228.8)
Net increase/(decrease) in cash and cash equivalents 19 98.4 (19.5)Cash and cash equivalents at the start of the year 19 28.1 49.6Effect of exchange rate fluctuations on cash held 7.9 (2.0)Cash and cash equivalents at the end of the year* 134.4 28.1
* Net of bank overdrafts of £73.5m (2019: £60.1m).Notes to the cash flow appear in Note 19.
Consolidated statement of cash flows For the year ended 31 December 2020
127

IntroductionIMI plc (the ‘Company’) is a company incorporated and domiciled in the United Kingdom. The consolidated financial statements of the Company comprise the Company and its subsidiaries (together referred to as the ‘Group’). The Company financial statements present information about the Company as a separate entity and not about the Group. The consolidated financial statements have been prepared in accordance with those International Financial Reporting Standards as adopted pursuant to Regulation (EC) No. 1606/2002 as it applies in the European Union. The Company financial statements have been prepared in accordance with International Accounting Standards in conformity with the requirements of the Companies Act 2006 as applied in accordance with section 408 of the Companies Act 2006 and these are presented on pages 180 to 184. The financial statements were approved by the Board of Directors on 25 February 2021.
Basis of accountingThe financial statements are presented in Pounds Sterling (which is the Company’s functional currency), rounded to the nearest hundred thousand, except revenues, which are rounded to the nearest whole million. They are prepared on the historical cost basis except for derivative financial instruments; financial assets classified as fair value through profit and loss or other comprehensive income; assets and liabilities acquired through business combinations, which are stated at fair value and retirement benefits. Non-current assets and liabilities held for sale are stated at the lower of their carrying amounts and their fair values less costs to sell.
The accounting policies described in the notes to the financial statements have been applied consistently throughout the Group for the purposes of these consolidated financial statements.
(i) New or amended EU Endorsed Accounting Standards adopted by the Group during 2020
Noted below are the amended and new International Financial Reporting Standards which became effective for the Group as of 1 January 2020, none of which has a material impact on the financial statements:• IFRS 3 ‘Business Combinations’ – amendments to definition of a Business;• IFRS 7, IFRS 9 and IAS 39: ‘Financial Instruments’ – amendments to Interest
Rate Benchmark Reform; and• IAS 1 ‘Presentation of Financial Statements’ and IAS 8 ‘Accounting Policies,
Changes in Accounting Estimates and Errors’ – amendments to definition of Material
Going concernAccounting standards require that directors satisfy themselves that it is reasonable for them to conclude whether it is appropriate to prepare financial statements on a going concern basis. The Group’s business activities, together with the factors likely to affect its business development, performance and position are set out in the Strategic Report. Principal risks are detailed on pages 60 to 63. The financial position of the Group, its cash flows, liquidity position and borrowing facilities are described in these financial statements. In addition, Note 18 includes the Group’s objectives, policies and processes for managing its capital; its financial risk management objectives; details of its financial instruments and hedging activities; and its exposures to credit risk and liquidity risk. Note 14 to the financial statements addresses the management of the funding risks of the Group’s employee benefit obligations.
After making enquiries, the directors have a reasonable expectation that the Company and the Group have adequate resources to continue in operational existence for the foreseeable future and for a period of at least twelve months (28 February 2022) following the approval of the Annual Report & Accounts. Accordingly, they continue to adopt the going concern basis in preparing the financial statements.
The directors have considered the impact of Coronavirus and of the restrictions put in place by governments to contain the spread of the virus on the Group’s financial results and financial position. Immediate measures were taken to protect first and
foremost the Group’s workforce, communities and customers. Actions were deployed to ensure strict adherence to social distancing measures and deep-cleaning protocols and these measures will be continued as needed to keep the workforce safe.
Business disruption, so far, has been reasonably modest as the Group is well diversified and maintains a balanced portfolio operating across a range of markets, sectors and geographies with no single dependency. Performance in IMI Precision’s Commercial Vehicle segment has been affected and temporary construction site restrictions have impacted the results of IMI Hydronic, both of which have been mitigated to some extent by a temporary surge in orders within Life Sciences.
Across the Group, all sites have returned to normal levels of production. Supply chain disruptions have been minimal and alternative suppliers or contingency stocks have addressed the few instances of part shortages.
During this period of uncertainty, the Group continues to maintain a robust financial position. The balance sheet position has been protected by the actions taken to reduce costs and preserve cash, including the following:• salary reductions for the Board;• continuing, successful initiatives in rationalisation, value-pricing and material cost
reduction; and• reduction in temporary workers, increase in short time working, and tight controls
on discretionary spending.
At 31 December 2020, the Group had cash and cash equivalents of £134m and undrawn committed facilities of £300m in the form of Revolving Credit Facilities (RCF), of which £150m is due for renewal in 2022, £75m in 2023 and £75m in 2024. Forecasts indicate that the Group can operate within the level of facilities in place without the need to obtain any new facilities in the twelve-month period following the approval of the Annual Report & Accounts.
The directors have assessed the viability of the Group and reviewed detailed cash flow forecasts for a period of at least twelve months following the date of approval of the Annual Report & Accounts. These revised forecasts factored in a decline in revenue based on slowdowns in various end markets, experiencing tough trading conditions. After applying a reverse stress test and making comparisons to the detailed forecasts, the directors have a reasonable expectation that the financial headroom will not be exhausted during this period.
Covenant compliance reviews are undertaken to ensure that the Group remains fully within the covenant limits. Funding covenants currently require EBITDA to be no less than 4.0 times interest and net debt to be no more than 3.0 times EBITDA. Those covenant ratios, at 31 December 2020, were 34.5 times and 0.8 times, respectively. For there to be a breach of covenants during the twelve-month period following the approval of the Annual Report & Accounts, forecast revenue would need to fall by 36%, and forecast EBITDA by 69%, after taking into account the mitigating actions that would be undertaken in these circumstances. The mitigating actions include, but are not limited to, reducing working capital, restricting capital expenditure, reducing overhead spend and employee costs and cutting or suspending dividend payments to shareholders.
Re-presentationsFurther information has been provided in the following financial statements in the current year and as a result, 2019 comparatives have been re-presented accordingly:
Consolidated statement of comprehensive income'Exchange differences on translation of foreign operations net of hedge settlements and funding revaluations' disclosed in the prior year are now separately disclosed within the Consolidated statement of comprehensive income as 'Settled effective net investment hedge derivatives' and 'Exchange differences on translation of foreign operations net of funding revaluations'.
Consolidated statement of changes in equity‘Other comprehensive income/(expense)’ disclosed in the prior year is now separately disclosed within the Consolidated statement of changes in equity as ‘Other comprehensive income/(expense) excluding related taxation effect’ and ‘Related taxation effect’.
Notes to the consolidated financial statements 1. Basis of preparation
128 IMI plc Annual Report & Accounts 2020

Where appropriate the significant accounting policies are presented in the note to which it applies to aid the reader’s understanding of their application. Set out below are the significant accounting policies which do not have a specific note.
A. SubsidiariesThe Group financial statements consolidate the financial statements of IMI plc and the entities it controls (its subsidiaries) for the year to 31 December 2020. The Group has no significant interests which are accounted for as associates or joint ventures.
Subsidiaries are consolidated from the date of their acquisition, being the date on which the Group obtains control, and continue to be consolidated until the date that such control ceases. Control comprises the power to govern the financial and operating policies of the investee so as to obtain benefit from its activities and is achieved through direct or indirect ownership of voting rights; currently exercisable or convertible potential voting rights; or by way of contractual agreement. The financial statements of subsidiaries used in the preparation of the consolidated financial statements are prepared for the same reporting year as the parent company and are based on consistent accounting policies. All intragroup balances and transactions, including unrealised profits arising from them, are eliminated in full.
A change in the ownership interest of a subsidiary, without loss of control, is accounted for as an equity transaction. If the Group loses control over a subsidiary, it:• derecognises the assets (including any goodwill relating to the subsidiary)
and liabilities of the subsidiary;• derecognises the carrying amount of any non-controlling interest;• derecognises the cumulative translation differences recorded in equity;• recognises the fair value of the consideration received;• recognises the fair value of any investment retained;• recognises any surplus or deficit in profit or loss; and• reclassifies the parent’s share of components previously recognised in other
comprehensive income to profit or loss or retained earnings, as appropriate.
Taxation on the above accounting entries would also be recognised where applicable.
B. Use of judgements and estimatesThe preparation of financial statements requires management to make judgements, estimates and assumptions that affect the application of accounting policies and the reported amounts of assets, liabilities, income and expenses. Actual results may differ from these estimates.
i. Key judgements The key judgements are disclosed in Notes 3 and 13.
ii. Key estimates and assumptionsThe key estimates and assumptions concerning the future and other sources of estimation uncertainty at the reporting date are described below. The Group bases its assumptions and estimates on information available when the consolidated financial statements are prepared. Market changes or circumstances arising beyond the control of the Group are reflected in the assumptions and estimates when they occur. Revisions to accounting estimates are recognised in the period in which the estimate is revised and in any future periods affected. The key estimates are disclosed in Notes 11, 14 and 15.
iii. Changes in judgements, estimates and assumptionsManagement has reassessed the key judgements and estimates presented in the 2019 Annual Report and Accounts and concluded that, in the current year, no changes are required in the consideration of what constitutes a key judgement; however, we no longer consider there to be a key estimate associated with trade and other receivables, warranty provisions or acquisitions.
C. Revenue recognitionRevenue is recognised when obligations under the terms of a contract with our customer are satisfied. This generally occurs when the goods are transferred, or the services are provided, to our customer. Revenue is measured as the amount of consideration we expect to receive in exchange for transferring goods or providing services. Sales and other taxes collected from customers are excluded from revenue. The nature of the equipment, valve and other contracts into which the Group enters means that: • the contracts usually contain distinct performance obligations, each of which
transfers control of the goods to the customer. Where such distinct performance obligations are present, revenue is recognised on each element in accordance with the policy on the sale of goods; and
• the service element of the contract is usually insignificant in relation to the total contract value and is often provided on a short-term or one-off basis. Where this is the case, revenue is recognised when the service is complete.
As a result of the above, the significant majority of the Group’s revenue is recognised on a sale of goods basis. Each of the divisional revenue streams set out in Note 4 can consist of the sale of goods, the provision of services or a combination of the two. The specific methods used to recognise the different forms of revenue earned by the Group are set out below:
i. Sales of GoodsRevenue from the sale of goods is recognised in the income statement net of returns, trade discounts and volume rebates when control has been transferred to our customer. No revenue is recognised where recovery of the consideration is not probable or there are significant uncertainties regarding associated costs, or the possible return of goods.
In IMI Hydronic, the amount of consideration received and the revenue recognised varies in line with discounts and promotions offered to our customers and their customers. The level of estimation uncertainty associated with variable consideration is minimal, as discounts and rebates are accounted for at the point of sale and adjusted as required at each financial year end.
The timing of the transfer of control to our customer varies depending on the nature of the products sold and the individual terms of the contract of sale. Sales made under internationally accepted trade terms, Incoterms 2020, are recognised as revenue when the Group has completed the primary duties required to transfer control as defined by the International Chamber of Commerce Official Rules for the Interpretation of Trade Terms. Sales made outside Incoterms 2020 are generally recognised on delivery to the customer. In limited instances, a customer may request that the Group retains physical possession of an asset for a period after control has been transferred to the customer. In these circumstances, the Group provides this storage as a service to the customer and therefore revenue is recognised prior to delivery of the asset.
2. Significant accounting policies
129

ii. Rendering of servicesAs noted above, revenue from the rendering of services is usually insignificant in relation to the total contract value and is generally provided on a short-term or one-off basis. Accordingly, revenue is usually recognised when the service is complete.
Where this is not the case, revenue from services rendered is recognised in proportion to the stage of completion of the service at the balance sheet date.
The stage of completion is assessed by reference to the contractual performance obligations with each separate customer and the costs incurred on the contract to date in comparison to the total forecast costs of the contract. Revenue recognition commences only when the outcome of the contract can be reliably measured. Installation fees are similarly recognised by reference to the stage of completion on the installation unless they are incidental to the sale of the goods, in which case they are recognised when the goods are sold.
iii. Combined services and goodsWhen a transaction combines a supply of goods with the provision of a significant service, distinct performance obligations are identified and recognised in line with the applicable policy. If the service is essential to the functionality of the goods supplied then combined performance obligations, including the provision of goods and services, are identified at the lowest level and the transaction price is allocated to each performance obligation on an appropriate basis. Revenue from a service that is incidental to the supply of goods is recognised at the same time as the revenue from the supply of goods.
D. Foreign currenciesi. Foreign currency transactionsMonetary assets and liabilities denominated in foreign currencies have been translated into sterling at the rates of exchange ruling at the balance sheet date. Foreign exchange differences arising on translating transactions at the exchange rates ruling on the transaction date are reflected in the income statement. Non-monetary assets and liabilities that are measured at historical cost in a foreign currency are translated using the exchange rate at the date of the transaction. Non-monetary assets and liabilities denominated in foreign currencies that are stated at fair value are translated into sterling at foreign exchange rates ruling at the balance sheet date.
ii. Foreign operationsThe income statement's of overseas subsidiary undertakings are translated at the appropriate average rate of exchange for the year and the adjustment to year end rates is taken directly to reserves.
The assets and liabilities of foreign operations, including goodwill and fair value adjustments arising on acquisition, are translated at foreign exchange rates ruling at the balance sheet date.
Foreign exchange differences arising on retranslation are recognised directly as a separate component of equity. Since 1 January 2004, the Group’s date of transition to IFRSs, such differences have been recognised in the translation reserve. When a foreign operation is disposed of, in part or in full, the relevant amount in the translation reserve is transferred to profit or loss.
E. Financial instruments and fair value hedgingFinancial instruments are initially recorded at fair value plus directly attributable transaction costs unless the instrument is a derivative not designated as a hedge (see below). Subsequent measurement depends on the designation of the instrument, which follows the categories in IFRS 9:
• Short term borrowings and overdrafts are classified as financial liabilities at amortised cost.
• Derivatives, comprising interest rate swaps, foreign exchange contracts and options, metals futures contracts and any embedded derivatives, are classified as ‘fair value through profit or loss’ under IFRS 9, unless designated as hedges. Derivatives not designated as hedges are initially recognised at fair value; attributable transaction costs are recognised in profit or loss when incurred. Subsequent to initial recognition, changes in fair value of such derivatives and gains or losses on their settlement are recognised in net financial income or expense.
• Long term loans and other interest bearing borrowings are generally held at amortised cost using the effective interest rate method. Where the long term loan is hedged, generally by an interest rate swap, and the hedge is regarded as effective, the carrying value of the long term loan is adjusted for changes in fair value of the hedge.
• Trade receivables are stated at cost as reduced by appropriate impairment allowances for expected irrecoverable amounts.
• Trade payables are stated at cost.• Financial assets and liabilities are recognised on the balance sheet only when
the Group becomes a party to the contractual provisions of the instrument.• Available for sale financial assets are carried at fair value with gains and losses
being recognised in equity, except for impairment losses, which are recognised in the income statement.
2. Significant accounting policies (continued)
130 IMI plc Annual Report & Accounts 2020

F. Other hedgingi. Hedge of monetary assets and liabilities, financial commitments
or forecast transactionsWhere a derivative financial instrument is used as an economic hedge of the foreign exchange or metals commodity price exposure of a recognised monetary asset or liability, financial commitment or forecast transaction, but does not meet the criteria to qualify for hedge accounting under IFRS 9, no hedge accounting is applied and any gain or loss resulting from changes in fair value of the hedging instrument is recognised in net financial income or expense.
Where such a derivative is a formally designated hedge of a forecast transaction for accounting purposes, movements in the value of the derivative are recognised directly in other comprehensive income to the extent the hedge is effective. The Company assesses the effectiveness of the hedge based on the expected fair value of the amount to be received and the movement in the fair value of the derivative designated as the hedge.
For segmental reporting purposes, changes in the fair value of economic hedges that are not designated hedges, which relate to current year trading, together with the gains and losses on their settlement, are allocated to the operating profit of the relevant business segment.
ii. Hedge of net investment in foreign operationsWhere a foreign currency liability or derivative financial instrument is a formally designated hedge of a net investment in a foreign operation, foreign exchange differences arising on translation of the foreign currency liability or changes in the fair value of the financial instrument are recognised directly in equity via other comprehensive income, to the extent the hedge is effective. The Group assesses the effectiveness of its net investment hedges based on fair value changes of its net assets, including relevant goodwill designated as foreign currency assets, and the fair value changes of both the debt designated as a hedge and the relevant financial instrument.
G. Investments not held for tradingInvestments that are designated as being not held for trading are initially recognised at fair value. Subsequently, the fair value of the investment is reassessed at each balance sheet date with movements in the fair value recognised in other comprehensive income.
H. Discontinued operationsWhen the Group has assets and liabilities that have been sold in the year or are likely to be sold rather than being held for continuing use, these assets and liabilities are included in current assets and liabilities and denoted ‘held for sale’ rather than in their usual categories. They are recognised at the lower of carrying amount and fair value less costs to sell. Impairment losses on the initial classification of assets held for sale are included in the income statement, even for assets measured at fair value, as are impairment losses on subsequent remeasurement and any reversal thereof. Once classified as held for sale, assets are no longer depreciated or amortised.
If they represent a significant enough proportion of the Group, they are also treated as discontinued operations. A discontinued operation is a component of the Group’s business that represents a separate major line of business that has been disposed of, is held for sale or is a subsidiary acquired exclusively with a view to re-sale. This means that their trading performance, i.e. their revenues, costs and other items of income and expense, are no longer reported within the headline figures in the income statement and are instead reported in a separate line, net of tax, called ‘discontinued operations’. These amounts no longer form part of continuing earnings per share. Comparative figures are re-presented to be shown on the same basis.
This enables the income statement for the current and prior year to be presented on a consistent basis and to convey a more forward-looking version of the results for the year.
In 2020, there was a profit after tax of £nil (2019: profit after tax of £2.8m) from discontinued operations. See Note 28 for further details.
131

Key judgement
Management has applied judgement in the selection of the Alternative Performance Measures (‘APMs’) used in the Annual Report and Accounts. The APMs presented are used in discussions with the investment analyst community and by the Board and management to monitor the trading performance of the Group. We consider that the presentation of APMs allows for improved insight to the trading performance of the Group. We consider that the term 'Adjusted', together with an adjusting items category, best reflects the trading performance of the Group.
The adjusting items in the income statement include restructuring costs, special pension events, gains/losses on disposals of subsidiaries, impairment losses, the reversal of gains/losses on economic hedges, gains on property disposals, acquisition costs, acquired intangible amortisation and other acquisition items.
Movements in adjusted revenue and adjusted operating profit are given on an organic basis (see definition below) so that performance is not distorted by acquisitions, disposals and movements in exchange rates.
The table below details the definition of each APM and a reference to where it can be reconciled to the equivalent statutory measure.
APM Definition Reconciliation to statutory measure
Adjusted revenue
Adjusted profit before tax
Adjusted net interest cost
Adjusted earnings per share
Adjusted effective tax rate
Adjusted EBITDA
These measures are as reported to management and do not include the impact of adjusting items described in this note.
This measure reflects adjusted profit after tax before interest, tax, depreciation and amortisation.
See income statement on page 124.
See Note 7.
See Note 9.
See Note 19.
Adjusted operating profit and margin
Organic growth
These measures are as reported to management and do not include the impact of adjusting items described in this note.
This measure removes the impact of adjusting items, acquisitions, disposals and movements in exchange rates.
See income statement on page 124 and segmental reporting note in Note 4.
Adjusted operating cash flow This measure reflects cash generated from operations as shown in the statement of cash flows less cash spent acquiring property, plant and equipment, non-acquired intangible assets and investments; plus cash received from the sale of property, plant and equipment, the sale of investments less the repayment of principal amounts of lease payments excluding the cash impact of adjusting items.
See Note 19.
Net debt
Free cash flow before corporate activity
Net debt is defined as the cash and cash equivalents, overdrafts, interest-bearing loans and borrowings and lease liabilities.
This measure is a sub-total in the reconciliation of adjusted EBITDA to Net Debt and is presented to assist the reader to understand the nature of the current year’s cash flows.
See Note 19.
See Note 19.
Return on capital employed (ROCE)
ROCE is defined as adjusted operating profit after tax divided by average capital employed. Capital employed is defined as net assets adjusted to remove net debt, derivative assets/liabilities, defined benefit pension position (net of deferred tax) and to reverse historical impairments of goodwill and amortisation of acquired intangible assets.
See Financial review on page 52.
3. Alternative Performance Measures (‘APMs’) & adjusting items
132 IMI plc Annual Report & Accounts 2020

The adjusting items category in the income statement includes those items which are removed from statutory measures to provide insight as to the performance of the Group. Accordingly, adjusting items are included in a separate column on the face of the income statement. Outlined below are the adjusting items impacting the current results.
2020 2019 Key £m £m
Recognised in arriving at operating profit from continuing operations Reversal of net economic hedge contract (gains)/losses a) (1.5) 4.0Restructuring costs b) (36.1) (51.8)Gains on special pension events c) - 8.6Impairment losses d) (1.6) (1.5)Acquired intangible amortisation and other acquisition items e) (18.7) (21.1)
Recognised in net financial expense Financial income a) 14.1 13.4Financial expense a) (15.8) (13.0)
(a) Reversal of net economic hedge contract losses/gains – For segmental reporting purposes, changes in the fair value of economic hedges which are not designated as hedges for accounting purposes, together with the gains and losses on their settlement, are included in the adjusted revenues and operating profit of the relevant business segment. The adjusting items at the operating level reverse this treatment. The net financing adjusting items reflect the change in value or settlement of these contracts with the financial institutions with whom they were transacted.
(b) Restructuring costs – The restructuring costs of £36.1m (2019: £51.8m) are a result of a number of significant restructuring projects across the Group. These include the continuation of a cost and footprint rationalisation programme within IMI Precision Engineering, £4.8m in Europe and £2.5m in the Americas, which include the closure of a manufacturing site in each region. In IMI Critical Engineering, adjusted restructuring costs related to a restructuring programme in the EMEA region of £22.4m, which included the closure of manufacturing at two Italian sites and restructuring at two German sites, and £2.1m in the Americas to right size the workforce. In IMI Hydronic Engineering, there were costs of £5.1m related to closure of a manufacturing site in Slovenia and consolidation of the Swedish and German distribution hubs into one hub in Poland. There was a provision release of £0.8m related to the Corporate HQ following the closure of matters relating to previous projects.
In 2019, £51.8m of restructuring costs included the restructure of our European business totalling £24.4m in IMI Precision Engineering, £4.6m in the Americas and £1.2m in the divisional central team. In IMI Critical Engineering, adjusted restructuring costs related to a divisional reorganisation of £9.2m and restructure of the EMEA region of £9.5m. In IMI Hydronic Engineering, there were restructuring costs of £0.3m due to the finalisation of the Global Restructuring Programme initiated in 2018 and there were restructuring costs of £2.6m relating to the Corporate head office.
(c) Gains on special pension events – During 2019, a gain in respect of an accounting adjustment for Swiss disability benefits was recognised for £4.7m. A gain was recognised in respect of a restructure of the pension benefits in Switzerland resulting in a gain of £2.8m. A curtailment gain of £0.8m was recognised in relation to a restructuring event in Switzerland. A settlement gain of £0.5m was recognised in respect of the buy-out of retirees in Switzerland. Professional fees of £0.2m have been recognised as adjusting associated with ongoing de-risking projects.
(d) Impairment losses – In 2020, the Group recorded an adjusting impairment charge of £1.6m (2019: £1.5m) associated with the restructuring programmes ongoing in IMI Precision Engineering and IMI Critical Engineering.
(e) Acquired intangible amortisation and other acquisition items – Acquired intangible amortisation is excluded from adjusted profits, to allow for better comparability of the performance across divisions. This allows users of the financial statements to gain a clearer understanding of the performance of the business, with the impact of amortisation identified separately in line with internal reporting to management. Acquired intangible amortisation reduced to £18.7m (2019: £19.5m), which largely relates to the amortisation of the intangible assets recognised on the acquisition of Bimba in 2018.
In 2019, the acquisition of PBM resulted in a fair value uplift to inventory of £1.1m recognised in accordance with IFRS 3 ‘Business Combinations’ as an adjusting item to cost of sales and professional fees of £0.5m.
Adjusting items associated with discontinued operations are disclosed in Note 28.
133

Segmental information is presented in the consolidated financial statements for each of the Group's operating segments. The operating segment reporting format reflects the Group's management and internal reporting structures and represents the information that was presented to the chief operating decision-maker, being the Executive Committee. As described on page 03, each of the Group’s three divisions has a number of key brands across its main markets and operational locations. For the purposes of reportable segmental information, operating segments are aggregated into the Group’s three divisions, as the nature of the products, production processes and types of customer are similar within each division. Inter-segment revenue is insignificant.
IMI Precision EngineeringIMI Precision Engineering specialises in the design and manufacture of motion and fluid control technologies where precision, speed and reliability are essential to the processes in which they are involved.
IMI Critical EngineeringIMI Critical Engineering is a world-leading provider of flow control solutions that enable vital energy and process industries to operate safely, cleanly, reliably and more efficiently. Our products control the flow of steam, gas and liquids in harsh environments and are designed to withstand temperature and pressure extremes as well as intensely abrasive or corrosive cyclical operations.
IMI Hydronic EngineeringIMI Hydronic Engineering is a leading provider of technologies that deliver operational and energy efficient water-based heating and cooling systems for the residential and commercial building sectors.
Performance is measured by the Executive Committee based on adjusted operating profit and organic revenue growth, which are defined in Note 3. These two measures represent the two short term key performance indicators for the Group.
Businesses enter into forward currency and metal contracts to provide economic hedges against the impact on profitability of swings in rates and values in accordance with the Group's policy to minimise the risk of volatility in revenues, costs and margins. Adjusted operating profits are therefore charged/credited with the impact of these contracts. In accordance with IFRS 9, these contracts do not meet the requirements for hedge accounting and gains and losses are reversed out of operating profit and are recorded in net financial income and expense for the purposes of the consolidated income statement
4. Segmental information
The following table illustrates how the results for the segments reconcile to the overall results reported in the income statement.
Revenue Operating profit Operating margin
2020 2019 2020 2019 2020 2019 £m £m £m £m % %
Continuing operations IMI Precision Engineering 877 907 151.4 148.0 17.3% 16.3% IMI Critical Engineering 643 651 106.5 90.1 16.6% 13.8% IMI Hydronic Engineering 305 315 55.7 56.7 18.3% 18.0% Corporate costs (28.9) (28.7) Total adjusted revenue/operating profit 1,825 1,873 284.7 266.1 15.6% 14.2%
Reversal of net economic hedge contract (gains)/losses (1.5) 4.0 Restructuring costs (36.1) (51.8) Gains on special pension events - 8.6 Acquired intangible amortisation and other acquisition items (18.7) (21.1) Impairment losses (1.6) (1.5)
Statutory revenue/operating profit 1,825 1,873 226.8 204.3
Net financial expense (12.5) (15.0) Statutory profit before tax from continuing operations 214.3 189.3
134 IMI plc Annual Report & Accounts 2020

The following table illustrates how revenue and adjusted operating profit have been impacted by movements in foreign exchange, acquisitions and disposals.
Year ended 31 December 2019 Year ended 31 December 2020
As As Adjusted Organic adjusted Exchange Organic adjusted Acquisitions Organic growth (%) growth (%)
Adjusted revenue IMI Precision Engineering 907 (1) 906 877 877 -3% -3% IMI Critical Engineering 651 (1) 650 643 (19) 624 -1% -4% IMI Hydronic Engineering 315 2 317 305 305 -3% -4%Total 1,873 - 1,873 1,825 (19) 1,806 -3% -4%
Adjusted operating profit IMI Precision Engineering 148.0 0.3 148.3 151.4 151.4 2% 2% IMI Critical Engineering 90.1 - 90.1 106.5 (3.7) 102.8 18% 14% IMI Hydronic Engineering 56.7 2.0 58.7 55.7 55.7 -2% -5% Corporate costs (28.7) - (28.7) (28.9) (28.9) Total 266.1 2.3 268.4 284.7 (3.7) 281.0 7% 5%
Adjusted operating profit margin (%) 14.2% 14.3% 15.6% 15.6%
The following table illustrates how the segmental assets and liabilities reconcile to the overall total assets and liabilities reported in the balance sheet.
Assets Liabilities
2020 2019 2020 2019 £m £m £m £m
IMI Precision Engineering 645.0 667.0 154.3 165.8IMI Critical Engineering 749.8 771.4 256.4 241.1IMI Hydronic Engineering 224.7 206.8 84.8 69.9
Total segmental assets/liabilities (including lease liabilities) 1,619.5 1,645.2 495.5 476.8Corporate items 18.3 14.0 35.4 36.9Employee benefits 69.1 47.9 91.1 79.2Investments 3.1 3.6 - -Net debt items (excluding lease liabilities) 207.9 88.2 435.8 435.6Net taxation and others 39.6 24.7 100.2 85.2Total assets and liabilities in Group balance sheet 1,957.5 1,823.6 1,158.0 1,113.7
135

The following table includes other information to show how certain costs are allocated between the segments of the Group.
Adjusting restructuring costs Capital expenditure Amortisation* Depreciation **
2020 2019 2020 2019 2020 2019 2020 2019 £m £m £m £m £m £m £m £m
IMI Precision Engineering 7.3 30.2 28.9 27.5 11.8 11.0 38.0 35.5IMI Critical Engineering 24.5 18.7 10.5 27.3 17.7 17.4 22.3 24.7IMI Hydronic Engineering 5.1 0.3 11.3 10.9 5.5 5.8 15.0 14.8 36.9 49.2 50.7 65.7 35.0 34.2 75.3 75.0Corporate costs (0.8) 2.6 - 0.1 - 0.3 0.8 1.2Total 36.1 51.8 50.7 65.8 35.0 34.5 76.1 76.2
* The amortisation figures above include the amortisation of acquired intangibles. £7.7m (2019: £7.5m) is included in respect of IMI Precision, £11.0m (2019: £12.0m) is included in respect of IMI Critical and £nil (2019: £nil) is included in respect of IMI Hydronic.
** The depreciation figures above include the impact of IFRS 16: £0.6m in respect of Corporate (2019: £0.7m), £12.8m in respect of IMI Precision (2019: £13.2m), £9.3m in respect of IMI Critical (2019: £11.6m) and £7.0m in respect of IMI Hydronic (2019: £6.3m).
4. Segmental information (continued)
The following table shows a geographical analysis of how the Group’s revenue is derived by destination.
2020 2019 Revenue Revenue £m £m
UK 88 90 Germany 222 234 Rest of Europe 486 494 Total Europe 796 818
USA 443 440 Rest of Americas 102 98 Total Americas 545 538
China 156 158 Rest of Asia Pacific 234 246 Total Asia Pacific 390 404
Middle East & Africa 94 113 Total statutory revenue 1,825 1,873
Total Americas30%
Total Americas29%
Total Europe44%
Total Europe44%
Total Asia Pacific21%
Total Asia Pacific21%
Middle East & Africa5%
Middle East & Africa6%
Adjusted revenue by destination (2019)Adjusted revenue by destination (2020)
136 IMI plc Annual Report & Accounts 2020

The following table shows a geographical analysis of the location of the Group’s intangible assets, property, plant and equipment, and right of use assets.
2020 2019 £m £m
UK 74.2 84.1Germany 232.2 234.2Rest of Europe 279.5 265.1USA 279.8 309.3Asia Pacific 47.6 51.7Rest of World 38.1 35.8Total 951.4 980.2
The Group's revenue streams are disaggregated in the table below. For details of the performance obligations relating to these revenue streams please refer to Note 2C.
2020 2019* Revenue RevenueSector £m £m
IMI Precision Engineering** Factory Automation 361 406 Rail 37 42 Motion Control 398 448 Life Sciences 171 88Process Control 86 98 Energy 82 87 Fluid Technologies 339 273 Commercial Vehicles 140 186 Total IMI Precision Engineering 877 907
IMI Critical Engineering*** New Construction 67 60 Aftermarket 47 51 Oil & Gas 114 111 New Construction 120 102Aftermarket 82 105 Refining & Petrochemical 202 207New Construction 47 57Aftermarket 130 147 Power 177 204 Marine 39 30Nuclear 49 53 Other 62 46 Total IMI Critical Engineering 643 651
IMI Hydronic Engineering TA 146 152 Heimeier 95 97 Pneumatex 51 50Other 13 16 Total IMI Hydronic Engineering 305 315Total revenue 1,825 1,873
* The Group has been reorganised into commercially focused business units, resulting in the reclassification to new sectors. Prior year numbers in the tables above have been re-presented.
** 2019 Industrial Automation sales of £509m disaggregate as Factory Automation (£398m), Process Control (£98m), Life Sciences (£7m) and Energy (£6m). 2019 Commercial Vehicle sales of £194m disaggregate as Commercial Vehicle (£186m) and Factory Automation (£8m).
*** 2019 New Construction sales of £277m disaggregate as Oil & Gas (£60m), Refining & Petrochemical of (£102m), Power (£57m), Marine (£13m), Nuclear (£11m) and Other (£34m) and Aftermarket sales of £374m disaggregate as Oil & Gas (£51m), Refining & Petrochemical (£105m), Power (£147m), Marine (£17m), Nuclear (£42m) and Other (£12m).
137

5. Operating costs
Operating costs by functionThe following table shows how much of the operating costs disclosed in the income statement relate to selling and distribution costs and administrative expenses.
2020 £m
2019 £m
Selling and distribution costs (222.5) (253.5)Administrative expenses (309.0) (294.8)
(531.5) (548.3)
Employee informationThe average number of people employed by the Group during the year was:
2020 2019
IMI Precision Engineering 5,427 5,979
IMI Critical Engineering 3,116 3,217IMI Hydronic Engineering 1,810 1,770Corporate 93 108Total Group 10,446 11,074
The decrease in 2020 is due to the results of ongoing restructuring.
The aggregate employment cost charged to operating profit for the year was:
2020 £m
2019 £m
Wages and salaries 489.9 499.5Share-based payments 10.3 8.8Social security costs 77.4 82.8Pension costs* 5.6 (3.1)Total 583.2 588.0
* There are no special pension events included in 2020 pension costs (2019: £8.6m gain which is disclosed as adjusting items, see Note 3).
The aggregate gains made by directors on the exercise of share options was £0.6m (2019: £3.7m). The remuneration, as defined in the Companies Act 2006 Schedule 5, for the executive directors' comprises fixed and annual variable pay as set out in the table on page 95 of the Remuneration Report. For details of the non-executive directors’ remuneration please refer to page 103 of the Remuneration Report.
Research and development expenditureThe continuing cost of research and development expenditure charged directly to the income statement was £38.7m (2019: £42.9m), included within this is amortisation of capitalised intangible development costs which amounted to £7.0m (2019: £6.5m restated) and across the Group a further £6.9m (2019: £8.6m restated) was capitalised in the year.
Government AssistanceDuring the year, the Group has benefited from government assistance of £2.7m as a result of the COVID-19 pandemic. In accordance with IAS 20 'Government Grants', the income received has been deducted in reporting the related expense.
Over 84% of this balance was received by our businesses located in Asia Pacific through the Job Support Scheme or in the form of social insurance rebates.
Exchange on operating activities net of hedging arrangementsThe transactional foreign exchange losses in the Group were £0.6m (2019: gains of £1.8m).
Audit feesThe Group engages its auditor, EY, to perform other assurance assignments in addition to their statutory audit duties where their expertise, experience and knowledge of the Group should enable them to perform these assignments more efficiently than other similar service providers.
The Group’s policy on such assignments is set out in the Audit Committee Report on page 79. Fees earned by EY and its associates during the year are set out below:
2020 £m
2019 £m
Fees earned by the Company’s auditor for the audit of the Company’s annual accounts 0.2 0.2 The audit of the Company’s subsidiaries, pursuant to legislation 2.9 2.8Other assurance services 0.1 0.1Total 3.2 3.1
138 IMI plc Annual Report & Accounts 2020

6. Share-based payments
The Group operates a number of equity and equity-related compensation benefits to reward its employees. The estimated cost of awarding these share options is charged to the income statement over the period that the Group benefits from the employees’ services. This cost is then added back to retained earnings, to reflect that there is no overall impact on the Group’s balance sheet until the shares are issued to the employees when the options are exercised.
The individual share option schemes, the number of options outstanding under each of them, the estimated cost of these options recognised in the income statement and the assumptions used in arriving at this estimated cost are described below.
Accounting policy
The fair value of the employee services received in exchange for the grant of the options is recognised as an expense each year. The total amount to be expensed over the vesting period is determined by reference to the fair value of the options granted, excluding the impact of any non-market vesting conditions (for example, profitability and sales growth targets). Non-market vesting conditions are included in assumptions about the number of options that are expected to become exercisable. The fair value of the options is determined based on the Monte Carlo and Black-Scholes option-pricing models.
At each balance sheet date, the Group revises its estimates of the number of options that are expected to vest. It recognises the impact of the revision of original estimates, if any, in the income statement.
For newly issued shares, the proceeds received net of any directly attributable transaction costs are credited to share capital (nominal value) and share premium when the options are exercised.
Outstanding share optionsAt 31 December 2020, options to purchase ordinary shares had been granted to, but not yet exercised by, participants of IMI share option schemes as follows:
Date of Number grant of shares Price Dates from which exercisable
IMI Sharesave Scheme 05.06.15 11,119 1075.32p 01.08.18 or 01.08.20 29.04.16 34,870 845.10p 01.08.19 or 01.08.21 21.04.17 24,914 1106.00p 01.08.20 or 01.08.22 04.04.18 55,815 1012.68p 01.08.21 or 01.08.23 04.04.19 147,757 884.16p 01.08.22 or 01.08.24 02.04.20 66,765 904.66p 01.08.23 or 01.08.25 341,240 Purchase Plans 16.08.19 26,231 902.72p 12.08.21 10.08.20 42,753 956.07p 10.08.22 68,984 IMI Incentive Plan 07.05.15 1,868 - 07.05.17 or 07.05.18 09.03.16 16,678 - 09.03.18 or 09.03.19 09.03.17 36,433 - 09.03.19 or 09.03.20 12.03.18 587,307 - 12.03.20 or 12.03.21 18.03.19 640,397 - 18.03.21 or 18.03.22 16.03.20 1,296,959 - 16.03.23 2,579,642 IMI Share Option Plan 22.03.10 645.00p 22.03.13 23.03.11 68,500 971.83p 23.03.14 04.05.12 152,300 980.67p 04.05.15 27.11.12 10,000 1007.33p 27.11.15 12.03.13 156,650 1322.70p 12.03.16 22.10.13 9,000 1518.33p 22.10.16 11.03.14 156,650 1467.00p 11.03.17 553,100 Total 3,542,966
139
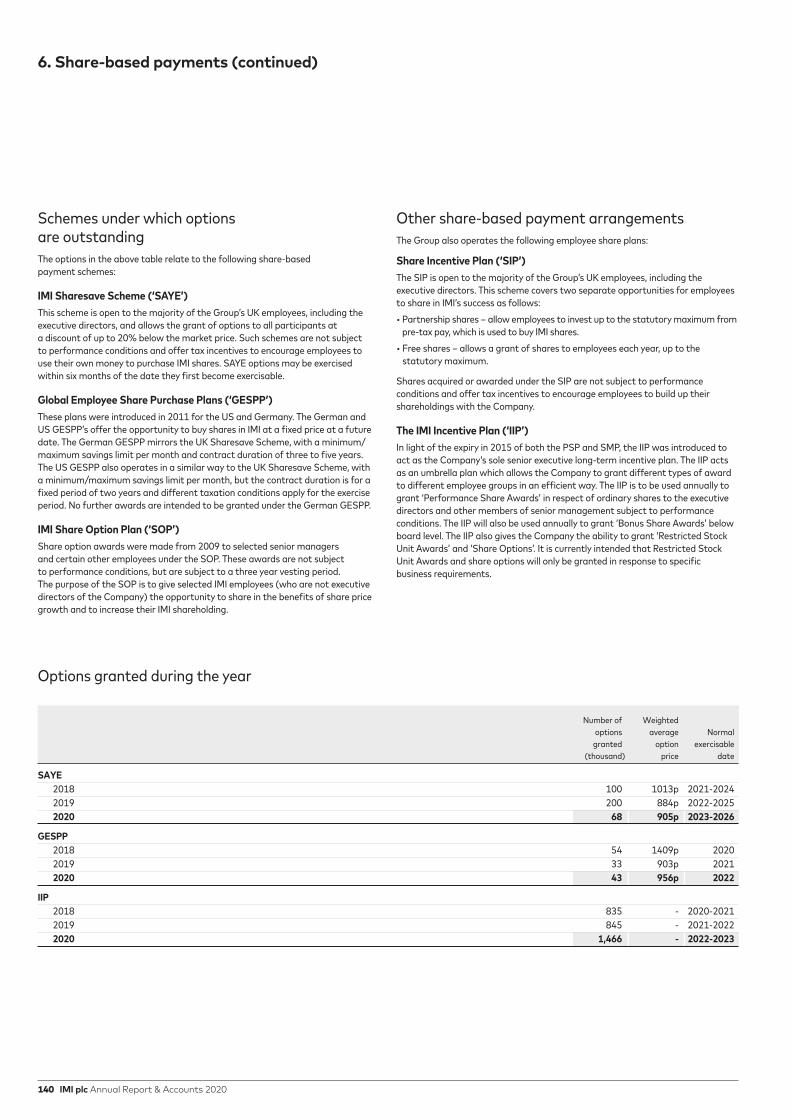
6. Share-based payments (continued)
Schemes under which options are outstanding The options in the above table relate to the following share-based payment schemes:
IMI Sharesave Scheme (‘SAYE’)This scheme is open to the majority of the Group’s UK employees, including the executive directors, and allows the grant of options to all participants at a discount of up to 20% below the market price. Such schemes are not subject to performance conditions and offer tax incentives to encourage employees to use their own money to purchase IMI shares. SAYE options may be exercised within six months of the date they first become exercisable.
Global Employee Share Purchase Plans (‘GESPP’) These plans were introduced in 2011 for the US and Germany. The German and US GESPP’s offer the opportunity to buy shares in IMI at a fixed price at a future date. The German GESPP mirrors the UK Sharesave Scheme, with a minimum/maximum savings limit per month and contract duration of three to five years. The US GESPP also operates in a similar way to the UK Sharesave Scheme, with a minimum/maximum savings limit per month, but the contract duration is for a fixed period of two years and different taxation conditions apply for the exercise period. No further awards are intended to be granted under the German GESPP.
IMI Share Option Plan (‘SOP’) Share option awards were made from 2009 to selected senior managers and certain other employees under the SOP. These awards are not subject to performance conditions, but are subject to a three year vesting period. The purpose of the SOP is to give selected IMI employees (who are not executive directors of the Company) the opportunity to share in the benefits of share price growth and to increase their IMI shareholding.
Other share-based payment arrangements The Group also operates the following employee share plans:
Share Incentive Plan (‘SIP’) The SIP is open to the majority of the Group’s UK employees, including the executive directors. This scheme covers two separate opportunities for employees to share in IMI’s success as follows:• Partnership shares – allow employees to invest up to the statutory maximum from
pre-tax pay, which is used to buy IMI shares.• Free shares – allows a grant of shares to employees each year, up to the
statutory maximum.
Shares acquired or awarded under the SIP are not subject to performance conditions and offer tax incentives to encourage employees to build up their shareholdings with the Company.
The IMI Incentive Plan (‘IIP’)In light of the expiry in 2015 of both the PSP and SMP, the IIP was introduced to act as the Company’s sole senior executive long-term incentive plan. The IIP acts as an umbrella plan which allows the Company to grant different types of award to different employee groups in an efficient way. The IIP is to be used annually to grant ‘Performance Share Awards’ in respect of ordinary shares to the executive directors and other members of senior management subject to performance conditions. The IIP will also be used annually to grant ‘Bonus Share Awards’ below board level. The IIP also gives the Company the ability to grant ‘Restricted Stock Unit Awards’ and ‘Share Options’. It is currently intended that Restricted Stock Unit Awards and share options will only be granted in response to specific business requirements.
Options granted during the year Number of Weighted options average Normal granted option exercisable (thousand) price date
SAYE 2018 100 1013p 2021-2024 2019 200 884p 2022-2025 2020 68 905p 2023-2026
GESPP 2018 54 1409p 2020 2019 33 903p 2021 2020 43 956p 2022
IIP 2018 835 - 2020-2021 2019 845 - 2021-2022 2020 1,466 - 2022-2023
140 IMI plc Annual Report & Accounts 2020

Movement in outstanding options in the year
Options granted at Options not granted at nil cost 1 nil cost 2 Total
Number of Weighted Number of Number of options Range of average options options (thousand) option prices option price (thousand) (thousand)
Outstanding at 1 January 2019 1,555 645-1518p 1162p 3,257 4,812Exercisable at 1 January 2019 1,156 645-1518p 1229p 128 1,284Granted 233 884-903p 887p 1,194 1,427Exercised 189 645-1067p 815p 655 844Lapsed 109 845-1384p 1022p 1,105 1,214Outstanding at 31 December 2019 1,490 645-1518p 1173p 2,692 4,182Exercisable at 31 December 2019 1,067 645-1518p 1264p 202 1,269
Granted 110 905-956p 925p 1,567 1,677Exercised 88 645-1467p 1046p 540 628Lapsed 546 845-1518p 1254p 671 1,217Outstanding at 31 December 2020 966 845-1518p 1098p 3,048 4,014Exercisable at 31 December 2020 586 971-1518p 1216p 167 753 1 Options not granted at nil cost include options granted under the following schemes: IMI Sharesave Scheme, Global Employee Share Purchase Plans and IMI Share
Option Plan.2 Options granted at nil cost are those granted under the Performance Share Plan, Share Matching Plan and IMI Incentive Plan.
Share-based payment charge for the year The total expense recognised for the year arising from share-based payments was £10.3m (2019: £8.8m) which comprises a charge of £13.5m (2019: £13.8m) for the year offset by a credit of £3.2m (2019: £5.0m) in respect of lapses.
£2.3m (2019: £3.5m) of the total charge and £1.0m (2019: £3.4m) of the total credit is in respect of options granted to directors.
Share-based payment valuation methodologyThe fair value of services received in return for share options granted are measured by reference to the fair value of share options granted, based on Black-Scholes and Monte Carlo option pricing models. The assumptions used for grants in 2020 included a dividend yield of 2.4% (2019: 3.7%), expected share price volatility of 28% (2019: 24%), a weighted average expected life of 3.4 years (2019: 3.3 years) and a weighted average interest rate of 0.1% (2019: 0.6%). The expected volatility is wholly based on the historical volatility (calculated based on the weighted average remaining life of the share options), adjusted for any expected changes to future volatility due to publicly available information.
Other share-based payment disclosures The weighted average remaining contractual life for the share options outstanding as at 31 December 2020 is 6.70 years (2019: 6.18 years) and the weighted average fair value of share options granted in the year at their grant date was £7.58 (2019: £8.66).
The weighted average share price at the date of exercise of share options exercised during the year was £9.29 (2019: £9.98).
141

2020 2019 Key million million
Weighted average number of shares for the purpose of basic earnings per share A 271.4 270.8Dilutive effect of employee share options 0.5 0.4Weighted average number of shares for the purpose of diluted earnings per share B 271.9 271.2
Key £m £m
Statutory profit for the year C 170.2 156.1Statutory profit from discontinued operations, net of tax - (2.8)
Continuing statutory profit for the year D 170.2 153.3Total adjusting items charges included in profit before tax 59.6 61.4Total adjusting items credits included in taxation (13.4) (16.6)
Earnings for adjusted EPS E 216.4 198.1
Key 2020 2019
Statutory EPS measures
Statutory basic EPS C/A 62.7p 57.6pStatutory diluted EPS C/B 62.6p 57.6pStatutory basic continuing EPS D/A 62.7p 56.6pStatutory diluted continuing EPS D/B 62.6p 56.5p
Adjusted EPS measures Adjusted basic EPS E/A 79.7p 73.2pAdjusted diluted EPS E/B 79.6p 73.0p
Discontinued earnings per shareStatutory basic discontinued earnings per share were £nil (2019: 1.0p). Statutory diluted discontinued earnings per share were £nil (2019: 1.0p).
Earnings per share (‘EPS’) is the amount of post-tax profit attributable to each share (excluding those held in the Employee Benefit Trust or by the Company). Basic EPS measures are calculated as the Group profit for the year attributable to equity shareholders divided by the weighted average number of shares in issue during the year. Diluted EPS takes into account the dilutive effect of all outstanding share options priced below the market price, in arriving at the number of shares used in its calculation.
Both of these measures are also presented on an adjusted basis, to assist the reader of the financial statements to get a better understanding of the performance of the Group. The note below demonstrates how this calculation has been performed.
7. Earnings per ordinary share
142 IMI plc Annual Report & Accounts 2020
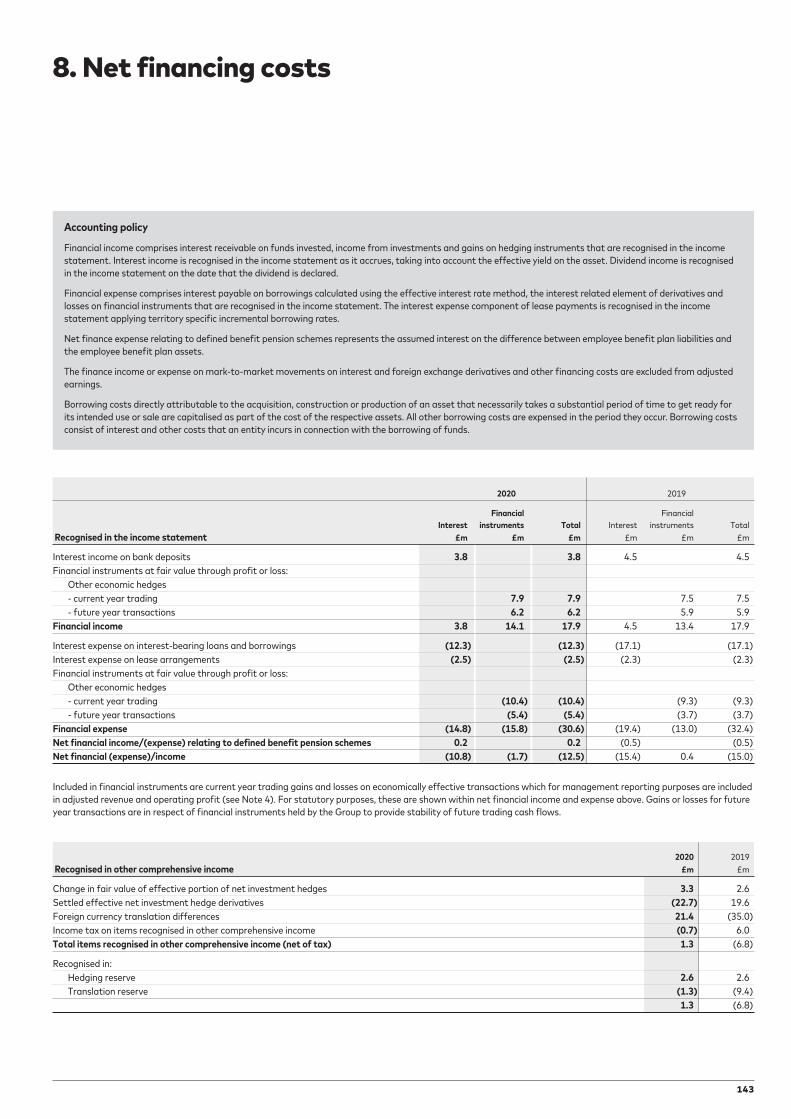
8. Net financing costs
Accounting policy
Financial income comprises interest receivable on funds invested, income from investments and gains on hedging instruments that are recognised in the income statement. Interest income is recognised in the income statement as it accrues, taking into account the effective yield on the asset. Dividend income is recognised in the income statement on the date that the dividend is declared.
Financial expense comprises interest payable on borrowings calculated using the effective interest rate method, the interest related element of derivatives and losses on financial instruments that are recognised in the income statement. The interest expense component of lease payments is recognised in the income statement applying territory specific incremental borrowing rates.
Net finance expense relating to defined benefit pension schemes represents the assumed interest on the difference between employee benefit plan liabilities and the employee benefit plan assets.
The finance income or expense on mark-to-market movements on interest and foreign exchange derivatives and other financing costs are excluded from adjusted earnings.
Borrowing costs directly attributable to the acquisition, construction or production of an asset that necessarily takes a substantial period of time to get ready for its intended use or sale are capitalised as part of the cost of the respective assets. All other borrowing costs are expensed in the period they occur. Borrowing costs consist of interest and other costs that an entity incurs in connection with the borrowing of funds.
2020 2019
Financial Financial Interest instruments Total Interest instruments Total Recognised in the income statement £m £m £m £m £m £m
Interest income on bank deposits 3.8 3.8 4.5 4.5 Financial instruments at fair value through profit or loss: Other economic hedges - current year trading 7.9 7.9 7.5 7.5 - future year transactions 6.2 6.2 5.9 5.9 Financial income 3.8 14.1 17.9 4.5 13.4 17.9
Interest expense on interest-bearing loans and borrowings (12.3) (12.3) (17.1) (17.1)Interest expense on lease arrangements (2.5) (2.5) (2.3) (2.3)Financial instruments at fair value through profit or loss: Other economic hedges - current year trading (10.4) (10.4) (9.3) (9.3) - future year transactions (5.4) (5.4) (3.7) (3.7)Financial expense (14.8) (15.8) (30.6) (19.4) (13.0) (32.4)Net financial income/(expense) relating to defined benefit pension schemes 0.2 0.2 (0.5) (0.5)Net financial (expense)/income (10.8) (1.7) (12.5) (15.4) 0.4 (15.0)
Included in financial instruments are current year trading gains and losses on economically effective transactions which for management reporting purposes are included in adjusted revenue and operating profit (see Note 4). For statutory purposes, these are shown within net financial income and expense above. Gains or losses for future year transactions are in respect of financial instruments held by the Group to provide stability of future trading cash flows.
2020 2019 Recognised in other comprehensive income £m £m
Change in fair value of effective portion of net investment hedges 3.3 2.6 Settled effective net investment hedge derivatives (22.7) 19.6Foreign currency translation differences 21.4 (35.0) Income tax on items recognised in other comprehensive income (0.7) 6.0Total items recognised in other comprehensive income (net of tax) 1.3 (6.8)
Recognised in: Hedging reserve 2.6 2.6 Translation reserve (1.3) (9.4) 1.3 (6.8)
143

IMI operates through subsidiary companies all around the world that pay many different taxes such as corporate income taxes, VAT, payroll withholdings, social security contributions, customs import and excise duties. This note aggregates only those corporate income taxes that are or will be levied on the individual profits of IMI plc and its subsidiary companies for periods leading up to and including the balance sheet date. The profits of each company are subject to certain adjustments as specified by applicable tax laws in each country to arrive at the tax liability that is expected to result on its tax returns. Where these adjustments have future tax impact then deferred taxes may also be recorded.
Accounting policy
Current tax payable/receivable represents the expected tax payable/ receivable on the taxable income for the year, using tax rates enacted or substantively enacted at the balance sheet date and taking into account any adjustments in respect of prior years.
Deferred tax is provided, using the balance sheet method, on temporary differences between the carrying amounts of assets and liabilities for financial reporting purposes and the amounts used for taxation purposes. Deferred tax is not recognised for the following temporary differences: the initial recognition of goodwill, the initial recognition of assets or liabilities in a transaction that is not a business combination and that affects neither accounting nor taxable profit, and differences relating to investments in subsidiaries to the extent that the timing of the reversal of the differences can be controlled and it is probable that the differences will not reverse in the foreseeable future. Deferred tax is measured at the tax rates that are expected to apply when the temporary differences reverse, based on the tax laws that have been enacted or substantively enacted by the balance sheet date.
A deferred tax asset is recognised to the extent that it is probable that future taxable profit will be available against which the temporary difference can be utilised.
Tax governance, risk and strategyIMI recognises its corporate responsibility to ensure that all businesses within the IMI Group follow responsible tax practices to enhance long-term shareholder value whilst also contributing to the public expenditure and the overall welfare of the communities in which it operates. Accordingly, the IMI Tax Policy sets the core principles of compliance, fairness, value and transparency for the management of the Group’s tax affairs.
This Policy has been approved by the Board, fully communicated to subsidiary businesses and is reviewed to ensure responsible business practices across the Group are maintained. The Group Finance Director has primary responsibility for all tax matters and keeps the Board appraised of any significant issues or changes to the Tax Policy. A robust tax governance framework has also been established under which the Executive Committee and the IMI Board are appraised on a regular basis of any material or significant tax matters, so that appropriate action can be effected. Through the IMI Global Intranet, the Group communicates policies, procedures, guidance and best practices to improve the management of taxation across its subsidiary companies worldwide.
Compliance: IMI pays and collects significant amounts of taxes around the world as a result of its business activities. It seeks to manage its taxation obligations worldwide in compliance with all applicable tax laws and regulations, as well as fully in line with the Group’s Code of Conduct. Accordingly, the tax contribution by the individual businesses is monitored and robust standard tax compliance processes operate together with appropriate financial controls to ensure that all tax returns are complete, accurate and filed on a timely basis with the tax authorities around the world and the declared taxes paid on time. Furthermore, the preparation and filing of the corporate income tax returns for IMI subsidiary companies worldwide have been largely outsourced to one tax advisory firm.
Tax laws are often complex, which can lead to inconsistent interpretations by different stakeholders. Where this occurs, IMI may reduce uncertainty and controversy through various actions, including proactive discussion with the fiscal authorities to obtain early resolution and securing external tax advice to ensure the robust interpretation of tax laws and practices.
The Group Tax Policy is fully aligned with the Group’s Code of Conduct, which requires the Group and its employees and agents to act in compliance with applicable laws and with fairness and integrity in all of its business dealings. IMI has a zero-tolerance approach to tax evasion and the facilitation of tax evasion. UK legislation regarding third party tax evasion has also been incorporated into the Group’s prevention procedures, including employee training.
Fairness: IMI seeks to record its profits across the subsidiary companies around the world on an arm’s length basis in accordance with internationally accepted best practices, recognising the relative contributions of people, assets, intellectual property and risks borne by the various businesses. The resulting allocation of profits is regularly tested for compliance with this standard.
IMI has taken action to ensure that it meets the enhanced transfer pricing disclosures and documentation requirements by tax authorities as a result of the Base Erosion & Profit Shifting (commonly referred to as BEPS) initiative by the OECD.
Value: IMI manages the impact of taxation on its businesses in a responsible manner by only adopting legitimate and commercial positions. In doing so, the Group may make use of legitimate tax incentives, exemptions and statutory alternatives offered by governments and will look to ensure that it is not taxed more than once on the same profit. As a UK headquartered group, IMI’s profits are ultimately subject to UK taxation, although as the Group pays significant taxes overseas, the overall effective tax rate for the Group is marginally above the UK statutory tax rate.
Transparency: IMI aims to build positive working relationships with tax authorities by co-operating in a constructive, open and timely manner. IMI seeks to disclose its tax affairs in its published accounts and taxation returns fully in accordance with the applicable standards and, where appropriate, will supplement its tax disclosures with further information to better inform, and to be transparent to, its stakeholders.
Risk: IMI engages external support to manage tax risks and achieve the strategic objectives outlined above. Tax risks are regularly assessed for all companies within the Group, promptly addressed and reported so that they may be appropriately provided and disclosed in the relevant accounts and tax returns. To the extent that identified tax risks are material they will be reported to the Executive Committee through the Group’s process for strategic risk management as described on page 58.
UK corporation taxThe rate of corporation tax in the UK for the 2020 calendar year was 19.0% (2019: 19.0%). In the Spring Budget of 2020, the UK Government announced that from 1 April 2020 the UK corporation tax rate would remain at 19%, rather than reducing to a rate of 17%, as had been previously substantively enacted. This new law was substantively enacted on 17 March 2020. UK deferred tax assets and liabilities have therefore been calculated using a rate of 19% (2019: 17%).
9. Taxation
144 IMI plc Annual Report & Accounts 2020

Tax paymentsDuring the year, the Group made payments of corporate income tax of £41.0m (2019: £40.2m), principally arising as follows:
Jurisdiction of companies making corporate income tax payments:
There is normally an element of volatility in the annual payments of corporate income taxes due to the timing of assessments, acquisition and disposals, adjusting items and payments on account in the many countries in which the Group operates. Changes in the jurisdictions in which profits are earned can have an impact on cash flow levels which may take time to be reflected in the tax cash flow.
The level of payments made during 2020 increased slightly compared to 2019. UK payments increased significantly due to a change in rules regarding the timing of payments. Italy payments decreased partly due to obtaining tax credits on patents and R&D. Germany continued to recover tax debtors. Other territorial movements in payments largely reflect shifts in trading performance.
In addition, the Group makes substantial other tax payments relating to employment, consumption, procurement and investment to local authorities around the world.
Recognised in the income statementThis section sets out the current and deferred tax charges, which together comprise the total tax charge in the income statement.
2020 2019 £m £m
Current tax charge Current year charge 43.9 41.4Adjustments in respect of prior years 2.7 0.4 46.6 41.8Deferred taxation Origination and reversal of temporary differences (2.5) (5.8)Total income tax charge 44.1 36.0
The above income tax charge is apportioned between continuing and discontinued operations in the income statement as follows:
2020 2019 £m £m
Current tax charge Continuing operations 46.6 41.8
Deferred tax credit Continuing operations (2.5) (5.8)
Total income tax charge Continuing operations 44.1 36.0
South Korea £1.7m
Japan £1.2m
UK £13.9m
UK £19.5m
US £4.2m
Other £4.6m
Other £4.4m
Singapore £1.2mSwitzerland £1.8m
Japan £2.2m
Germany £1.4m
Czech £1.4m
Switzerland £3.4mItaly £(0.1)m
Austria £0.8m
Singapore £1.9m
Sweden £0.9m
Czech £1.2m
Australia £1.0m
Austria £1.1m
China £1.1m
South Korea £1.0mSweden £0.9mAustralia £0.6mChina £0.3m
US £(0.6)m
Germany £3.3m
Italy £6.9m
2019 £40.2m
2020 £41.0m
145

Reconciliation of effective tax rateAs IMI's head office and parent company is domiciled in the UK, the Group references its effective tax rate to the UK corporation tax rate, despite only a small portion of the Group's business being in the UK. Therefore, the following tax reconciliation applies the UK corporation tax rate for the year to profit before tax, both before and after adjusting items. The resulting tax charge is reconciled to the actual tax charge for the Group, by taking account of specific tax adjustments as follows:
2020 2019
Adjusting Adjusting Adjusted items Statutory Adjusted items Statutory Note £m £m £m £m £m £m
Profit before tax from continuing operations 273.9 (59.6) 214.3 250.7 (61.4) 189.3 Profit before tax from discontinued operations 28 2.8 2.8 Profit before tax 273.9 (59.6) 214.3 250.7 (58.6) 192.1
Income tax using the Company's domestic rate of tax of 19.0% (2019: 19.0%) 52.0 (11.3) 40.7 47.6 (11.1) 36.5 Effects of: Non-deductible items 0.8 0.2 1.0 0.7 0.2 0.9 Non taxable impairment/loss on disposal of businesses/discontinued operations (0.5) (0.5) Utilisation of losses on which no deferred tax had been recognised (0.3) (0.3) (0.5) (0.5) Current year losses for which no deferred tax asset has been recognised 0.2 0.1 0.3 0.2 0.2 Recognition of deferred tax asset on previously unprovided timing differences (8.1) (8.1) (1.8) (1.8) Change in future tax rate on deferred tax 6.5 6.5 Differing tax rates 4.2 (2.4) 1.8 6.1 (5.2) 0.9 Under provided in prior years 2.2 2.2 0.3 0.3 Total tax in income statement 57.5 (13.4) 44.1 52.6 (16.6) 36.0 Income tax expense reported in the consolidated income statement 57.5 (13.4) 44.1 52.6 (16.6) 36.0 Effective rate of tax – continuing operations: 21.0% 20.6% 21.0% 19.0%Income tax attributable to discontinued operations 28 Effective rate of tax – discontinued operations: Total tax in income statement 57.5 (13.4) 44.1 52.6 (16.6) 36.0 Effective rate of tax – total Group: 21.0% 21.0%
9. Taxation (continued)
Recognised outside of the income statementIn addition to amounts charged to the income statement, some current tax and deferred tax is (credited)/charged directly to equity or through other comprehensive income, which can be analysed as follows:
2020 2019 £m £m
Deferred tax: On equity-settled transactions (0.4) - On re-measurement gains and on defined benefit plans 2.1 (0.1) Effect of rate change on previously recognised items (5.7) - On change in value of effective net investment hedge derivatives - (2.0) (4.0) (2.1)
Current tax: On change in value of effective net investment hedge derivatives 0.7 (4.0) On equity-settled transactions 0.4 0.2 (2.9) (5.9)
Of which the following amounts are charged/(credited): to the statement of comprehensive income (2.8) (6.1) to the statement of changes in equity - 0.2 (2.8) (5.9)
146 IMI plc Annual Report & Accounts 2020

Recognised deferred tax assets and liabilitiesDeferred taxes record the tax consequences of temporary differences between the accounting and taxation recognition of certain items, as explained below:
Assets Liabilities Net
2020 2019 2020 2019 2020 2019 £m £m £m £m £m £m
Non-current assets 7.5 5.2 (38.8) (36.6) (31.3) (31.4)Inventories 4.3 3.6 (2.2) (2.2) 2.1 1.4Revaluation of derivatives - 0.4 (1.1) (1.0) (1.1) (0.6)Employee benefits and provisions 39.0 36.0 (18.1) (12.4) 20.9 23.6Other tax assets 11.8 1.7 - - 11.8 1.7
62.6 46.9 (60.2) (52.2) 2.4 (5.3)Offsetting within tax jurisdictions (26.3) (24.7) 26.3 24.7 - -Total deferred tax assets and liabilities 36.3 22.2 (33.9) (27.5) 2.4 (5.3)
The movement in the net deferred tax balances has been recognised in the financial statements as analysed below:
Recognised Recognised in the outside the Balance at income income Balance at 1 Jan 20 statement statement Exchange 31 Dec 20 £m £m £m £m £m
Non-current assets (31.4) (0.6) 0.7 (31.3)Inventories 1.4 0.7 2.1Revaluation of derivatives (0.6) (0.5) (1.1)Employee benefits and provisions 23.6 (7.2) 4.0 0.5 20.9Other tax assets 1.7 10.1 11.8Net deferred tax (liability)/asset (5.3) 2.5 4.0 1.2 2.4
Recognised Recognised in the outside the Balance at income income Balance at 1 Jan 19 statement statement Exchange 31 Dec 19 £m £m £m £m £m
Non-current assets (33.9) 1.5 1.0 (31.4)Inventories 1.1 0.3 1.4 Revaluation of derivatives (2.9) 0.3 2.0 (0.6)Employee benefits and provisions 21.7 2.5 0.1 (0.7) 23.6 Other tax assets 1.2 1.2 (0.7) 1.7 Net deferred tax (liability)/asset (12.8) 5.8 2.1 (0.4) (5.3)
All exchange movements are taken through the translation reserve.
Unrecognised deferred tax assets and liabilitiesDeferred tax assets of £40.6m (2019: £48.4m) have not been recognised in respect of tax losses of £65.2m (2019: £62.2m), interest of £nil (2019: £37.3m) and capital losses of £118.9m (2019: £117.3m). A deferred tax asset of £10.3m (2019: £nil) has been recognised in respect of surplus interest following a review. This is reflected in the Other tax assets movement in the table above. The majority of the tax losses have no expiry date. No deferred tax asset has been recognised for these temporary differences due to the uncertainty over their offset against future taxable profits and therefore their recoverability. In some instances, these balances are also yet to be accepted by the tax authorities and could be challenged in the event of an audit.
It is likely that the majority of unremitted earnings of overseas subsidiaries would qualify for the UK dividend exemption. However, £94.4m (2019: £35.3m) of those earnings may still result in a tax liability principally as a result of withholding taxes levied by the overseas jurisdictions in which those subsidiaries operate. These tax liabilities are not expected to exceed £7.2m (2019: £3.8m) of which £3.3m (2019: £3.3m) has been provided on the basis that the Group expects to remit these amounts.
147
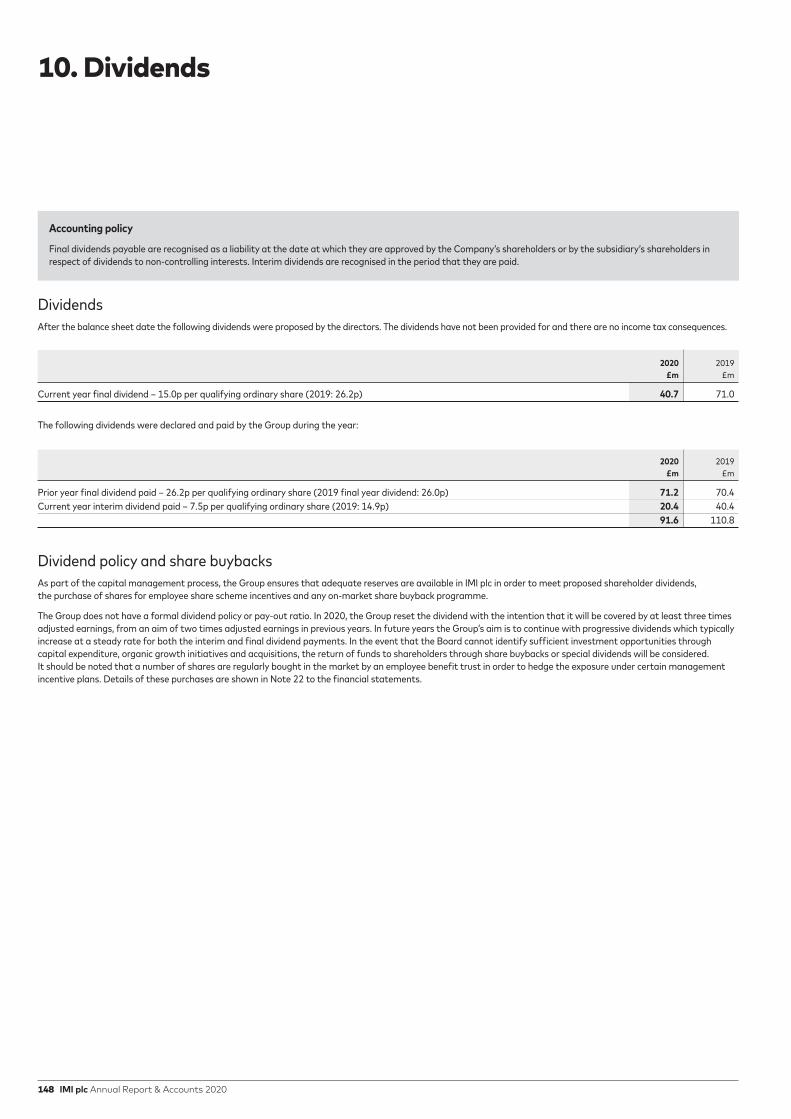
Accounting policy
Final dividends payable are recognised as a liability at the date at which they are approved by the Company’s shareholders or by the subsidiary’s shareholders in respect of dividends to non-controlling interests. Interim dividends are recognised in the period that they are paid.
DividendsAfter the balance sheet date the following dividends were proposed by the directors. The dividends have not been provided for and there are no income tax consequences.
2020 2019 £m £m
Current year final dividend – 15.0p per qualifying ordinary share (2019: 26.2p) 40.7 71.0 The following dividends were declared and paid by the Group during the year:
2020 2019 £m £m
Prior year final dividend paid – 26.2p per qualifying ordinary share (2019 final year dividend: 26.0p) 71.2 70.4Current year interim dividend paid – 7.5p per qualifying ordinary share (2019: 14.9p) 20.4 40.4 91.6 110.8
Dividend policy and share buybacksAs part of the capital management process, the Group ensures that adequate reserves are available in IMI plc in order to meet proposed shareholder dividends, the purchase of shares for employee share scheme incentives and any on-market share buyback programme.
The Group does not have a formal dividend policy or pay-out ratio. In 2020, the Group reset the dividend with the intention that it will be covered by at least three times adjusted earnings, from an aim of two times adjusted earnings in previous years. In future years the Group’s aim is to continue with progressive dividends which typically increase at a steady rate for both the interim and final dividend payments. In the event that the Board cannot identify sufficient investment opportunities through capital expenditure, organic growth initiatives and acquisitions, the return of funds to shareholders through share buybacks or special dividends will be considered. It should be noted that a number of shares are regularly bought in the market by an employee benefit trust in order to hedge the exposure under certain management incentive plans. Details of these purchases are shown in Note 22 to the financial statements.
10. Dividends
148 IMI plc Annual Report & Accounts 2020

11. Intangible assets
Accounting policy
Intangible assets are disclosed as acquired intangible assets and non-acquired intangible assets. Amortisation of acquired intangible assets is treated as an adjusting item as described in Note 3 of these accounting policies, because of its inherent volatility.
i. Goodwill Goodwill is initially measured at cost being the excess of the aggregate of the acquisition-date fair value of the consideration transferred over the net
identifiable amounts of the assets acquired and the liabilities assumed for the business combination. After initial recognition, goodwill is measured at cost less any accumulated impairment losses. The value of the goodwill can arise from a number of sources, but in relation to our more recent acquisitions, it has been represented by post-acquisition synergies and the skills and knowledge of the workforce.
ii. Research and Development Expenditure on research activities, undertaken with the prospect of gaining new scientific or technical knowledge and understanding, is recognised in the income
statement as an expense as incurred.
Expenditure on development activities, whereby research findings are applied to a plan or design for the production of new or substantially improved products and processes, is capitalised provided benefits are probable, cost can be reliably measured and if, and only if, the product or process is technically and commercially feasible and the Group has sufficient resources and intention to complete development. The expenditure capitalised includes the cost of materials, direct labour and directly attributable overheads. Other development expenditure is recognised in the income statement as an expense as incurred. Capitalised development expenditure is stated at cost less accumulated amortisation (see below) and impairment losses (see accounting policy ‘Impairment’) and is included in the other acquired or other non-acquired category of intangible assets depending on its origin.
iii. Software development costs Software applications and systems that are not an integral part of their host computer equipment are capitalised on initial recognition as intangible assets at
cost. Cost comprises the purchase price plus directly attributable costs incurred on development of the asset to bring it into use. Following initial recognition, software development costs are carried at cost less any accumulated amortisation (see below) and accumulated impairment losses (see accounting policy ‘Impairment’) and are included in the other acquired or other non-acquired category of intangible assets depending on their origin.
iv. Customer relationships and other acquired intangible assets Customer relationships and other intangible assets that are acquired by the Group as part of a business combination are stated at their fair value calculated by
reference to the net present value of future benefits accruing to the Group from utilisation of the asset, discounted at an appropriate discount rate. Expenditure on other internally generated intangible assets is recognised in the income statement as an expense as incurred.
v. Amortisation of intangible assets other than goodwill Amortisation is charged to the income statement on a straight-line basis (other than for customer relationships and order book, which are charged on a sum
of digits basis) over the estimated useful lives of the intangible assets. Amortisation commences from the date the intangible asset becomes available for use. The estimated useful lives are:
• Capitalised development costs are the life of the intangible asset (usually a maximum of 15 years) • Software development costs are the life of the intangible asset (up to 10 years) • Customer relationships are the life of the intangible asset (up to 10 years) • Other intangible assets (including order books, brands and software) are the life of the intangible asset (up to 10 years)
The Group splits its intangible assets between those arising on acquisitions and those which do not, because the amortisation of acquired intangibles is recognised as an adjusting item in the income statement.
149

11. Intangible assets (continued)
Analysis of intangible assets
Non-acquired Acquired Other Total Other non- intangibles customer acquired acquired acquired under Goodwill relationships intangibles intangibles intangibles* construction Total £m £m £m £m £m £m £m
CostAs at 1 January 2019 475.5 236.6 122.3 834.4 143.6 17.3 995.3Exchange adjustments (20.9) (12.0) (5.8) (38.7) (8.1) (0.3) (47.1)Acquisitions 25.8 15.7 13.3 54.8 - - 54.8Additions - - - - 7.6 11.2 18.8Transfers from assets in the course of construction - - - - 12.6 (12.6) -Disposals - - - - (0.8) - (0.8)
As at 31 December 2019 480.4 240.3 129.8 850.5 154.9 15.6 1,021.0Exchange adjustments 7.0 3.7 2.5 13.2 5.8 0.5 19.5Additions - - - - 5.6 7.2 12.8Transfers from assets in the course of construction - - - - 13.5 (13.5) -Disposals - - - - (9.6) - (9.6)As at 31 December 2020 487.4 244.0 132.3 863.7 170.2 9.8 1,043.7
Amortisation As at 1 January 2019 38.3 180.5 99.4 318.2 70.4 - 388.6Exchange adjustments (2.0) (9.3) (4.5) (15.8) (4.6) - (20.4)Disposals - - - - (0.5) - (0.5)Amortisation for year - 15.2 4.3 19.5 15.0 - 34.5
As at 31 December 2019 36.3 186.4 99.2 321.9 80.3 - 402.2Exchange adjustments 1.6 4.1 3.1 8.8 3.0 - 11.8Disposals - - - - (9.4) - (9.4)Impairment - - - - 4.3 4.3Amortisation for year - 14.3 4.4 18.7 16.3 - 35.0As at 31 December 2020 37.9 204.8 106.7 349.4 94.5 - 443.9Net book value at 31 December 2019 444.1 53.9 30.6 528.6 74.6 15.6 618.8Net book value at 31 December 2020 449.5 39.2 25.6 514.3 75.7 9.8 599.8
Goodwill impairment testing
Accounting policy
For the purpose of impairment testing goodwill acquired in a business combination is, from the acquisition date, allocated to each of the Group’s cash-generating units (or groups of ’CGUs’). The composition of CGUs reflects both the way in which cash inflows are generated and the internal reporting structure. Where our businesses operate closely with each other we will continue to review whether they should be treated as a single CGU. Each unit or group of units to which goodwill is allocated represents the lowest level within the entity at which the goodwill is monitored for internal management purposes and shall not be larger than an operating segment before aggregation.
Where goodwill forms part of a CGU and part of the operation within that unit is disposed of, the goodwill associated with the operation disposed of is included in the carrying amount of the operation when determining the gain or loss on disposal of the operation. Goodwill disposed of in this circumstance is measured based on the relative values of the operation disposed of and the portion of the CGU retained.
Impairment – the carrying values of the Group’s non-financial assets other than inventories and deferred tax assets, are reviewed at each balance sheet date to determine whether impairment indicators exist.
If indicators exist, the recoverable amount of the asset or all assets within its CGU is estimated. An impairment loss is recognised whenever the carrying amount of an asset or its CGU unit exceeds its recoverable amount. Impairment losses are recognised in the income statement.
For goodwill and assets that are not yet available for use, the recoverable amount is evaluated at each balance sheet date.
The recoverable amount of non-financial assets is the greater of their fair value less costs to sell and value in use. In assessing value in use, an individual assessment is made of the estimated future cash flows generated for each CGU derived from the Group’s long-term forecasts for the next five years. These are discounted to their present value using a pre-tax discount rate that reflects current market assessments of the time value of money and the risks specific to the asset.
* Other non-acquired intangibles includes capitalised development costs with a carrying value of £40.1m (2019: £36.4m) and capitalised software costs with a carrying value of £35.6m (2019: £38.2m).
150 IMI plc Annual Report & Accounts 2020

Management believe that this approach, including the use of the indefinite cash flow projection, is appropriate based upon both historical experience and because it is one of the bases management utilise to evaluate the fair value of investment opportunities. For an asset that does not generate largely independent cash inflows, the recoverable amount is determined for the smallest cash generating unit to which the asset belongs.
Reversals of impairment Impairments of goodwill or available for sale financial assets are non-reversible. In respect of other assets, an impairment loss is reversed if at the balance sheet
date there are indications that the loss has decreased or no longer exists following a change in the estimates used to determine the recoverable amount. An impairment loss is reversed only to the extent that the asset’s carrying amount does not exceed the carrying amount that would have been determined, net of depreciation or amortisation, if no impairment loss had been recognised.
Key estimate
The value in use is based on a discounted cash flow model. The principal key estimate reflects the combination of assumptions used in these calculations, including the long-term growth rates and the discount rate applied to forecast cash flows in addition to the achievement of the forecasts themselves. The assessments performed were materially insensitive to changes in the underlying growth and discount rate assumptions which were not significantly revised in the current year. Further information on the assumptions adopted for material cash generating units and the assets affected is included below.
The Group has 12 (2019: 19) cash generating units to which goodwill is allocated. Following management’s assessment during the year, the grouping of the CGUs, as defined for the purpose of goodwill testing, has been changed to reflect the re-organisation of the divisional structures as shown in Note 4, principally in IMI Precision Engineering with the new Motion Control, Fluid Technologies & Commercial Vehicles sectors and in IMI Critical Engineering with a new regional structure.
The recoverable amount of a CGU is the higher of its fair value less costs to sell and its value in use. Value in use is determined using cash flow projections from financial budgets, forecasts and plans approved by the Board covering a five-year period and include a terminal value multiple. The projected cash flows reflect the latest expectation of demand for products and services.
The key assumptions in these calculations are the long-term growth rates and the discount rates applied to forecast cash flows in addition to the achievement of the forecasts themselves. Long-term growth rates are based on long-term economic forecasts for growth in the manufacturing sector in the geographical regions in which the cash generating unit operates. Pre-tax discount rates specific to each cash generating unit are calculated by adjusting the Group post-tax weighted average cost of capital (‘WACC’) of 7% (2019: 7%) for the tax rate relevant to the jurisdiction before adding risk premia for the size of the unit, the characteristics of the segment in which it resides, and the geographical regions from which the cash flows are derived.
This exercise resulted in the use of the following ranges of values for the key assumptions:
2020 2019 % %
Pre-tax, pre-risk adjusted discount rate 9.2 – 10.7 8.3 – 11.0Long-term growth rate 1.3 – 2.1 0.7 – 2.0
For the purpose of assessing the significance of CGUs, the Group uses a threshold of 10% of the total goodwill balance. The recoverable amount of the CGUs is determined from a value in use calculation and the key assumptions used in this calculation are the discount rate, growth rate and operating cashflows.
These estimates are determined using the methodology discussed above and for those CGUs considered to be significant, outlined in the table adjacent:
Sensitivity to changes in assumptions
The principal key estimate reflects the combination of assumptions used, including the long-term growth rates and the discount rate applied to forecast cash flows in addition to the achievement of the forecasts themselves.
The Directors do not consider that any reasonably possible changes to the key assumptions would cause the carrying amount to exceed the recoverable amount of the CGU.
Forecast cash flows – decreased demand can lead to a decline in the forecast cash flows used to assess goodwill impairment. A decrease of 33% in the forecast cash flows of Petrochemical & Isolation would result in impairment. A decrease of 79% in the forecast cash flows of Control Valves would result in impairment. A decrease of 48% in the forecast cash flows of Precision Americas – Fluid Technologies would result in impairment.
Discount rates – a rise in the pre-tax discount rate to 15.3% (i.e. +4.4%) in Petrochemical & Isolation would result in impairment. A rise in the pre-tax discount rate to 46.0% (i.e. +35.1%) in Control Valves would result in impairment. A rise in the pre-tax discount rate to 21.8% (i.e. +9.6%) in Precision Americas – Fluid Technologies would result in impairment.
Growth rates – a decline in the growth rate to -4.7% (i.e. -6.8%) in Petrochemical & Isolation would result in impairment. A decline in the growth rate to -19.1% (i.e. -20.9%) in Precision Americas – Fluid Technologies would result in impairment. A significant decline in the growth rate would be required before Control Valves goodwill would require an impairment.
No other CGUs have goodwill that is considered significant in the context of the Group's total goodwill balance, nor do any CGUs use the same key assumptions for the purposes of impairment testing in either this year or the last.
The aggregate amount of goodwill arising from acquisitions prior to 1 January 2004 which had been deducted from the profit and loss reserves and incorporated into the IFRS transitional balance sheet as at 1 January 2004, amounted to £364m. The cumulative impairment recognised in relation to goodwill is £41m (2019: £41m).
2020 Goodwill£m
Discount rate
%
Growth rate
%
IMI Critical – Petrochemical & Isolation 117.1 10.9 2.1
IMI Critical – Control Valves 94.0 10.9 2.1
IMI Precision Americas – Fluid Technologies 58.1 12.2 1.8
2019
IMI Critical – Petrochemical & Isolation 113.3 9.4 2.0
IMI Critical – Control Valves 90.2 9.4 2.0
IMI Precision Americas – Fluid Technologies 60.4 10.5 1.6
151

This note details the physical assets used by the Group to generate revenues and profits, in addition to those disclosed in Note 13. These assets include manufacturing, distribution and office sites, and equipment used in the manufacture of the Group’s products. The cost of these assets represents the amount initially paid for them.
Accounting policy
Freehold land and assets in the course of construction are not depreciated.
Items of property, plant and equipment are stated at cost less accumulated depreciation (see below) and impairment losses (see Note 11).
Where an item of property, plant and equipment comprises major components having different useful lives, they are accounted for as separate items of property, plant and equipment. Costs in respect of tooling owned by the Group for clearly identifiable new products are capitalised net of any contribution received from customers and are included in plant and equipment.
Depreciation is charged to the income statement, from the date the asset is brought in to use, on a straight-line basis (unless such a basis is not aligned with the anticipated benefit) so as to write down the cost of assets to residual values over the period of their estimated useful lives within the following ranges:
– Freehold buildings – 25 to 50 years – Plant and equipment – 3 to 20 years
Assets in the course of construction comprise assets which are not currently ready to be brought in to use. Assets under construction are not depreciated.
If there has been a technological change or decline in business performance the directors review the value of the assets to ensure they have not fallen below their depreciated value. If an asset’s value falls below its depreciated value, a one-off impairment charge is made against profit.
Assets in the Land & Plant & course of buildings equipment construction Total £m £m £m £m
Cost As at 1 January 2019 194.0 687.5 19.2 900.7Exchange adjustments (9.8) (31.5) (1.2) (42.5)Acquisitions 2.0 2.1 1.1 5.2Additions 6.6 18.2 22.2 47.0Transfers from assets in the course of construction 5.9 15.5 (21.4) -Disposals (18.8) (23.0) (0.3) (42.1)As at 31 December 2019 179.9 668.8 19.6 868.3
Exchange adjustments 6.0 16.6 1.0 23.6Additions 1.6 17.7 18.6 37.9Transfers from assets in the course of construction 3.1 18.7 (21.8) -Disposals (1.0) (23.6) (0.5) (25.1)As at 31 December 2020 189.6 698.2 16.9 904.7
Depreciation As at 1 January 2019 105.8 510.5 - 616.3Exchange adjustments (5.3) (24.6) - (29.9)Disposals (13.9) (21.4) - (35.3)Impairment charge - 1.5 - 1.5Depreciation 3.8 40.6 - 44.4As at 31 December 2019 90.4 506.6 - 597.0
Exchange adjustments 3.1 15.3 - 18.4Disposals (0.5) (22.3) - (22.8)(Reversal of impairment)/Impairment charge (0.4) 0.1 - (0.3)Depreciation 4.4 42.0 - 46.4As at 31 December 2020 97.0 541.7 - 638.7NBV at 31 December 2019 89.5 162.2 19.6 271.3NBV at 31 December 2020 92.6 156.5 16.9 266.0
A net reversal of impairment of £0.3m relating to continuing operations occurred during the year (2019: £1.5m charge). The recoverable amount of these assets has been determined using their fair value less costs to sell, estimated by both internal and external valuation specialists.
Group contracts in respect of future capital expenditure which had been placed at the balance sheet date relating to the continuing business amounted to £5.6m (2019: £12.3m).
12. Property, plant and equipment
152 IMI plc Annual Report & Accounts 2020

Accounting policy
The Group leases various properties, plant, equipment and cars. Rental contracts are negotiated individually and have a range of initial terms and may have extension options. The lease agreements do not impose any covenants, but leased assets may not be used as security for borrowing purposes.
Leases are recognised as a right-of-use asset and a corresponding liability at the date at which the leased asset is available for use by the Group. Each lease payment is allocated between the liability and finance cost. The finance cost is charged to the income statement over the lease period so as to produce a constant periodic rate of interest on the remaining balance of the liability for each period. The right-of-use asset is depreciated over the shorter of the asset's useful life and the lease term on a straight-line basis.
Assets and liabilities arising from a lease are initially measured on a present value basis. Lease liabilities include the net present value of: i. fixed payments less any lease incentives receivable; ii. variable lease payments that are based on an index or a rate; iii. amounts expected to be payable by the Group under residual value guarantees; iv. the exercise price of a purchase option if the Group is reasonably certain to exercise that option; and v. payments of penalties for terminating the lease, if the lease term reflects the Group exercising that option.
The lease payments are discounted using the interest rate implicit in the lease. If that rate cannot be determined, the entity’s incremental borrowing rate is used, being the rate that the entity would have to pay to borrow the funds necessary to obtain an asset of similar value in a similar economic environment with similar terms and conditions.
Right-of-use assets are measured at cost comprising:
i. the amount of the initial measurement of lease liability;
ii. any lease payments made at or before the commencement date less any lease incentives received; and
iii. restoration costs.
Payments associated with short-term leases and leases of low-value assets are recognised on a straight-line basis as an expense in profit or loss. Short-term leases are leases with a lease term of 12 months or less. Low-value assets comprise IT-equipment and small items of office furniture.
Extension and termination options – extension and termination options are included in a number of property and equipment leases across the Group. These terms are used to maximise operational flexibility in terms of managing contracts. The majority of extension and termination options held are exercisable only by the Group and not by the respective lessor.
Key judgement
In determining the lease term, management considers all facts and circumstances that create an economic incentive to exercise an extension option, or not exercise a termination option. Extension options (or periods after termination options) are only included in the lease term if the lease is reasonably certain to be extended (or not terminated). Potential future cash outflows of £nil have not been included in the lease liability because it is not reasonably certain that the leases will be extended (or not terminated).
The assessment is reviewed if a significant event or a significant change in circumstances occurs which affects this assessment and that is within the control of the Group. During the current financial year, the financial effect of revising lease terms to reflect the effect of exercising extension and termination options was an increase in recognised lease liabilities and right-of-use assets of £5.3m (2019: £7.8m).
13. Leases
153

13. Leases (continued)
Set out below are the carrying amounts of right-of-use assets recognised and the movements during the period: Land & Plant & buildings equipment Total £m £m £m
As at 1 January 2019 83.2 17.2 100.4Additions 8.0 7.2 15.2Extensions 13.2 0.6 13.8Payment changes (1.8) (0.4) (2.2)Terminations (5.3) (0.7) (6.0)Depreciation expense (22.5) (9.3) (31.8)Exchange 0.5 0.2 0.7As at 31 December 2019 75.3 14.8 90.1
Additions 12.3 6.0 18.3Extensions 6.3 0.8 7.1Payment changes 1.2 0.1 1.3Terminations (1.1) (0.7) (1.8)Depreciation expense (21.5) (8.2) (29.7)Exchange 0.1 0.2 0.3As at 31 December 2020 72.6 13.0 85.6
Set out below are the carrying amounts of lease liabilities (included under interest-bearing loans and borrowings) and the movements during the period:
Land & Plant & buildings equipment Total £m £m £m
As at 1 January 2019 83.2 17.2 100.4Additions 8.0 7.2 15.2Extensions 13.2 0.6 13.8Payment changes (1.8) (0.4) (2.2)Terminations (5.5) (0.7) (6.2)Accretion of interest 2.0 0.3 2.3Payments (23.9) (9.7) (33.6)Exchange 0.5 0.2 0.7As at 31 December 2019 75.7 14.7 90.4
Additions 12.8 6.0 18.8Extensions 6.3 0.8 7.1Payment changes 1.8 0.1 1.9Terminations (1.1) (0.6) (1.7)Accretion of interest 2.2 0.3 2.5Payments (22.6) (8.6) (31.2)Exchange 0.4 0.1 0.5As at 31 December 2020 75.5 12.8 88.3
Current 20.0 6.3 26.3Non-current 55.5 6.5 62.0
154 IMI plc Annual Report & Accounts 2020

The following are the amounts recognised in the income statement:
2020 2019 £m £m
Depreciation expense of right-of-use assets (29.7) (31.8)Interest expense on lease liabilities (2.5) (2.3)Total amount recognised in profit or loss (32.2) (34.1)
Practical expedients appliedThe Group has used the following practical expedients permitted by the standard: i. reliance on previous assessments on the identification of a lease (per IAS 17) for all existing contracts on the date of initial application; ii. the use of a single discount rate to a portfolio of leases with reasonably similar characteristics;iii. reliance on previous assessments on whether leases are onerous;iv. the exclusion of initial direct costs for the measurement of the right-of-use asset at the date of initial application; and v. the use of hindsight in determining the lease term where the contract contains options to extend or terminate the lease.
No practical expedient has been applied in relation to short-term leases and low value assets and is not expected to be used in subsequent periods.
Future cash outflows that the Group is potentially exposed to in relation to the measurement of lease liabilities which have not been reflected is £nil (2019: £nil).
155

Accounting policy
i. Defined contribution (‘DC’) pension plans
Arrangements where the employer pays fixed contributions into an external fund on behalf of the employee (who is responsible for making the investment decision and therefore assumes the risks and rewards of fund performance).
Contributions to defined contribution pension plans are recognised as an expense in the income statement as incurred.
ii. Defined benefit (‘DB’) pension plans
A defined benefit pension plan is a pension arrangement in which the employer promises a specified annual benefit on retirement that is pre-determined by a formula based on the employee's earnings history, tenure of service and age, rather than depending directly on individual investment returns. In some cases, this benefit is paid as a lump sum on leaving the Company or while in the service of the Company rather than as a pension. The Group underwrites one or more risks in meeting these obligations and therefore any net liability or surplus in these arrangements is shown on the Group balance sheet.
The Group’s net obligation in respect of defined benefit pension plans is calculated separately for each plan by estimating the amount of future benefit that employees have earned in return for their service in the current and prior periods; that benefit is discounted to determine its present value, and the fair value of any plan assets are deducted. Past service costs are recognised in profit or loss on the earlier of the date of the plan amendment or curtailment, and the date that the Group recognises restructuring-related costs. The discount rate is the yield at the balance sheet date on high quality corporate bonds of the appropriate currency that have durations approximating those of the Group’s obligations. The calculation is performed by a qualified actuary using the projected unit credit method. At each year end the Company and the local actuaries consider whether the plans are affected by the asset ceiling requirements. When the calculation results in a net asset to the Group, the recognised asset is limited to the present value of any future refunds from the plan or reductions in future contributions to the plan and restricted by any relevant asset ceiling. Any deduction made by the tax authorities in the event of a refund of a surplus would be regarded by the Group as an income tax.
When the benefits of a plan are improved, the expense is recognised immediately in the income statement. Re-measurement gains and losses are recognised immediately in equity and disclosed in the statement of comprehensive income.
iii. Long-term service and other post-employment benefits
The Group’s net obligation in respect of long-term service and other post-employment benefits, other than pension plans, is the amount of future benefit that employees have earned in return for their service in the current and prior periods. The obligation is calculated using the projected unit credit method and is discounted to its present value and the fair value of any related assets is deducted. The discount rate is the yield at the balance sheet date on high quality bonds of the appropriate currency that have durations approximating those of the Group’s obligations.
Key estimate
The present value of the Group’s defined benefit pension plans and other post-employment benefits are determined using actuarial valuations. An actuarial valuation involves making various assumptions that may differ from actual developments in the future. These include the determination of the discount rate, inflation, future salary increases, mortality rates and future pension increases. The assumptions used and analysis of their sensitivity is set out below. Due to the complexity of the valuation and its long-term nature, a defined benefit obligation is highly sensitive to changes in these assumptions.
14. Retirement benefits
156 IMI plc Annual Report & Accounts 2020
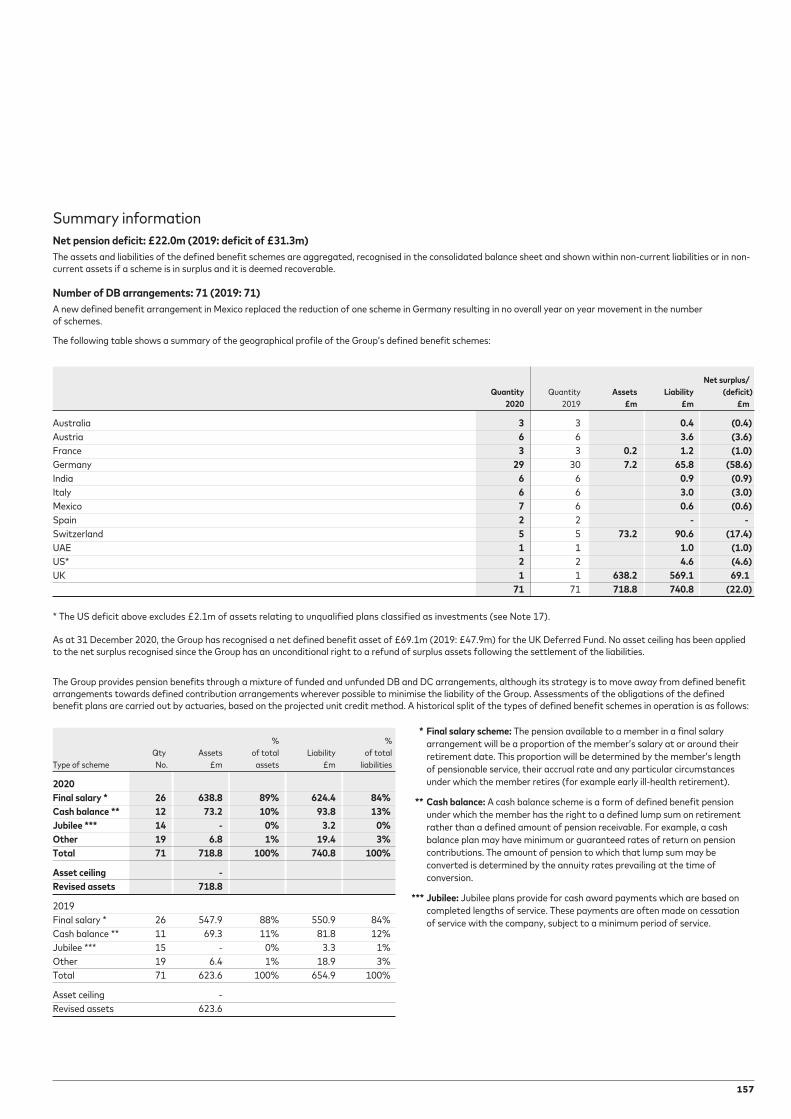
Summary information Net pension deficit: £22.0m (2019: deficit of £31.3m)The assets and liabilities of the defined benefit schemes are aggregated, recognised in the consolidated balance sheet and shown within non-current liabilities or in non-current assets if a scheme is in surplus and it is deemed recoverable.
Number of DB arrangements: 71 (2019: 71)A new defined benefit arrangement in Mexico replaced the reduction of one scheme in Germany resulting in no overall year on year movement in the number of schemes.
The following table shows a summary of the geographical profile of the Group’s defined benefit schemes:
Net surplus/ Quantity Quantity Assets Liability (deficit) 2020 2019 £m £m £m
Australia 3 3 0.4 (0.4)Austria 6 6 3.6 (3.6)France 3 3 0.2 1.2 (1.0)Germany 29 30 7.2 65.8 (58.6) India 6 6 0.9 (0.9)Italy 6 6 3.0 (3.0)Mexico 7 6 0.6 (0.6)Spain 2 2 - -Switzerland 5 5 73.2 90.6 (17.4)UAE 1 1 1.0 (1.0)US* 2 2 4.6 (4.6)UK 1 1 638.2 569.1 69.1 71 71 718.8 740.8 (22.0)
* The US deficit above excludes £2.1m of assets relating to unqualified plans classified as investments (see Note 17).
As at 31 December 2020, the Group has recognised a net defined benefit asset of £69.1m (2019: £47.9m) for the UK Deferred Fund. No asset ceiling has been applied to the net surplus recognised since the Group has an unconditional right to a refund of surplus assets following the settlement of the liabilities.
% % Qty Assets of total Liability of total Type of scheme No. £m assets £m liabilities
2020Final salary * 26 638.8 89% 624.4 84%Cash balance ** 12 73.2 10% 93.8 13%Jubilee *** 14 - 0% 3.2 0%Other 19 6.8 1% 19.4 3%Total 71 718.8 100% 740.8 100%
Asset ceiling - Revised assets 718.8
2019Final salary * 26 547.9 88% 550.9 84%Cash balance ** 11 69.3 11% 81.8 12%Jubilee *** 15 - 0% 3.3 1%Other 19 6.4 1% 18.9 3%Total 71 623.6 100% 654.9 100%
Asset ceiling -Revised assets 623.6
The Group provides pension benefits through a mixture of funded and unfunded DB and DC arrangements, although its strategy is to move away from defined benefit arrangements towards defined contribution arrangements wherever possible to minimise the liability of the Group. Assessments of the obligations of the defined benefit plans are carried out by actuaries, based on the projected unit credit method. A historical split of the types of defined benefit schemes in operation is as follows:
* Final salary scheme: The pension available to a member in a final salary arrangement will be a proportion of the member’s salary at or around their retirement date. This proportion will be determined by the member’s length of pensionable service, their accrual rate and any particular circumstances under which the member retires (for example early ill-health retirement).
** Cash balance: A cash balance scheme is a form of defined benefit pension under which the member has the right to a defined lump sum on retirement rather than a defined amount of pension receivable. For example, a cash balance plan may have minimum or guaranteed rates of return on pension contributions. The amount of pension to which that lump sum may be converted is determined by the annuity rates prevailing at the time of conversion.
*** Jubilee: Jubilee plans provide for cash award payments which are based on completed lengths of service. These payments are often made on cessation of service with the company, subject to a minimum period of service.
157

Asset profile of schemesThe following table sets out the profile of the overall assets of the schemes (to give an indication of their risk profile), the comparative amounts of the funded and unfunded defined benefit liabilities ('DBOs') and a split of the balance sheet impact between schemes with a net pension surplus and a net pension deficit.
2020 2019 £m £m
Quoted equities 25.7 25.1Quoted bonds 423.2 385.9Total quoted assets 448.9 411.0
Private equities 121.5 113.2Insurance policies* 68.3 20.8Hedge funds - 1.2Property 18.6 17.8Other** 61.5 59.6Total unquoted assets 269.9 212.6
Fair value of assets 718.8 623.6DBOs for funded schemes (672.1) (589.9)DBOs for unfunded schemes (68.7) (65.0)Deficit for DBOs (22.0) (31.3)
Schemes in net pension deficit (91.1) (79.2)Schemes in net pension surplus 69.1 47.9
* The value of the insurance policies match the value of the IAS 19 liabilities insured.
** 'Other' assets primarily consists of cash, currency swaps and UK commercial real estate debt.
The overseas assets of £80.6m (2019: £76.3m) comprise equities of £25.7m (2019: £25.1m), bonds of £17.8m (2019: £24.0m), insurance of £7.4m (2019: £6.9m), property of £17.6m (2019: £15.8m) and other assets of £12.1m (2019: £4.5m).
Funded: The majority of the Group defined benefit and other post-employment benefit arrangements are funded, which means they are linked to specific plan assets that have been segregated in a trust or foundation.
Unfunded: Plans that are not funded are those that are not backed by segregated assets. These include some pension plans but also a number of other long-term arrangements for the benefit of our employees, with benefits payable while they are employed by the Group but more than 12 months after the related service is rendered. Actuarial gains and losses on other long-term arrangements are recognised in the income statement in the period in which they arise.
Average duration by geographyThe following table shows the weighted average number of years (or duration) over which pension benefits are expected to be paid.
Location 2020 2019
UK 21.9 22.0Switzerland 18.3 17.4US 5.7 6.5Eurozone 15.2 15.5
The UK and overseas pension funds
The UK FundsThe United Kingdom constitutes 77% (2019: 76%) of total defined benefit liabilities and 89% (2019: 88%) of total defined benefit assets. Historically the IMI Pension Fund offered final salary benefits to UK employees until it closed to new entrants in 2005 and to future accrual on 31 December 2010. In December 2014 winding-up procedures commenced and those members who were not eligible or did not take up the offer of a single cash lump sum transferred to one of two new Funds (IMI 2014 Pensioner Fund or the IMI 2014 Deferred Fund – ‘the UK Funds’). Ongoing pension benefits in the UK are provided via the Trustee’s defined contribution plan – The IMI Retirement Savings Plan. All UK pension assets are run on behalf of the Trustee by the Board of the IMI Common Investment Fund.
The Trustee has determined an investment objective to achieve, over time, a position of self-sufficiency, defined using a discount rate of gilts +0.25%.
Liability managementThe Group completed a bulk insurance buy-in exercise in relation to certain members of the UK Deferred Fund during the year. The difference between the value of the liabilities insured and the cost of the premium to insure them of £7.5m has been recognised as a loss in other comprehensive income.
ContributionsThe March 2018 Valuation was completed in December 2018 and the Funds’ Actuary certified that no deficit funding contributions would be required over and above the projected investment returns and the scheduled payments, of £7.0m per annum, due from the Scottish Limited Partnerships until the earlier of full funding of the UK Deferred Fund or 2030.
14. Retirement benefits (continued)
158 IMI plc Annual Report & Accounts 2020

Specific effect on financial statements The corresponding entries for increases and decreases in the net pension deficit reported in the balance sheet are reflected as follows. Other movements includes foreign exchange. i. Cash flow statement: When the Group makes cash contributions to fund the
deficit they are reflected in the cash flow statement and reduce the net deficit/increase the net surplus.
ii. Income statement: Movements in the overall net pension deficit are recognised in the income statement when they relate to changes in the overall pension promise, due to either an additional period of service (known as ‘current service cost’), changes to pension terms in the scheme rules (known as ‘past service cost’), or closure of all or part of a scheme (known as settlements and curtailments). The interest charge/income on the net deficit/surplus position is also recognised in the income statement.
iii. Other comprehensive income (OCI): Movements in the overall net pension deficit are recognised through OCI when they relate to changes in actuarial assumptions or the difference (‘experience gain or loss’) between previous assumptions and actual results.
The table below reconciles the movement in the UK and overseas net defined benefit surplus/(obligation) between 1 January 2020 and 31 December 2020.
UK Overseas Total £m £m £m
Net defined benefit surplus/(obligation) at 1 January 2020 47.9 (79.2) (31.3)Movement recognised in: Income statement 0.8 (6.3) (5.5) OCI 13.4 (9.1) 4.3 Cash flow statement 7.0 - 7.0Other movements - 3.5 3.5Net defined benefit surplus/(obligation) at 31 December 2020 69.1 (91.1) (22.0)
Risks faced by the schemesThe main risks that the Group face in respect of the UK Deferred Fund, which makes up 77% of the Group’s liabilities, are:
Risk Description/mitigation
Interest rate risk Under IAS 19, the discount rate should be set with reference to the yield on high quality corporate bonds (typically taken to mean those rated AA) of term appropriate to the duration of the liabilities.
A decrease in corporate bond yields and therefore the resulting discount rate, leads to a higher value being placed on the pension liabilities.
The Trustees’ investment strategy for the UK Deferred Fund includes investing in liability-driven investments and bonds whose values increase with decreases in interest rates. The Trustees have a target to hedge 100% of interest rate risk. The Trustees' investment managers measure and monitor the hedging arrangements in place and the latest performance report shows this target is being met.
Note that the Scheme hedges interest rate risk on a scheme funding basis (relative to gilts) whereas AA corporate bonds are implicit in the IAS 19 discount rate and so there is some mismatching risk to the Group should yields on gilts and corporate bonds diverge. The Scheme’s exposure to corporate bonds mitigates this risk to some extent.
Inflation risk In the UK Deferred Fund, a large proportion of the benefits are linked to inflation. Therefore, an increase in inflation would lead to higher benefits being paid than expected.
To mitigate this risk, the UK Deferred Fund aims to hedge 100% of the Fund’s liabilities against inflation risk. The Trustees' investment managers measure and monitor the hedging arrangements in place and the latest performance report shows this target is being met.
Investment risk The UK Deferred Fund holds investments in asset classes, such as private equity and property, which have volatile market values. These assets are expected to provide better returns than Government bonds over the long-term. However, the short-term volatility can cause additional funding to be required, if a deficit emerges. As these investments make up around 20% of the total assets, the risk to the Group is relatively small.
Mortality risk The majority of the plans’ obligations are to provide benefits for the life of each retired member and his/her spouse, so increases in life expectancy result in an increase in the plans’ liabilities.
An increase of one year in life expectancy for the UK Deferred Fund would act to increase liabilities by c.£20.9m.
The Group has an objective to insure benefits as members retire in order to reduce mortality risk.
159

14. Retirement benefits (continued)
IMI takes advice from actuaries regarding the appropriateness of the assumptions used to determine the present value of the defined benefit obligations. These assumptions include the discount rate applied to the assets and liabilities, the life expectancy of the members, their expected salary and pension increases and inflation. The assumptions used for this purpose in these financial statements are summarised below:
Weighted Averages
31 Dec 2020 31 Dec 2019 31 Dec 2018
UK Overseas UK Overseas UK Overseas % pa % pa % pa % pa % pa % pa
Inflation – RPI 3.1 n/a 3.1 n/a 3.3 n/aInflation – CPI (pre-2030) 2.1 1.3 2.1 1.4 2.3 1.4Inflation – CPI (post-2030) 3.1 1.3 2.1 1.4 2.3 1.4 Discount rate 1.4 0.4 2.0 0.7 2.7 1.5Expected salary increases n/a 1.6 n/a n/a n/a 1.8Rate of pension increases 3.1 0.7 3.1 0.6 3.3 0.6
Cash flow impacts
2020 2019
UK Overseas Total UK Overseas Total £m £m £m £m £m £m
Amounts from employees - 2.2 2.2 - 2.1 2.1Amounts from employers 7.0 2.7 9.7 7.0 2.4 9.4Benefits and settlements paid directly by the Group - 4.1 4.1 - 4.4 4.4Total 7.0 9.0 16.0 7.0 8.9 15.9
The expected contributions to the DB arrangements in 2021 are £2.6m of normal employer contributions and £2.1m of normal employee contributions, both in relation to overseas pension funds. Additional contributions of £7.0m will be made in the UK in 2021.
Other comprehensive incomeMovements in pension assets and liabilities that arise during the year from changes in actuarial assumptions, or because actual experience is different from the actuarial assumptions, are recognised in equity via other comprehensive income. These movements are analysed below:
2020 2019
Overseas Overseas Overseas Overseas post non-post post non-post UK employment employment Total UK employment employment Total £m £m £m £m £m £m £m £m
Change in discount rate (78.5) (7.2) (85.7) (72.8) (12.4) (85.2)Change in inflation 4.7 0.4 5.1 19.3 (3.5) 15.8Change in other assumptions (1.0) (1.0) 2.4 0.7 3.1Actuarial experience 5.7 (0.7) 5.0 (1.1) (4.3) (5.4)Asset experience 82.5 (1.6) 80.9 64.4 7.0 71.4Actuarial gains/(losses) in the year 13.4 (9.1) 4.3 12.2 (12.5) (0.3)Change in the asset ceiling 0.2 0.2Exchange gains/(losses) (3.2) (0.1) (3.3) 3.5 0.4 3.9Gains/(losses) recognised through equity 13.4 (12.3) (0.1) 1.0 12.2 (8.8) 0.4 3.8
160 IMI plc Annual Report & Accounts 2020

Income statementIn accordance with IAS 19, pension costs recorded through the income statement primarily represent the increase in the DBO based on employee service during the year and the interest on the net liability or surplus for DBOs in respect of employee service in previous years. The table below shows the total cost reported in the income statement in respect of pension obligations and therefore also includes the cost of the defined contribution schemes.
2020 2019
Overseas Overseas Overseas Overseas post non-post post non-post UK employment employment Total UK employment employment Total £m £m £m £m £m £m £m £m
Current service cost 4.6 1.1 5.7 4.1 1.4 5.5Past service cost/(credit) 0.2 0.2 (7.5) (7.5)Settlement/curtailment gain (0.2) (0.2) (1.4) (1.4)Recognition of gains (0.5) (0.5)Pension (income)/expense – operating costs 0.2 4.6 0.9 5.7 (4.8) 0.9 (3.9)
Interest on DBO 9.9 1.0 0.1 11.0 11.8 1.7 0.2 13.7Interest on assets (10.9) (0.3) (11.2) (12.7) (0.5) (13.2)Interest (income)/expense – financing costs (1.0) 0.7 0.1 (0.2) (0.9) 1.2 0.2 0.5
2020 2019 2018 Years Years Years
Life expectancy at age 65 (UK Funds only) Current male pensioners 21.8 21.8 21.3Current female pensioners 24.6 24.8 24.3Future male pensioners 23.5 23.4 23.0Future female pensioners 26.4 26.6 26.2
The mortality assumptions used for the UK Funds above reflect its scheme specific experience, together with an allowance for improvements over time. The experience was reviewed as part of the formal triennial actuarial valuation carried out as at 31 March 2018. The assumptions used as at 31 December 2020 have been based on the results of this review, with the allowance for improvements over time updated to reflect the latest data available.
The table below illustrates how the UK Funds’ net pension surplus would decrease (excluding the impact of inflation rate and interest rate hedging), as at 31 December 2020, in the event of the following reasonable changes in the key assumptions above.
UK 2020 2019 £m £m
Discount rate 0.1% pa lower 13.0 11.0Inflation-linked pension increases 0.1% pa higher* 10.0 9.0Increase of one year in life expectancy from age 65 21.0 21.010% fall in non-bond-like assets ** 57.0 44.4
* This is an in-payment pension increase sensitivity. ** Fund assets excluding cash, bonds, insurance policies and the Funds’
interest in the IMI Scottish Limited Partnerships.
In each case all other assumptions are unchanged.
The table below shows how the net pension deficit for IMI’s non-UK plans would increase, in the event of the following reasonable changes in the key assumptions above.
Non-UK 2020 2019 £m £m
Discount rate 0.1% pa lower 2.9 2.7Salary increases 0.1% higher 0.4 0.4Increase of one year in life expectancy at age 65 4.6 4.0
161

Overall reconciliation of changes in the net surplus/(liability) for DBOs
2020 2019
Net DB Net DB Asset asset/ Asset asset/ DBO Assets ceiling (liability) DBO Assets ceiling (liability) £m £m £m £m £m £m £m £m
Brought forward at start of year (654.9) 623.6 (31.3) (596.8) 544.7 (0.2) (52.3)
Income statement (charges)/credits Current service cost (5.7) (5.7) (5.5) (5.5)Past service cost – plan amendments (0.2) (0.2) 7.5 7.5Past service cost – curtailment 0.8 0.8Settlement 2.1 (1.5) 0.6Net interest (cost)/income on net DB (liability)/asset (11.0) 11.2 0.2 (13.7) 13.2 (0.5)Immediate recognition of gains/(losses) – other long-term benefits 0.2 0.2 0.5 0.5Total charged to income statement (16.7) 11.2 (5.5) (8.3) 11.7 3.4
Remeasurements recognised in other comprehensive income
Actuarial gain/(loss) due to actuarial experience 4.9 4.9 (5.3) (5.3)Actuarial (loss)/gain due to financial assumption changes (80.5) (80.5) (69.5) (69.5)Actuarial (loss)/gain due to demographic assumption changes (1.0) (1.0) 3.1 3.1Return on plan assets* less than discount rate 80.9 80.9 71.4 71.4Change in effect of asset ceiling 0.2 0.2Total remeasurements recognised in other comprehensive income (76.6) 80.9 4.3 (71.7) 71.4 0.2 (0.1)
Cash flows in the year
Employer contributions 9.7 9.7 9.4 9.4Employee contributions (2.2) 2.2 (2.1) 2.1 Benefits and settlements paid directly by the Company 4.1 4.1 4.4 4.4Benefits paid from plan assets 13.0 (13.0) 14.4 (14.4) Net cash inflow/(outflow) 14.9 (1.1) 13.8 16.7 (2.9) 13.8
Other movements
Changes in exchange rates (7.5) 4.2 (3.3) 5.2 (1.3) 3.9Total other movements (7.5) 4.2 (3.3) 5.2 (1.3) 3.9Carried forward at end of year (740.8) 718.8 (22.0) (654.9) 623.6 (31.3)
14. Retirement benefits (continued)
* Net of management costs.
162 IMI plc Annual Report & Accounts 2020

15. Inventories
Accounting policy
Inventories are valued at the lower of cost and net realisable value. Due to the varying nature of the Group’s operations, both first in, first out and weighted average methodologies are employed. In respect of work in progress and finished goods, cost includes all direct costs of production and the appropriate proportion of production overheads.
Key estimate
The Group sells a wide range of highly technical products and whilst they are designed and engineered to a high degree of precision and to customer specifications, there is a risk of products requiring modification, which can lead to excess or obsolete inventory.
Management makes estimates based on: • historical sales trends and management’s view of future sales forecasts; and • forecast costs to complete. The degree of dependence on future events makes the estimate inherently subjective. The amount of the inventory provision recognised is disclosed below.
Inventories
2020 2019 £m £m
Raw materials and consumables 100.3 95.6 Work in progress 112.5 111.2 Finished goods 80.5 74.0 293.3 280.8
Inventories are stated after: Allowance for impairment 42.8 35.4 In 2020, the cost of inventories recognised as an expense (being segmental cost of sales) amounted to £1,008.8m (2019: £1,058.8m). The Group's inventory increased by £13m as a result of trading movements of £9m and foreign exchange movements of £4m.
In 2020, the write-down of inventories to net realisable value amounted to £20.0m (2019: £11.9m). The reversal of write-downs amounted to £6.2m (2019: £2.3m). Write-downs and reversals in both years relate to on-going assessments of inventory obsolescence, excess inventory holding and inventory resale values across all of the Group’s businesses.
163
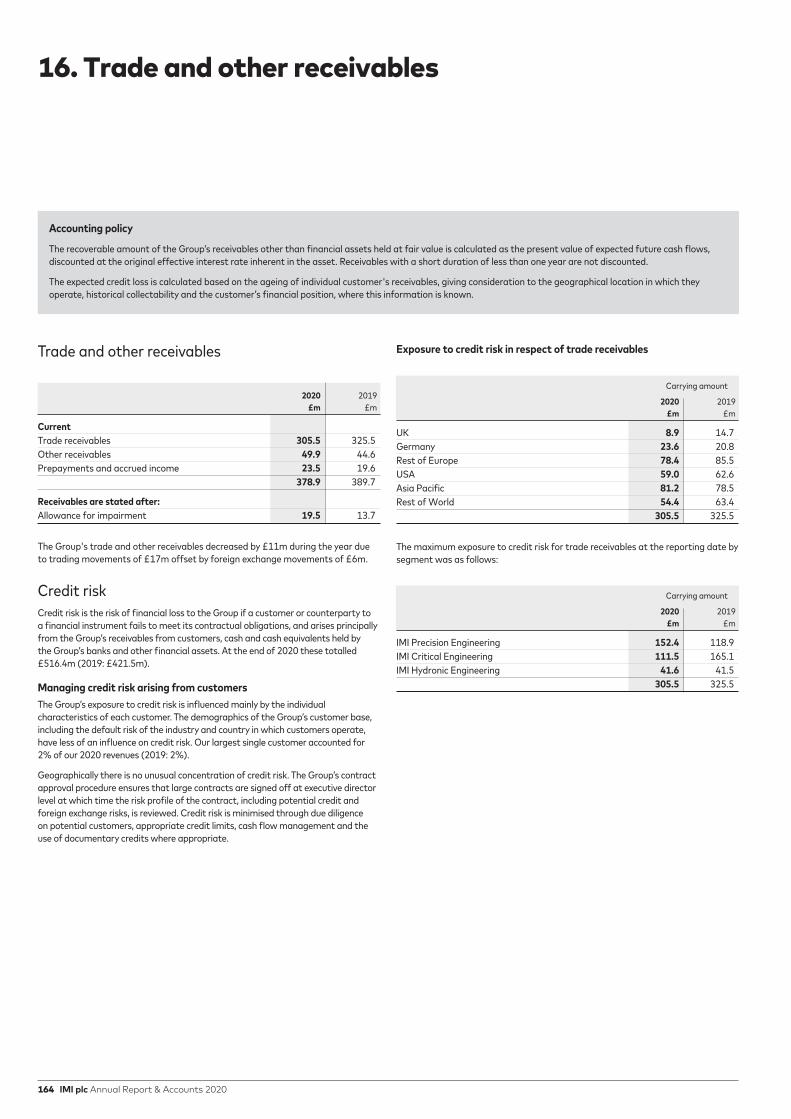
Trade and other receivables
2020 2019 £m £m
Current Trade receivables 305.5 325.5Other receivables 49.9 44.6Prepayments and accrued income 23.5 19.6 378.9 389.7
Receivables are stated after: Allowance for impairment 19.5 13.7
The Group's trade and other receivables decreased by £11m during the year due to trading movements of £17m offset by foreign exchange movements of £6m.
Credit riskCredit risk is the risk of financial loss to the Group if a customer or counterparty to a financial instrument fails to meet its contractual obligations, and arises principally from the Group’s receivables from customers, cash and cash equivalents held by the Group’s banks and other financial assets. At the end of 2020 these totalled £516.4m (2019: £421.5m).
Managing credit risk arising from customers The Group’s exposure to credit risk is influenced mainly by the individual characteristics of each customer. The demographics of the Group’s customer base, including the default risk of the industry and country in which customers operate, have less of an influence on credit risk. Our largest single customer accounted for 2% of our 2020 revenues (2019: 2%).
Geographically there is no unusual concentration of credit risk. The Group’s contract approval procedure ensures that large contracts are signed off at executive director level at which time the risk profile of the contract, including potential credit and foreign exchange risks, is reviewed. Credit risk is minimised through due diligence on potential customers, appropriate credit limits, cash flow management and the use of documentary credits where appropriate.
Exposure to credit risk in respect of trade receivables
Carrying amount
2020 2019 £m £m
UK 8.9 14.7Germany 23.6 20.8Rest of Europe 78.4 85.5USA 59.0 62.6Asia Pacific 81.2 78.5Rest of World 54.4 63.4 305.5 325.5
The maximum exposure to credit risk for trade receivables at the reporting date by segment was as follows:
Carrying amount
2020 2019 £m £m
IMI Precision Engineering 152.4 118.9IMI Critical Engineering 111.5 165.1IMI Hydronic Engineering 41.6 41.5 305.5 325.5
16. Trade and other receivables
Accounting policy
The recoverable amount of the Group’s receivables other than financial assets held at fair value is calculated as the present value of expected future cash flows, discounted at the original effective interest rate inherent in the asset. Receivables with a short duration of less than one year are not discounted.
The expected credit loss is calculated based on the ageing of individual customer's receivables, giving consideration to the geographical location in which they operate, historical collectability and the customer’s financial position, where this information is known.
164 IMI plc Annual Report & Accounts 2020

Impairment provisions for trade receivablesThe ageing of trade receivables at the reporting date was:
2020 2019
Gross Impairment Gross Impairment £m £m £m £m
Not past due 266.9 (0.2) 265.0 (0.1)Past due 1-30 days 24.4 (1.5) 30.4 (0.5)Past due 31-90 days 11.3 (1.9) 16.9 (0.8)Past due over 90 days 22.4 (15.9) 26.9 (12.3)Total 325.0 (19.5) 339.2 (13.7)
The net movement in the allowance for impairment in respect of trade receivables during the year was as follows:
2020 2019 £m £m
Net balance at 1 January 13.7 13.2Utilised during the year (3.1) (1.8)Charged to the income statement 9.9 3.6Released (1.2) (0.8)Exchange 0.2 (0.5)Net balance at 31 December 19.5 13.7
The net impairment charge recognised of £8.7m (2019: charge of £2.8m) relates to the movement in the Group's assessment of the risk of non-recovery from a range of customers across all of its businesses.
Managing credit risk arising from counterparties A group of relationship banks provides the bulk of the banking services, with pre-approved credit limits set for each institution. Financial derivatives are entered into with these core banks and the credit exposure to these instruments is included when considering the credit exposure to the counterparties. At the end of 2020 credit exposure including cash deposited did not exceed £30.0m with any single institution (2019: £13.8m).
Exposure to credit risk in respect of financial assetsThe maximum exposure to credit risk for financial assets is represented by their carrying value and is analysed below:
Carrying amount
2020 2019 £m £m
Cash and cash equivalents 207.9 88.2 Investments 3.1 3.6 211.0 91.8
165
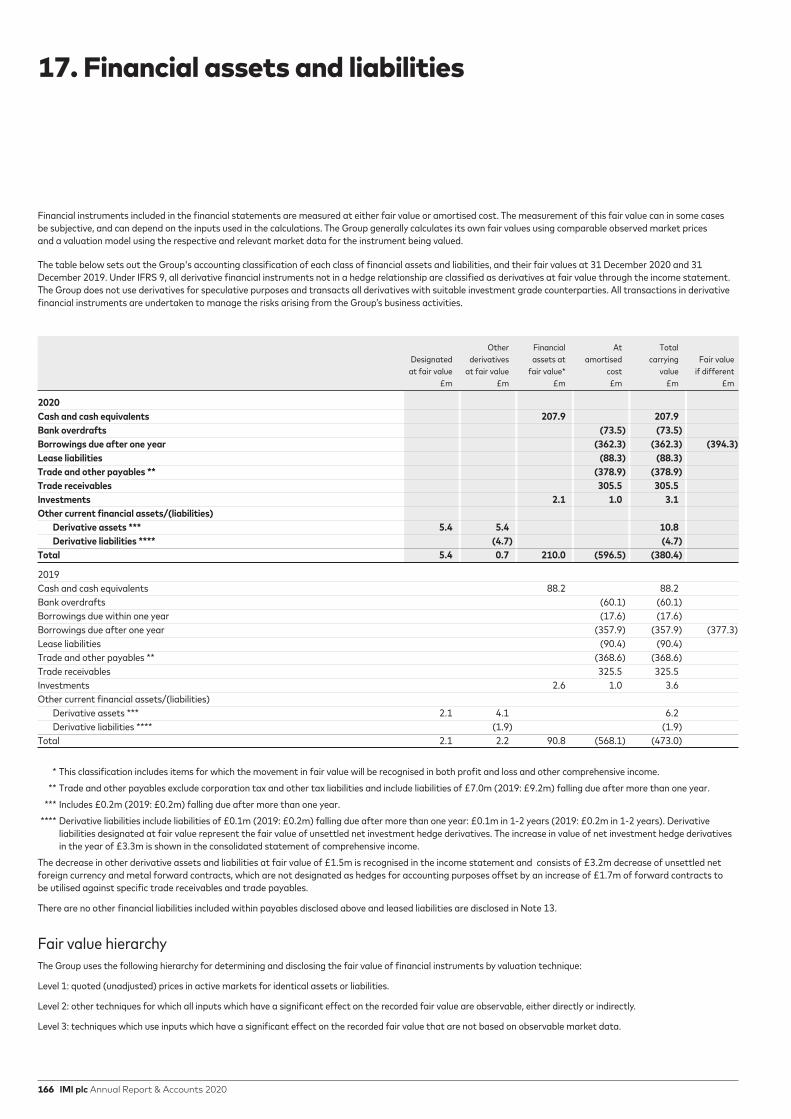
Financial instruments included in the financial statements are measured at either fair value or amortised cost. The measurement of this fair value can in some cases be subjective, and can depend on the inputs used in the calculations. The Group generally calculates its own fair values using comparable observed market prices and a valuation model using the respective and relevant market data for the instrument being valued.
The table below sets out the Group's accounting classification of each class of financial assets and liabilities, and their fair values at 31 December 2020 and 31 December 2019. Under IFRS 9, all derivative financial instruments not in a hedge relationship are classified as derivatives at fair value through the income statement. The Group does not use derivatives for speculative purposes and transacts all derivatives with suitable investment grade counterparties. All transactions in derivative financial instruments are undertaken to manage the risks arising from the Group’s business activities.
Other Financial At Total Designated derivatives assets at amortised carrying Fair value at fair value at fair value fair value* cost value if different £m £m £m £m £m £m
2020Cash and cash equivalents 207.9 207.9 Bank overdrafts (73.5) (73.5)Borrowings due after one year (362.3) (362.3) (394.3)Lease liabilities (88.3) (88.3)Trade and other payables ** (378.9) (378.9)Trade receivables 305.5 305.5Investments 2.1 1.0 3.1Other current financial assets/(liabilities) Derivative assets *** 5.4 5.4 10.8 Derivative liabilities **** (4.7) (4.7)Total 5.4 0.7 210.0 (596.5) (380.4)
2019 Cash and cash equivalents 88.2 88.2 Bank overdrafts (60.1) (60.1) Borrowings due within one year (17.6) (17.6) Borrowings due after one year (357.9) (357.9) (377.3)Lease liabilities (90.4) (90.4) Trade and other payables ** (368.6) (368.6) Trade receivables 325.5 325.5 Investments 2.6 1.0 3.6 Other current financial assets/(liabilities) Derivative assets *** 2.1 4.1 6.2 Derivative liabilities **** (1.9) (1.9) Total 2.1 2.2 90.8 (568.1) (473.0)
* This classification includes items for which the movement in fair value will be recognised in both profit and loss and other comprehensive income. ** Trade and other payables exclude corporation tax and other tax liabilities and include liabilities of £7.0m (2019: £9.2m) falling due after more than one year. *** Includes £0.2m (2019: £0.2m) falling due after more than one year. **** Derivative liabilities include liabilities of £0.1m (2019: £0.2m) falling due after more than one year: £0.1m in 1-2 years (2019: £0.2m in 1-2 years). Derivative
liabilities designated at fair value represent the fair value of unsettled net investment hedge derivatives. The increase in value of net investment hedge derivatives in the year of £3.3m is shown in the consolidated statement of comprehensive income.
The decrease in other derivative assets and liabilities at fair value of £1.5m is recognised in the income statement and consists of £3.2m decrease of unsettled net foreign currency and metal forward contracts, which are not designated as hedges for accounting purposes offset by an increase of £1.7m of forward contracts to be utilised against specific trade receivables and trade payables.
There are no other financial liabilities included within payables disclosed above and leased liabilities are disclosed in Note 13.
Fair value hierarchyThe Group uses the following hierarchy for determining and disclosing the fair value of financial instruments by valuation technique:
Level 1: quoted (unadjusted) prices in active markets for identical assets or liabilities.
Level 2: other techniques for which all inputs which have a significant effect on the recorded fair value are observable, either directly or indirectly.
Level 3: techniques which use inputs which have a significant effect on the recorded fair value that are not based on observable market data.
17. Financial assets and liabilities
166 IMI plc Annual Report & Accounts 2020

The following table shows the Group’s financial instruments held at fair value.
Quoted prices in active markets Significant for identical other assets and observable Unobservable liabilities inputs inputs Level 1 Level 2 Level 3 Total £m £m £m £m
As at 31 December 2020Financial assets measured at fair valueEquity instruments* 3.1 3.1Cash and cash equivalents 207.9 207.9Foreign currency forward contracts 10.8 10.8 211.0 10.8 - 221.8
Financial liabilities measured at fair value Foreign currency forward contracts (4.7) (4.7) (4.7) (4.7)
As at 31 December 2019 Financial assets measured at fair value Equity instruments* 3.6 - 3.6Cash and cash equivalents 88.2 88.2Foreign currency forward contracts 6.2 6.2 91.8 6.2 - 98.0
Financial liabilities measured at fair value Foreign currency forward contracts (1.9) (1.9) - (1.9) - (1.9)
* Equity instruments primarily relate to investments in funds in order to satisfy long-term benefit arrangements.
Valuation techniques for level 2 inputsDerivative assets and liabilities of £10.8m and £4.7m respectively are valued by level 2 techniques. The valuations are derived from discounted contractual cash flows using observable, and directly relevant, market interest rates and foreign exchange rates from market data providers.
Valuation techniques for level 3 inputsAt 31 December 2020, the Group held one external investment at fair value using significant unobservable (level 3) inputs. The valuation is derived using the cash flows of the investment which indicate a fair value of £nil.
Valuation methodologyCash and cash equivalents, bank overdrafts, trade payables and trade receivables are carried at their book values as this approximates to their fair value due to the short-term nature of the instruments.
Long-term and short-term borrowings, apart from any which are subject to hedging arrangements, are carried at amortised cost as it is the intention that they will not be repaid prior to maturity, where this option exists. The fair values are evaluated by the Group based on parameters such as interest rates and relevant credit spreads.
Long-term borrowings which are subject to hedging arrangements are valued using appropriate discount rates to value the relevant hedged cash flows.
Derivative assets and liabilities, including foreign exchange forward contracts, interest rate swaps and metal hedges, are valued using comparable observed market prices and a valuation model using foreign exchange spot and forward rates, interest rate curves and forward rate curves for the underlying commodities.
167

18. Financial risk management
OverviewThe Group’s activities expose it to a variety of financial risks: interest rate, foreign exchange and base metal price movements in addition to funding and liquidity risks. The financial instruments used to manage these risks themselves introduce exposure to market risk and liquidity risk.
The Board has overall responsibility for the establishment and oversight of the Group’s risk management framework. As described in the Corporate Governance Report on page 70 the Executive Committee monitors risk and internal controls and the Audit Committee monitors financial risk, while the other Board committees also play a part in contributing to the oversight of risk.
The Audit Committee oversees how management monitors compliance with the Group’s financial risk management policies and procedures and reviews the adequacy of the risk management framework in relation to the financial risks faced by the Group. The Group Assurance department undertakes both regular and ad-hoc reviews of risk management controls and procedures, the results of which are reported to the Audit Committee.
The following sections discuss the management of specific financial risk factors in detail, including market risk, foreign exchange risk, interest rate risk, commodity risk and liquidity risk. The management of credit risk is disclosed in Note 16.
Market riskMarket risk is the risk that changes in market prices, such as foreign exchange rates, interest rates and commodity prices, will affect the Group’s income and cash flows or the value of its financial instruments. The objective of market risk management is to manage and control market risk exposures within acceptable parameters.
Under the management of the central Treasury function, the Group enters into derivatives in the ordinary course of business and also manages financial liabilities in order to mitigate market risks. All such transactions are carried out within the guidelines set by the Board and are undertaken only if they relate to underlying exposures.
Foreign exchange riskThe Group publishes consolidated accounts in sterling but conducts much of its global business in other currencies. As a result it is subject to the risks associated with foreign exchange movements affecting transaction costs (‘transactional risk’), translation of foreign profits (‘profit translation risk’) and translation of the underlying net assets of foreign operations (‘asset translation risk’).
Management of transactional riskThe Group’s wide geographical spread both in terms of cost base and customer locations helps to reduce the impact on profitability of swings in exchange rates as well as creating opportunities for central netting of exposures. It is the Group’s policy to minimise risk to exchange rate movements affecting sales and purchases by economically hedging or netting currency exposures at the time of commitment, or when there is a high probability of future commitment, using currency instruments (primarily forward exchange contracts). A proportion of forecast exposures are hedged depending on the level of confidence and hedging is periodically adjusted following regular reviews. On this basis over 50% of the Group’s annual exposures to transactional risk are likely to be hedged at any point in time and the Group’s net transactional exposure to different currencies varies from time to time.
Management of profit translation riskThe Group is exposed to the translation of profits denominated in foreign currencies into the sterling-based income statement. The interest cost related to the currency liabilities hedging the asset base provides a partial hedge to this exposure. Short-term currency option contracts may be used to provide limited protection against sterling strength on an opportunistic basis. The translation of US dollar and euro-based profits represent the most significant translation exposures for the Group.
Management of asset translation riskThe Group hedges its net investments in its major overseas operations by way of external currency loans and forward currency contracts. The intention is to manage the Group's exposure to gains and losses in Group equity resulting from retranslation of currency net assets at balance sheet dates.
To the extent that an instrument used to hedge a net investment in a foreign operation is determined to be an effective hedge, the gain or loss arising is recognised directly in the translation reserves. Any ineffective portion is recognised immediately in the income statement.
168 IMI plc Annual Report & Accounts 2020

Currency profile of assets and liabilities
Assets subject Lease Exchange to interest Other Total Total Cash* Debt liabilities contracts rate risk net assets** net assets net assets 2020 2020 2020 2020 2020 2020 2020 2019 £m £m £m £m £m £m £m £m
Sterling 85 - (14) 368 439 71 510 377US dollar - (157) (10) - (167) 363 196 202Euro 44 (205) (20) (176) (357) 357 - 96Other 5 - (44) (192) (231) 325 94 35Total 134 (362) (88) - (316) 1,116 800 710
* Cash is stated net of overdrafts.
** Other net assets includes leased assets: £13m sterling (2019: £14m), £10m US dollar (2019: £16m), £20m euro (2019: £35m) and £43m other (2019: £25m).
Exchange contracts and non-sterling debt are financial instruments used as currency hedges of overseas net assets.
Interest rate riskThe Group is exposed to a number of global interest rates through assets and liabilities denominated in jurisdictions to which these rates are applied, most notably US, Eurozone and UK rates. The Group is exposed to these because market movements in these rates will increase or decrease the interest charge recognised in the Group income statement.
Management of interest rate riskThe Group adopts a policy of maintaining a portion of its liabilities at fixed interest rates and reviewing the balance of the floating rate exposure to ensure that if interest rates rise globally the effect on the Group’s income statement is manageable.
Interest rates are managed using fixed and floating rate debt and financial instruments including interest rate swaps. Floating rate liabilities comprise short-term debt which bears interest at short-term bank rates and the liability side of exchange contracts where the interest element is based primarily on three-month inter-bank rates.
All cash surpluses are invested for short periods and are treated as floating rate investments.
Non-interest bearing financial assets and liabilities including short-term trade receivables and payables have been excluded from the following analysis.
169

18. Financial risk management (continued)
Interest rate risk profileThe following table shows how much of our cash, interest-bearing liabilities and exchange contracts attract both fixed and floating rate interest charges, and how this is analysed between currencies:
Assets Weighted Debt and Cash and subject Weighted average exchange exchange to interest Floating Fixed average period contracts* contracts rate risk* rate rate fixed for which 2020 2020 2020 2020 2020 interest rate rate is fixed £m £m £m £m £m % years
Sterling (14) 453 439 453 (14) US dollar (167) - (167) - (167) 4.1 5.4Euro (401) 44 (357) (132) (225) 1.4 5.3Other (236) 5 (231) (187) (44) Total (818) 502 (316) 134 (450)
* Net of lease liabilities: £14m sterling, £10m US dollar, £20m euro and £44m other.
Assets Weighted Debt and Cash and subject Weighted average exchange exchange to interest Floating Fixed average period contracts* contracts rate risk* rate rate fixed for which 2019 2019 2019 2019 2019 interest rate rate is fixed £m £m £m £m £m % years
Sterling (15) 335 320 335 (15) US dollar (196) 1 (195) (16) (179) 4.1 6.4Euro (392) 11 (381) (150) (231) 1.4 6.3Other (202) 20 (182) (158) (24) Total (805) 367 (438) 11 (449)
* Net of lease liabilities: £15m sterling, £16m US dollar, £35m Euro and £24m other.
Market risk sensitivity analysis on financial instrumentsIn estimating the sensitivity of the financial instruments all other variables are held constant to determine the impact on profit before tax and equity. The analysis is for illustrative purposes only, as in practice market rates rarely change in isolation.
The values shown in the table below are estimates of the impact on financial instruments only. Actual results in the future may differ materially from these estimates. As such this table should not be considered as a projection of likely future gains and losses in these financial instruments.
Financial derivatives sensitivity tableThe outputs from the sensitivity analysis are estimates of the impact of market risk assuming that the specified changes occur only to the financial derivatives and do not reflect the opposite movement from the impact of the specific change on the underlying business that they are designed to hedge.
1% 1% 10% 10% decrease increase 10% 10% decrease in increase in in interest in interest weakening strengthening base metal base metal rates rates in sterling in sterling costs costs £m £m £m £m £m £m
At 31 December 2020 Impact on income statement: (loss)/gain - - (12.4) 12.4 (0.3) 0.3Impact on equity: (loss)/gain - - (67.2) 67.2 - -
At 31 December 2019 Impact on income statement: (loss)/gain - - (5.4) 5.4 (0.4) 0.4Impact on equity: (loss)/gain - - (67.8) 67.8 - -
170 IMI plc Annual Report & Accounts 2020

Commodity riskThe Group’s operating companies purchase metal and metal components and are therefore exposed to changes in commodity prices.
The Group manages this exposure through a centralised process hedging copper, zinc and aluminium using a combination of financial contracts and local supply agreements designed to minimise the volatility of short-term margins.
Liquidity risk Liquidity risk is the risk that the Group will not be able to meet its financial obligations as they fall due.
Management of liquidity riskThe Group’s approach to managing liquidity is to ensure, as far as possible, that it will always have adequate resources to meet its liabilities when they fall due, with sufficient headroom to cope with abnormal market conditions. This position is reviewed on a quarterly basis.
Funding for the Group is co-ordinated centrally by the treasury function and comprises committed bilateral facilities with a core group of banks, and a series of US loan note issues. The level of facilities is maintained such that facilities and term loans exceed the forecast peak gross debt of the Group over a rolling 12 month view by an appropriate amount taking into account market conditions and corporate activity, including acquisitions, organic growth plans and share buybacks. In addition, we undertake regular covenant compliance reviews to ensure that we remain fully within those covenant limits. At the end of 2020 the Group had undrawn committed facilities totalling £300m (2019: £283m) and was holding cash and cash equivalents of £208m (2019: £88m). There are no significant seasonal funding requirements or capital intensive investment areas for the Group.
Capital management OverviewCapital management concerns the decision as to how the Group’s activities are financed and specifically, how much of the Group capital is provided by borrowings (or debt) and how much of it is financed with equity raised from the issue of share capital.
The Board’s policy is to maintain a balance sheet with a broad capital base and the strength to sustain the future development of the business including acquisitions.
The capital base of the Group includes total equity and reserves and net debt. Employee benefit obligations net of deferred tax form part of the extended capital base. Management of this element of the capital base is discussed further in Note 14 of the financial statements. Undrawn committed funding facilities are maintained as described in Note 19 to provide additional capital for growth (including acquisitions and organic investments) and liquidity requirements as discussed above.
Capital base
2020 2019 £m £m
Total equity 800 710Gross debt including overdrafts 436 526Gross cash (208) (88)Capital base 1,028 1,148Employee benefits and deferred tax assets 105 70Extended capital base 1,133 1,218Undrawn funding facilities 300 283Available capital base 1,433 1,501
Part of the capital base is held in currencies to broadly match the currency base of the assets being funded as described in the asset translation risk section.
Debt or equity The balance between debt and equity in the capital base of the Group is considered regularly by the Board in light of market conditions, business forecasts, growth opportunities and the ratio of net debt to continuing adjusted EBITDA. Funding covenants currently limit net debt to a maximum of 3.0 times EBITDA. The net debt to EBITDA ratio at the end of 2020 was 0.8 times (2019: 1.2 times). Through the life of our five-year plan, the Board would consider appropriate acquisitions that could take net debt up to 2.5 times EBITDA on acquisition, provided that a clear plan exists to reduce this ratio back to under 2.0 times. It is expected that at these levels our debt would continue to be perceived as investment grade. The potential benefits to equity shareholders of greater leverage are offset by higher risk and the cost and availability of funding. The Board will consider raising additional equity in the event that it is required to support the capital base of the Group.
Weighted average cost of capitalThe Group currently uses a post-tax weighted average cost of capital (‘WACC’) of 7% (2019: 7%) as a benchmark for investment returns. This is reviewed regularly in the light of changes in market rates. The Board tracks the Group’s return on invested capital and seeks to ensure that it consistently delivers returns in excess of the WACC.
171

Net debt is the Group’s key measure used to evaluate total outstanding debt, net of the current cash resources. Some of the Group’s borrowings (and cash) are held in foreign currencies. Movements in foreign exchange rates affect the sterling value of the net debt. Cash and cash equivalents comprise cash balances and call deposits. Bank overdrafts that are repayable on demand and form an integral part of the Group’s cash management are included as a component of cash and cash equivalents for the purpose of the statement of cash flows.
Movement in net debt
2020 2019 £m £m
Adjusted EBITDA* from continuing operations 379.5 357.3 Working capital movements 14.6 12.9Capital and development expenditure (50.7) (65.8)Provisions and employee benefit movements** 8.5 6.5 Principal elements of lease payments (28.7) (31.3)Other 11.3 19.2
Adjusted operating cash flow *** 334.5 298.8 Adjusting items**** (36.7) (26.2)Interest (11.0) (14.9)Derivatives (22.5) 16.1Tax paid (41.0) (40.2)Additional pension scheme funding (7.0) (7.0)
Free cash flow before corporate activity 216.3 226.6 Dividends paid to equity shareholders (91.6) (110.8)Acquisition of subsidiaries - (69.0)Net purchase of own shares (8.5) (3.4)Net cash flow (excluding debt movements) 116.2 43.4
* Adjusted profit after tax (£216.4m) before interest (£10.8m), tax (£57.5m), depreciation (£76.1m), amortisation (£16.3m) and impairment on property, plant and equipment and non-acquired intangible assets (£2.4m).
** Movement in provisions and employee benefits as per the statement of cash flows (£7.9m) adjusted for the movement in the restructuring provisions (£0.6m). *** Adjusted operating cash flow is the cash generated from the operations shown in the statement of cash flows less cash spent acquiring property, plant and
equipment, non-acquired intangible assets and investments; plus cash received from the sale of property, plant and equipment and the sale of investments, excluding the cash impact of adjusting items. This measure best reflects the operating cash flows of the Group.
**** Cash impact of adjusting items.
Reconciliation of net cash to movement in net borrowings 2020 2019 £m £m
Net increase/(decrease) in cash and cash equivalents excluding foreign exchange 98.4 (19.5)Repayment of borrowings excluding foreign exchange and net debt disposed/acquired 17.8 62.9
Decrease/(increase) in net debt before acquisitions, disposals and foreign exchange 116.2 43.4Net cash/(debt) acquired - 1.0Currency translation differences 3.3 12.7Movement in lease creditors 2.1 (90.4)
Movement in net borrowings in the year 121.6 (33.3)Net borrowings at the start of the year (437.8) (404.5)Net borrowings at the end of the year (316.2) (437.8)
19. Net debt
172 IMI plc Annual Report & Accounts 2020

Reconciliation of cash and cash equivalents
2020 2019 £m £m
Cash and cash equivalents in current assets 207.9 88.2Bank overdraft in current liabilities (73.5) (60.1)Cash and cash equivalents 134.4 28.1
Analysis of net debt
Borrowings and finance leases due
Cash and cash within after more Lease Total equivalents one year than one year creditors net debt £m £m £m £m £m
At 1 January 2019 49.6 (78.8) (375.3) - (404.5)Opening lease liabilities per IFRS 16 - - - (100.4) (100.4) Lease additions, extensions, terminations and payment changes - - - (20.6) (20.6) Lease payments and interest - - - 31.3 31.3 Cash flow excluding settlement of currency derivatives hedging balance sheet and net cash disposed of/acquired (40.1) 58.6 5.3 - 23.8Cash acquired 1.0 - - - 1.0Settlement of currency derivatives hedging balance sheet 19.6 - - - 19.6Currency translation differences (2.0) 2.6 12.1 (0.7) 12.0At 31 December 2019 28.1 (17.6) (357.9) (90.4) (437.8)
Lease additions, extensions, terminations and payment changes - - - (26.1) (26.1) Lease payments and interest - - - 28.7 28.7 Cash flow excluding settlement of currency derivatives hedging balance sheet and net cash disposed of/acquired 121.1 17.8 - - 138.9Cash acquired - - - - -Settlement of currency derivatives hedging balance sheet (22.7) - - - (22.7)Currency translation differences 7.9 (0.2) (4.4) (0.5) 2.8At 31 December 2020 134.4 - (362.3) (88.3) (316.2)
Undrawn committed facilitiesThe Group has various undrawn committed borrowing facilities. The facilities available at 31 December in respect of which all conditions precedent had been met were as follows:
2020 2019 £m £m
Expiring within one year - 75.0Expiring between one and two years 150.0 57.6Expiring after more than two years 150.0 150.0 300.0 282.6
The weighted average life of these facilities is 2.0 years (2019: 1.6 years).
173

Terms and debt repayment scheduleThe terms and conditions of cash and cash equivalents and outstanding loans were as follows:
Effective Carrying Contractual 0 to 1 to 2 to 3 to 4 to 5 years interest rate value cash flows <1 year <2 years <3 years <4 years <5 years and over % £m £m £m £m £m £m £m £m
2020Cash and cash equivalents Floating 207.9 207.9 207.9 US loan notes 2022 7.17% (10.9) (12.5) (0.8) (11.7) US loan notes 2025 1.39% (133.9) (142.1) (1.9) (1.9) (1.9) (1.9) (134.5) US loan notes 2026 3.86% (91.3) (109.6) (3.5) (3.5) (3.5) (3.5) (3.5) (92.1)US loan notes 2027 3.92% (54.7) (68.0) (2.1) (2.1) (2.1) (2.1) (2.1) (57.5)US loan notes 2028 1.53% (71.5) (79.3) (1.1) (1.1) (1.1) (1.1) (1.1) (73.8)Bank overdrafts Floating (73.5) (73.5) (73.5) Lease liabilities Various (88.3) (88.3) (26.3) (19.7) (13.9) (9.6) (5.6) (13.2) Total (316.2) (365.4) 98.7 (40.0) (22.5) (18.2) (146.8) (236.6)
2019Cash and cash equivalents Floating 88.2 88.2 88.2 Revolving Bank Facilities Floating (17.6) (17.6) (17.6) US loan notes 2022 7.17% (11.4) (13.8) (0.8) (0.8) (12.2) US loan notes 2025 1.39% (127.1) (136.7) (1.8) (1.8) (1.8) (1.8) (1.8) (127.7)US loan notes 2026 3.86% (94.7) (118.1) (3.7) (3.7) (3.7) (3.7) (3.7) (99.6)US loan notes 2027 3.92% (56.8) (73.0) (2.2) (2.2) (2.2) (2.2) (2.2) (62.0)US loan notes 2028 1.53% (67.9) (76.2) (1.0) (1.0) (1.0) (1.0) (1.0) (71.2)Bank overdrafts Floating (60.1) (60.1) (60.1) Lease liabilities Various (90.4) (90.4) (35.3) (13.7) (10.9) (7.9) (6.1) (16.5)Total (437.8) (497.7) (34.3) (23.2) (31.8) (16.6) (14.8) (377.0)
Contractual cash flows include undiscounted committed interest cash flows and, where the amount payable is not fixed, the amount disclosed is determined by reference to the conditions existing at the reporting date.
Interest-bearing loans and borrowingsThe Group borrows money from financial institutions in the form of bonds and other financial instruments. These generally have fixed interest rates and are for a fixed term or are drawn from committed borrowing facilities that generally have floating interest rates. For more information about the Group’s exposure to interest rate and foreign currency risk, see Note 18.
2020 2019 £m £m
Current liabilities Unsecured loan notes and other loans - 17.6Lease liabilities 26.3 25.6 26.3 43.2
Non-current liabilities Unsecured loan notes and other loans 362.3 357.9Lease liabilities 62.0 64.8 424.3 422.7
19. Net debt (continued)
174 IMI plc Annual Report & Accounts 2020

20. Provisions
Accounting policy
A provision is recorded instead of a payable when uncertainty exists over the timing and amount of the cash outflow. Provisions are recognised when: the Group has a present legal or constructive obligation as a result of past events; it is probable that an outflow of resources will be required to settle the obligation; and the amount can be reliably estimated. Provisions are valued at management’s best estimate of the amount required to settle the present obligation at the balance sheet date.
A provision for restructuring is recognised when the Group has approved a detailed and formal restructuring plan, and the restructuring has either commenced or has been announced publicly.
The recognition of a provision requires estimation. The principal estimates made in respect of the Group’s provisions concern the timing and amount of payments required to:
- cover the costs of known restructuring projects;
- reimburse customers for potential product warranty claims;
- ensure that current and former manufacturing sites meet relevant environmental standards;
- reflect the estimated outcome of ongoing legal disputes; and
- provide against indemnities following the disposal of subsidiaries.
Analysis of the Group’s provisions:
Environmental, Trade legal & Restructuring warranties indemnity Total £m £m £m £m
Current 29.2 10.2 0.4 39.8Non-current 0.2 6.2 6.6 13.0At 1 January 2020 29.4 16.4 7.0 52.8
Arising during the year 36.1 7.6 - 43.7Utilised during the year (36.7) (2.2) - (38.9)Exchange adjustment 1.3 0.1 - 1.4At 31 December 2020 30.1 21.9 7.0 59.0
Current 30.1 13.4 0.4 43.9Non-current - 8.5 6.6 15.1 30.1 21.9 7.0 59.0
The Group sells a wide range of highly technical products and whilst they are designed and engineered to a high degree of precision and to customer specifications, there is a risk of products requiring modification, which can lead to warranty claims. Trade warranties are given in the normal course of business and cover a range of periods, typically one to two years, with the expected amounts falling due in less than and greater than one year separately analysed above.
The restructuring provision reflects residual amounts committed but not spent in relation to a number of specific projects.
Environmental and legal provisions recognise the Group's obligation to remediate contaminated land at a number of current and former sites, together with current legal cases for which a settlement is considered probable. Because of the long-term nature of the liabilities, the timescales are uncertain and the provisions represent the directors' best estimates of these costs.
Provisions for indemnities included in the agreed terms of disposals of subsidiaries are provided for based on the expected probability of indemnified losses that may be suffered by the purchaser.
175

21. Trade and other payables
2020 2019* £m £m
Current Trade payables 189.8 182.3Social security and other taxation 22.4 28.9Other payables 6.9 6.2Accruals and deferred income 71.2 79.4Progress billings and advance payments from customers 81.6 62.6 371.9 359.4
Non-current Other payables 7.0 9.2 378.9 368.6
The Group's trade and other payables increased by £10m due to foreign exchange movements of £4m and trading movements of £6m.
*' Accruals and deferred income' has been re-presented to separately disclose 'Accruals and deferred income' and 'Progress billings and advance payments from customers'.
176 IMI plc Annual Report & Accounts 2020

22. Share capital
The movement in the number of ordinary shares of 28 4/7p each issued by IMI plc is as follows:
Number and value of shares
2020 2019
Ordinary Ordinary Shares Shares 28 4/7p per 28 4/7p per share share Number (m) Value (£m) Number (m) Value (£m)
In issue at the start of the year 286.4 81.8 286.3 81.8Issued to satisfy employee share schemes 0.1 - 0.1 -In issue at the end of the year 286.5 81.8 286.4 81.8
All issued share capital at 31 December 2020 and 2019 is fully paid and conveys the same rights.
Share movements in the yearMovements in shares due to share issues and purchases during the year were as follows:
Number of ordinary shares of 28 4/7p each (million)
Employee Benefit Trust Treasury Other Total
In issue at 31 December 2019 1.1 14.3 271.0 286.4New issues to satisfy employee share scheme awards 0.1 0.1Market purchases 0.8 (0.8) -Shares allocated under employee share schemes (0.8) 0.8 -At 31 December 2020 1.1 14.3 271.1 286.5 During the year 0.1m (2019: 0.1m) shares were issued under employee share schemes realising £0.2m (2019: £0.8m).
Employee Benefit TrustThe Employee Benefit Trust made market purchases of a total of 0.8m (2019: 0.5m) shares with an aggregate market value of £9.0m (2019: £5.0m) and a nominal value of £0.2m (2019: £0.1m). Associated transaction costs amounted to £nil (2019: £nil).
Share options exercised in 2020 were settled using the shares in the Group's Employee Benefit Trust. In 2020, 0.8m (2019: 0.8m) shares were issued for cash of £0.2m (2019: £0.8m).
Of the 15.4m (2019: 15.4m) shares held within retained earnings, 1.1m (2019: 1.1m) shares with an aggregate market value of £13.4m (2019: £12.7m) are held in trust to satisfy employee share scheme vesting.
177
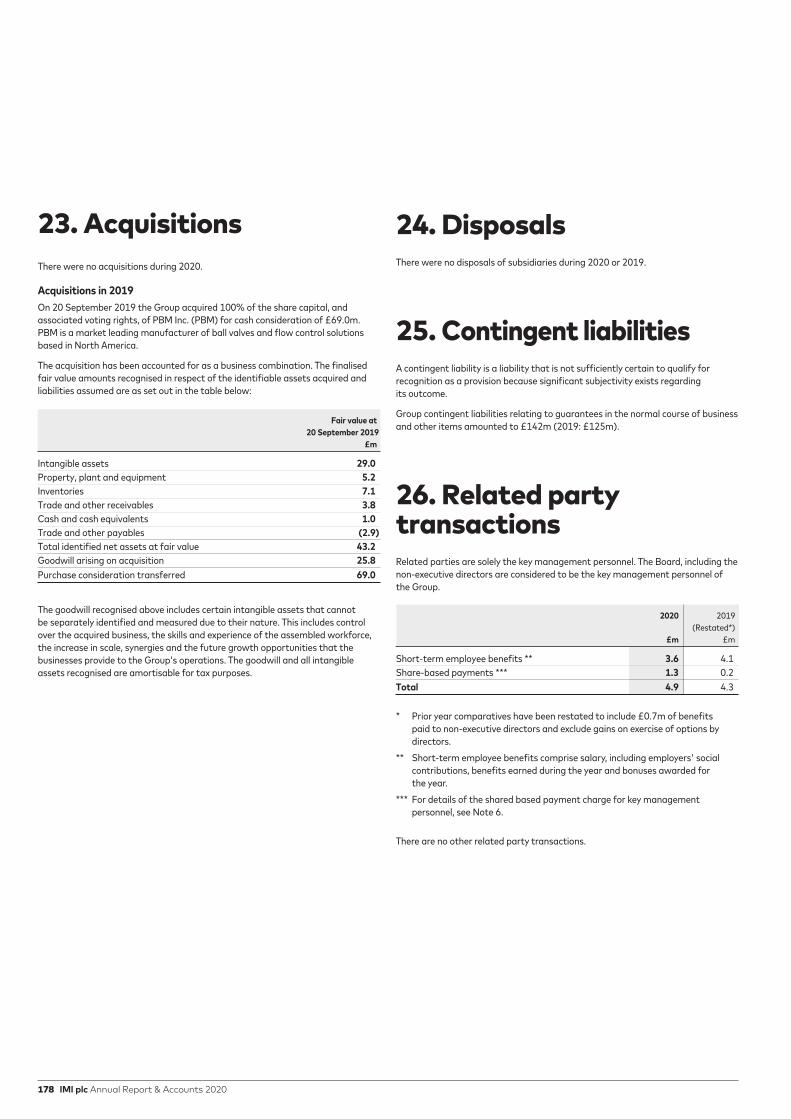
There were no acquisitions during 2020.
Acquisitions in 2019On 20 September 2019 the Group acquired 100% of the share capital, and associated voting rights, of PBM Inc. (PBM) for cash consideration of £69.0m. PBM is a market leading manufacturer of ball valves and flow control solutions based in North America.
The acquisition has been accounted for as a business combination. The finalised fair value amounts recognised in respect of the identifiable assets acquired and liabilities assumed are as set out in the table below:
Fair value at 20 September 2019 £m
Intangible assets 29.0Property, plant and equipment 5.2Inventories 7.1Trade and other receivables 3.8Cash and cash equivalents 1.0Trade and other payables (2.9)Total identified net assets at fair value 43.2Goodwill arising on acquisition 25.8Purchase consideration transferred 69.0
The goodwill recognised above includes certain intangible assets that cannot be separately identified and measured due to their nature. This includes control over the acquired business, the skills and experience of the assembled workforce, the increase in scale, synergies and the future growth opportunities that the businesses provide to the Group's operations. The goodwill and all intangible assets recognised are amortisable for tax purposes.
23. Acquisitions 24. Disposals There were no disposals of subsidiaries during 2020 or 2019.
25. Contingent liabilities A contingent liability is a liability that is not sufficiently certain to qualify for recognition as a provision because significant subjectivity exists regarding its outcome.
Group contingent liabilities relating to guarantees in the normal course of business and other items amounted to £142m (2019: £125m).
26. Related party transactions Related parties are solely the key management personnel. The Board, including the non-executive directors are considered to be the key management personnel of the Group.
2020 2019 (Restated*) £m £m
Short-term employee benefits ** 3.6 4.1Share-based payments *** 1.3 0.2Total 4.9 4.3
* Prior year comparatives have been restated to include £0.7m of benefits paid to non-executive directors and exclude gains on exercise of options by directors.
** Short-term employee benefits comprise salary, including employers' social contributions, benefits earned during the year and bonuses awarded for the year.
*** For details of the shared based payment charge for key management personnel, see Note 6.
There are no other related party transactions.
178 IMI plc Annual Report & Accounts 2020

27. Subsequent events Events that occur in the period between 31 December and the date
of approval of the annual report can be categorised as adjusting or non-adjusting depending on whether the condition existed at 31 December. If the event is an adjusting event, then an adjustment to the results is made. If a non-adjusting event after the year end is material, non-disclosure could influence decisions that readers of the financial statements make. Accordingly, for each material non-adjusting event after the reporting period we disclose the nature of the event and an estimate of its financial effect, or a statement that such an estimate cannot be made.
There were no adjusting or non-adjusting subsequent events after the balance sheet date of 31 December 2020.
28. Discontinued operations Accounting policy
When the Group has assets and liabilities that have been sold in the year or are likely to be sold rather than being held for continuing use, these assets and liabilities are included in current assets and liabilities and denoted ‘held for sale’ rather than in their usual categories.
If they represent a significant enough proportion of the Group, they are also treated as discontinued operations. This means that their trading performance, i.e. their revenues, costs and other items of income and expense, are no longer reported within the headline figures in the income statement and are instead reported in a separate line, net of tax, called ‘discontinued operations’. These amounts no longer form part of continuing earnings per share. Comparative figures are re-presented to be shown on the same basis.
This enables the income statement for the current and prior year to be presented on a consistent basis and to convey a more forward-looking version of the results for the year.
There was no profit or loss from discontinued operations in 2020.
A gain of £2.8m, pre and post-tax, was recognised in 2019 relating to the release of an indemnity provision for a historical discontinued operation. There was no cash impact of this.
179

2020 2019 Note £m £m
Fixed assetsInvestments C5 173.2 173.2
Current assets Debtors C6 379.1 398.8Deferred tax assets C7 3.2 2.7Cash at bank and in hand 10.4 2.9 392.7 404.4
Creditors: amounts falling due within one year Other creditors C8 (3.5) (4.0)Net current assets 389.2 400.4Total assets less current liabilities 562.4 573.6Net assets 562.4 573.6
Capital and reserves Called up share capital C9 81.8 81.8Share premium account 14.3 14.1Capital redemption reserve 174.4 174.4Profit and loss account 291.9 303.3Equity shareholders' funds 562.4 573.6
Approved by the Board of Directors on 25 February 2021 and signed on its behalf by:
Lord Smith of Kelvin
Chairman
Company balance sheetat 31 December 2020
180 IMI plc Annual Report & Accounts 2020

Company statement of changes in equity
Share Share Redemption Retained Parent capital premium reserve earnings equity £m £m £m £m £m
At 1 January 2019 81.8 13.3 174.4 320.0 589.5Retained profit for the year 89.5 89.5Dividends paid on ordinary shares (110.8) (110.8)Shares issued in the year 0.8 0.8Share-based payments 8.8 8.8Shares acquired for: employee share scheme trust (4.2) (4.2)At 31 December 2019 81.8 14.1 174.4 303.3 573.6
Retained profit for the year 78.2 78.2Dividends paid on ordinary shares* (91.6) (91.6)Shares issued in the year - 0.2 0.2Share-based payments 10.7 10.7Shares acquired for*: employee share scheme trust (8.7) (8.7)At 31 December 2020 81.8 14.3 174.4 291.9 562.4
* Details of treasury and employee trust share scheme movements are contained in Note 22 of the Group financial statements and details of dividends paid and proposed in the year are shown in Note C4.
All of the retained earnings held at both 31 December 2020 and 31 December 2019 are considered to be distributable reserves.
181

C1. Significant accounting policiesThe following accounting policies have been applied consistently in dealing with items considered material in relation to the financial statements, except where otherwise noted below:
Basis of accountingThe financial statements were prepared in accordance with Financial Reporting Standard 101 ‘Reduced Disclosure Framework’ (‘FRS 101’).The Company has not presented a separate profit and loss account as permitted by Section 408 of the Companies Act 2006.The Company has taken advantage of the following disclosure exemptions under FRS 101:a) the requirements of paragraphs 45(b) and 46-52 of IFRS 2 ‘Share-based
Payment’;b) the requirements of IFRS 7 ‘Financial Instruments’;c) the requirements of paragraphs 91-99 of IFRS 13 ‘Fair Value Measurement’; d) the requirement in paragraph 38 of IAS 1 ‘Presentation of Financial
Statements’ to present comparative information in respect of paragraph 79(a)(iv) of IAS 1;
e) the requirements of paragraphs 10(d), 10(f) and 134-136 of IAS 1;f) the requirements of IAS 7 ‘Statement of Cash Flows’;g) the requirements of paragraphs 30 and 31 of IAS 8 ‘Accounting Policies,
Changes in Accounting Estimates and Errors’;h) the requirements of paragraph 17 of IAS 24 ‘Related Party Disclosures’; andi) the requirements in IAS 24 ‘Related Party Disclosures’ to disclose related
party transactions entered into between two or more members of the Group, provided that any subsidiary which is party to the transaction is wholly owned by such a member. Related party transactions with the Company’s key management personnel are disclosed in the Remuneration Report on pages 93 to 107 and in Note 26 on page 178 of the Group financial statements.
Judgements and key sources of estimation uncertaintyThe preparation of financial statements requires management to make judgements, estimates and assumptions that affect the amounts reported for assets and liabilities as at the balance sheet date and the amounts reported for income and expenses during the year. However, the nature of estimation means that actual outcomes could differ from those estimates.
There were no judgements, estimates or assumptions applied in 2020 or in 2019.
Foreign currenciesThe Company’s functional currency and presentation currency is sterling. Transactions in foreign currencies are recorded using the rate of exchange ruling at the date of transaction.
Monetary assets and liabilities denominated in foreign currencies have been translated into sterling at the rates of exchange ruling at the balance sheet date and the gains or losses on translation are included in the profit and loss account.
InvestmentsInvestments in subsidiaries are accounted for at cost less any provision for impairment. The Company’s cost of investments in subsidiary undertakings is stated at the aggregate of (a) the cash consideration and either (b) the nominal value of the shares issued as consideration when Section 612 of the Companies Act 2006 applies or (c) in all other cases the market value of the Company’s shares on the date they were issued as consideration.
TaxationThe charge for taxation is based on the profit for the year and takes into account taxation deferred because of temporary differences between the treatment of certain items for taxation and accounting purposes.
Deferred tax is recognised in respect of all temporary differences between the treatment of certain items for taxation and accounting purposes, which have arisen but not reversed by the balance sheet date, except as otherwise required by IAS 12 ‘Income Taxes’. Deferred tax is measured at the tax rates that are expected to apply when the temporary differences reverse, based on the tax laws that have been enacted or substantively enacted by the balance sheet date. A deferred tax asset is recognised to the extent that it is probable that future taxable profit will be available against which the temporary difference can be utilised.
Equity and equity-related compensation benefitsThe Company operates a number of equity and equity-related compensation. The Company operates a number of equity and equity-related compensation benefits as set out in Note 6 to the Group financial statements. The fair value of the employee services received in exchange for the grant of the options is recharged in full to the principal employing company and accordingly, there is no net charge recorded in the Company’s financial statements. The recharged amount is recognised as a debtor falling due for payment within one year.
The total amount recharged over the vesting period is determined by reference to the fair value of the options granted, excluding the impact of any non-market vesting conditions (for example, profitability and sales growth targets). Non-market vesting conditions are included in assumptions about the number of options that are expected to become exercisable. The fair value of the options at the date of grant is determined based on the Monte Carlo and Black-Scholes option-pricing model.
At each balance sheet date, the Company revises its estimate of the number of options that are expected to vest. It recognises the impact of the revision of original estimates, if any, in the amount recharged to subsidiary undertakings.
For newly issued shares, the proceeds received, net of any directly attributable transaction costs are credited to share capital (nominal value) and share premium when the options are exercised.
Treasury sharesThe consideration paid by the Company on the acquisition of treasury shares is charged directly to retained earnings in the year of purchase. Consideration received for the sale of such shares is also recognised in equity, with any difference between the proceeds from sale and the original cost taken to share premium. If treasury shares are subsequently cancelled the nominal value of the cancelled shares is transferred from share capital to the capital redemption reserve. No gain or loss is recognised on the purchase, sale or cancellation of treasury shares.
DividendsDividends unpaid at the balance sheet date are only recognised as a liability at that date to the extent that they are authorised and are no longer at the discretion of the Company. Unpaid dividends that do not meet these criteria are disclosed in the notes to the financial statements.
C2. Remuneration of directorsThe detailed information concerning directors’ emoluments, shareholdings and options are shown in the audited section of the Remuneration Report on pages 93 to 107, Note 5 and Note 26 of the Group financial statements.
C3. Staff numbers and costsThe number of people employed by the Company, including directors, during the year was 17 (2019: 19) all of whom were employed in administrative roles. The costs associated with them were borne by a subsidiary undertaking.
The Company participates in the IMI UK Funds, which are defined benefit schemes in which the assets are held independently. The total net defined benefit costs of these Funds are borne by a subsidiary undertaking and therefore, in accordance with IAS 19, no net defined benefit costs are recognised in the Company’s financial statements. Note 14 to the Group financial statements provides further details regarding the defined benefit schemes.
Company notes to the financial statements
182 IMI plc Annual Report & Accounts 2020

C4. Dividends The aggregate amount of dividends comprises: 2020 2019 £m £m
Prior year final dividend paid – 26.2p per qualifying ordinary share (2019: 26.0p) 71.2 70.4Current year interim dividend paid – 7.5p per qualifying ordinary share (2019: 14.9p) 20.4 40.4Aggregate amount of dividends paid in the financial year 91.6 110.8
Dividends paid in the year of £91.6m represent 33.7p per share (2019: 40.9p).
After the balance sheet date the following dividends were proposed by the directors. The dividends have not been provided for and there are no income tax consequences.
2020 2019 £m £m
Current year final dividend – 15.0p per qualifying ordinary share (2019: 26.2p) 40.7 71.0 Dividends proposed after the balance sheet date may differ from the final dividend paid. This is a result of the final number of qualifying shares entitled to dividends differing from those in issue at the balance sheet date.
C5. Fixed assets – investments
Subsidiary undertakings
2020 2019 £m £m
At 1 January 2020 and 31 December 2020 cost and net book value 173.2 173.2 Details of subsidiary undertakings as at 31 December 2020 are shown on pages 185 to 188.
C6. Debtors 2020 2019 £m £m
Falling due for payment after more than one year: Amounts owed by subsidiary undertakings 367.2 389.9
Falling due for payment within one year: Amounts owed by subsidiary undertakings 11.9 8.9 379.1 398.8
C7. Deferred tax 2020 2019 £m £m
The deferred tax included in the balance sheet is as follows: Employee benefits and share-based payments 3.2 2.7Deferred tax asset included in the balance sheet 3.2 2.7
Reconciliation of movement in deferred tax asset: At 1 January 2020 2.7 2.2Deferred tax credit/(charge) in the profit and loss account 0.2 0.5Deferred tax charge in equity 0.3 -At 31 December 2020 3.2 2.7
The average weighted rate of corporation tax in the UK for the 2020 calendar year was 19.0% (2019: 19.0%). In the Spring Budget of 2020, the UK Government announced that from 1 April 2020 the UK corporation tax rate would remain at 19%, rather than reducing to a rate of 17%, as had been previously substantively enacted. This new law was substantively enacted on 17 March 2020. UK deferred tax assets and liabilities have therefore been calculated using a rate of 19% (2019: 17%).
183

C8. Other creditors falling due within one year 2020 2019 £m £m
Corporation tax 2.5 3.0Other payables 1.0 1.0 3.5 4.0
C9. Share capital 2020 2019 £m £m
Issued and fully paid 286.5m (2019: 286.4m) ordinary shares of 28 4/7p each 81.8 81.8
C10. Contingencies Contingent liabilities relating to guarantees in the normal course of business and other items amounted to £13.7m (2019: £30.7m).
There is a right of set-off with three of the Company's bankers relating to the balances of the Company and a number of its wholly-owned UK subsidiaries.
Where the Company enters into financial guarantee contracts to guarantee the indebtedness of other companies within its Group, the Company considers these to be insurance arrangements, and accounts for them as such. In this respect, the Company treats the guarantee contract as a contingent liability until such time as it becomes probable that the Company will be required to make a payment under the guarantee.
Company notes to the financial statements
184 IMI plc Annual Report & Accounts 2020

Subsidiary undertakings
A full list of the Group’s subsidiary undertakings and registered/principal offices as at 31 December 2020 is included below. Except where indicated, the share capital consists of ordinary shares only. The principal country in which each subsidiary operates and has its registered/principal office is the country of incorporation. IMI plc’s effective interest in the undertakings listed is 100%, except where indicated, and is held in each case by a subsidiary undertaking, except for IMI Group Limited, IMI Deutschland Verwaltungs GmbH and IMI Lakeside Australia Pty Ltd which are held directly by IMI plc.
The Group has an interest in a partnership, the IMI Scottish Limited Partnership, which is fully consolidated into these Group accounts. The Group has taken advantage of the exemption conferred by regulation 7 of the Partnerships (Accounts) Regulations 2008 and has, therefore, not appended the accounts of this qualifying partnership to these accounts. Separate accounts for the partnership are not required to be and have not been filed at Companies House.
Charles Baynes Netherlands BV Netherlands,FCX Pension Trustees Limited,Holford Estates Limited,IMI CIF Trustee Limited,IMI Deutschland Limited,IMI Euro Finance Limited,IMI Fluid Controls (Finance) Limited,IMI Germany Limited,IMI Group Limited,IMI Kynoch Limited,IMI Marston Limited,IMI Overseas Investments Limited,IMI Pensions Trust Limited,IMI plc,IMI Precision Engineering Limited,IMI Property Investments Limited,IMI Refiners Limited,IMI Retirement Savings Trust Limited,IMI Sweden Finance Limited,IMI Vision Limited,Liquick 211 Limited,Truflo Group Limited,Truflo International Limited,Truflo Investments Limited
Lakeside, Solihull Parkway, Birmingham Business Park, Birmingham, West Midlands B37 7XZ, United Kingdom
Finch Land Management LLC,IMI Americas LLC,IMI Fluid Controls Holdings Inc,IMI Norgren LLC,Norgren LLC
5400 South Delaware Street, Littleton, CO 80120, United States
IMI Critical Engineering Holding GmbH,IMI Deutschland II GmbH & Co KG, IMI Deutschland Verwaltungs GmbH,IMI Germany Holding B.V. & Co. KG,Norgren GmbH
Bruckstrasse 93, 46519 Alpen, Germany
Heimeier GmbH,IMI Hydronic Engineering Deutschland GmbH,THJ Holding GmbH
Voellinghauser Weg 2, 59597 Erwitte, Germany
IMI Holding Italy S.R.L., Orton S.R.L.,Truflo Rona S.R.L.
Via Stendhal, 65, 20144 Milano, Italy
IMI Aero-Dynamiek BVBA, IMI Hydronic Engineering NV
Boomsesteenweg 28, B 2627 Schelle, Belgium
IMI Australia Pty Ltd,IMI Lakeside Australia Pty Ltd
33 South Corporate Avenue, Rowville VIC 3178, Australia
IMI Components Limited, Truflo Marine Limited
Westwood Road, Birmingham, B6 7JF, United Kingdom
IMI Finance SA,IMI Hydronic Engineering International SA
Route de Crassier 19, Lake Geneva Business Park, 1262 Eysins, Switzerland
IMI Hydronic Engineering A/S,Norgren A/S
Vesterlundvej 18, 2730 Herlev, Denmark
IMI Hydronic Engineering BV,IMI Netherlands Holdings BV
Röntgenweg 20, Alphen aan den Rijn, NL-2408 AB, Netherlands
IMI Scotland Limited, The IMI Scottish Limited Partnership
15 Atholl Crescent, Edinburgh EH3 8HA, United Kingdom
185

Lakeside Finance Unlimited Company,Lakeside Treasury Unlimited Company
1 Stokes Place, St Stephens Green, Dublin 2, Ireland
Norgren Co Limited, Norgren Manufacturing Co Ltd
Building 3, No. 1885, Duhui Road, Minhang District, Shanghai, China
Valves Holding GmbH,Z & J Technologies GmbH
Bertramsweg 6, 52355 Düren, Germany
Acro Associates LLC 1990 Olivera Rd., Sta. A Concord, CA 94520, United States
Bimba LLC 25150 S. Governors Hwy, University Park, IL 60484, United States
Bopp & Reuther Valves GmbH Carl-Reuther Str. 1, 68305 Mannheim, Germany
Brookvale International Insurance Limited Clarendon House, Church Street, Hamilton, HM11, Bermuda
Buschjost GmbH Detmolder Strasse 256, 32545 Bad Oeynhausen, Germany
CCI AG Fabrikstrasse 10, 8370 Sirnach, Switzerland
CCI America do Sul Comercio de Equipamentos Industriais Ltda Rua Itapeva, 286 cjs 95/96/97, Sao Paulo, 01332-000, Brazil
CCI Czech Republic s.r.o. K Letišti 1804/3, Šlapanice, 62700, Brno, Czech Republic
CCI Flow Control (Shanghai) Co Ltd Room 108, Unit 15, 159 Tian Zhou Road, Cao He Jing Development Zone, Shanghai, 200233, China
CCI International Limited Unit A3 Brookside Business Park, Greengate, Middleton, Manchester, M24 1GS, United Kingdom
CCI Italy S.R.L. Via Stendhal, 65, 20144 Milano, Italy
CCI Valve Technology AB Industrigatan 1-3, Box 603, 661 29 Säffle, Sweden
CCI Valve Technology GmbH Lemböckgasse 63/1, 1230 Wien, Austria
Control Component India Pvt Limited Ground, 1st & 2nd Floor, Tower 4, SJR i park, Plot # 13 14&15, EPIP Zone Phase 1, Whitefield Road, Bangalore 560066, India
Control Components Inc 22591 Avenida Empresa, Rancho Santa Margarita CA 92688, United States
FAS Medic SA Route de Bossonnens 2, 1607, Palézieux, Switzerland
Fluid Automation Systems GmbH Stuttgarter Straße 120, 70736 Fellbach, Germany
Herion Systemtechnik GmbH Untere Talstrasse 65, 71263 Weil der Stadt, Germany
IMI Aero-Dynamiek BV Havenstraat 9, 3861 VS, Nijkerk, Netherlands
IMI Critical Engineering (APAC) Pte. Ltd 29 International Business Park, ACER Building, Tower A, #04-01, Singapore, 609923, Singapore
IMI Critical Engineering (Shanghai) Company Limited B3-2, No. 303, Xinke Road, Qingpu District, Shanghai, 201707 China
IMI Critical Engineering Korea 14 Dangdong 2-ro, Munsan-eup, Paju-si, Gyeonggi-do, 10816, Republic of Korea
IMI Critical FZE Office No. FZJOA1308, FZJ0A1310, FZJ0A1307A, Jebel Ali Free Zone, PO Box 17827, Dubai, UAE
IMI Deutschland B.V. Versterkerstraat 6, 1322 AP Almere, Netherlands
IMI Energi & VVS Utveckling AB Annedalsvägen 9, 22764, Lund, Sweden
IMI Engineering Sdn. Bhd. K-7-5 & K-7-6, Solaris Kirara, Soho, Jalan Solaris Mont Kiara, 50480 Kuala Lumpur, Malaysia
IMI France SARL 52 Boulevard de Sébastopol, 75003 Paris, France
IMI Hidronik Muhendislik Iklimlendirme Sistemleri Ltd Sti Atasehir Bulvari Ata Carsi no. 50-59, Atasehir, Istanbul, Turkey
IMI Holdings LLC 101 Broadway Street West, Suite 204, Osseo, MN 55369, United States
IMI Hydronic Engineering AB Annelund, SE-524 80, Ljung, Sweden
IMI Hydronic Engineering AS Glynitveien 7, Ski, N-1400, Norway
IMI Hydronic Engineering China Room 360, Xin Mao Building, No 2 Tai Zhong Nan Road, Pilot Free Trade Zone, Shanghai, 200131 China
IMI Hydronic Engineering France S.A. 13, rue de la Perdrix – Les Flamants 8, 93290 Tremblay-en-France, France
IMI Hydronic Engineering FZE Office 1307-10 Jafza One, JAFZA (PO Box 262611), Dubai, United Arab Emirates
IMI Hydronic Engineering GesmbH Industriestrasse 9, Objekt 5, 2353, Guntramsdorf, Austria
IMI Hydronic Engineering Inc 8908 Governors Row, Dallas, TX 75247, United States
IMI Hydronic Engineering Limited Hat House Third Floor, 32 Guildford Street, Luton, Bedfordshire, LU1 2NR, United Kingdom
IMI Hydronic Engineering Ltda Av Fagundes Filho, 134 cj 43, S. Judas, Sao Paulo, 04304-010, Brazil
IMI Hydronic Engineering OY Robert Huberin tie 7, Vantaa FI-01510, Finland
Subsidiary undertakings
186 IMI plc Annual Report & Accounts 2020

IMI Hydronic Engineering Pte Ltd 223 Mountbatten Road #03-01, Singapore 398008, Singapore
IMI Hydronic Engineering S.A. 9, rue des 3 Cantons, Windhof, L-8399, Luxembourg
IMI Hydronic Engineering (Spain) SAU Complejo Europa Empresarial, C/Rozabella, 6, Las Rozas, 28290, Madrid, Spain
IMI Hydronic Engineering S.R.L. Via dei Martinitt 3 cap, 20146, Milan, Italy
IMI Hydronic Engineering Switzerland AG Mühlerainstrasse 26, 4414 Füllinsdorf, Switzerland
IMI Hydronic Engineering UAB A.Juozapaviciaus 27-5, Kaunas, LT – 45258, Lithuania
IMI International Co Srl Str. Aristide Pascal nr.36, Sector 3, Bucuresti, 031445, Romania
IMI International d.o.o. Alpska cesta 37b, Lesce, 4248, Slovenia
IMI International d.o.o. Slavonska avenija 17, Zagreb, 10040, Croatia
IMI International d.o.o. Beograd Milutina Milankovica 1b, Novi Beograd, 11070, Serbia
IMI International Kft. Kunigunda Útja 60, Budapest, HU-1037, Hungary
IMI International LLC Leninskaya Sloboda Street 19 b2, 115280, Moscow, Russian Federation
IMI International s.r.o. Central Trade Park D1, c.p.1573, Humpolec, 396 01, Czech Republic
IMI International Sp. z.o.o. Olewin 50 A, PL-32300, Olkusz, Poland
IMI Japan KK 7-3-6 Minatojima Minamimachi, Chuo-ku, Kobe, Hyogo 650-0047, Japan
IMI Norgren Herion PVT Limited B-30A Sector 85, Noida, Uttar Pradesh 201305, India
IMI Norgren Limited 137a Slaney Close, Dublin Industrial Estate, Finglass Road, Dublin 11, Ireland
IMI Norgren SA (Sociedad Unipersonal) Calle Colom, 391, 2 Edif. Tecno, 08223, Terrassa, Spain
IMI Saudi Industry LLC 3826 unit No. 7, Street 122, Second Industrial City, Post 34325-7535, Dammam, Saudi Arabia
IMI Webber Limited City Business Park, Easton Road, Easton, Bristol, BS5 0SP, United Kingdom
Industrie Mecanique Pour Les Fluides SA 15 Avenue des Cures, 95580, Andilly, France
Interativa Indústria Comércio e Representações Ltda Avenida Garabed Gananian, 386 Bairro Aparecidinha, Sorocaba, São Paulo, 18.087-340, Brazil
Kynoch Sweden Holding AB c/o IMI Hydronic Engineering AB, 52 480 Ljung, Sweden
Mead Fluid Dynamics, Inc. 4114 North Knox Avenue, Chicago, IL 60641, United States
Newman Hattersley Limited 151 Superior Blvd, Mississauga ON L5T 2L1, Canada
Norgren AG Fabrikstrasse 10, 8370 Sirnach, Switzerland
Norgren AS Karihaugveien 89, Oslo, 1086, Norway
Norgren Automation Solutions LLC 2871 Bond Street, Rochester Hills, MI 48309, United States
Norgren BV Versterkerstraat 6, 1322 AP Almere, Netherlands
Norgren Co Limited 120/34 M.12, Rachadhewa, Bangplee, Samutprakarn, 10540, Thailand
Norgren Finland OY Robert Huberin Tie 7, Fl-015 10 Vantaa, Finland
Norgren Ges.m.b.H Industriezentrum NÖ Süd, Straße 2a, Objekt M39/1, A-2355, Wiener Neudorf, Austria
Norgren GT Development LLC 425 “C” Street NW, Suite 100, Auburn, WA 98001, United States
Norgren Kloehn LLC 10000 Banburry Cross Drive, Las Vegas, NV 89144, United States
Norgren Limited 6/F Benson Tower, 74 Hung To Road, Kwun Tong, Kowloon, Hong Kong
Norgren Limited 15A Vestey Drive, Auckland, 1060, New Zealand
Norgren Limited Blenheim Way, Fradley Park, Lichfield, Staffordshire, WS13 8SY, United Kingdom
Norgren Ltda Av. Eng. Alberto de Zagottis, 696-B, Sao Paulo SP, 04675-085, Brazil
Norgren Manufacturing de Mexico S.A. de C.V. Avenida de la Montaña # 120, Parque Industrial Querétaro, Santiago De Querétaro, Querétaro, CP 76220, México
Norgren S.A. de C.V. Avenida de la Montaña # 120, Santa Rosa Jauregui, Santiago De Querétaro, Querétaro, CP 76220, México
Norgren NV F Walravensstraat 84, B.1651 Lot, Belgium
Norgren Pte. Limited 16 Tuas Street, Singapore 638453, Singapore
Norgren SAS 1, rue de Lamirault 77090 Collégien, France
Norgren Srl Via trieste 16, Vimercate, 20871, Milan, Italy
187

Norgren Sweden AB Box 14001, Ventilgatan 6, S-200 24 Malmo, Sweden
Norgren Taiwan Co Limited 3F, No. 540 Sec. 1, Minsheng N. Rd., Guishan Dist., Taoyuan City , 333, Taiwan
PBM, Inc. 1070 Sandy Hill Road, Irwin, Westmoreland County, PA 15642, United States
Pneumadyne, Inc. 14425 23rd Ave North, Plymouth, MN 55447, United States
Remosa S.R.L. Viale Pula 37, 09123 sede e stabilimento stradario, 03608, Cagliari, Sardinia, Italy
SAIC CCI Valve Co Ltd (44%)* Block B, 123 Chongming Xiushan Road, Chongming County, Shanghai, 202150 China
Shanghai CCI Power Control Equipment Co Ltd 229C, 2F, No 11, Lane 465, Tengyue Road, Yangpu District, Shanghai, 200090, China
STI S.R.L. Via dei Caravaggi 15, 24040, Levate (BG), Italy
TA Regulator d.o.o. Orliska Ulica13, Brezice, SI-8250, Slovenia
TH Jansen Armaturen GmbH Otto-Kaiser Str. 6, 66386 Sankt Ingbert, Germany
Thompson Valves Limited 17 Balena Close, Creekmoor, Poole, Dorset, BH17 7EF, United Kingdom
Truflo Rona S.A. 3e avenue, 16, Parc Industrial des Hauts Sarts, 4040 Herstal, Belgium
Vaccon Company, Inc. 9 Industrial Park Road, Medway, MA 02053, United States
Z & J High Temperature Equipment (Shanghai) Co Ltd 819 Yinchun Road, Minhang District, Shanghai, 201109, China
Zimmermann & Jansen, Inc. 4525 Kennedy Commerce Drive, Houston, TX 77036, United States
* Treated as external investments
Subsidiary audit exemptionsIMI plc has issued guarantees over the liabilities over the following companies at 31 December 2020 under Section 479C of Companies Act 2006 and these entities are exempt from the requirements of the Act relating to the audit of individual accounts by virtue of Section 479A of the Act:
Company name Company number
Holford Estates Limited 01181406
IMI Deutschland Limited 07843551
IMI Euro Finance Limited 07929408
IMI Fluid Controls (Finance) Limited 08528502
IMI Germany Limited 07843576
IMI Marston Limited 00155987
IMI Refiners Limited 00148305
IMI Components Limited 01640862
IMI Precision Engineering Limited 01687068
IMI Hydronic Engineering Limited 08656812
IMI Kynoch Limited 00713735
Company name Company number
IMI Scotland Limited SC378424
IMI Sweden Finance Limited 07272731
IMI Vision Limited 04421176
Truflo Group Limited 04430846
Truflo International Limited 00164822
Truflo Investments Limited 04430927
CCI International Limited 00259162
IMI Webber Limited 01416237
Norgren Limited 00564656
Thompson Valves Limited 02791464
IMI Overseas Investments Limited 00209251
Subsidiary undertakings
188 IMI plc Annual Report & Accounts 2020

The following table shows the geographic distribution of employees as at 31 December 2020 and is not required to be audited.
United Kingdom 1,127Continental Europe 5,904Americas 2,550Asia Pacific 1,130Rest of World 65Total 10,776
* includes agency and contractors
Geographic distribution of employees*
189

Five year summary
2018
Adjusted revenue £m Adjusted profit before tax* £m
* On an adjusted basis.
Adjusted Group revenue by geography 2020
Middle East & Africa5%
Total APAC21%
Total Americas30%
Total Europe
44%
2016
2020
2016
2017
2018
2019
2020
2017
2019
Income statement 2016 2017 2018 2019 2020 £m £m £m £m £m
Statutory revenue 1,657 1,751 1,907 1,873 1,825Adjusted revenue 1,649 1,751 1,907 1,873 1,825Adjusted operating profit 224.2 239.2 265.5 266.1 284.7
Adjusted profit before tax 208.0 224.1 251.2 250.7 273.9Special pension events 2.8 10.8 6.8 8.6 -Restructuring costs (18.8) (34.6) (12.4) (51.8) (36.1)Acquired intangible amortisation and impairment (25.5) (17.5) (27.1) (21.0) (20.3)Other acquisition items - (2.0) (3.7) (1.6) -Gain/(loss) on disposal of subsidiaries - (2.3) 0.6 - -Financial instruments excluding economic hedge contract gains/(losses) (1.2) 2.4 (2.5) 4.4 (3.2)Profit before tax from continuing operations 165.3 180.9 212.9 189.3 214.3Adjusted EBITDA 273 288 320 357 380
Group sales by destination 2016 2017 2018 2019 2020 £m £m £m £m £m
UK 75 79 90 90 88Germany 240 260 288 234 222Rest of Europe 494 519 519 494 486Total Europe 809 858 897 818 796Total Americas 403 405 515 538 545Total Asia Pacific 334 355 357 404 390Middle East and Africa 103 133 138 113 94Adjusted Revenue 1,649 1,751 1,907 1,873 1,825Reversal of net economic hedge contract losses/(gains) 8 - - - -Statutory Revenue 1,657 1,751 1,907 1,873 1,825
251.
2
250.
7 273.
9
224.
1
208.
0
1,75
1 1,90
7
1,87
3
1,82
5
1,64
9
190 IMI plc Annual Report & Accounts 2020
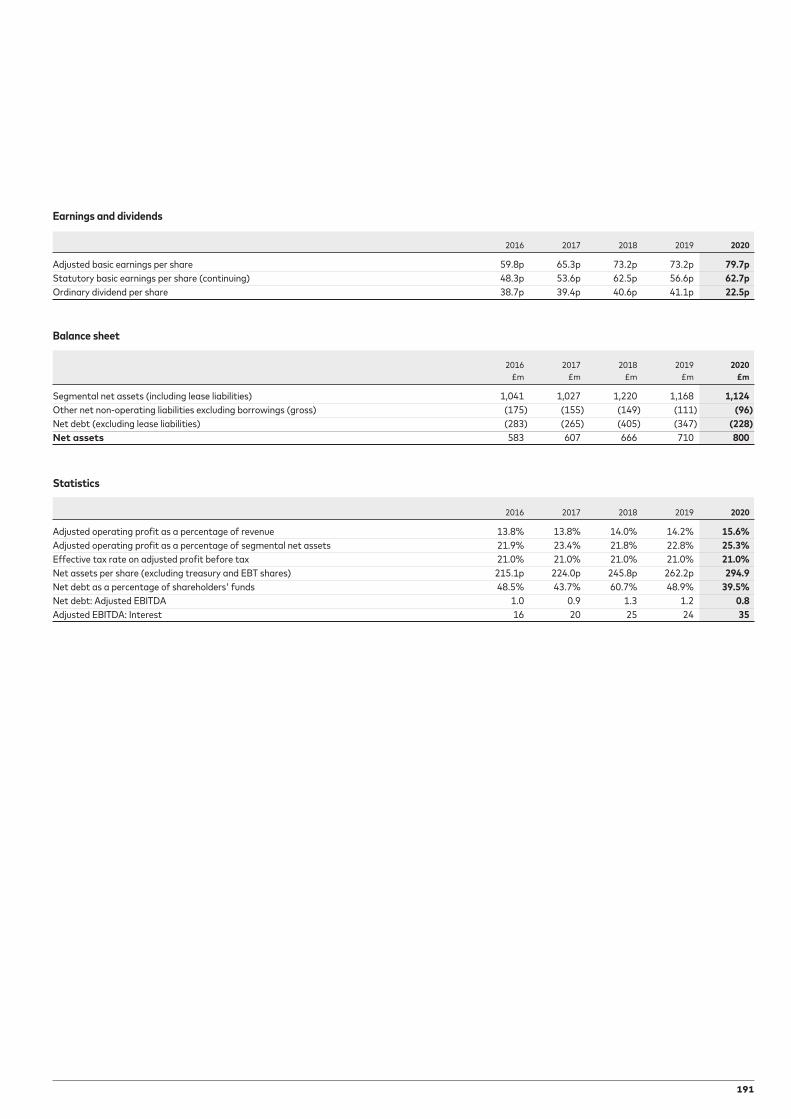
Earnings and dividends 2016 2017 2018 2019 2020
Adjusted basic earnings per share 59.8p 65.3p 73.2p 73.2p 79.7pStatutory basic earnings per share (continuing) 48.3p 53.6p 62.5p 56.6p 62.7pOrdinary dividend per share 38.7p 39.4p 40.6p 41.1p 22.5p
Balance sheet
2016 2017 2018 2019 2020 £m £m £m £m £m
Segmental net assets (including lease liabilities) 1,041 1,027 1,220 1,168 1,124Other net non-operating liabilities excluding borrowings (gross) (175) (155) (149) (111) (96)Net debt (excluding lease liabilities) (283) (265) (405) (347) (228)Net assets 583 607 666 710 800
Statistics 2016 2017 2018 2019 2020
Adjusted operating profit as a percentage of revenue 13.8% 13.8% 14.0% 14.2% 15.6%Adjusted operating profit as a percentage of segmental net assets 21.9% 23.4% 21.8% 22.8% 25.3%Effective tax rate on adjusted profit before tax 21.0% 21.0% 21.0% 21.0% 21.0%Net assets per share (excluding treasury and EBT shares) 215.1p 224.0p 245.8p 262.2p 294.9Net debt as a percentage of shareholders' funds 48.5% 43.7% 60.7% 48.9% 39.5%Net debt: Adjusted EBITDA 1.0 0.9 1.3 1.2 0.8Adjusted EBITDA: Interest 16 20 25 24 35
191
Shareholder and general information
Announcement of trading resultsThe trading results for the Group for the first half of 2021 will be announced on 30 July 2021. The trading results for the full year ending 31 December 2021 will be announced in February 2022.
Interim management statements will be issued in May and November 2021.
Expected dividend paymentsFinal: 14 May 2021
Interim: September 2021
Share prices and capital gains taxThe closing price of the Company’s ordinary shares on the London Stock Exchange on 31 December 2020 was 1,165.0p (2019: 1,179.0p). The market value of the Company’s ordinary shares on 31 March 1982, as calculated for capital gains tax purposes, was 53.5p per share.
The Company’s SEAQ number is 51443.
Enquiries about shareholdingsFor enquiries concerning shareholders’ personal holdings, please contact the Company’s Registrar: Equiniti (contact details appear to the right).
Please remember to tell Equiniti if you move house, change bank details or if there is any other change to your account information.
Managing your shares on-lineShareholders can manage their holdings on-line by registering with Shareview, the internet based platform provided by Equiniti. Registration is a straightforward process and allows shareholders to:• help us to reduce print, paper and postage costs
and the associated environmental impact of these;• cast your AGM vote electronically;• receive an email alert when important shareholder
documents are available on-line such as Annual Reports and Notices of General Meetings;
• access details of your individual shareholding quickly and securely;
• set up a dividend mandate on-line; and• change your registered postal address or your
dividend mandate details.
To find out more information about the services offered by Shareview and to register, please visit: www.shareview.co.uk.
Corporate websiteThe IMI plc website provides a wealth of useful information for shareholders and should be your first port of call for general queries relating to the Company and your shares. As well as providing share price data and financial history, the site also provides background information about the Company.Shareholders are also encouraged to sign up to receive news alerts by email in the Investors section of the website. These include all of the financial news releases from throughout the year that are not sent to shareholders by post. You can access the corporate website at: www.imiplc.com.
Annual General Meeting 2021This year’s AGM will be held on 6 May 2021. For further information, please refer to the Notice of Meeting which is on the corporate website.
Individual Savings Account (ISA)IMI‘s ordinary shares can be held in an ISA. For information about the ISA operated by our Registrar, Equiniti, please call the Equiniti ISA helpline on 0345 300 0430. Lines are open from 8.30am to 5.30pm, Monday to Friday (excluding public holidays in England and Wales).
Share dealing serviceManaged by Equiniti, the Company’s Registrar, the IMI plc share dealing service provides shareholders with a simple way of buying and selling IMI ordinary shares. Telephone: 0345 603 7037. Full written details can be obtained from Equiniti (contact details appear to the right).
Share fraudShare fraud includes scams where investors are called out of the blue and offered shares that often turn out to be worthless or non-existent, or an inflated price for shares they own. These calls come from fraudsters operating in ‘boiler rooms’ that are mostly based abroad. Further information on how to spot share fraud or report a scam can be found on our corporate website.
American Depository ReceiptsIMI plc has an American Depository Receipt (‘ADR’) programme that trades on the Over-The-Counter market in the USA, using the symbol IMIAY. ADR enquiries should be directed to Citibank Shareholder Services, PO Box 43077, Providence, RI 02940-3077, USA. Toll-free number in the USA is 1-877-CITI-ADR (877-248-4237) and from outside the USA is 1-781-575-4555. You can also email [email protected].
Headquarters and registered officeLakesideSolihull ParkwayBirmingham Business ParkBirminghamB37 7XZTelephone: +44 121 717 3700IMI plc is registered in England No.714275
RegistrarsEquinitiAspect HouseSpencer RoadLancingWest SussexBN99 6DATelephone: 0371 384 2916 or from overseas +44 121 415 7047Lines are open 8.30am to 5.30pm, Monday to Friday (excluding public holidays in England and Wales).
StockbrokersJPMorgan CazenoveBank of America
AuditorErnst & Young LLP
Cautionary statementThis Annual Report may contain forward-looking statements that may or may not prove accurate. For example, statements regarding expected revenue growth and operating margins, market trends and our product pipeline are forward-looking statements. It is believed that the expectations reflected in these statements are reasonable but they may be affected by a number of risks and uncertainties that are inherent in any forward-looking statement which could cause actual results to differ materially from those currently anticipated. Any forward-looking statement is made in good faith and based on information available to IMI plc as of the date of the preparation of this Annual Report. All written or oral forward-looking statements attributable to IMI plc are qualified by this caution. IMI plc does not undertake any obligation to update or revise any forward-looking statement to reflect any change in circumstances or in IMI plc’s expectations.
192 IMI plc Annual Report & Accounts 2020

Designed and produced by Design Motive LtdPrinted and bound in the UK by CPI Colour Ltd

IMI plcLakesideSolihull ParkwayBirmingham Business ParkBirmingham B37 7XZUnited Kingdom
www.imiplc.com