Breaking Out of the Mold: Minority-Majority Districts and ...

October 2018 Zachary Chertok Research Analyst, Human Capital Management
RR
BREAKING THE MOLD ON GENERALIZED LEADERSHIP IS A WINNING STRATEGY

Aberdeen has found that employers are still overwhelmingly focused on hiring top talent to fill today’s skills gaps over cultivating internal talent to grow to meet top-quality expectations. In fact, the gap in resource spend between these two focus areas can be as wide as 2 to 1. With such a large gap, we need to ask ourselves if we are just pouring good money after bad with this approach.
A 10-year Shift in Talent Management
Businesses have a labor continuity problem. Aberdeen has found that 72% of companies are dissatisfied with the quality of hired talent just one to three years after bringing them onboard. Furthermore, voluntary turnover is continuing to increase by more than 10% per year, despite the average tenure among employees who stay with the organization rising to between five and six years in the last 12 months.
Looking outside Aberdeen’s native data, the picture is not clear on what is happening in the workforce, nor is the data clear or consistent enough to indicate trends in tenure, labor availability, or labor movement in terms of how skilled employees are matching up with employer talent needs. A big part of gaps in tenure and turnover is the extended stay of employees age 55 and over in the workforce. In 2014, the US Bureau of Labor Statistics (BLS) found that the workforce participation rate for this age group was at 40%. In subsequent years, every forecast has this number rising as retirement accounts are insufficient in supporting a Baby Boomer exodus from the workforce.
Employers are trying to standardize a definition of top talent at a time when involuntary dimensions are being added to the workforce. Aberdeen has found that as little as six years ago, the old workforce continuity paradigm still held: As more tenured workers rose into management roles, younger employees took the helm of entry-level roles. Seasoned workers trained new workers in the basic skills required for the role while internal performance objectives and learning and development resources helped younger workers realize career potential to be had at the organization. As older workers eventually retired, and as younger workers passed the 5-year tenure period, they rose into the management roles
The Aberdeen maturity class framework is comprised of three groups of survey respondents. This data is used to determine overall company performance. Classified by their self-reported performance across several key metrics, each respondent falls into one of three categories:
► Best-in-Class: Top 20% of respondents based on performance
► Industry Average: Middle 50%of respondents based on performance
► Laggard: Bottom 30% of respondents based on performance
Sometimes we refer to a fourth
category, All Others, which is
Industry Average and Laggard combined.

vacated by retiring employees only to perpetuate the cycle as the next wave came into the entry-level positions.
Table 1: Top Labor Continuity Tools 2008 vs. 2018
2008 2018
Performance reviews 60% 70% Engagement management 48% 65% Learning management system 75% 60% Management mentor programs 29% 58% Internal career branding 46% 53%
N = 204 source: Aberdeen, June 2017
Table 1 shows the top resources used to foster labor continuity in 2018 as compared to how these resources were used in 2008. While the overall resource objectives for fostering and driving employee performance improvements remained the same over the last 10 years, the focus on what needs to be at the center of that drive has shifted.
In 2008, Aberdeen found that leadership development could be driven through internal relationship management — an inherent process as older generations and tenured employees had a built-in incentive to train younger employees to drive departmental or divisional success. In other words, training and cultivating younger talent made older managers look good through improving departmental performance. Back in 2008, Best-in-Class companies were 40% more likely than All Others (95% vs. 68%) to realize employee performance improvements through traditional performance reviews and manager-led training initiatives built on structured programming. By 2018, these highly structured methods lost their appeal. The Best-in-Class likelihood to see performance improvements driven by these methods dropped by 13% (40% vs. 27%) with overall performance improvement potential dropping by 27% (95% vs. 68%).
By 2018, the Best-in-Class likelihood to see performance improvements driven by structured performance methods dropped by 13%.
What Changed?
The BLS statistic from earlier is a key indicator of why this transformation occurred. Today’s workforce is looking at management among a six generation-spanning workforce. To put this in perspective, Bloomberg found that U.S. seniors are staying employed at the highest rate in five decades with 80% of people retiring for reasons beyond their control. With generational continuity broken, some employers may be rejoicing at the opportunity to keep skilled and trained workers in the workforce for longer, but the reality is that these workers eventually slow down or partially retire. A new lack of labor continuity is threatening to upend both the skills and the leadership needed to take risks on new ideas that will keep the company going.
The workforce is now more multi-dimensional than ever before, and it is causing problems in performance measurement, top talent identification, employee retention, and innovation cultivation. If the linear cycle of personalized performance management and leadership identification is broken, then how are managers supposed to source and develop the leadership they need to keep the company competitive?
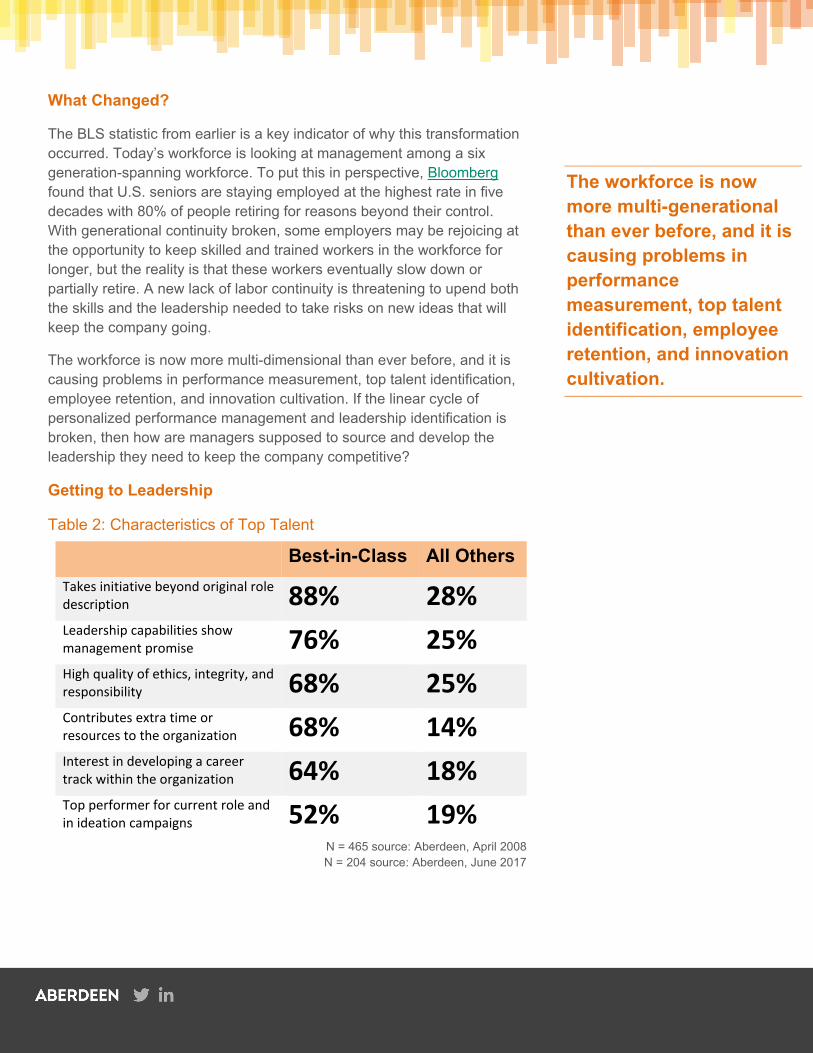
Getting to Leadership
Table 2: Characteristics of Top Talent
Best-in-Class All Others Takes initiative beyond original role description 88% 28% Leadership capabilities show management promise 76% 25% High quality of ethics, integrity, and responsibility 68% 25% Contributes extra time or resources to the organization 68% 14% Interest in developing a career track within the organization 64% 18% Top performer for current role and in ideation campaigns 52% 19%
N = 465 source: Aberdeen, April 2008 N = 204 source: Aberdeen, June 2017
The workforce is now more multi-generational than ever before, and it is causing problems in performance measurement, top talent identification, employee retention, and innovation cultivation.
Table 2 shows the top ways in which the Best-in-Class currently define top talent as compared to All Other companies. The Best-in-Class are focused on employee self-motivation in terms of leadership and initiative. The problem with this is that as companies rely on employee self-motivation to resolve the intergenerational training and development gap, employee tenure is shrinking because employees are choosing to develop their own careers rather than in tandem with achieving management goals and objectives.
One of the key differentiators between the Best-in-Class and All Others that signals a shift in the right direction toward solving the problem of developing high-quality leadership, is that the Best-in-Class are looking for signs of new employees seeking a long-term employer for career development. Going back to Table 1, the Best-in-Class are making a strong push into engagement management, increasing spend by 17%.
Best-in-Class and All Other companies are both 68% weighted toward an understanding that they suffer from low employee engagement. In other words, their performance management ecosystem focuses more on business metrics than it does on the individual talent defining the quality of those metrics. Traditional performance reviews hold employees to a collective standard that only guarantees that individuals will rise to a known expectation. Furthermore, 64% of Best-in-Class companies recognize that retroactive performance reviews are overly subjective and lack the degree of honesty needed to objectively identify leadership potential.
When an employee exceeds expectations, there is little means to quantify it towards promotional value, and when an employee underperforms, there is little understanding as to why. While the Best-in-Class are 2.5 times more likely than All Others (20% vs. 8%) to find that more than 50% of their workforce is, or should be, eligible for promotion, just 20% of the Best-in-Class assemble the right metrics to understand where promotion is not only possible, but where it will also be beneficial to retention and organizational performance.
When it comes to identifying leadership potential before it leaves the company, the Best-in-Class are making strategic changes that include looking at internal talent as well as defining characteristics of what to look for when hiring. Today, the Best-in-Class are 3.5 times more likely than All Others (56% vs. 16%) to be shifting their talent
The Best-in-Class are making a strong push into engagement management, increasing spend by 17%.

focus to develop internal talent to be equally as competitive as external talent to fill their skills and leadership gaps.
Figure 1: Areas of Increased Spend in the Next 12 Months
N = 204 source: Aberdeen, June 2017
Figure 1 shows where the Best-in-Class expect to focus spend in the next 12 months. Developing leadership and innovation is a core business focus for more than 70% of these companies. A key component to sourcing the right talent to take the organization into the next generation is having the right metrics in the right time frame to make equitable decisions about hiring, firing, moving, or promoting employees when they deliver on specific types of contextual performance objectives. With the increasing number of dimensions within the workforce to watch in terms of performance, managers need the tools to get more individualized with performance analyses and the identification of strategic employee growth objectives.
As indicated in Figure 1, the Best-in-Class are moving away from reactive, periodic, and subjective performance reviews in favor of aggregated and integrated data sets consolidated into centralized management dashboards that output metrics for managers to assess labor performance across the company, the division, the department, and the individual in question. Having all these metrics at their disposal in real time not only enables managers to be more accountable for departmental performance, but to spot emerging potential among individual employees as compared to the moving target of overall workforce performance as well.
Figure 1 also shows the top three resource categories that employers are using to amass and aggregate performance data are rewards management, recognition, and wellness and well-being. Together,
Developing leadership and innovation is a core business focus for more than 70% of Best-in-Class companies.

these resources inform management about employee stresses that detract from performance while indicating how employee interests shape the kinds of campaigns, achievements, and feedback they participate in and receive. Linking these together in a common dashboard analysis helps managers to understand more about the context behind employee performance changes while providing insight for managers. The resulting insight ensures that employees get access to the right development tracks and resources, get placed on the right goals and initiatives, and get to work with the best teams to optimize their performance potential. In a similar way, the feedback channels in recognition help managers understand what types of potential leaders are emerging within the teams that form within the workforce dynamic.
For 40% of Best-in-Class companies, these metrics, and the significance they convey, carry forward into the learning and development infrastructure to set employees on the path to management, leadership, or promotional potential. Furthermore, Aberdeen has found that the aggregated and real-time metric view lets 55% of Best-in-Class companies more clearly see and plan around how different employee qualities are integral to leadership potential at different times and under different workplace paradigms. In this way, the definition of top-quality talent and leadership potential fluctuates with the changing dynamics of the workforce such that HR and senior management can guarantee a higher rate of success in supporting innovation while preserving a leadership hierarchy irrespective of where the generations, and subsequent experience, may fall within the organization.
By the Numbers
As Best-in-Class companies shift to a technology ecosystem that supports a moving target on performance management data and definitions of top talent, they are making top-talent definitions more accountable to emerging employee potential. In other words, these companies are willing to break the mold on generalized, standardized definitions of leadership to adapt to a changing definition of top talent that connects individually to the position inside the organization. As they search for equitable leadership potential, they are developing talent pipelines that consist of candidates coming from both inside and outside the organization.
For 40% of Best-in-Class companies, performance metrics, and the significance they convey, carry forward into the learning and development infrastructure to set employees on the path to management, leadership, or promotion potential.
The metrics that define the skills and characteristics for leadership potential are driven by real-time performance metrics emerging from a host of technology resources inside the organization including rewards management, recognition, social feedback channels, and wellness and well-being. Furthermore, these resource datasets are being integrated into succession planning to develop a defined profile of existing leaders and top performers within current positions such that Best-in-Class organizations can identify the characteristics of success more than 70% of the time.
The new, adaptive model is working for Best-in-Class companies who are 78% more likely than All Others (34% vs. 19%) to build leadership characteristic profiles based on internal performance metrics and external business metrics. These companies are 48% more likely than All Others (34% vs. 23%) to source innovation and leadership potential from within the workforce, which has allowed them to enter new markets and develop new departments in the last 12 months. The Best-in-Class are also 32% likely to be able to identify successors for more than 50% of their organization’s key positions before the positions are vacated, up almost 15% from 2012.
Best-in-Class companies are 92% more likely than All Others (25% vs. 13%) to be able to drive employee leadership and performance improvement potential while increasing the rate at which employees achieve or exceed management goals. While the Best-in-Class are driving these organizational metrics, they are 49% more likely than All Others (91% vs. 61%) to find that cumulative employee retention, inclusive of re-hiring after an employee has left the organization at least once, exceeds five years.
In the end, moving to a real-time, integrated, employee performance-data objective improves the way that companies can capitalize on and recognize the leadership potential coming from their existing workforce and their talent pipelines. The net result of this visualization approach is that the Best-in-Class can expand into and explore new markets at a faster rate than All Other companies. At the same time, internal innovation rates are up, and employees are exploring their career potential at the company while striving to achieve management goals, all leading to central improvements in organizational performance metrics. For employees, retention incentives are growing, and leadership opportunities are clear, real, and indicating opportunities for growth. Something to keep in mind is that for 71% of employees at Best-in-Class companies, growth,
Best-in-Class companies are 92% more likely than All Others to be able to drive employee leadership and performance improvement potential while increasing the rate at which employees achieve or exceed management goals.

leadership opportunities, and internal recognition are key reasons that top performers join and stay with the organization, bringing the need to de-generalize leadership definitions full circle.
Related Research
Unifying the Multi-Channel Workforce; September 2018
Improving the Workforce: Putting Internal Talent on the Front Lines; February 2017
Hiring Tomorrow’s Workforce Today: The Talent Pipeline; November 2017
In Pursuit of Productivity: How Technology Can Map It; January 2018
About Aberdeen Group
Since 1988, Aberdeen Group has published research that helps businesses worldwide to improve their performance. Our analysts derive fact-based, vendor-neutral insights from a proprietary analytical framework, which identifies Best-in-Class organizations from primary research conducted with industry practitioners. The resulting research content is used by hundreds of thousands of business professionals to drive smarter decision-making and improve business strategies. Aberdeen Group is headquartered in Waltham, Massachusetts, USA.
This document is the result of primary research performed by Aberdeen Group and represents the best analysis available at the time of publication. Unless otherwise noted, the entire contents of this publication are copyrighted by Aberdeen Group and may not be reproduced, distributed, archived, or transmitted in any form or by any means without prior written consent by Aberdeen Group.
17749