Breaking Down Analytical and Computational Barriers Across the Energy Industry Using Databricks
33
Breaking Down Analytical and Computational Barriers in Energy Data Analytics Jonathan Farland DNV GL Energy
-
Upload
spark-summit -
Category
Data & Analytics
-
view
280 -
download
0
Transcript of Breaking Down Analytical and Computational Barriers Across the Energy Industry Using Databricks
Breaking Down Analytical and Computational Barriers in Energy Data Analytics
Jonathan FarlandDNV GL Energy

• IntroductionsWho is DNV GL?
• Overview• Data ScienceEnergy Analytics
• DemonstrationStatistical Computing Pilot
• PlansConcepts in Development
• DiscussionQ&A
Agenda

DNV GL
Policy Production Transmission & Distribution
Use

400offices
100countries
16,000employees
150years
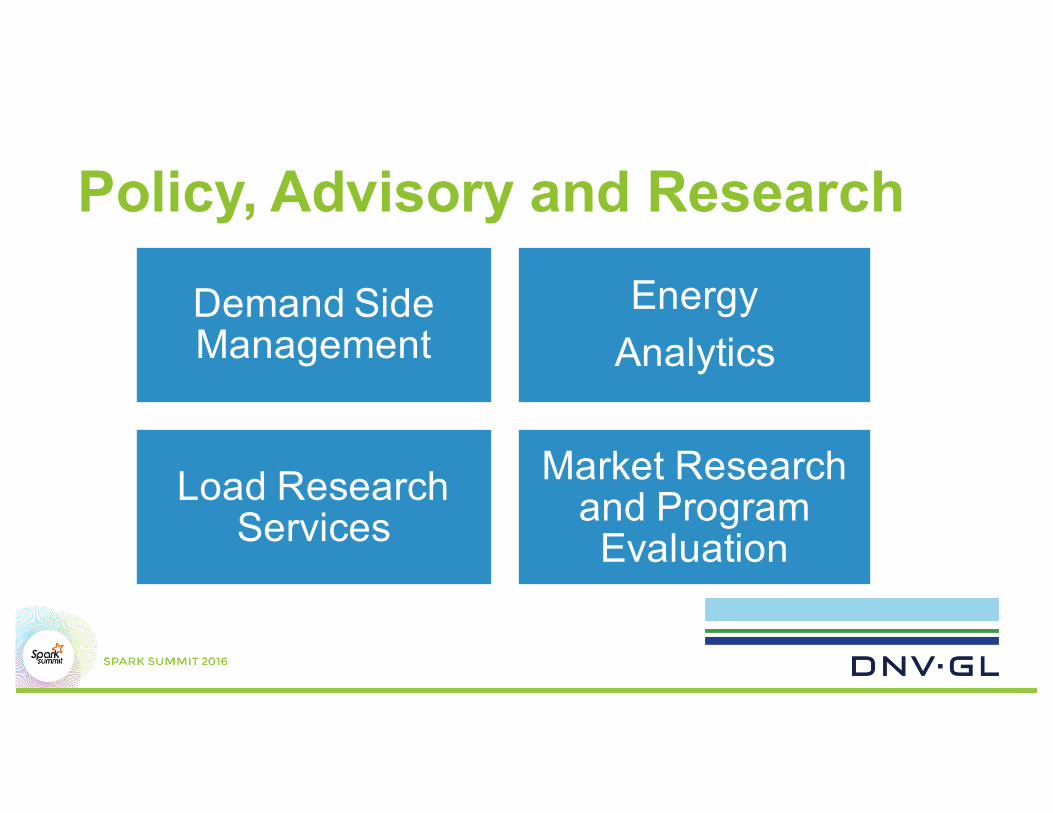
Policy, Advisory and Research
Demand Side Management
Energy Analytics
Load Research Services
Market Research and Program Evaluation
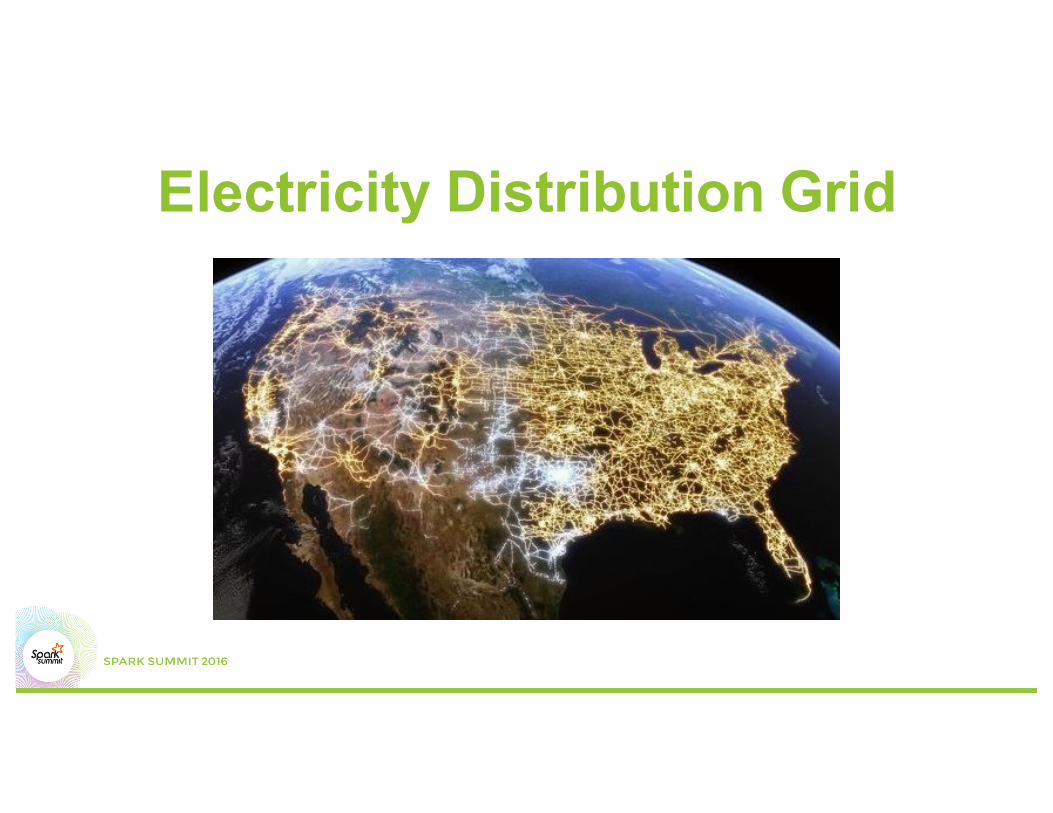
Electricity Distribution Grid
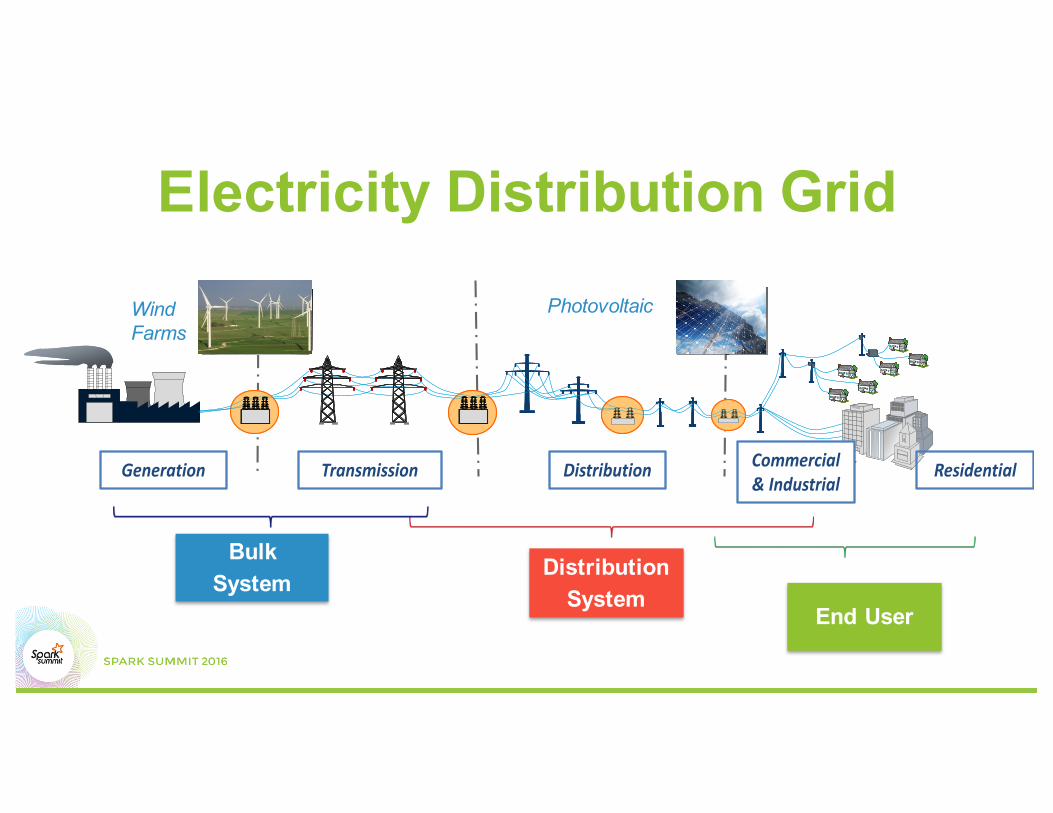
Electricity Distribution Grid
Transmission Distribution ConsumerGeneration Transmission Distribution ConsumerGeneration
WindFarms
PhotoVoltaic
AggregatedUtilityScale2-50MW
UtilityScale
100kW-2MW
DistributedScale
25kW-100kW
ResidentialCommercial&Industrial
DistributionTransmissionGeneration
BulkStorage>50MW
Distribution System
End User
Bulk System
PhotovoltaicWind Farms
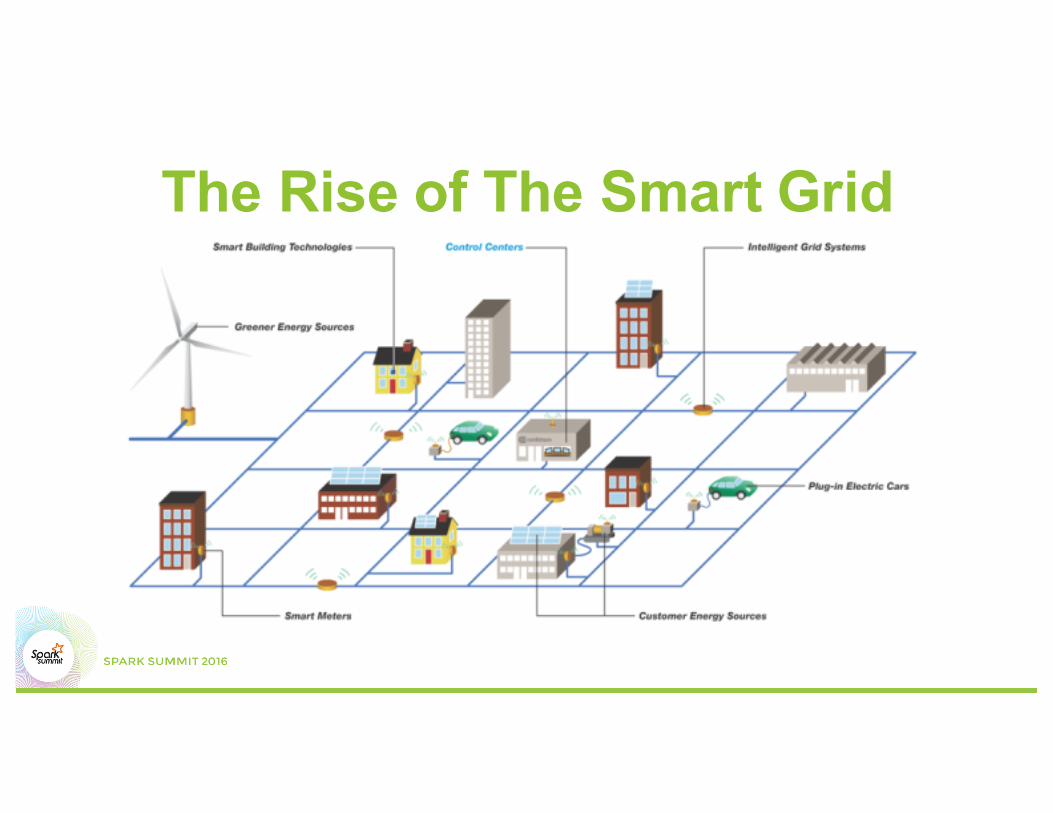
The Rise of The Smart Grid

Energy Data Science
Jonathan FarlandDNV GL Energy

Terminology

11
12

13

14

15
16

Forecasting Approaches
– Similar Day Matching – Statistically Adjusted Engineering
(SAE)– Univariate Time Series (ARIMA)– Multiple Linear Regression – Econometric
– Machine / Statistical Learning– Semiparametric Regression– Artificial Neural Networks– Fuzzy Logic– Support Vector Machines– Gradient Boosting
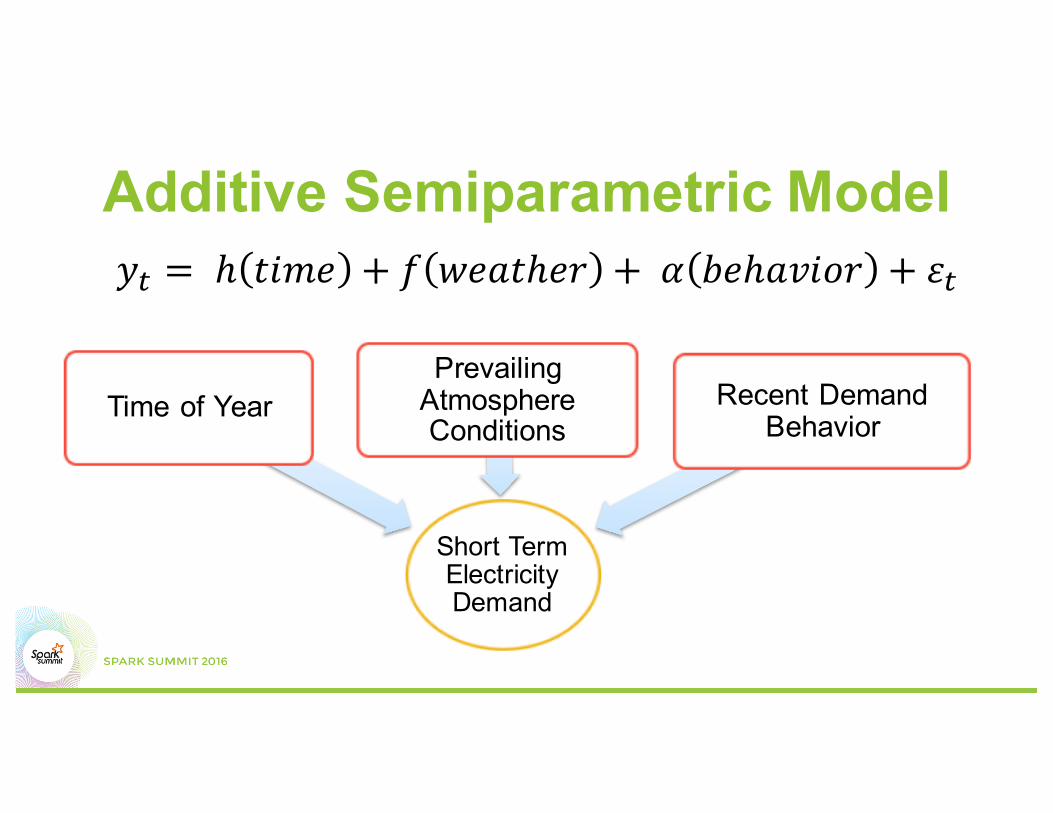
Additive Semiparametric Model𝑦" = ℎ 𝑡𝑖𝑚𝑒 + 𝑓 𝑤𝑒𝑎𝑡ℎ𝑒𝑟 + 𝛼 𝑏𝑒ℎ𝑎𝑣𝑖𝑜𝑟 + 𝜀"
Short Term Electricity Demand
Time of Year Prevailing
Atmosphere Conditions
Recent Demand Behavior

Additive Semiparametric Model𝑦" = ℎ 𝑡𝑖𝑚𝑒 + 𝑓 𝑤𝑒𝑎𝑡ℎ𝑒𝑟 + 𝛼 𝑏𝑒ℎ𝑎𝑣𝑖𝑜𝑟 + 𝜀"
Short Term Electricity Demand
Time of Year Prevailing
Atmosphere Conditions
Recent Demand Behavior

Emerging Technologies
Photovoltaic Cells (e.g., Solar)
Electric Vehicles Storage Wind
Energy Efficiency Demand Response
21
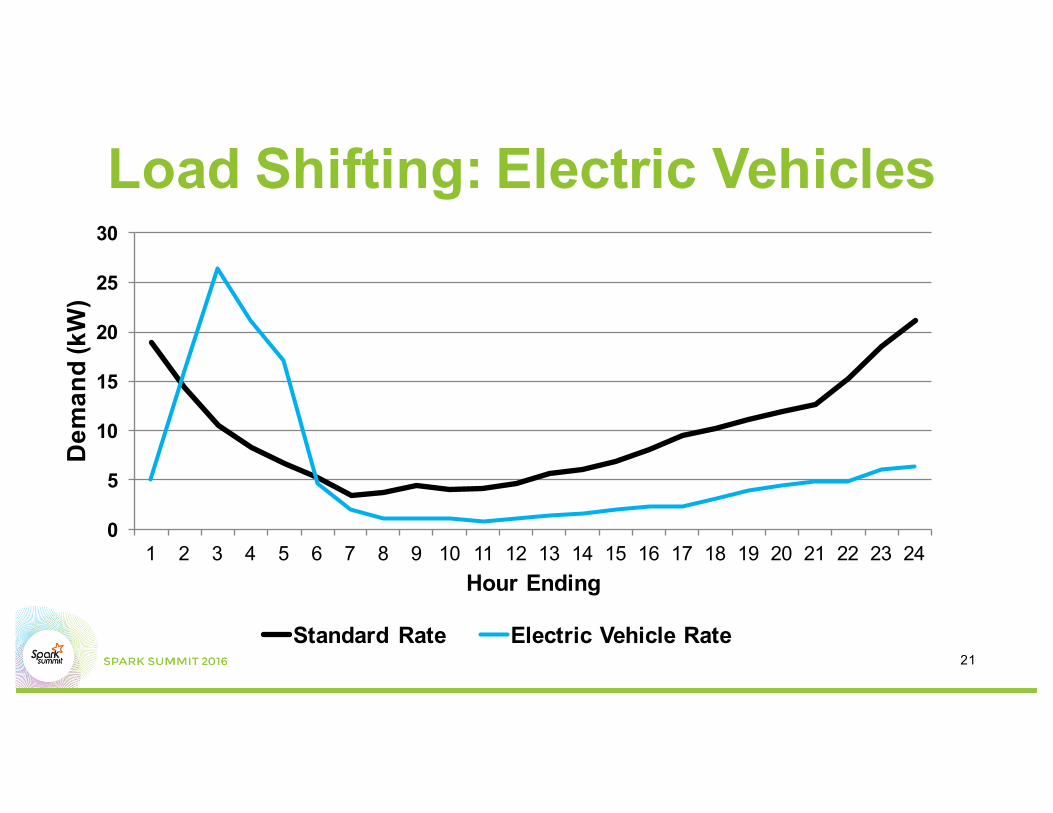
Load Shifting: Electric Vehicles
0
5
10
15
20
25
30
1 2 3 4 5 6 7 8 9 10 11 12 13 14 15 16 17 18 19 20 21 22 23 24
Dem
and
(kW
)
Hour Ending
Standard Rate Electric Vehicle Rate

22
-20,000 40,000 60,000 80,000
100,000 120,000 140,000 160,000
1 2 3 4 5 6 7 8 9 10 11 12 13 14 15 16 17 18 19 20 21 22 23 24
Load
(kW
h)
Hour Ending
Forecasted - DR Reduction Forecasted - DR BaselineForecasted - DR Impacted Load Actual DR - Reduction
Load Reduction: Demand Response

Databricks + Spark Pilot
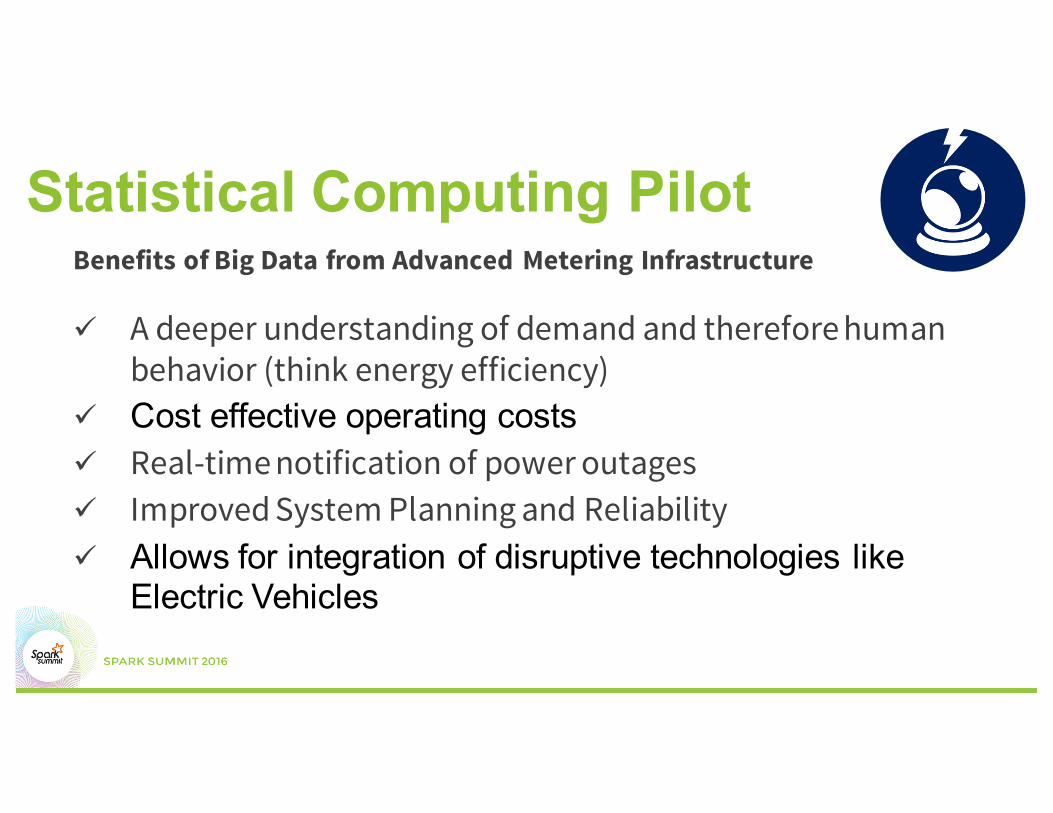
Benefits of Big Data from Advanced Metering Infrastructure
ü A deeper understanding of demand and therefore human behavior (think energy efficiency)
ü Cost effective operating costsü Real-time notification of power outagesü Improved System Planning and Reliabilityü Allows for integration of disruptive technologies like
Electric Vehicles
Statistical Computing Pilot

Pilot Design
Data Generating
ProcessAnalytics
Statistical Computing Pilot
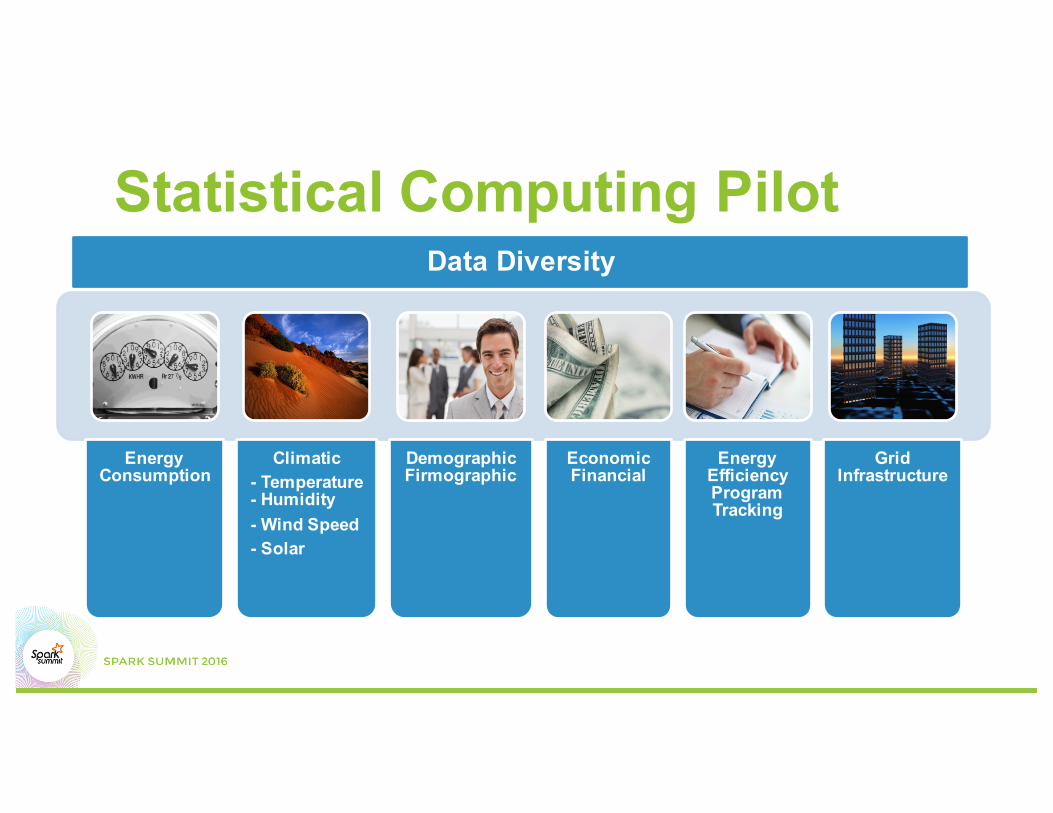
EnergyConsumption
Climatic- Temperature - Humidity- Wind Speed- Solar
Demographic Firmographic
Economic Financial
Energy Efficiency Program Tracking
Grid Infrastructure
Statistical Computing PilotData Diversity

Key Focus Areas
Performance Scalability
Granularity

Going Further

Use Cases

DEMONSTRATION

VISION OF THE FUTURE

Current Concepts in Development
Weather Normalization at Scale (e.g., California)
Real-time Energy Forecasting Using Statistical Learning and Spark Streaming API
Real-time Customer Sentiment Analysis
Grid Reliability Analysis
Cybercrime Protection of Electricity Grids