
Breakdown study based on direct in situ observation of ...
17
Breakdown study based on direct in situ observation of inner surfaces of an rf accelerating cavity during a high-gradient test Tetsuo Abe, * Tatsuya Kageyama, Hiroshi Sakai, Yasunao Takeuchi, and Kazuo Yoshino Accelerator Laboratory, High Energy Accelerator Research Organization (KEK), Tsukuba, Ibaraki 305-0801, Japan (Received 1 September 2015; revised manuscript received 30 June 2016; published 4 October 2016) We have developed normal-conducting accelerating single-cell cavities with a complete higher-order- mode (HOM) heavily damped structure, into which we feed a 508.9-MHz continuous wave. During a high- gradient test of the second production version of the cavity, we performed a breakdown study based on direct in situ observation of the inner surfaces of the cavity. This paper presents our experimental findings obtained from this observation. DOI: 10.1103/PhysRevAccelBeams.19.102001 I. INTRODUCTION Particle acceleration using radio-frequency (rf) electro- magnetic waves is a widely used method in both large and small accelerators. Normal-conducting rf accelerating cavities (hereafter, rf cavities or cavities) are adequate and often used for high-current storage rings with beam currents of a few amperes or higher and high-gradient accelerators with gradients of several tens of megavolts per meter or higher, where high-purity copper is currently considered to be the best material for cavity bodies based on a comprehensive evaluation of the electric conductivity, thermal conductivity, outgassing rate, rf breakdown field, ease of machining, and cost. For the above-mentioned former (high-current) and latter (high-gradient) types of accelerators, rf cavities are required to have continuously high stability, i.e., an extremely low cavity breakdown rate over a long period of time, and a high gradient with a sufficiently-low cavity breakdown rate, respectively. To satisfy these requirements, the cavity breakdown rate should be minimized; however, this is currently very difficult because the real source of cavity breakdowns, i.e., the cavity-breakdown trigger mechanism, is unknown. After fabricating rf cavities and before using them in accelerator operation, we perform a high-gradient test called rf conditioning, where we first feed a low rf power into the cavity, and gradually increase the input rf power and the accelerating field while maintaining certain cavity- related quantities, such as the vacuum pressure (light blue lines in Fig. 7) and cavity breakdown rate [1], at values lower than their corresponding reference values. In the early stages of rf conditioning, cavity breakdowns occur frequently with increases in vacuum pressure and/or vacuum arcs, even when the accelerating field is low. This process removes contaminations and microscopic defects in the cavity surface using an rf field. Once the accelerating gradient reaches its maximum expected value in the high- gradient test, almost no further increases in vacuum pressure occur, and the cavity breakdown rate usually decreases to an acceptable level at a gradient lower than the maximum achieved gradient unless the vacuum is broken or a long time passes without feeding a high rf power. Here rf cavities should be designed to ensure that the maximum expected gradient is sufficiently higher than the accelerator design requirement. However, the cavity breakdown rate rapidly increases as the accelerating gradient increases. Therefore, technology that enables a lower final cavity breakdown rate can contribute to developments of future accelerators with higher luminosities and/or higher energies. Various experimental breakdown studies have been per- formed and have provided measurements of various quan- tities, such as the cavity breakdown rate and its dependence on the accelerating gradient, the rf waveform when cavity breakdown occurs, the dark current before and after cavity breakdown occurs and its dependence on the accelerating gradient, and partial or total vacuum pressure increases during high-gradient tests (e.g., [2–4]). In particular, a large amount of breakdown studies have been performed on normal-conducting X-band accelerating structures using traveling or standing waves in pulsed operation, leading to the discovery of (1) a scaling law describing the cavity breakdown rate as a function of the gradient and rf pulse width (e.g., [5]); (2) the significant effect of the magnetic field and pulsed surface heating on the cavity breakdown rate [6,7]; and (3) a new local field quantity called the modified Poynting vector, which gives the high-gradient performance limit by cavity breakdown [5]. However, these measured quantities provide only indirect information about the cavity breakdown trigger, meaning it is difficult to use * [email protected] Published by the American Physical Society under the terms of the Creative Commons Attribution 3.0 License. Further distri- bution of this work must maintain attribution to the author(s) and the published article’s title, journal citation, and DOI. PHYSICAL REVIEW ACCELERATORS AND BEAMS 19, 102001 (2016) 2469-9888=16=19(10)=102001(17) 102001-1 Published by the American Physical Society
Transcript of Breakdown study based on direct in situ observation of ...
Breakdown study based on direct in situ observation of inner surfacesof an rf accelerating cavity during a high-gradient test
Tetsuo Abe,* Tatsuya Kageyama, Hiroshi Sakai, Yasunao Takeuchi, and Kazuo YoshinoAccelerator Laboratory, High Energy Accelerator Research Organization (KEK),
Tsukuba, Ibaraki 305-0801, Japan(Received 1 September 2015; revised manuscript received 30 June 2016; published 4 October 2016)
We have developed normal-conducting accelerating single-cell cavities with a complete higher-order-mode (HOM) heavily damped structure, into which we feed a 508.9-MHz continuous wave. During a high-gradient test of the second production version of the cavity, we performed a breakdown study based ondirect in situ observation of the inner surfaces of the cavity. This paper presents our experimental findingsobtained from this observation.
DOI: 10.1103/PhysRevAccelBeams.19.102001
I. INTRODUCTION
Particle acceleration using radio-frequency (rf) electro-magnetic waves is a widely used method in both largeand small accelerators. Normal-conducting rf acceleratingcavities (hereafter, rf cavities or cavities) are adequate andoften used for high-current storage rings with beamcurrents of a few amperes or higher and high-gradientaccelerators with gradients of several tens of megavolts permeter or higher, where high-purity copper is currentlyconsidered to be the best material for cavity bodies basedon a comprehensive evaluation of the electric conductivity,thermal conductivity, outgassing rate, rf breakdown field,ease of machining, and cost. For the above-mentionedformer (high-current) and latter (high-gradient) types ofaccelerators, rf cavities are required to have continuouslyhigh stability, i.e., an extremely low cavity breakdown rateover a long period of time, and a high gradient with asufficiently-low cavity breakdown rate, respectively. Tosatisfy these requirements, the cavity breakdown rateshould be minimized; however, this is currently verydifficult because the real source of cavity breakdowns,i.e., the cavity-breakdown trigger mechanism, is unknown.After fabricating rf cavities and before using them
in accelerator operation, we perform a high-gradient testcalled rf conditioning, where we first feed a low rf powerinto the cavity, and gradually increase the input rf powerand the accelerating field while maintaining certain cavity-related quantities, such as the vacuum pressure (light bluelines in Fig. 7) and cavity breakdown rate [1], at valueslower than their corresponding reference values.
In the early stages of rf conditioning, cavity breakdownsoccur frequently with increases in vacuum pressure and/orvacuum arcs, even when the accelerating field is low. Thisprocess removes contaminations and microscopic defects inthe cavity surface using an rf field. Once the acceleratinggradient reaches its maximum expected value in the high-gradient test, almost no further increases in vacuum pressureoccur, and the cavity breakdown rate usually decreases to anacceptable level at a gradient lower than the maximumachieved gradient unless the vacuum is broken or a long timepasses without feeding a high rf power. Here rf cavitiesshould be designed to ensure that the maximum expectedgradient is sufficiently higher than the accelerator designrequirement. However, the cavity breakdown rate rapidlyincreases as the accelerating gradient increases. Therefore,technology that enables a lower final cavity breakdown ratecan contribute to developments of future accelerators withhigher luminosities and/or higher energies.Various experimental breakdown studies have been per-
formed and have provided measurements of various quan-tities, such as the cavity breakdown rate and its dependenceon the accelerating gradient, the rf waveform when cavitybreakdown occurs, the dark current before and after cavitybreakdown occurs and its dependence on the acceleratinggradient, and partial or total vacuum pressure increasesduring high-gradient tests (e.g., [2–4]). In particular, a largeamount of breakdown studies have been performed onnormal-conducting X-band accelerating structures usingtraveling or standing waves in pulsed operation, leadingto the discovery of (1) a scaling law describing the cavitybreakdown rate as a function of the gradient and rf pulsewidth (e.g., [5]); (2) the significant effect of the magneticfield and pulsed surface heating on the cavity breakdownrate [6,7]; and (3) a new local field quantity called themodified Poynting vector, which gives the high-gradientperformance limit by cavity breakdown [5]. However, thesemeasured quantities provide only indirect information aboutthe cavity breakdown trigger, meaning it is difficult to use
Published by the American Physical Society under the terms ofthe Creative Commons Attribution 3.0 License. Further distri-bution of this work must maintain attribution to the author(s) andthe published article’s title, journal citation, and DOI.
PHYSICAL REVIEW ACCELERATORS AND BEAMS 19, 102001 (2016)
2469-9888=16=19(10)=102001(17) 102001-1 Published by the American Physical Society

them to learn about the trigger. On another front, vacuumarc experiments using simple electrode setups, such asparallel plates and needle-plane electrodes, have beenperformed (e.g., [8–10]). We can learn a great deal aboutthe breakdown characteristics of materials and surfaceprocesses from such experiments; however, there aresignificant differences between such setups and rf cavitiesregarding their electromagnetic field patterns and qualityfactors. In particular, rf cavities usually have a highquality factor of the order of thousands or higher foran accelerating field. After such high-gradient tests orvacuum arc experiments, microscopic inspections were
often performed, in which microscopic craters, cracks,and/or suspicious objects were observed on surfacesexposed to high electric and/or magnetic fields (e.g.,[10,11]). These are assumed to originate from the break-downs; however, it is unclear if we can find anyassociation with the cavity breakdown trigger in any way.To elucidate the cavity-breakdown trigger mechanism,
we propose a method based on direct in situ observation ofinner surfaces of an rf cavity through video recording oflight images during a high-gradient test. This method hasthe following three features: (1) Exhaustive observation,meaning all cavity breakdown events are captured;(2) Multidirectional and wide-field observation to allowthe observation of the origin of the cavity breakdown; and(3) Accompanying statistical quantitative analysis of thedata obtained from the observation. Hereafter, this methodis called the direct observation method.In this paper, through a breakdown study of an rf
cavity developed for a positron damping ring (DR) at theSuperKEKB accelerator [12], we present our experi-mental findings obtained using the direct observationmethod, and demonstrate the usefulness of this method.Abbreviations used in this paper are listed in Table VII ofAppendix A.
II. EXPERIMENTAL SETUP AND METHODS
A. rf cavity for the DR (DR cavity)
Figure 1(a) shows a conceptual diagram of the DRcavity, which is a pillbox cavity of a single cell used toexcite a continuous TM010 standing wave as the accel-erating mode. The accelerating voltage per cavity[cavity voltage (Vc)] during DR operation is 0.70 MVand has an equivalent accelerating gradient (Eacc) of2.7 MV=m. This cavity voltage is comparable to actualoperating voltages of other accelerating cavities of the
TABLE I. Design parameters of the DR cavity.
rf operating frequency 508.9 MHzRsh=Q0
a150 Ω
Q0 ≈30000 (97% IACSb)Input coupling factor ≈1.3Cavity voltage during operation Vc ¼ 0.70 MV
(Eacc ¼ 2.7 MV=m)Cavity voltage of the specification Vc ¼ 0.80 MV
(Eacc ¼ 3.1 MV=m)Wall loss power at Vc ¼ 0.70 MV ≈110 kWWall loss power at Vc ¼ 0.80 MV ≈140 kWEðmaxÞs
c / Eacc 3.7HðmaxÞ
sd / Eacc 9.6 kAm−1ðMV=mÞ−1
aRsh and Q0 represent the shunt impedance and unloadedquality factor of the accelerating mode, respectively.
bIACS stands for International Annealed Copper Standard.cEðmaxÞ
s represents the maximum surface electric field.dHðmaxÞ
s represents the maximum surface magnetic field.FIG. 1. DR cavity.
TETSUO ABE et al. PHYS. REV. ACCEL. BEAMS 19, 102001 (2016)
102001-2

same type (normal-conducting single cells with continuousinput waves in the ultrahigh frequency range) used in recenthigh-energy accelerator operations; for example, PEP-II(476 MHz) [13] was operated at 0.50 to 0.64 MV=cavity[14], and the Australian Synchrotron (500 MHz) [15] hasbeen operated at 0.60 to 0.75 MV=cavity [16]. Typicaldesign parameters of the DR cavity are summarized inTable I.The main body of the DR cavity is made of high-purity
oxygen-free copper (C10100, ASTM F68 Class 1), andconsists of a barrel and two discoidal end plates. The innersurfaces of the barrel and the two end plates were machinedwith an accuracy of 50 μm and a surface roughness of3S to 6S. Before the final brazing, the two end plates were
electropolished; the barrel part was not electropolished.This process of electropolishing typically improves thesurface roughness; in this case, the arithmetic mean rough-ness (Ra) and maximum peak roughness (Ry) were changedfrom 1.5 and 8 μm to 0.2 and 1 μm (typical measurements),respectively, as shown in Fig. 2, where the skin depth ofcopper at 508.9 MHz is approximately 3 μm. We havedemonstrated definite positive results of this type ofelectropolishing through high-gradient tests [17]. In thefinal brazing, the barrel and two end plates were bonded toform a pillbox cavity.For the purpose of frequency tuning, one of the end
plates has a bump (tuning bump) with an initial height of2.5 mm in the surface region where a high magnetic fieldis applied during high-gradient operation (see Fig. 8).Reducing the bump height by 1.0 mm decreases theaccelerating-mode frequency by 286 kHz. The end plateswith and without such tuning bump are called the tuningend plate (TEP) and fixed end plate (FEP) in this paper,respectively. The FEP and TEP are located upstream anddownstream of the barrel, respectively, with respect to thepositron beam direction in the DR tunnel.Further details of the DR cavity are given in Appendix B.Thus far, we have fabricated two production versions of
the DR cavity, the first (DR cavity No. 1) in fiscal year 2012and the second (DR cavity No. 2) in fiscal year 2013, basedon the development results of a prototype cavity (DR cavityNo. 0) fabricated in fiscal year 2011 and tested early infiscal year 2012. DR cavities No. 1 and No. 2 are basedon the same electrical design, have the same mechanical
Movable Tuner
Waveguide with
DirectionalCouplers
Sputter–Ion Pump
Q Mass SpectrometerHigh–Power Input Coupler
TV Camera 1
(a) (b)
LAN cable (CAT.6) Power Meter
Power Sensors
FIG. 3. (a) Diagram of DR cavity No. 2. (b) Photograph of the test stand used for the high-gradient test of DR cavity No. 2 in aradiation-controlled area. The bold arrows indicate the flow of high rf power generated by a 1.2-MW continuous-wave klystron. Theklystron is not included in this photograph. The turbo-molecular pump is behind the sputter-ion pump.
FIG. 2. Photographs of the end plate (a) before and (b) afterelectropolishing with approximately 40 μm of etching. The outerdiameter is approximately 500 mm. The inner diameter of thebeam port is 150 mm.
BREAKDOWN STUDY BASED ON DIRECT IN SITU … PHYS. REV. ACCEL. BEAMS 19, 102001 (2016)
102001-3
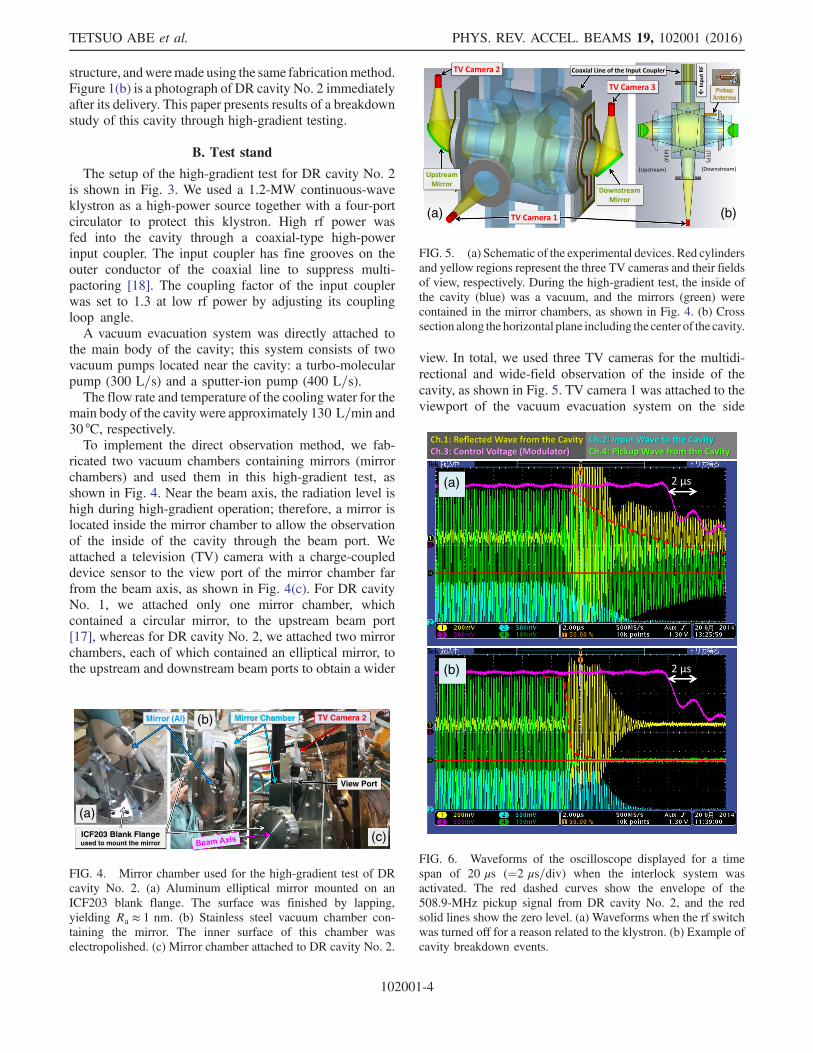
structure, andweremade using the same fabricationmethod.Figure 1(b) is a photograph of DR cavity No. 2 immediatelyafter its delivery. This paper presents results of a breakdownstudy of this cavity through high-gradient testing.
B. Test stand
The setup of the high-gradient test for DR cavity No. 2is shown in Fig. 3. We used a 1.2-MW continuous-waveklystron as a high-power source together with a four-portcirculator to protect this klystron. High rf power wasfed into the cavity through a coaxial-type high-powerinput coupler. The input coupler has fine grooves on theouter conductor of the coaxial line to suppress multi-pactoring [18]. The coupling factor of the input couplerwas set to 1.3 at low rf power by adjusting its couplingloop angle.A vacuum evacuation system was directly attached to
the main body of the cavity; this system consists of twovacuum pumps located near the cavity: a turbo-molecularpump (300 L=s) and a sputter-ion pump (400 L=s).The flow rate and temperature of the cooling water for the
main body of the cavity were approximately 130 L=min and30 °C, respectively.To implement the direct observation method, we fab-
ricated two vacuum chambers containing mirrors (mirrorchambers) and used them in this high-gradient test, asshown in Fig. 4. Near the beam axis, the radiation level ishigh during high-gradient operation; therefore, a mirror islocated inside the mirror chamber to allow the observationof the inside of the cavity through the beam port. Weattached a television (TV) camera with a charge-coupleddevice sensor to the view port of the mirror chamber farfrom the beam axis, as shown in Fig. 4(c). For DR cavityNo. 1, we attached only one mirror chamber, whichcontained a circular mirror, to the upstream beam port[17], whereas for DR cavity No. 2, we attached two mirrorchambers, each of which contained an elliptical mirror, tothe upstream and downstream beam ports to obtain a wider
view. In total, we used three TV cameras for the multidi-rectional and wide-field observation of the inside of thecavity, as shown in Fig. 5. TV camera 1 was attached to theviewport of the vacuum evacuation system on the side
(b)
(a)
FIG. 6. Waveforms of the oscilloscope displayed for a timespan of 20 μs (¼2 μs=div) when the interlock system wasactivated. The red dashed curves show the envelope of the508.9-MHz pickup signal from DR cavity No. 2, and the redsolid lines show the zero level. (a) Waveforms when the rf switchwas turned off for a reason related to the klystron. (b) Example ofcavity breakdown events.
(a) (b)
FIG. 5. (a) Schematic of the experimental devices. Red cylindersand yellow regions represent the three TV cameras and their fieldsof view, respectively. During the high-gradient test, the inside ofthe cavity (blue) was a vacuum, and the mirrors (green) werecontained in the mirror chambers, as shown in Fig. 4. (b) Crosssection along the horizontal plane including the center of the cavity.
TV Camera 2
(c)
(a)
(b)
ICF203 Blank Flange used to mount the mirror
View Port
Mirror ChamberMirror (Al)
FIG. 4. Mirror chamber used for the high-gradient test of DRcavity No. 2. (a) Aluminum elliptical mirror mounted on anICF203 blank flange. The surface was finished by lapping,yielding Ra ≈ 1 nm. (b) Stainless steel vacuum chamber con-taining the mirror. The inner surface of this chamber waselectropolished. (c) Mirror chamber attached to DR cavity No. 2.
TETSUO ABE et al. PHYS. REV. ACCEL. BEAMS 19, 102001 (2016)
102001-4

opposite the input coupler. TV camera 2 was attached to theupstream beam port and aimed toward the downstream endplate (the TEP). TV camera 3 was attached to the down-stream beam port and aimed toward the upstream end plate(the FEP). Note that we use the words “upstream” and“downstream” for convenience; no beam was injected intothe cavity during this high-gradient test.Videos obtained using the TV cameras were automati-
cally recorded on high-capacity storage devices using skipback recorders during the time period from 5 s before therf switch of the low-level control system was changedfrom ON to OFF, which is the recording trigger signal,until 1 s after this change. Additionally, we recorded thenonbreakdown status manually as needed. The videoswere obtained and recorded with a frame rate of approx-imately 30 frames per second (fps) (more accurately,29.97 fps) and an image resolution of 704 × 480 pixels,and videos with different trigger timings were stored indifferent electronic files, each of which had a file size ofapproximately 13 MB in MOV format. This exhaustive
observation enables the statistical quantitative data analy-sis performed in this study.
C. Detection of cavity breakdown
In this study, cavity breakdown was detected when theinterlock system was activated by an rf power reflectedfrom the cavity exceeding a specified threshold, and inaddition, the signal through the pickup antenna from thecavity (pickup signal) decayed much more rapidly than thedecay time constant (approximately 8 μs) determined bythe loaded quality factor (approximately 13000) andfrequency. Here, such threshold was in the range of 16to 28 kW depending on the actual reflected rf power(≲3 kW for Vc ≤ 0.95 MV). Figure 6(a) shows an exam-ple of events that occurred when the interlock system wasactivated for a reason unrelated to the cavity, where suchdecay time constant was observed in the pickup signal.Conversely, Fig. 6(b) shows an example of the cavitybreakdown events in which the pickup signal droppedin less than 1 μs.
50
100
150
200
0
0
0.2
0.4
0.6
0.8
Pin
p –
Pre
fl [
kW]
Vc
[MV
]
Conditioning Time [h]
Vac
uum
Pre
ssur
e [μ
Pa]
0
1
2
3
4
5
10 20 30 40 50 60 70 80 90 100 110
0
50
100
150
200
0
0.2
0.4
0.6
0.8
Pin
p –
Pre
fl [
kW]
Vc
[MV
]
Conditioning Time [h]
Vac
uum
Pre
ssur
e [ μ
Pa]
0
1
2
3
4
5
10 20 30 40 50 60 70 80 90 100 110
FIG. 7. Conditioning histories until Vc reached (a) 0.90 MV for DR cavity No. 1 and (b) 0.95 MV for DR cavity No. 2 with datapoints recorded every 10 s. Data with no input rf power, data while the input rf power was kept constant, and data used to tune thecontrol system or klystron are excluded here. The light blue lines indicate the reference vacuum pressure specified in the automaticconditioning by computer control. If the vacuum pressure is higher than the reference pressure, the rf power is stepped down until thevacuum pressure becomes lower than the reference pressure, and then the power is gradually stepped up as long as the vacuumpressure is lower than the reference pressure. The step-up slope is proportional to the difference between the reference and vacuumpressures.
BREAKDOWN STUDY BASED ON DIRECT IN SITU … PHYS. REV. ACCEL. BEAMS 19, 102001 (2016)
102001-5

After detecting cavity breakdown, the rf switch wasautomatically turned off, and the acquired data, includingthe rf waveforms and vacuum pressure, were then manuallyreviewed over a period typically spanning 30–60 s. The
automatic conditioning by computer control was thenmanually restarted from zero rf power if no abnormalitywas found. The algorithm of the automatic conditioning isdescribed in the caption of Fig. 7.
(a) (b)
(c) (d)
FIG. 8. Surface field of the accelerating mode at Vc ¼ 0.90 MV (Eacc ¼ 3.5 MV=m). The region inside the white dashed ellipse onthe FEP was observable with TV camera 3, and the observable region on the TEP was almost the same. The maximum strengths of theelectric and magnetic fields are 13 MV=m on the nose cone and 34 kA=m at the aperture for the HOM waveguide, respectively.(a) Electric field on the FEP. (b) Electric field on the TEP with a vertical cut plane. (c) Magnetic field on the FEP. (d) Magnetic field onthe TEP with a vertical cut plane.
TABLE II. Classification and number of cavity tripevents.
Period Vaca BDb Others
rf conditioning 2 180 1Stability test (total) 0 25 0Stability test (Vc ¼ 0.90 MV) 0 11 0
aVac means cavity vacuum events.bBD means cavity breakdown events.
TABLE III. Number of cavity breakdown events with anabnormality observed by at least one of the three TV cameras.Numbers enclosed in square brackets are percentages of the totalnumbers of cavity breakdown events with binomial errors for a 1σconfidence interval.
PeriodEvents with an
abnormality observed
rf conditioning 143 ½79� 3%�Stability test (total) 20 ½80þ8
−11%�Stability test (Vc ¼ 0.90 MV) 9 ½82þ12
−19%�
TETSUO ABE et al. PHYS. REV. ACCEL. BEAMS 19, 102001 (2016)
102001-6
D. Calculation of cavity voltage Vc
In this study, Vc was calculated from the rf power inputto the cavity (Pinp), the rf power reflected from the cavity(Prefl), and the quantities given in Table I, according to theformulae described in [12,17]. Both of these rf powers(Pinp and Prefl) were measured using a power meter and
sensors connected directly to the directional coupler nearthe cavity, as shown in Fig. 3(b).
III. HIGH-GRADIENT TEST
We first gradually increased the rf power input to DRcavity No. 2 using an automatic computer control to a
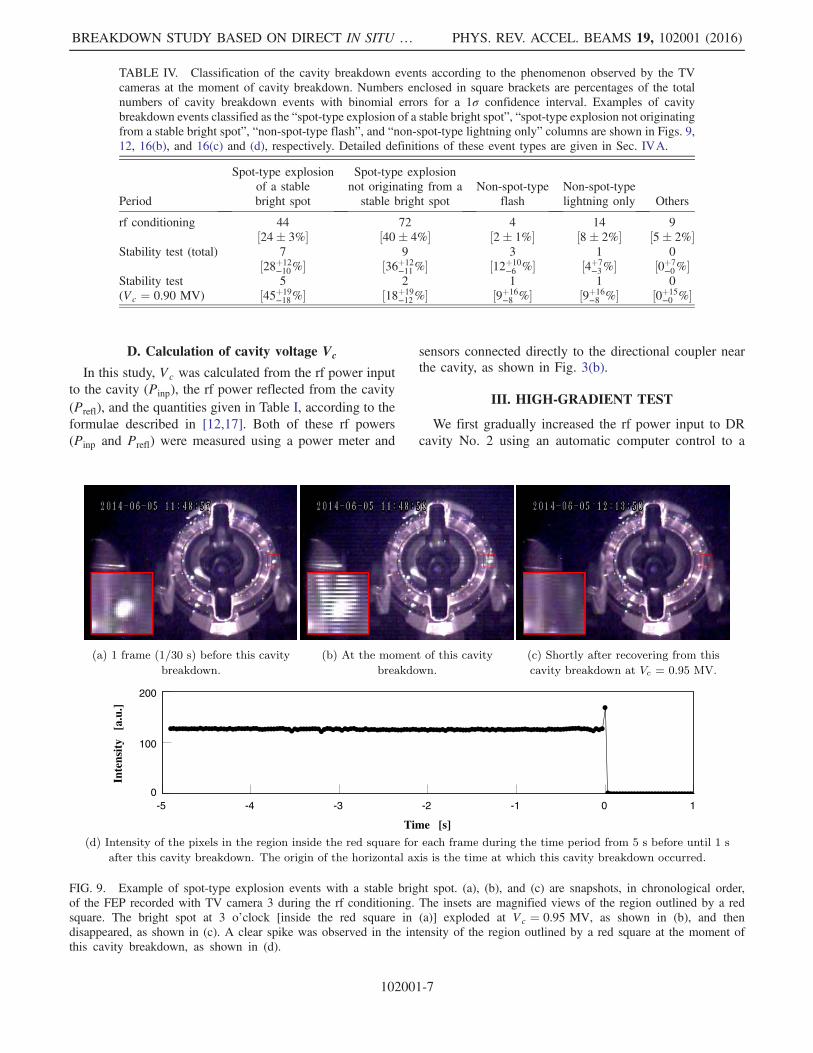
TABLE IV. Classification of the cavity breakdown events according to the phenomenon observed by the TVcameras at the moment of cavity breakdown. Numbers enclosed in square brackets are percentages of the totalnumbers of cavity breakdown events with binomial errors for a 1σ confidence interval. Examples of cavitybreakdown events classified as the “spot-type explosion of a stable bright spot”, “spot-type explosion not originatingfrom a stable bright spot”, “non-spot-type flash”, and “non-spot-type lightning only” columns are shown in Figs. 9,12, 16(b), and 16(c) and (d), respectively. Detailed definitions of these event types are given in Sec. IVA.
Period
Spot-type explosionof a stablebright spot
Spot-type explosionnot originating from astable bright spot
Non-spot-typeflash
Non-spot-typelightning only Others
rf conditioning 44 72 4 14 9½24� 3%� ½40� 4%� ½2� 1%� ½8� 2%� ½5� 2%�
Stability test (total) 7 9 3 1 0½28þ12
−10%� ½36þ12−11%� ½12þ10
−6 %� ½4þ7−3%� ½0þ7
−0%�Stability test 5 2 1 1 0(Vc ¼ 0.90 MV) ½45þ19
−18%� ½18þ19−12%� ½9þ16
−8 %� ½9þ16−8 %� ½0þ15
−0 %�
Time [s]
Inte
nsit
y [
a.u.
]
0
100
200
-5 -4 -3 -2 -1 0 1
FIG. 9. Example of spot-type explosion events with a stable bright spot. (a), (b), and (c) are snapshots, in chronological order,of the FEP recorded with TV camera 3 during the rf conditioning. The insets are magnified views of the region outlined by a redsquare. The bright spot at 3 o’clock [inside the red square in (a)] exploded at Vc ¼ 0.95 MV, as shown in (b), and thendisappeared, as shown in (c). A clear spike was observed in the intensity of the region outlined by a red square at the moment ofthis cavity breakdown, as shown in (d).
BREAKDOWN STUDY BASED ON DIRECT IN SITU … PHYS. REV. ACCEL. BEAMS 19, 102001 (2016)
102001-7

cavity voltage of Vc ¼ 0.95 MV, which is the highestvoltage permitted by the radiation regulation for this teststand, while maintaining the vacuum pressure at a valuelower than the specified value, i.e., the reference vacuumpressure indicated by light blue lines in Fig. 7. Then,
after reaching Vc ¼ 0.95 MV, we performed a stabilitytest at a constant cavity voltage of Vc ¼ 0.90 MV. Theformer step is hereafter referred to as rf conditioning(performed May 12 to June 6, 2014, during the day-time on weekdays), and the latter is referred to as thestability test (performed June 10 to July 4, 2014, duringthe daytime on weekdays, excluding some maintenancedays).
A. rf conditioning
Figure 7(b) shows the rf conditioning history of DRcavity No. 2, where Vc reached 0.90 MV (0.95 MV) in95 (107) h without any problem, exceeding the cavityvoltage of 0.80 MV given in the specifications.Figure 7(a) shows the rf conditioning history of DR
cavity No. 1, which was obtained in the same manner asthat for DR cavity No. 2. In this case, Vc reached 0.90 MVin 83 h. Only data with Vc ≤ 0.90 MV are plottedin Fig. 7(a) because data with Vc > 0.90 MV are includedin the stability test period for DR cavity No. 1. The
TABLE V. Number of spot-type explosion events with a stablebright spot in which the bright spot disappeared after theexplosion. Numbers enclosed in square brackets are percentagesof the total numbers of cavity breakdown events with binomialerrors for a 1σ confidence interval.
Period BSa disappeared
rf conditioning 36½20� 3%�
Stability test (total) 7½28þ12
−10%�Stability test (Vc ¼ 0.90 MV) 5
½45þ19−18%�
aBS indicates bright spot.
FIG. 10. Snapshots of the FEP recorded with TV camera 3 at Vc ¼ 0.90 MV.
FIG. 11. Snapshots of the TEP recorded with TV camera 2 at Vc ¼ 0.90 MV.
TETSUO ABE et al. PHYS. REV. ACCEL. BEAMS 19, 102001 (2016)
102001-8
conditioning speed of DR cavity No. 2 is comparable tothat of DR cavity No. 1.
B. Stability test
After the rf conditioning, we performed a stabilitytest on DR cavity No. 2 for 16 days according to thefollowing daily sequential procedure. (1) The deviceswere turned on, and the cavity voltage was increased to0.94 or 0.95 MV in the morning. (2) This cavity voltagewas maintained for 30 min. (3) The cavity voltage wasdecreased to Vc ¼ 0.90 MV. (4) The cavity voltage wasmaintained at Vc ¼ 0.90 MV until 17:00 that evening.Finally, we maintained a cavity voltage of Vc ¼ 0.90 MVfor a total of 80 h. Throughout this time, 11 cavitybreakdowns occurred. This number of cavity breakdownsis equivalent to a cavity breakdown rate of 3.3þ1.3
−1.0breakdowns per day for DR cavity No. 2, where thestatistical error for a 1σ (68%) confidence interval is givenaccording to Poisson statistics. This cavity breakdown rateat Vc ¼ 0.90 MV is statistically equivalent to that of DRcavity No. 1: 5.0þ4.8
−2.7 breakdowns per day, which wasobtained in the same manner [17].
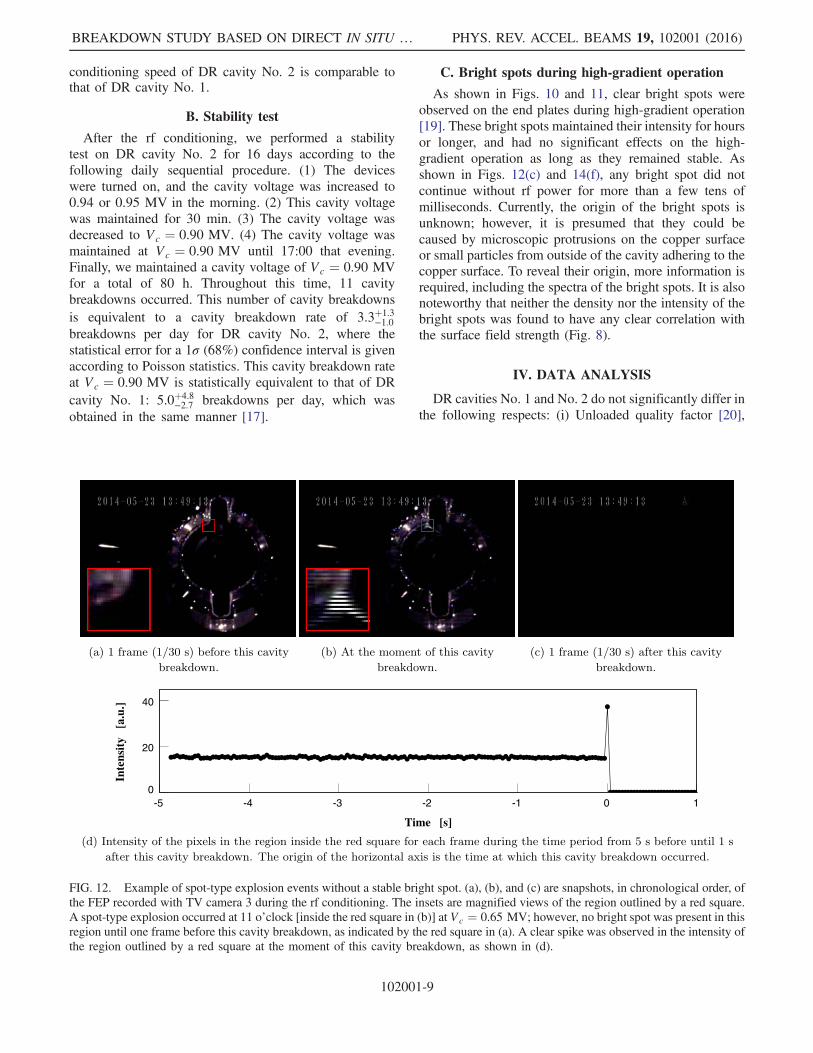
C. Bright spots during high-gradient operation
As shown in Figs. 10 and 11, clear bright spots wereobserved on the end plates during high-gradient operation[19]. These bright spots maintained their intensity for hoursor longer, and had no significant effects on the high-gradient operation as long as they remained stable. Asshown in Figs. 12(c) and 14(f), any bright spot did notcontinue without rf power for more than a few tens ofmilliseconds. Currently, the origin of the bright spots isunknown; however, it is presumed that they could becaused by microscopic protrusions on the copper surfaceor small particles from outside of the cavity adhering to thecopper surface. To reveal their origin, more information isrequired, including the spectra of the bright spots. It is alsonoteworthy that neither the density nor the intensity of thebright spots was found to have any clear correlation withthe surface field strength (Fig. 8).
IV. DATA ANALYSIS
DR cavities No. 1 and No. 2 do not significantly differ inthe following respects: (i) Unloaded quality factor [20],
Time [s]
Inte
nsit
y [
a.u.
]
0
20
40
-5 -4 -3 -2 -1 0 1
FIG. 12. Example of spot-type explosion events without a stable bright spot. (a), (b), and (c) are snapshots, in chronological order, ofthe FEP recorded with TV camera 3 during the rf conditioning. The insets are magnified views of the region outlined by a red square.A spot-type explosion occurred at 11 o’clock [inside the red square in (b)] at Vc ¼ 0.65 MV; however, no bright spot was present in thisregion until one frame before this cavity breakdown, as indicated by the red square in (a). A clear spike was observed in the intensity ofthe region outlined by a red square at the moment of this cavity breakdown, as shown in (d).
BREAKDOWN STUDY BASED ON DIRECT IN SITU … PHYS. REV. ACCEL. BEAMS 19, 102001 (2016)
102001-9
(ii) rf conditioning speed (Fig. 7), (iii) Vacuum perfor-mance (Fig. 7 and Appendix B), (iv) High-gradientperformance (Fig. 7) and cavity breakdown rate(Sec. III B), and (v) Radiation dose rate or dark current[Fig. 19(a)]. Thus, DR cavity No. 2 has no particularproblems or unusual characteristics. This means thatperforming a breakdown study on only DR cavity No. 2does not result in a loss of generality.
A. Classification and statistics of cavitybreakdown events
In this paper, a cavity trip is defined as an eventduring high-gradient operation when the interlock systemis activated for a reason related to the cavity. Cavity tripevents are classified into three types: (1) Cavity vacuumevents, which are defined as events accompanied by avacuum-pressure rise beyond a given threshold (4.1 × 10⁻⁵
to 1.0 × 10⁻⁴ Pa), (2) Cavity breakdown events (defined inSec. II C), and (3) Others. It should be noted that cavitybreakdown events accompanied by an increase in thevacuum pressure beyond the threshold are not defined ascavity vacuum events but as cavity breakdown events.Table II shows the classification and number of cavity trip
events; almost all of these events were cavity breakdownevents.Table III gives the number of cavity breakdown
events with an abnormality observed by at least one ofthe three TV cameras at the moment when the interlocksystem was activated, and the percentages in all the cavitybreakdown events. These numbers and percentages wereobtained by carefully reviewing every frame of every video.
Time [s]
Inte
nsit
y [
a.u.
]
0
20
40
-5 -4 -3 -2 -1 0 1
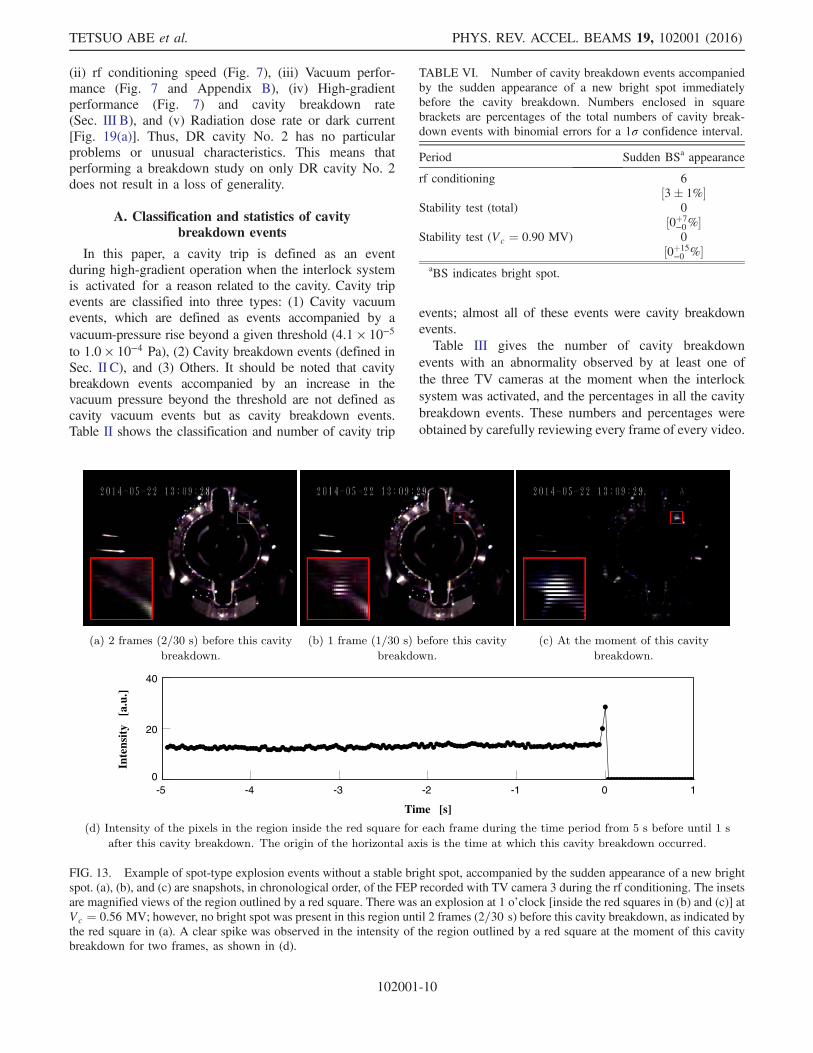
FIG. 13. Example of spot-type explosion events without a stable bright spot, accompanied by the sudden appearance of a new brightspot. (a), (b), and (c) are snapshots, in chronological order, of the FEP recorded with TV camera 3 during the rf conditioning. The insetsare magnified views of the region outlined by a red square. There was an explosion at 1 o’clock [inside the red squares in (b) and (c)] atVc ¼ 0.56 MV; however, no bright spot was present in this region until 2 frames (2=30 s) before this cavity breakdown, as indicated bythe red square in (a). A clear spike was observed in the intensity of the region outlined by a red square at the moment of this cavitybreakdown for two frames, as shown in (d).
TABLE VI. Number of cavity breakdown events accompaniedby the sudden appearance of a new bright spot immediatelybefore the cavity breakdown. Numbers enclosed in squarebrackets are percentages of the total numbers of cavity break-down events with binomial errors for a 1σ confidence interval.
Period Sudden BSa appearance
rf conditioning 6½3� 1%�
Stability test (total) 0½0þ7
−0%�Stability test (Vc ¼ 0.90 MV) 0
½0þ15−0 %�
aBS indicates bright spot.
TETSUO ABE et al. PHYS. REV. ACCEL. BEAMS 19, 102001 (2016)
102001-10
Approximately 80% of all cavity breakdown events wereaccompanied by an abnormality during both the rf con-ditioning and the stability test; this large percentage meansthat most of the cavity breakdown events emit a signal thatis observable by at least one of the TV cameras.Table IV gives the classification of the cavity break-
down events, where an event classified as the “spot-typeexplosion of a stable bright spot” column (hereafter, a
spot-type explosion event with a stable bright spot) isdefined as a cavity breakdown event accompanied by arapid increase in the intensity of a stable bright spot atthe moment of the cavity breakdown. Figure 9 shows anexample of such type of events, in which one of thestable bright spots on the FEP exploded and thendisappeared.Table V gives the number of cavity breakdown events
accompanied by a bright spot explosion followed by the
Time [s]
Inte
nsit
y [
a.u.
]
0
100
-5 -4 -3 -2 -1 0 1
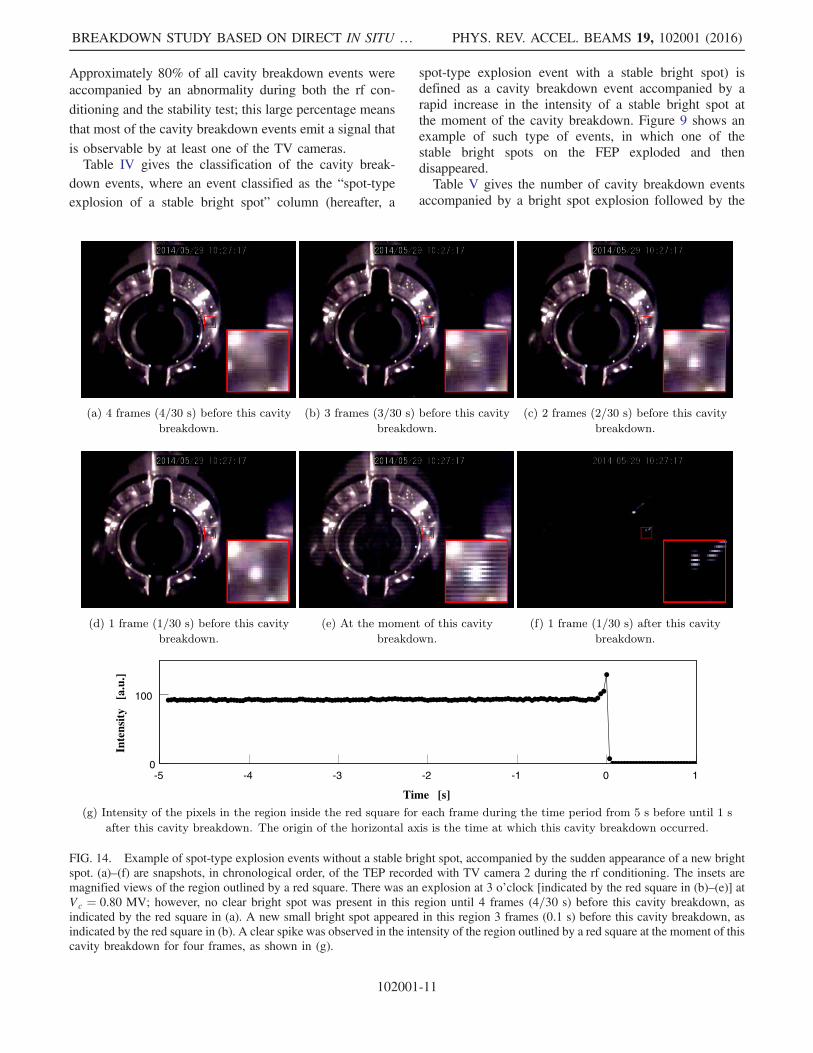
FIG. 14. Example of spot-type explosion events without a stable bright spot, accompanied by the sudden appearance of a new brightspot. (a)–(f) are snapshots, in chronological order, of the TEP recorded with TV camera 2 during the rf conditioning. The insets aremagnified views of the region outlined by a red square. There was an explosion at 3 o’clock [indicated by the red square in (b)–(e)] atVc ¼ 0.80 MV; however, no clear bright spot was present in this region until 4 frames (4=30 s) before this cavity breakdown, asindicated by the red square in (a). A new small bright spot appeared in this region 3 frames (0.1 s) before this cavity breakdown, asindicated by the red square in (b). A clear spike was observed in the intensity of the region outlined by a red square at the moment of thiscavity breakdown for four frames, as shown in (g).
BREAKDOWN STUDY BASED ON DIRECT IN SITU … PHYS. REV. ACCEL. BEAMS 19, 102001 (2016)
102001-11

disappearance of the bright spot, demonstrating that almostall the bright spots disappeared after an explosion occurred.This decrease in the number of explosion seeds (stablebright spots) is a significant component of rf condi-tioning, occurring in 20% or more of all cavity breakdownevents. Figures 10 and 11 show snapshots of the FEPand TEP, respectively, taken in chronological order atVc ¼ 0.90 MV. The number of stable bright spotsdecreased over time, although some bright spots becamebrighter and some new bright spots appeared.
In Table IV, an event classified as the “spot-typeexplosion not originating from a stable bright spot”column (hereafter, a spot-type explosion event withouta stable bright spot) is defined as a cavity breakdownevent accompanied by a spot-type explosion at theposition where no stable bright spot was observed until2 s before the cavity breakdown. Spot-type explosionevents with and without a stable bright spot are hereaftercollectively called spot-type explosion events. Figure 12shows an example of spot-type explosion events without
Time [s]
Inte
nsit
y [
a.u.
]
0
20
40
-5 -4 -3 -2 -1 0 1
FIG. 15. Example of spot-type explosion events without a stable bright spot, accompanied by the sudden appearance of a new brightspot. (a)–(f) are snapshots, in chronological order, of the FEP recorded with TV camera 3 during the rf conditioning. The insets aremagnified views of the region outlined by a red square. In this case, a new bright spot appeared at 11 o’clock 45 frames (1.5 s) before thiscavity breakdown at Vc ¼ 0.54 MV. A clear enhancement was observed in the intensity of the region outlined by a red square over the46 frames, starting at the moment when the new bright spot appeared, as shown in (g).
TETSUO ABE et al. PHYS. REV. ACCEL. BEAMS 19, 102001 (2016)
102001-12
a stable bright spot. It should be noted that, in a numberof such events (on the order of several percentage points),a new bright spot suddenly appeared at the position ofthe explosion within 2 s before the cavity breakdown(Table VI). Figure 13 shows an example of such events,in which a new bright spot appeared one frame (1=30 s)before the cavity breakdown. Figure 14 shows anotherexample of such events, in which a tiny new bright spotappeared three frames (0.1 s) before the cavity break-down, then increased in intensity until the cavity break-down occurred. Figure 15 shows a third example of suchevents, in which a new bright spot appeared 45 frames(1.5 s) before the cavity breakdown, then graduallyincreased in intensity until the cavity breakdownoccurred. In these events, relevant microscopic dynamics(the generation, growth, and explosion of a bright spot,followed by cavity breakdown) occurred on a time scale
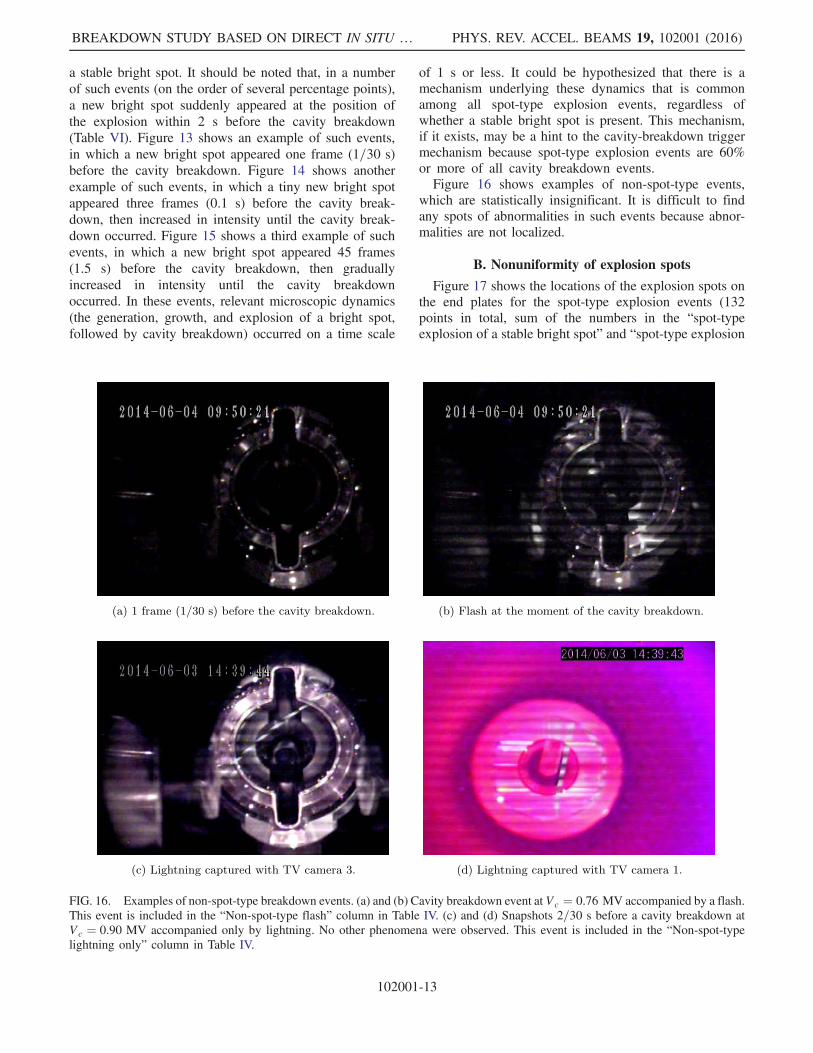
of 1 s or less. It could be hypothesized that there is amechanism underlying these dynamics that is commonamong all spot-type explosion events, regardless ofwhether a stable bright spot is present. This mechanism,if it exists, may be a hint to the cavity-breakdown triggermechanism because spot-type explosion events are 60%or more of all cavity breakdown events.Figure 16 shows examples of non-spot-type events,
which are statistically insignificant. It is difficult to findany spots of abnormalities in such events because abnor-malities are not localized.
B. Nonuniformity of explosion spots
Figure 17 shows the locations of the explosion spots onthe end plates for the spot-type explosion events (132points in total, sum of the numbers in the “spot-typeexplosion of a stable bright spot” and “spot-type explosion
FIG. 16. Examples of non-spot-type breakdown events. (a) and (b) Cavity breakdown event at Vc ¼ 0.76 MV accompanied by a flash.This event is included in the “Non-spot-type flash” column in Table IV. (c) and (d) Snapshots 2=30 s before a cavity breakdown atVc ¼ 0.90 MV accompanied only by lightning. No other phenomena were observed. This event is included in the “Non-spot-typelightning only” column in Table IV.
BREAKDOWN STUDY BASED ON DIRECT IN SITU … PHYS. REV. ACCEL. BEAMS 19, 102001 (2016)
102001-13
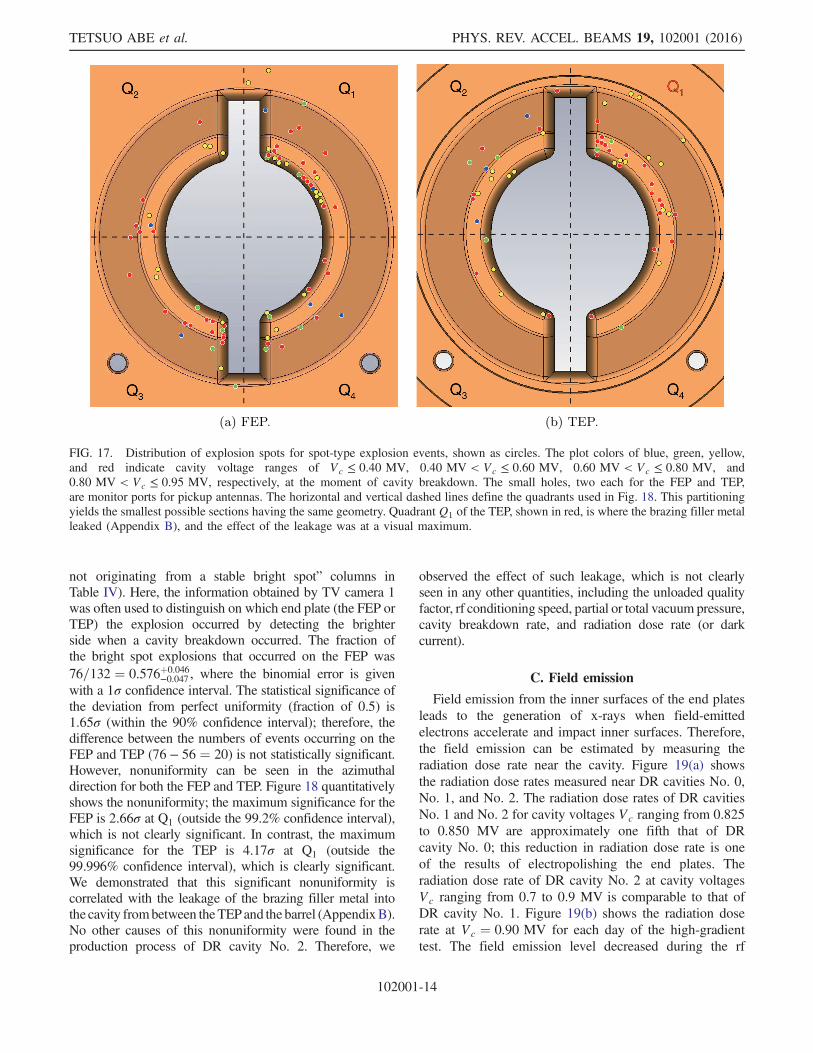
not originating from a stable bright spot” columns inTable IV). Here, the information obtained by TV camera 1was often used to distinguish on which end plate (the FEP orTEP) the explosion occurred by detecting the brighterside when a cavity breakdown occurred. The fraction ofthe bright spot explosions that occurred on the FEP was76=132 ¼ 0.576þ0.046
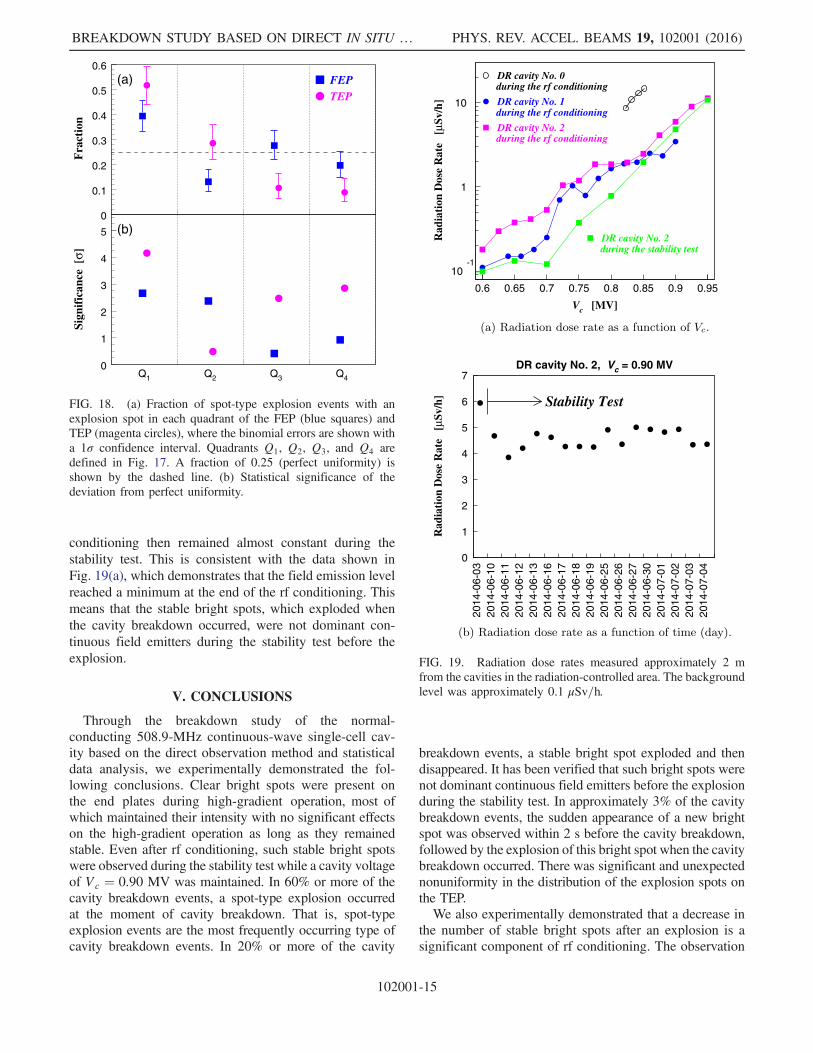
−0.047 , where the binomial error is givenwith a 1σ confidence interval. The statistical significance ofthe deviation from perfect uniformity (fraction of 0.5) is1.65σ (within the 90% confidence interval); therefore, thedifference between the numbers of events occurring on theFEP and TEP (76 − 56 ¼ 20) is not statistically significant.However, nonuniformity can be seen in the azimuthaldirection for both the FEP and TEP. Figure 18 quantitativelyshows the nonuniformity; the maximum significance for theFEP is 2.66σ at Q1 (outside the 99.2% confidence interval),which is not clearly significant. In contrast, the maximumsignificance for the TEP is 4.17σ at Q1 (outside the99.996% confidence interval), which is clearly significant.We demonstrated that this significant nonuniformity iscorrelated with the leakage of the brazing filler metal intothe cavity frombetween the TEPand the barrel (AppendixB).No other causes of this nonuniformity were found in theproduction process of DR cavity No. 2. Therefore, we
observed the effect of such leakage, which is not clearlyseen in any other quantities, including the unloaded qualityfactor, rf conditioning speed, partial or total vacuum pressure,cavity breakdown rate, and radiation dose rate (or darkcurrent).
C. Field emission
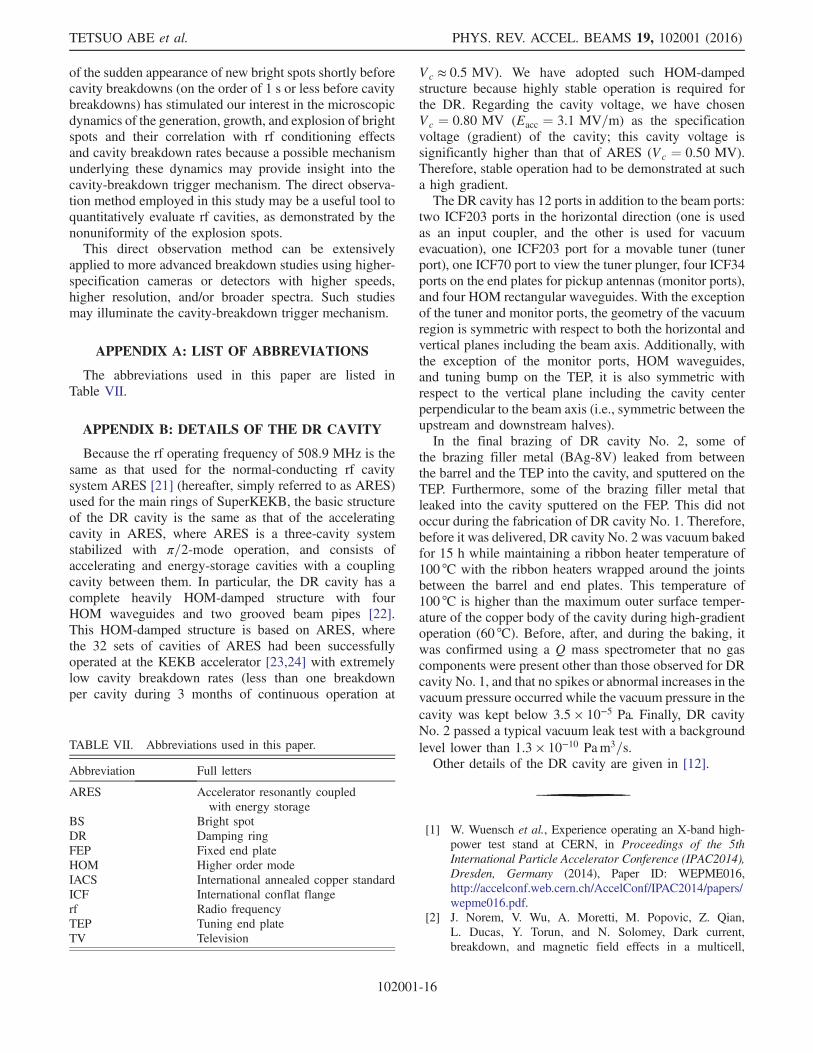
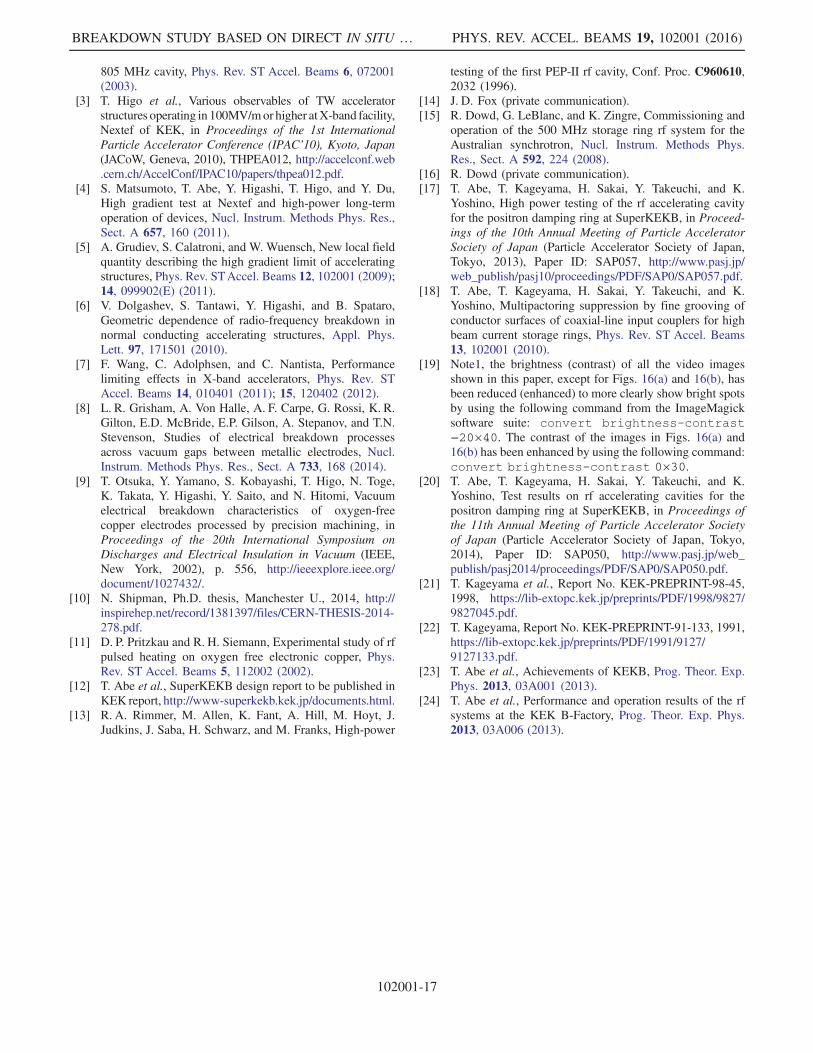
Field emission from the inner surfaces of the end platesleads to the generation of x-rays when field-emittedelectrons accelerate and impact inner surfaces. Therefore,the field emission can be estimated by measuring theradiation dose rate near the cavity. Figure 19(a) showsthe radiation dose rates measured near DR cavities No. 0,No. 1, and No. 2. The radiation dose rates of DR cavitiesNo. 1 and No. 2 for cavity voltages Vc ranging from 0.825to 0.850 MV are approximately one fifth that of DRcavity No. 0; this reduction in radiation dose rate is oneof the results of electropolishing the end plates. Theradiation dose rate of DR cavity No. 2 at cavity voltagesVc ranging from 0.7 to 0.9 MV is comparable to that ofDR cavity No. 1. Figure 19(b) shows the radiation doserate at Vc ¼ 0.90 MV for each day of the high-gradienttest. The field emission level decreased during the rf
FIG. 17. Distribution of explosion spots for spot-type explosion events, shown as circles. The plot colors of blue, green, yellow,and red indicate cavity voltage ranges of Vc ≤ 0.40 MV, 0.40 MV < Vc ≤ 0.60 MV, 0.60 MV < Vc ≤ 0.80 MV, and0.80 MV < Vc ≤ 0.95 MV, respectively, at the moment of cavity breakdown. The small holes, two each for the FEP and TEP,are monitor ports for pickup antennas. The horizontal and vertical dashed lines define the quadrants used in Fig. 18. This partitioningyields the smallest possible sections having the same geometry. Quadrant Q1 of the TEP, shown in red, is where the brazing filler metalleaked (Appendix B), and the effect of the leakage was at a visual maximum.
TETSUO ABE et al. PHYS. REV. ACCEL. BEAMS 19, 102001 (2016)
102001-14
conditioning then remained almost constant during thestability test. This is consistent with the data shown inFig. 19(a), which demonstrates that the field emission levelreached a minimum at the end of the rf conditioning. Thismeans that the stable bright spots, which exploded whenthe cavity breakdown occurred, were not dominant con-tinuous field emitters during the stability test before theexplosion.
V. CONCLUSIONS
Through the breakdown study of the normal-conducting 508.9-MHz continuous-wave single-cell cav-ity based on the direct observation method and statisticaldata analysis, we experimentally demonstrated the fol-lowing conclusions. Clear bright spots were present onthe end plates during high-gradient operation, most ofwhich maintained their intensity with no significant effectson the high-gradient operation as long as they remainedstable. Even after rf conditioning, such stable bright spotswere observed during the stability test while a cavity voltageof Vc ¼ 0.90 MV was maintained. In 60% or more of thecavity breakdown events, a spot-type explosion occurredat the moment of cavity breakdown. That is, spot-typeexplosion events are the most frequently occurring type ofcavity breakdown events. In 20% or more of the cavity
breakdown events, a stable bright spot exploded and thendisappeared. It has been verified that such bright spots werenot dominant continuous field emitters before the explosionduring the stability test. In approximately 3% of the cavitybreakdown events, the sudden appearance of a new brightspot was observed within 2 s before the cavity breakdown,followed by the explosion of this bright spot when the cavitybreakdown occurred. There was significant and unexpectednonuniformity in the distribution of the explosion spots onthe TEP.We also experimentally demonstrated that a decrease in
the number of stable bright spots after an explosion is asignificant component of rf conditioning. The observation
0
0.1
0.2
0.3
0.4
0.5
0.6
0
1
2
3
4
5
Q1 Q2 Q3 Q4
Fra
ctio
n FEP TEP
(a)Si
gnif
ican
ce [
σ]
(b)
FIG. 18. (a) Fraction of spot-type explosion events with anexplosion spot in each quadrant of the FEP (blue squares) andTEP (magenta circles), where the binomial errors are shown witha 1σ confidence interval. Quadrants Q1, Q2, Q3, and Q4 aredefined in Fig. 17. A fraction of 0.25 (perfect uniformity) isshown by the dashed line. (b) Statistical significance of thedeviation from perfect uniformity.
10-1
1
10
0.6 0.65 0.7 0.75 0.8 0.85 0.9 0.95
Vc [MV]
Rad
iati
on D
ose
Rat
e [
μSv/
h]
DR cavity No. 0 during the rf conditioning
DR cavity No. 1 during the rf conditioning
DR cavity No. 2 during the rf conditioning
DR cavity No. 2 during the stability test
0
1
2
3
4
5
6
7
2014
-06-
0320
14-0
6-10
2014
-06-
1120
14-0
6-12
2014
-06-
1320
14-0
6-16
2014
-06-
1720
14-0
6-18
2014
-06-
1920
14-0
6-25
2014
-06-
2620
14-0
6-27
2014
-06-
3020
14-0
7-01
2014
-07-
0220
14-0
7-03
2014
-07-
04
DR cavity No. 2, Vc = 0.90 MV
Rad
iati
on D
ose
Rat
e [
μSv/
h] Stability Test
FIG. 19. Radiation dose rates measured approximately 2 mfrom the cavities in the radiation-controlled area. The backgroundlevel was approximately 0.1 μSv=h.
BREAKDOWN STUDY BASED ON DIRECT IN SITU … PHYS. REV. ACCEL. BEAMS 19, 102001 (2016)
102001-15
of the sudden appearance of new bright spots shortly beforecavity breakdowns (on the order of 1 s or less before cavitybreakdowns) has stimulated our interest in the microscopicdynamics of the generation, growth, and explosion of brightspots and their correlation with rf conditioning effectsand cavity breakdown rates because a possible mechanismunderlying these dynamics may provide insight into thecavity-breakdown trigger mechanism. The direct observa-tion method employed in this study may be a useful tool toquantitatively evaluate rf cavities, as demonstrated by thenonuniformity of the explosion spots.This direct observation method can be extensively
applied to more advanced breakdown studies using higher-specification cameras or detectors with higher speeds,higher resolution, and/or broader spectra. Such studiesmay illuminate the cavity-breakdown trigger mechanism.
APPENDIX A: LIST OF ABBREVIATIONS
The abbreviations used in this paper are listed inTable VII.
APPENDIX B: DETAILS OF THE DR CAVITY
Because the rf operating frequency of 508.9 MHz is thesame as that used for the normal-conducting rf cavitysystem ARES [21] (hereafter, simply referred to as ARES)used for the main rings of SuperKEKB, the basic structureof the DR cavity is the same as that of the acceleratingcavity in ARES, where ARES is a three-cavity systemstabilized with π=2-mode operation, and consists ofaccelerating and energy-storage cavities with a couplingcavity between them. In particular, the DR cavity has acomplete heavily HOM-damped structure with fourHOM waveguides and two grooved beam pipes [22].This HOM-damped structure is based on ARES, wherethe 32 sets of cavities of ARES had been successfullyoperated at the KEKB accelerator [23,24] with extremelylow cavity breakdown rates (less than one breakdownper cavity during 3 months of continuous operation at
Vc ≈ 0.5 MV). We have adopted such HOM-dampedstructure because highly stable operation is required forthe DR. Regarding the cavity voltage, we have chosenVc ¼ 0.80 MV (Eacc ¼ 3.1 MV=m) as the specificationvoltage (gradient) of the cavity; this cavity voltage issignificantly higher than that of ARES (Vc ¼ 0.50 MV).Therefore, stable operation had to be demonstrated at sucha high gradient.The DR cavity has 12 ports in addition to the beam ports:
two ICF203 ports in the horizontal direction (one is usedas an input coupler, and the other is used for vacuumevacuation), one ICF203 port for a movable tuner (tunerport), one ICF70 port to view the tuner plunger, four ICF34ports on the end plates for pickup antennas (monitor ports),and four HOM rectangular waveguides. With the exceptionof the tuner and monitor ports, the geometry of the vacuumregion is symmetric with respect to both the horizontal andvertical planes including the beam axis. Additionally, withthe exception of the monitor ports, HOM waveguides,and tuning bump on the TEP, it is also symmetric withrespect to the vertical plane including the cavity centerperpendicular to the beam axis (i.e., symmetric between theupstream and downstream halves).In the final brazing of DR cavity No. 2, some of
the brazing filler metal (BAg-8V) leaked from betweenthe barrel and the TEP into the cavity, and sputtered on theTEP. Furthermore, some of the brazing filler metal thatleaked into the cavity sputtered on the FEP. This did notoccur during the fabrication of DR cavity No. 1. Therefore,before it was delivered, DR cavity No. 2 was vacuum bakedfor 15 h while maintaining a ribbon heater temperature of100 °C with the ribbon heaters wrapped around the jointsbetween the barrel and end plates. This temperature of100 °C is higher than the maximum outer surface temper-ature of the copper body of the cavity during high-gradientoperation (60 °C). Before, after, and during the baking, itwas confirmed using a Q mass spectrometer that no gascomponents were present other than those observed for DRcavity No. 1, and that no spikes or abnormal increases in thevacuum pressure occurred while the vacuum pressure in thecavity was kept below 3.5 × 10⁻⁵ Pa. Finally, DR cavityNo. 2 passed a typical vacuum leak test with a backgroundlevel lower than 1.3 × 10⁻¹⁰ Pam3=s.Other details of the DR cavity are given in [12].
[1] W. Wuensch et al., Experience operating an X-band high-power test stand at CERN, in Proceedings of the 5thInternational Particle Accelerator Conference (IPAC2014),Dresden, Germany (2014), Paper ID: WEPME016,http://accelconf.web.cern.ch/AccelConf/IPAC2014/papers/wepme016.pdf.
[2] J. Norem, V. Wu, A. Moretti, M. Popovic, Z. Qian,L. Ducas, Y. Torun, and N. Solomey, Dark current,breakdown, and magnetic field effects in a multicell,
TABLE VII. Abbreviations used in this paper.
Abbreviation Full letters
ARES Accelerator resonantly coupledwith energy storage
BS Bright spotDR Damping ringFEP Fixed end plateHOM Higher order modeIACS International annealed copper standardICF International conflat flangerf Radio frequencyTEP Tuning end plateTV Television
TETSUO ABE et al. PHYS. REV. ACCEL. BEAMS 19, 102001 (2016)
102001-16
805 MHz cavity, Phys. Rev. ST Accel. Beams 6, 072001(2003).
[3] T. Higo et al., Various observables of TW acceleratorstructures operating in 100MV/mor higher atX-band facility,Nextef of KEK, in Proceedings of the 1st InternationalParticle Accelerator Conference (IPAC’10), Kyoto, Japan(JACoW, Geneva, 2010), THPEA012, http://accelconf.web.cern.ch/AccelConf/IPAC10/papers/thpea012.pdf.
[4] S. Matsumoto, T. Abe, Y. Higashi, T. Higo, and Y. Du,High gradient test at Nextef and high-power long-termoperation of devices, Nucl. Instrum. Methods Phys. Res.,Sect. A 657, 160 (2011).
[5] A. Grudiev, S. Calatroni, and W. Wuensch, New local fieldquantity describing the high gradient limit of acceleratingstructures, Phys. Rev. STAccel. Beams 12, 102001 (2009);14, 099902(E) (2011).
[6] V. Dolgashev, S. Tantawi, Y. Higashi, and B. Spataro,Geometric dependence of radio-frequency breakdown innormal conducting accelerating structures, Appl. Phys.Lett. 97, 171501 (2010).
[7] F. Wang, C. Adolphsen, and C. Nantista, Performancelimiting effects in X-band accelerators, Phys. Rev. STAccel. Beams 14, 010401 (2011); 15, 120402 (2012).
[8] L. R. Grisham, A. Von Halle, A. F. Carpe, G. Rossi, K. R.Gilton, E.D. McBride, E.P. Gilson, A. Stepanov, and T.N.Stevenson, Studies of electrical breakdown processesacross vacuum gaps between metallic electrodes, Nucl.Instrum. Methods Phys. Res., Sect. A 733, 168 (2014).
[9] T. Otsuka, Y. Yamano, S. Kobayashi, T. Higo, N. Toge,K. Takata, Y. Higashi, Y. Saito, and N. Hitomi, Vacuumelectrical breakdown characteristics of oxygen-freecopper electrodes processed by precision machining, inProceedings of the 20th International Symposium onDischarges and Electrical Insulation in Vacuum (IEEE,New York, 2002), p. 556, http://ieeexplore.ieee.org/document/1027432/.
[10] N. Shipman, Ph.D. thesis, Manchester U., 2014, http://inspirehep.net/record/1381397/files/CERN‑THESIS‑2014‑278.pdf.
[11] D. P. Pritzkau and R. H. Siemann, Experimental study of rfpulsed heating on oxygen free electronic copper, Phys.Rev. ST Accel. Beams 5, 112002 (2002).
[12] T. Abe et al., SuperKEKB design report to be published inKEK report, http://www‑superkekb.kek.jp/documents.html.
[13] R. A. Rimmer, M. Allen, K. Fant, A. Hill, M. Hoyt, J.Judkins, J. Saba, H. Schwarz, and M. Franks, High-power
testing of the first PEP-II rf cavity, Conf. Proc. C960610,2032 (1996).
[14] J. D. Fox (private communication).[15] R. Dowd, G. LeBlanc, and K. Zingre, Commissioning and
operation of the 500 MHz storage ring rf system for theAustralian synchrotron, Nucl. Instrum. Methods Phys.Res., Sect. A 592, 224 (2008).
[16] R. Dowd (private communication).[17] T. Abe, T. Kageyama, H. Sakai, Y. Takeuchi, and K.
Yoshino, High power testing of the rf accelerating cavityfor the positron damping ring at SuperKEKB, in Proceed-ings of the 10th Annual Meeting of Particle AcceleratorSociety of Japan (Particle Accelerator Society of Japan,Tokyo, 2013), Paper ID: SAP057, http://www.pasj.jp/web_publish/pasj10/proceedings/PDF/SAP0/SAP057.pdf.
[18] T. Abe, T. Kageyama, H. Sakai, Y. Takeuchi, and K.Yoshino, Multipactoring suppression by fine grooving ofconductor surfaces of coaxial-line input couplers for highbeam current storage rings, Phys. Rev. ST Accel. Beams13, 102001 (2010).
[19] Note1, the brightness (contrast) of all the video imagesshown in this paper, except for Figs. 16(a) and 16(b), hasbeen reduced (enhanced) to more clearly show bright spotsby using the following command from the ImageMagicksoftware suite: convert brightness-contrast−20×40. The contrast of the images in Figs. 16(a) and16(b) has been enhanced by using the following command:convert brightness-contrast 0×30.
[20] T. Abe, T. Kageyama, H. Sakai, Y. Takeuchi, and K.Yoshino, Test results on rf accelerating cavities for thepositron damping ring at SuperKEKB, in Proceedings ofthe 11th Annual Meeting of Particle Accelerator Societyof Japan (Particle Accelerator Society of Japan, Tokyo,2014), Paper ID: SAP050, http://www.pasj.jp/web_publish/pasj2014/proceedings/PDF/SAP0/SAP050.pdf.
[21] T. Kageyama et al., Report No. KEK-PREPRINT-98-45,1998, https://lib‑extopc.kek.jp/preprints/PDF/1998/9827/9827045.pdf.
[22] T. Kageyama, Report No. KEK-PREPRINT-91-133, 1991,https://lib‑extopc.kek.jp/preprints/PDF/1991/9127/9127133.pdf.
[23] T. Abe et al., Achievements of KEKB, Prog. Theor. Exp.Phys. 2013, 03A001 (2013).
[24] T. Abe et al., Performance and operation results of the rfsystems at the KEK B-Factory, Prog. Theor. Exp. Phys.2013, 03A006 (2013).
BREAKDOWN STUDY BASED ON DIRECT IN SITU … PHYS. REV. ACCEL. BEAMS 19, 102001 (2016)
102001-17


