Breakdown of lysosomal glycogen breakdown of glycogen in the...Breakdown of lysosomal glycogen small...
8
Transcript of Breakdown of lysosomal glycogen breakdown of glycogen in the...Breakdown of lysosomal glycogen small...
Breakdown of lysosomal glycogen
controls from the same litters were killed at the age of 6 hours. Cyclic AMP was administered intraperitoneally in 0.2 m1 of a 0.3% solution of the compound in 0.9% NaCl. The animals were injected at birth and 3 hours after birth (a dose of 100 mg/Kg each time). This administration is known to result in a marked hyperglycemia (Kotoulas and Phillips, 1971). Control animals were injected with 0.9% NaCl. Four caffeine- treated animals and four controls from the same litters were killed at the age of 6 hours. Caffeine was administered intraperitoneally in 0.1 m1 of a 0.25% solution of the compound in 0.9% NaCl. The animals were injected at birth and 3 hours after birth (a dose of 41.7mglkg each time). Control animals were injected with 0.9% NaCl.
For the quantitative morphometric study on electron micrographs, three normal animals were killed at birth. Three cyclic AMP-treated and three caffeine-treated animals and an equal number of their controls were killed at the age of 6 hours.Three glucose-treated animals and an equal number of their controls were killed at the age of 12 hours.
Biochemical methods
The glycogen-hydrolyzing activity of acid alpha 1,4 glucosidase was assayed in homogenates of liver tissue in a 10% dilution with distilled water. Usually 200 p1 of homogenate were used for the assay. The total activity of the enzyme was determined according to Hers (1963) and Lejeune et al. (1963) with glycogen (1%) as substrate. Incubation was carried out in 0.1M sodium acetate buffer (pH 4.7). Glucose was estimated by the method of Raabo and Terkildsen (1960) modified according to Sigma Technical Bulletin 510, using glucose oxidase, peroxidase and dianisidine. Protein was detennined by the method of Lowry et al. (1951). Cyclic AMP was determined according to Amersham Bulletin TRK 432, using ( 8 - 3 ~ ) cyclic adenosine-3',5' phosphate. The results were statistically evalued and correlated according to Hill(1967).
Electron microscopy and morphometric analysis
Liver tissue was fixed for 1 hour at O "C in 1% osmium tetroxide buffered with 0.1M phosphate buffer at pH 7.2. Ultrathin sections, approximately 50 nm thick were stained with a saturated aqueous solution of uranyl acetate and Reynold's solution of lead citrate. Morphometric analysis was performed on electron micrographs as described before (Kotoulas and Phillips, 1971; Kotoulas et al., 1971). From each liver five blocks were prepared and from each block two randomly taken micrographs were used. For the morphometric work the pictures were enlarged to a final magnification of 13000. A lattice composed of horizontal and vertical lines at regular intervals (0.5 cm) was superimposed on the prints. The cross points of the lines of the lattice were used for planimetric work. According to the principies of
stereology, the fractional volume occupied by a cytoplasmic component is equal to the fraction of the points enclosed within the area of the component in random cross sections of the tissue. In the case of lysosomes and lysosomal glycogen, the data of the micrographs from the same block were combined and therefore the means and standard errors were calculated from these combined data (Weibel, 1969).
The number of organelles per unit of cytoplasmic volume was estimated as described by Loud (1968). The mean tangent diameter of the organelle required for this estimation was found from the volume-to-surface ratio. To estimate this ratio, every other segment between two cross points on the horizontal lines of the lattice was used. The intersections of the segments with the organelle boundaries and the cross points of the lattice overlying the organelle were counted. Then, the volume- to-surface ratio was calculated according to the formula of Chalkley and Cornfield (Weibel, 1969). In prelirninary studies the disector method for estimating number of organelles was used (Cruz-Orive and Weibel, 1990).
The diameter-to-length ratio of organelles was determined according to Weibel (1979) using a graph and estimates of fractional volume, fractional number and number of transsections per unit area of tissue section. Lysosomes were assimilated to the ellipsoids (Loud et al., 1965; Weibel, 1979).
The volume of cytoplasm in pm3/hepatic cell was determined from light photographs (one photograph from each of five animals of each group) taken from 1 km-thick sections stained with toluidine blue and enlarged to a final magnification of 1000. First, the volume of hepatic cell cytoplasrnJunit of volume of liver tissue was estimated. Second, the number of hepatic cell nucleilunit of volume of liver tissue was estimated as described by Loud (1968). Then, the ratio of these two estimates was obtained. This calculation gave the volume of hepatic cell cytoplasm~hepatic cell nucleus. Except for the presence of binucleated cells, this calculation would have given the average cytoplasmic volume/hepatic cell. Since binucleated cells have twice the volume of mononucleated cells, the estimated volume of the hepatic cell cytoplasm/hepatic cell nucleus is still approximately the same as the volume of cytoplasm/hepatic cell (Loud, 1968).
The mean tangent diameter of the hepatic cell nucleus required for the second estimate was found from the volume-to-surface ratio as described above. The resutls of morphometric analysis were evaluated by Student's t- test.
Results
Biochemical results
Blood glucose, liver acid glucosidase and liver cyclic AMP during the first 12 hours after birth are shown in Table 1. The blood glucose concentration fe11 at the age
Breakdown of lysosomal glycogen
Table 1. Blood glucose, liver acid glucosidase and liver cyclic AMP, during the first 12 hours after birth. Results are meansfstandard deviations. Each value includes 3 obse~ations.
AGE (hours after birth)
O 2 4 6 8 10 12
Blood glucose (m911 OOmi)
Liver lucosidase 0.09910.046 0.105-10.051 0.19910.081 0.20310.080 0.172M.073 0.17W.073 0.165-10.070 ucose/hr/mg protein) (PM gg
Liver cyclic AMP 38.718.9 (pM/g wet wt.)
Table 2. Blood glucoce, liver acid glucocidase and liver cyclic AMP at the age of 12 hours, after parenteral glucose treatment of newborn rats. Results are meansIstandard deviations. Each value includes 4 obse~ations.
BLOOD GLUCOSE AClD GLUCOSIDASE CYCLlC AMP (mg1100ml) (yM glucoseihr/mg protein) (pM/g wet wt.)
Control 45.9I14.0 0.17910.060 57.1112.2 Glucose 350.8k 114.2* 0.1 1W.048 32.317.80 P <0.05 c0.05 c0.05
': at 6 hours. 380.5e10.0.
Table 3. Liver acid glucosidase and liver cyclic AMP at the age of 6 hours, after cyclic AMP treatment of newborn rats. Results are meansfstandard deviations. Each value includes 5 obsewations.
AClD GLUCOSIDASE CYCLlC AMP (yM glucose/hr/mg protein) (pM/g wet wt.)
Control 0.21 7-10.079 93.7119.0 cAMP 0.30810.090 148.8i33.1 P c0.05 <0.05
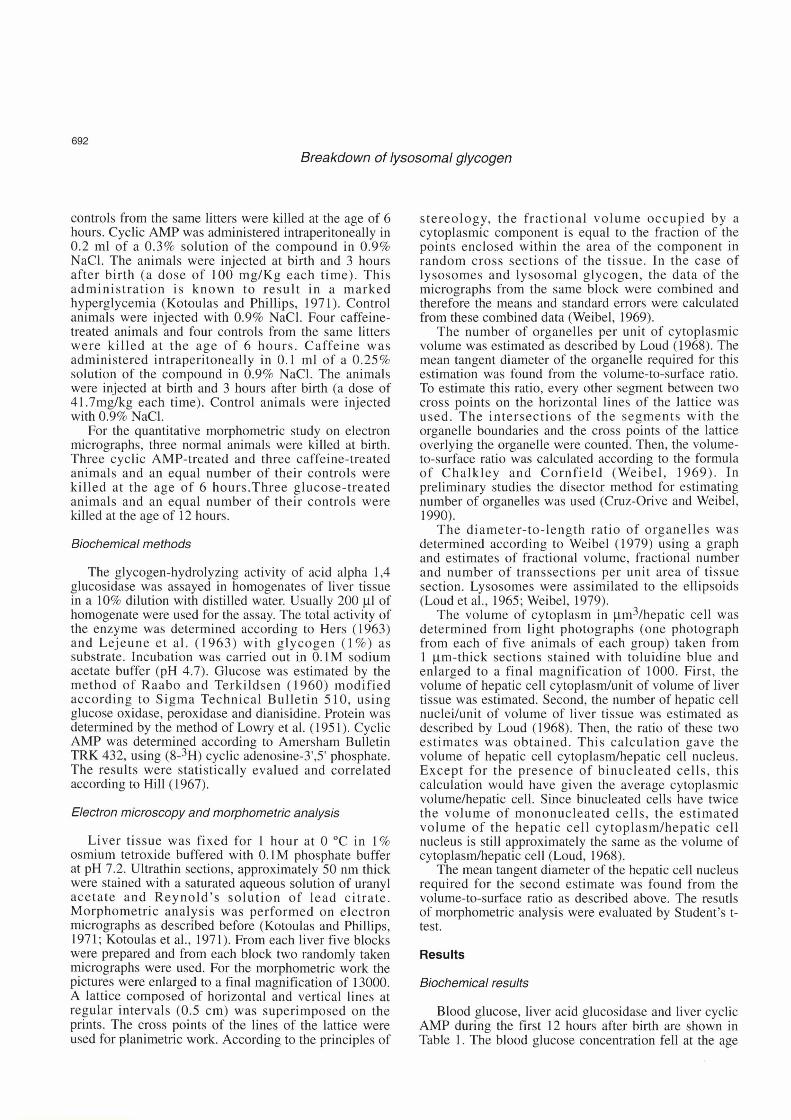
of 2 hours and rose again at the age of 6 hours. The liver enzyme activity was low at birth but it showed an abrupt increase at the ages of 4-6 hours. It returned to a lower
Table 4. Liver acid glucosidase at the age 0f 6 hours, afler caffeine level at the age of 8 hours. The liver cyclic AMp treatment of newborn rats (yM glucoselhrlmg protein). Results are cOncentration was elevated at the age of 6 hours. A meansistandard deviations. Each value includes 4 obse~ations. positive correldtion existed between acid glucosidase
Control 0.19910.082 and cyclic AMP levels in normal animals at the age of 6 Caffeine 0.289I0.088 hours (Fig. 1). P ~0.05 The results of parenteral glucose administration are
shown in Table 2. The newborn animals became hyperglycemic. The liver acid glucosidase activity and cyclic AMP concentration at the age of 12 hours, did not reach the leve1 of the controls remaining significantly lower. Preliminary observations at the age of 6 hours, showed similar results. The results of cyclic AMP administration are shown in Table 3. This administration resulted in increased concentration of cyclic AMP in the liver. The activity of acid glucosidase was also increased. Similar results were obtained after the administration of caffeine (Table 4).
Cgclic AMP (pM/g rrt r t - )
Morphological results
Both qualitative and quantitative changes were studied. The term lysosomes refers to lysosomes and related particles including autophagic vacuoles (DeDuve and Wattiaux, 1966; Dunn, 1990a,b). The appearance of normal rat hepatocytes during the first 12 hours after bith has been described before (Kotoulas and Phillips, 1971; Kotoulas et al., 1971). At birth, vast areas of hyaloplasmic glycogen were present. Lvsosomes were small and rare. Thev were located
Fig. 1. Relationship between activity of liver acid glucosidase and a< the margins of the hyaloplasmic dycogen areas. concentration of liver cyclic AMP in newborn rats. The correlation A large part of the lysosomal volume WaS occupied coefficient, R= 0.84 (p< 0.001). by undigested glycogen. The Golgi apparatus was
Breakdown of lysosomal glycogen
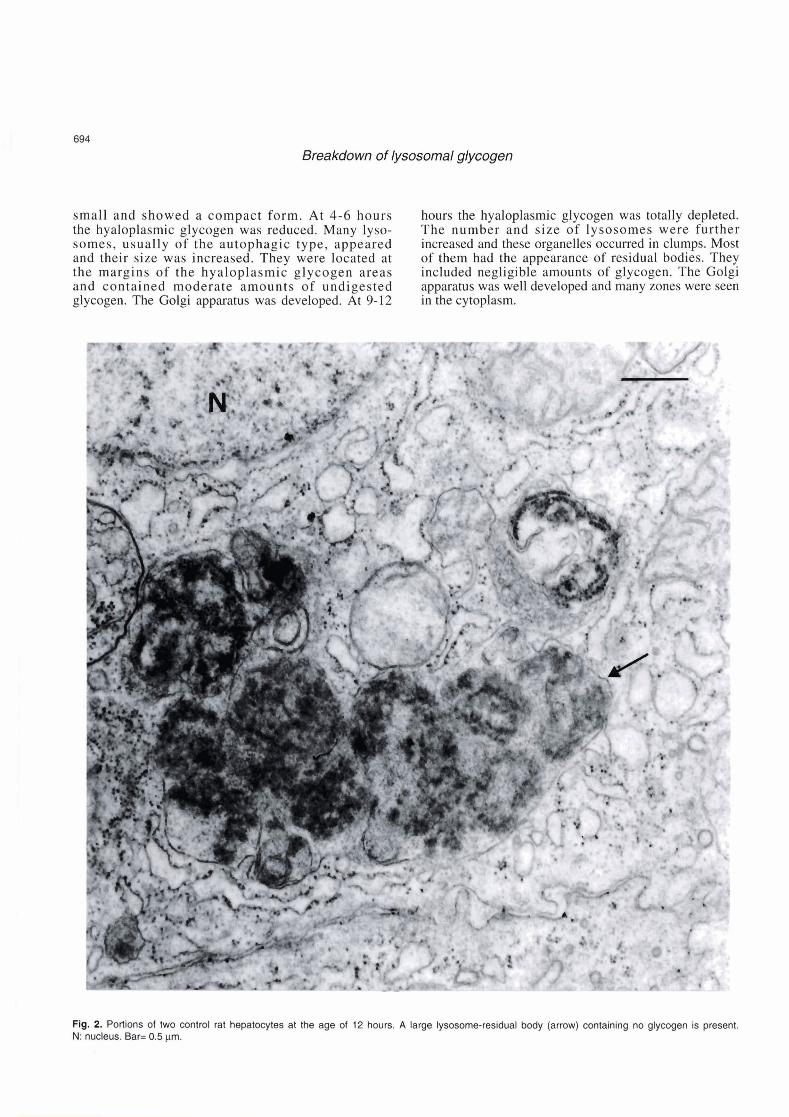
small and showed a compact form. At 4-6 hours hours the hyaloplasmic glycogen was totally depleted. the hyaloplasmic glycogen was reduced. Many lyso- The number and size of lysosomes were further somes, usually of the autophagic type, appeared increased and these organelles occurred in clumps. Most and their size was increased. They were located at of them had the appearance of residual bodies. They the margins of the hyaloplasmic glycogen areas included negligible amounts of glycogen. The Golgi and contained moderate amounts of undigested apparatus was well developed and many zones were seen glycogen. The Golgi apparatus was developed. At 9-12 in the cytoplasm.
Breakdown of lyosomal glycogen
Group l. Glucose-administered lysosomes of the residual body type appeared. Their total fractional volume was 5.83k0.70. They usually
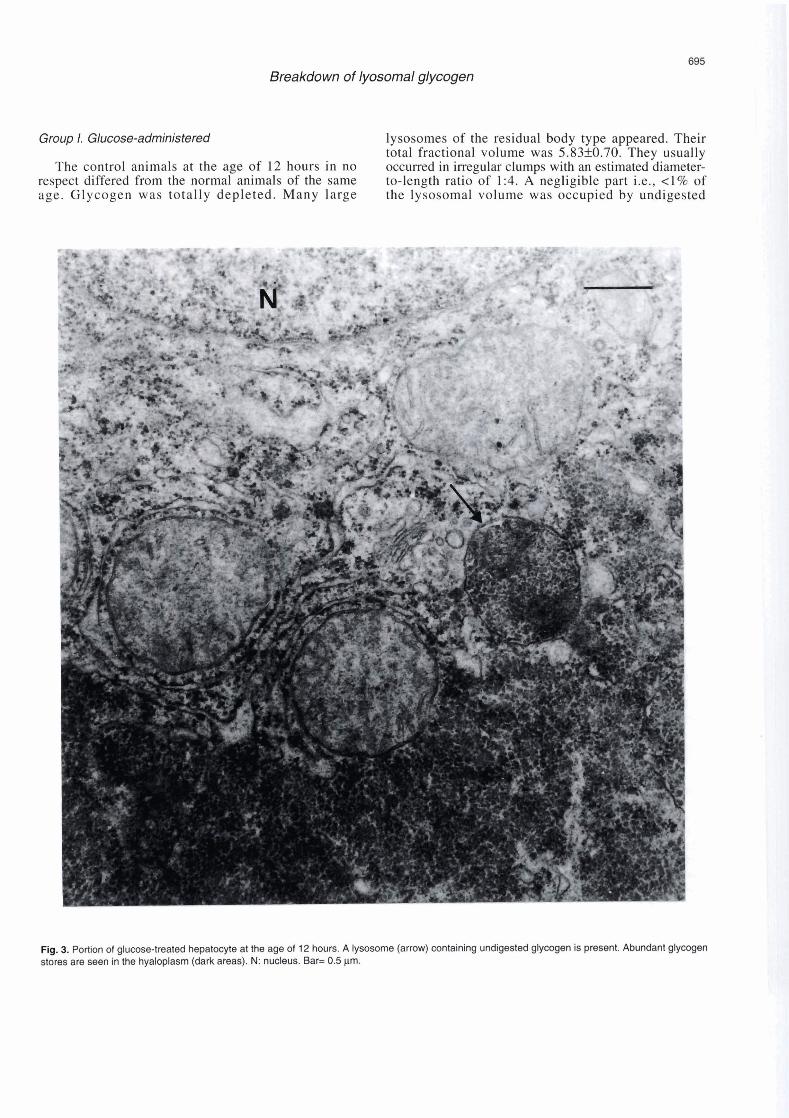
The control animals at the age of 12 hours in no occurred in irregular clumps with an estimated diameter- respect differed from the normal animals of the same to-length ratio of 1:4. A negligible part i.e., el% of age. Glycogen was totally depleted. Many large the lysosomal volume was occupied by undigested
Flg. 3. Portion of glucose-treated hepatocyte at the age of 12 hours. A lysosome (arrow) containing undigested glycogen is present. Abundant glycogen stores are seen in the hyaloplasm (dark areas). N: nucleus. Bar= 0.5 pm.
Breakdown of lysosomal glycogen
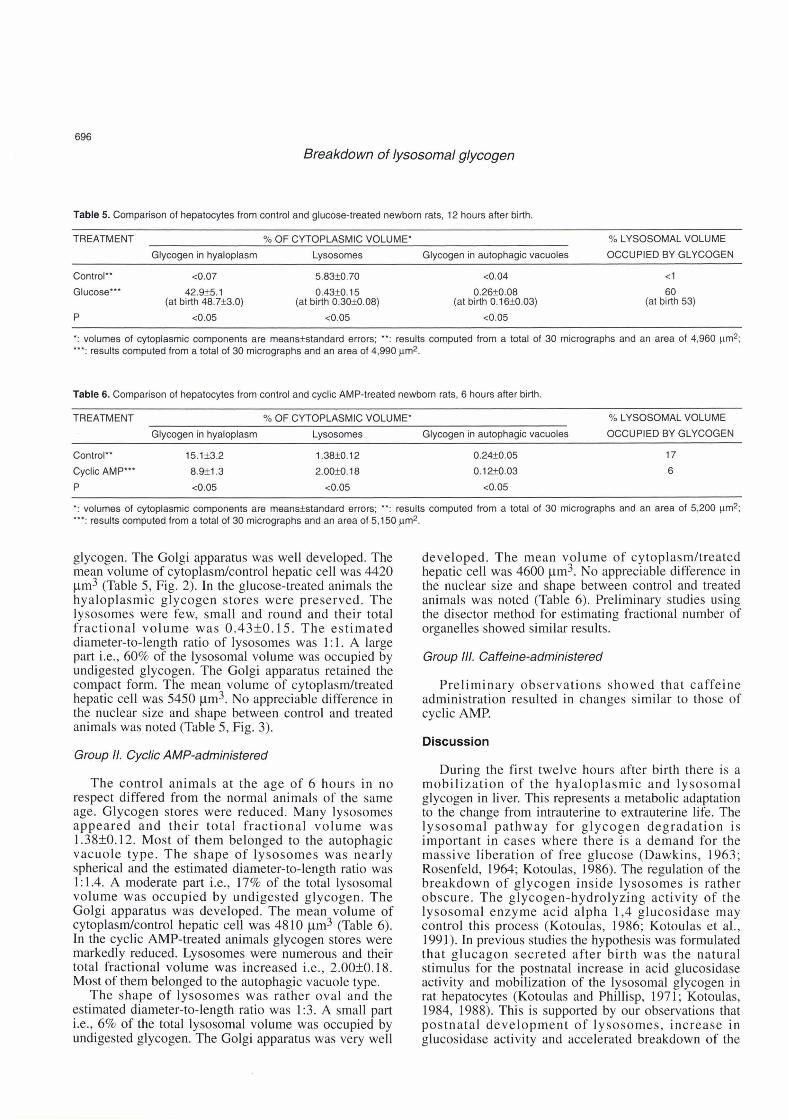
Table 5. Comparison of hepatocytes frorn control and glucose-treated newbom rats, 12 hours after bitth.
TREATMENT % OF CYTOPLASMIC VOLUME* % LYSOSOMAL VOLUME
Glycogen in hyaloplasm Lysosomes Glycogen in autophagic vacuoles OCCUPIED BY GLYCOGEN
Control" <0.07 5.8310.70 c0.04
Glucose"* 42.IH5.1 0.4339.15 0.26Io.08 (at birth 48.7k3.0) (at birth 0.3W.08) (at birth 0.1610.03)
P <0.05 ~ 0 . 0 5 <0.05
<1
60 (at birth 53)
': volumes of cytoplasrnic components are meanststandard errors; **: results computed frorn a total of 30 micrographs and an area of 4,960 1m2; "': results computed from a total of 30 micrographs and an area of 4,990 pm2.
Table 6. Comparison of hepatocytes from control and cyclic AMP-treated newbom rats, 6 hours after birth. - - - -
TREATMENT % OF CYTOPLASMIC VOLUME' % LYSOSOMAL VOLUME
Glycogen in hyaloplasm Lysosomes Glycogen in autophagic vacuoles OCCUPIED BY GLYCOGEN
Control"
Cyclic AMP'**
P
*: volumes of cytoplasmic components are meansfstandard errors; '̂ : results computed frorn a total of 30 micrographs and an area of 5,200 prn2; "': results computed frorn a total of 30 micrographs and an area of 5,150 pm2.
glycogen. The Golgi apparatus was well developed. The mean volume of cytoplasm/control hepatic cell was 4420 pm3 (Table 5, Fig. 2). In the glucose-treated animals the hyaloplasmic glycogen stores were preserved. The lysosomes were few, small and round and their total fractional volume was 0.4310.15. The estimated diameter-to-length ratio of lysosomes was 1 : 1. A large part Le., 60% of the lysosomal volume was occupied by undigested glycogen. The Golgi apparatus retained the compact form. The mean volume of cytoplasmltreated hepatic cell was 5450 pm3. No appreciable difference in the nuclear size and shape between control and treated animals was noted (Table 5, Fig. 3).
Group 11. Cyclic AMP-administered
The control animals at the age of 6 hours in no respect differed from the normal animals of the same age. Glycogen stores were reduced. Many lysosomes appeared and their total fractional volume was 1.38k0.12. Most of them belonged to the autophagic vacuole type. The shape of lysosomes was nearly spherical and the estimated diameter-to-length ratio was 1: 1.4. A moderate part i.e., 17% of the total lysosomal volume was occupied by undigested glycogen. The Golgi apparatus was developed. The mean volume of cytoplasm/control hepatic cell was 4810 pm3 (Table 6). In the cyclic AMP-treated animals glycogen stores were markedly reduced. Lysosomes were numerous and their total fractional volume was increased i.e., 2.00f0.18. Most of them belonged to the autophagic vacuole type.
The shape of lysosomes was rather oval and the estimated diameter-to-length ratio was 1:3. A small part i.e., 6% of the total lysosomal volume was occupied by undigested glycogen. The Golgi apparatus was very well
developed. The mean volume of cytoplasmltreated hepatic cell was 4600 pm3. No appreciable difference in the nuclear size and shape between control and treated animals was noted (Table 6). Prelirninary studies using the disector method for estimating fractional number of organelles showed similar results.
Group 111. Caffeine-administered
Preliminary observations showed that caffeine administration resulted in changes similar to those of cyclic AMP.
Discussion
During the first twelve hours after birth there is a mobilization of the hyaloplasmic and lysosomal glycogen in liver. This represents a metabolic adaptation to the change from intrauterine to extrauterine life. The lysosomal pathway for glycogen degradation is important in cases where there is a demand for the massive liberation of free glucose (Dawkins, 1963; Rosenfeld, 1964; Kotoulas, 1986). The regulation of the breakdown of glycogen inside lysosomes is rather obscure. The glycogen-hydrolyzing activity of the lysosomal enzyme acid alpha 1,4 glucosidase may control this process (Kotoulas, 1986; Kotoulas et al., 1991). In previous studies the hypothesis was formulated that glucagon secreted after birth was the natural stimulus for the postnatal increase in acid glucosidase activity and mobilization of the lysosomal glycogen in rat hepatocytes (Kotoulas and Phillisp, 1971; Kotoulas, 1984, 1988). This is supported by our observations that postnatal development of lysosomes, increase in glucosidase activity and accelerated breakdown of the
Breakdown of lysosomal glycogen
lysosomal glycogen were subsequent to the postnatal hypoglycemia. Normal postnatal hypoglycemia is known to release glucagon (Dawkins, 1963). Parenteral glucose administration abolished hypoglycemia and prevented these changes. In this case, the lysosomes remained small and filled with undegraded glycogen. In the glucose-treated newboms, liver cylic AMP was found to be low. This is in accordance with the fact that glucagon action is mediated by cyclic AMP. Similar changes are observed after the administration of insulin. This hormone acts by counteracting the effect of glucagon to elevate cAMP (Pilkis et al., 1986; Maintas et al., 1993; Molero et al., 1994).
The administration of exogenous cyclic AMP resulted in elevated nucleotide concentration in the liver. This was accompanied by increased lysosomal volume, increased acid glucosidase activity and accelerated breakdown of lysosomal glycogen in the hepatocytes. Caffeine, which potentiates the effects of cyclic AMP, produced similar results (Northrop and Parks, 1964). Also, a positive correlation was found to exist between liver cyclic AMP and glucosidase activity in normal animals. There is an absence of knowledge of the intermediate steps dista1 to that of cyclic AMP, in the reaction sequence leading to the increase of activity of the enzyme. The postnatal rise in this activity and the breakdown of glycogen inside lysosomes were found to be dependent on protein synthesis (Kotoulas, 1988). Also, cyclic AMP could influence the mechanism by which the acid hydrolase dephosphoylation competente of lysosomes is regulated (Einstein and Gabel, 1991; Glickman and Kornfeld, 1993; Meresse and Hoflack, 1993). The findings of this and previous studies suggest that the sequence of events after birth may be as follows. The normal postnatal fa11 in blood glucose produces a release of glucagon. This elevates the liver cyclic AMP concentration which increases the acid glucosidase activity. This change stimulates the breakdown of glycogen inside lysosomes (Dawkins, 1963; Exton and Park, 1968; Shelburne et al., 1973; Kotoulas, 1986).
The change in the shape of lysosomes observed in the cyclic AMP-treated animals cannot be explained by the data of this study. This phenomenon may be related to the fonnation of a lysosomal compartment analogous to the extended tubular compartment of the degradative pathway described in other cells (Swanson et al., 1987; Klausner et al., 1992; Rabinowitz et al., 1992).
Aronson N.N. Jr (1980). Effects of glucagon and insulin on liver lysosornes. Life Sci. 27, 95-104.
Cruz-Onve L.M. and Weibel E.R. (1990). Recent stereological rnethods for cell biology. Arn. J. Physiol. 258, L14SL156.
Dawkins M.J.R. (1963). Glycogen synthesis and breakdown in fetal and newborn rat liver. Ann. N.Y. Acad. Sci. 11 1,203-210.
DeDuve C. and Wattiaux R. (1966). Functions of lysosomes. Annu. Rev. Physiol. 28,435-492.
Dunn W.A. Jr (1990a). Studies on the mechanisrns of autophagy:
Formation of the autophagic vacuole. J. Cell Biol. 1 10, 1923-1 933. Dunn W.A. Jr (1990b). Studies on the rnechanisms of autophagy:
Maturation of the autophagic vacuole. J. Cell Biol., 110, 1935-1945. Einstein R. and Gabel C.A. (1991). Cell- and ligand specific dephosphe
rylation of acid hydrolases: Evidence that the rnannose 6- phosphatase is controled by cornpartrnentalization. J. Cell Biol. 112, 81-94.
Exton J.H. and Park C.R. (1968). The role of cyclic AMP in the control of liver rnetabolisrn. Adv. Enz. Reg. 6,391-407.
Glickrnan J.N. and Kornfeld S. (1993). Mannose 6-phosphate- independent targeting of lysosornal enzyrnes in 1-cell disease B lyrnphoblasts. J. Cell Biol. 123, 99-108.
Hers H.G. (1963). Alpha-glucosidase deficiency in generalized glycogen storage disease (Pornpe's disease). Biochern. J., 86, 11-16.,
Hill A.B. (1967). Principies of rnedical statistics. Oxford University Press. New York. pp 180-200.
Klausner R.D., Donaldson J.G. and Lippincott-Schwartz J. (1992). Brefeldin A: lnsights into the control of rnernbrane traffic and organelle structure. J. Cell Biol. 1 16, 1071 -1080.
Kotoulas A.O., Kotoulas 0.6. and Kalarnidas S. (1991). An electron rnicroscopic and biochernical study of the effects of cyclic AMP, ergotamine or propranolol on the lysosornes of newborn rat hepatocytes. Histol. Histopath. 6, 421-426.
Kotoulas 0.6. (1981). An electron rnicroscopic and biochernical study of the effects of insulin on newborn rat hepatocytes. Pathol. Res. Pract. 172,138-147.
Kotoulas O.B. (1984). An electron microccopic and biochernical study of the effects of glucagon on newborn rat hepatocytes. Bull. Assoc. Anat. (Nancy) 68,189-197.
Kotoulas O.B. (1986). The effects of cyclic 3',5'-AMP on the lysosornes of newborn rat hepatocytes. J. Ultrastruct. Res. 97,210-215.
Kotoulas O.B. (1988). Effects of actinomycin D on the lysosornes of newborn rat hepatocytes. Anat. Rec. 220, 103-107.
Kotoulas O.B. and Phillips M.J. (1971). Fine structural aspects of the rnobilization of hepatic glycogen. Acceleration of glycogen breakdown. Arn. J. Pathol. 63,l-7.
Kotoulas O.B., Ho J., Adachi F., Weigensberg B.I., and Phillips M.J. (1971). Fine structural aspects of the rnobilization of hepatic glywgen. lnhibition of glycogen breakdown. Arn. J. Pathol. 63, 23- 34.
Lejeune N., Thines-Sernpoux D. and Hers H.G. (1963). Tissue fractionation studies. lntracellular distribution and properties of a- gluwsidases in rat liver. Biochern. J. 86, 1821.
Loud A.V. (1968). A quantitative stereological description of the ultra- structure of normal rat liver parenchyrnal cells. J. Cell Biol. 37, 27- 46.
Loud A.V. Barany W.C. and Pack B.A. (1965). Quantitative evaluation of cytoplasrnic stnictures in electron rnicrographs. Lab. Invest. 14, 25s 270.
Lowry O.H., Rosebrough N.J.. Farr A.L. and Randall R.J. (1951). Protein rneasurernent with the Folin phenol reagent. J. Biol. Chem. 193,265-275.
Maintas D.B., Kotoulas 0.6. and Kotoulas A.O. (1993). A quantitative description of the insulin-induced ultrastructural changes in newborn rat hepatocytes. Histd. Histopath. 8,235-242.
Meresse S. and Hoflack B. (1993). Phosphorylation of the cation-independent rnanose 6-phosphate receptor is closely associated with its exit from the trans-Golgi network. J. Cell Biol. 120, 67-75.
Breakdown of lysosomal glycogen
Molero C., Benito M. and Lorenzo M. (1994). Glucose-6-phosphate dehydrogenase gene expression in fetal hepatocyte primary cultures under nonproliferative and proliferative conditions. Exp. Cell Res. 21 O, 26-32.
Northrop G. and Parks R.E. Jr (1964). The effects of adrenergic blocking agents and theophylline on 3',5'-AMP-induced hyper- glycemia. J. Phamacol. Exp. Ther. 145,87-91.
Pfeifer U. (1971). Tageszeitliche rhythmic der zellulgren autophagie. Naturwissenschaften 58, 152.
Pilkis S.J., Fox E., Wolfe L., Rothbarth L., Colosia A,, Stewatt H.B. and El-Maghrabi M.R. (1986). Hormonal modulation of key hepatic regulatory enzymes in the glyconeogenic/glycolytic pathway. Ann. N.Y. Acad. Sci. 478, 1-19.
Raabo E. and Terkildsen T.C. (1960). On !he enzymatic detemination of blood glucose. Scand. J. Clin. Lab. Invest. 12,402-407.
Rabinowitz S., Horstmann H., Gordon S. and Griffiths G. (1992).
lmmunocytochemical characterization of !he endocytic and phago- lysosomal compartments in peritoneal macrophages. J. Cell Biol. 116, 95-112.
Rosenfeld E.L. (1964). Control of glycogen metabolism. Ciba Foundation Symposium. Whelan W.J. and Cameron M.P. (eds). J. and A. Churchill Ltd. London.
Shelburne J.D., Arstila A.U. and Trump B.F. (1973). Studies on cellular autophagocytosis. Am. J. Pathol. 72,521-534.
Swanson J., Burke E. and Silverstein S.C. (1987). Tubular lysosomes accompany stimulated pinocytosis in macrophages. J. Cell Biol. 104, 1217-1222.
Weibel E.R. (1969). Stereological principles for morphometry in electron micrsocopic cytology. Int. Rev. Cytol. 26, 235-302.
Weibel E.R. (1979). Stereological methods. Academic Press. New York.
Accepted June 22,1994


![LUMIZYME (alglucosidase alfa) for Injection · LUMIZYME (alglucosidase alfa) [see Description (11)] is a lysosomal glycogen-specific enzyme indicated for patients 8 years and older](https://static.fdocuments.us/doc/165x107/5c5ecb4609d3f28e068c91c5/lumizyme-alglucosidase-alfa-for-injection-lumizyme-alglucosidase-alfa-see.jpg)
