bre2ch20 589 618 12/21/05 1:48 PM Page 589...
30
20 Conventional Energy Alternatives Upon successfully completing this chapter, you will be able to: Discuss the reasons for seeking alternatives to fossil fuels Summarize the contributions to world energy supplies of conventional alternatives to fossil fuels Describe nuclear energy and how it is harnessed Outline the societal debate over nuclear power Describe the major sources, scale, and impacts of biomass energy Describe the scale, methods, and impacts of hydroelectric power Cooling towers of nuclear power plant, Shropshire, U.K.
-
Upload
trinhhuong -
Category
Documents
-
view
214 -
download
0
Transcript of bre2ch20 589 618 12/21/05 1:48 PM Page 589...

20Conventional Energy Alternatives
Upon successfully completing thischapter, you will be able to:
� Discuss the reasons for seeking alternatives tofossil fuels
� Summarize the contributions to world energysupplies of conventional alternatives to fossilfuels
� Describe nuclear energy and how it is harnessed
� Outline the societal debate over nuclear power
� Describe the major sources, scale, and impacts ofbiomass energy
� Describe the scale, methods, and impacts ofhydroelectric power
Cooling towers ofnuclear power plant,Shropshire, U.K.
bre2ch20_589_618 12/21/05 1:48 PM Page 589

590
On the morning of April 28, 1986, workers at a
nuclear power plant in Sweden detected
suspiciously high radiation levels. Their concern
turned to confusion when they determined that the
radioactivity was coming not from their own plant, but
through the atmosphere from the direction of the Soviet
Union.
They had, in fact, discovered evidence of the disaster
at Chernobyl, more than 1,200 km (750 mi) away in what
is now the nation of Ukraine. Chernobyl’s nuclear reactor
had exploded two days earlier, but the Soviet government
had not yet admitted it to the world.
As low levels of radioactive fallout rained down
on the Swedish countryside in the days ahead,
contaminating crops and cows’ milk, many Swedes felt
more certain than ever about the decision they had
made collectively 6 years earlier. In a 1980 referendum,
Sweden’s electorate had voted to phase out their
country’s nuclear power program, shutting down all
nuclear plants by the year 2010.
But trying to phase out nuclear power has proven
difficult. Nuclear power today provides Sweden with one-
third of its overall energy supply and nearly half its
electricity. If nuclear plants are shut down, something
will have to take their place. Aware of the environmental
impacts of fossil fuels, Sweden’s government and citizens
do not favor expanding fossil fuel use. In fact, Sweden is
one of the few nations that have managed to decrease
use of fossil fuels since the 1970s—and it has done so
largely by replacing them with nuclear power.
To fill the gap that would be left by a nuclear
phaseout, Sweden’s government has promoted research
and development of renewable energy sources.
Biomass powerplant, Skelleftea,Sweden
Central Case: Sweden’s Search forAlternative Energy
“Nowhere has the publicdebate over nuclear powerplants been more severelycontested than Sweden.”—Writer and analyst
Michael Valenti
“If [Sweden] phases outnuclear power, then it will be virtually impossiblefor the country to keep its climate-changecommitments.”—Yale University
economist William
Nordhaus
Sweden
AtlanticOcean
Ukraine
bre2ch20_589_618 12/15/05 9:27 PM Page 590

Hydroelectric power from running water was already
supplying most of the other half of the nation’s
electricity, but it could not be expanded much more. The
government hoped that energy from biomass sources
and wind power could fill the gap.
Sweden has made itself an international leader in
renewable energy alternatives, but because renewables
have taken longer to develop than hoped, the
government has repeatedly postponed the nuclear
phaseout. Only one of the 12 reactors operating in
1980 has been shut down so far, and efforts to close a
second one have generated sustained controversy.
Proponents of nuclear power say it would be fiscally
and socially irresponsible to dismantle the nation’s
nuclear program without a ready replacement. And
environmental advocates worry that if nuclear power
is simply replaced by fossil fuel combustion, or if converting
to biomass energy means cutting down more forests, the
nuclear phaseout would be bad news for the environment.
Moreover, Sweden has made international obligations to
hold down its carbon emissions under the Kyoto Protocol
(� pp. 550, 552), so its incentive to keep nuclear power is
strong. Nuclear energy is free of atmospheric pollution
and seems, to many, the most effective way to minimize
carbon emissions in the short term.
In 2003, a poll showed 55% of the Swedish public in
favor of maintaining or increasing nuclear power, and
41% in favor of abandoning it. But despite the mixed
feelings over nuclear power, Swedes have little desire to
return to an energy economy dominated by fossil fuels. A
concurrent poll showed that 80% of Swedes supported
boosting research on renewable energy sources—a higher
percentage than in any other European country.
Alternatives to Fossil Fuels
Fossil fuels helped to drive the industrial revolution andincrease our material prosperity. Today’s economies arelargely powered by fossil fuels; 80% of all primary energycomes from oil, coal, and natural gas (Figure 20.1a), andthese three fuels also power two-thirds of the world’s elec-tricity generation (Figure 20.1b). However, these nonre-newable energy sources will not last forever. As we saw inChapter 19, oil production is thought to be peaking, andeasily extractable supplies of oil and natural gas may notlast half a century more. Moreover, the use of coal, oil, andnatural gas entails substantial environmental impacts, asdescribed in Chapters 17, 18, and 19.
For these reasons, most scientists and energy experts,as well as many economists and policymakers, accept that
the world’s economies will need to shift from fossil fuelsto energy sources that are less easily depleted and gentleron our environment. Developing alternatives to fossilfuels has the added benefit of helping to diversify aneconomy’s mix of energy, thus lessening price volatilityand dependence on foreign fuel imports.
People have developed a range of alternatives to fossilfuels. Most of these energy sources are renewable and can-not be depleted by use. Most have less impact on the envi-ronment than oil, coal, or natural gas. However, at thistime most remain more costly than fossil fuels (at least inthe short term), and many depend on technologies thatare not yet fully developed.
New renewables(0.5%)
Hydro (2.2%)
Nuclear (6.5%)
Coal(24.4%)
Coal(40.1%)
Natural gas(21.2%)
Natural gas(19.4%) Nuclear
(15.8%)
Hydro(15.9%)
Biomass(10.8%)
Oil(34.4%)
Oil (6.9%)
Biomass andnew renewables(1.9%)
(a) World total primary energy supply
(b) World total electricity generation
Fossil fuels account for 80% of the world’s totalsupply of primary energy (a). Nuclear and hydroelectric powercontribute substantially to global electricity generation, althoughfossil fuels still power two-thirds of our electricity (b). Data from
International Energy Agency. 2005. Key world energy statistics 2005. Paris: IEA.
FIGURE 20.1
CHAPTER TWENTY Conventional Energy Alternatives 591
bre2ch20_589_618 12/21/05 2:42 PM Page 591
Nuclear Power
Nuclear power occupies an odd and conflicted position inour modern debate over energy. It is free of the air pollu-tion produced by fossil fuel combustion, and so has longbeen put forth as an environmentally friendly alternativeto fossil fuels. At the same time, nuclear power’s greatpromise has been clouded by nuclear weaponry, thedilemma of radioactive waste disposal, and the long shadow
592 PART TWO Environmental Issues and the Search for Solutions
(a) Current energy consumption inthe United States by source
(b) Changes in energy consumption in the United Statesover the past half-century
Year
10
20
30
40
01950 1960 1970 1980 1990 2000
Qua
drill
ion
BTU
Oil
Hydroelectric power
Nuclear power
Natural gas Coal Biomass
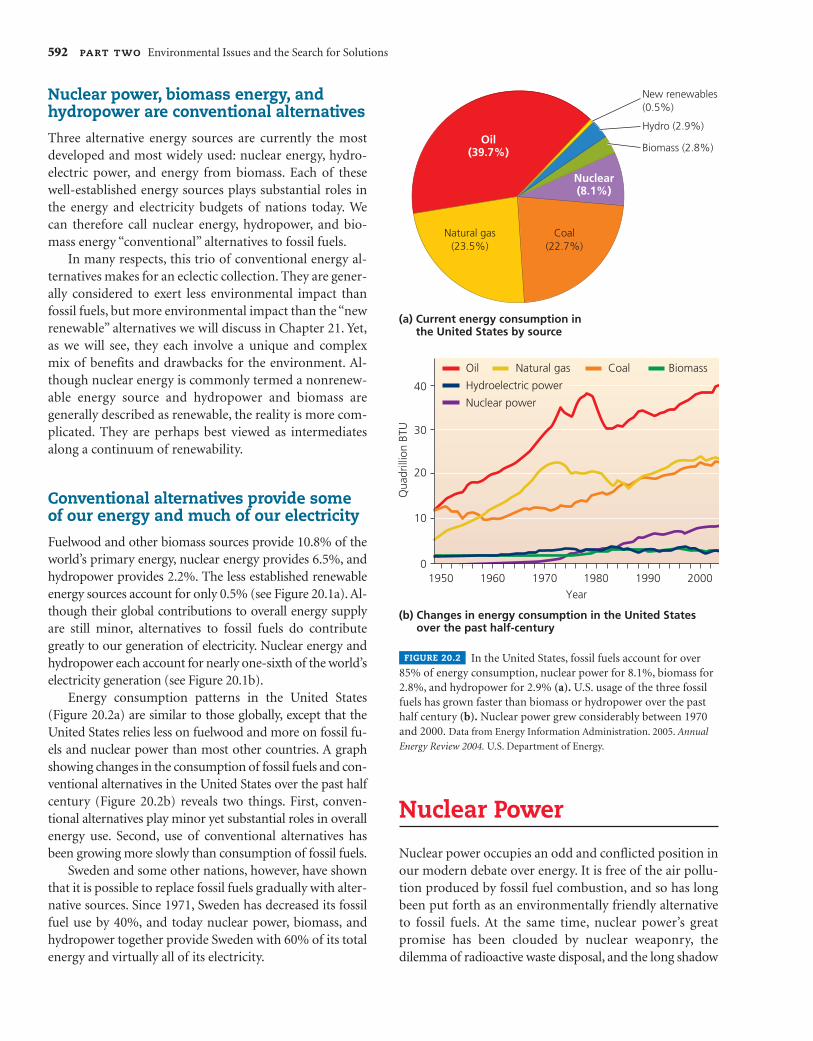
Oil(39.7%)
Natural gas(23.5%)
Coal(22.7%)
New renewables(0.5%)
Hydro (2.9%)
Biomass (2.8%)
Nuclear(8.1%)
In the United States, fossil fuels account for over85% of energy consumption, nuclear power for 8.1%, biomass for2.8%, and hydropower for 2.9% (a). U.S. usage of the three fossilfuels has grown faster than biomass or hydropower over the pasthalf century (b). Nuclear power grew considerably between 1970and 2000. Data from Energy Information Administration. 2005. Annual
Energy Review 2004. U.S. Department of Energy.
FIGURE 20.2
Nuclear power, biomass energy, andhydropower are conventional alternatives
Three alternative energy sources are currently the mostdeveloped and most widely used: nuclear energy, hydro-electric power, and energy from biomass. Each of thesewell-established energy sources plays substantial roles inthe energy and electricity budgets of nations today. Wecan therefore call nuclear energy, hydropower, and bio-mass energy “conventional” alternatives to fossil fuels.
In many respects, this trio of conventional energy al-ternatives makes for an eclectic collection. They are gener-ally considered to exert less environmental impact thanfossil fuels, but more environmental impact than the “newrenewable” alternatives we will discuss in Chapter 21. Yet,as we will see, they each involve a unique and complexmix of benefits and drawbacks for the environment. Al-though nuclear energy is commonly termed a nonrenew-able energy source and hydropower and biomass aregenerally described as renewable, the reality is more com-plicated. They are perhaps best viewed as intermediatesalong a continuum of renewability.
Conventional alternatives provide someof our energy and much of our electricity
Fuelwood and other biomass sources provide 10.8% of theworld’s primary energy, nuclear energy provides 6.5%, andhydropower provides 2.2%. The less established renewableenergy sources account for only 0.5% (see Figure 20.1a). Al-though their global contributions to overall energy supplyare still minor, alternatives to fossil fuels do contributegreatly to our generation of electricity. Nuclear energy andhydropower each account for nearly one-sixth of the world’selectricity generation (see Figure 20.1b).
Energy consumption patterns in the United States(Figure 20.2a) are similar to those globally, except that theUnited States relies less on fuelwood and more on fossil fu-els and nuclear power than most other countries. A graphshowing changes in the consumption of fossil fuels and con-ventional alternatives in the United States over the past halfcentury (Figure 20.2b) reveals two things. First, conven-tional alternatives play minor yet substantial roles in overallenergy use. Second, use of conventional alternatives hasbeen growing more slowly than consumption of fossil fuels.
Sweden and some other nations, however, have shownthat it is possible to replace fossil fuels gradually with alter-native sources. Since 1971, Sweden has decreased its fossilfuel use by 40%, and today nuclear power, biomass, andhydropower together provide Sweden with 60% of its totalenergy and virtually all of its electricity.
bre2ch20_589_618 12/16/05 12:51 AM Page 592

CHAPTER TWENTY Conventional Energy Alternatives 593
of Chernobyl and other power plant accidents. As such,public safety concerns and the costs of addressing them haveconstrained the development and spread of nuclear powerin the United States, Sweden, and many other nations.
First developed commercially in the 1950s, nuclearpower has expanded 15-fold worldwide since 1970, expe-riencing most of its growth during the 1970s and 1980s.Of all nations, the United States generates the most elec-tricity from nuclear power—nearly a third of the world’sproduction— and is followed by France and Japan. How-ever, only 20% of U.S. electricity comes from nuclearsources. A number of other nations rely more heavilyon nuclear power (Table 20.1). For instance, France andLithuania each receive roughly four-fifths of their elec-tricity from nuclear sources.
Fission releases nuclear energy
Strictly defined, nuclear energy is the energy that holdstogether protons and neutrons within the nucleus of anatom. We harness this energy by converting it to thermalenergy, which can then be used to generate electricity.Several processes can convert the energy within an atom’snucleus into thermal energy, releasing it and making itavailable for use. Each process involves transforming iso-topes (� pp. 92–95) of one element into isotopes of otherelements, by the addition or loss of neutrons.
The reaction that drives the release of nuclear energyin power plants is nuclear fission, the splitting apart ofatomic nuclei (Figure 20.3). In fission, the nuclei of large,heavy atoms, such as uranium or plutonium, are bom-barded with neutrons. Ordinarily neutrons move tooquickly to split nuclei when they collide with them, but ifneutrons are slowed down they can break apart nuclei.Each split nucleus emits multiple neutrons, together withsubstantial heat and radiation. These neutrons (two tothree in the case of fissile isotopes of uranium-235) can inturn bombard other uranium-235 (235U) atoms in thevicinity, resulting in a self-sustaining chain reaction.
If not controlled, this chain reaction becomes a run-away process of positive feedback that releases enormousamounts of energy—the same process that creates the ex-plosive power of a nuclear bomb. Inside a nuclear powerplant, however, fission is controlled so that only one of thetwo or three neutrons emitted with each fission event goeson to induce another fission event. In this way, the chainreaction maintains a constant output of energy at a con-trolled rate, rather than an explosively increasing output.
Nuclear energy comes from processedand enriched uranium
We generate electricity from nuclear power by controllingfission in nuclear reactors, facilities contained withinnuclear power plants. But this is just one step in a longerprocess sometimes called the nuclear fuel cycle. This
Percentage ofelectricity
generation from Nuclear power Number of nuclear power
Nation consumed1 plants2 plants3
United States 187.9 104 19
France 101.4 59 78
Japan 64.8 53 23
Germany 37.8 18 28
Russia 32.4 30 16
South Korea 29.6 19 37
Canada 20.5 16 13
Ukraine 19.7 13 45
United Kingdom 18.1 27 22
Sweden 17.3 11 50
Table 20.1 Top Consumers of Nuclear Power
Data from International Atomic Energy Agency, British Petroleum, andInternational Energy Agency.1In million metric tons of oil equivalent, 2004 data.22003 data.32003 data.
In nuclear fission, atoms of uranium-235 arebombarded with neutrons. Each collision splits uranium atomsinto smaller atoms and releases two or three neutrons, along withenergy and radiation. Because the neutrons can continue to splituranium atoms and set in motion a runaway chain reaction,engineers at nuclear plants must absorb excess neutrons withcontrol rods to regulate the rate of the reaction.
FIGURE 20.3
Neutron
235Uranium
Energy
Fission fragment(krypton, for example)
Fission fragment(barium, for example)
Free neutrons
bre2ch20_589_618 12/15/05 9:27 PM Page 593

process begins when the naturally occurring elementuranium is mined from underground deposits, as we sawwith the mines on Australian Aboriginal land in Chapter 2.
Uranium is an uncommon mineral, and uranium oreis in finite supply, which is why nuclear power is generallyconsidered a nonrenewable energy source. Uranium isused for nuclear power because it is radioactive. Radioac-tive isotopes, or radioisotopes, emit subatomic particlesand high-energy radiation as they decay into lighter ra-dioisotopes, until they become stable isotopes. The isotopeuranium-235 decays into a series of daughter isotopes,eventually forming lead-207. Each radioisotope decays at arate determined by that isotope’s half-life, the amount oftime it takes for one-half of the atoms to give off radiationand decay. Different radioisotopes have very different half-lives, ranging from fractions of a second to billions ofyears. The half-life of 235U is about 700 million years.
Over 99% of the uranium in nature occurs as the isotopeuranium-238. Uranium-235 (with three fewer neutrons)makes up less than 1% of the total. Because 238U does notemit enough neutrons to maintain a chain reaction whenfissioned, we use 235U for commercial nuclear power. So,mined uranium ore must be processed to enrich the con-
centration of 235U to at least 3%. The enriched uranium isformed into small pellets of uranium dioxide (UO2), whichare incorporated into large metallic tubes called fuel rods(Figure 20.4) that are used in nuclear reactors. After severalyears in a reactor, enough uranium has decayed so that thefuel loses its ability to generate adequate energy, and it mustbe replaced with new fuel. In some countries, the spent fuelis reprocessed to recover what usable energy may be left.Most spent fuel, however, is disposed of as radioactive waste.
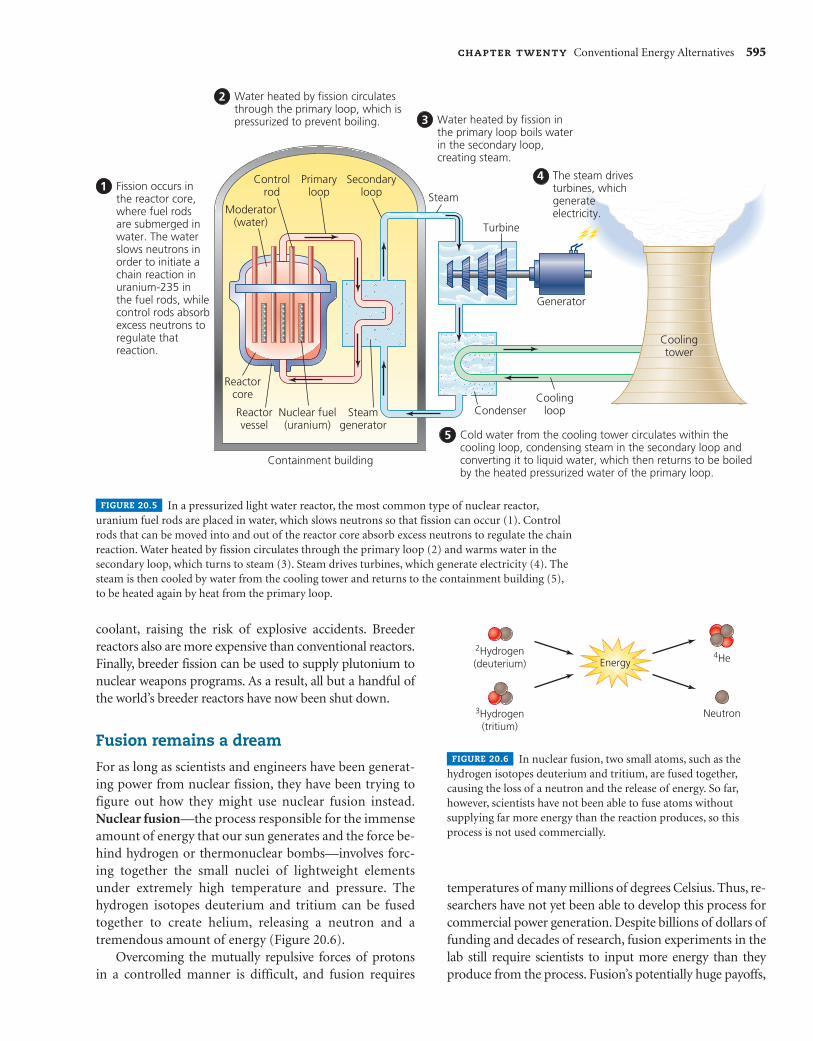
Fission in reactors generates electricity innuclear power plants
For fission to begin in a nuclear reactor, the neutronsbombarding uranium are slowed down with a substancecalled a moderator, most often water or graphite. With amoderator allowing fission to proceed, it then becomesnecessary to soak up the excess neutrons produced whenuranium nuclei divide, so that on average only a singleuranium atom from each nucleus goes on to split anothernucleus. For this purpose, control rods, made of a metallicalloy that absorbs neutrons, are placed into the reactoramong the water-bathed fuel rods. Engineers move thesecontrol rods into and out of the water to maintain the fis-sion reaction at the desired rate.
All this takes place within the reactor core and is thefirst step in the electricity-generating process of a nuclearpower plant (Figure 20.5). The reactor core is housedwithin a reactor vessel, and the vessel, steam generator,and associated plumbing are protected within a containmentbuilding. Containment buildings, with their meter-thickconcrete and steel walls, are constructed to prevent leaksof radioactivity due to accidents or natural catastrophessuch as earthquakes.
Breeder reactors make better use of fuel,but have raised safety concerns
Using 235U as fuel for conventional fission is only one po-tential route to harnessing nuclear energy. A similarprocess, breeder nuclear fission, makes use of 238U, whichin conventional fission goes unused as a waste product. Inbreeder fission, the addition of a neutron to 238U formsplutonium (239Pu). When plutonium is bombarded by aneutron, it splits into fission products and releases moreneutrons, which convert more of the remaining 238U fuelinto 239Pu, continuing the process. Because 99% of alluranium is 238U, breeder fission makes much better use offuel, generates far more power, and produces far less waste.
However, breeder fission is considerably more danger-ous than conventional nuclear fission, because highlyreactive liquid sodium, rather than water, is used as a
594 PART TWO Environmental Issues and the Search for Solutions
Enriched uranium fuel is packaged into fuel rods,which are encased in metal and used to power fission inside thecores of nuclear reactors. In this photo, the fuel rods are visiblearrayed in a circle within the blue water, at bottom.
FIGURE 20.4
bre2ch20_589_618 12/15/05 9:27 PM Page 594
CHAPTER TWENTY Conventional Energy Alternatives 595
coolant, raising the risk of explosive accidents. Breederreactors also are more expensive than conventional reactors.Finally, breeder fission can be used to supply plutonium tonuclear weapons programs. As a result, all but a handful ofthe world’s breeder reactors have now been shut down.
Fusion remains a dream
For as long as scientists and engineers have been generat-ing power from nuclear fission, they have been trying tofigure out how they might use nuclear fusion instead.Nuclear fusion—the process responsible for the immenseamount of energy that our sun generates and the force be-hind hydrogen or thermonuclear bombs—involves forc-ing together the small nuclei of lightweight elementsunder extremely high temperature and pressure. Thehydrogen isotopes deuterium and tritium can be fusedtogether to create helium, releasing a neutron and atremendous amount of energy (Figure 20.6).
Overcoming the mutually repulsive forces of protonsin a controlled manner is difficult, and fusion requires
temperatures of many millions of degrees Celsius. Thus, re-searchers have not yet been able to develop this process forcommercial power generation. Despite billions of dollars offunding and decades of research, fusion experiments in thelab still require scientists to input more energy than theyproduce from the process. Fusion’s potentially huge payoffs,
Coolingtower
3
Fission occurs inthe reactor core,where fuel rodsare submerged inwater. The waterslows neutrons inorder to initiate achain reaction inuranium-235 inthe fuel rods, whilecontrol rods absorbexcess neutrons toregulate thatreaction.
1
Water heated by fission circulates through the primary loop, which is pressurized to prevent boiling.
2
Cold water from the cooling tower circulates within thecooling loop, condensing steam in the secondary loop andconverting it to liquid water, which then returns to be boiledby the heated pressurized water of the primary loop.
5
Water heated by fission in the primary loop boils water in the secondary loop, creating steam.
The steam drives turbines, whichgenerate electricity.
4
Generator
CoolingloopCondenser
Turbine
Coolingtower
SteamModerator
(water)
Primaryloop
Secondaryloop
Reactorcore
Reactorvessel
Controlrod
Steamgenerator
Nuclear fuel(uranium)
Containment building
In a pressurized light water reactor, the most common type of nuclear reactor,uranium fuel rods are placed in water, which slows neutrons so that fission can occur (1). Controlrods that can be moved into and out of the reactor core absorb excess neutrons to regulate the chainreaction. Water heated by fission circulates through the primary loop (2) and warms water in thesecondary loop, which turns to steam (3). Steam drives turbines, which generate electricity (4). Thesteam is then cooled by water from the cooling tower and returns to the containment building (5),to be heated again by heat from the primary loop.
FIGURE 20.5
In nuclear fusion, two small atoms, such as thehydrogen isotopes deuterium and tritium, are fused together,causing the loss of a neutron and the release of energy. So far,however, scientists have not been able to fuse atoms withoutsupplying far more energy than the reaction produces, so thisprocess is not used commercially.
FIGURE 20.6
Neutron
Energy4He
3Hydrogen(tritium)
2Hydrogen(deuterium)
bre2ch20_589_618 12/15/05 9:27 PM Page 595

though, make many scientists eager to keep trying. If oneday we were to find a way to control fusion in a reactor, wecould produce vast amounts of energy using water as a fuel.The process would create only low-level radioactive wastes,without pollutant emissions or the risk of dangerous acci-dents, sabotage, or weapons proliferation. A consortium ofnations including Japan, several European countries, andthe United States is currently seeking to build a prototypefusion reactor called the International Thermonuclear Ex-perimental Reactor (ITER). Even if this multibillion-dollareffort succeeds, however, power from fusion seems likely toremain many years in the future.
Nuclear power delivers energy morecleanly than fossil fuels
Using conventional fission, nuclear power plants generateelectricity without creating air pollution from stack emis-sions. In contrast, combusting coal, oil, or natural gas emitssulfur dioxide that contributes to acidic deposition, partic-ulate matter that threatens human health, and carbon diox-ide and other greenhouse gases that contribute to globalclimate change. Even considering all the steps involved inbuilding plants and generating power, researchers from theInternational Atomic Energy Agency (IAEA) have calcu-lated that nuclear power lowers emissions 4–150 times be-low fossil fuel combustion (see “The Science behind theStory,” � pp. 598–599). IAEA scientists estimate that at cur-rent global rates of usage, nuclear power helps us avoid
emitting 600 million metric tons of carbon each year,equivalent to 8% of global greenhouse gas emissions.
Nuclear power has additional environmental advantagesover fossil fuels, coal in particular. Because uranium gener-ates far more power than coal by weight or volume, less of itneeds to be mined, so uranium mining causes less damageto landscapes and generates less solid waste than coal min-ing. Additionally, in the course of normal operation, nuclearpower plants are safer for workers than coal-fired plants.
However, nuclear power also has drawbacks. One isthat the waste it produces is radioactive. Radioactive wastemust be handled with great care and must be disposed ofin a way that minimizes danger to present and future gen-erations. The second main drawback is that if an accidentoccurs at a power plant, or if a plant is sabotaged, the con-sequences can potentially be catastrophic.
Given this mix of advantages and disadvantages(Table 20.2), most governments (although not necessarilymost citizens) judged the good to outweigh the bad, andtoday the world has 439 operating nuclear plants.
Weighing the Issues:
Choose your Risk
Given the choice of living next to a nuclear power plant
or living next to a coal-fired power plant, which would
you choose? What would concern you most about each
option?
596 PART TWO Environmental Issues and the Search for Solutions
Type of Impact Coal Nuclear
Land and ecosystem disturbance Extensive, on surface or underground Less extensivefrom mining
Greenhouse gas emissions Considerable emissions None from plant operation; much less than coal over the entire life cycle
Other air pollutants Sulfur dioxide, nitrogen oxides, particulate No pollutant emissionsmatter, and other pollutants
Radioactive emissions No appreciable emissions No appreciable emissions during normal operation; possibility of emissions during severe accident
Occupational health among workers More known health problems and fatalities Fewer known health problems and fatalities
Health impacts on nearby residents Air pollution impairs health No appreciable known health impacts under normal operation
Effects of accident or sabotage No widespread effects Potentially catastrophic widespread effects
Solid waste More generated Less generated
Radioactive waste None Radioactive waste generated
Fuel supplies remaining Should last several hundred more years Uncertain; supplies could last longer or shorter than coal supplies
Table 20.2 Environmental Impacts of Coal-Fired and Nuclear Power
Note: More-severe impacts are in italics.
bre2ch20_589_618 12/21/05 11:56 AM Page 596

CHAPTER TWENTY Conventional Energy Alternatives 597
Nuclear power poses small risks of large accidents
Although scientists calculate that nuclear power posesfewer chronic health risks than does fossil fuel combustion,the possibility of catastrophic accidents has spawned a greatdeal of public anxiety over nuclear power. Two events wereinfluential in shaping public opinion about nuclear energy.
The first took place at the Three Mile Island plant inPennsylvania (Figure 20.7), where in 1979 the UnitedStates experienced its most serious nuclear power plantaccident. Through a combination of mechanical failureand human error, coolant water drained from the reactorvessel, temperatures rose inside the reactor core, andmetal surrounding the uranium fuel rods began to melt,releasing radiation. This process is termed a meltdown,and it proceeded through half of one reactor core at ThreeMile Island. Area residents stood ready to be evacuated asthe nation held its breath, but fortunately most radiationremained trapped inside the containment building.
The accident was brought under control within days,the damaged reactor was shut down, and multibillion-dollar cleanup efforts stretched on for years. Three MileIsland is best regarded as a near-miss; the emergencycould have been far worse had the meltdown proceededthrough the entire stock of uranium fuel, or had the con-tainment building not contained the radiation. Althoughno significant health effects on residents have been proven
in the years since, the event put safety concerns squarelyon the map for U.S. citizens and policymakers.
Chernobyl saw the worst accident yet
In 1986 an explosion at the Chernobyl plant in Ukraine(part of the Soviet Union at the time) caused the most se-vere nuclear power plant accident the world has yet seen(Figure 20.8). Engineers had turned off safety systems to
The Three Mile Island nuclear power plant nearHarrisburg, Pennsylvania, was the site of the most serious nuclearpower plant accident in U.S. history. The partial meltdown here in1979 was a “near-miss”—radiation was released but was mostlycontained, and no health impacts have been confirmed. Theincident put the world on notice, however, that a major accidentcould potentially occur.
FIGURE 20.7
The world’s worst nuclear power plant accidentunfolded in 1986 at Chernobyl, in present-day Ukraine (then partof the Soviet Union). As part of the extensive cleanup operation,the destroyed reactor was encased in a massive concretesarcophagus (a) to contain further radiation leakage. Techniciansscoured the landscape surrounding the plant (b), measuringradiation levels, removing soil, and scrubbing roads and buildings.
FIGURE 20.8
(a) The Chernobyl sarcophagus
(b) Technicians measuring radiation
bre2ch20_589_618 12/15/05 9:28 PM Page 597

conduct tests, and human error, combined with unsafe re-actor design, resulted in explosions that destroyed the reac-tor and sent clouds of radioactive debris billowing into theatmosphere. For 10 days radiation escaped from the plant,while emergency crews risked their lives (some later diedfrom radiation exposure) putting out fires. Most residentsof the surrounding countryside remained at home for these10 days, exposed to radiation, before the Soviet governmentbelatedly began evacuating more than 100,000 people. Inthe months and years afterwards, workers erected a gigantic
concrete sarcophagus around the demolished reactor,scrubbed buildings and roads, and removed irradiated ma-terials, but the landscape for at least 30 km (19 mi) aroundthe plant remains contaminated today.
The accident killed 31 people directly and sickened orcaused cancer in many more. Exact numbers are uncer-tain because of inadequate data and the difficulty of de-termining long-term radiation effects (see “The Sciencebehind the Story,” � pp. 604–605). It is widely thought thatat least 2,000 people who were children at the time have
598 PART TWO Environmental Issues and the Search for Solutions
Combusting coal, oil,or natural gas emits
carbon dioxide and othergreenhouse gases into the atmo-sphere, where they contribute toglobal climate change (Chapter 18).Reducing greenhouse emissions isone of the main reasons so manypeople want to replace fossil fuelswith alternative energy sources.
But determining how differentenergy alternatives stack up interms of emissions is a complexprocess. A number of studies havetried to quantify and compareemission rates of different energytypes, but the varying methodolo-gies used have made it hard tosynthesize this information into acoherent picture.
Researchers from the Interna-tional Atomic Energy Agency (IAEA)made an attempt at such a synthesisfor the generation of electricity.Experts met at six meetingsbetween 1994 and 1998 and re-viewed the existing scientific litera-ture, together with data fromindustry and government. Their goalwas to come up with a range of esti-mates of greenhouse gas emissionsfor nuclear energy, each major fossilfuel type, and each major renewableenergy source. IAEA scientists Joseph
TheScience
behind
theStory
Assessing Emissions from Power Sources
Stack emissionsOther steps in the life cycle
HighCoal
278 79
HighOil
215 31
Low 216 48
Low 195 24
HighNatural gas
157 31Low 99
HighSolar
76.4Low 27.3
HighBiomass
16.6Low 8.4
HighHydroelectric
64.6Low
HighWind
13.1Low 2.5
HighNuclear
5.7Low 2.5
1.1
21
0 50 100 150 200 250 300 350Grams carbon-equivalent per kilowatt-hour
Coal, oil, and natural gas emit far more greenhouse gases than do renewable energysources and nuclear energy. Red portions of bars represent stack emissions, andorange portions show emissions resulting from other steps in the life cycle. Data from
Spadaro, J. V., et al. 2000. Greenhouse gas emissions of electricity generation chains: Assessing
the difference. IAEA Bulletin 42(2).
Spadaro, Lucille Langlois, and BruceHamilton then published the resultsin the IAEA Bulletin in 2000.
The researchers had to decidehow much of the total life cycle ofelectric power production to include
bre2ch20_589_618 12/15/05 9:28 PM Page 598

contracted or will contract thyroid cancer from radioac-tive iodine. Estimates for the total number of cancer casesattributable to Chernobyl, past and future, vary widely,from a few thousand to hundreds of thousands.
Atmospheric currents carried radioactive fallout fromChernobyl across much of the Northern Hemisphere,particularly Ukraine, Belarus, and parts of Russia and Eu-rope (Figure 20.9). Fallout was greatest where rainstormsbrought radioisotopes down from the radioactive cloud.Parts of Sweden received high amounts of fallout. The ac-
cident reinforced the Swedish public’s fears about nuclearpower. A survey taken after the event asked,“Do you thinkit was good or bad for the country to invest in nuclear en-ergy?” The proportion answering “bad” jumped from25% before Chernobyl to 47% afterward.
The world has been fortunate not to have experiencedanother accident on the scale of Chernobyl in the twodecades since. There have been smaller-scale incidents; forinstance, a 1999 accident at a plant in Tokaimura, Japan,killed two workers and exposed over 400 others to leaked
CHAPTER TWENTY Conventional Energy Alternatives 599
in their estimates. Simply comparingthe rotation of turbines at a windfarm to the operation of a coal-firedpower plant might not be fair, be-cause it would not reveal that green-house gases were emitted as a resultof manufacturing the turbines,transporting them to the site, anderecting them there. Similarly,because uranium mining is part ofthe nuclear fuel cycle, and becausewe use oil-fueled machinery to mineuranium, perhaps emissions fromthis process should be included inthe estimate for nuclear power.
The researchers decided to con-duct a “cradle-to-grave” analysis andinclude all sources of emissionsthroughout the entire life cycle ofeach energy source. This includednot just power generation, but alsothe mining of fuel, preparation andtransport of fuel, manufacturing ofequipment, construction of powerplants, disposal of wastes, and de-commissioning of plants. They did,however, separate stack emissionsfrom all other sources of emissions inthe chain of steps so that these datacould be analyzed independently.
Different greenhouse gases werethen standardized to a unit of “car-bon equivalence” according to theirglobal warming potential (� pp. 530–
532). For instance, because methaneis 21 times as powerful a greenhousegas as carbon, each unit of methaneemitted was counted as 21 units ofcarbon-equivalence. The researchersthen calculated rates of emissionper unit of power produced. Theypresented figures in grams ofcarbon-equivalent emitted perkilowatt-hour (gCeq/kWh) of elec-tric power produced.
The overall pattern they foundwas clear: Fossil fuels produce muchhigher emission rates than renewableenergy sources and nuclear energy(see the figure). The highest emissionrate for fossil fuels (357 gCeq/kWh forcoal) was 4.7 times higher than thehighest emission rate for any renew-able energy source (76.4 gCeq/kWhfor solar power). The lowest emissionrate for any fossil fuel (106 gCeq/kWhfor natural gas) was nearly 100 timesgreater than the lowest rate for re-newables (1.1 gCeq/kWh for oneform of hydropower). Overall, emis-sions decreased in the followingorder: coal, oil, natural gas, photo-voltaic solar, hydroelectric, biomass,wind, and nuclear.
The majority of fossil fuel emis-sions were direct stack emissionsfrom power generation, and theamounts due to other steps in the
life cycle were roughly comparableto those from some renewablesources.
Within each category, emissionsvalues varied considerably. This wasdue to many factors, including thetype of technology used, geographiclocation and transport costs, carboncontent of the fuel, and the effi-ciency with which fuel was con-verted to electricity.
However, technology was ex-pected to improve in the future, cre-ating greater fuel-to-electricityconversion efficiency and thereforelowering emissions rates. Thus, theresearchers devised separate emis-sions estimates for newer technolo-gies expected between 2005 and2020. These estimates suggestedthat fossil fuels will improve but stillwill not approach the cleanliness ofnuclear energy and most renewablesources.
Because the IAEA is charged withpromoting nuclear energy, criticspoint out that the agency has clearmotivation for conducting a studythat shows nuclear power in such afavorable light. However, few expertswould quibble with the overall trendin the study’s data: Nuclear and re-newable energy sources are demon-strably cleaner than fossil fuels.
bre2ch20_589_618 12/21/05 2:42 PM Page 599

radiation. And as plants around the world age, they re-quire more maintenance and are therefore less safe. Newconcerns have also surfaced. The September 11, 2001, ter-rorist attacks raised fears that similar airplane attackscould be carried out against nuclear plants. Moreover, ra-dioactive material could be stolen from plants and used interrorist attacks. This possibility is especially worrisomein Russia and other cash-strapped nations of the formerSoviet Union, where hundreds of former nuclear siteshave gone without adequate security for over a decade. Ina cooperative international agreement, the U.S. govern-ment, through the “megatons to megawatts” program, hasbeen buying up some of this material and diverting it topeaceful use in power generation.
Waste disposal remains a problem
Even if nuclear power generation could be made com-pletely safe, we would still be left with the conundrum ofwhat to do with spent fuel rods and other radioactivewaste. Recall that fission utilizes 235U as fuel, leaving the97% of uranium that is 238U as waste. This 238U, as well asall irradiated material and equipment that is no longerbeing used, must be disposed of in a location whereradiation will not escape and harm the public. Becausethe half-lives of uranium, plutonium, and many otherradioisotopes are far longer than human lifetimes, thiswaste will continue emitting dangerous levels of radiationfor thousands of years. Thus, radioactive waste must be
600 PART TWO Environmental Issues and the Search for Solutions
Port
ugal
Spain
France
Italy
Greece
Northern Africa
Turkey
HungaryRomania
Moldova
Belgium Germany
Slovakia
Nodataavailable
CzechRepublic
Poland
AustriaSwitzerland
Slovenia
Netherlands
Denmark
AtlanticOcean
MediterraneanSea
TyrrhenianSea
IonianSea
AegeanSeaAegeanSea
NorwegianSea
BarentsSea
WhiteSeaWhiteSea
BalticSeaBalticSea
Black Sea
Caspian Sea
NorthSea
Norway
Sweden
Finland
Russia
Ukraine
Chernobyl
Estonia
Latvia
Lithuania
Belarus
Ireland
UnitedKingdom
Adriatic Sea
Highest
Cesium-137 deposition
HighMediumLow
Radioactive fallout from the Chernobyl disaster was deposited across Europe incomplex patterns resulting from atmospheric currents and rainstorms in the days following theaccident. Darker colors in the map indicate higher levels of radioactivity. Although Chernobylproduced 100 times more fallout than the U.S. bombs dropped on Hiroshima and Nagasaki inWorld War II, it was distributed over a much wider area. Thus, levels of contamination in any givenplace outside of Ukraine, Belarus, and Russia were relatively low; the average European received lessthan the amount of radiation a person receives naturally in a year. Data from chernobyl.info, Swiss
Agency for Development and Cooperation, Bern, 2005.
FIGURE 20.9
bre2ch20_589_618 12/16/05 4:09 AM Page 600

CHAPTER TWENTY Conventional Energy Alternatives 601
placed in unusually stable and secure locations where ra-dioactivity will not harm future generations.
Currently, nuclear waste from power generation is be-ing held in temporary storage at nuclear power plantsacross the United States and the world. Spent fuel rods aresunken in pools of cooling water to minimize radiationleakage (Figure 20.10a). However, the U.S. Department ofEnergy (DOE) estimates that by 2010, three-fourths ofU.S. plants will have no room left for this type of storage.Many plants are now expanding their storage capacity bystoring waste in thick casks of steel, lead, and concrete(Figure 20.10b).
In total, U.S. power plants are storing over 49,000 met-ric tons of radioactive waste, enough to fill a football fieldto the depth of 3.3 m (10 ft). This waste is held at 125 sitesspread across 39 states (Figure 20.11). A 2005 NationalAcademy of Sciences report judged that most of these siteswere vulnerable to terrorist attacks. The DOE estimates thatover 161 million U.S. citizens live within 125 km (75 mi)of temporarily stored waste.
Because storing waste at numerous dispersed sitescreates a large number of potential hazards, nuclearwaste managers have long wanted to send all waste to acentral repository that can be heavily guarded. In Swe-den, that nation’s nuclear industry has established a sin-gle repository for low-level waste near one power plantand is searching for a single disposal site deep withinbedrock for spent fuel rods and other high-level waste.The industry hopes to decide on a site and get it ap-proved by 2008.
In the United States, the multi-year search homed inon Yucca Mountain, a remote site in the desert of southernNevada, 160 km (100 mi) from Las Vegas (Figure 20.12a,� p. 603). Choice of this site followed extensive study bygovernment scientists (Figure 20.12b), but Nevadans werenot happy about the choice and fought against it. In 2002the site was recommended by the president and approvedby Congress, and the Department of Energy is now await-ing approval from the Nuclear Regulatory Commission. Ifgiven final approval, Yucca Mountain is expected to beginreceiving waste from nuclear reactors, as well as high-levelradioactive waste from military installations, in 2010.According to the design, waste would be stored in a net-work of tunnels 300 m (1,000 ft) underground, yet 300 m(1,000 ft) above the water table (Figure 20.12c) Scientistsand policymakers chose the Yucca Mountain site becausethey determined that:
� It is unpopulated, lying 23 km (14 mi) from the nearestyear-round residences.
� It has stable geology, with minimal risk of earthquakesthat could damage the tunnels and release radioactivity.
(a) Wet storage
(b) Dry storage
Spent uranium fuel rods are currently stored atnuclear power plants and will likely remain at these scattered sitesuntil a central repository for radioactive waste is developed. Spentfuel rods are most often kept in “wet storage” in pools of water (a), which keep them cool and reduce radiation release. Alternatively,the rods may be kept in “dry storage” in thick-walled casks layeredwith lead, concrete, and steel (b).
FIGURE 20.10
bre2ch20_589_618 12/15/05 9:28 PM Page 601

602 PART TWO Environmental Issues and the Search for Solutions
most every state of the union, many people worry that therisk of an accident or of sabotage is unacceptably high.
Weighing the Issues:
How to Store Waste?
Which do you think is a better option—to transport nuclear
waste cross-country to a single repository or to store it
permanently at numerous power plants and military bases
scattered across the nation? Would your opinion be affected
if you lived near the repository site? Near a power plant?
On a highway route along which waste was transported?
Multiple dilemmas have slowed nuclearpower’s growth
Dogged by concerns over waste disposal, safety, and ex-pensive cost overruns, nuclear power’s growth hasslowed. Since the late 1980s, nuclear power has grown by2.5% per year, about the same rate as electricity genera-tion overall. Public anxiety in the wake of Chernobyl
Nuclear waste from civilian reactors is currently stored at 125 sites in 39 statesacross the United States. In this map, dots indicate each storage site, and the four shades of colorindicate the total amount of waste stored in each state. Data from: Office of Civilian Radioactive Waste
Management, U.S. Department of Energy; and Nuclear Energy Institute, Washington, D.C.
FIGURE 20.11
>1,000
Metric tons of spent fuel
101–1,000<1–1000
WAWAWA
OROROR
NV
UTCOCOCO
NM
TXTXTX
OK
KS
AZAZAZ
CA
HIAK
IDIDID
WY
MT ND
MNWI
IAIAIA
MOMOMO
ARARAR
LALALA
MS ALALAL GAGAGA
SCSCSC
NC
VAVAVAWV
OH
PAPAPA
MD
DE
MANYNYNY
VTNHNHNH
MEMEME
IN
KY
TN
IL
FL
MISDSDSD
NE NJ
RICT
� Its dry climate should minimize water infiltrationthrough the soil, reducing chances of groundwatercontamination.
� The water table is deep underground, makinggroundwater contamination less likely.
� The pool of groundwater does not connect withgroundwater elsewhere, so that any contaminationwould be contained.
� The location, on federal land, can feasibly be protectedfrom sabotage.
Some scientists, antinuclear activists, and concernedNevadans have challenged these conclusions. For in-stance, they argue that earthquakes or volcanic activitycould destabilize the site’s geology. They also fear that fis-sures in the mountain’s rock could allow rainwater to seepinto the caverns.
A greater concern, in many people’s minds, is that nu-clear waste will need to be transported to Yucca Mountainfrom the 125 current storage areas and from current andfuture nuclear plants and military installations. Becausethis would involve many thousands of shipments by railand truck across hundreds of public highways through al-
bre2ch20_589_618 12/21/05 2:42 PM Page 602

CHAPTER TWENTY Conventional Energy Alternatives 603
made utilities less willing to invest in new plants. So didthe enormous expense of building, maintaining, operat-ing, and ensuring the safety of nuclear facilities. Almostevery nuclear plant has turned out to be more expensivethan expected. In addition, plants have aged morequickly than expected because of problems that were un-derestimated, such as corrosion in coolant pipes. Theplants that have been shut down—well over 100 aroundthe world to date—have served on average less than halftheir expected lifetimes. Moreover, shutting down, or de-commissioning, a plant can sometimes be more expen-sive than the original construction. As a result of theseeconomic issues, electricity from nuclear power today re-mains more expensive than electricity from coal and
other sources. Governments are still subsidizing nuclearpower to keep consumer costs down, but many privateinvestors lost interest long ago.
Nonetheless, nuclear power remains one of the fewcurrently viable alternatives to fossil fuels with which wecan generate large amounts of electricity in short order.The International Energy Agency (IEA) predicts nuclearproduction will peak at 7% of world energy use and 17%of electricity production in 2010, then decline to 5% ofworld energy use and 9% of electricity production by2030. The reason is that Asian nations are adding gener-ating capacity, but three-quarters of Western Europe’scapacity is scheduled to be retired by 2030. In WesternEurope, not a single reactor is under construction today,
Canisters of radioactivewaste are shippedto the site
1
Radioactive waste isplaced in a multilayeredsteel storage container and sent underground
Radioactive waste isplaced in a multilayeredsteel storage container and sent underground
2
Containers are storedalong the tunnels
Ramp to tunnels
300 m(1,000 ft)
300 m(1,000 ft)
Containers are storedalong the tunnels
3
Yucca Mountain
Processingsite
Tunnel system
Storagecontainer
Water table
Ramp to tunnels
Container
(a) Yucca Mountain
(c) Proposed design
(b) Scientific testing
300 m(1,000 ft)
300 m(1,000 ft)
Yucca Mountain (a), in aremote part of Nevada, awaits final approvalas the central repository site for all thenuclear waste in the United States. Here (b),technicians are testing the effects of extremeheat from radioactive decay on the stability ofrock. Waste would be buried in a network oftunnels deep underground yet still high abovethe water table (c).
FIGURE 20.12
bre2ch20_589_618 12/15/05 9:29 PM Page 603

604 PART TWO Environmental Issues and the Search for Solutions
In the wake of thenuclear power plant
accident at Chernobyl in1986, medical scientists fromaround the world rushed to studyhow the release of radiation mightaffect human health.
Determining long-term healthimpacts of a discrete event is diffi-cult, so it is not surprising that thehundreds of researchers trying topin down Chernobyl’s impactssometimes came up with very differ-ent conclusions. In an effort to reachsome consensus, researchers at theNuclear Energy Agency (NEA) of
TheScience
behind
theStory
Health Impacts of Chernobyl
the Organization for Economic Co-operation and Development(OECD) reviewed studies through2002 and issued a report summariz-ing what scientists had learned inthe 16 years since the accident.
Doctors had documented themost severe effects among plantworkers and firefighters who battledto contain the incident in its initialhours and days. Medical stafftreated and recorded the progress of237 patients who had been admittedto area hospitals diagnosed withacute radiation sickness (ARS).Radiation destroys cells in the body,
and if the destruction outpaces thebody’s abilities to repair the damage,the person will soon die. Symptomsof ARS include vomiting, fever,diarrhea, thermal burns, mucousmembrane damage, and weakeningof the immune system by the deple-tion of white blood cells. In total,28 (11.8%) of these people diedfrom acute effects soon after theaccident, and those who died hadhad the greatest estimated exposureto radiation.
IAEA scientists in 1990 studiedresidents of areas highly contami-nated with radioactive cesium and
(a) Rates of child thyroid cancer (b) Cancer patient withmother after surgery
1
2
3
4
5
6
01986 1988 1990 1992 1994 1996 1998
Num
ber
of c
ases
per
100
,000
chi
ldre
n
Year
Belarus
Russian Federation
Ukraine
The incidence of thyroid cancer (a) jumped in Belarus, Ukraine, and southwestern Russia starting4 years after the Chernobyl accident released high levels of radioactive iodine isotopes. Manybabies and young children (b) at the time of the accident developed thyroid cancer in later years.Most have undergone treatment and survived. Data (a) from Nuclear Energy Agency, OECD, 2002.
and Germany and Belgium, like Sweden, have declaredan intention to phase out nuclear power altogether.However, France is committed to keeping its large shareof nuclear-powered electricity. In Asia, Japan is so relianton oil that it is eager to expand its options in the fastest
and easiest way possible. China, India, and South Koreaare expanding their nuclear programs to help powertheir rapidly growing economies. Indeed, Asia hosts 19of the last 28 nuclear power plants to go into operationand 20 of the 31 plants now under construction.
bre2ch20_589_618 12/15/05 9:29 PM Page 604

CHAPTER TWENTY Conventional Energy Alternatives 605
compared their health with peopleof the same ages living in unconta-minated settlements nearby. Med-ical exams of 1,356 people showedno significant differences betweenthe two groups or health abnormal-ities attributable to radiation expo-sure. However, the study wascriticized for the quality of its data,for its small sample size, and forpotential conflict of interest (theIAEA is charged with promotingthe nuclear industry). In addition,the study was conducted only 4 years after the accident, beforemany cancers would be expected toappear.
Nonetheless, studies by theWorld Health Organization andothers have come to similar conclu-sions. Overall, the NEA summaryconcluded, there is little evidencefor long-term physical health effectsresulting from Chernobyl (althoughpsychological and social effectsamong displaced residents havebeen substantial). If cancer rateshave risen among exposed popula-tions, they have risen so little as tobe statistically indistinguishablefrom normal variation in back-ground levels of cancer.
The one exception is thyroidcancer, for which numerous studieshave documented a real and percep-tible increase among Chernobyl-area residents, particularly children(because children have large and ac-
tive thyroid glands). The thyroidgland is where the human bodyconcentrates iodine, and one of themost common radioactive isotopesreleased early in the disaster wasiodine-131 (131I).
Realizing that thyroid cancer in-duced by radioisotopes of iodinemight be a problem, medical work-ers took measurements of iodineactivity from the thyroid glands ofhundreds of thousands of people—60,000 in Russia, 150,000 in Ukraine,and several hundred thousand inBelarus—in the months immediatelyfollowing the accident. They alsomeasured food contamination andhad people fill out questionnaires ontheir food consumption. These datashowed that drinking cows’ milk wasthe main route of exposure to 131Ifor most people, although fresh veg-etables also contributed.
As doctors had feared, in theyears following the accident rates ofthyroid cancer began rising amongchildren in regions of highest expo-sure (see the figure). The yearlynumber of thyroid cancer cases inthe 1990s, particularly in Belarus,far exceeded numbers from yearsbefore Chernobyl. Multiple studiesfound linear dose-response rela-tionships (� pp. 420–421) in datafrom Ukraine and Belarus. Fortu-nately, treatment of thyroid cancerhas a high success rate, and as of2002, only 3 of the 1,036 children
cited in our figure had died of thy-roid cancer. By comparing theChernobyl-region data to back-ground rates elsewhere, researcherscalculated that Ukraine would even-tually suffer 300 thyroid cancercases more than normal and thatthe nearby region of Russia (with apopulation of 4.3 million) wouldsuffer 349 extra cases, a 3–6% in-crease above the normal rate.
Critics pointed out that any tar-geted search tends to turn up more ofwhatever medical problem is beinglooked for. But the magnitude of theincrease in childhood thyroid cancerwas large enough that most expertsjudge it to be real. The rise in thyroidcancer, the NEA concluded,“shouldbe attributed to the Chernobyl acci-dent until proven otherwise.”
Furthermore, thyroid cancer alsoappears to have risen in adults. Adultcases in Belarus in the 12 years be-fore the accident totaled 1,392, but inthe 12 years after Chernobyl totaled5,449. In the most contaminated re-gions of Russia, thyroid cancer inci-dence rose to 11 per 100,000 womenand 1.7 per 100,000 men, comparedto normal rates of 4 and 1.1 for Rus-sia as a whole. And although rates ofchildhood cancer may now befalling, rates for adults are still rising.As new cancer cases accumulate inthe future, continued research will beneeded to measure the full scope ofhealth effects from Chernobyl.
In the United States, the nuclear industry stoppedbuilding plants following Three Mile Island, and publicopposition scuttled many that were under construction.The $5.5-billion Shoreham Nuclear Power Plant onNew York’s Long Island was shut down just 2 months af-
ter its licensing because officials determined that evacua-tion would be impossible in this densely populated areashould an accident ever occur. Of the 259 U.S. nuclearplants ordered since 1957, nearly half have been can-celled. At its peak in 1990, the United States had 112
bre2ch20_589_618 12/15/05 9:29 PM Page 605

606 PART TWO Environmental Issues and the Search for Solutions
Nuclear PowerCan nuclear power help reduce our reliance on fossil fuels? Should we revitalize
and expand our nuclear power programs?VIEWPOINTS
Nuclear Power: A Deadly and Needless Energy Source
Nuclear power is deadly and unnecessary.Disasters such as the 1979 Three Mile Islandnuclear plant accident, the catastrophicChernobyl plant explosion in 1986—andworse—are what will happen regularly ifthe United States and other nations moveanew to build nuclear power plants.
The disastrous impacts of nuclear power are acknowl-edged in government documents. The U.S. Nuclear Regu-latory Commission conducted a study in the 1980s, theCalculation of Reactor Accident Consequences 2. For the In-dian Point 3 plant near New York, it calculated an accidentcausing 50,000 “peak fatalities,” 141,000 “peak early in-juries,” 13,000 “peak cancer deaths,” and $314 billion inproperty damage in 1980 dollars. The cost of a part ofAmerica left uninhabitable for millennia would be nearly$1 trillion today.
Nuclear power is so dangerous that there’s a law calledthe Price-Anderson Act that limits a plant owner’s liabilityfor an accident, now $8 billion. If nuclear power is so safe,why the Price-Anderson Act?
The likelihood of an accident is far from “almost impos-sible,” as atomic promoters once claimed. The NRC hasconceded a 45% probability of a severe core melt accidentevery 20 years among the 100 U.S. atomic plants.
And it doesn’t take an accident for a nuclear plant tospread radioactivity and contaminate and kill. There are“routine emissions” of radiation at every plant, as well astons of lethal radioactive waste each plant produces annu-ally, which must be isolated for thousands to millions ofyears. Moreover, in an age of terrorism, nuclear plants aresitting ducks.
We need not take the colossal risk of atomic power.Safe, clean, sustainable technologies are here today andcan unhook us from fossil fuels: wind, solar, geothermal,and hydrogen power, among others. Let’s have energy thatwon’t kill us and our children—energy we can live with.
Karl Grossman is a professor at SUNY/College at OldWestbury and an investigative journalist who has authoredbooks and hosted television programs about nuclear power.
Nuclear Power: Essential for Sustainable Global Development
We live in a world that has only begun toconsume energy. During the next 50years, as Earth’s population expands from6 billion toward 9 billion, humanity willconsume more energy than the combinedtotal used in all previous history.
With carbon emissions threateninghuman health and the stability of the biosphere, the secu-rity of our world requires a massive transformation toclean energy. This crisis is global. Today India and Chinaare gaining rapidly on Europe and America in per capitaenergy consumption and climate-endangering emissions.Renewables such as solar, wind, and biomass can help. Butonly nuclear power offers clean energy on a massive scale.
Some “environmental” groups still spread misinforma-tion about nuclear power. But here are the facts:
� Safety. Using 12,000 reactor-years of experience, nu-clear power is the safest large-scale source of energy.The Chernobyl reactor used Soviet technology with noresemblance to today’s technology.
� Waste. Nuclear power extracts enormous energy fromtiny amounts of uranium. The small amounts of wastecan be safely managed and placed in geological reposito-ries with no long-term environmental harm.
� Proliferation. Civil nuclear power production does notfoster nuclear weapons. Atomic bombs require sophisti-cated military programs, and worldwide IAEA safeguardsprevent illicit diversion of nuclear material.
� Cost. Nuclear energy is already cost-competitive, andtrends point to falling nuclear prices and rising fossilprices. A carbon tax would add to the nuclear advantage.
� Usability. Nuclear power is operating in countries rep-resenting two-thirds of total human population, andusage is expanding.
An informed public debate—focused on facts rather thanmyths—will demonstrate that nuclear energy is indispen-sable to sustainable global development.
John Ritch is director general of the World Nuclear Association.From 1994 to 2001, he was U.S. ambassador tothe International Atomic Energy Agency andseveral other U.N. organizations. Previously, heserved for 22 years as an advisor to the U.S.Senate Foreign Relations Committee.
Explore this issuefurther by accessingViewpoints at
www.aw-bc.com/withgott.
bre2ch20_589_618 12/21/05 11:56 AM Page 606

CHAPTER TWENTY Conventional Energy Alternatives 607
operable plants; today it has 104. However, the Bushadministration advocates expanding U.S. nuclear capac-ity to decrease reliance on oil imports, and nuclear pro-ponents point out that engineers are planning a newgeneration of reactors designed to be safer and lessexpensive.
Weighing the Issues:
More Nuclear Power?
Do you think the United States should expand its nuclear
power program? Why or why not?
With slow growth predicted for nuclear power, andwith fossil fuels in limited supply, where will our grow-ing human population turn for additional energy? In-creasingly, people are turning to renewable sources ofenergy: energy sources that cannot be depleted by ouruse. Although many renewable sources are still early intheir stages of development, two of them—biomass andhydropower—are already well developed and widelyused.
Biomass Energy
Biomass energy was the first energy source our speciesused, and it is still the leading energy source in much ofthe developing world. Biomass (� p. 158) consists of theorganic material that makes up living organisms. People
harness biomass energy from many types of plant andanimal matter, including wood from trees, charcoal fromburned wood, and combustible animal waste productssuch as cattle manure. Fossil fuels are not consideredbiomass energy sources because their organic matterhas not been part of living organisms for millions of yearsand has undergone considerable chemical alteration sincethat time.
Fuelwood and other traditional biomasssources are widely used in thedeveloping world
Over 1 billion people still use wood from trees as theirprincipal power source. In developing nations, especiallyin rural areas, families gather fuelwood to burn in or neartheir homes for heating, cooking, and lighting (Figure20.13). In these nations, fuelwood, charcoal, and manureaccount for fully 35% of energy use—in the poorest na-tions, up to 90%.
Fuelwood and other traditional biomass energysources constitute nearly 80% of all renewable energyused worldwide. Considering what we have learnedabout the loss of forests (� pp. 349–354), however, it isfair to ask whether biomass should truly be considered arenewable resource. In reality, biomass is renewable onlyif it is not overharvested. At moderate rates of use, treesand other plants can replenish themselves over monthsto decades. However, when forests are cut too quickly, orwhen overharvesting leads to soil erosion and forests failto grow back, then biomass is not effectively replenished.
Hundreds of millions ofpeople in the developing world rely onfuelwood for heating and cooking. Woodcut from trees remains the major source ofbiomass energy used today. In theorybiomass is renewable, but in practice it maynot be if forests are overharvested.
FIGURE 20.13
bre2ch20_589_618 12/15/05 9:29 PM Page 607

608 PART TWO Environmental Issues and the Search for Solutions
The potential for deforestation makes biomass energyless sustainable than other renewable sources, particu-larly as human population continues to increase.
As developing nations industrialize, fossil fuels are re-placing traditional energy sources (Figure 20.14). As aresult, biomass use is growing more slowly worldwidethan overall energy use.
New biomass sources are beingdeveloped in industrialized countries
Besides the fuelwood, charcoal, and manure traditionallyused, biomass energy sources in today’s world include anumber of sources for which innovative uses have re-cently been developed (Table 20.3). Some of these sourcescan be burned efficiently in power plants to producebiopower, generating electricity in the same way that coalis burned for power (� pp. 566–567). Other new biomasssources can be converted into fuels used primarily topower automobiles; these are termed biofuels. Becausemany of these novel biofuels and biopower strategies de-pend on technologies resulting from a good deal of re-search and development, they are being developedprimarily in wealthier industrialized nations, such as Swe-den and the United States.
Many of the new biomass resources are the wasteproducts of preexisting industries or processes. For in-stance, the forest products industry generates large
amounts of woody debris in logging operations and atsawmills, pulp mills, and paper mills (Figure 20.15). Swe-den’s efforts to encourage biomass energy have focusedlargely on using forestry residues. Because so much of thenation is forested and the timber industry is a major partof the national economy, plenty of forestry waste is avail-able. Organic components of waste from municipal land-fills also can provide biomass energy, as can animal wastefrom agricultural feedlots. Residue from agriculturalcrops (such as stalks, cobs, and husks from corn) couldalso soon become a major bioenergy source.
Some plants are now specifically grown for the pur-pose of producing biofuels. These bioenergy crops in-clude various fast-growing grasses, such as bamboo,fescue, and switchgrass; grain and oil-producing crops,
� Wood cut from trees (fuelwood)
� Charcoal
� Manure from domestic animals
� Crops grown specifically for biomass energy production
� Crop residues (such as corn stalks)
� Forestry residues (such as wood waste from logging)
� Processing wastes (such as solid or liquid waste from sawmills,pulp mills, and paper mills)
� Components of municipal solid waste
Table 20.3 Major Sources of Biomass Energy
(a) Energy consumption in developing nations (b) Energy consumption in developed nations in the OECD
YearYear
Oil Biomass Coal Natural gas Hydropower Nuclear
2,000
4,000
6,000
8,000
10,000
12,000
14,000
01970 1975 1980 1985 1990 1995 2000 1975 1980 1985 1990 1995 2000
Barr
els
of o
il eq
uiva
lent
per
day
20,000
15,000
10,000
5,000
25,000
30,000
35,000
40,000
45,000
50,000
01970
Barr
els
of o
il eq
uiva
lent
per
day
Energy consumption patterns vary greatly between developing nations (a) anddeveloped nations, here represented by nations of the Organisation for Economic Cooperation andDevelopment (OECD) (b). Note the large role that biomass (primarily fuelwood) plays in supplyingenergy to developing countries. Data from Energy Information Administration, U.S. Department of Energy.
FIGURE 20.14
bre2ch20_589_618 12/21/05 11:56 AM Page 608

CHAPTER TWENTY Conventional Energy Alternatives 609
Forestry residues (here, from a Swedish loggingoperation) are a major source of biomass energy in some regions.FIGURE 20.15
such as corn and soybeans; and fast-growing trees, such aspoplar and cottonwood. For biofuels, willow trees arecultivated commercially in Sweden, sugarcane is grown inBrazil, and corn is raised in the United States.
Biofuels can power automobiles
Liquid fuels from biomass sources are helping to powermillions of vehicles on today’s roads, and some vehiclescan run entirely on biofuels. The two primary types ofsuch fuels developed so far are ethanol (for gasoline en-gines) and biodiesel (for diesel engines).
Ethanol is the alcohol in beer, wine, and liquor. It isproduced as a biofuel by fermenting biomass, generallyfrom carbohydrate-rich crops, such as corn, in a processsimilar to brewing beer. In fermentation, carbohydratesare converted to sugars and then to ethanol. Spurred bythe 1990 Clean Air Act amendments and generous gov-ernment subsidies, ethanol is widely added to gasoline inthe United States to reduce automotive emissions. In 2004in the United States, 14 billion L (3.7 billion gal) ofethanol were produced from corn. This amount hasgrown each year, as the number of U.S. ethanol plants ap-proaches 100. A number of nations now have vehicles thatcan run on ethanol (Sweden has dozens of such publicbuses), and each of the U.S. “big three” automakers is nowproducing flexible fuel vehicles that run on E-85, a mix of85% ethanol and 15% gasoline. In Brazil, half of all newcars are flexible-fuel cars, and ethanol from sugarcane ac-counts for 44% of all automotive fuel used.
Biodiesel is produced from vegetable oil, used cook-ing grease, or animal fat. The oil or fat is mixed with smallamounts of ethanol or methanol (wood alcohol) in the
presence of a chemical catalyst. In Europe, where mostbiodiesel is used, canola oil is often the oil of choice,whereas U.S. biodiesel producers use mostly soybean oiland recycled grease and oil from restaurants. Vehicles withdiesel engines can run on 100% biodiesel. In fact, whenRudolf Diesel invented the diesel engine in 1895, he de-signed it to run on a variety of fuels, and he showcased hisinvention at the 1900 World’s Fair using peanut oil. Sincethat time, petroleum-based fuel (petrodiesel) has beenused because it has been cheaper. Because today’s dieselengines have been designed to work with petrodiesel, someengine parts wear out more quickly with biodiesel, but onecan use both and switch back and forth without makingany modifications. Biodiesel can also be mixed with con-ventional petrodiesel; a 20% biodiesel mix (called B20) iscommon today.
Biodiesel cuts down on emissions compared withpetrodiesel (Figure 20.16). Its fuel economy is almost asgood, and it costs just 10–20% more. It is also nontoxicand biodegradable. Increasing numbers of environmen-tally conscious individuals in North America and Europeare fueling their cars with biodiesel from waste oils, andsome buses and recycling trucks are now running onbiodiesel. Governments are encouraging its use, too;Minnesota, for instance, mandates that all diesel soldmust include a 2% biodiesel component, and alreadyover 40 state and federal fleets are using biodiesel blends.
Burning biodiesel in a diesel engine emits feweremissions than burning conventional petroleum-based diesel.Shown are the percentage reductions in several major automotivepollutants that one can attain by using B20 (a mix of 20%biodiesel and 80% petrodiesel) and B100 (pure biodiesel). Data
from U.S. Environmental Protection Agency.
FIGURE 20.16
Carbo
nm
onox
ide
Parti
culat
e
mat
ter
Tota
lhy
droc
arbo
nsSu
lfate
s
Nitrog
enox
ides
20
0
40
60
80
100
Perc
ent
redu
ctio
n ve
rsus
pet
rodi
esel
B20 B100
bre2ch20_589_618 12/15/05 9:29 PM Page 609

Some enthusiasts have taken biofuel use a step further.Eliminating the processing step that biodiesel requires,they use straight vegetable oil in their diesel engines. Onenotable effort is the “B.I.O. Bus,” a bus fueled entirely onwaste oil from restaurants that a group of students, envi-ronmentalists, and artists drives across North America(Figure 20.17). Each summer the group goes on tour withthe bus, hosting festive events that combine music anddancing with seminars on environmental sustainability,and spreading the word about nonpetroleum fuels. Inthe summers of 2003, 2004, and 2005, the bus traveled25,000 miles.
To run on straight vegetable oil, a diesel engine needsto be modified. Extra parts need to be added, so that thereare tanks for both the oil and for petrodiesel, which is of-ten needed to start the engine in cooler weather. Althoughthese parts can be bought for as little as $800, it remains tobe seen whether using straight vegetable oil might entailfurther costs, such as reduced longevity or greater enginemaintenance.
Biopower generates electricity from biomass
We can harness biopower in various ways. The most fre-quently used strategy is simply to burn biomass in thepresence of large amounts of air. This can be done onsmall scales with furnaces and stoves to produce heat fordomestic needs, or on large industrial scales to producedistrict heating and to generate electricity. Power plants
built to combust biomass operate in a similar way to thosefired by fossil fuels; the combustion heats water, creatingsteam to turn turbines and generators, thereby generatingelectricity. Much of the biopower produced so far comesfrom power plants that generate both electricity and heat-ing through cogeneration (� p. 583); these plants are oftenlocated where they can take advantage of waste materialfrom the forest products industry.
Biomass is also increasingly being combined with coalin existing coal-fired power plants in a process called co-firing. Biomass is introduced with coal into a high-efficiencyboiler that uses one of several technologies. Up to 15% ofthe coal can be substituted with biomass, with only minorequipment modification and no appreciable loss of effi-ciency. Co-firing can be a relatively easy and inexpensiveway for fossil-fuel-based utilities to expand their use ofrenewable energy.
The decomposition of biomass by microbes alsoproduces gas that can be used to generate electricity.The anaerobic bacterial breakdown of waste in landfillsproduces methane and other components, and this“landfill gas” is now being captured at many solid wastelandfills and sold as fuel (� p. 657). Methane and othergases can also be produced in a more controlled way inanaerobic digestion facilities. This “biogas” can then beburned in a power plant’s boiler to generate electricity.
The process of gasification can also provide biopower,as well as biofuels. In this process, biomass is vaporized atextremely high temperatures in the absence of oxygen,creating a gaseous mixture including hydrogen, carbon
610 PART TWO Environmental Issues and the Search for Solutions
Each summer a group ofalternative-fuel advocates goes on tour inthe B.I.O. Bus, a bus fueled entirely on usedvegetable oil from restaurants. Their “BioTours” sponsor events across NorthAmerica that include music, dancing, andseminars on environmental sustainabilityand alternative fuels. Their motto: “Solar-powered sound, veggie-powered bus.”
FIGURE 20.17
bre2ch20_589_618 12/21/05 11:56 AM Page 610

monoxide, and methane. This mixture can generate elec-tricity when used in power plants to turn a gas turbine topropel a generator. Gas from gasification can also betreated in various ways to produce methanol, synthesize atype of diesel fuel, or isolate hydrogen for use in hydrogenfuel cells (� pp. 637–642). An alternative method of heat-ing biomass in the absence of oxygen results in pyrolysis,which produces a mix of solids, gases, and liquids. This in-cludes a liquid fuel called pyrolysis oil, which can beburned to generate electricity.
At small scales, farmers and ranchers can buy modularbiopower systems that use livestock manure to generateelectricity, and small household biodigesters are now pro-viding portable and decentralized energy production. Inmany developing nations, particularly in Asia, interna-tional agencies have distributed hundreds of thousands ofefficient biomass-fueled cooking stoves. At large scales, in-dustries such as the forest products industry are usingtheir waste to generate power, farmers are growing cropsfor biopower, and governments are encouraging biopower.In Sweden, one-sixth of the nation’s energy supply nowcomes from biomass, and biomass provides more fuel forelectricity generation than coal, oil, or natural gas. Pulpmill liquors are the main source, but solid wood waste,municipal solid waste, and biogas from digestion are allincreasingly being used. In the United States, severaldozen biomass-fueled power plants are now operating,and several dozen coal-fired plants are experimentingwith co-firing.
Biomass energy brings environmentaland economic benefits
Biomass energy has one overarching environmental bene-fit: It is essentially carbon-neutral, releasing no net carboninto the atmosphere. Although burning biomass emitsplenty of carbon, the carbon released is simply the carbonthat was pulled from the atmosphere by photosynthesis tocreate the biomass being burned. That is, because biomassis the product of recent photosynthesis, the carbon releasedin its combustion is balanced by the carbon taken up in thephotosynthesis that created it. Therefore, when biomasssources take the place of fossil fuels, net carbon flux to theatmosphere is reduced. However, this holds only if biomasssources are not overharvested; deforestation will increasecarbon flux to the atmosphere because less vegetationmeans less carbon uptake by plants for photosynthesis.
Biofuels can reduce greenhouse gas emissions thatcontribute to climate change in additional ways. Captur-ing landfill gas reduces emissions of methane, a potentgreenhouse gas. And biofuels such as ethanol and bio-
diesel contain oxygen, which when added to gasolineor diesel helps those petroleum fuels to combust morecompletely, reducing pollution.
Shifting from fossil fuels to biomass energy also canhave economic benefits. As a resource, biomass tends to bewell spread geographically, so using it should help sup-port rural economies and reduce many nations’ depend-ence on imported fuels. Biomass also tends to be the leastexpensive type of fuel for burning in power plants,and improved energy efficiency brings lower prices forconsumers.
By increasing energy efficiency and recycling wasteproducts, use of biomass energy helps move our indus-trial systems toward greater sustainability. The U.S. forestproducts industry now obtains over half its energy bycombusting the biomass waste it recycles, includingwoody waste and liquor from pulp mill processing.
Relative to fossil fuels, biomass also has benefits for hu-man health. By replacing coal in co-firing and direct com-bustion, biomass reduces emissions of nitrogen oxides andparticularly sulfur dioxide. The reason is that wood, unlikecoal, contains no appreciable sulfur content. By replacinggasoline and petrodiesel and burning more cleanly, biofuelsreduce emissions of various air pollutants.
Biomass energy also brings drawbacks
Biomass energy is not without negative environmentalimpacts, however. Burning fuelwood and other biomassin traditional ways for cooking and heating leads tohealth hazards from indoor air pollution (� pp. 519–522).In addition, harvesting fuelwood at an unsustainablyrapid rate leads to deforestation, soil erosion, and deser-tification, damaging landscapes, diminishing biodiversity,and impoverishing human societies dependent on anarea’s resources. In arid regions that are heavily popu-lated and support meager woodlands, fuelwood harvest-ing can have enormous impacts. Such is the case withmany regions of Africa and Asia. In contrast, moister,well-forested areas with lower population densities, suchas Sweden, stand less chance of deforestation.
Another drawback of biomass energy is that growingcrops specifically to produce biofuels establishes mono-culture agriculture, with all its impacts (� pp. 281–282),on precious land that might otherwise be used to growfood, be developed for other purposes, or be left aswildlife habitat. Fully 10% of the U.S. corn crop is used tomake ethanol, and most U.S. biodiesel is produced fromoil from soybeans grown specifically for this purpose (al-though researchers are studying how to obtain oil fromalgae, which could take up far less space). Growing
CHAPTER TWENTY Conventional Energy Alternatives 611
bre2ch20_589_618 12/21/05 11:56 AM Page 611

bioenergy crops also requires substantial inputs of en-ergy. We currently operate farm equipment using fossilfuels, and farmers apply petroleum-based pesticides andfertilizers to increase yields. Thus, shifting from gasolineto ethanol for our transportation needs would not elimi-nate our reliance on fossil fuels. Moreover, growing cornfor ethanol (Figure 20.18) yields only small amounts ofethanol per acre of crop grown; 1 bushel of corn createsonly 9.4 L (2.5 gal) of ethanol. It is not efficient to growhigh-input, high-energy crops merely to reduce them to afew liters of fuel; such a process is less efficient thandirectly burning biomass. Indeed, even using ethanol as agasoline additive to reduce emissions has a downside; itlowers fuel economy very slightly, so that more gasolineneeds to be used. For all these reasons, many critics havelambasted U.S. subsidies of ethanol, viewing them aseffective in gaining politicians’ votes in politically impor-tant farm states, but less effective as a path to sustainableenergy use.
On the positive side, crops grown for energy typicallyreceive lower inputs of pesticides and fertilizers than thosegrown for food. Researchers are currently refining tech-niques to produce ethanol from the cellulose that givesstructure to plant material, and not just from starchycrops like corn. If these techniques can be made widelyfeasible, then ethanol could be produced primarily fromlow-quality waste and crop residues, rather than fromhigh-quality crops.
Although biomass energy in industrialized nationscurrently revolves mostly around a few easily grown crops
and the efficient use of waste products, the U.S. govern-ment sees a future of specialized crops that can serve asthe basis for a wide variety of fuels and products. Mean-while, use of traditional fuels in the developing world isexpected to increase, and the IEA estimates that in theyear 2030, 2.6 billion people will be using traditional fuelsfor heating and cooking in unsustainable ways. Like nu-clear power and like hydropower, biomass energy use in-volves a complex mix of advantages and disadvantages forthe environment and human society.
Weighing the Issues:
Ethanol
Do you think producing and using ethanol from corn or
other crops is a good idea? Do the benefits outweigh the
drawbacks? Can you suggest ways of using biofuels that
would minimize environmental impacts?
Hydroelectric Power
Next to biomass, we draw more renewable energy fromthe motion of water than from any other resource. Inhydroelectric power, or hydropower, the kinetic en-ergy of moving water is used to turn turbines and gen-erate electricity. We examined hydropower and itsenvironmental impacts in our discussion of freshwaterresources in Chapter 15 (� pp. 446–449), but we willnow take a closer look at hydropower as an energysource.
Modern hydropower uses dams and“run-of-river” approaches
Just as people have long burned fuelwood, we have longharnessed the power of moving water. For instance, wa-terwheels spun by river water powered mills in past cen-turies. Today we harness water’s kinetic energy in twomajor ways: with storage impoundments and by using“run-of-river” approaches.
Most of our hydroelectric power today comes fromimpounding water in reservoirs behind concrete damsthat block the flow of river water, and then letting thatwater pass through the dam. Because immense amountsof water are stored behind dams, this is called thestorage technique. If you have ever seen Hoover Dam onthe Colorado River (� p. 432), or any other large dam,you have witnessed an impressive example of the storage
612 PART TWO Environmental Issues and the Search for Solutions
Ethanol is widely added to gasoline in the UnitedStates and some other nations, and 10% of the U.S. corn crop isused to produce ethanol. Ethanol makes for cleaner-burning fuel,but it requires a great deal of industrialized agriculture.
FIGURE 20.18
bre2ch20_589_618 12/21/05 11:56 AM Page 612

approach to hydroelectric power. As reservoir waterpasses through a dam, it turns the blades of turbines,which cause a generator to generate electricity (Figure20.19). Electricity generated in the powerhouse of a damis transmitted to the electric grid by transmission lines,
while the water is allowed to flow into the riverbed belowthe dam to continue downriver. The amount of powergenerated depends on the distance the water falls and thevolume of water released. By storing water in reservoirs,dam operators can ensure a steady and predictable supply
CHAPTER TWENTY Conventional Energy Alternatives 613
(a) Ice Harbor Dam, Washington (b) Turbine generator inside MacNary Dam, Columbia River
Outflow
Stator
Rotor
Turbine
Generator
DamDam
Reservoir
PowerlinesPowerlines
Intake PowerhousePowerhouse
Water flows fromthe reservoir throughthe dam.
1
The flowing waterturns the turbine.
2
The turbine turnsthe rotor, which consists of a seriesof magnets.
3
Electricity is produced as the rotor spins past the stator, which is the stationary part of the generator made of coils of copper wire.
4
(c) Hydroelectric power
Large dams, such as the Ice Harbor Dam on the Snake River in Washington (a),generate substantial amounts of hydroelectric power. Inside these dams, flowing water is used toturn turbines (b) and generate electricity. Water is funneled from the reservoir through a portion ofthe dam (c) to rotate turbines, which turn rotors containing magnets. The spinning rotors generateelectricity as their magnets pass coils of copper wire. Electrical current is transmitted away throughpower lines, and the river’s water flows out through the base of the dam.
FIGURE 20.19
bre2ch20_589_618 12/15/05 9:29 PM Page 613

614 PART TWO Environmental Issues and the Search for Solutions
Run-of-river systems diverta portion of a river’s water and can bedesigned in various ways. Some designsinvolve piping water downhill through apowerhouse and releasing it downriver,and some involve using water as it flowsover shallow dams.
FIGURE 20.20 Direction ofriver flow
Intake
Penstock
Powerhouse
GeneratorTurbine
Tailrace
of electricity at all times, even during seasons of natu-rally low river flow.
An alternative approach is the run-of-river approach,in which electricity is generated without greatly disrupt-ing the flow of river water. This approach sacrifices thereliability of water flow across seasons that the stor-age approach guarantees, but it minimizes many of theenvironmental impacts of large dams. The run-of-riverapproach can be followed using several methods, one ofwhich is to divert a portion of a river’s flow through a pipeor channel, passing it through a powerhouse and then re-turning it to the river (Figure 20.20). This can be donewith or without a small reservoir that pools water tem-porarily, and the pipe or channel can be run along the sur-face or underground. Another method is to flow riverwater over a dam that is small enough not to impede fishpassage, siphoning off water to turn turbines, and then re-turning the water to the river. Run-of-river systems areparticularly useful in areas remote from established elec-trical grids and in regions without the economic resourcesto build and maintain large dams.
Hydroelectric power is widely used
Hydropower accounts for 2.2% of the world’s primary en-ergy supply and 16.2% of the world’s electricity produc-tion. For nations with large amounts of river water andthe economic resources to build dams, hydroelectric
power has been a keystone of their development andwealth. Canada, Brazil, Norway, Austria, Switzerland, andmany other nations today obtain large amounts of theirenergy from hydropower (Table 20.4). Sweden receives14% of its total energy and nearly half its electricity fromhydropower. In the wake of the nation’s decision to phaseout nuclear power, many people had hoped hydropower
Percentage ofHydropower electricity generation
Nation consumed1 from hydropower2
Canada 76.4 57.5
China 74.2 14.9
Brazil 72.4 83.8
United States 59.8 7.5
Russia 40.0 17.2
Norway 24.7 98.9
Japan 22.6 9.9
India 19.0 11.9
Venezuela 16.0 66.0
France 14.8 11.4
Table 20.4 Top Consumers of Hydropower
Data from British Petroleum and International Energy Agency.1In million metric tons of oil equivalent, 2004 data.22003 data.
bre2ch20_589_618 12/21/05 11:56 AM Page 614

CHAPTER TWENTY Conventional Energy Alternatives 615
could play a still larger role and compensate for the elec-trical capacity that would be lost. However, Sweden has al-ready dammed so many of its rivers that it cannot gainmuch additional hydropower by erecting more dams.Moreover, Swedish citizens have made clear that theywant some rivers to remain undammed, preserved in theirnatural state.
In the United States, the great age of dam building forhydroelectric power (as well as for flood control and irri-gation) began in the 1930s, when the federal governmentconstructed dams as public projects, partly to employpeople and help end the economic depression of the time.U.S. dam construction peaked in 1960, when 3,123 damswere completed in a single year.
Hydropower is clean and renewable
For producing electricity, hydropower has two clear ad-vantages over fossil fuels. First, it is renewable; as long asprecipitation falls from the sky and fills rivers and reser-voirs, we can use water to turn turbines. When pressurefrom human population or consumption is intenseenough, water supplies may be used faster than they are re-plenished, and hydropower may not be sustainable. How-ever, in most cases hydropower continues today to providethe renewable energy that dams were built to provide.
The second advantage of hydropower over fossil fuelsis its cleanliness. Because no carbon compounds areburned in the production of hydropower, no carbon diox-ide or other pollutants are emitted into the atmosphere. Itscleanliness has won hydropower praise for protecting airquality, climate, and human health. Of course, fossil fuelsare used in the construction and maintenance of dams.Moreover, recent evidence indicates that large reservoirsmay release the greenhouse gas methane as a result ofanaerobic decay in deep water. But overall, hydropower ac-counts for only a small fraction of the greenhouse gasemissions typical of fossil fuel combustion.
Hydropower has negative environmental impacts
Although it is renewable and produces little air pollu-tion, hydropower does create other environmental im-pacts. Damming rivers destroys habitat for riversidewildlife as riparian areas above dam sites are submergedand those below dam sites often become starved of wa-ter. Because water discharge is carefully controlled to op-timize electricity generation, the natural flooding cyclesof rivers are disrupted. Suppressing flooding preventsriver floodplains from receiving fresh nutrient-laden
sediments. Instead, sediments become trapped behinddams, where they begin filling the reservoir. Dams alsocause thermal pollution, because water downstreamfrom dams may become unusually warm if water levelsare kept unnaturally shallow. Moreover, periodic flushesof cold water may occur from the lower depths of thereservoir. Such thermal shocks, together with severehabitat alteration, have diminished or eliminated manynative fish populations in dammed waterways through-out the world. In addition, dams generally block the pas-sage of fish and other aquatic creatures, effectivelyfragmenting segments of the river and reducing biodi-versity in each segment. All these ecological impactsgenerally translate into negative social and economicimpacts on local communities. We discussed the envi-ronmental, economic, and social impacts of dams, andtheir advantages and disadvantages, more fully in Chap-ter 15 (� pp. 446–449).
Hydropower may not expand much more
Use of hydropower is growing slightly more quickly thanoverall energy use, and some gargantuan projects are be-ing planned and carried out. China’s recently completedThree Gorges Dam (� pp. 447, 449) is the world’s largest.Its reservoir displaced over 1 million people, and the damshould soon be able to generate as much electricity asdozens of coal-fired or nuclear plants.
However, unlike other renewable energy sources, hy-dropower is not likely to expand very much more. Onereason is that, as in Sweden, most of the world’s largerivers that offer excellent opportunities for hydropowerhave already been dammed. Another reason is that peo-ple’s awareness of the ecological impacts of dams hasgrown, and in some nations residents are fighting damconstruction in their regions. Indeed, in Sweden, hy-dropower’s contribution to the national energy budgethas remained virtually unchanged for over 30 years. Inthe United States, 98% of rivers appropriate for dam con-struction already are dammed, many of the remaining2% are protected under the Wild and Scenic RiversAct, and many people now propose dismantling andremoving some dams and restoring river habitats(� pp. 448–449).
Overall, hydropower will likely continue to increase indeveloping nations that have yet to dam their rivers, but indeveloped nations hydropower growth will likely slow orstop. The IEA forecasts that hydropower’s share of elec-tricity generation will decline between now and 2030,while the share of other renewable energy sources willtriple, from 2% to 6%.
bre2ch20_589_618 12/15/05 9:29 PM Page 615
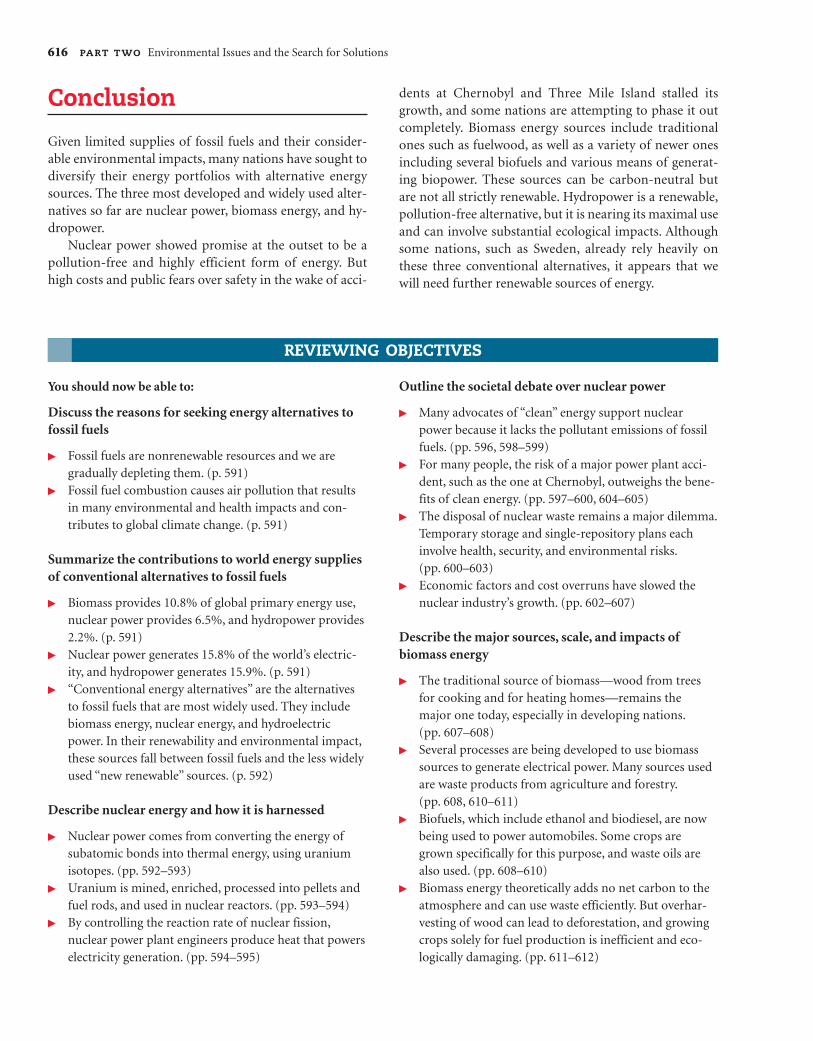
Conclusion
Given limited supplies of fossil fuels and their consider-able environmental impacts, many nations have sought todiversify their energy portfolios with alternative energysources. The three most developed and widely used alter-natives so far are nuclear power, biomass energy, and hy-dropower.
Nuclear power showed promise at the outset to be apollution-free and highly efficient form of energy. Buthigh costs and public fears over safety in the wake of acci-
dents at Chernobyl and Three Mile Island stalled itsgrowth, and some nations are attempting to phase it outcompletely. Biomass energy sources include traditionalones such as fuelwood, as well as a variety of newer onesincluding several biofuels and various means of generat-ing biopower. These sources can be carbon-neutral butare not all strictly renewable. Hydropower is a renewable,pollution-free alternative, but it is nearing its maximal useand can involve substantial ecological impacts. Althoughsome nations, such as Sweden, already rely heavily onthese three conventional alternatives, it appears that wewill need further renewable sources of energy.
616 PART TWO Environmental Issues and the Search for Solutions
You should now be able to:
Discuss the reasons for seeking energy alternatives tofossil fuels
� Fossil fuels are nonrenewable resources and we aregradually depleting them. (p. 591)
� Fossil fuel combustion causes air pollution that resultsin many environmental and health impacts and con-tributes to global climate change. (p. 591)
Summarize the contributions to world energy suppliesof conventional alternatives to fossil fuels
� Biomass provides 10.8% of global primary energy use,nuclear power provides 6.5%, and hydropower provides2.2%. (p. 591)
� Nuclear power generates 15.8% of the world’s electric-ity, and hydropower generates 15.9%. (p. 591)
� “Conventional energy alternatives” are the alternativesto fossil fuels that are most widely used. They includebiomass energy, nuclear energy, and hydroelectricpower. In their renewability and environmental impact,these sources fall between fossil fuels and the less widelyused “new renewable” sources. (p. 592)
Describe nuclear energy and how it is harnessed
� Nuclear power comes from converting the energy ofsubatomic bonds into thermal energy, using uraniumisotopes. (pp. 592–593)
� Uranium is mined, enriched, processed into pellets andfuel rods, and used in nuclear reactors. (pp. 593–594)
� By controlling the reaction rate of nuclear fission,nuclear power plant engineers produce heat that powerselectricity generation. (pp. 594–595)
Outline the societal debate over nuclear power
� Many advocates of “clean” energy support nuclearpower because it lacks the pollutant emissions of fossilfuels. (pp. 596, 598–599)
� For many people, the risk of a major power plant acci-dent, such as the one at Chernobyl, outweighs the bene-fits of clean energy. (pp. 597–600, 604–605)
� The disposal of nuclear waste remains a major dilemma.Temporary storage and single-repository plans eachinvolve health, security, and environmental risks.(pp. 600–603)
� Economic factors and cost overruns have slowed thenuclear industry’s growth. (pp. 602–607)
Describe the major sources, scale, and impacts ofbiomass energy
� The traditional source of biomass—wood from treesfor cooking and for heating homes—remains themajor one today, especially in developing nations.(pp. 607–608)
� Several processes are being developed to use biomasssources to generate electrical power. Many sources usedare waste products from agriculture and forestry.(pp. 608, 610–611)
� Biofuels, which include ethanol and biodiesel, are nowbeing used to power automobiles. Some crops aregrown specifically for this purpose, and waste oils arealso used. (pp. 608–610)
� Biomass energy theoretically adds no net carbon to theatmosphere and can use waste efficiently. But overhar-vesting of wood can lead to deforestation, and growingcrops solely for fuel production is inefficient and eco-logically damaging. (pp. 611–612)
REVIEWING OBJECTIVES
bre2ch20_589_618 12/21/05 11:56 AM Page 616

CHAPTER TWENTY Conventional Energy Alternatives 617
1. How much of our global energy supply do nuclearpower, biomass energy, and hydroelectric power con-tribute? How much of our global electricity do thesethree conventional energy alternatives generate?
2. Describe how nuclear fission works. How do nuclearplant engineers control fission and prevent a runawaychain reaction?
3. In terms of greenhouse gas emissions, how does nuclearpower compare to coal, oil, and natural gas? How do hy-dropower and biomass energy compare?
4. In what ways did the incident at Three Mile Island differfrom that at Chernobyl? What consequences resultedfrom each of these incidents?
5. What has been done so far about disposing of radioac-tive waste?
6. List five sources of biomass energy. What is the world’smost-used source of biomass energy? How does bio-mass energy use differ between developed and develop-ing nations?
7. Describe two biofuels, where each comes from, and howeach is used.
8. Evaluate two potential benefits and two potential draw-backs of biomass energy.
9. Describe two major approaches to generating hydro-electric power.
10. Assess two benefits and two negative environmental im-pacts of hydroelectric power.
TESTING YOUR COMPREHENSION
Describe the scale, methods, and impacts ofhydroelectric power
� Hydroelectric power is generated when water from ariver runs through a powerhouse and turns turbines.(pp. 612–613)
� Dams and reservoirs and run-of-river systems are alter-native approaches. (pp. 612–614)
� Hydropower produces no appreciable air pollution, butdams and reservoirs can greatly alter riverine ecologyand local economies. (p. 615)
1. Given what you learned about fossil fuels in Chapter 19and about some of the conventional alternatives dis-cussed in this chapter, do you think it is important forus to minimize our use of fossil fuels and maximize ouruse of alternatives? If such a shift were to require mas-sive public subsidies, how much should we subsidizethis? What challenges or obstacles would we need toovercome to shift to such alternatives?
2. Nuclear power has by now been widely used for over threedecades, and the world has experienced only one majoraccident (Chernobyl) responsible for any significant num-ber of deaths. Would you call this a good safety record?Should we maintain, decrease, or increase our reliance onnuclear power? Why might safety at nuclear power plantsbe better in the future? Why might it be worse?
3. How serious a problem do you think the disposal of ra-dioactive waste represents? How would you like to seethis issue addressed?
4. There are many different sources of biomass and manyways of harnessing energy from biomass. Discuss onethat seems particularly beneficial to you, and one withwhich you see problems. What biomass energy sourcesand strategies do you think our society should focus oninvesting in?
5. Discuss the advantages and impacts of hydropower. Ifthere is a hydroelectric dam near where you live, con-sider what economic benefits and environmental im-pacts it has had in your area. Given this mix of effects,would you favor the construction of more dams andgreater reliance on hydropower?
6. Imagine that you are the head of the national depart-ment of energy in a country that has just experienced aminor accident at one of its nuclear plants. A partialmeltdown released radiation, but the radiation was fullycontained inside the containment building, and therewere no health impacts on area residents. However,citizens are terrified, and the media is playing up thedangers of nuclear power. Your country relies on its 10nuclear plants for 25% of its energy and 50% of its elec-tricity needs. It has no fossil fuel deposits and recentlybegan a promising but still-young program to developrenewable energy options. What will you tell the publicat your next press conference, and what policy steps willyou recommend taking to assure a safe and reliable na-tional energy supply?
SEEKING SOLUTIONS
bre2ch20_589_618 12/21/05 11:56 AM Page 617

618 PART TWO Environmental Issues and the Search for Solutions
Recently, national security issues have received increased at-tention in energy policy discussions. Although nuclear reac-tors are potential targets for terrorists, they do lessen ourdependence on petroleum imports. The United States pro-duces reactor fuel but also relies on imports of uranium ox-ide from abroad, particularly from Canada, Australia,Russia, Kazakhstan, Uzbekistan, South Africa, and Namibia.
1. How much uranium oxide did the United Statesproduce in 2004? How much did it export that year?How much did it import?
2. What was the net amount of uranium imported in2004? How does this amount compare to domestic pro-duction for that same year? How do these amountscompare to the amounts in 1980?
3. What national security concerns do these data suggest toyou? How might such concerns be alleviated?
INTERPRETING GRAPHS AND DATA
Each of the conventional energy alternatives releases con-siderably less net carbon dioxide (CO2) to the atmospherethan do any of the fossil fuels.
For each fuel source in the table, calculate net greenhousegas emissions it produces while providing electricity to atypical U.S. household that uses 30 kilowatt-hours per day.Use data on emissions rates from each of the energy sources asprovided in the figure from “The Science behind the Story” on� p. 598. For each energy source, use the average of the highand low values given.
CALCULATING ECOLOGICAL FOOTPRINTS
Greenhousegas emis-sion rate Time period
Energy (g Ceq / source kW-hr) 1 day 1 year 30 years
Coal 311 9,330 3,405,450 102,163,500
Oil
Natural gas
PV solar
Hydroelectric
Biomass
Wind
Nuclear
Take It FurtherGo to www.aw-bc.com/withgott or the student CD-ROM where you’ll find:
� Suggested answers to end-of-chapter questions� Quizzes, animations, and flashcards to help you study� Research Navigator™ database of credible and reliable
sources to assist you with your research projects
� tutorials to help you master how to interpretgraphs
� current news articles that link thetopics that you study to case studies from your regionto around the world
10
20
30
40
50
60
70
01950 1960 1970 1980 1990 2000
Mill
ion
poun
ds o
f ur
aniu
m o
xide
Year
Domestic productionImportsExports
Production and trade of uranium oxide by the United States,1949–2004. Data from Energy Information Administration. 2005.
Annual energy review 2004. U.S. Department of Energy.
1. What is the ratio of greenhouse emissions from fossilfuels, on average, to greenhouse emissions from alterna-tive energy sources, on average?
2. Why are there significant emissions from hydroelectricpower, which is commonly touted as being a nonpollut-ing energy source?
3. Which energy source has the lowest emission rate?Would you advocate that the United States furtherdevelop that source? Why or why not?
bre2ch20_589_618 12/21/05 5:25 PM Page 618