BRAZORIA COUNTY - Alvin ISD - 1998 Texas School Survey of Drug and Alcohol Use
213
-
Upload
texas-school-survey-of-drug-and-alcohol-use -
Category
Documents
-
view
219 -
download
0
Transcript of BRAZORIA COUNTY - Alvin ISD - 1998 Texas School Survey of Drug and Alcohol Use

8/14/2019 BRAZORIA COUNTY - Alvin ISD - 1998 Texas School Survey of Drug and Alcohol Use
http://slidepdf.com/reader/full/brazoria-county-alvin-isd-1998-texas-school-survey-of-drug-and-alcohol 1/213
8/14/2019 BRAZORIA COUNTY - Alvin ISD - 1998 Texas School Survey of Drug and Alcohol Use
http://slidepdf.com/reader/full/brazoria-county-alvin-isd-1998-texas-school-survey-of-drug-and-alcohol 2/213
AlvinSpring 1998
______________________________________________________________________________________________
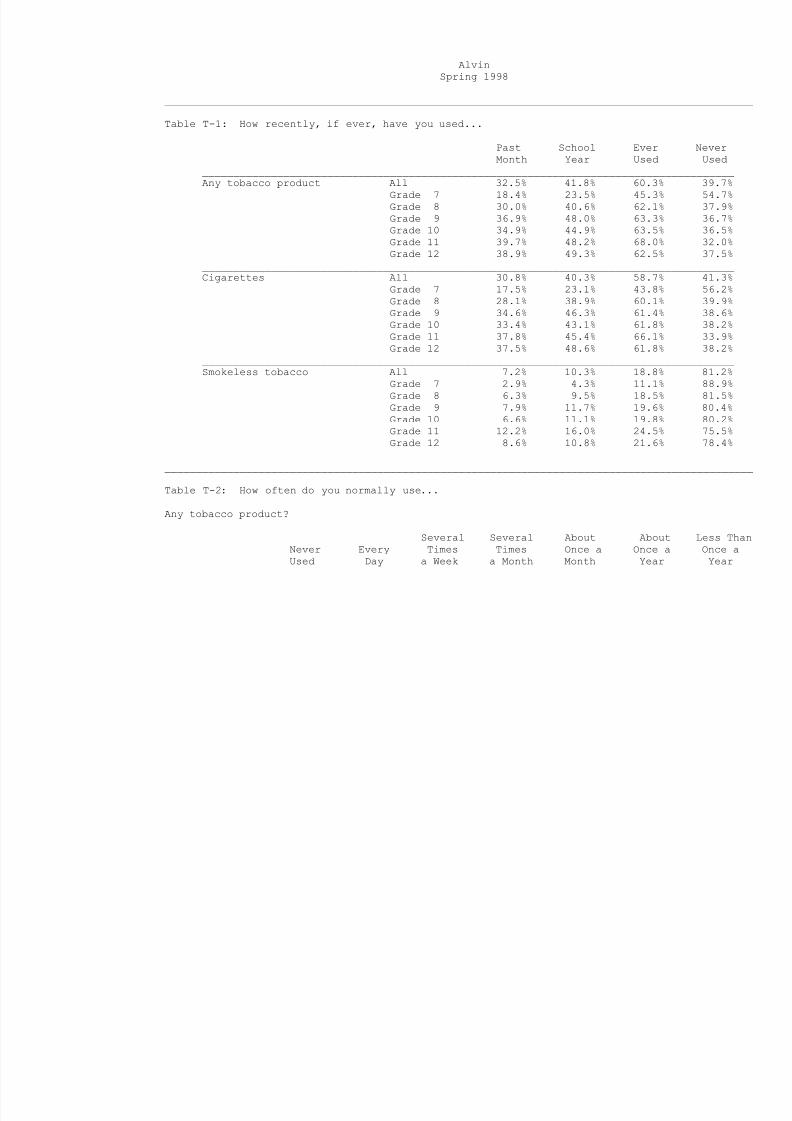
Table T-1: How recently, if ever, have you used...
Past School Ever NeverMonth Year Used Used
_____________________________________________________________________________________Any tobacco product All 32.5% 41.8% 60.3% 39.7%
Grade 7 18.4% 23.5% 45.3% 54.7%Grade 8 30.0% 40.6% 62.1% 37.9%Grade 9 36.9% 48.0% 63.3% 36.7%Grade 10 34.9% 44.9% 63.5% 36.5%Grade 11 39.7% 48.2% 68.0% 32.0%Grade 12 38.9% 49.3% 62.5% 37.5%
_____________________________________________________________________________________
Cigarettes All 30.8% 40.3% 58.7% 41.3%Grade 7 17.5% 23.1% 43.8% 56.2%Grade 8 28.1% 38.9% 60.1% 39.9%Grade 9 34.6% 46.3% 61.4% 38.6%Grade 10 33.4% 43.1% 61.8% 38.2%Grade 11 37.8% 45.4% 66.1% 33.9%Grade 12 37.5% 48.6% 61.8% 38.2%
_____________________________________________________________________________________Smokeless tobacco All 7.2% 10.3% 18.8% 81.2%
Grade 7 2.9% 4.3% 11.1% 88.9%Grade 8 6.3% 9.5% 18.5% 81.5%Grade 9 7.9% 11.7% 19.6% 80.4%Grade 10 6.6% 11.1% 19.8% 80.2%Grade 11 12.2% 16.0% 24.5% 75.5%Grade 12 8.6% 10.8% 21.6% 78.4%
______________________________________________________________________________________________
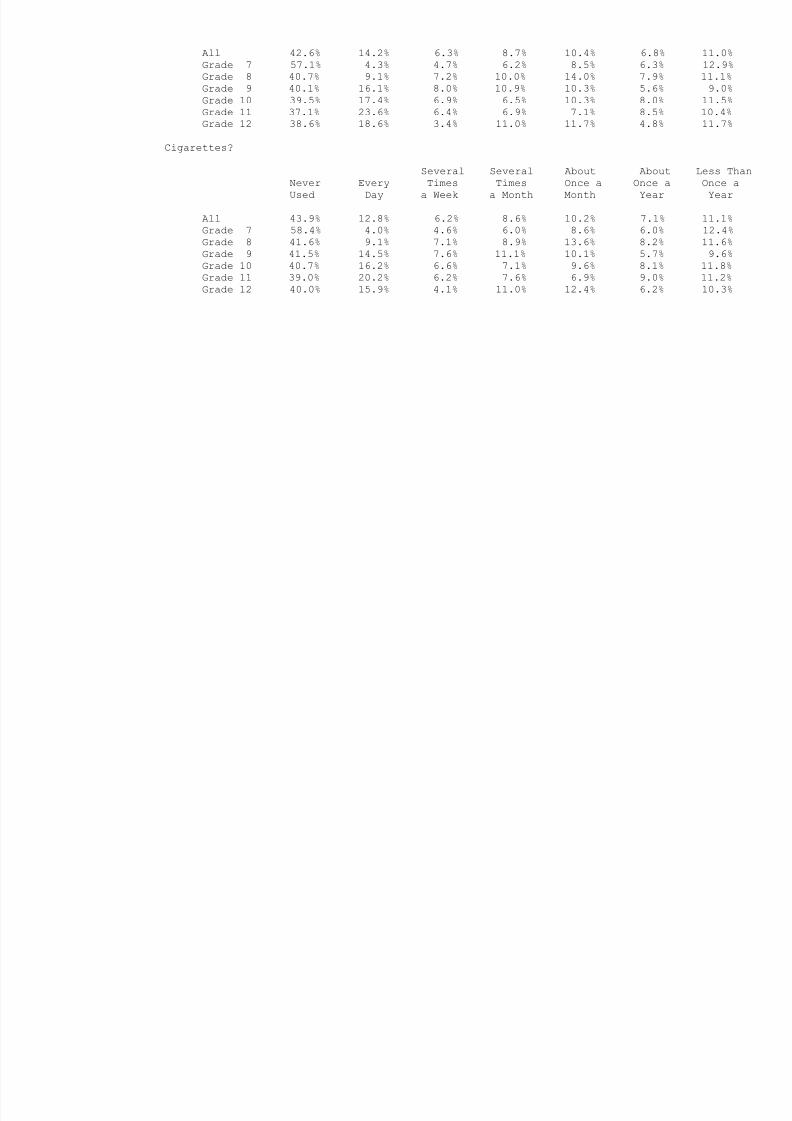
Table T-2: How often do you normally use...
Any tobacco product?
Several Several About About Less Than
Never Every Times Times Once a Once a Once aUsed Day a Week a Month Month Year Year
8/14/2019 BRAZORIA COUNTY - Alvin ISD - 1998 Texas School Survey of Drug and Alcohol Use
http://slidepdf.com/reader/full/brazoria-county-alvin-isd-1998-texas-school-survey-of-drug-and-alcohol 3/213
All 42.6% 14.2% 6.3% 8.7% 10.4% 6.8% 11.0%Grade 7 57.1% 4.3% 4.7% 6.2% 8.5% 6.3% 12.9%Grade 8 40.7% 9.1% 7.2% 10.0% 14.0% 7.9% 11.1%Grade 9 40.1% 16.1% 8.0% 10.9% 10.3% 5.6% 9.0%Grade 10 39.5% 17.4% 6.9% 6.5% 10.3% 8.0% 11.5%Grade 11 37.1% 23.6% 6.4% 6.9% 7.1% 8.5% 10.4%Grade 12 38.6% 18.6% 3.4% 11.0% 11.7% 4.8% 11.7%
Cigarettes?
Several Several About About Less ThanNever Every Times Times Once a Once a Once aUsed Day a Week a Month Month Year Year
All 43.9% 12.8% 6.2% 8.6% 10.2% 7.1% 11.1%Grade 7 58.4% 4.0% 4.6% 6.0% 8.6% 6.0% 12.4%Grade 8 41.6% 9.1% 7.1% 8.9% 13.6% 8.2% 11.6%Grade 9 41.5% 14.5% 7.6% 11.1% 10.1% 5.7% 9.6%Grade 10 40.7% 16.2% 6.6% 7.1% 9.6% 8.1% 11.8%
Grade 11 39.0% 20.2% 6.2% 7.6% 6.9% 9.0% 11.2%Grade 12 40.0% 15.9% 4.1% 11.0% 12.4% 6.2% 10.3%
8/14/2019 BRAZORIA COUNTY - Alvin ISD - 1998 Texas School Survey of Drug and Alcohol Use
http://slidepdf.com/reader/full/brazoria-county-alvin-isd-1998-texas-school-survey-of-drug-and-alcohol 4/213
AlvinSpring 1998
______________________________________________________________________________________________
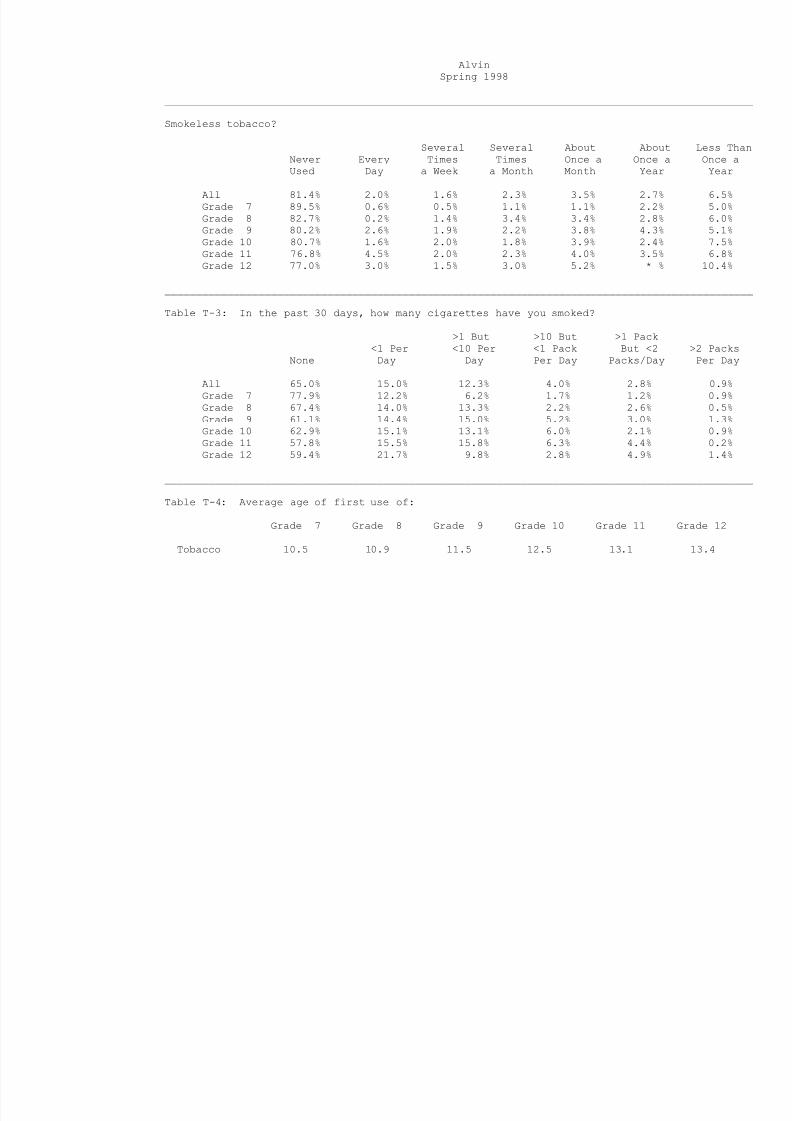
Smokeless tobacco?
Several Several About About Less ThanNever Every Times Times Once a Once a Once aUsed Day a Week a Month Month Year Year
All 81.4% 2.0% 1.6% 2.3% 3.5% 2.7% 6.5%Grade 7 89.5% 0.6% 0.5% 1.1% 1.1% 2.2% 5.0%Grade 8 82.7% 0.2% 1.4% 3.4% 3.4% 2.8% 6.0%Grade 9 80.2% 2.6% 1.9% 2.2% 3.8% 4.3% 5.1%Grade 10 80.7% 1.6% 2.0% 1.8% 3.9% 2.4% 7.5%Grade 11 76.8% 4.5% 2.0% 2.3% 4.0% 3.5% 6.8%Grade 12 77.0% 3.0% 1.5% 3.0% 5.2% * % 10.4%
______________________________________________________________________________________________
Table T-3: In the past 30 days, how many cigarettes have you smoked?
>1 But >10 But >1 Pack<1 Per <10 Per <1 Pack But <2 >2 Packs
None Day Day Per Day Packs/Day Per Day
All 65.0% 15.0% 12.3% 4.0% 2.8% 0.9%Grade 7 77.9% 12.2% 6.2% 1.7% 1.2% 0.9%Grade 8 67.4% 14.0% 13.3% 2.2% 2.6% 0.5%Grade 9 61.1% 14.4% 15.0% 5.2% 3.0% 1.3%Grade 10 62.9% 15.1% 13.1% 6.0% 2.1% 0.9%Grade 11 57.8% 15.5% 15.8% 6.3% 4.4% 0.2%Grade 12 59.4% 21.7% 9.8% 2.8% 4.9% 1.4%
______________________________________________________________________________________________
Table T-4: Average age of first use of:
Grade 7 Grade 8 Grade 9 Grade 10 Grade 11 Grade 12
Tobacco 10.5 10.9 11.5 12.5 13.1 13.4
8/14/2019 BRAZORIA COUNTY - Alvin ISD - 1998 Texas School Survey of Drug and Alcohol Use
http://slidepdf.com/reader/full/brazoria-county-alvin-isd-1998-texas-school-survey-of-drug-and-alcohol 5/213
______________________________________________________________________________________________
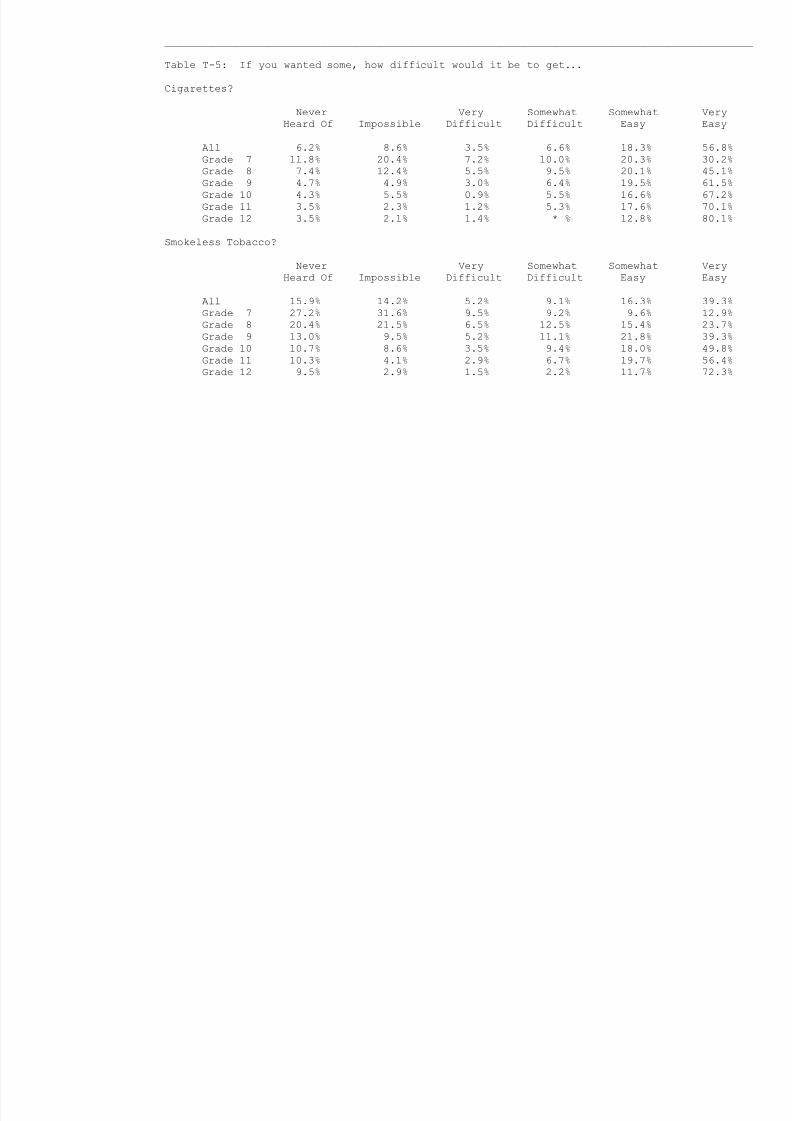
Table T-5: If you wanted some, how difficult would it be to get...
Cigarettes?
Never Very Somewhat Somewhat VeryHeard Of Impossible Difficult Difficult Easy Easy
All 6.2% 8.6% 3.5% 6.6% 18.3% 56.8%Grade 7 11.8% 20.4% 7.2% 10.0% 20.3% 30.2%Grade 8 7.4% 12.4% 5.5% 9.5% 20.1% 45.1%Grade 9 4.7% 4.9% 3.0% 6.4% 19.5% 61.5%Grade 10 4.3% 5.5% 0.9% 5.5% 16.6% 67.2%Grade 11 3.5% 2.3% 1.2% 5.3% 17.6% 70.1%Grade 12 3.5% 2.1% 1.4% * % 12.8% 80.1%
Smokeless Tobacco?
Never Very Somewhat Somewhat Very
Heard Of Impossible Difficult Difficult Easy Easy
All 15.9% 14.2% 5.2% 9.1% 16.3% 39.3%Grade 7 27.2% 31.6% 9.5% 9.2% 9.6% 12.9%Grade 8 20.4% 21.5% 6.5% 12.5% 15.4% 23.7%Grade 9 13.0% 9.5% 5.2% 11.1% 21.8% 39.3%Grade 10 10.7% 8.6% 3.5% 9.4% 18.0% 49.8%Grade 11 10.3% 4.1% 2.9% 6.7% 19.7% 56.4%Grade 12 9.5% 2.9% 1.5% 2.2% 11.7% 72.3%
8/14/2019 BRAZORIA COUNTY - Alvin ISD - 1998 Texas School Survey of Drug and Alcohol Use
http://slidepdf.com/reader/full/brazoria-county-alvin-isd-1998-texas-school-survey-of-drug-and-alcohol 6/213
AlvinSpring 1998
______________________________________________________________________________________________
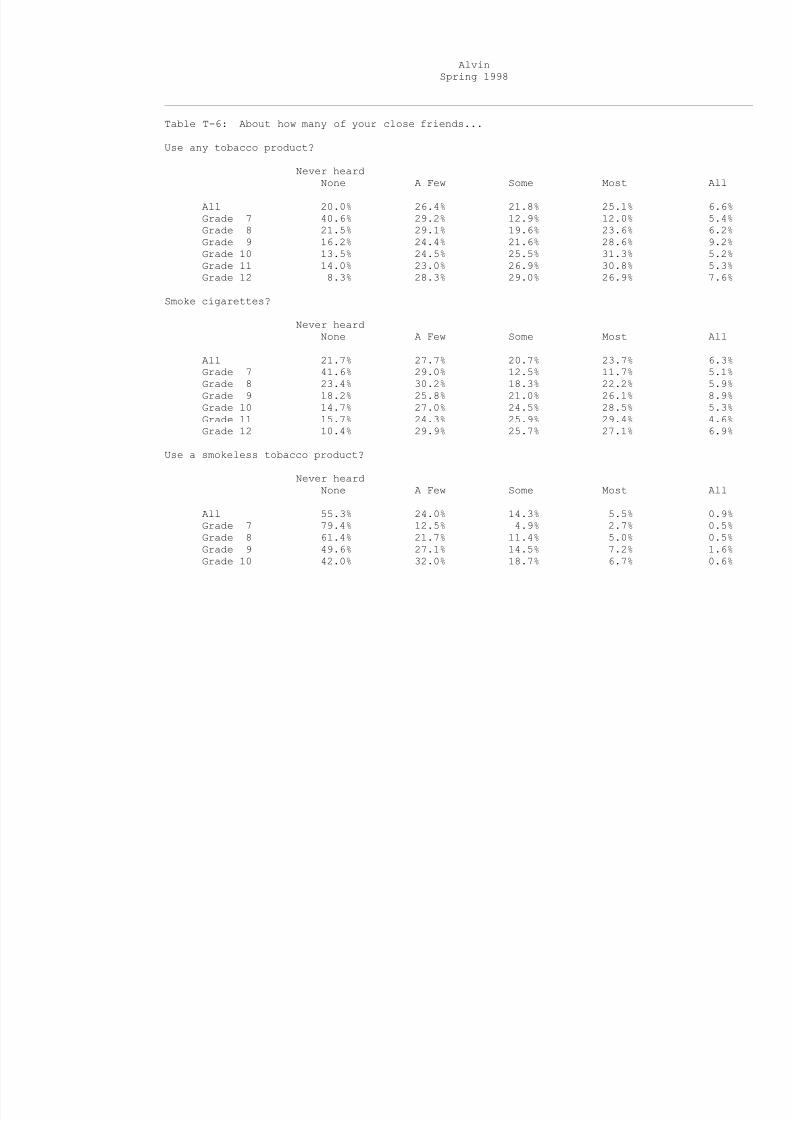
Table T-6: About how many of your close friends...
Use any tobacco product?
Never heardNone A Few Some Most All
All 20.0% 26.4% 21.8% 25.1% 6.6%Grade 7 40.6% 29.2% 12.9% 12.0% 5.4%Grade 8 21.5% 29.1% 19.6% 23.6% 6.2%Grade 9 16.2% 24.4% 21.6% 28.6% 9.2%Grade 10 13.5% 24.5% 25.5% 31.3% 5.2%Grade 11 14.0% 23.0% 26.9% 30.8% 5.3%
Grade 12 8.3% 28.3% 29.0% 26.9% 7.6%
Smoke cigarettes?
Never heardNone A Few Some Most All
All 21.7% 27.7% 20.7% 23.7% 6.3%Grade 7 41.6% 29.0% 12.5% 11.7% 5.1%Grade 8 23.4% 30.2% 18.3% 22.2% 5.9%Grade 9 18.2% 25.8% 21.0% 26.1% 8.9%Grade 10 14.7% 27.0% 24.5% 28.5% 5.3%Grade 11 15.7% 24.3% 25.9% 29.4% 4.6%Grade 12 10.4% 29.9% 25.7% 27.1% 6.9%
Use a smokeless tobacco product?
Never heardNone A Few Some Most All
All 55.3% 24.0% 14.3% 5.5% 0.9%Grade 7 79.4% 12.5% 4.9% 2.7% 0.5%Grade 8 61.4% 21.7% 11.4% 5.0% 0.5%
Grade 9 49.6% 27.1% 14.5% 7.2% 1.6%Grade 10 42.0% 32.0% 18.7% 6.7% 0.6%
8/14/2019 BRAZORIA COUNTY - Alvin ISD - 1998 Texas School Survey of Drug and Alcohol Use
http://slidepdf.com/reader/full/brazoria-county-alvin-isd-1998-texas-school-survey-of-drug-and-alcohol 7/213
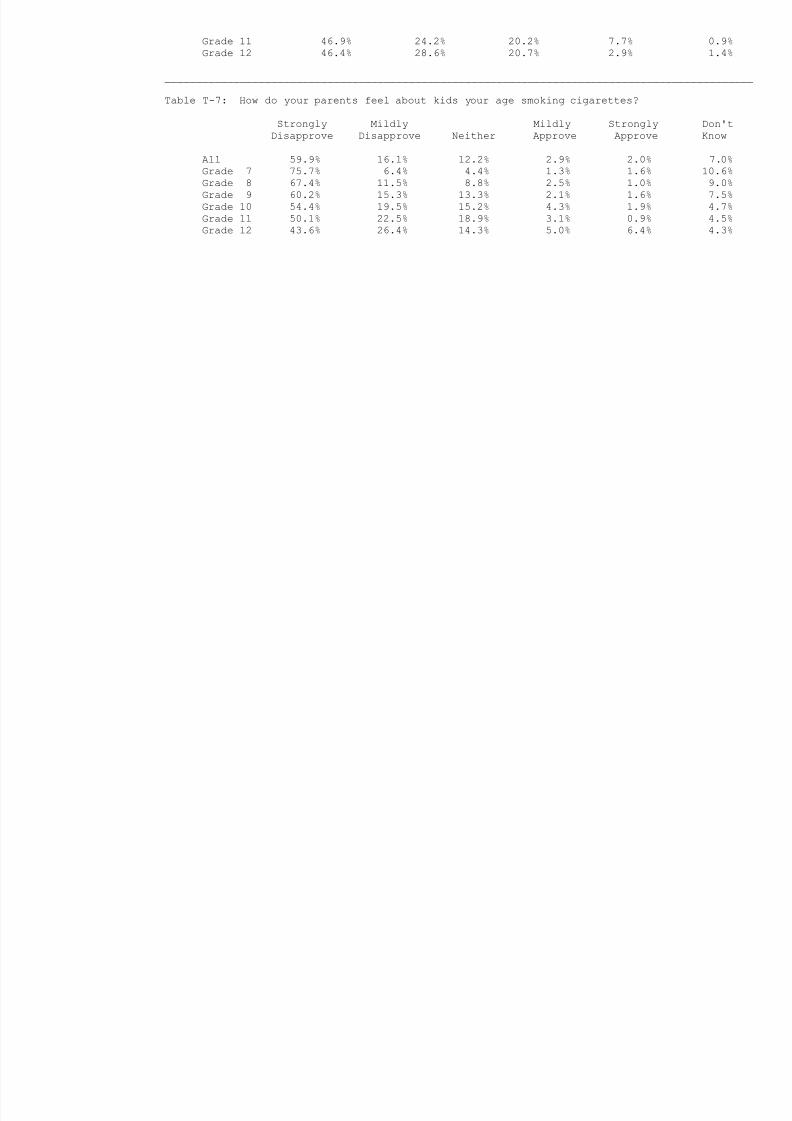
Grade 11 46.9% 24.2% 20.2% 7.7% 0.9%Grade 12 46.4% 28.6% 20.7% 2.9% 1.4%
______________________________________________________________________________________________
Table T-7: How do your parents feel about kids your age smoking cigarettes?
Strongly Mildly Mildly Strongly Don't
Disapprove Disapprove Neither Approve Approve Know
All 59.9% 16.1% 12.2% 2.9% 2.0% 7.0%Grade 7 75.7% 6.4% 4.4% 1.3% 1.6% 10.6%Grade 8 67.4% 11.5% 8.8% 2.5% 1.0% 9.0%Grade 9 60.2% 15.3% 13.3% 2.1% 1.6% 7.5%Grade 10 54.4% 19.5% 15.2% 4.3% 1.9% 4.7%Grade 11 50.1% 22.5% 18.9% 3.1% 0.9% 4.5%Grade 12 43.6% 26.4% 14.3% 5.0% 6.4% 4.3%
8/14/2019 BRAZORIA COUNTY - Alvin ISD - 1998 Texas School Survey of Drug and Alcohol Use
http://slidepdf.com/reader/full/brazoria-county-alvin-isd-1998-texas-school-survey-of-drug-and-alcohol 8/213
AlvinSpring 1998
______________________________________________________________________________________________
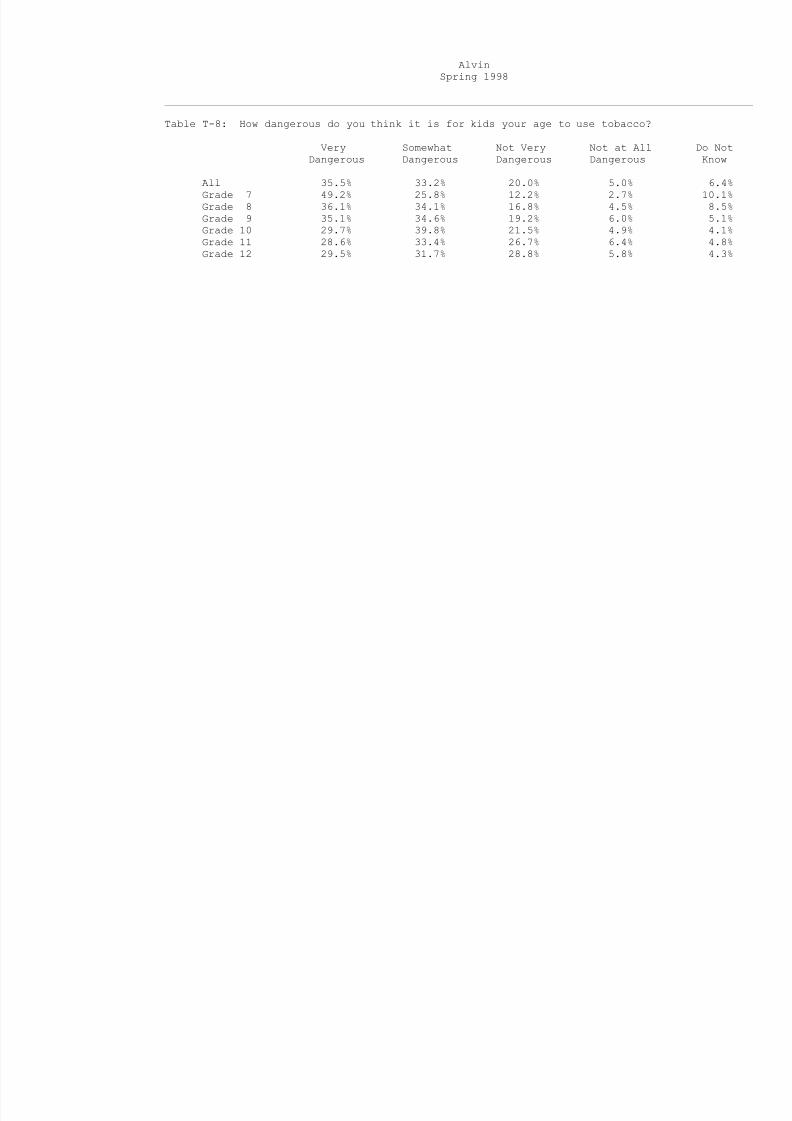
Table T-8: How dangerous do you think it is for kids your age to use tobacco?
Very Somewhat Not Very Not at All Do NotDangerous Dangerous Dangerous Dangerous Know
All 35.5% 33.2% 20.0% 5.0% 6.4%Grade 7 49.2% 25.8% 12.2% 2.7% 10.1%Grade 8 36.1% 34.1% 16.8% 4.5% 8.5%Grade 9 35.1% 34.6% 19.2% 6.0% 5.1%Grade 10 29.7% 39.8% 21.5% 4.9% 4.1%Grade 11 28.6% 33.4% 26.7% 6.4% 4.8%Grade 12 29.5% 31.7% 28.8% 5.8% 4.3%
8/14/2019 BRAZORIA COUNTY - Alvin ISD - 1998 Texas School Survey of Drug and Alcohol Use
http://slidepdf.com/reader/full/brazoria-county-alvin-isd-1998-texas-school-survey-of-drug-and-alcohol 9/213
AlvinSpring 1998
______________________________________________________________________________________________
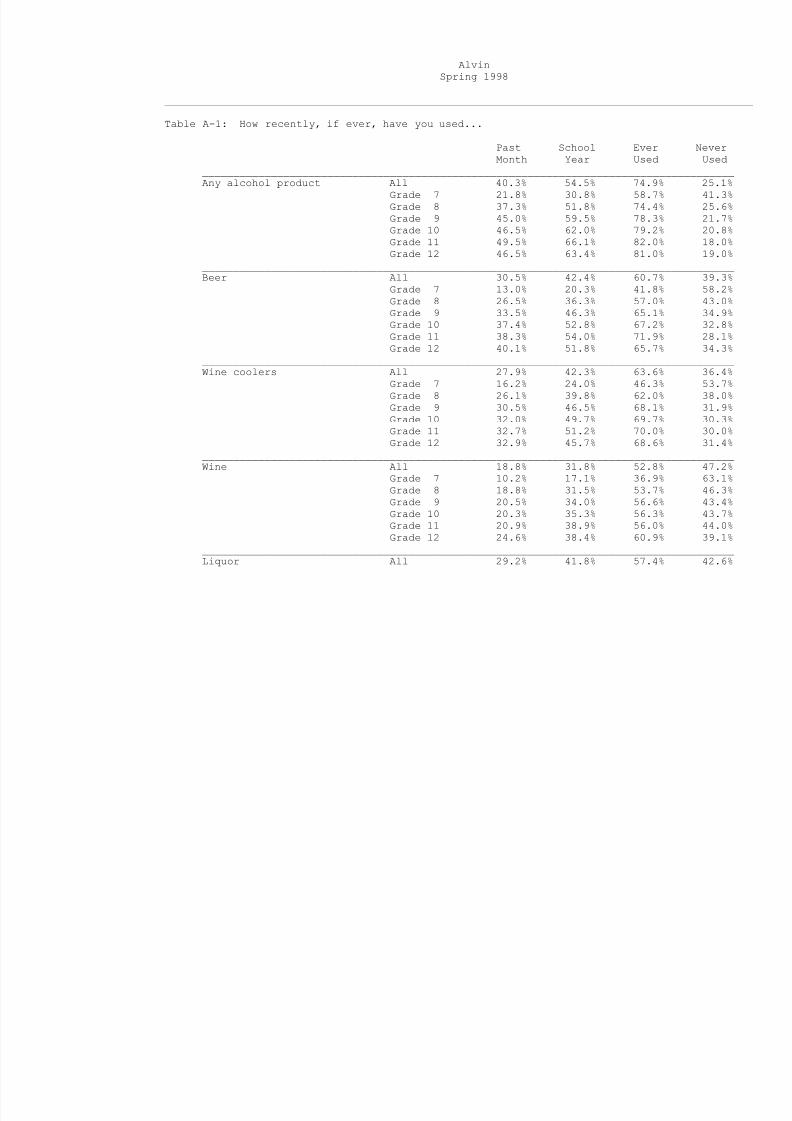
Table A-1: How recently, if ever, have you used...
Past School Ever NeverMonth Year Used Used
_____________________________________________________________________________________Any alcohol product All 40.3% 54.5% 74.9% 25.1%
Grade 7 21.8% 30.8% 58.7% 41.3%Grade 8 37.3% 51.8% 74.4% 25.6%Grade 9 45.0% 59.5% 78.3% 21.7%Grade 10 46.5% 62.0% 79.2% 20.8%Grade 11 49.5% 66.1% 82.0% 18.0%Grade 12 46.5% 63.4% 81.0% 19.0%
_____________________________________________________________________________________
Beer All 30.5% 42.4% 60.7% 39.3%Grade 7 13.0% 20.3% 41.8% 58.2%Grade 8 26.5% 36.3% 57.0% 43.0%Grade 9 33.5% 46.3% 65.1% 34.9%Grade 10 37.4% 52.8% 67.2% 32.8%Grade 11 38.3% 54.0% 71.9% 28.1%Grade 12 40.1% 51.8% 65.7% 34.3%
_____________________________________________________________________________________Wine coolers All 27.9% 42.3% 63.6% 36.4%
Grade 7 16.2% 24.0% 46.3% 53.7%Grade 8 26.1% 39.8% 62.0% 38.0%Grade 9 30.5% 46.5% 68.1% 31.9%Grade 10 32.0% 49.7% 69.7% 30.3%Grade 11 32.7% 51.2% 70.0% 30.0%Grade 12 32.9% 45.7% 68.6% 31.4%
_____________________________________________________________________________________Wine All 18.8% 31.8% 52.8% 47.2%
Grade 7 10.2% 17.1% 36.9% 63.1%Grade 8 18.8% 31.5% 53.7% 46.3%Grade 9 20.5% 34.0% 56.6% 43.4%Grade 10 20.3% 35.3% 56.3% 43.7%Grade 11 20.9% 38.9% 56.0% 44.0%Grade 12 24.6% 38.4% 60.9% 39.1%
_____________________________________________________________________________________Liquor All 29.2% 41.8% 57.4% 42.6%
8/14/2019 BRAZORIA COUNTY - Alvin ISD - 1998 Texas School Survey of Drug and Alcohol Use
http://slidepdf.com/reader/full/brazoria-county-alvin-isd-1998-texas-school-survey-of-drug-and-alcohol 10/213
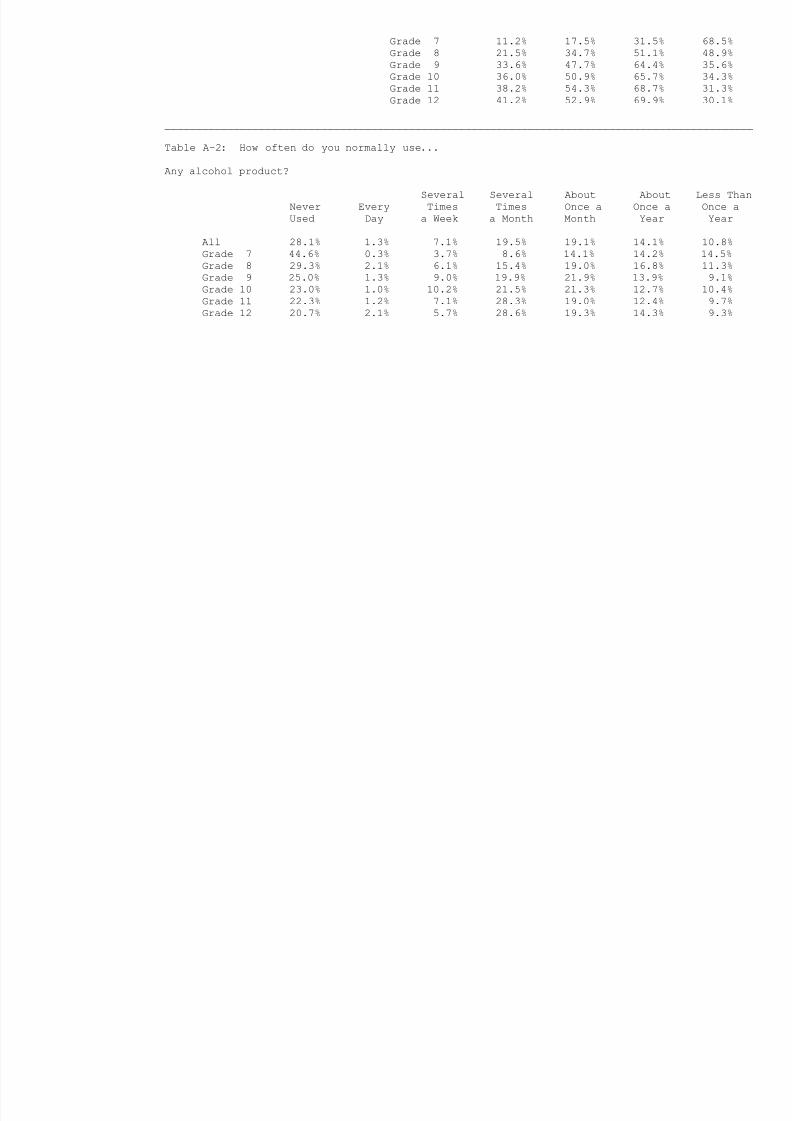
Grade 7 11.2% 17.5% 31.5% 68.5%Grade 8 21.5% 34.7% 51.1% 48.9%Grade 9 33.6% 47.7% 64.4% 35.6%Grade 10 36.0% 50.9% 65.7% 34.3%Grade 11 38.2% 54.3% 68.7% 31.3%Grade 12 41.2% 52.9% 69.9% 30.1%
______________________________________________________________________________________________
Table A-2: How often do you normally use...
Any alcohol product?
Several Several About About Less ThanNever Every Times Times Once a Once a Once aUsed Day a Week a Month Month Year Year
All 28.1% 1.3% 7.1% 19.5% 19.1% 14.1% 10.8%Grade 7 44.6% 0.3% 3.7% 8.6% 14.1% 14.2% 14.5%Grade 8 29.3% 2.1% 6.1% 15.4% 19.0% 16.8% 11.3%
Grade 9 25.0% 1.3% 9.0% 19.9% 21.9% 13.9% 9.1%Grade 10 23.0% 1.0% 10.2% 21.5% 21.3% 12.7% 10.4%Grade 11 22.3% 1.2% 7.1% 28.3% 19.0% 12.4% 9.7%Grade 12 20.7% 2.1% 5.7% 28.6% 19.3% 14.3% 9.3%
8/14/2019 BRAZORIA COUNTY - Alvin ISD - 1998 Texas School Survey of Drug and Alcohol Use
http://slidepdf.com/reader/full/brazoria-county-alvin-isd-1998-texas-school-survey-of-drug-and-alcohol 11/213
AlvinSpring 1998
______________________________________________________________________________________________
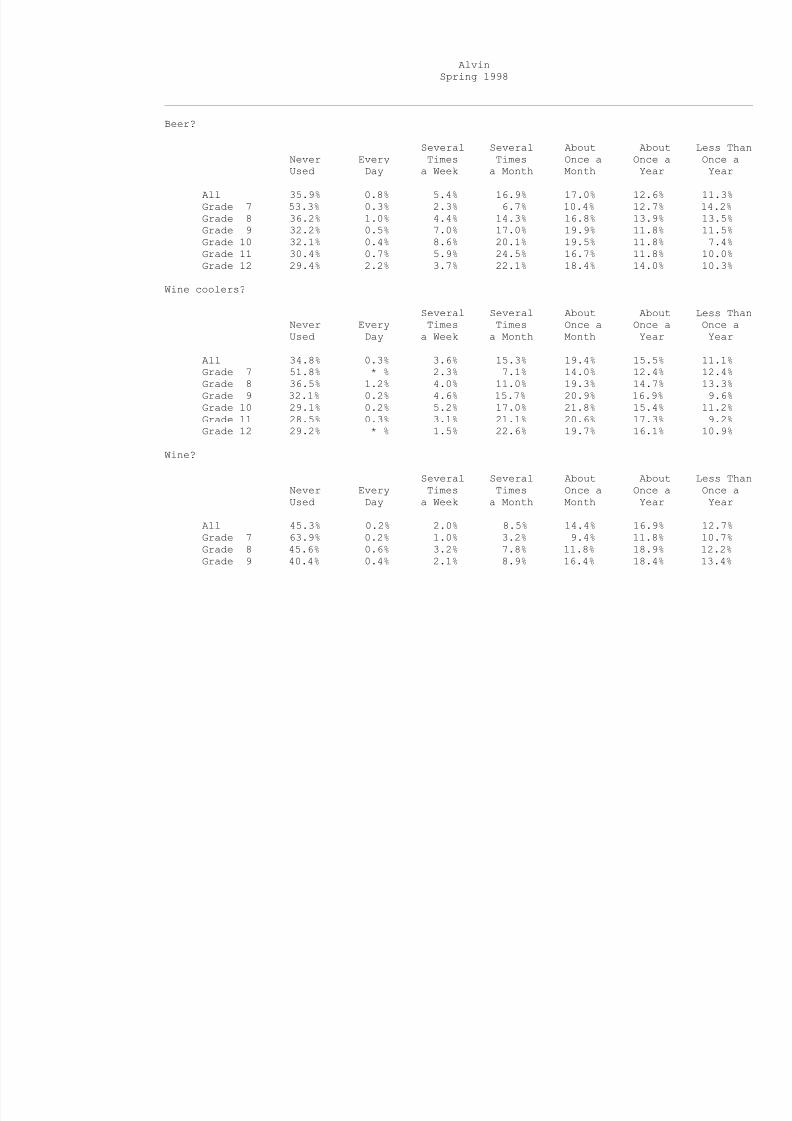
Beer?
Several Several About About Less ThanNever Every Times Times Once a Once a Once aUsed Day a Week a Month Month Year Year
All 35.9% 0.8% 5.4% 16.9% 17.0% 12.6% 11.3%Grade 7 53.3% 0.3% 2.3% 6.7% 10.4% 12.7% 14.2%Grade 8 36.2% 1.0% 4.4% 14.3% 16.8% 13.9% 13.5%Grade 9 32.2% 0.5% 7.0% 17.0% 19.9% 11.8% 11.5%Grade 10 32.1% 0.4% 8.6% 20.1% 19.5% 11.8% 7.4%Grade 11 30.4% 0.7% 5.9% 24.5% 16.7% 11.8% 10.0%Grade 12 29.4% 2.2% 3.7% 22.1% 18.4% 14.0% 10.3%
Wine coolers?
Several Several About About Less ThanNever Every Times Times Once a Once a Once aUsed Day a Week a Month Month Year Year
All 34.8% 0.3% 3.6% 15.3% 19.4% 15.5% 11.1%Grade 7 51.8% * % 2.3% 7.1% 14.0% 12.4% 12.4%Grade 8 36.5% 1.2% 4.0% 11.0% 19.3% 14.7% 13.3%Grade 9 32.1% 0.2% 4.6% 15.7% 20.9% 16.9% 9.6%Grade 10 29.1% 0.2% 5.2% 17.0% 21.8% 15.4% 11.2%Grade 11 28.5% 0.3% 3.1% 21.1% 20.6% 17.3% 9.2%Grade 12 29.2% * % 1.5% 22.6% 19.7% 16.1% 10.9%
Wine?
Several Several About About Less ThanNever Every Times Times Once a Once a Once aUsed Day a Week a Month Month Year Year
All 45.3% 0.2% 2.0% 8.5% 14.4% 16.9% 12.7%Grade 7 63.9% 0.2% 1.0% 3.2% 9.4% 11.8% 10.7%
Grade 8 45.6% 0.6% 3.2% 7.8% 11.8% 18.9% 12.2%Grade 9 40.4% 0.4% 2.1% 8.9% 16.4% 18.4% 13.4%
8/14/2019 BRAZORIA COUNTY - Alvin ISD - 1998 Texas School Survey of Drug and Alcohol Use
http://slidepdf.com/reader/full/brazoria-county-alvin-isd-1998-texas-school-survey-of-drug-and-alcohol 12/213
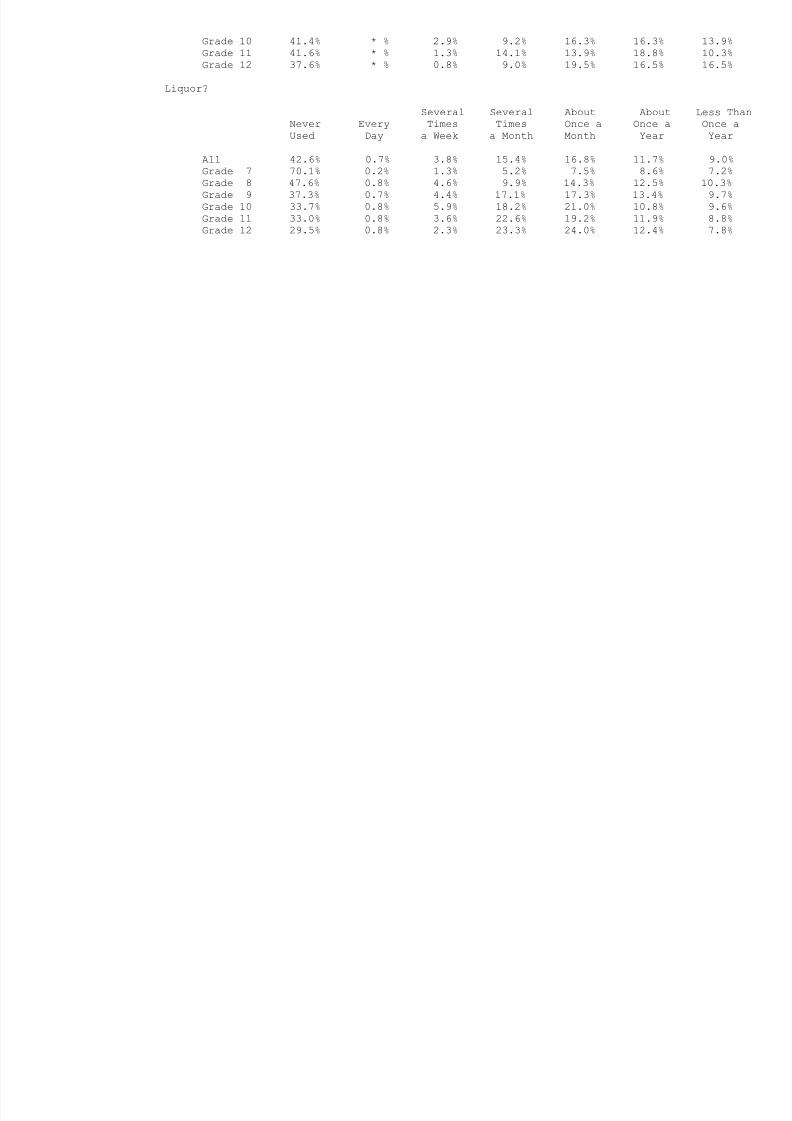
Grade 10 41.4% * % 2.9% 9.2% 16.3% 16.3% 13.9%Grade 11 41.6% * % 1.3% 14.1% 13.9% 18.8% 10.3%Grade 12 37.6% * % 0.8% 9.0% 19.5% 16.5% 16.5%
Liquor?
Several Several About About Less ThanNever Every Times Times Once a Once a Once a
Used Day a Week a Month Month Year Year
All 42.6% 0.7% 3.8% 15.4% 16.8% 11.7% 9.0%Grade 7 70.1% 0.2% 1.3% 5.2% 7.5% 8.6% 7.2%Grade 8 47.6% 0.8% 4.6% 9.9% 14.3% 12.5% 10.3%Grade 9 37.3% 0.7% 4.4% 17.1% 17.3% 13.4% 9.7%Grade 10 33.7% 0.8% 5.9% 18.2% 21.0% 10.8% 9.6%Grade 11 33.0% 0.8% 3.6% 22.6% 19.2% 11.9% 8.8%Grade 12 29.5% 0.8% 2.3% 23.3% 24.0% 12.4% 7.8%
8/14/2019 BRAZORIA COUNTY - Alvin ISD - 1998 Texas School Survey of Drug and Alcohol Use
http://slidepdf.com/reader/full/brazoria-county-alvin-isd-1998-texas-school-survey-of-drug-and-alcohol 13/213
AlvinSpring 1998
______________________________________________________________________________________________
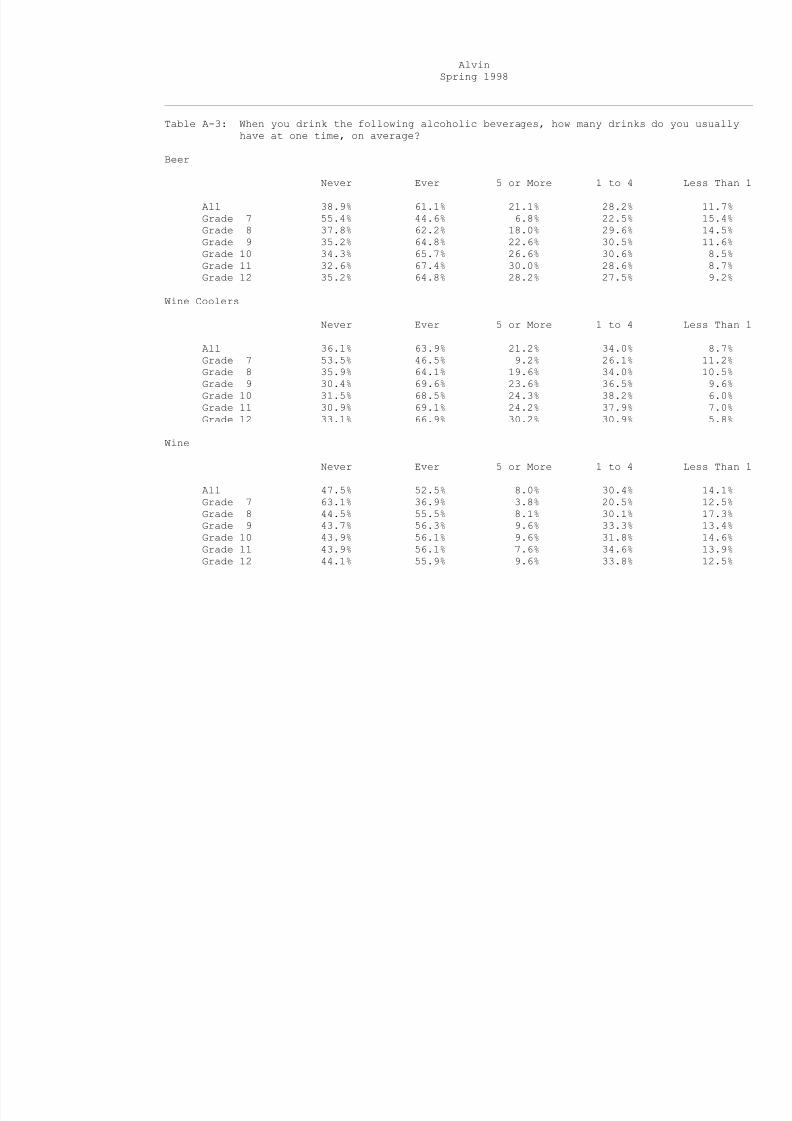
Table A-3: When you drink the following alcoholic beverages, how many drinks do you usually
have at one time, on average?
Beer
Never Ever 5 or More 1 to 4 Less Than 1
All 38.9% 61.1% 21.1% 28.2% 11.7%Grade 7 55.4% 44.6% 6.8% 22.5% 15.4%Grade 8 37.8% 62.2% 18.0% 29.6% 14.5%Grade 9 35.2% 64.8% 22.6% 30.5% 11.6%Grade 10 34.3% 65.7% 26.6% 30.6% 8.5%Grade 11 32.6% 67.4% 30.0% 28.6% 8.7%
Grade 12 35.2% 64.8% 28.2% 27.5% 9.2%
Wine Coolers
Never Ever 5 or More 1 to 4 Less Than 1
All 36.1% 63.9% 21.2% 34.0% 8.7%Grade 7 53.5% 46.5% 9.2% 26.1% 11.2%Grade 8 35.9% 64.1% 19.6% 34.0% 10.5%Grade 9 30.4% 69.6% 23.6% 36.5% 9.6%Grade 10 31.5% 68.5% 24.3% 38.2% 6.0%Grade 11 30.9% 69.1% 24.2% 37.9% 7.0%Grade 12 33.1% 66.9% 30.2% 30.9% 5.8%
Wine
Never Ever 5 or More 1 to 4 Less Than 1
All 47.5% 52.5% 8.0% 30.4% 14.1%Grade 7 63.1% 36.9% 3.8% 20.5% 12.5%Grade 8 44.5% 55.5% 8.1% 30.1% 17.3%Grade 9 43.7% 56.3% 9.6% 33.3% 13.4%Grade 10 43.9% 56.1% 9.6% 31.8% 14.6%
Grade 11 43.9% 56.1% 7.6% 34.6% 13.9%Grade 12 44.1% 55.9% 9.6% 33.8% 12.5%
8/14/2019 BRAZORIA COUNTY - Alvin ISD - 1998 Texas School Survey of Drug and Alcohol Use
http://slidepdf.com/reader/full/brazoria-county-alvin-isd-1998-texas-school-survey-of-drug-and-alcohol 14/213
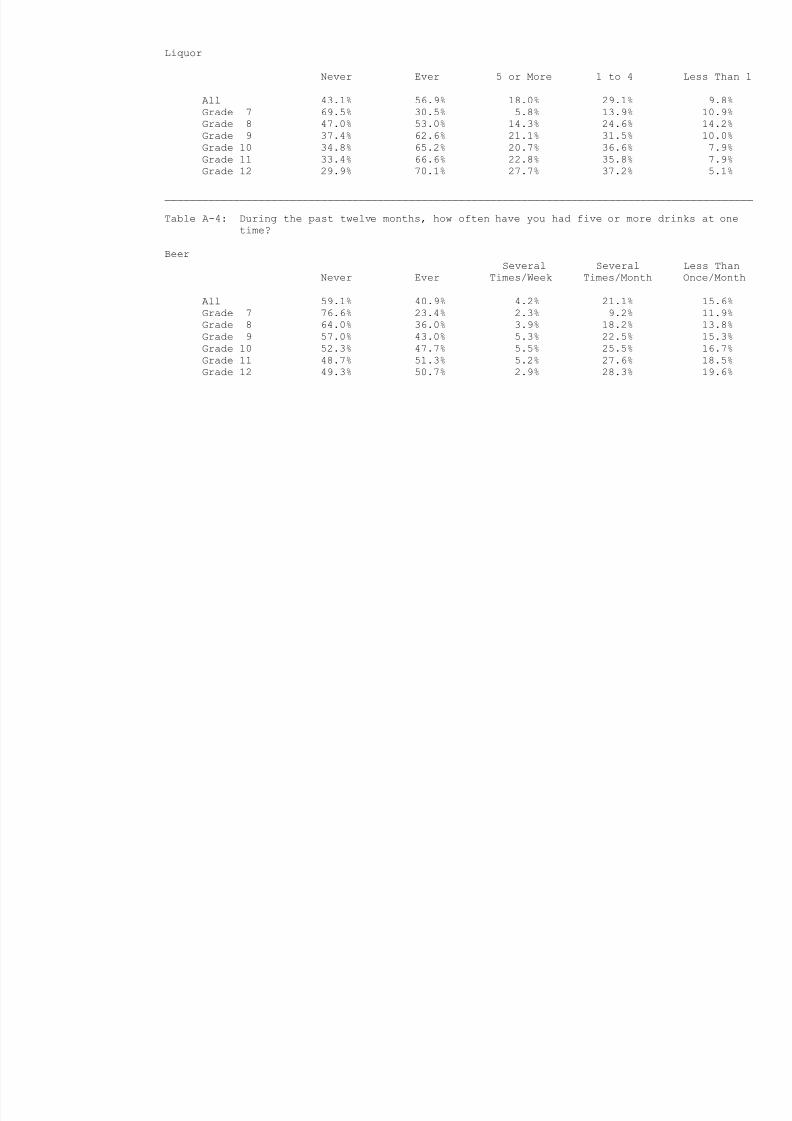
Liquor
Never Ever 5 or More 1 to 4 Less Than 1
All 43.1% 56.9% 18.0% 29.1% 9.8%Grade 7 69.5% 30.5% 5.8% 13.9% 10.9%Grade 8 47.0% 53.0% 14.3% 24.6% 14.2%
Grade 9 37.4% 62.6% 21.1% 31.5% 10.0%Grade 10 34.8% 65.2% 20.7% 36.6% 7.9%Grade 11 33.4% 66.6% 22.8% 35.8% 7.9%Grade 12 29.9% 70.1% 27.7% 37.2% 5.1%
______________________________________________________________________________________________
Table A-4: During the past twelve months, how often have you had five or more drinks at onetime?
BeerSeveral Several Less Than
Never Ever Times/Week Times/Month Once/Month
All 59.1% 40.9% 4.2% 21.1% 15.6%Grade 7 76.6% 23.4% 2.3% 9.2% 11.9%Grade 8 64.0% 36.0% 3.9% 18.2% 13.8%Grade 9 57.0% 43.0% 5.3% 22.5% 15.3%Grade 10 52.3% 47.7% 5.5% 25.5% 16.7%Grade 11 48.7% 51.3% 5.2% 27.6% 18.5%Grade 12 49.3% 50.7% 2.9% 28.3% 19.6%
8/14/2019 BRAZORIA COUNTY - Alvin ISD - 1998 Texas School Survey of Drug and Alcohol Use
http://slidepdf.com/reader/full/brazoria-county-alvin-isd-1998-texas-school-survey-of-drug-and-alcohol 15/213
AlvinSpring 1998
______________________________________________________________________________________________
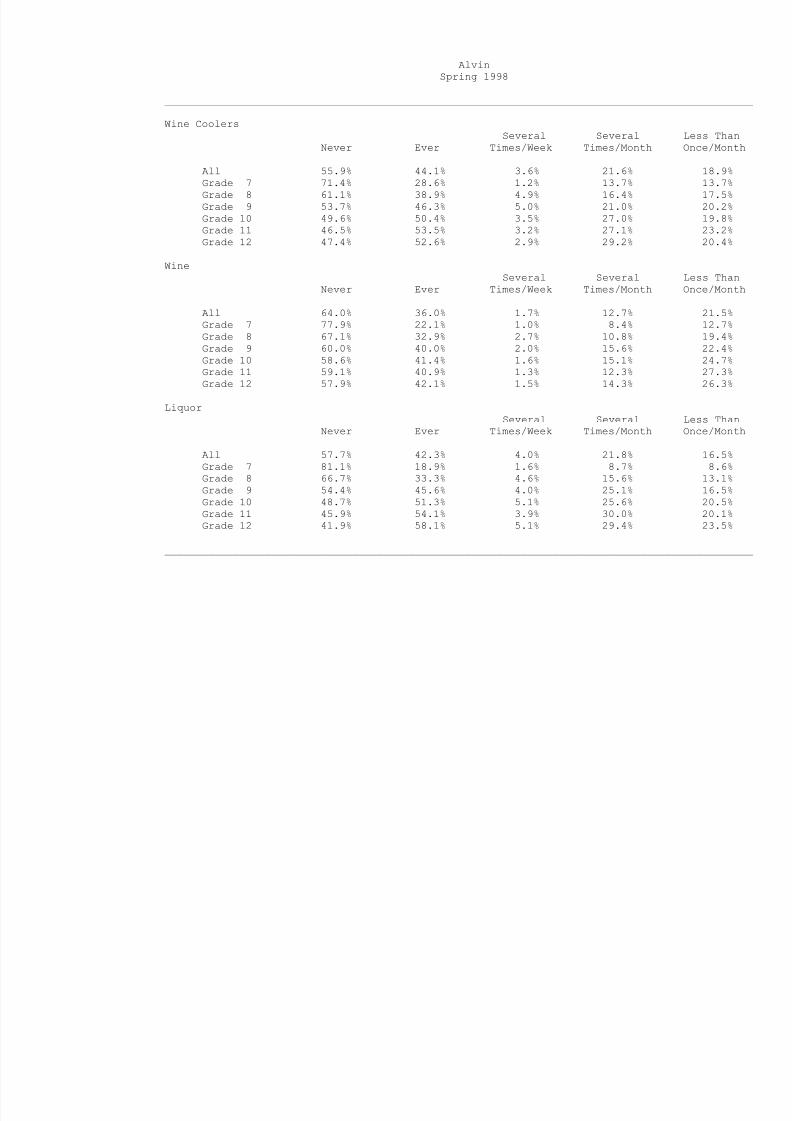
Wine Coolers
Several Several Less ThanNever Ever Times/Week Times/Month Once/Month
All 55.9% 44.1% 3.6% 21.6% 18.9%Grade 7 71.4% 28.6% 1.2% 13.7% 13.7%Grade 8 61.1% 38.9% 4.9% 16.4% 17.5%Grade 9 53.7% 46.3% 5.0% 21.0% 20.2%Grade 10 49.6% 50.4% 3.5% 27.0% 19.8%Grade 11 46.5% 53.5% 3.2% 27.1% 23.2%Grade 12 47.4% 52.6% 2.9% 29.2% 20.4%
Wine
Several Several Less ThanNever Ever Times/Week Times/Month Once/Month
All 64.0% 36.0% 1.7% 12.7% 21.5%Grade 7 77.9% 22.1% 1.0% 8.4% 12.7%Grade 8 67.1% 32.9% 2.7% 10.8% 19.4%Grade 9 60.0% 40.0% 2.0% 15.6% 22.4%Grade 10 58.6% 41.4% 1.6% 15.1% 24.7%Grade 11 59.1% 40.9% 1.3% 12.3% 27.3%Grade 12 57.9% 42.1% 1.5% 14.3% 26.3%
Liquor
Several Several Less ThanNever Ever Times/Week Times/Month Once/Month
All 57.7% 42.3% 4.0% 21.8% 16.5%Grade 7 81.1% 18.9% 1.6% 8.7% 8.6%Grade 8 66.7% 33.3% 4.6% 15.6% 13.1%Grade 9 54.4% 45.6% 4.0% 25.1% 16.5%Grade 10 48.7% 51.3% 5.1% 25.6% 20.5%Grade 11 45.9% 54.1% 3.9% 30.0% 20.1%Grade 12 41.9% 58.1% 5.1% 29.4% 23.5%
______________________________________________________________________________________________
8/14/2019 BRAZORIA COUNTY - Alvin ISD - 1998 Texas School Survey of Drug and Alcohol Use
http://slidepdf.com/reader/full/brazoria-county-alvin-isd-1998-texas-school-survey-of-drug-and-alcohol 16/213
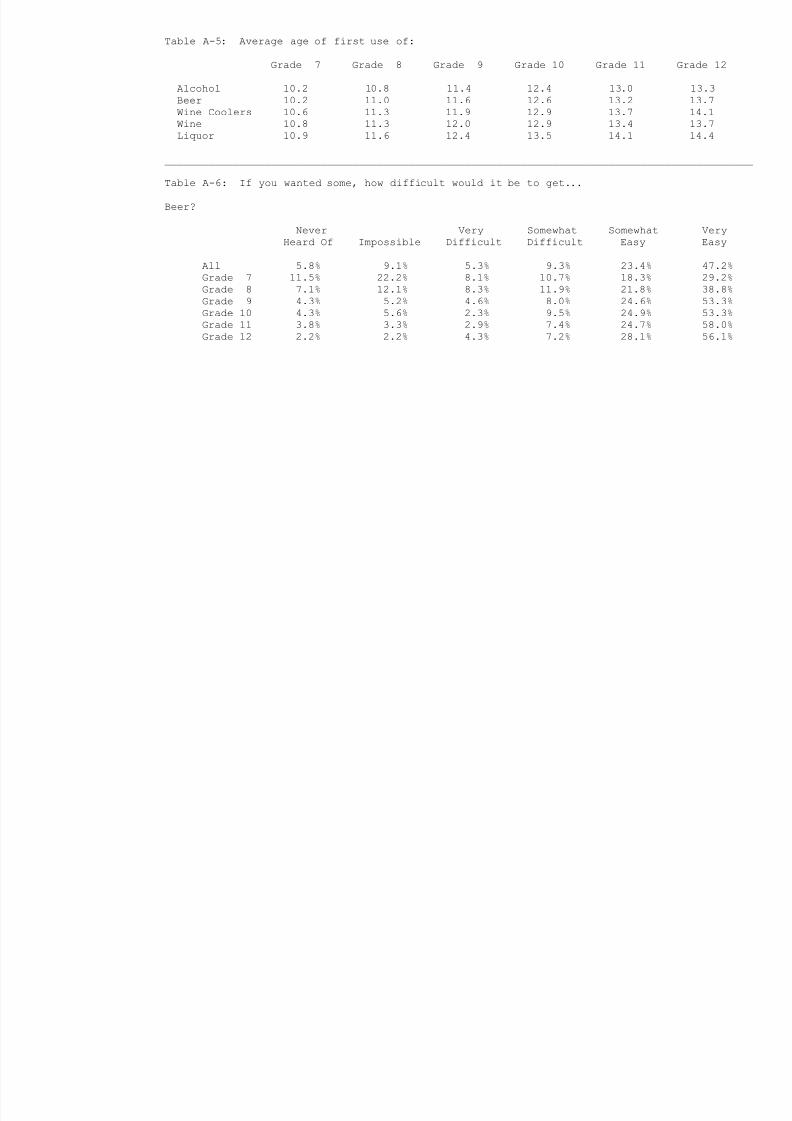
Table A-5: Average age of first use of:
Grade 7 Grade 8 Grade 9 Grade 10 Grade 11 Grade 12
Alcohol 10.2 10.8 11.4 12.4 13.0 13.3Beer 10.2 11.0 11.6 12.6 13.2 13.7Wine Coolers 10.6 11.3 11.9 12.9 13.7 14.1Wine 10.8 11.3 12.0 12.9 13.4 13.7
Liquor 10.9 11.6 12.4 13.5 14.1 14.4
______________________________________________________________________________________________
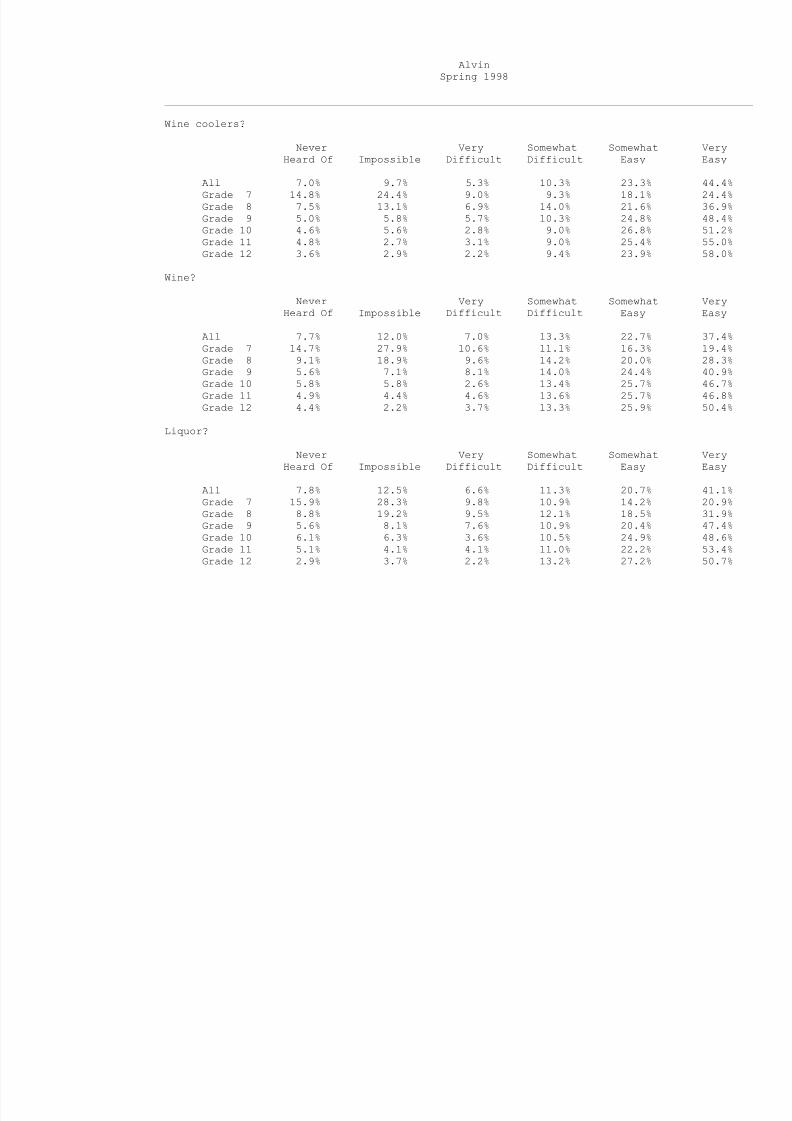
Table A-6: If you wanted some, how difficult would it be to get...
Beer?
Never Very Somewhat Somewhat VeryHeard Of Impossible Difficult Difficult Easy Easy
All 5.8% 9.1% 5.3% 9.3% 23.4% 47.2%
Grade 7 11.5% 22.2% 8.1% 10.7% 18.3% 29.2%Grade 8 7.1% 12.1% 8.3% 11.9% 21.8% 38.8%Grade 9 4.3% 5.2% 4.6% 8.0% 24.6% 53.3%Grade 10 4.3% 5.6% 2.3% 9.5% 24.9% 53.3%Grade 11 3.8% 3.3% 2.9% 7.4% 24.7% 58.0%Grade 12 2.2% 2.2% 4.3% 7.2% 28.1% 56.1%
8/14/2019 BRAZORIA COUNTY - Alvin ISD - 1998 Texas School Survey of Drug and Alcohol Use
http://slidepdf.com/reader/full/brazoria-county-alvin-isd-1998-texas-school-survey-of-drug-and-alcohol 17/213
AlvinSpring 1998
______________________________________________________________________________________________
Wine coolers?
Never Very Somewhat Somewhat VeryHeard Of Impossible Difficult Difficult Easy Easy
All 7.0% 9.7% 5.3% 10.3% 23.3% 44.4%Grade 7 14.8% 24.4% 9.0% 9.3% 18.1% 24.4%Grade 8 7.5% 13.1% 6.9% 14.0% 21.6% 36.9%Grade 9 5.0% 5.8% 5.7% 10.3% 24.8% 48.4%Grade 10 4.6% 5.6% 2.8% 9.0% 26.8% 51.2%Grade 11 4.8% 2.7% 3.1% 9.0% 25.4% 55.0%Grade 12 3.6% 2.9% 2.2% 9.4% 23.9% 58.0%
Wine?
Never Very Somewhat Somewhat VeryHeard Of Impossible Difficult Difficult Easy Easy
All 7.7% 12.0% 7.0% 13.3% 22.7% 37.4%Grade 7 14.7% 27.9% 10.6% 11.1% 16.3% 19.4%Grade 8 9.1% 18.9% 9.6% 14.2% 20.0% 28.3%Grade 9 5.6% 7.1% 8.1% 14.0% 24.4% 40.9%Grade 10 5.8% 5.8% 2.6% 13.4% 25.7% 46.7%Grade 11 4.9% 4.4% 4.6% 13.6% 25.7% 46.8%Grade 12 4.4% 2.2% 3.7% 13.3% 25.9% 50.4%
Liquor?
Never Very Somewhat Somewhat VeryHeard Of Impossible Difficult Difficult Easy Easy
All 7.8% 12.5% 6.6% 11.3% 20.7% 41.1%Grade 7 15.9% 28.3% 9.8% 10.9% 14.2% 20.9%Grade 8 8.8% 19.2% 9.5% 12.1% 18.5% 31.9%Grade 9 5.6% 8.1% 7.6% 10.9% 20.4% 47.4%Grade 10 6.1% 6.3% 3.6% 10.5% 24.9% 48.6%
Grade 11 5.1% 4.1% 4.1% 11.0% 22.2% 53.4%Grade 12 2.9% 3.7% 2.2% 13.2% 27.2% 50.7%
8/14/2019 BRAZORIA COUNTY - Alvin ISD - 1998 Texas School Survey of Drug and Alcohol Use
http://slidepdf.com/reader/full/brazoria-county-alvin-isd-1998-texas-school-survey-of-drug-and-alcohol 18/213
______________________________________________________________________________________________
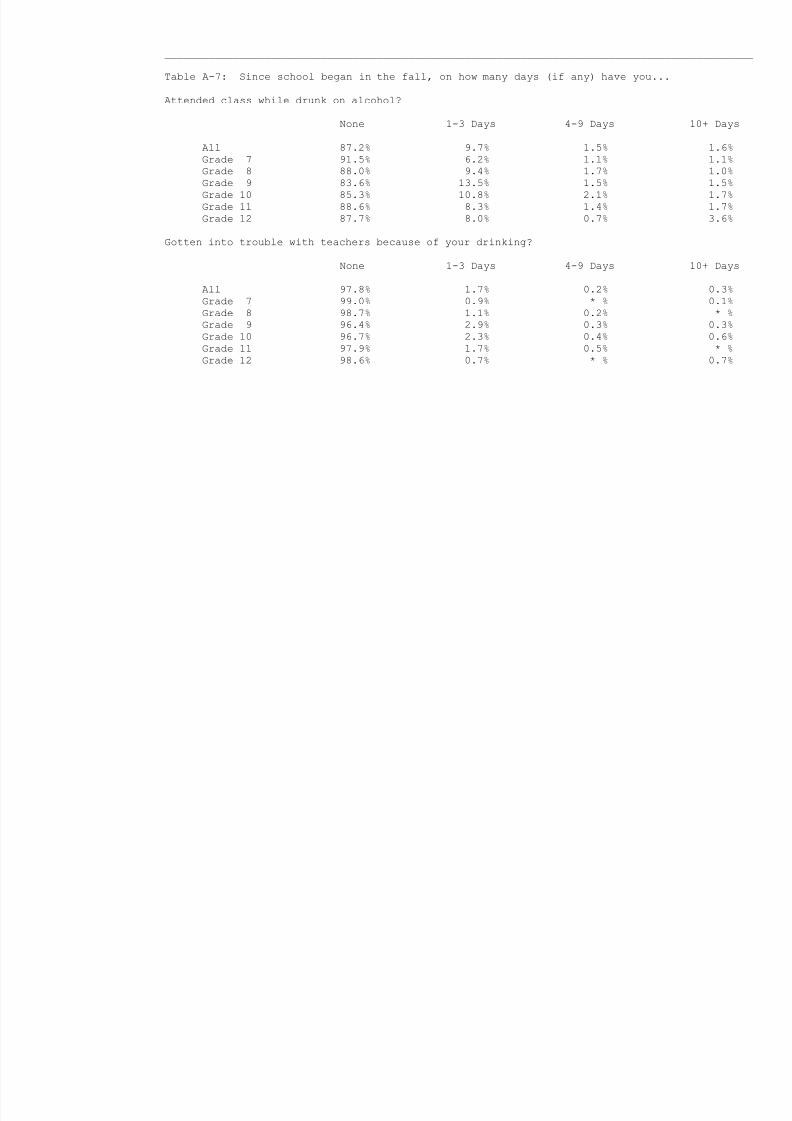
Table A-7: Since school began in the fall, on how many days (if any) have you...
Attended class while drunk on alcohol?
None 1-3 Days 4-9 Days 10+ Days
All 87.2% 9.7% 1.5% 1.6%Grade 7 91.5% 6.2% 1.1% 1.1%Grade 8 88.0% 9.4% 1.7% 1.0%Grade 9 83.6% 13.5% 1.5% 1.5%Grade 10 85.3% 10.8% 2.1% 1.7%Grade 11 88.6% 8.3% 1.4% 1.7%Grade 12 87.7% 8.0% 0.7% 3.6%
Gotten into trouble with teachers because of your drinking?
None 1-3 Days 4-9 Days 10+ Days
All 97.8% 1.7% 0.2% 0.3%Grade 7 99.0% 0.9% * % 0.1%Grade 8 98.7% 1.1% 0.2% * %Grade 9 96.4% 2.9% 0.3% 0.3%Grade 10 96.7% 2.3% 0.4% 0.6%Grade 11 97.9% 1.7% 0.5% * %Grade 12 98.6% 0.7% * % 0.7%
8/14/2019 BRAZORIA COUNTY - Alvin ISD - 1998 Texas School Survey of Drug and Alcohol Use
http://slidepdf.com/reader/full/brazoria-county-alvin-isd-1998-texas-school-survey-of-drug-and-alcohol 19/213
AlvinSpring 1998
______________________________________________________________________________________________
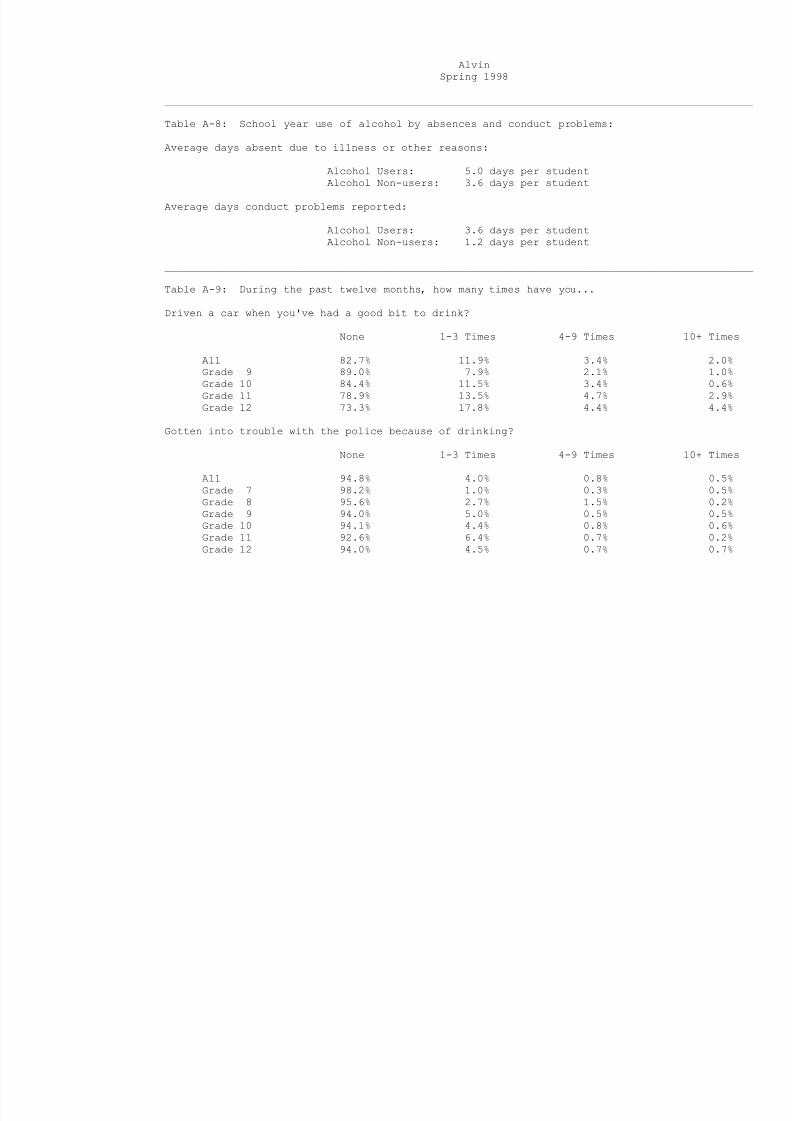
Table A-8: School year use of alcohol by absences and conduct problems:
Average days absent due to illness or other reasons:
Alcohol Users: 5.0 days per studentAlcohol Non-users: 3.6 days per student
Average days conduct problems reported:
Alcohol Users: 3.6 days per studentAlcohol Non-users: 1.2 days per student
______________________________________________________________________________________________
Table A-9: During the past twelve months, how many times have you...
Driven a car when you've had a good bit to drink?
None 1-3 Times 4-9 Times 10+ Times
All 82.7% 11.9% 3.4% 2.0%Grade 9 89.0% 7.9% 2.1% 1.0%Grade 10 84.4% 11.5% 3.4% 0.6%Grade 11 78.9% 13.5% 4.7% 2.9%Grade 12 73.3% 17.8% 4.4% 4.4%
Gotten into trouble with the police because of drinking?
None 1-3 Times 4-9 Times 10+ Times
All 94.8% 4.0% 0.8% 0.5%Grade 7 98.2% 1.0% 0.3% 0.5%Grade 8 95.6% 2.7% 1.5% 0.2%Grade 9 94.0% 5.0% 0.5% 0.5%Grade 10 94.1% 4.4% 0.8% 0.6%Grade 11 92.6% 6.4% 0.7% 0.2%
Grade 12 94.0% 4.5% 0.7% 0.7%
8/14/2019 BRAZORIA COUNTY - Alvin ISD - 1998 Texas School Survey of Drug and Alcohol Use
http://slidepdf.com/reader/full/brazoria-county-alvin-isd-1998-texas-school-survey-of-drug-and-alcohol 20/213
______________________________________________________________________________________________
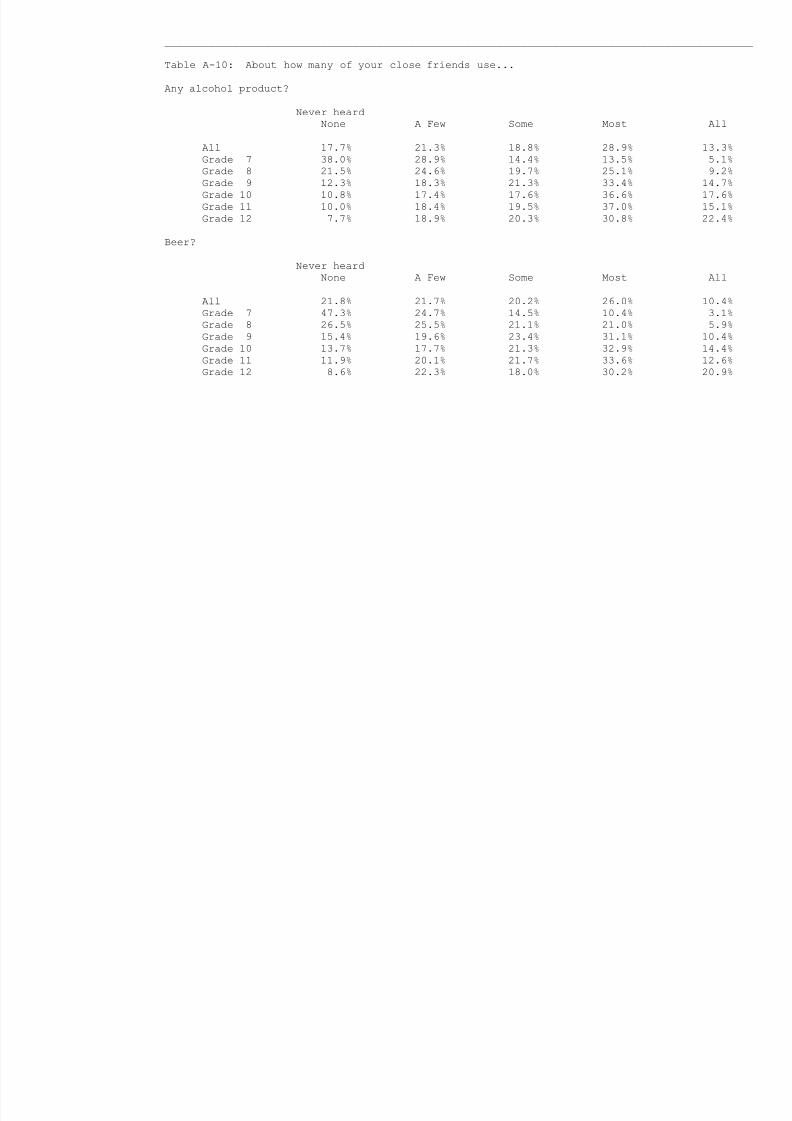
Table A-10: About how many of your close friends use...
Any alcohol product?
Never heardNone A Few Some Most All
All 17.7% 21.3% 18.8% 28.9% 13.3%Grade 7 38.0% 28.9% 14.4% 13.5% 5.1%Grade 8 21.5% 24.6% 19.7% 25.1% 9.2%Grade 9 12.3% 18.3% 21.3% 33.4% 14.7%Grade 10 10.8% 17.4% 17.6% 36.6% 17.6%Grade 11 10.0% 18.4% 19.5% 37.0% 15.1%Grade 12 7.7% 18.9% 20.3% 30.8% 22.4%
Beer?
Never heard
None A Few Some Most All
All 21.8% 21.7% 20.2% 26.0% 10.4%Grade 7 47.3% 24.7% 14.5% 10.4% 3.1%Grade 8 26.5% 25.5% 21.1% 21.0% 5.9%Grade 9 15.4% 19.6% 23.4% 31.1% 10.4%Grade 10 13.7% 17.7% 21.3% 32.9% 14.4%Grade 11 11.9% 20.1% 21.7% 33.6% 12.6%Grade 12 8.6% 22.3% 18.0% 30.2% 20.9%
8/14/2019 BRAZORIA COUNTY - Alvin ISD - 1998 Texas School Survey of Drug and Alcohol Use
http://slidepdf.com/reader/full/brazoria-county-alvin-isd-1998-texas-school-survey-of-drug-and-alcohol 21/213
AlvinSpring 1998
______________________________________________________________________________________________
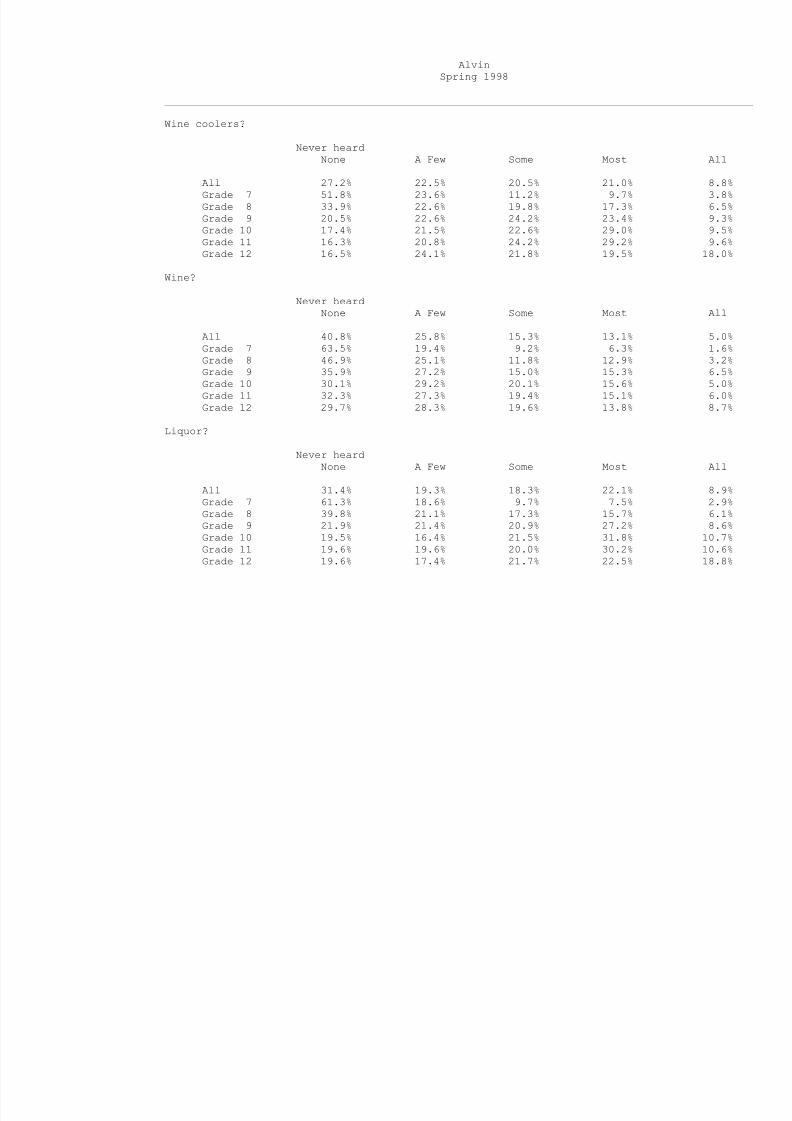
Wine coolers?
Never heardNone A Few Some Most All
All 27.2% 22.5% 20.5% 21.0% 8.8%Grade 7 51.8% 23.6% 11.2% 9.7% 3.8%Grade 8 33.9% 22.6% 19.8% 17.3% 6.5%Grade 9 20.5% 22.6% 24.2% 23.4% 9.3%Grade 10 17.4% 21.5% 22.6% 29.0% 9.5%Grade 11 16.3% 20.8% 24.2% 29.2% 9.6%Grade 12 16.5% 24.1% 21.8% 19.5% 18.0%
Wine?
Never heardNone A Few Some Most All
All 40.8% 25.8% 15.3% 13.1% 5.0%Grade 7 63.5% 19.4% 9.2% 6.3% 1.6%Grade 8 46.9% 25.1% 11.8% 12.9% 3.2%Grade 9 35.9% 27.2% 15.0% 15.3% 6.5%Grade 10 30.1% 29.2% 20.1% 15.6% 5.0%Grade 11 32.3% 27.3% 19.4% 15.1% 6.0%Grade 12 29.7% 28.3% 19.6% 13.8% 8.7%
Liquor?
Never heardNone A Few Some Most All
All 31.4% 19.3% 18.3% 22.1% 8.9%Grade 7 61.3% 18.6% 9.7% 7.5% 2.9%Grade 8 39.8% 21.1% 17.3% 15.7% 6.1%Grade 9 21.9% 21.4% 20.9% 27.2% 8.6%Grade 10 19.5% 16.4% 21.5% 31.8% 10.7%Grade 11 19.6% 19.6% 20.0% 30.2% 10.6%Grade 12 19.6% 17.4% 21.7% 22.5% 18.8%
8/14/2019 BRAZORIA COUNTY - Alvin ISD - 1998 Texas School Survey of Drug and Alcohol Use
http://slidepdf.com/reader/full/brazoria-county-alvin-isd-1998-texas-school-survey-of-drug-and-alcohol 22/213
______________________________________________________________________________________________
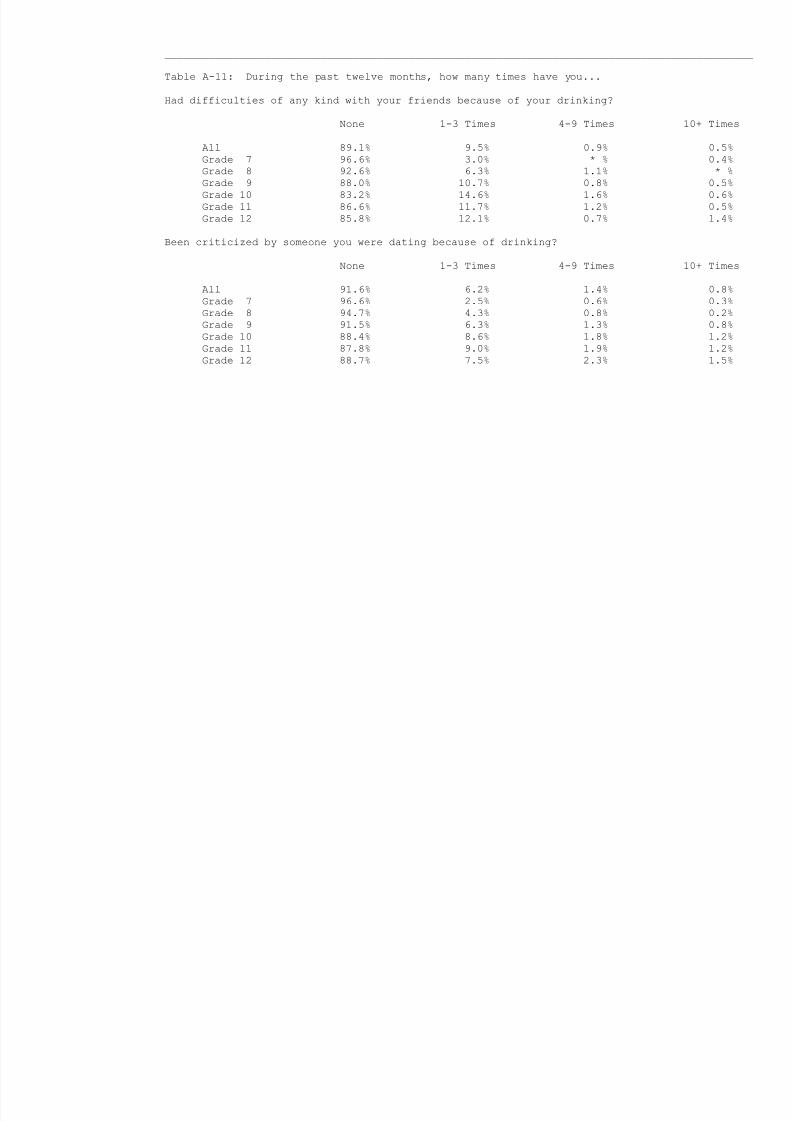
Table A-11: During the past twelve months, how many times have you...
Had difficulties of any kind with your friends because of your drinking?
None 1-3 Times 4-9 Times 10+ Times
All 89.1% 9.5% 0.9% 0.5%Grade 7 96.6% 3.0% * % 0.4%Grade 8 92.6% 6.3% 1.1% * %Grade 9 88.0% 10.7% 0.8% 0.5%Grade 10 83.2% 14.6% 1.6% 0.6%Grade 11 86.6% 11.7% 1.2% 0.5%Grade 12 85.8% 12.1% 0.7% 1.4%
Been criticized by someone you were dating because of drinking?
None 1-3 Times 4-9 Times 10+ Times
All 91.6% 6.2% 1.4% 0.8%Grade 7 96.6% 2.5% 0.6% 0.3%Grade 8 94.7% 4.3% 0.8% 0.2%Grade 9 91.5% 6.3% 1.3% 0.8%Grade 10 88.4% 8.6% 1.8% 1.2%Grade 11 87.8% 9.0% 1.9% 1.2%Grade 12 88.7% 7.5% 2.3% 1.5%
8/14/2019 BRAZORIA COUNTY - Alvin ISD - 1998 Texas School Survey of Drug and Alcohol Use
http://slidepdf.com/reader/full/brazoria-county-alvin-isd-1998-texas-school-survey-of-drug-and-alcohol 23/213
AlvinSpring 1998
______________________________________________________________________________________________
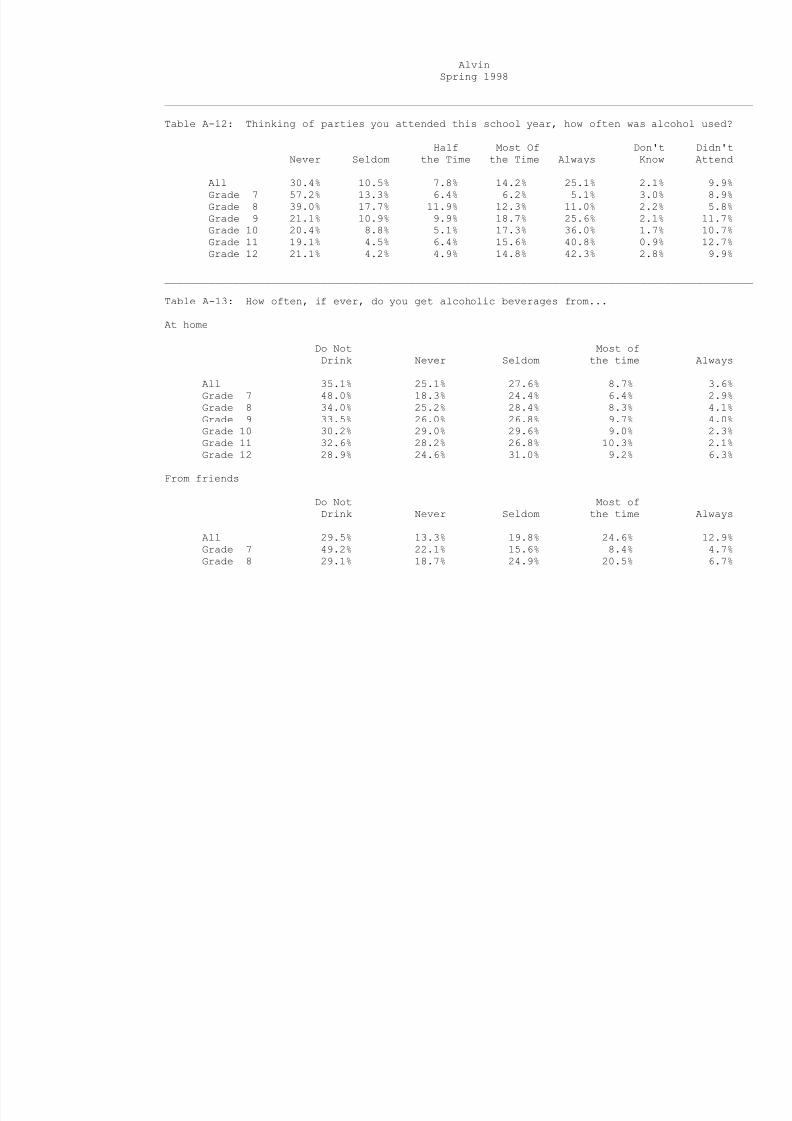
Table A-12: Thinking of parties you attended this school year, how often was alcohol used?
Half Most Of Don't Didn'tNever Seldom the Time the Time Always Know Attend
All 30.4% 10.5% 7.8% 14.2% 25.1% 2.1% 9.9%Grade 7 57.2% 13.3% 6.4% 6.2% 5.1% 3.0% 8.9%Grade 8 39.0% 17.7% 11.9% 12.3% 11.0% 2.2% 5.8%Grade 9 21.1% 10.9% 9.9% 18.7% 25.6% 2.1% 11.7%Grade 10 20.4% 8.8% 5.1% 17.3% 36.0% 1.7% 10.7%Grade 11 19.1% 4.5% 6.4% 15.6% 40.8% 0.9% 12.7%Grade 12 21.1% 4.2% 4.9% 14.8% 42.3% 2.8% 9.9%
______________________________________________________________________________________________
Table A-13: How often, if ever, do you get alcoholic beverages from...
At home
Do Not Most ofDrink Never Seldom the time Always
All 35.1% 25.1% 27.6% 8.7% 3.6%Grade 7 48.0% 18.3% 24.4% 6.4% 2.9%Grade 8 34.0% 25.2% 28.4% 8.3% 4.1%
Grade 9 33.5% 26.0% 26.8% 9.7% 4.0%Grade 10 30.2% 29.0% 29.6% 9.0% 2.3%Grade 11 32.6% 28.2% 26.8% 10.3% 2.1%Grade 12 28.9% 24.6% 31.0% 9.2% 6.3%
From friends
Do Not Most ofDrink Never Seldom the time Always
All 29.5% 13.3% 19.8% 24.6% 12.9%Grade 7 49.2% 22.1% 15.6% 8.4% 4.7%Grade 8 29.1% 18.7% 24.9% 20.5% 6.7%
8/14/2019 BRAZORIA COUNTY - Alvin ISD - 1998 Texas School Survey of Drug and Alcohol Use
http://slidepdf.com/reader/full/brazoria-county-alvin-isd-1998-texas-school-survey-of-drug-and-alcohol 24/213
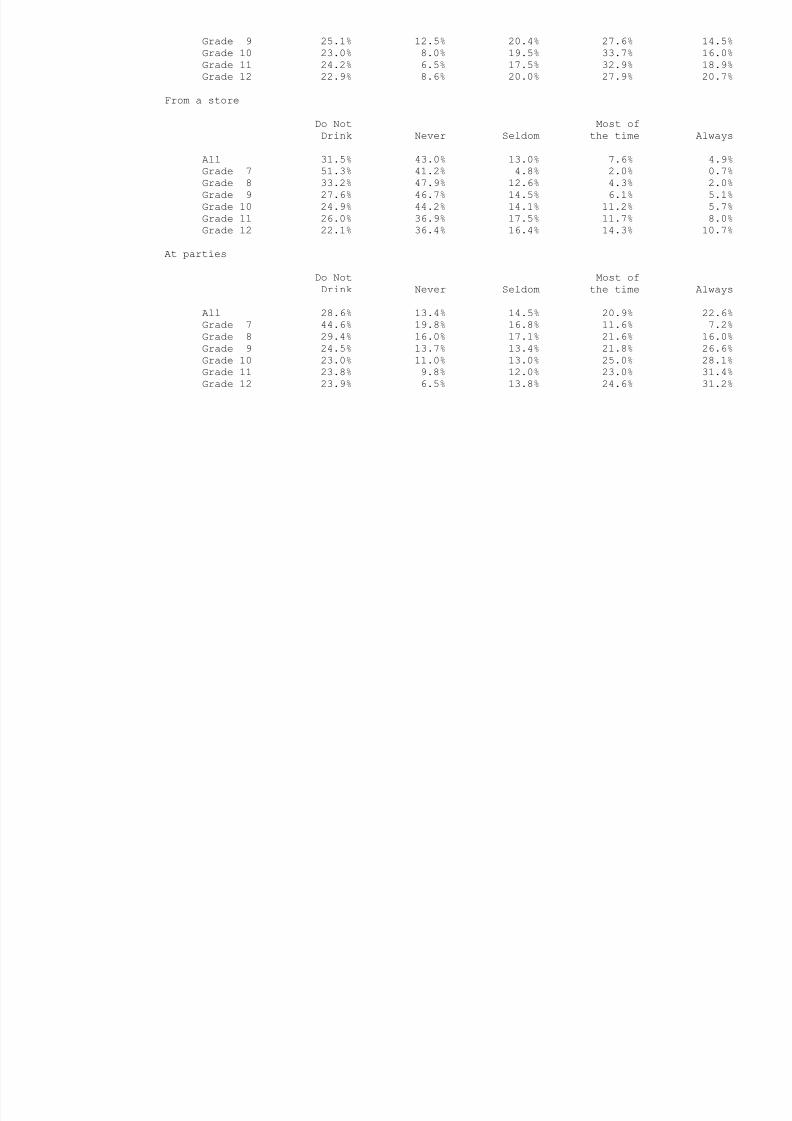
Grade 9 25.1% 12.5% 20.4% 27.6% 14.5%Grade 10 23.0% 8.0% 19.5% 33.7% 16.0%Grade 11 24.2% 6.5% 17.5% 32.9% 18.9%Grade 12 22.9% 8.6% 20.0% 27.9% 20.7%
From a store
Do Not Most ofDrink Never Seldom the time Always
All 31.5% 43.0% 13.0% 7.6% 4.9%Grade 7 51.3% 41.2% 4.8% 2.0% 0.7%Grade 8 33.2% 47.9% 12.6% 4.3% 2.0%Grade 9 27.6% 46.7% 14.5% 6.1% 5.1%Grade 10 24.9% 44.2% 14.1% 11.2% 5.7%Grade 11 26.0% 36.9% 17.5% 11.7% 8.0%Grade 12 22.1% 36.4% 16.4% 14.3% 10.7%
At parties
Do Not Most ofDrink Never Seldom the time Always
All 28.6% 13.4% 14.5% 20.9% 22.6%Grade 7 44.6% 19.8% 16.8% 11.6% 7.2%Grade 8 29.4% 16.0% 17.1% 21.6% 16.0%Grade 9 24.5% 13.7% 13.4% 21.8% 26.6%Grade 10 23.0% 11.0% 13.0% 25.0% 28.1%Grade 11 23.8% 9.8% 12.0% 23.0% 31.4%Grade 12 23.9% 6.5% 13.8% 24.6% 31.2%
8/14/2019 BRAZORIA COUNTY - Alvin ISD - 1998 Texas School Survey of Drug and Alcohol Use
http://slidepdf.com/reader/full/brazoria-county-alvin-isd-1998-texas-school-survey-of-drug-and-alcohol 25/213
AlvinSpring 1998
______________________________________________________________________________________________
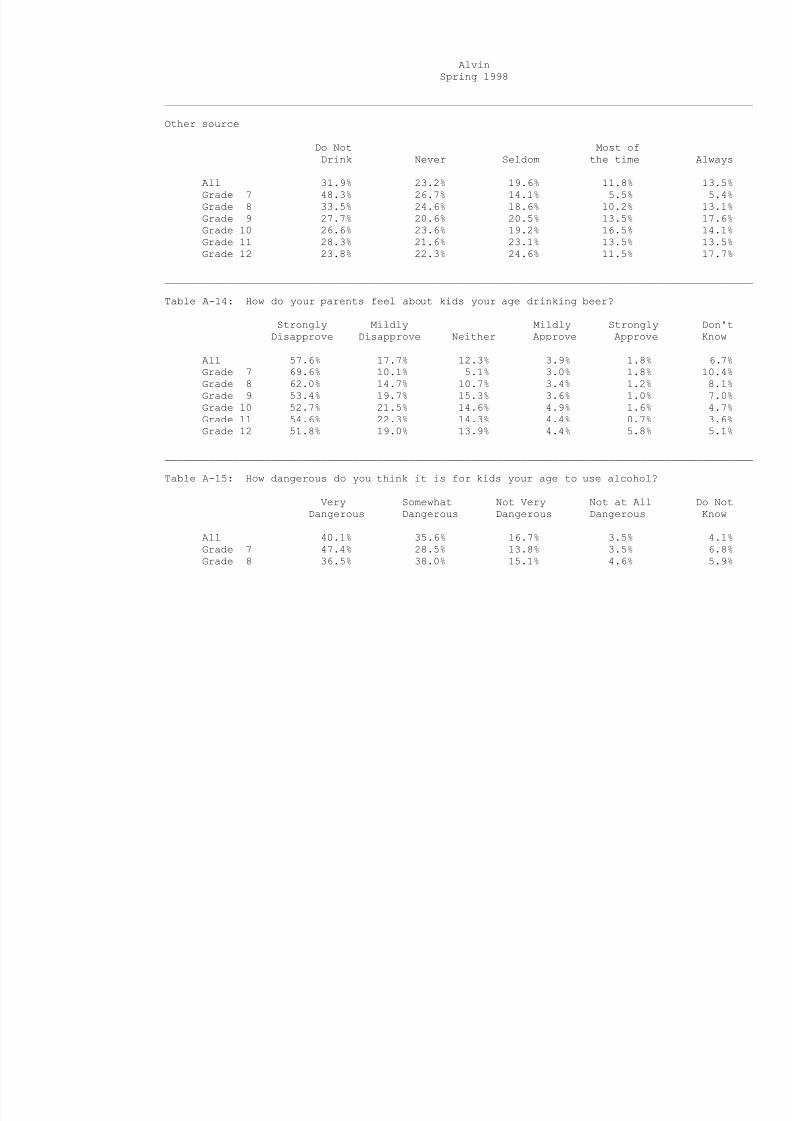
Other source
Do Not Most ofDrink Never Seldom the time Always
All 31.9% 23.2% 19.6% 11.8% 13.5%Grade 7 48.3% 26.7% 14.1% 5.5% 5.4%Grade 8 33.5% 24.6% 18.6% 10.2% 13.1%Grade 9 27.7% 20.6% 20.5% 13.5% 17.6%Grade 10 26.6% 23.6% 19.2% 16.5% 14.1%Grade 11 28.3% 21.6% 23.1% 13.5% 13.5%Grade 12 23.8% 22.3% 24.6% 11.5% 17.7%
______________________________________________________________________________________________
Table A-14: How do your parents feel about kids your age drinking beer?
Strongly Mildly Mildly Strongly Don'tDisapprove Disapprove Neither Approve Approve Know
All 57.6% 17.7% 12.3% 3.9% 1.8% 6.7%Grade 7 69.6% 10.1% 5.1% 3.0% 1.8% 10.4%Grade 8 62.0% 14.7% 10.7% 3.4% 1.2% 8.1%Grade 9 53.4% 19.7% 15.3% 3.6% 1.0% 7.0%Grade 10 52.7% 21.5% 14.6% 4.9% 1.6% 4.7%
Grade 11 54.6% 22.3% 14.3% 4.4% 0.7% 3.6%Grade 12 51.8% 19.0% 13.9% 4.4% 5.8% 5.1%
______________________________________________________________________________________________
Table A-15: How dangerous do you think it is for kids your age to use alcohol?
Very Somewhat Not Very Not at All Do NotDangerous Dangerous Dangerous Dangerous Know
All 40.1% 35.6% 16.7% 3.5% 4.1%Grade 7 47.4% 28.5% 13.8% 3.5% 6.8%Grade 8 36.5% 38.0% 15.1% 4.6% 5.9%

8/14/2019 BRAZORIA COUNTY - Alvin ISD - 1998 Texas School Survey of Drug and Alcohol Use
http://slidepdf.com/reader/full/brazoria-county-alvin-isd-1998-texas-school-survey-of-drug-and-alcohol 26/213
Grade 9 37.7% 35.6% 20.3% 3.7% 2.8%Grade 10 41.0% 36.7% 16.9% 3.5% 1.9%Grade 11 40.8% 38.3% 15.5% 1.9% 3.4%Grade 12 37.3% 38.1% 17.9% 3.7% 3.0%

8/14/2019 BRAZORIA COUNTY - Alvin ISD - 1998 Texas School Survey of Drug and Alcohol Use
http://slidepdf.com/reader/full/brazoria-county-alvin-isd-1998-texas-school-survey-of-drug-and-alcohol 27/213
8/14/2019 BRAZORIA COUNTY - Alvin ISD - 1998 Texas School Survey of Drug and Alcohol Use
http://slidepdf.com/reader/full/brazoria-county-alvin-isd-1998-texas-school-survey-of-drug-and-alcohol 28/213
AlvinSpring 1998
______________________________________________________________________________________________
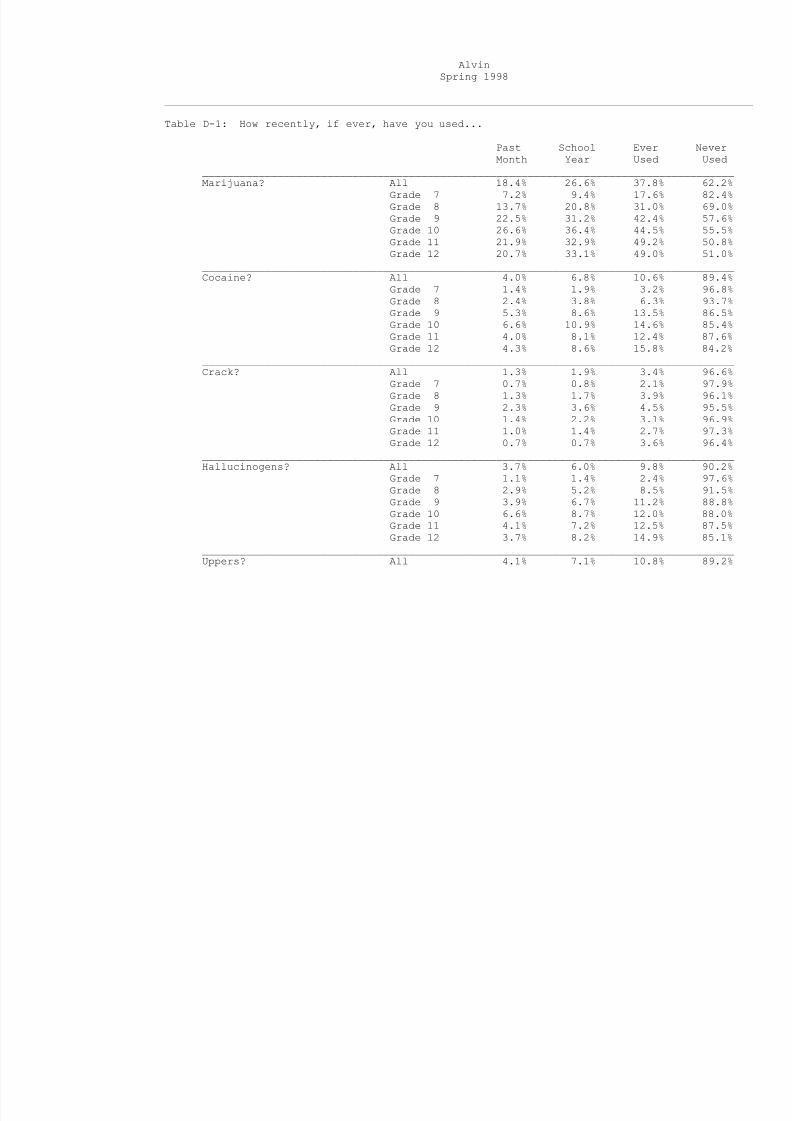
Table D-1: How recently, if ever, have you used...
Past School Ever NeverMonth Year Used Used
_____________________________________________________________________________________Marijuana? All 18.4% 26.6% 37.8% 62.2%
Grade 7 7.2% 9.4% 17.6% 82.4%Grade 8 13.7% 20.8% 31.0% 69.0%Grade 9 22.5% 31.2% 42.4% 57.6%Grade 10 26.6% 36.4% 44.5% 55.5%Grade 11 21.9% 32.9% 49.2% 50.8%Grade 12 20.7% 33.1% 49.0% 51.0%
_____________________________________________________________________________________
Cocaine? All 4.0% 6.8% 10.6% 89.4%Grade 7 1.4% 1.9% 3.2% 96.8%Grade 8 2.4% 3.8% 6.3% 93.7%Grade 9 5.3% 8.6% 13.5% 86.5%Grade 10 6.6% 10.9% 14.6% 85.4%Grade 11 4.0% 8.1% 12.4% 87.6%Grade 12 4.3% 8.6% 15.8% 84.2%
_____________________________________________________________________________________Crack? All 1.3% 1.9% 3.4% 96.6%
Grade 7 0.7% 0.8% 2.1% 97.9%Grade 8 1.3% 1.7% 3.9% 96.1%Grade 9 2.3% 3.6% 4.5% 95.5%
Grade 10 1.4% 2.2% 3.1% 96.9%Grade 11 1.0% 1.4% 2.7% 97.3%Grade 12 0.7% 0.7% 3.6% 96.4%
_____________________________________________________________________________________Hallucinogens? All 3.7% 6.0% 9.8% 90.2%
Grade 7 1.1% 1.4% 2.4% 97.6%Grade 8 2.9% 5.2% 8.5% 91.5%Grade 9 3.9% 6.7% 11.2% 88.8%Grade 10 6.6% 8.7% 12.0% 88.0%Grade 11 4.1% 7.2% 12.5% 87.5%Grade 12 3.7% 8.2% 14.9% 85.1%
_____________________________________________________________________________________Uppers? All 4.1% 7.1% 10.8% 89.2%
8/14/2019 BRAZORIA COUNTY - Alvin ISD - 1998 Texas School Survey of Drug and Alcohol Use
http://slidepdf.com/reader/full/brazoria-county-alvin-isd-1998-texas-school-survey-of-drug-and-alcohol 29/213
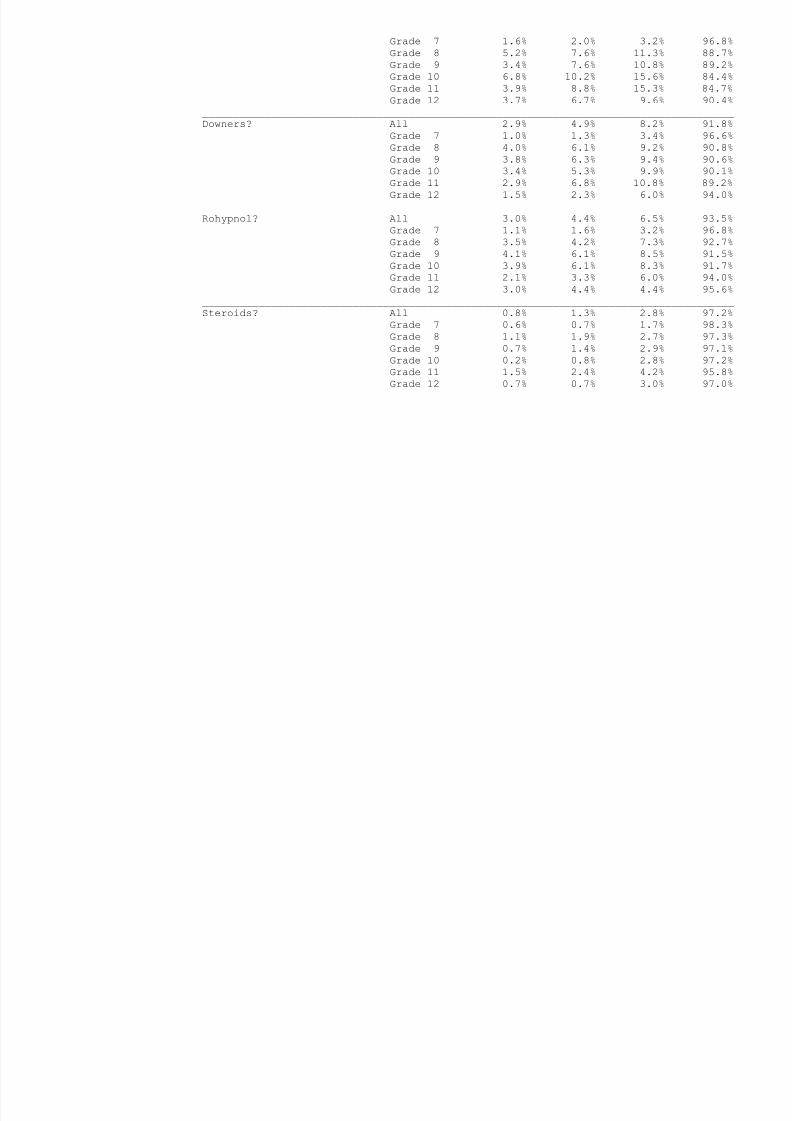
Grade 7 1.6% 2.0% 3.2% 96.8%Grade 8 5.2% 7.6% 11.3% 88.7%Grade 9 3.4% 7.6% 10.8% 89.2%Grade 10 6.8% 10.2% 15.6% 84.4%Grade 11 3.9% 8.8% 15.3% 84.7%Grade 12 3.7% 6.7% 9.6% 90.4%
_____________________________________________________________________________________Downers? All 2.9% 4.9% 8.2% 91.8%
Grade 7 1.0% 1.3% 3.4% 96.6%Grade 8 4.0% 6.1% 9.2% 90.8%Grade 9 3.8% 6.3% 9.4% 90.6%Grade 10 3.4% 5.3% 9.9% 90.1%Grade 11 2.9% 6.8% 10.8% 89.2%Grade 12 1.5% 2.3% 6.0% 94.0%
_____________________________________________________________________________________Rohypnol? All 3.0% 4.4% 6.5% 93.5%
Grade 7 1.1% 1.6% 3.2% 96.8%Grade 8 3.5% 4.2% 7.3% 92.7%Grade 9 4.1% 6.1% 8.5% 91.5%Grade 10 3.9% 6.1% 8.3% 91.7%
Grade 11 2.1% 3.3% 6.0% 94.0%Grade 12 3.0% 4.4% 4.4% 95.6%_____________________________________________________________________________________Steroids? All 0.8% 1.3% 2.8% 97.2%
Grade 7 0.6% 0.7% 1.7% 98.3%Grade 8 1.1% 1.9% 2.7% 97.3%Grade 9 0.7% 1.4% 2.9% 97.1%Grade 10 0.2% 0.8% 2.8% 97.2%Grade 11 1.5% 2.4% 4.2% 95.8%Grade 12 0.7% 0.7% 3.0% 97.0%
8/14/2019 BRAZORIA COUNTY - Alvin ISD - 1998 Texas School Survey of Drug and Alcohol Use
http://slidepdf.com/reader/full/brazoria-county-alvin-isd-1998-texas-school-survey-of-drug-and-alcohol 30/213
AlvinSpring 1998
______________________________________________________________________________________________
Past School Ever NeverMonth Year Used Used
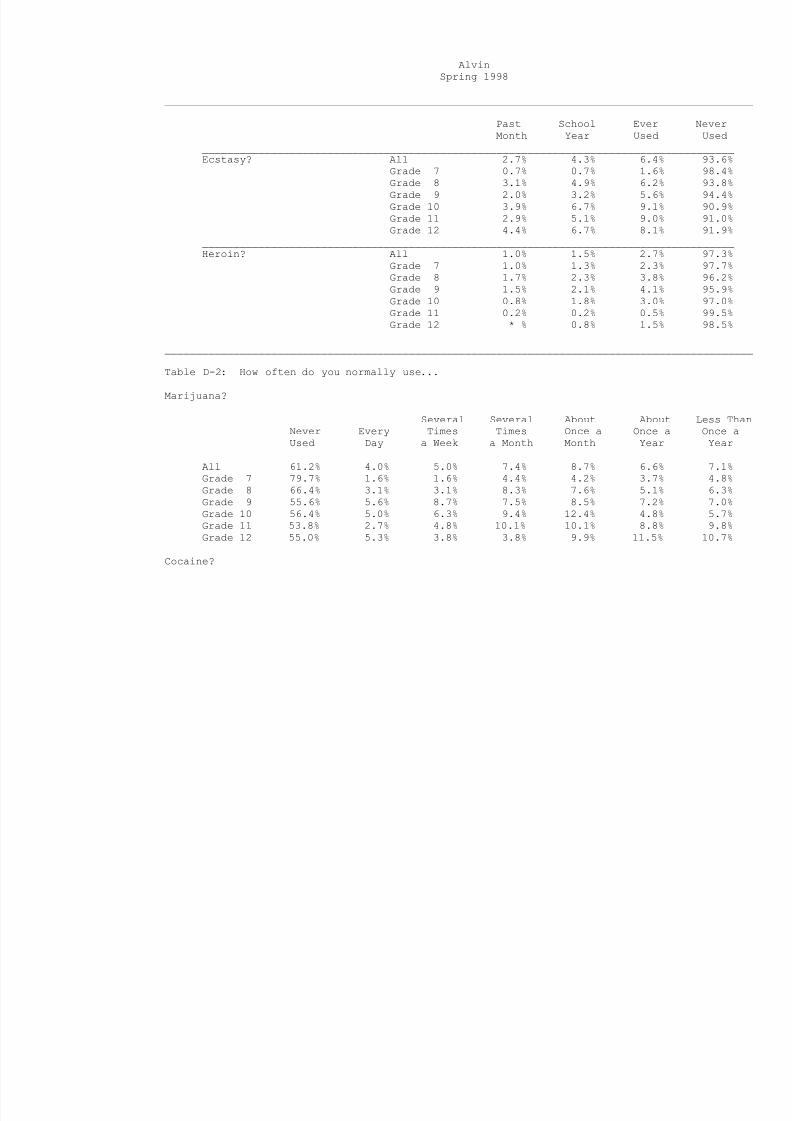
_____________________________________________________________________________________Ecstasy? All 2.7% 4.3% 6.4% 93.6%
Grade 7 0.7% 0.7% 1.6% 98.4%Grade 8 3.1% 4.9% 6.2% 93.8%Grade 9 2.0% 3.2% 5.6% 94.4%Grade 10 3.9% 6.7% 9.1% 90.9%Grade 11 2.9% 5.1% 9.0% 91.0%Grade 12 4.4% 6.7% 8.1% 91.9%
_____________________________________________________________________________________Heroin? All 1.0% 1.5% 2.7% 97.3%
Grade 7 1.0% 1.3% 2.3% 97.7%
Grade 8 1.7% 2.3% 3.8% 96.2%Grade 9 1.5% 2.1% 4.1% 95.9%Grade 10 0.8% 1.8% 3.0% 97.0%Grade 11 0.2% 0.2% 0.5% 99.5%Grade 12 * % 0.8% 1.5% 98.5%
______________________________________________________________________________________________
Table D-2: How often do you normally use...
Marijuana?
Several Several About About Less ThanNever Every Times Times Once a Once a Once aUsed Day a Week a Month Month Year Year
All 61.2% 4.0% 5.0% 7.4% 8.7% 6.6% 7.1%Grade 7 79.7% 1.6% 1.6% 4.4% 4.2% 3.7% 4.8%Grade 8 66.4% 3.1% 3.1% 8.3% 7.6% 5.1% 6.3%Grade 9 55.6% 5.6% 8.7% 7.5% 8.5% 7.2% 7.0%Grade 10 56.4% 5.0% 6.3% 9.4% 12.4% 4.8% 5.7%Grade 11 53.8% 2.7% 4.8% 10.1% 10.1% 8.8% 9.8%Grade 12 55.0% 5.3% 3.8% 3.8% 9.9% 11.5% 10.7%
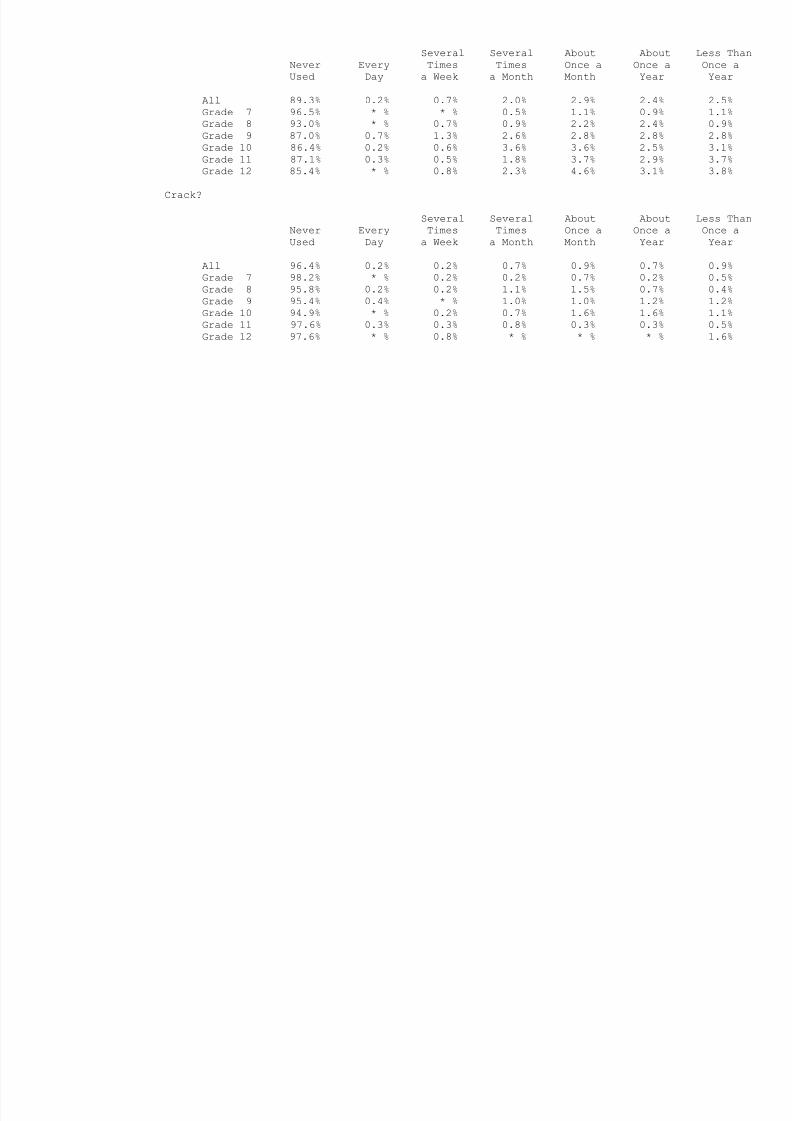
Cocaine?
8/14/2019 BRAZORIA COUNTY - Alvin ISD - 1998 Texas School Survey of Drug and Alcohol Use
http://slidepdf.com/reader/full/brazoria-county-alvin-isd-1998-texas-school-survey-of-drug-and-alcohol 31/213
Several Several About About Less Than
Never Every Times Times Once a Once a Once aUsed Day a Week a Month Month Year Year
All 89.3% 0.2% 0.7% 2.0% 2.9% 2.4% 2.5%Grade 7 96.5% * % * % 0.5% 1.1% 0.9% 1.1%Grade 8 93.0% * % 0.7% 0.9% 2.2% 2.4% 0.9%Grade 9 87.0% 0.7% 1.3% 2.6% 2.8% 2.8% 2.8%Grade 10 86.4% 0.2% 0.6% 3.6% 3.6% 2.5% 3.1%Grade 11 87.1% 0.3% 0.5% 1.8% 3.7% 2.9% 3.7%Grade 12 85.4% * % 0.8% 2.3% 4.6% 3.1% 3.8%
Crack?
Several Several About About Less ThanNever Every Times Times Once a Once a Once aUsed Day a Week a Month Month Year Year
All 96.4% 0.2% 0.2% 0.7% 0.9% 0.7% 0.9%
Grade 7 98.2% * % 0.2% 0.2% 0.7% 0.2% 0.5%Grade 8 95.8% 0.2% 0.2% 1.1% 1.5% 0.7% 0.4%Grade 9 95.4% 0.4% * % 1.0% 1.0% 1.2% 1.2%Grade 10 94.9% * % 0.2% 0.7% 1.6% 1.6% 1.1%Grade 11 97.6% 0.3% 0.3% 0.8% 0.3% 0.3% 0.5%Grade 12 97.6% * % 0.8% * % * % * % 1.6%
8/14/2019 BRAZORIA COUNTY - Alvin ISD - 1998 Texas School Survey of Drug and Alcohol Use
http://slidepdf.com/reader/full/brazoria-county-alvin-isd-1998-texas-school-survey-of-drug-and-alcohol 32/213
AlvinSpring 1998
______________________________________________________________________________________________
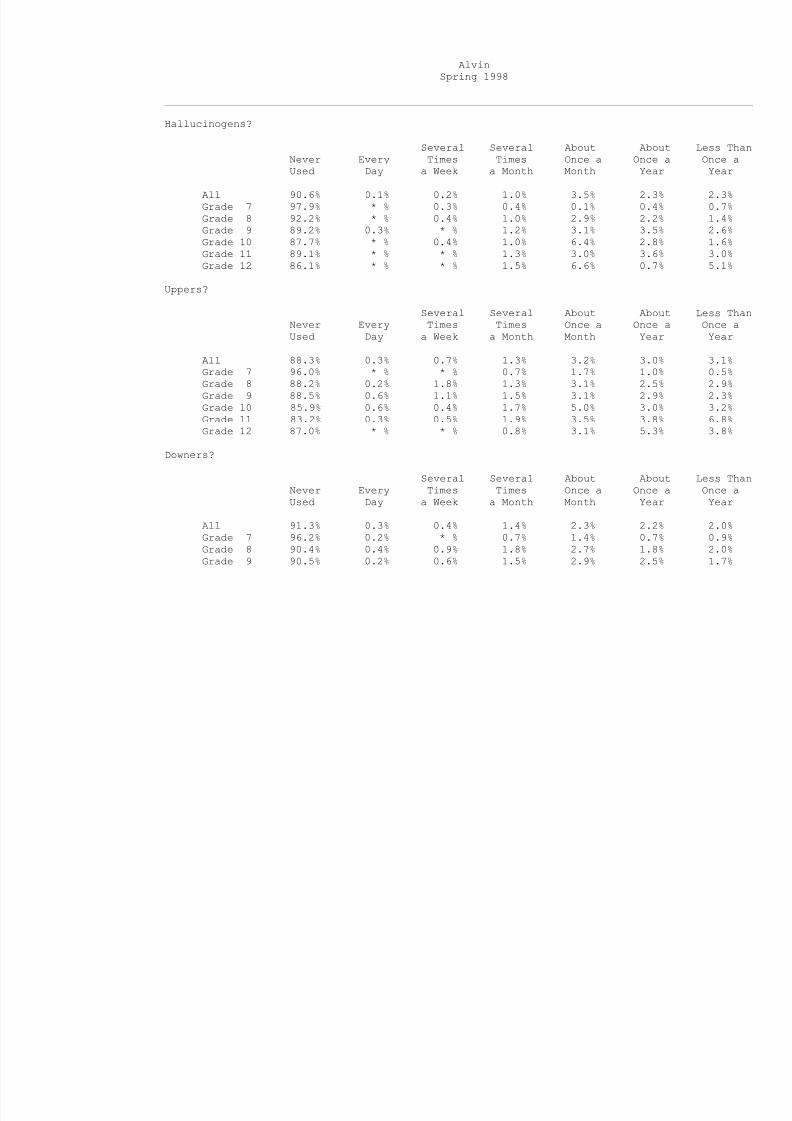
Hallucinogens?
Several Several About About Less ThanNever Every Times Times Once a Once a Once aUsed Day a Week a Month Month Year Year
All 90.6% 0.1% 0.2% 1.0% 3.5% 2.3% 2.3%Grade 7 97.9% * % 0.3% 0.4% 0.1% 0.4% 0.7%Grade 8 92.2% * % 0.4% 1.0% 2.9% 2.2% 1.4%Grade 9 89.2% 0.3% * % 1.2% 3.1% 3.5% 2.6%Grade 10 87.7% * % 0.4% 1.0% 6.4% 2.8% 1.6%Grade 11 89.1% * % * % 1.3% 3.0% 3.6% 3.0%Grade 12 86.1% * % * % 1.5% 6.6% 0.7% 5.1%
Uppers?
Several Several About About Less ThanNever Every Times Times Once a Once a Once aUsed Day a Week a Month Month Year Year
All 88.3% 0.3% 0.7% 1.3% 3.2% 3.0% 3.1%Grade 7 96.0% * % * % 0.7% 1.7% 1.0% 0.5%Grade 8 88.2% 0.2% 1.8% 1.3% 3.1% 2.5% 2.9%Grade 9 88.5% 0.6% 1.1% 1.5% 3.1% 2.9% 2.3%Grade 10 85.9% 0.6% 0.4% 1.7% 5.0% 3.0% 3.2%
Grade 11 83.2% 0.3% 0.5% 1.9% 3.5% 3.8% 6.8%Grade 12 87.0% * % * % 0.8% 3.1% 5.3% 3.8%
Downers?
Several Several About About Less ThanNever Every Times Times Once a Once a Once aUsed Day a Week a Month Month Year Year
All 91.3% 0.3% 0.4% 1.4% 2.3% 2.2% 2.0%Grade 7 96.2% 0.2% * % 0.7% 1.4% 0.7% 0.9%Grade 8 90.4% 0.4% 0.9% 1.8% 2.7% 1.8% 2.0%Grade 9 90.5% 0.2% 0.6% 1.5% 2.9% 2.5% 1.7%

8/14/2019 BRAZORIA COUNTY - Alvin ISD - 1998 Texas School Survey of Drug and Alcohol Use
http://slidepdf.com/reader/full/brazoria-county-alvin-isd-1998-texas-school-survey-of-drug-and-alcohol 33/213
Grade 10 90.2% 0.2% 0.7% 2.0% 3.0% 2.0% 2.0%Grade 11 89.2% 0.5% 0.3% 1.1% 3.2% 1.9% 3.8%Grade 12 91.4% * % * % 1.6% * % 4.7% 2.3%
Rohypnol?
Several Several About About Less ThanNever Every Times Times Once a Once a Once aUsed Day a Week a Month Month Year Year
All 93.6% 0.2% 0.6% 1.0% 1.6% 1.5% 1.5%Grade 7 97.3% * % 0.3% 0.9% 0.4% 0.1% 0.9%Grade 8 92.6% 0.2% 1.2% 0.8% 2.2% 1.6% 1.4%Grade 9 91.4% 0.5% 1.2% 1.4% 2.5% 2.1% 0.7%Grade 10 93.0% * % 0.2% 1.4% 1.6% 1.8% 1.8%Grade 11 93.5% 0.5% 0.3% 0.8% * % 2.8% 2.3%Grade 12 94.8% * % * % 0.7% 2.2% * % 2.2%
Steroids?
Several Several About About Less ThanNever Every Times Times Once a Once a Once aUsed Day a Week a Month Month Year Year
All 97.0% 0.4% 0.1% 0.5% 0.3% 0.5% 1.1%Grade 7 97.8% 0.4% * % 0.4% 0.7% * % 0.7%Grade 8 97.4% 0.5% 0.2% 0.7% * % 0.5% 0.7%Grade 9 97.4% 0.4% 0.2% 0.4% 0.2% 0.8% 0.6%Grade 10 96.8% 0.5% * % * % 0.7% 0.7% 1.4%Grade 11 96.4% * % 0.3% 0.8% * % 1.1% 1.4%Grade 12 96.1% 0.8% * % 0.8% * % * % 2.3%
8/14/2019 BRAZORIA COUNTY - Alvin ISD - 1998 Texas School Survey of Drug and Alcohol Use
http://slidepdf.com/reader/full/brazoria-county-alvin-isd-1998-texas-school-survey-of-drug-and-alcohol 34/213
AlvinSpring 1998
______________________________________________________________________________________________
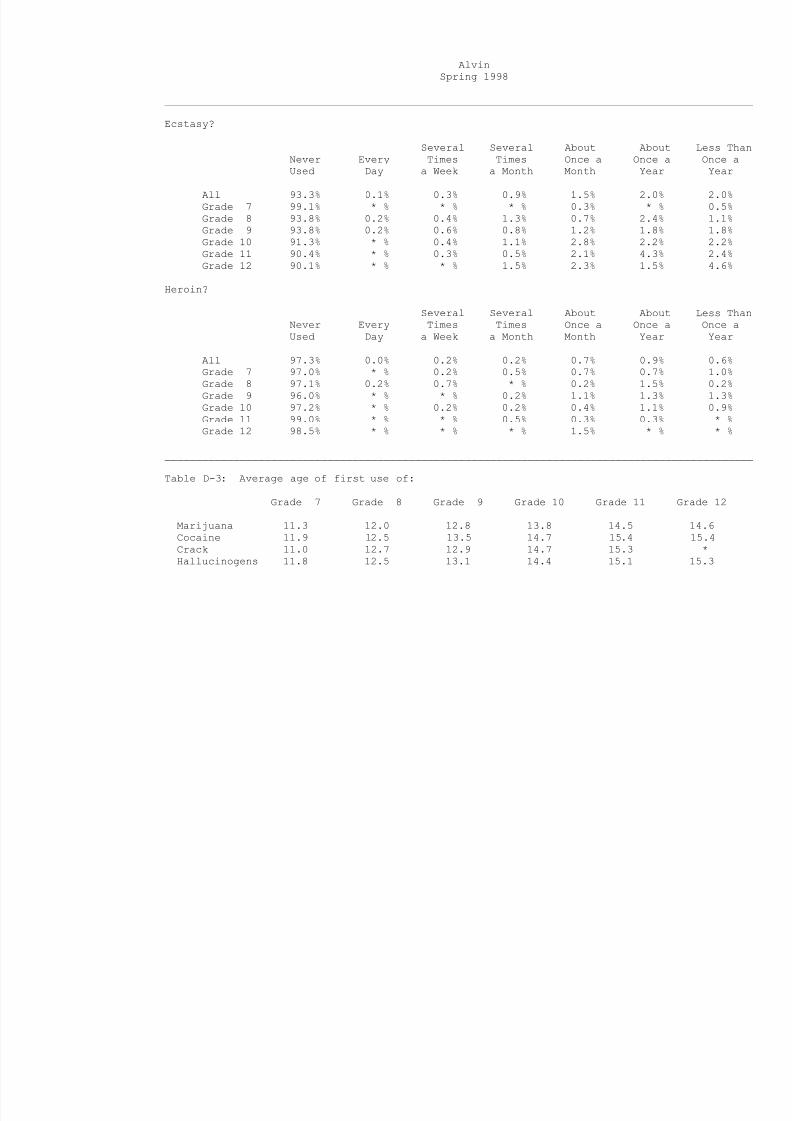
Ecstasy?
Several Several About About Less ThanNever Every Times Times Once a Once a Once aUsed Day a Week a Month Month Year Year
All 93.3% 0.1% 0.3% 0.9% 1.5% 2.0% 2.0%Grade 7 99.1% * % * % * % 0.3% * % 0.5%Grade 8 93.8% 0.2% 0.4% 1.3% 0.7% 2.4% 1.1%Grade 9 93.8% 0.2% 0.6% 0.8% 1.2% 1.8% 1.8%Grade 10 91.3% * % 0.4% 1.1% 2.8% 2.2% 2.2%Grade 11 90.4% * % 0.3% 0.5% 2.1% 4.3% 2.4%Grade 12 90.1% * % * % 1.5% 2.3% 1.5% 4.6%
Heroin?
Several Several About About Less ThanNever Every Times Times Once a Once a Once aUsed Day a Week a Month Month Year Year
All 97.3% 0.0% 0.2% 0.2% 0.7% 0.9% 0.6%Grade 7 97.0% * % 0.2% 0.5% 0.7% 0.7% 1.0%Grade 8 97.1% 0.2% 0.7% * % 0.2% 1.5% 0.2%Grade 9 96.0% * % * % 0.2% 1.1% 1.3% 1.3%Grade 10 97.2% * % 0.2% 0.2% 0.4% 1.1% 0.9%
Grade 11 99.0% * % * % 0.5% 0.3% 0.3% * %Grade 12 98.5% * % * % * % 1.5% * % * %
______________________________________________________________________________________________
Table D-3: Average age of first use of:
Grade 7 Grade 8 Grade 9 Grade 10 Grade 11 Grade 12
Marijuana 11.3 12.0 12.8 13.8 14.5 14.6Cocaine 11.9 12.5 13.5 14.7 15.4 15.4Crack 11.0 12.7 12.9 14.7 15.3 *Hallucinogens 11.8 12.5 13.1 14.4 15.1 15.3
8/14/2019 BRAZORIA COUNTY - Alvin ISD - 1998 Texas School Survey of Drug and Alcohol Use
http://slidepdf.com/reader/full/brazoria-county-alvin-isd-1998-texas-school-survey-of-drug-and-alcohol 35/213
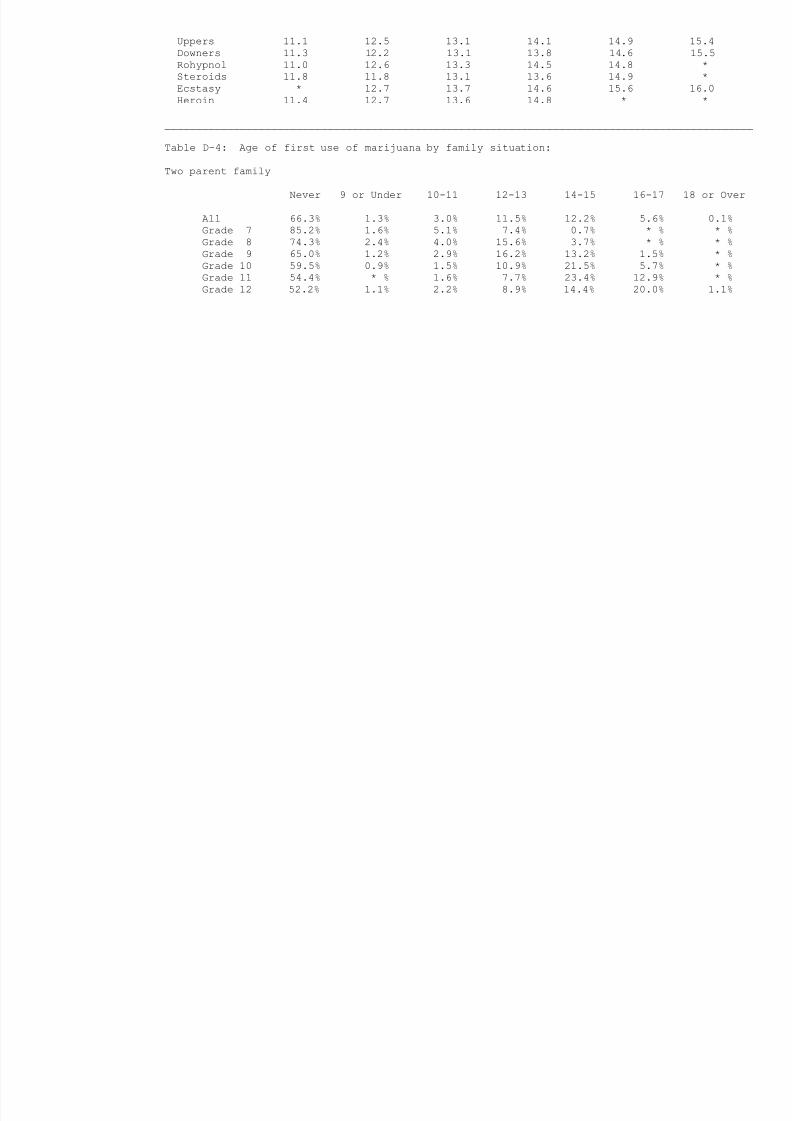
Uppers 11.1 12.5 13.1 14.1 14.9 15.4Downers 11.3 12.2 13.1 13.8 14.6 15.5Rohypnol 11.0 12.6 13.3 14.5 14.8 *Steroids 11.8 11.8 13.1 13.6 14.9 *Ecstasy * 12.7 13.7 14.6 15.6 16.0Heroin 11.4 12.7 13.6 14.8 * *
______________________________________________________________________________________________
Table D-4: Age of first use of marijuana by family situation:
Two parent family
Never 9 or Under 10-11 12-13 14-15 16-17 18 or Over
All 66.3% 1.3% 3.0% 11.5% 12.2% 5.6% 0.1%Grade 7 85.2% 1.6% 5.1% 7.4% 0.7% * % * %Grade 8 74.3% 2.4% 4.0% 15.6% 3.7% * % * %Grade 9 65.0% 1.2% 2.9% 16.2% 13.2% 1.5% * %Grade 10 59.5% 0.9% 1.5% 10.9% 21.5% 5.7% * %
Grade 11 54.4% * % 1.6% 7.7% 23.4% 12.9% * %Grade 12 52.2% 1.1% 2.2% 8.9% 14.4% 20.0% 1.1%
8/14/2019 BRAZORIA COUNTY - Alvin ISD - 1998 Texas School Survey of Drug and Alcohol Use
http://slidepdf.com/reader/full/brazoria-county-alvin-isd-1998-texas-school-survey-of-drug-and-alcohol 36/213
AlvinSpring 1998
______________________________________________________________________________________________
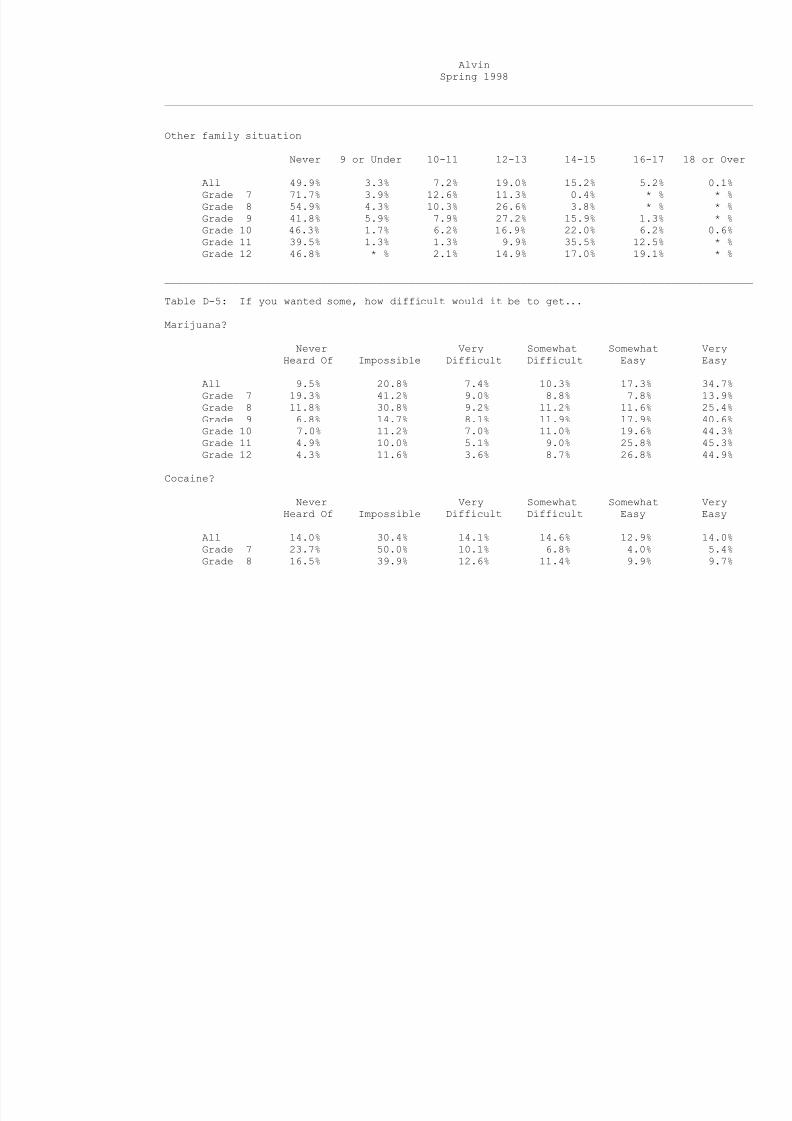
Other family situation
Never 9 or Under 10-11 12-13 14-15 16-17 18 or Over
All 49.9% 3.3% 7.2% 19.0% 15.2% 5.2% 0.1%Grade 7 71.7% 3.9% 12.6% 11.3% 0.4% * % * %Grade 8 54.9% 4.3% 10.3% 26.6% 3.8% * % * %Grade 9 41.8% 5.9% 7.9% 27.2% 15.9% 1.3% * %Grade 10 46.3% 1.7% 6.2% 16.9% 22.0% 6.2% 0.6%Grade 11 39.5% 1.3% 1.3% 9.9% 35.5% 12.5% * %Grade 12 46.8% * % 2.1% 14.9% 17.0% 19.1% * %
______________________________________________________________________________________________
Table D-5: If you wanted some, how difficult would it be to get...
Marijuana?
Never Very Somewhat Somewhat VeryHeard Of Impossible Difficult Difficult Easy Easy
All 9.5% 20.8% 7.4% 10.3% 17.3% 34.7%Grade 7 19.3% 41.2% 9.0% 8.8% 7.8% 13.9%Grade 8 11.8% 30.8% 9.2% 11.2% 11.6% 25.4%
Grade 9 6.8% 14.7% 8.1% 11.9% 17.9% 40.6%Grade 10 7.0% 11.2% 7.0% 11.0% 19.6% 44.3%Grade 11 4.9% 10.0% 5.1% 9.0% 25.8% 45.3%Grade 12 4.3% 11.6% 3.6% 8.7% 26.8% 44.9%
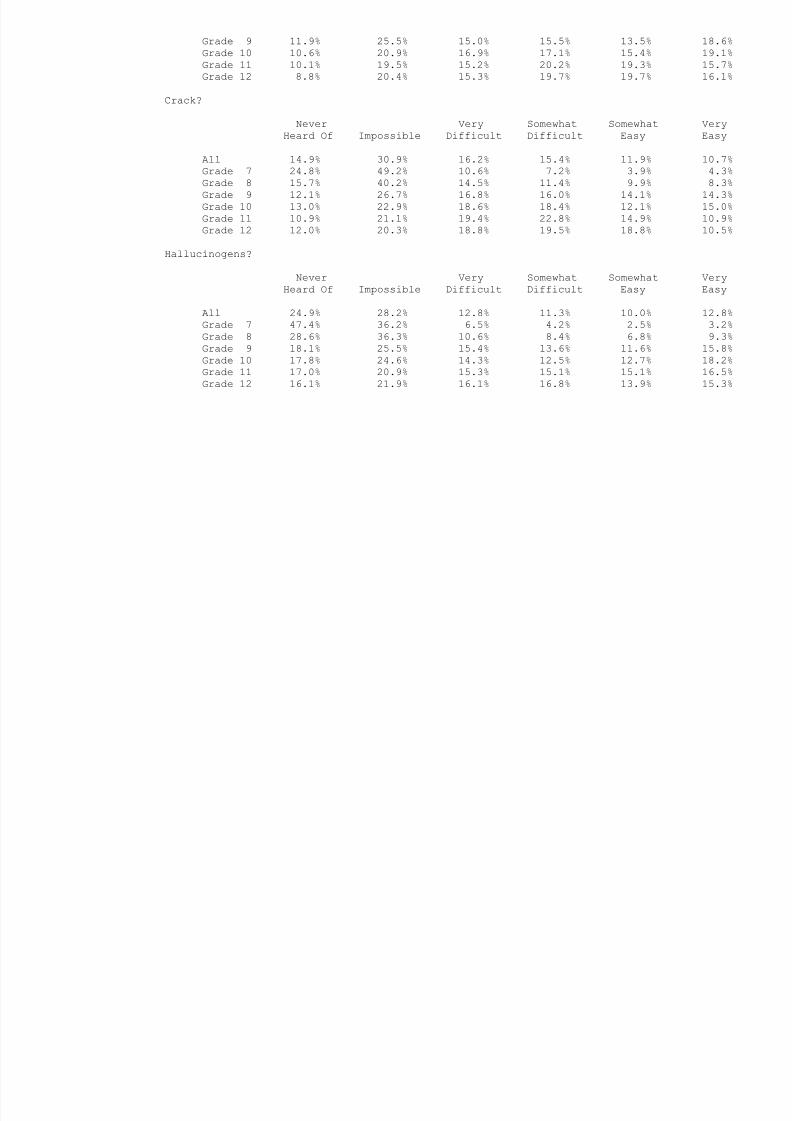
Cocaine?
Never Very Somewhat Somewhat VeryHeard Of Impossible Difficult Difficult Easy Easy
All 14.0% 30.4% 14.1% 14.6% 12.9% 14.0%Grade 7 23.7% 50.0% 10.1% 6.8% 4.0% 5.4%
Grade 8 16.5% 39.9% 12.6% 11.4% 9.9% 9.7%
8/14/2019 BRAZORIA COUNTY - Alvin ISD - 1998 Texas School Survey of Drug and Alcohol Use
http://slidepdf.com/reader/full/brazoria-county-alvin-isd-1998-texas-school-survey-of-drug-and-alcohol 37/213
Grade 9 11.9% 25.5% 15.0% 15.5% 13.5% 18.6%Grade 10 10.6% 20.9% 16.9% 17.1% 15.4% 19.1%Grade 11 10.1% 19.5% 15.2% 20.2% 19.3% 15.7%Grade 12 8.8% 20.4% 15.3% 19.7% 19.7% 16.1%
Crack?
Never Very Somewhat Somewhat VeryHeard Of Impossible Difficult Difficult Easy Easy
All 14.9% 30.9% 16.2% 15.4% 11.9% 10.7%Grade 7 24.8% 49.2% 10.6% 7.2% 3.9% 4.3%Grade 8 15.7% 40.2% 14.5% 11.4% 9.9% 8.3%Grade 9 12.1% 26.7% 16.8% 16.0% 14.1% 14.3%Grade 10 13.0% 22.9% 18.6% 18.4% 12.1% 15.0%Grade 11 10.9% 21.1% 19.4% 22.8% 14.9% 10.9%Grade 12 12.0% 20.3% 18.8% 19.5% 18.8% 10.5%
Hallucinogens?
Never Very Somewhat Somewhat VeryHeard Of Impossible Difficult Difficult Easy Easy
All 24.9% 28.2% 12.8% 11.3% 10.0% 12.8%Grade 7 47.4% 36.2% 6.5% 4.2% 2.5% 3.2%Grade 8 28.6% 36.3% 10.6% 8.4% 6.8% 9.3%Grade 9 18.1% 25.5% 15.4% 13.6% 11.6% 15.8%Grade 10 17.8% 24.6% 14.3% 12.5% 12.7% 18.2%Grade 11 17.0% 20.9% 15.3% 15.1% 15.1% 16.5%Grade 12 16.1% 21.9% 16.1% 16.8% 13.9% 15.3%
8/14/2019 BRAZORIA COUNTY - Alvin ISD - 1998 Texas School Survey of Drug and Alcohol Use
http://slidepdf.com/reader/full/brazoria-county-alvin-isd-1998-texas-school-survey-of-drug-and-alcohol 38/213
AlvinSpring 1998
______________________________________________________________________________________________
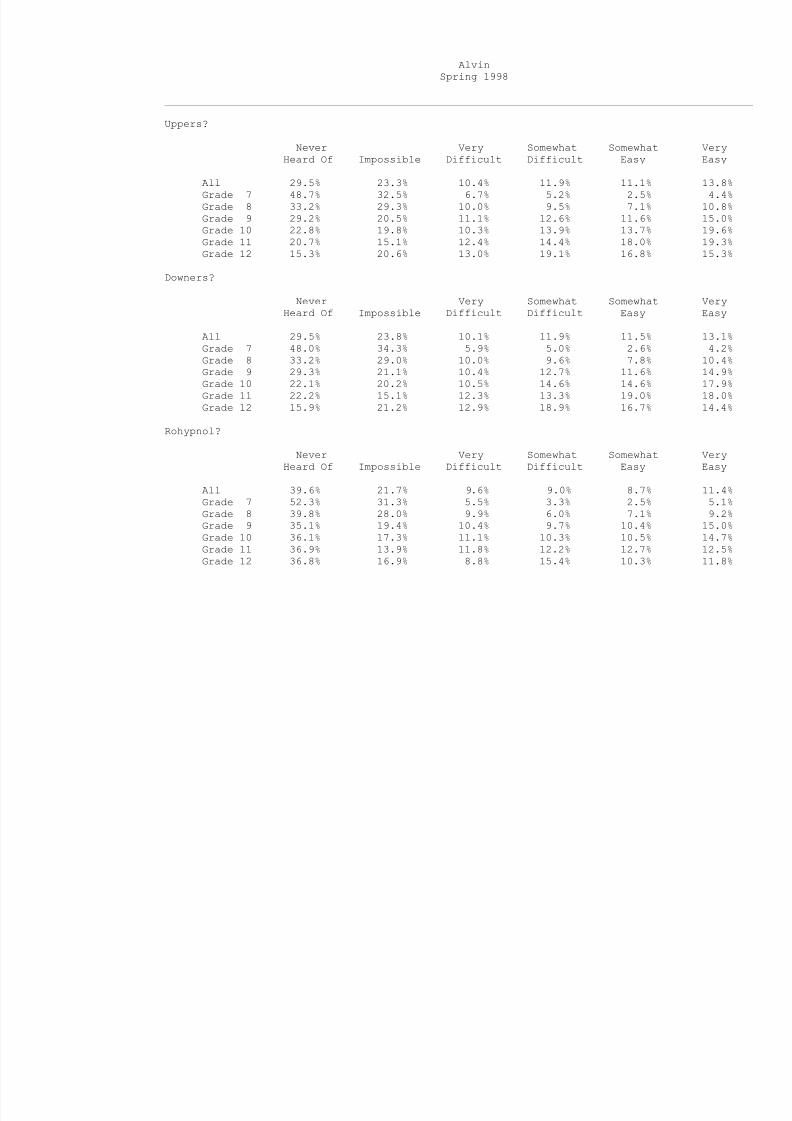
Uppers?
Never Very Somewhat Somewhat VeryHeard Of Impossible Difficult Difficult Easy Easy
All 29.5% 23.3% 10.4% 11.9% 11.1% 13.8%Grade 7 48.7% 32.5% 6.7% 5.2% 2.5% 4.4%Grade 8 33.2% 29.3% 10.0% 9.5% 7.1% 10.8%Grade 9 29.2% 20.5% 11.1% 12.6% 11.6% 15.0%Grade 10 22.8% 19.8% 10.3% 13.9% 13.7% 19.6%Grade 11 20.7% 15.1% 12.4% 14.4% 18.0% 19.3%Grade 12 15.3% 20.6% 13.0% 19.1% 16.8% 15.3%
Downers?
Never Very Somewhat Somewhat VeryHeard Of Impossible Difficult Difficult Easy Easy
All 29.5% 23.8% 10.1% 11.9% 11.5% 13.1%Grade 7 48.0% 34.3% 5.9% 5.0% 2.6% 4.2%Grade 8 33.2% 29.0% 10.0% 9.6% 7.8% 10.4%Grade 9 29.3% 21.1% 10.4% 12.7% 11.6% 14.9%Grade 10 22.1% 20.2% 10.5% 14.6% 14.6% 17.9%Grade 11 22.2% 15.1% 12.3% 13.3% 19.0% 18.0%Grade 12 15.9% 21.2% 12.9% 18.9% 16.7% 14.4%
Rohypnol?
Never Very Somewhat Somewhat VeryHeard Of Impossible Difficult Difficult Easy Easy
All 39.6% 21.7% 9.6% 9.0% 8.7% 11.4%Grade 7 52.3% 31.3% 5.5% 3.3% 2.5% 5.1%Grade 8 39.8% 28.0% 9.9% 6.0% 7.1% 9.2%Grade 9 35.1% 19.4% 10.4% 9.7% 10.4% 15.0%Grade 10 36.1% 17.3% 11.1% 10.3% 10.5% 14.7%Grade 11 36.9% 13.9% 11.8% 12.2% 12.7% 12.5%
Grade 12 36.8% 16.9% 8.8% 15.4% 10.3% 11.8%
8/14/2019 BRAZORIA COUNTY - Alvin ISD - 1998 Texas School Survey of Drug and Alcohol Use
http://slidepdf.com/reader/full/brazoria-county-alvin-isd-1998-texas-school-survey-of-drug-and-alcohol 39/213
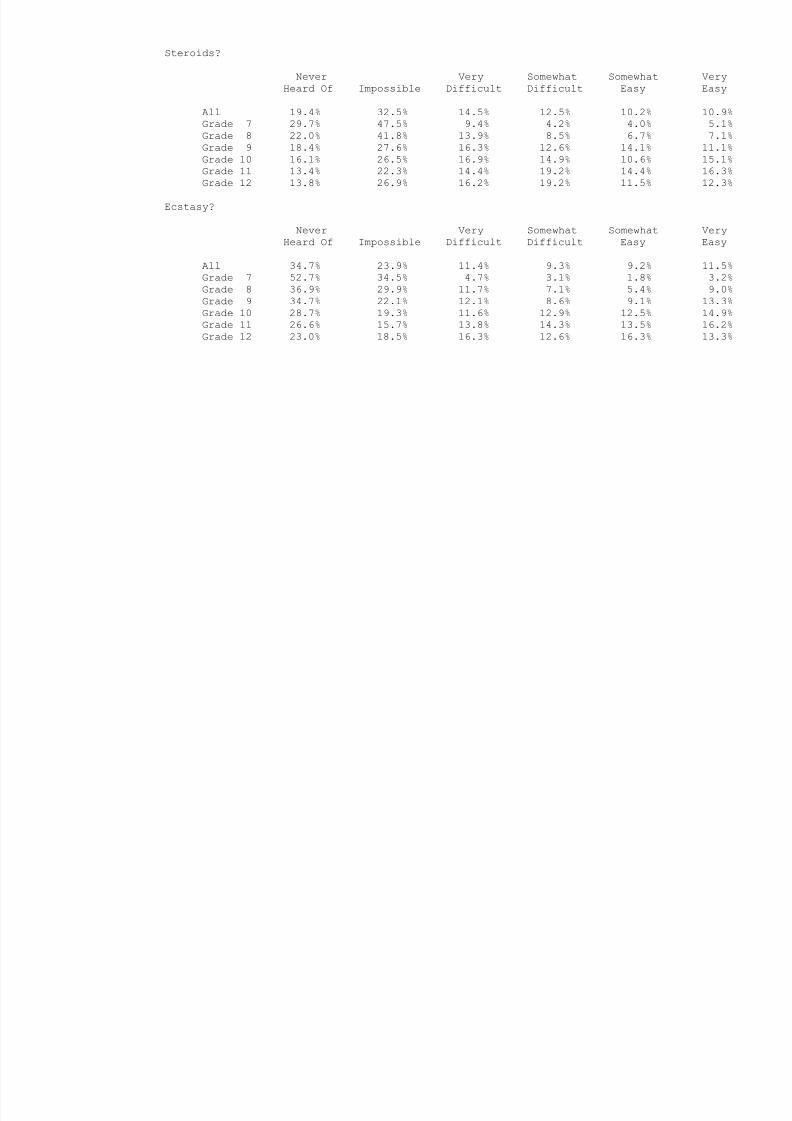
Steroids?
Never Very Somewhat Somewhat VeryHeard Of Impossible Difficult Difficult Easy Easy
All 19.4% 32.5% 14.5% 12.5% 10.2% 10.9%Grade 7 29.7% 47.5% 9.4% 4.2% 4.0% 5.1%Grade 8 22.0% 41.8% 13.9% 8.5% 6.7% 7.1%
Grade 9 18.4% 27.6% 16.3% 12.6% 14.1% 11.1%Grade 10 16.1% 26.5% 16.9% 14.9% 10.6% 15.1%Grade 11 13.4% 22.3% 14.4% 19.2% 14.4% 16.3%Grade 12 13.8% 26.9% 16.2% 19.2% 11.5% 12.3%
Ecstasy?
Never Very Somewhat Somewhat VeryHeard Of Impossible Difficult Difficult Easy Easy
All 34.7% 23.9% 11.4% 9.3% 9.2% 11.5%
Grade 7 52.7% 34.5% 4.7% 3.1% 1.8% 3.2%Grade 8 36.9% 29.9% 11.7% 7.1% 5.4% 9.0%Grade 9 34.7% 22.1% 12.1% 8.6% 9.1% 13.3%Grade 10 28.7% 19.3% 11.6% 12.9% 12.5% 14.9%Grade 11 26.6% 15.7% 13.8% 14.3% 13.5% 16.2%Grade 12 23.0% 18.5% 16.3% 12.6% 16.3% 13.3%
8/14/2019 BRAZORIA COUNTY - Alvin ISD - 1998 Texas School Survey of Drug and Alcohol Use
http://slidepdf.com/reader/full/brazoria-county-alvin-isd-1998-texas-school-survey-of-drug-and-alcohol 40/213
AlvinSpring 1998
______________________________________________________________________________________________
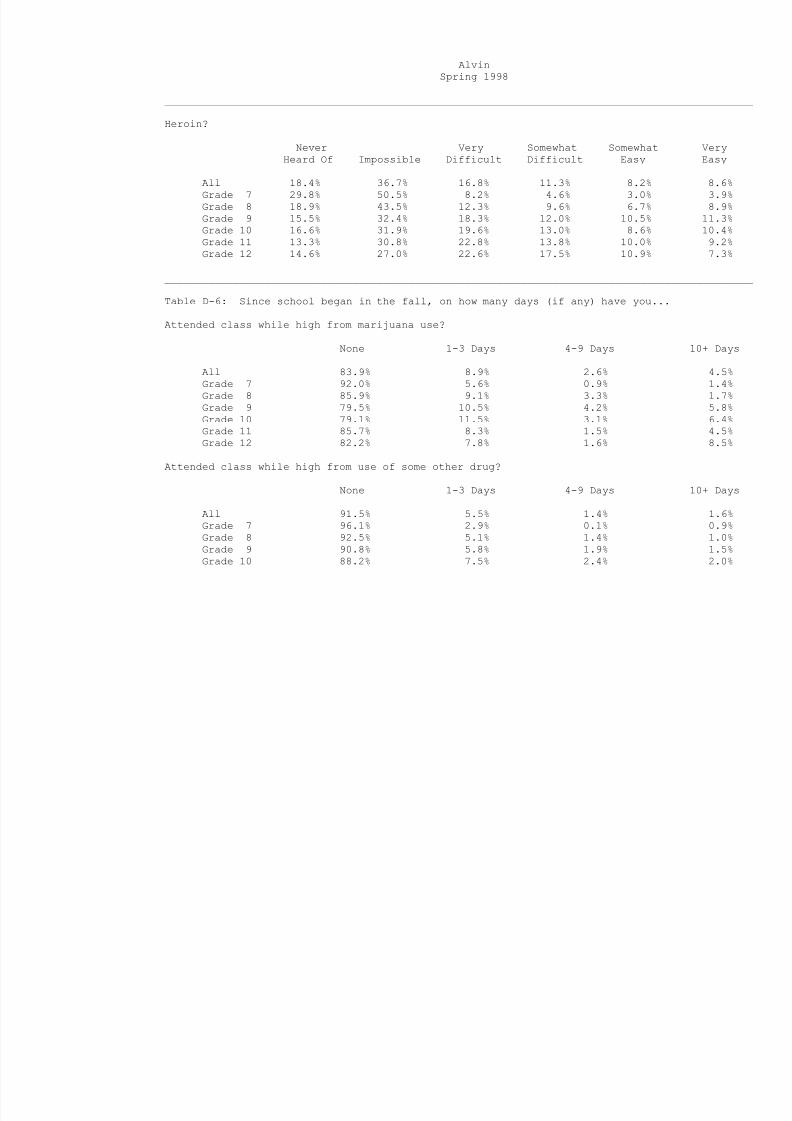
Heroin?
Never Very Somewhat Somewhat VeryHeard Of Impossible Difficult Difficult Easy Easy
All 18.4% 36.7% 16.8% 11.3% 8.2% 8.6%Grade 7 29.8% 50.5% 8.2% 4.6% 3.0% 3.9%Grade 8 18.9% 43.5% 12.3% 9.6% 6.7% 8.9%Grade 9 15.5% 32.4% 18.3% 12.0% 10.5% 11.3%Grade 10 16.6% 31.9% 19.6% 13.0% 8.6% 10.4%Grade 11 13.3% 30.8% 22.8% 13.8% 10.0% 9.2%Grade 12 14.6% 27.0% 22.6% 17.5% 10.9% 7.3%
______________________________________________________________________________________________
Table D-6: Since school began in the fall, on how many days (if any) have you...
Attended class while high from marijuana use?
None 1-3 Days 4-9 Days 10+ Days
All 83.9% 8.9% 2.6% 4.5%Grade 7 92.0% 5.6% 0.9% 1.4%Grade 8 85.9% 9.1% 3.3% 1.7%Grade 9 79.5% 10.5% 4.2% 5.8%
Grade 10 79.1% 11.5% 3.1% 6.4%Grade 11 85.7% 8.3% 1.5% 4.5%Grade 12 82.2% 7.8% 1.6% 8.5%
Attended class while high from use of some other drug?
None 1-3 Days 4-9 Days 10+ Days
All 91.5% 5.5% 1.4% 1.6%Grade 7 96.1% 2.9% 0.1% 0.9%Grade 8 92.5% 5.1% 1.4% 1.0%Grade 9 90.8% 5.8% 1.9% 1.5%
Grade 10 88.2% 7.5% 2.4% 2.0%
8/14/2019 BRAZORIA COUNTY - Alvin ISD - 1998 Texas School Survey of Drug and Alcohol Use
http://slidepdf.com/reader/full/brazoria-county-alvin-isd-1998-texas-school-survey-of-drug-and-alcohol 41/213
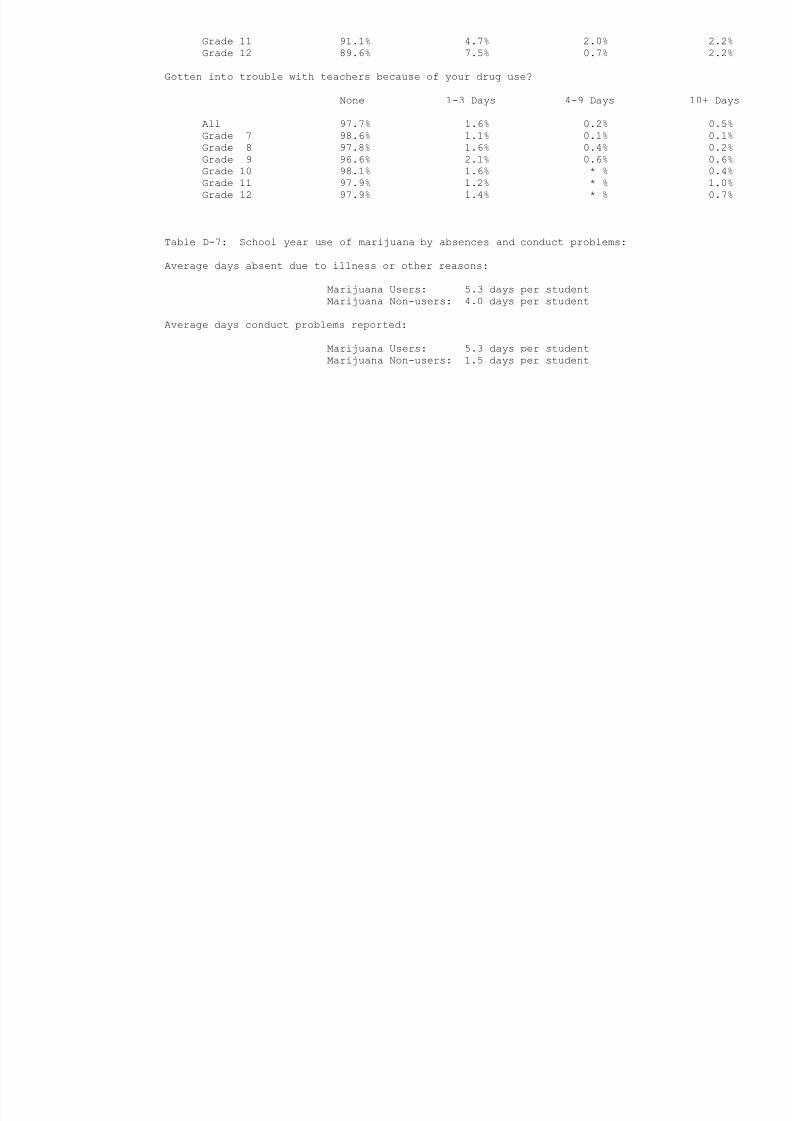
Grade 11 91.1% 4.7% 2.0% 2.2%Grade 12 89.6% 7.5% 0.7% 2.2%
Gotten into trouble with teachers because of your drug use?
None 1-3 Days 4-9 Days 10+ Days
All 97.7% 1.6% 0.2% 0.5%Grade 7 98.6% 1.1% 0.1% 0.1%
Grade 8 97.8% 1.6% 0.4% 0.2%Grade 9 96.6% 2.1% 0.6% 0.6%Grade 10 98.1% 1.6% * % 0.4%Grade 11 97.9% 1.2% * % 1.0%Grade 12 97.9% 1.4% * % 0.7%
______________________________________________________________________________________________
Table D-7: School year use of marijuana by absences and conduct problems:
Average days absent due to illness or other reasons:
Marijuana Users: 5.3 days per studentMarijuana Non-users: 4.0 days per student
Average days conduct problems reported:
Marijuana Users: 5.3 days per studentMarijuana Non-users: 1.5 days per student
8/14/2019 BRAZORIA COUNTY - Alvin ISD - 1998 Texas School Survey of Drug and Alcohol Use
http://slidepdf.com/reader/full/brazoria-county-alvin-isd-1998-texas-school-survey-of-drug-and-alcohol 42/213
AlvinSpring 1998
______________________________________________________________________________________________
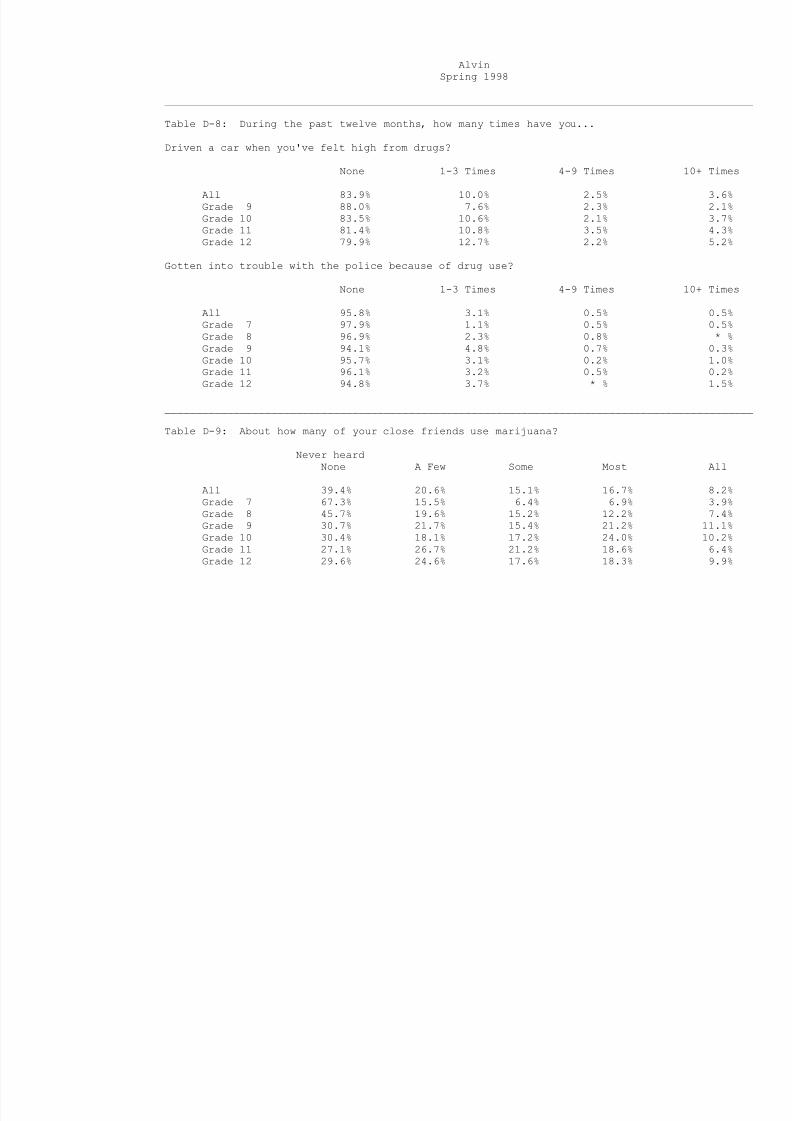
Table D-8: During the past twelve months, how many times have you...
Driven a car when you've felt high from drugs?
None 1-3 Times 4-9 Times 10+ Times
All 83.9% 10.0% 2.5% 3.6%Grade 9 88.0% 7.6% 2.3% 2.1%Grade 10 83.5% 10.6% 2.1% 3.7%Grade 11 81.4% 10.8% 3.5% 4.3%Grade 12 79.9% 12.7% 2.2% 5.2%
Gotten into trouble with the police because of drug use?
None 1-3 Times 4-9 Times 10+ Times
All 95.8% 3.1% 0.5% 0.5%Grade 7 97.9% 1.1% 0.5% 0.5%Grade 8 96.9% 2.3% 0.8% * %Grade 9 94.1% 4.8% 0.7% 0.3%Grade 10 95.7% 3.1% 0.2% 1.0%Grade 11 96.1% 3.2% 0.5% 0.2%Grade 12 94.8% 3.7% * % 1.5%
______________________________________________________________________________________________
Table D-9: About how many of your close friends use marijuana?
Never heardNone A Few Some Most All
All 39.4% 20.6% 15.1% 16.7% 8.2%Grade 7 67.3% 15.5% 6.4% 6.9% 3.9%Grade 8 45.7% 19.6% 15.2% 12.2% 7.4%Grade 9 30.7% 21.7% 15.4% 21.2% 11.1%Grade 10 30.4% 18.1% 17.2% 24.0% 10.2%Grade 11 27.1% 26.7% 21.2% 18.6% 6.4%
Grade 12 29.6% 24.6% 17.6% 18.3% 9.9%
8/14/2019 BRAZORIA COUNTY - Alvin ISD - 1998 Texas School Survey of Drug and Alcohol Use
http://slidepdf.com/reader/full/brazoria-county-alvin-isd-1998-texas-school-survey-of-drug-and-alcohol 43/213
______________________________________________________________________________________________
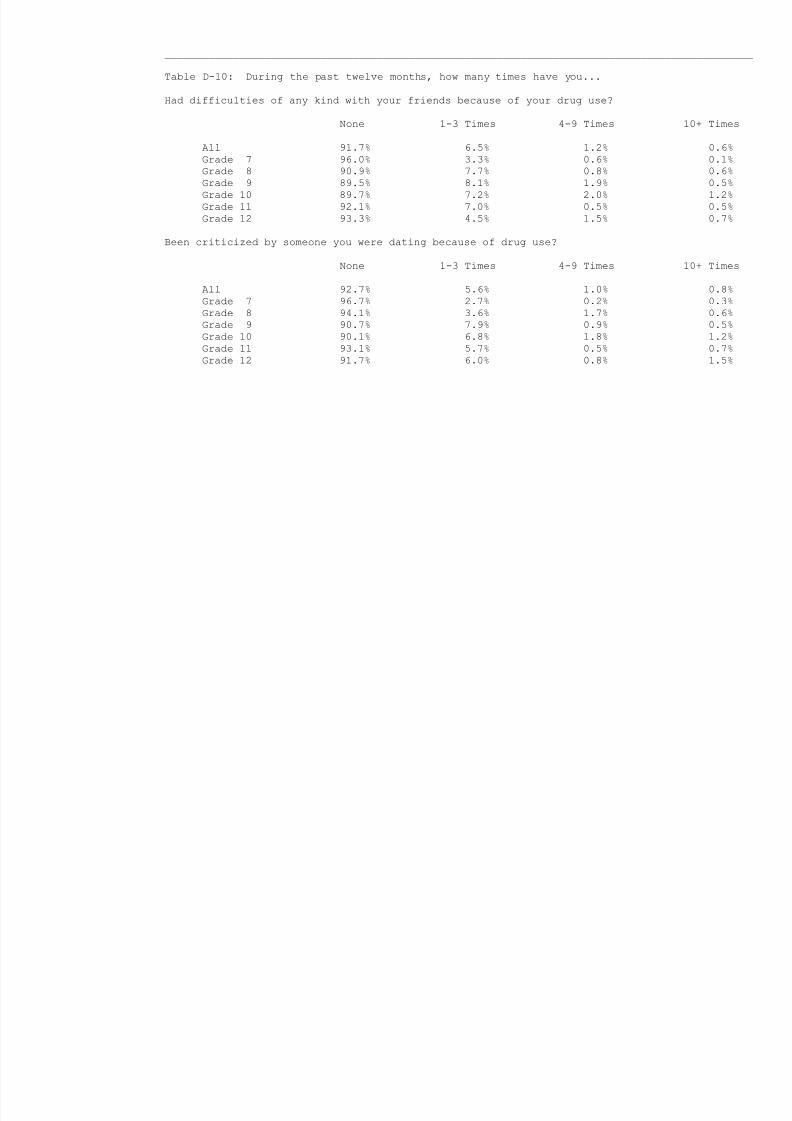
Table D-10: During the past twelve months, how many times have you...
Had difficulties of any kind with your friends because of your drug use?
None 1-3 Times 4-9 Times 10+ Times
All 91.7% 6.5% 1.2% 0.6%Grade 7 96.0% 3.3% 0.6% 0.1%Grade 8 90.9% 7.7% 0.8% 0.6%Grade 9 89.5% 8.1% 1.9% 0.5%Grade 10 89.7% 7.2% 2.0% 1.2%Grade 11 92.1% 7.0% 0.5% 0.5%Grade 12 93.3% 4.5% 1.5% 0.7%
Been criticized by someone you were dating because of drug use?
None 1-3 Times 4-9 Times 10+ Times
All 92.7% 5.6% 1.0% 0.8%Grade 7 96.7% 2.7% 0.2% 0.3%Grade 8 94.1% 3.6% 1.7% 0.6%Grade 9 90.7% 7.9% 0.9% 0.5%Grade 10 90.1% 6.8% 1.8% 1.2%Grade 11 93.1% 5.7% 0.5% 0.7%Grade 12 91.7% 6.0% 0.8% 1.5%
8/14/2019 BRAZORIA COUNTY - Alvin ISD - 1998 Texas School Survey of Drug and Alcohol Use
http://slidepdf.com/reader/full/brazoria-county-alvin-isd-1998-texas-school-survey-of-drug-and-alcohol 44/213
AlvinSpring 1998
______________________________________________________________________________________________
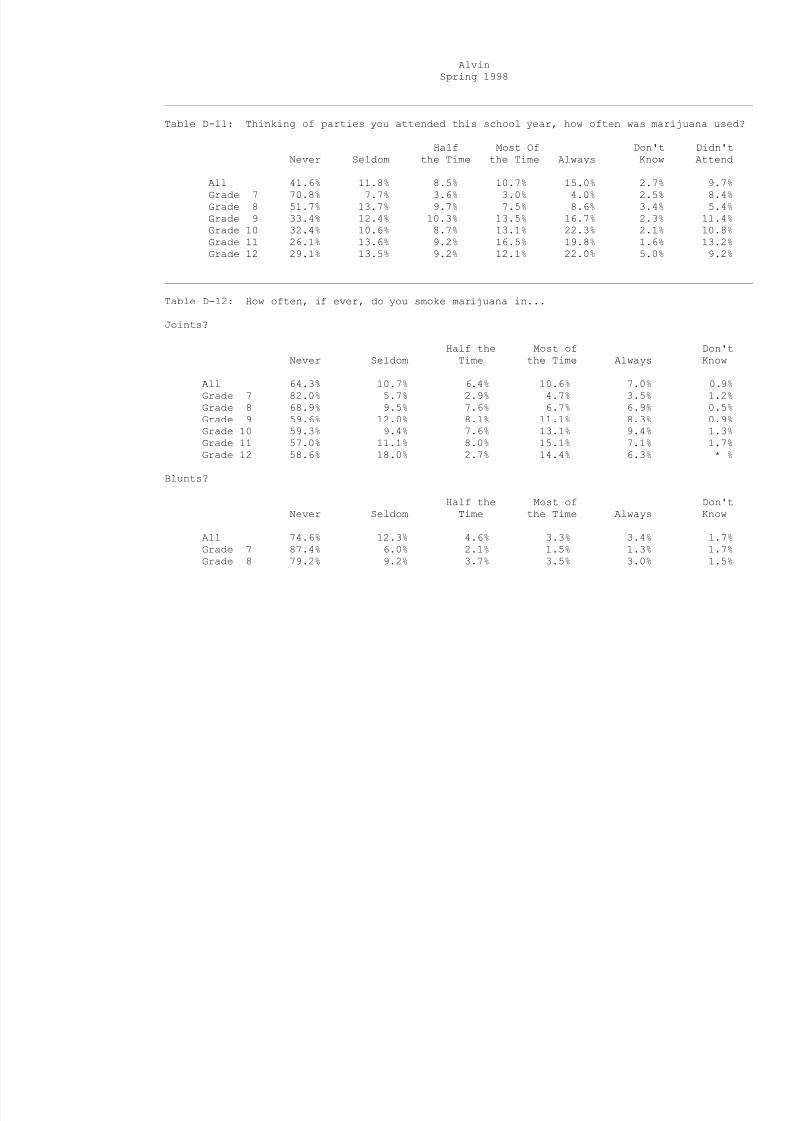
Table D-11: Thinking of parties you attended this school year, how often was marijuana used?
Half Most Of Don't Didn'tNever Seldom the Time the Time Always Know Attend
All 41.6% 11.8% 8.5% 10.7% 15.0% 2.7% 9.7%Grade 7 70.8% 7.7% 3.6% 3.0% 4.0% 2.5% 8.4%Grade 8 51.7% 13.7% 9.7% 7.5% 8.6% 3.4% 5.4%Grade 9 33.4% 12.4% 10.3% 13.5% 16.7% 2.3% 11.4%Grade 10 32.4% 10.6% 8.7% 13.1% 22.3% 2.1% 10.8%Grade 11 26.1% 13.6% 9.2% 16.5% 19.8% 1.6% 13.2%Grade 12 29.1% 13.5% 9.2% 12.1% 22.0% 5.0% 9.2%
______________________________________________________________________________________________
Table D-12: How often, if ever, do you smoke marijuana in...
Joints?
Half the Most of Don'tNever Seldom Time the Time Always Know
All 64.3% 10.7% 6.4% 10.6% 7.0% 0.9%Grade 7 82.0% 5.7% 2.9% 4.7% 3.5% 1.2%Grade 8 68.9% 9.5% 7.6% 6.7% 6.9% 0.5%
Grade 9 59.6% 12.0% 8.1% 11.1% 8.3% 0.9%Grade 10 59.3% 9.4% 7.6% 13.1% 9.4% 1.3%Grade 11 57.0% 11.1% 8.0% 15.1% 7.1% 1.7%Grade 12 58.6% 18.0% 2.7% 14.4% 6.3% * %
Blunts?
Half the Most of Don'tNever Seldom Time the Time Always Know
All 74.6% 12.3% 4.6% 3.3% 3.4% 1.7%Grade 7 87.4% 6.0% 2.1% 1.5% 1.3% 1.7%
Grade 8 79.2% 9.2% 3.7% 3.5% 3.0% 1.5%
8/14/2019 BRAZORIA COUNTY - Alvin ISD - 1998 Texas School Survey of Drug and Alcohol Use
http://slidepdf.com/reader/full/brazoria-county-alvin-isd-1998-texas-school-survey-of-drug-and-alcohol 45/213
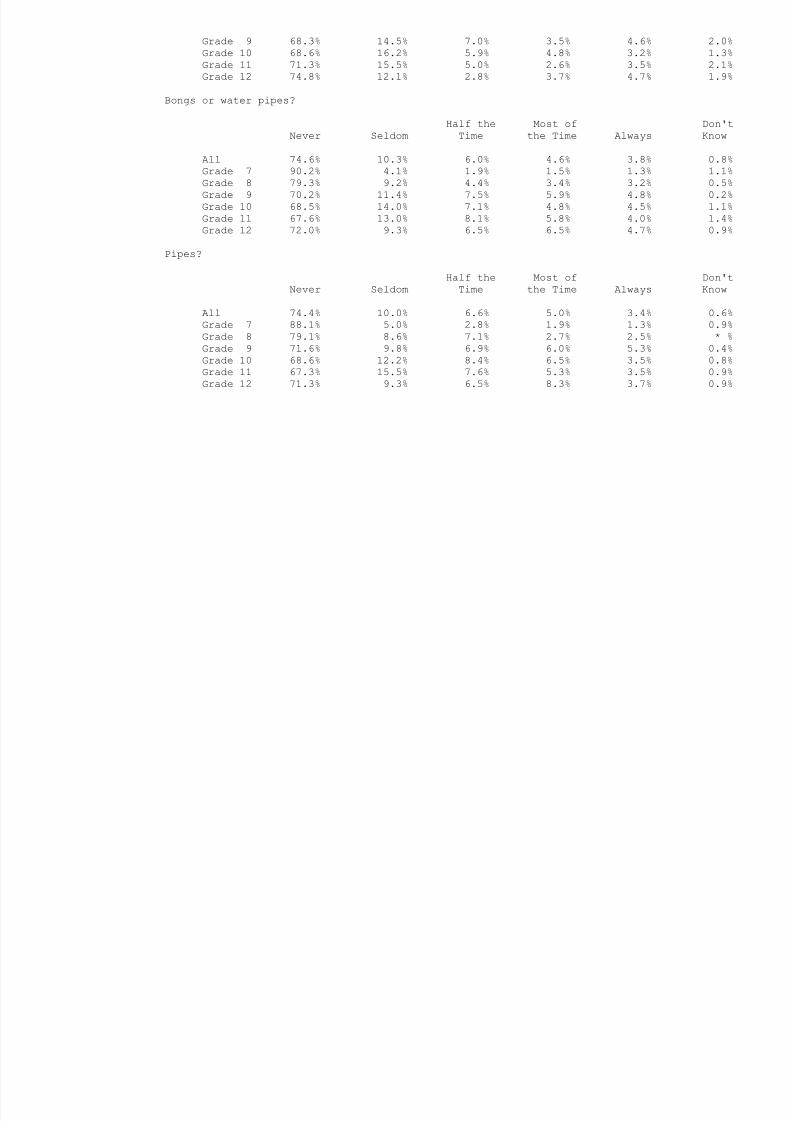
Grade 9 68.3% 14.5% 7.0% 3.5% 4.6% 2.0%Grade 10 68.6% 16.2% 5.9% 4.8% 3.2% 1.3%Grade 11 71.3% 15.5% 5.0% 2.6% 3.5% 2.1%Grade 12 74.8% 12.1% 2.8% 3.7% 4.7% 1.9%
Bongs or water pipes?
Half the Most of Don'tNever Seldom Time the Time Always Know
All 74.6% 10.3% 6.0% 4.6% 3.8% 0.8%Grade 7 90.2% 4.1% 1.9% 1.5% 1.3% 1.1%Grade 8 79.3% 9.2% 4.4% 3.4% 3.2% 0.5%Grade 9 70.2% 11.4% 7.5% 5.9% 4.8% 0.2%Grade 10 68.5% 14.0% 7.1% 4.8% 4.5% 1.1%Grade 11 67.6% 13.0% 8.1% 5.8% 4.0% 1.4%Grade 12 72.0% 9.3% 6.5% 6.5% 4.7% 0.9%
Pipes?
Half the Most of Don'tNever Seldom Time the Time Always Know
All 74.4% 10.0% 6.6% 5.0% 3.4% 0.6%Grade 7 88.1% 5.0% 2.8% 1.9% 1.3% 0.9%Grade 8 79.1% 8.6% 7.1% 2.7% 2.5% * %Grade 9 71.6% 9.8% 6.9% 6.0% 5.3% 0.4%Grade 10 68.6% 12.2% 8.4% 6.5% 3.5% 0.8%Grade 11 67.3% 15.5% 7.6% 5.3% 3.5% 0.9%Grade 12 71.3% 9.3% 6.5% 8.3% 3.7% 0.9%
8/14/2019 BRAZORIA COUNTY - Alvin ISD - 1998 Texas School Survey of Drug and Alcohol Use
http://slidepdf.com/reader/full/brazoria-county-alvin-isd-1998-texas-school-survey-of-drug-and-alcohol 46/213
AlvinSpring 1998
______________________________________________________________________________________________
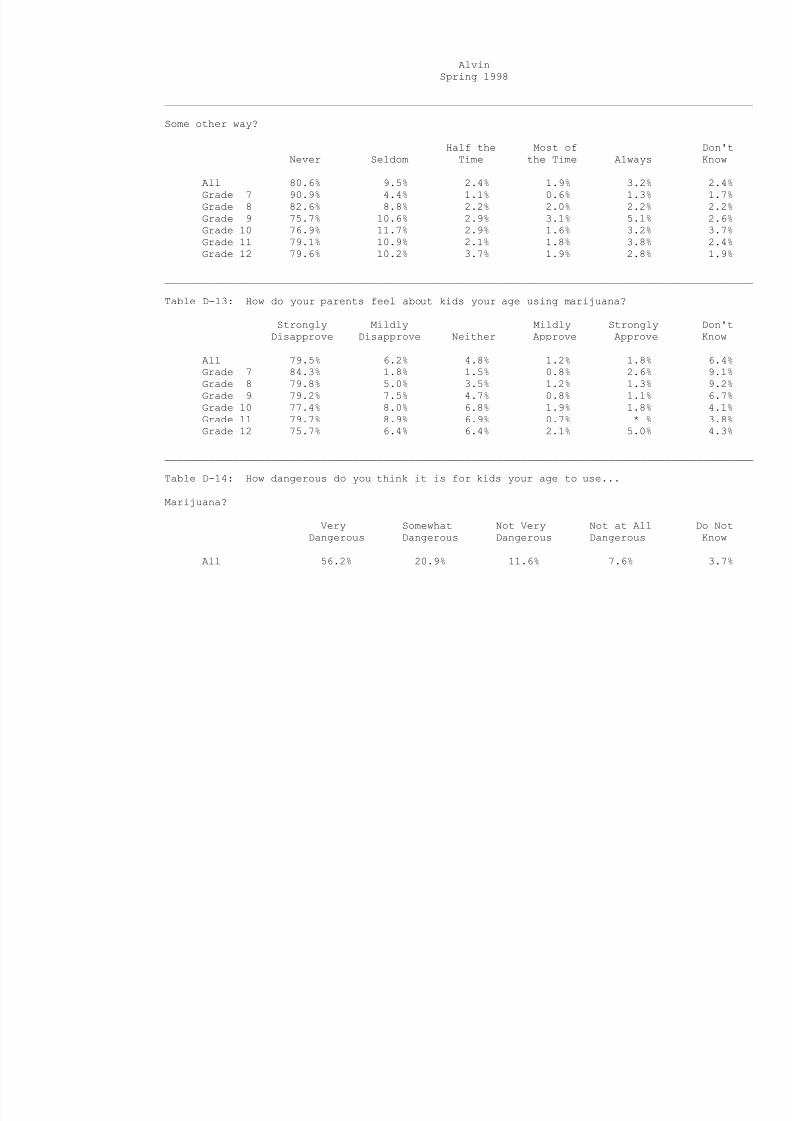
Some other way?
Half the Most of Don'tNever Seldom Time the Time Always Know
All 80.6% 9.5% 2.4% 1.9% 3.2% 2.4%Grade 7 90.9% 4.4% 1.1% 0.6% 1.3% 1.7%Grade 8 82.6% 8.8% 2.2% 2.0% 2.2% 2.2%Grade 9 75.7% 10.6% 2.9% 3.1% 5.1% 2.6%Grade 10 76.9% 11.7% 2.9% 1.6% 3.2% 3.7%Grade 11 79.1% 10.9% 2.1% 1.8% 3.8% 2.4%Grade 12 79.6% 10.2% 3.7% 1.9% 2.8% 1.9%
______________________________________________________________________________________________
Table D-13: How do your parents feel about kids your age using marijuana?
Strongly Mildly Mildly Strongly Don'tDisapprove Disapprove Neither Approve Approve Know
All 79.5% 6.2% 4.8% 1.2% 1.8% 6.4%Grade 7 84.3% 1.8% 1.5% 0.8% 2.6% 9.1%Grade 8 79.8% 5.0% 3.5% 1.2% 1.3% 9.2%Grade 9 79.2% 7.5% 4.7% 0.8% 1.1% 6.7%Grade 10 77.4% 8.0% 6.8% 1.9% 1.8% 4.1%
Grade 11 79.7% 8.9% 6.9% 0.7% * % 3.8%Grade 12 75.7% 6.4% 6.4% 2.1% 5.0% 4.3%
______________________________________________________________________________________________
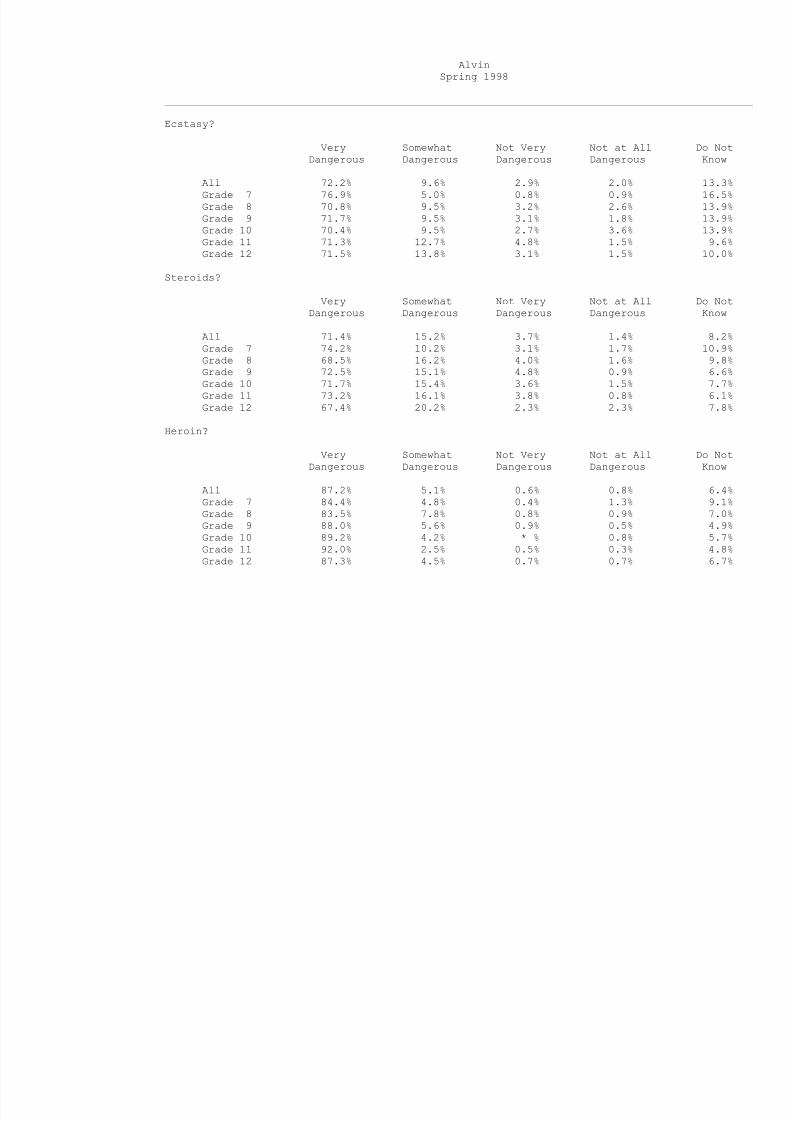
Table D-14: How dangerous do you think it is for kids your age to use...
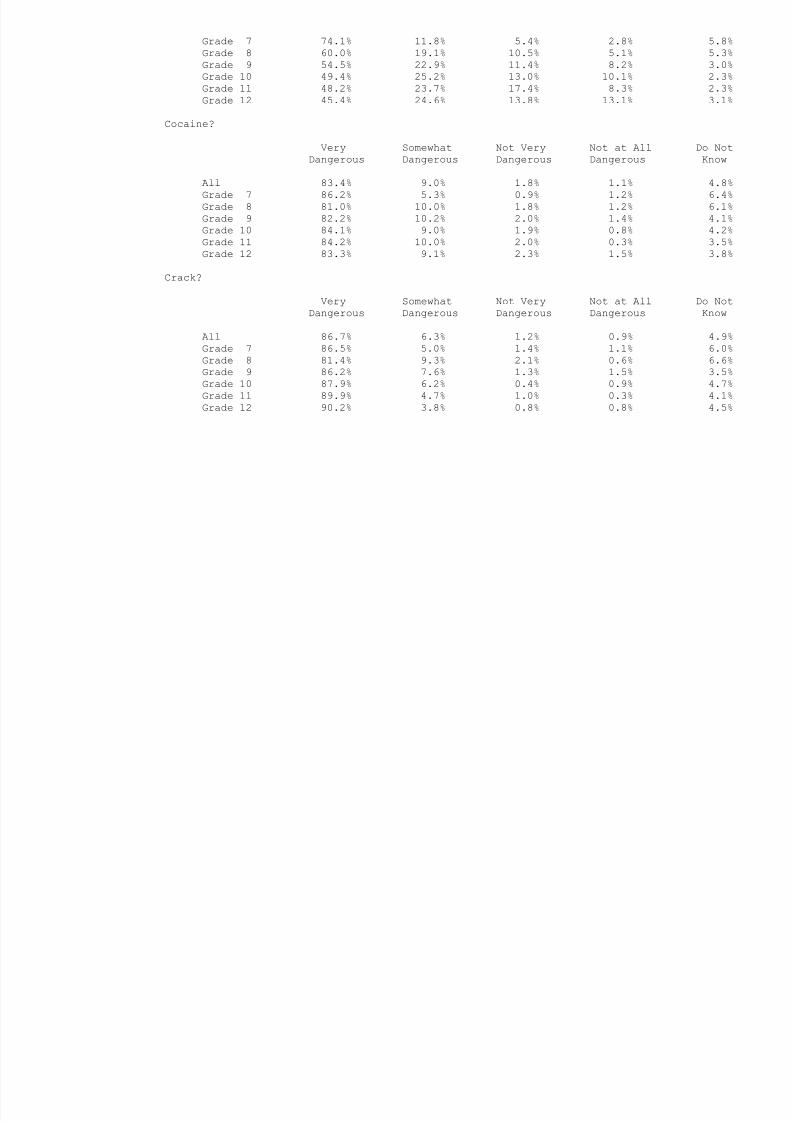
Marijuana?
Very Somewhat Not Very Not at All Do NotDangerous Dangerous Dangerous Dangerous Know
All 56.2% 20.9% 11.6% 7.6% 3.7%
8/14/2019 BRAZORIA COUNTY - Alvin ISD - 1998 Texas School Survey of Drug and Alcohol Use
http://slidepdf.com/reader/full/brazoria-county-alvin-isd-1998-texas-school-survey-of-drug-and-alcohol 47/213
Grade 7 74.1% 11.8% 5.4% 2.8% 5.8%Grade 8 60.0% 19.1% 10.5% 5.1% 5.3%Grade 9 54.5% 22.9% 11.4% 8.2% 3.0%Grade 10 49.4% 25.2% 13.0% 10.1% 2.3%Grade 11 48.2% 23.7% 17.4% 8.3% 2.3%Grade 12 45.4% 24.6% 13.8% 13.1% 3.1%
Cocaine?
Very Somewhat Not Very Not at All Do NotDangerous Dangerous Dangerous Dangerous Know
All 83.4% 9.0% 1.8% 1.1% 4.8%Grade 7 86.2% 5.3% 0.9% 1.2% 6.4%Grade 8 81.0% 10.0% 1.8% 1.2% 6.1%Grade 9 82.2% 10.2% 2.0% 1.4% 4.1%Grade 10 84.1% 9.0% 1.9% 0.8% 4.2%Grade 11 84.2% 10.0% 2.0% 0.3% 3.5%Grade 12 83.3% 9.1% 2.3% 1.5% 3.8%
Crack?
Very Somewhat Not Very Not at All Do NotDangerous Dangerous Dangerous Dangerous Know
All 86.7% 6.3% 1.2% 0.9% 4.9%Grade 7 86.5% 5.0% 1.4% 1.1% 6.0%Grade 8 81.4% 9.3% 2.1% 0.6% 6.6%Grade 9 86.2% 7.6% 1.3% 1.5% 3.5%Grade 10 87.9% 6.2% 0.4% 0.9% 4.7%Grade 11 89.9% 4.7% 1.0% 0.3% 4.1%Grade 12 90.2% 3.8% 0.8% 0.8% 4.5%
8/14/2019 BRAZORIA COUNTY - Alvin ISD - 1998 Texas School Survey of Drug and Alcohol Use
http://slidepdf.com/reader/full/brazoria-county-alvin-isd-1998-texas-school-survey-of-drug-and-alcohol 48/213
AlvinSpring 1998
______________________________________________________________________________________________
Ecstasy?
Very Somewhat Not Very Not at All Do NotDangerous Dangerous Dangerous Dangerous Know
All 72.2% 9.6% 2.9% 2.0% 13.3%Grade 7 76.9% 5.0% 0.8% 0.9% 16.5%Grade 8 70.8% 9.5% 3.2% 2.6% 13.9%Grade 9 71.7% 9.5% 3.1% 1.8% 13.9%Grade 10 70.4% 9.5% 2.7% 3.6% 13.9%Grade 11 71.3% 12.7% 4.8% 1.5% 9.6%Grade 12 71.5% 13.8% 3.1% 1.5% 10.0%
Steroids?
Very Somewhat Not Very Not at All Do NotDangerous Dangerous Dangerous Dangerous Know
All 71.4% 15.2% 3.7% 1.4% 8.2%Grade 7 74.2% 10.2% 3.1% 1.7% 10.9%Grade 8 68.5% 16.2% 4.0% 1.6% 9.8%Grade 9 72.5% 15.1% 4.8% 0.9% 6.6%Grade 10 71.7% 15.4% 3.6% 1.5% 7.7%Grade 11 73.2% 16.1% 3.8% 0.8% 6.1%Grade 12 67.4% 20.2% 2.3% 2.3% 7.8%
Heroin?
Very Somewhat Not Very Not at All Do NotDangerous Dangerous Dangerous Dangerous Know
All 87.2% 5.1% 0.6% 0.8% 6.4%Grade 7 84.4% 4.8% 0.4% 1.3% 9.1%Grade 8 83.5% 7.8% 0.8% 0.9% 7.0%Grade 9 88.0% 5.6% 0.9% 0.5% 4.9%Grade 10 89.2% 4.2% * % 0.8% 5.7%Grade 11 92.0% 2.5% 0.5% 0.3% 4.8%
Grade 12 87.3% 4.5% 0.7% 0.7% 6.7%

8/14/2019 BRAZORIA COUNTY - Alvin ISD - 1998 Texas School Survey of Drug and Alcohol Use
http://slidepdf.com/reader/full/brazoria-county-alvin-isd-1998-texas-school-survey-of-drug-and-alcohol 49/213

8/14/2019 BRAZORIA COUNTY - Alvin ISD - 1998 Texas School Survey of Drug and Alcohol Use
http://slidepdf.com/reader/full/brazoria-county-alvin-isd-1998-texas-school-survey-of-drug-and-alcohol 50/213
8/14/2019 BRAZORIA COUNTY - Alvin ISD - 1998 Texas School Survey of Drug and Alcohol Use
http://slidepdf.com/reader/full/brazoria-county-alvin-isd-1998-texas-school-survey-of-drug-and-alcohol 51/213
AlvinSpring 1998
______________________________________________________________________________________________
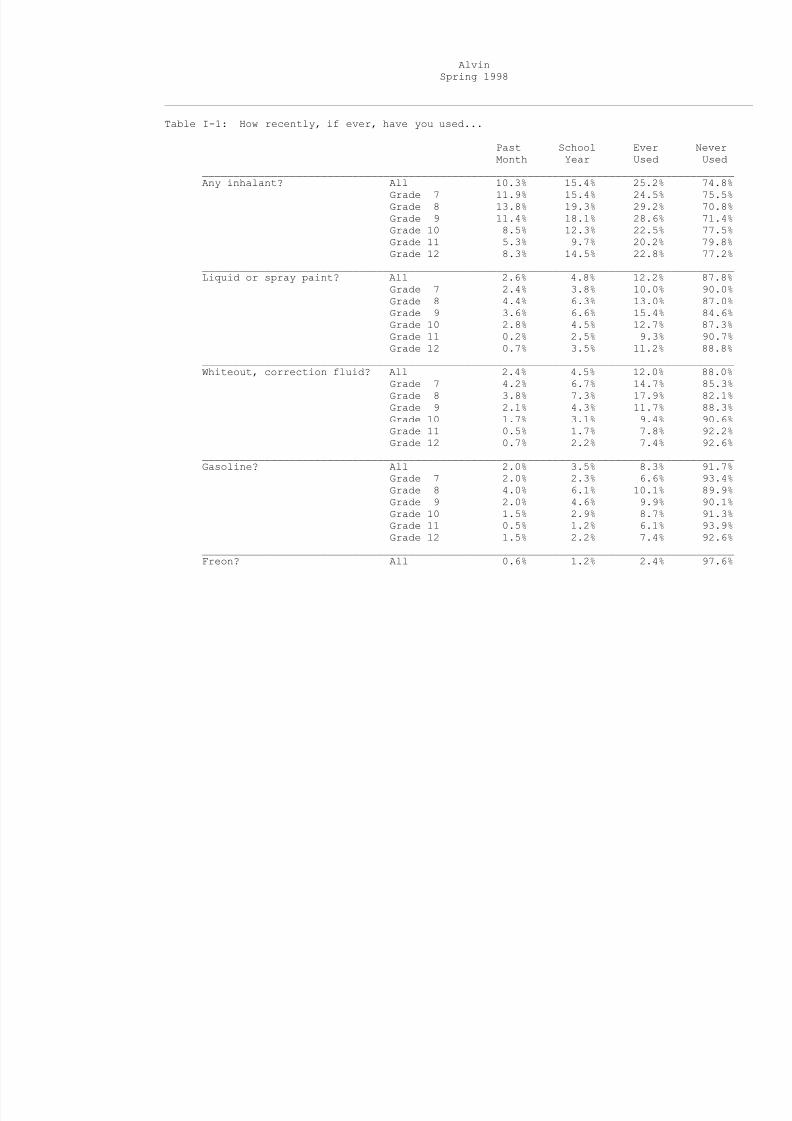
Table I-1: How recently, if ever, have you used...
Past School Ever NeverMonth Year Used Used
_____________________________________________________________________________________Any inhalant? All 10.3% 15.4% 25.2% 74.8%
Grade 7 11.9% 15.4% 24.5% 75.5%Grade 8 13.8% 19.3% 29.2% 70.8%Grade 9 11.4% 18.1% 28.6% 71.4%Grade 10 8.5% 12.3% 22.5% 77.5%Grade 11 5.3% 9.7% 20.2% 79.8%Grade 12 8.3% 14.5% 22.8% 77.2%
_____________________________________________________________________________________Liquid or spray paint? All 2.6% 4.8% 12.2% 87.8%
Grade 7 2.4% 3.8% 10.0% 90.0%Grade 8 4.4% 6.3% 13.0% 87.0%Grade 9 3.6% 6.6% 15.4% 84.6%Grade 10 2.8% 4.5% 12.7% 87.3%Grade 11 0.2% 2.5% 9.3% 90.7%Grade 12 0.7% 3.5% 11.2% 88.8%
_____________________________________________________________________________________Whiteout, correction fluid? All 2.4% 4.5% 12.0% 88.0%
Grade 7 4.2% 6.7% 14.7% 85.3%Grade 8 3.8% 7.3% 17.9% 82.1%Grade 9 2.1% 4.3% 11.7% 88.3%
Grade 10 1.7% 3.1% 9.4% 90.6%Grade 11 0.5% 1.7% 7.8% 92.2%Grade 12 0.7% 2.2% 7.4% 92.6%
_____________________________________________________________________________________Gasoline? All 2.0% 3.5% 8.3% 91.7%
Grade 7 2.0% 2.3% 6.6% 93.4%Grade 8 4.0% 6.1% 10.1% 89.9%Grade 9 2.0% 4.6% 9.9% 90.1%Grade 10 1.5% 2.9% 8.7% 91.3%Grade 11 0.5% 1.2% 6.1% 93.9%Grade 12 1.5% 2.2% 7.4% 92.6%
_____________________________________________________________________________________
Freon? All 0.6% 1.2% 2.4% 97.6%
8/14/2019 BRAZORIA COUNTY - Alvin ISD - 1998 Texas School Survey of Drug and Alcohol Use
http://slidepdf.com/reader/full/brazoria-county-alvin-isd-1998-texas-school-survey-of-drug-and-alcohol 52/213
Grade 7 0.6% 0.7% 1.5% 98.5%Grade 8 0.7% 1.1% 2.2% 97.8%Grade 9 1.2% 2.4% 4.4% 95.6%Grade 10 0.6% 0.8% 2.5% 97.5%Grade 11 * % 1.0% 1.2% 98.8%Grade 12 * % 0.7% 1.5% 98.5%
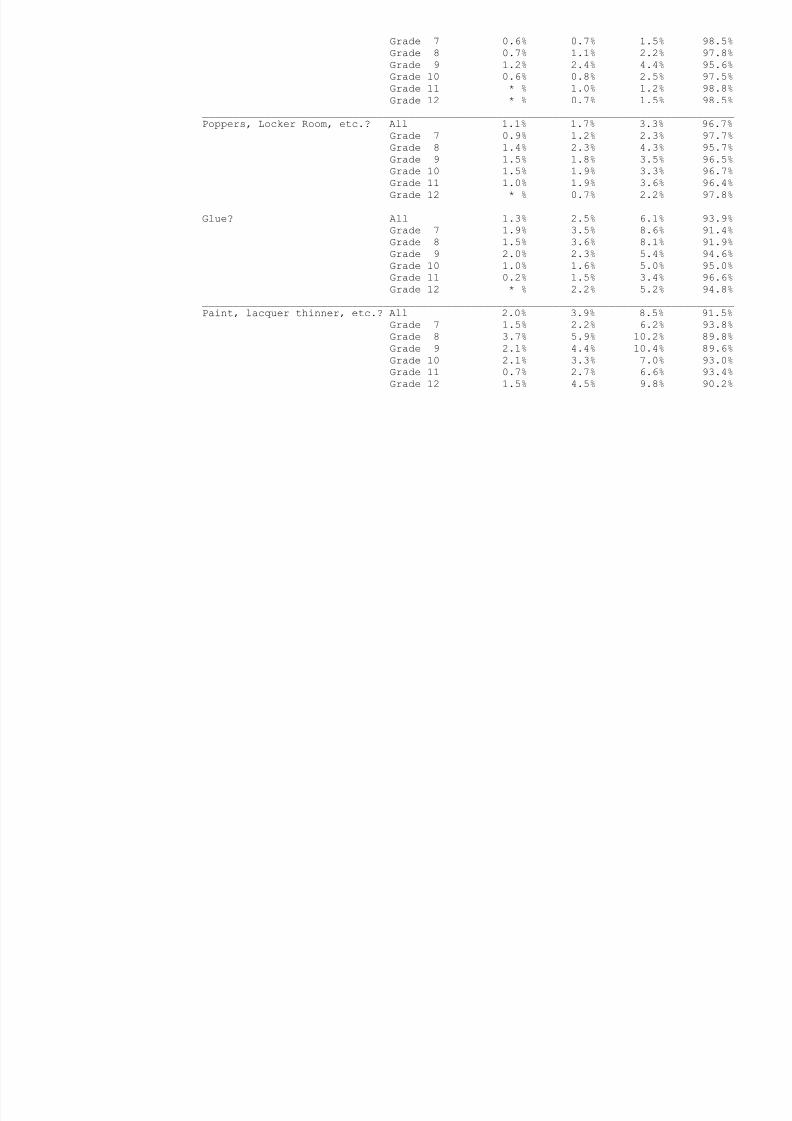
_____________________________________________________________________________________Poppers, Locker Room, etc.? All 1.1% 1.7% 3.3% 96.7%
Grade 7 0.9% 1.2% 2.3% 97.7%
Grade 8 1.4% 2.3% 4.3% 95.7%Grade 9 1.5% 1.8% 3.5% 96.5%Grade 10 1.5% 1.9% 3.3% 96.7%Grade 11 1.0% 1.9% 3.6% 96.4%Grade 12 * % 0.7% 2.2% 97.8%
_____________________________________________________________________________________Glue? All 1.3% 2.5% 6.1% 93.9%
Grade 7 1.9% 3.5% 8.6% 91.4%Grade 8 1.5% 3.6% 8.1% 91.9%Grade 9 2.0% 2.3% 5.4% 94.6%Grade 10 1.0% 1.6% 5.0% 95.0%Grade 11 0.2% 1.5% 3.4% 96.6%Grade 12 * % 2.2% 5.2% 94.8%
_____________________________________________________________________________________Paint, lacquer thinner, etc.? All 2.0% 3.9% 8.5% 91.5%
Grade 7 1.5% 2.2% 6.2% 93.8%Grade 8 3.7% 5.9% 10.2% 89.8%Grade 9 2.1% 4.4% 10.4% 89.6%Grade 10 2.1% 3.3% 7.0% 93.0%Grade 11 0.7% 2.7% 6.6% 93.4%Grade 12 1.5% 4.5% 9.8% 90.2%
8/14/2019 BRAZORIA COUNTY - Alvin ISD - 1998 Texas School Survey of Drug and Alcohol Use
http://slidepdf.com/reader/full/brazoria-county-alvin-isd-1998-texas-school-survey-of-drug-and-alcohol 53/213
AlvinSpring 1998
______________________________________________________________________________________________
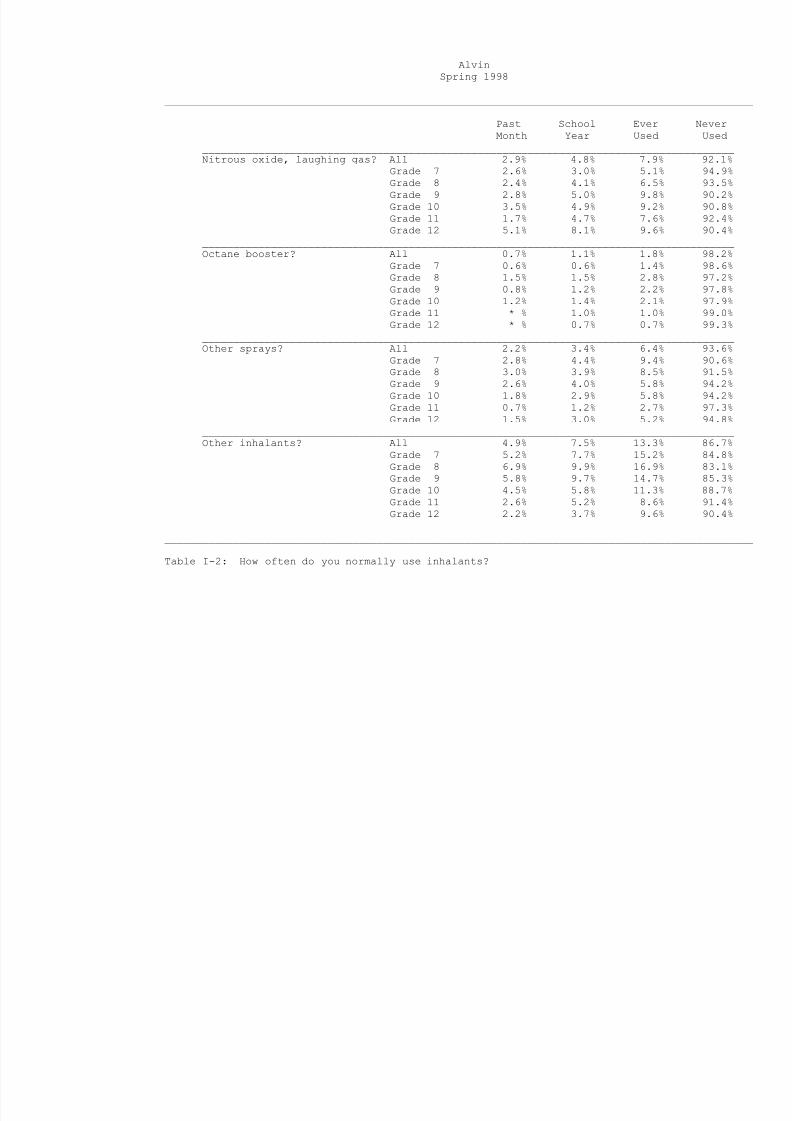
Past School Ever NeverMonth Year Used Used
_____________________________________________________________________________________Nitrous oxide, laughing gas? All 2.9% 4.8% 7.9% 92.1%
Grade 7 2.6% 3.0% 5.1% 94.9%Grade 8 2.4% 4.1% 6.5% 93.5%Grade 9 2.8% 5.0% 9.8% 90.2%Grade 10 3.5% 4.9% 9.2% 90.8%Grade 11 1.7% 4.7% 7.6% 92.4%Grade 12 5.1% 8.1% 9.6% 90.4%
_____________________________________________________________________________________Octane booster? All 0.7% 1.1% 1.8% 98.2%
Grade 7 0.6% 0.6% 1.4% 98.6%Grade 8 1.5% 1.5% 2.8% 97.2%Grade 9 0.8% 1.2% 2.2% 97.8%Grade 10 1.2% 1.4% 2.1% 97.9%Grade 11 * % 1.0% 1.0% 99.0%Grade 12 * % 0.7% 0.7% 99.3%
_____________________________________________________________________________________Other sprays? All 2.2% 3.4% 6.4% 93.6%
Grade 7 2.8% 4.4% 9.4% 90.6%Grade 8 3.0% 3.9% 8.5% 91.5%Grade 9 2.6% 4.0% 5.8% 94.2%Grade 10 1.8% 2.9% 5.8% 94.2%Grade 11 0.7% 1.2% 2.7% 97.3%
Grade 12 1.5% 3.0% 5.2% 94.8%_____________________________________________________________________________________Other inhalants? All 4.9% 7.5% 13.3% 86.7%
Grade 7 5.2% 7.7% 15.2% 84.8%Grade 8 6.9% 9.9% 16.9% 83.1%Grade 9 5.8% 9.7% 14.7% 85.3%Grade 10 4.5% 5.8% 11.3% 88.7%Grade 11 2.6% 5.2% 8.6% 91.4%Grade 12 2.2% 3.7% 9.6% 90.4%
______________________________________________________________________________________________
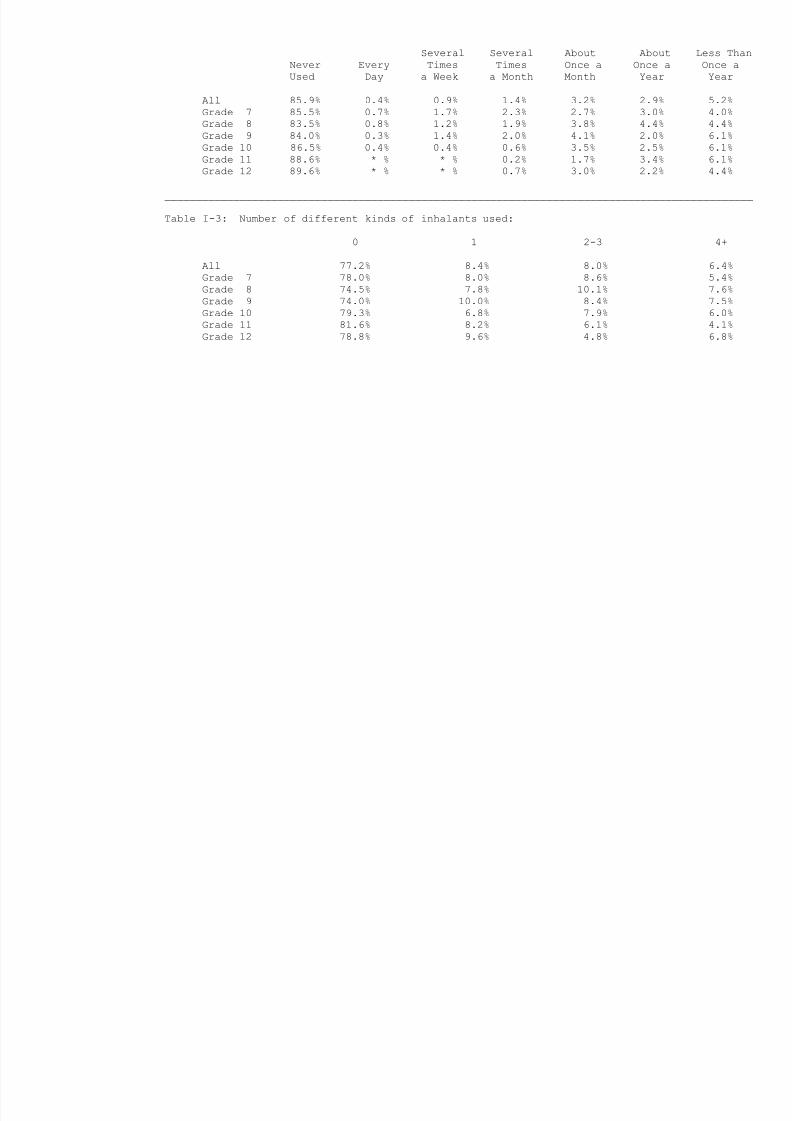
Table I-2: How often do you normally use inhalants?
8/14/2019 BRAZORIA COUNTY - Alvin ISD - 1998 Texas School Survey of Drug and Alcohol Use
http://slidepdf.com/reader/full/brazoria-county-alvin-isd-1998-texas-school-survey-of-drug-and-alcohol 54/213
Several Several About About Less Than
Never Every Times Times Once a Once a Once aUsed Day a Week a Month Month Year Year
All 85.9% 0.4% 0.9% 1.4% 3.2% 2.9% 5.2%Grade 7 85.5% 0.7% 1.7% 2.3% 2.7% 3.0% 4.0%Grade 8 83.5% 0.8% 1.2% 1.9% 3.8% 4.4% 4.4%Grade 9 84.0% 0.3% 1.4% 2.0% 4.1% 2.0% 6.1%
Grade 10 86.5% 0.4% 0.4% 0.6% 3.5% 2.5% 6.1%Grade 11 88.6% * % * % 0.2% 1.7% 3.4% 6.1%Grade 12 89.6% * % * % 0.7% 3.0% 2.2% 4.4%
______________________________________________________________________________________________
Table I-3: Number of different kinds of inhalants used:
0 1 2-3 4+
All 77.2% 8.4% 8.0% 6.4%Grade 7 78.0% 8.0% 8.6% 5.4%Grade 8 74.5% 7.8% 10.1% 7.6%Grade 9 74.0% 10.0% 8.4% 7.5%Grade 10 79.3% 6.8% 7.9% 6.0%Grade 11 81.6% 8.2% 6.1% 4.1%Grade 12 78.8% 9.6% 4.8% 6.8%
8/14/2019 BRAZORIA COUNTY - Alvin ISD - 1998 Texas School Survey of Drug and Alcohol Use
http://slidepdf.com/reader/full/brazoria-county-alvin-isd-1998-texas-school-survey-of-drug-and-alcohol 55/213
AlvinSpring 1998
______________________________________________________________________________________________
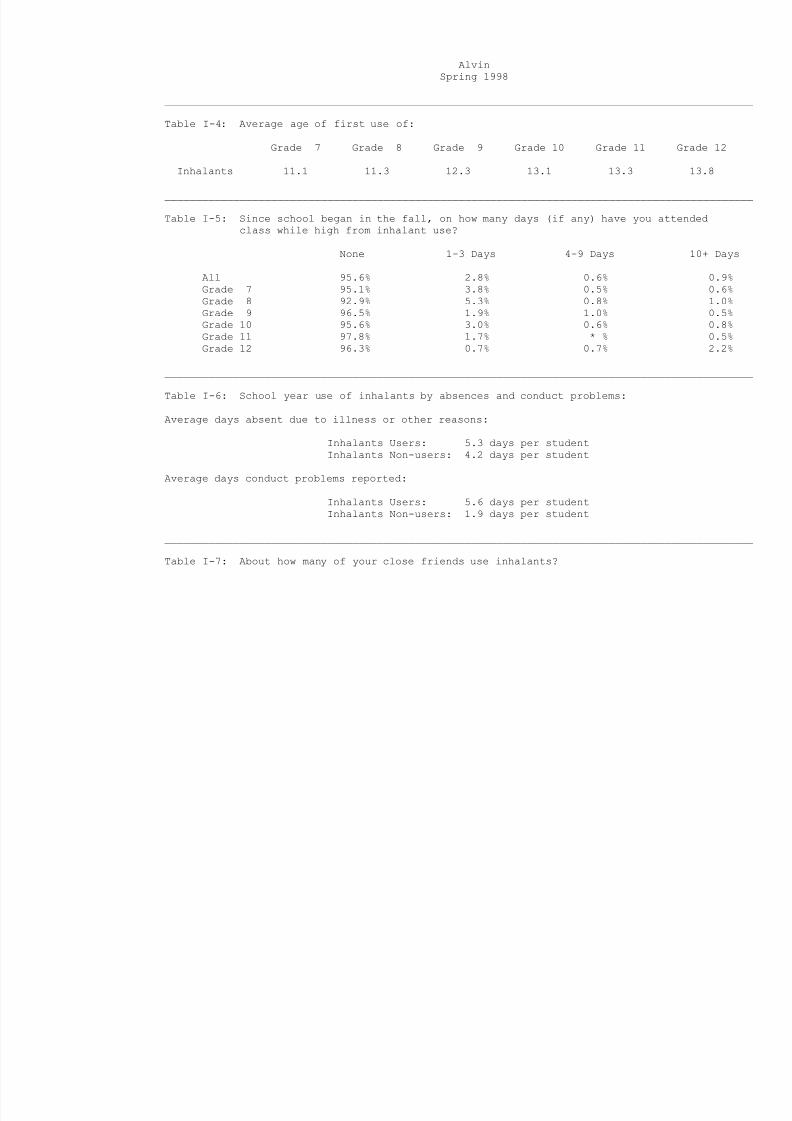
Table I-4: Average age of first use of:
Grade 7 Grade 8 Grade 9 Grade 10 Grade 11 Grade 12
Inhalants 11.1 11.3 12.3 13.1 13.3 13.8
______________________________________________________________________________________________
Table I-5: Since school began in the fall, on how many days (if any) have you attendedclass while high from inhalant use?
None 1-3 Days 4-9 Days 10+ Days
All 95.6% 2.8% 0.6% 0.9%Grade 7 95.1% 3.8% 0.5% 0.6%Grade 8 92.9% 5.3% 0.8% 1.0%Grade 9 96.5% 1.9% 1.0% 0.5%Grade 10 95.6% 3.0% 0.6% 0.8%Grade 11 97.8% 1.7% * % 0.5%Grade 12 96.3% 0.7% 0.7% 2.2%
______________________________________________________________________________________________
Table I-6: School year use of inhalants by absences and conduct problems:
Average days absent due to illness or other reasons:
Inhalants Users: 5.3 days per studentInhalants Non-users: 4.2 days per student
Average days conduct problems reported:
Inhalants Users: 5.6 days per studentInhalants Non-users: 1.9 days per student
______________________________________________________________________________________________
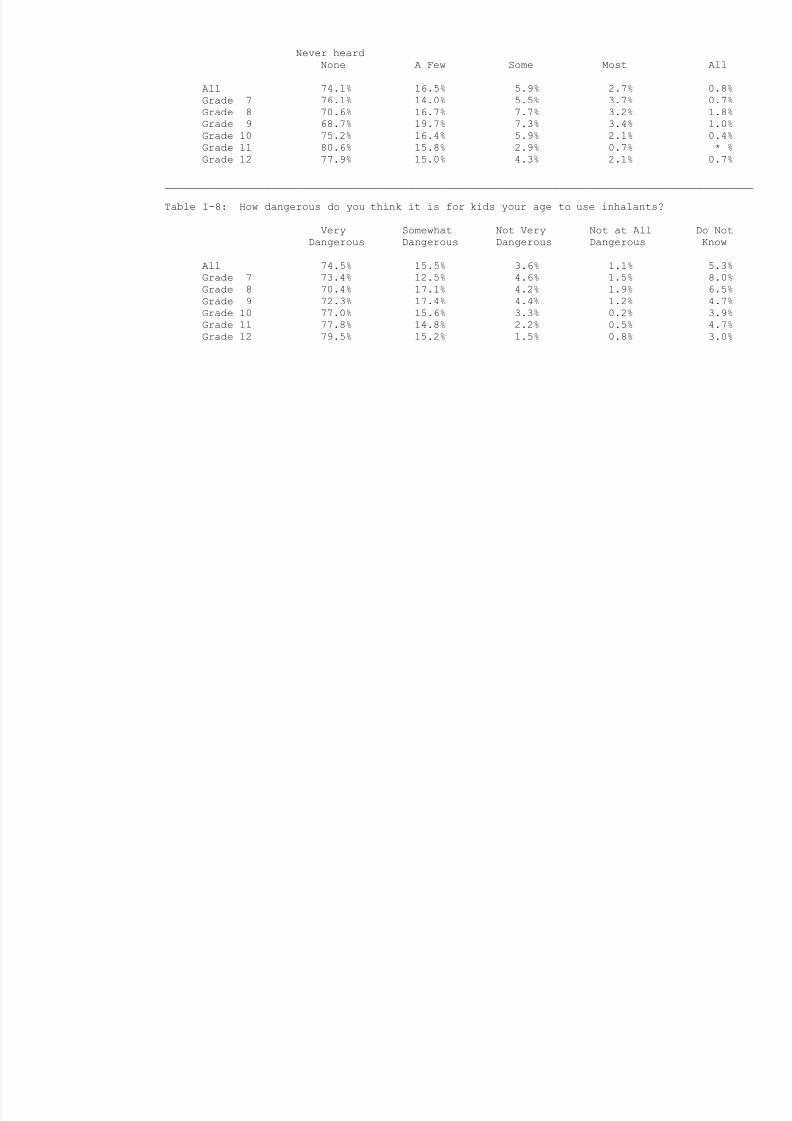
Table I-7: About how many of your close friends use inhalants?
8/14/2019 BRAZORIA COUNTY - Alvin ISD - 1998 Texas School Survey of Drug and Alcohol Use
http://slidepdf.com/reader/full/brazoria-county-alvin-isd-1998-texas-school-survey-of-drug-and-alcohol 56/213
Never heard
None A Few Some Most All
All 74.1% 16.5% 5.9% 2.7% 0.8%Grade 7 76.1% 14.0% 5.5% 3.7% 0.7%Grade 8 70.6% 16.7% 7.7% 3.2% 1.8%Grade 9 68.7% 19.7% 7.3% 3.4% 1.0%Grade 10 75.2% 16.4% 5.9% 2.1% 0.4%
Grade 11 80.6% 15.8% 2.9% 0.7% * %Grade 12 77.9% 15.0% 4.3% 2.1% 0.7%
______________________________________________________________________________________________
Table I-8: How dangerous do you think it is for kids your age to use inhalants?
Very Somewhat Not Very Not at All Do NotDangerous Dangerous Dangerous Dangerous Know
All 74.5% 15.5% 3.6% 1.1% 5.3%Grade 7 73.4% 12.5% 4.6% 1.5% 8.0%Grade 8 70.4% 17.1% 4.2% 1.9% 6.5%Grade 9 72.3% 17.4% 4.4% 1.2% 4.7%Grade 10 77.0% 15.6% 3.3% 0.2% 3.9%Grade 11 77.8% 14.8% 2.2% 0.5% 4.7%Grade 12 79.5% 15.2% 1.5% 0.8% 3.0%

8/14/2019 BRAZORIA COUNTY - Alvin ISD - 1998 Texas School Survey of Drug and Alcohol Use
http://slidepdf.com/reader/full/brazoria-county-alvin-isd-1998-texas-school-survey-of-drug-and-alcohol 57/213
8/14/2019 BRAZORIA COUNTY - Alvin ISD - 1998 Texas School Survey of Drug and Alcohol Use
http://slidepdf.com/reader/full/brazoria-county-alvin-isd-1998-texas-school-survey-of-drug-and-alcohol 58/213
AlvinSpring 1998
______________________________________________________________________________________________
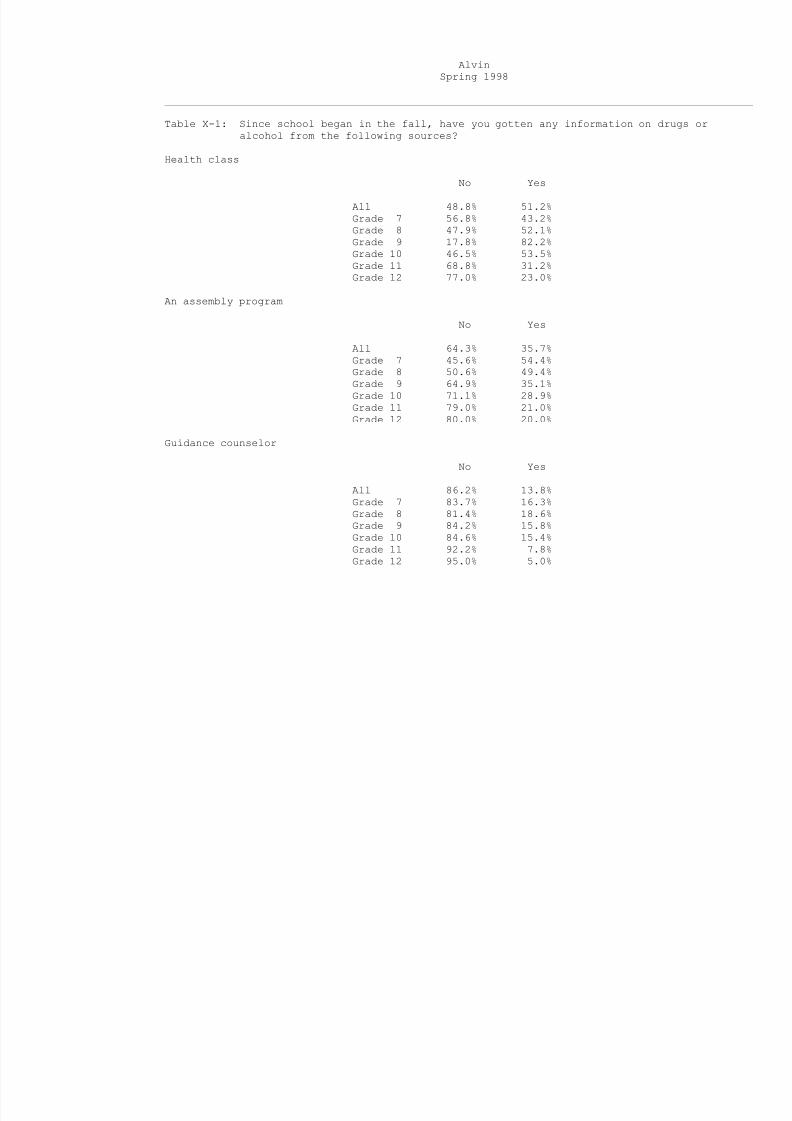
Table X-1: Since school began in the fall, have you gotten any information on drugs oralcohol from the following sources?
Health class
No Yes
All 48.8% 51.2%Grade 7 56.8% 43.2%Grade 8 47.9% 52.1%Grade 9 17.8% 82.2%Grade 10 46.5% 53.5%Grade 11 68.8% 31.2%Grade 12 77.0% 23.0%
An assembly program
No Yes
All 64.3% 35.7%Grade 7 45.6% 54.4%Grade 8 50.6% 49.4%Grade 9 64.9% 35.1%Grade 10 71.1% 28.9%Grade 11 79.0% 21.0%
Grade 12 80.0% 20.0%
Guidance counselor
No Yes
All 86.2% 13.8%Grade 7 83.7% 16.3%Grade 8 81.4% 18.6%Grade 9 84.2% 15.8%Grade 10 84.6% 15.4%Grade 11 92.2% 7.8%
Grade 12 95.0% 5.0%
8/14/2019 BRAZORIA COUNTY - Alvin ISD - 1998 Texas School Survey of Drug and Alcohol Use
http://slidepdf.com/reader/full/brazoria-county-alvin-isd-1998-texas-school-survey-of-drug-and-alcohol 59/213
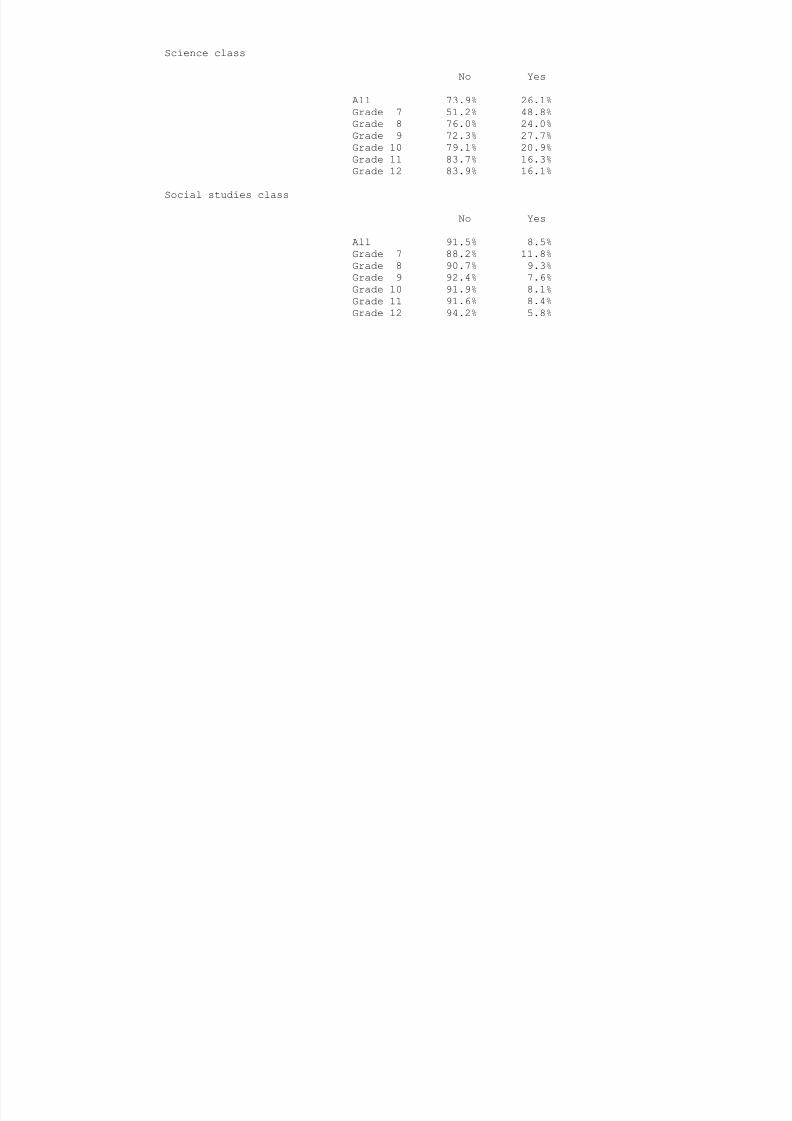
Science class
No Yes
All 73.9% 26.1%Grade 7 51.2% 48.8%Grade 8 76.0% 24.0%Grade 9 72.3% 27.7%
Grade 10 79.1% 20.9%Grade 11 83.7% 16.3%Grade 12 83.9% 16.1%
Social studies class
No Yes
All 91.5% 8.5%Grade 7 88.2% 11.8%Grade 8 90.7% 9.3%Grade 9 92.4% 7.6%Grade 10 91.9% 8.1%Grade 11 91.6% 8.4%Grade 12 94.2% 5.8%
8/14/2019 BRAZORIA COUNTY - Alvin ISD - 1998 Texas School Survey of Drug and Alcohol Use
http://slidepdf.com/reader/full/brazoria-county-alvin-isd-1998-texas-school-survey-of-drug-and-alcohol 60/213
AlvinSpring 1998
______________________________________________________________________________________________
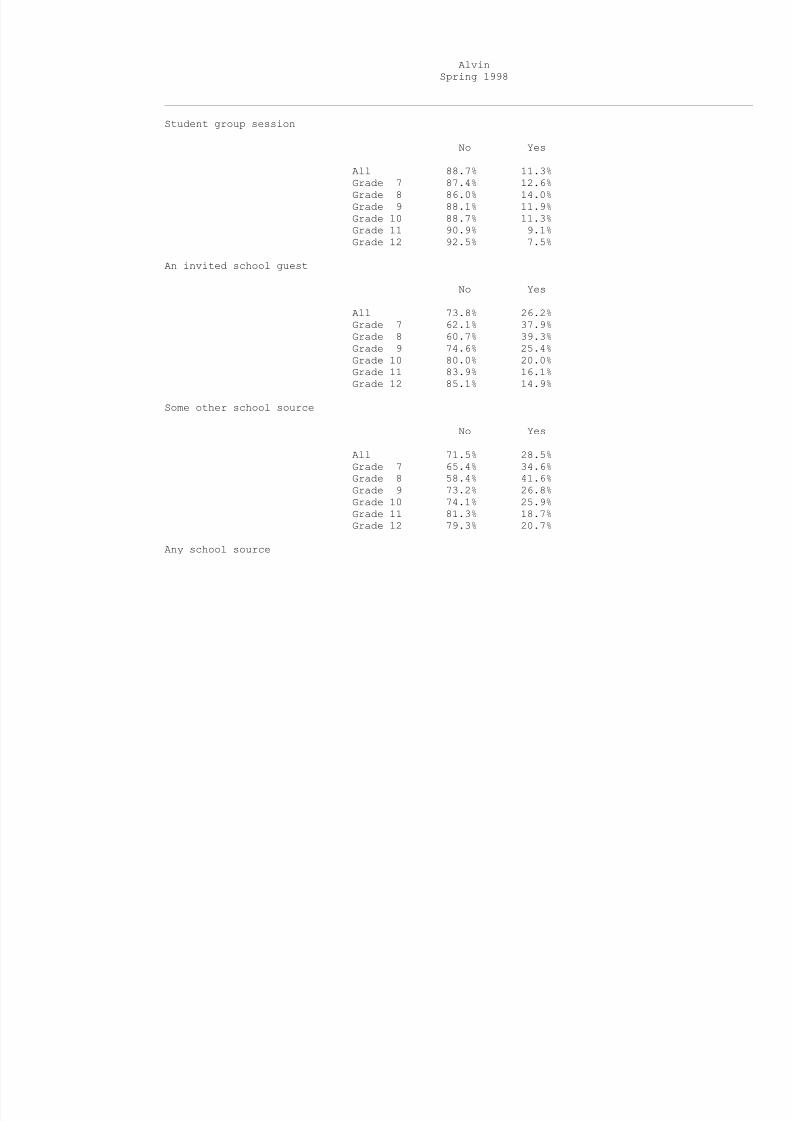
Student group session
No Yes
All 88.7% 11.3%Grade 7 87.4% 12.6%Grade 8 86.0% 14.0%Grade 9 88.1% 11.9%Grade 10 88.7% 11.3%Grade 11 90.9% 9.1%Grade 12 92.5% 7.5%
An invited school guest
No Yes
All 73.8% 26.2%Grade 7 62.1% 37.9%Grade 8 60.7% 39.3%Grade 9 74.6% 25.4%Grade 10 80.0% 20.0%Grade 11 83.9% 16.1%Grade 12 85.1% 14.9%
Some other school source
No Yes
All 71.5% 28.5%Grade 7 65.4% 34.6%Grade 8 58.4% 41.6%Grade 9 73.2% 26.8%Grade 10 74.1% 25.9%Grade 11 81.3% 18.7%Grade 12 79.3% 20.7%
Any school source
No Yes
8/14/2019 BRAZORIA COUNTY - Alvin ISD - 1998 Texas School Survey of Drug and Alcohol Use
http://slidepdf.com/reader/full/brazoria-county-alvin-isd-1998-texas-school-survey-of-drug-and-alcohol 61/213
o es
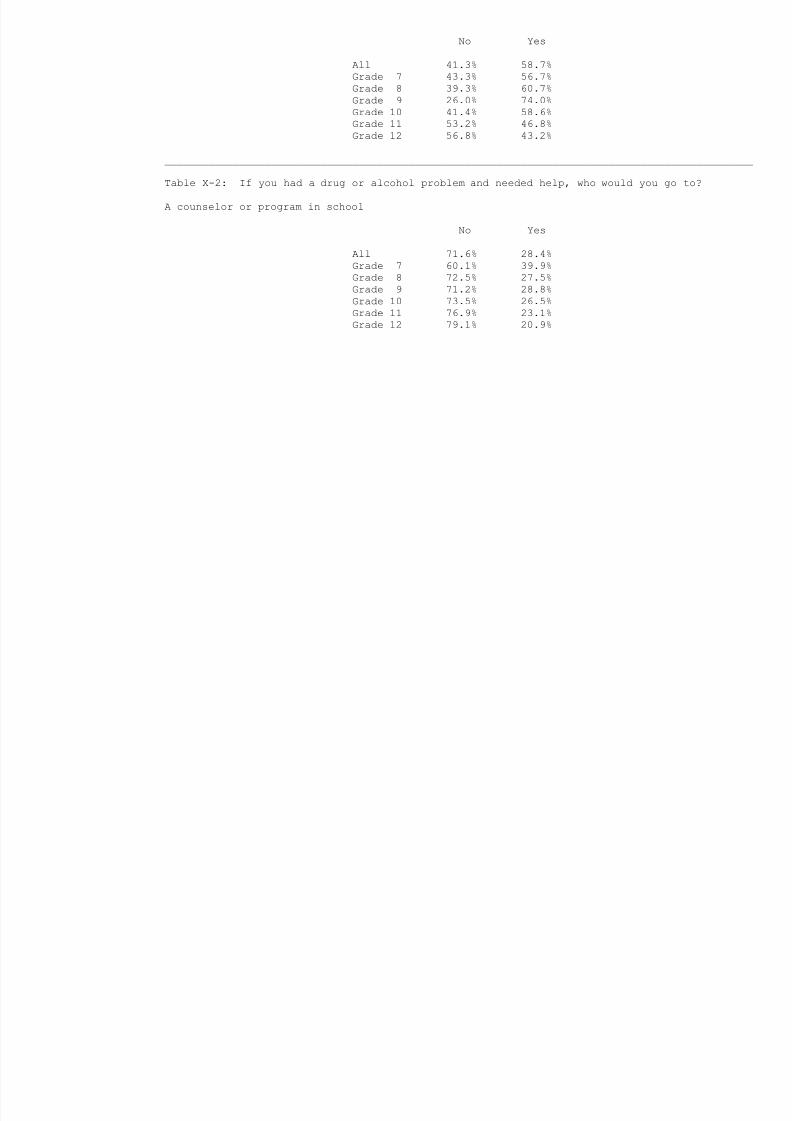
All 41.3% 58.7%Grade 7 43.3% 56.7%Grade 8 39.3% 60.7%Grade 9 26.0% 74.0%Grade 10 41.4% 58.6%Grade 11 53.2% 46.8%Grade 12 56.8% 43.2%
______________________________________________________________________________________________
Table X-2: If you had a drug or alcohol problem and needed help, who would you go to?
A counselor or program in school
No Yes
All 71.6% 28.4%Grade 7 60.1% 39.9%Grade 8 72.5% 27.5%
Grade 9 71.2% 28.8%Grade 10 73.5% 26.5%Grade 11 76.9% 23.1%Grade 12 79.1% 20.9%
8/14/2019 BRAZORIA COUNTY - Alvin ISD - 1998 Texas School Survey of Drug and Alcohol Use
http://slidepdf.com/reader/full/brazoria-county-alvin-isd-1998-texas-school-survey-of-drug-and-alcohol 62/213
AlvinSpring 1998
______________________________________________________________________________________________
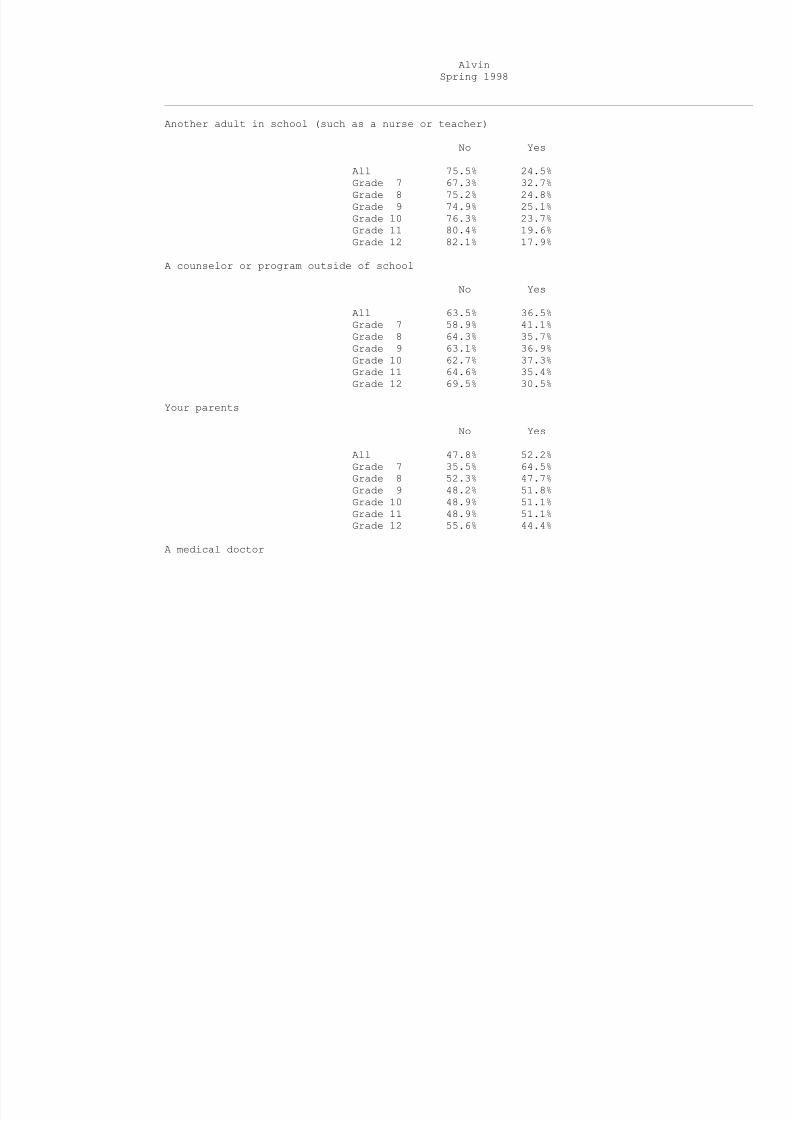
Another adult in school (such as a nurse or teacher)
No Yes
All 75.5% 24.5%Grade 7 67.3% 32.7%Grade 8 75.2% 24.8%Grade 9 74.9% 25.1%Grade 10 76.3% 23.7%Grade 11 80.4% 19.6%Grade 12 82.1% 17.9%
A counselor or program outside of school
No Yes
All 63.5% 36.5%Grade 7 58.9% 41.1%Grade 8 64.3% 35.7%Grade 9 63.1% 36.9%Grade 10 62.7% 37.3%Grade 11 64.6% 35.4%Grade 12 69.5% 30.5%
Your parents
No Yes
All 47.8% 52.2%Grade 7 35.5% 64.5%Grade 8 52.3% 47.7%Grade 9 48.2% 51.8%Grade 10 48.9% 51.1%Grade 11 48.9% 51.1%Grade 12 55.6% 44.4%
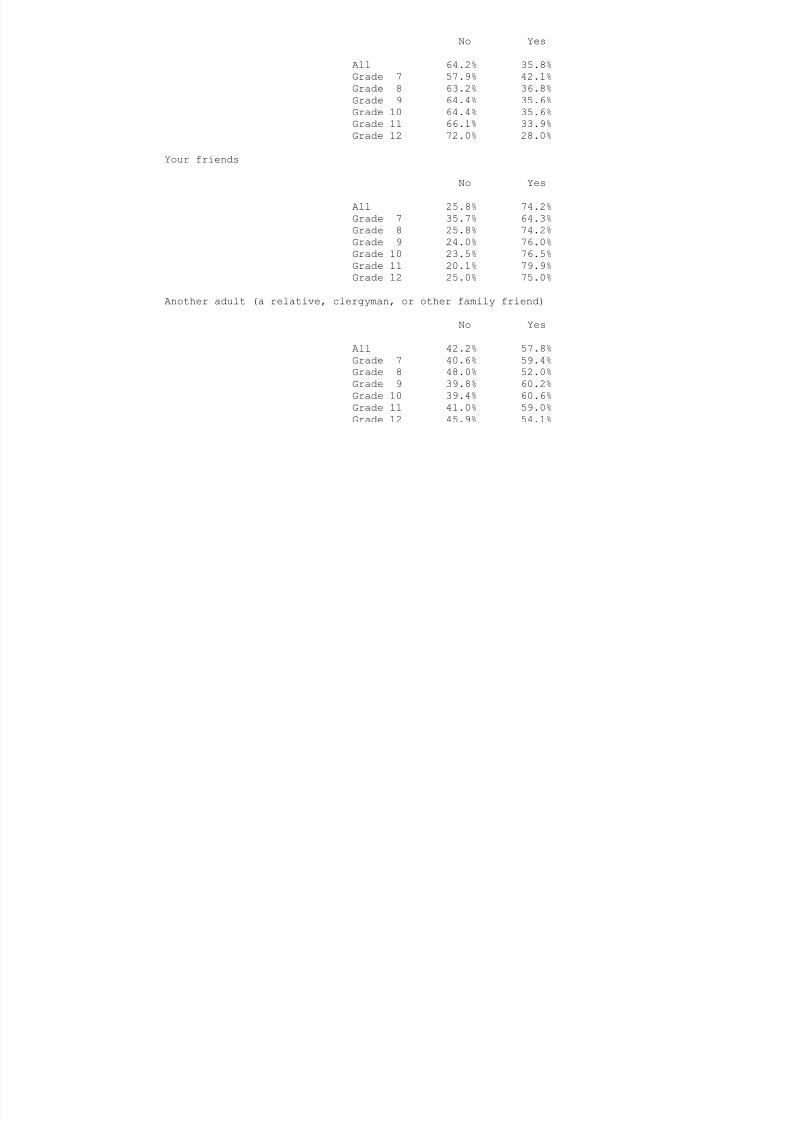
A medical doctor
No Yes
8/14/2019 BRAZORIA COUNTY - Alvin ISD - 1998 Texas School Survey of Drug and Alcohol Use
http://slidepdf.com/reader/full/brazoria-county-alvin-isd-1998-texas-school-survey-of-drug-and-alcohol 63/213
All 64.2% 35.8%Grade 7 57.9% 42.1%Grade 8 63.2% 36.8%Grade 9 64.4% 35.6%Grade 10 64.4% 35.6%Grade 11 66.1% 33.9%Grade 12 72.0% 28.0%
Your friends
No Yes
All 25.8% 74.2%Grade 7 35.7% 64.3%Grade 8 25.8% 74.2%Grade 9 24.0% 76.0%Grade 10 23.5% 76.5%Grade 11 20.1% 79.9%Grade 12 25.0% 75.0%
Another adult (a relative, clergyman, or other family friend)
No Yes
All 42.2% 57.8%Grade 7 40.6% 59.4%Grade 8 48.0% 52.0%Grade 9 39.8% 60.2%Grade 10 39.4% 60.6%Grade 11 41.0% 59.0%
Grade 12 45.9% 54.1%
8/14/2019 BRAZORIA COUNTY - Alvin ISD - 1998 Texas School Survey of Drug and Alcohol Use
http://slidepdf.com/reader/full/brazoria-county-alvin-isd-1998-texas-school-survey-of-drug-and-alcohol 64/213
AlvinSpring 1998
______________________________________________________________________________________________
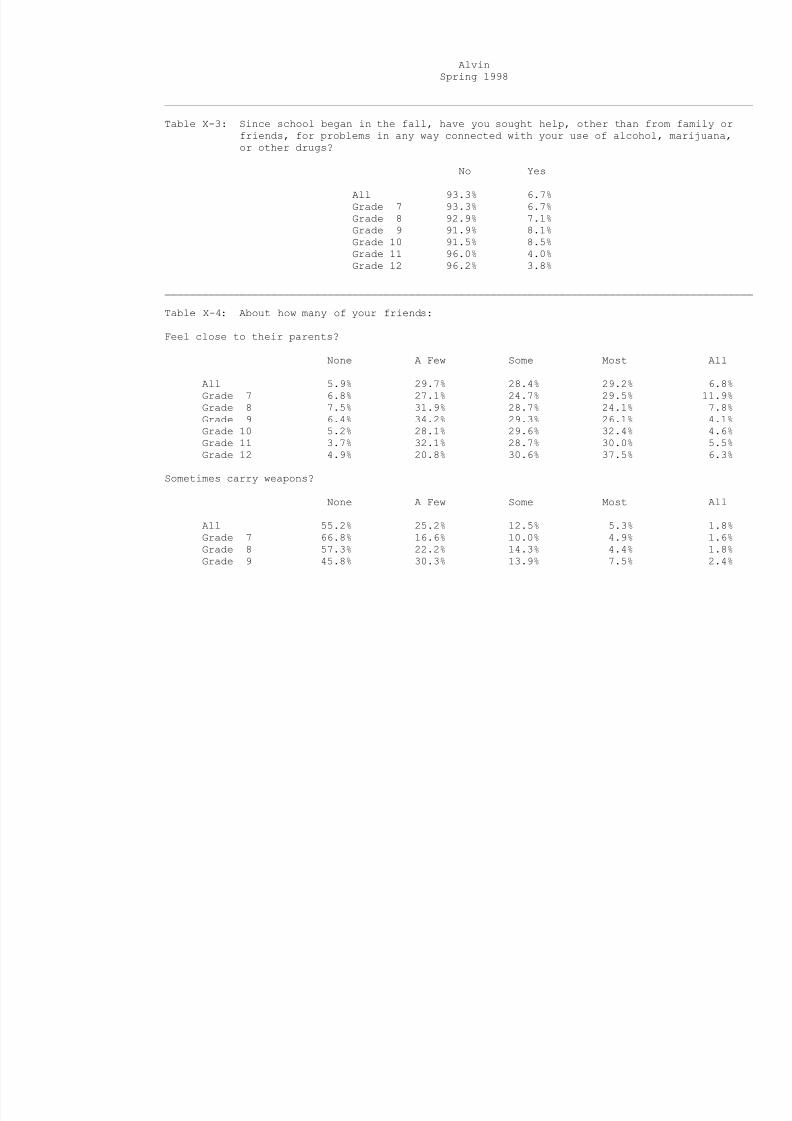
Table X-3: Since school began in the fall, have you sought help, other than from family orfriends, for problems in any way connected with your use of alcohol, marijuana,
or other drugs?
No Yes
All 93.3% 6.7%Grade 7 93.3% 6.7%Grade 8 92.9% 7.1%Grade 9 91.9% 8.1%Grade 10 91.5% 8.5%Grade 11 96.0% 4.0%Grade 12 96.2% 3.8%
______________________________________________________________________________________________
Table X-4: About how many of your friends:
Feel close to their parents?
None A Few Some Most All
All 5.9% 29.7% 28.4% 29.2% 6.8%Grade 7 6.8% 27.1% 24.7% 29.5% 11.9%Grade 8 7.5% 31.9% 28.7% 24.1% 7.8%
Grade 9 6.4% 34.2% 29.3% 26.1% 4.1%Grade 10 5.2% 28.1% 29.6% 32.4% 4.6%Grade 11 3.7% 32.1% 28.7% 30.0% 5.5%Grade 12 4.9% 20.8% 30.6% 37.5% 6.3%
Sometimes carry weapons?
None A Few Some Most All
All 55.2% 25.2% 12.5% 5.3% 1.8%Grade 7 66.8% 16.6% 10.0% 4.9% 1.6%Grade 8 57.3% 22.2% 14.3% 4.4% 1.8%
Grade 9 45.8% 30.3% 13.9% 7.5% 2.4%
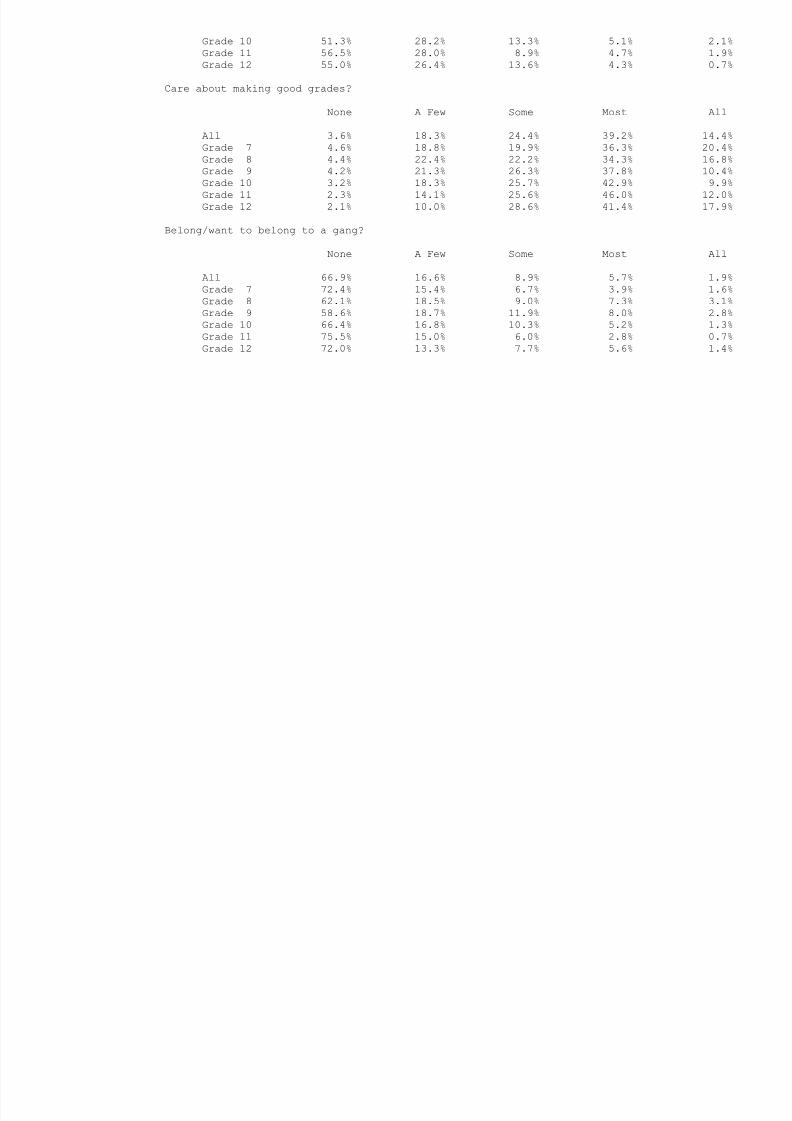
Grade 10 51.3% 28.2% 13.3% 5.1% 2.1%
8/14/2019 BRAZORIA COUNTY - Alvin ISD - 1998 Texas School Survey of Drug and Alcohol Use
http://slidepdf.com/reader/full/brazoria-county-alvin-isd-1998-texas-school-survey-of-drug-and-alcohol 65/213
Grade 11 56.5% 28.0% 8.9% 4.7% 1.9%Grade 12 55.0% 26.4% 13.6% 4.3% 0.7%
Care about making good grades?
None A Few Some Most All
All 3.6% 18.3% 24.4% 39.2% 14.4%
Grade 7 4.6% 18.8% 19.9% 36.3% 20.4%Grade 8 4.4% 22.4% 22.2% 34.3% 16.8%Grade 9 4.2% 21.3% 26.3% 37.8% 10.4%Grade 10 3.2% 18.3% 25.7% 42.9% 9.9%Grade 11 2.3% 14.1% 25.6% 46.0% 12.0%Grade 12 2.1% 10.0% 28.6% 41.4% 17.9%
Belong/want to belong to a gang?
None A Few Some Most All
All 66.9% 16.6% 8.9% 5.7% 1.9%
Grade 7 72.4% 15.4% 6.7% 3.9% 1.6%Grade 8 62.1% 18.5% 9.0% 7.3% 3.1%Grade 9 58.6% 18.7% 11.9% 8.0% 2.8%Grade 10 66.4% 16.8% 10.3% 5.2% 1.3%Grade 11 75.5% 15.0% 6.0% 2.8% 0.7%Grade 12 72.0% 13.3% 7.7% 5.6% 1.4%
8/14/2019 BRAZORIA COUNTY - Alvin ISD - 1998 Texas School Survey of Drug and Alcohol Use
http://slidepdf.com/reader/full/brazoria-county-alvin-isd-1998-texas-school-survey-of-drug-and-alcohol 66/213
AlvinSpring 1998
______________________________________________________________________________________________
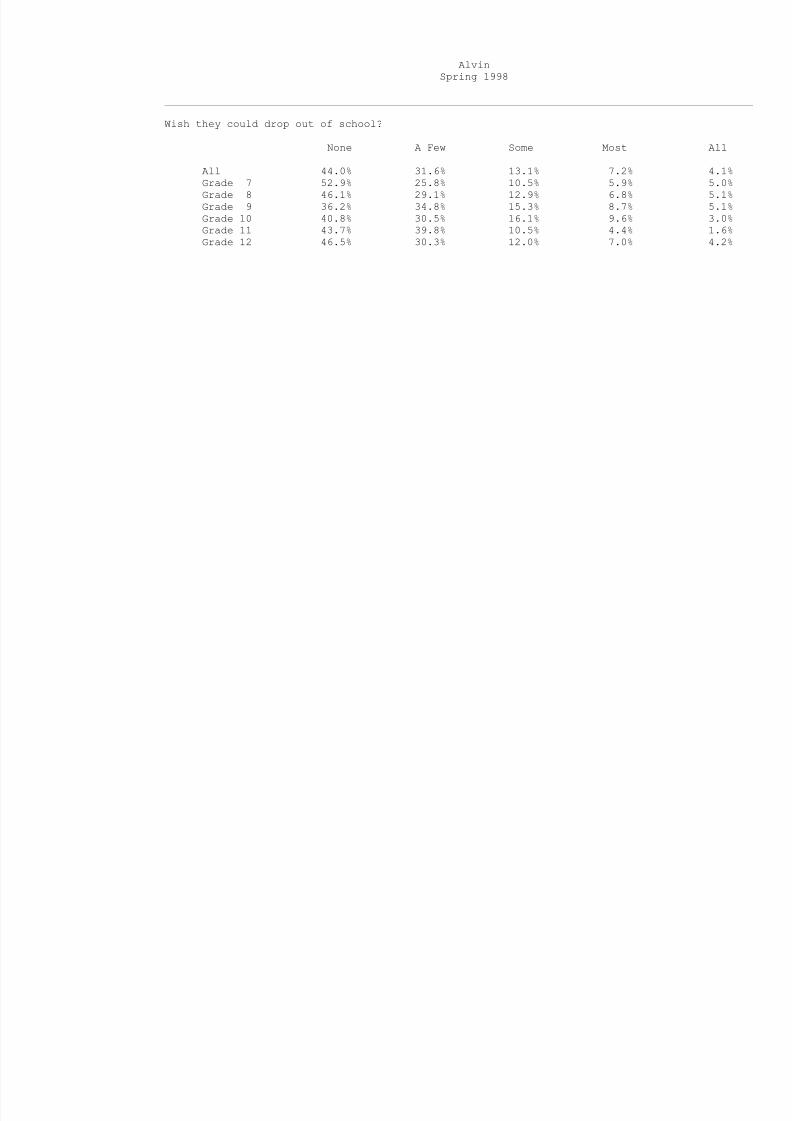
Wish they could drop out of school?
None A Few Some Most All
All 44.0% 31.6% 13.1% 7.2% 4.1%Grade 7 52.9% 25.8% 10.5% 5.9% 5.0%Grade 8 46.1% 29.1% 12.9% 6.8% 5.1%Grade 9 36.2% 34.8% 15.3% 8.7% 5.1%Grade 10 40.8% 30.5% 16.1% 9.6% 3.0%Grade 11 43.7% 39.8% 10.5% 4.4% 1.6%Grade 12 46.5% 30.3% 12.0% 7.0% 4.2%

8/14/2019 BRAZORIA COUNTY - Alvin ISD - 1998 Texas School Survey of Drug and Alcohol Use
http://slidepdf.com/reader/full/brazoria-county-alvin-isd-1998-texas-school-survey-of-drug-and-alcohol 67/213
Alvini 1998
8/14/2019 BRAZORIA COUNTY - Alvin ISD - 1998 Texas School Survey of Drug and Alcohol Use
http://slidepdf.com/reader/full/brazoria-county-alvin-isd-1998-texas-school-survey-of-drug-and-alcohol 68/213
Spring 1998
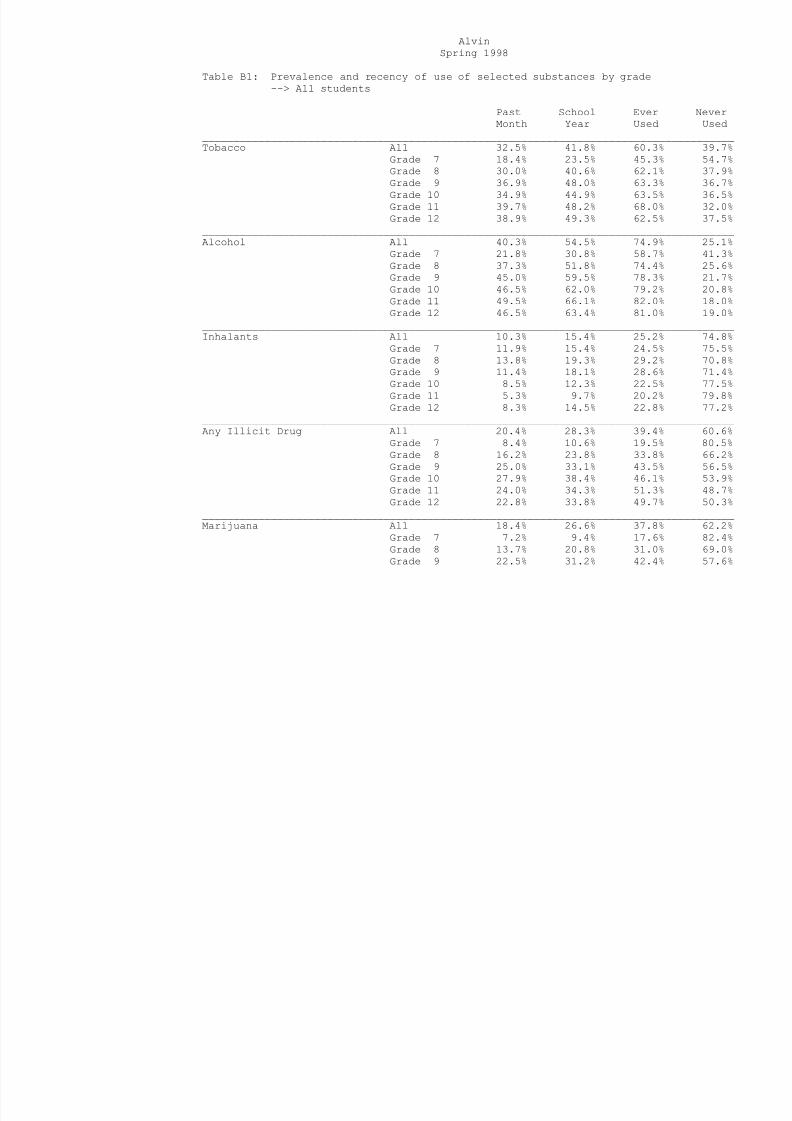
Table B1: Prevalence and recency of use of selected substances by grade--> All students
Past School Ever NeverMonth Year Used Used
_____________________________________________________________________________________
Tobacco All 32.5% 41.8% 60.3% 39.7%Grade 7 18.4% 23.5% 45.3% 54.7%Grade 8 30.0% 40.6% 62.1% 37.9%Grade 9 36.9% 48.0% 63.3% 36.7%Grade 10 34.9% 44.9% 63.5% 36.5%Grade 11 39.7% 48.2% 68.0% 32.0%Grade 12 38.9% 49.3% 62.5% 37.5%
_____________________________________________________________________________________Alcohol All 40.3% 54.5% 74.9% 25.1%
Grade 7 21.8% 30.8% 58.7% 41.3%Grade 8 37.3% 51.8% 74.4% 25.6%Grade 9 45.0% 59.5% 78.3% 21.7%
Grade 10 46.5% 62.0% 79.2% 20.8%Grade 11 49.5% 66.1% 82.0% 18.0%Grade 12 46.5% 63.4% 81.0% 19.0%
_____________________________________________________________________________________Inhalants All 10.3% 15.4% 25.2% 74.8%
Grade 7 11.9% 15.4% 24.5% 75.5%Grade 8 13.8% 19.3% 29.2% 70.8%Grade 9 11.4% 18.1% 28.6% 71.4%Grade 10 8.5% 12.3% 22.5% 77.5%Grade 11 5.3% 9.7% 20.2% 79.8%Grade 12 8.3% 14.5% 22.8% 77.2%
_____________________________________________________________________________________Any Illicit Drug All 20.4% 28.3% 39.4% 60.6%
Grade 7 8.4% 10.6% 19.5% 80.5%Grade 8 16.2% 23.8% 33.8% 66.2%Grade 9 25.0% 33.1% 43.5% 56.5%Grade 10 27.9% 38.4% 46.1% 53.9%Grade 11 24.0% 34.3% 51.3% 48.7%Grade 12 22.8% 33.8% 49.7% 50.3%
_____________________________________________________________________________________Marijuana All 18.4% 26.6% 37.8% 62.2%
Grade 7 7.2% 9.4% 17.6% 82.4%Grade 8 13.7% 20.8% 31.0% 69.0%
Grade 9 22.5% 31.2% 42.4% 57.6%
Grade 10 26.6% 36.4% 44.5% 55.5%G d 11 21 9% 32 9% 49 2% 50 8%

8/14/2019 BRAZORIA COUNTY - Alvin ISD - 1998 Texas School Survey of Drug and Alcohol Use
http://slidepdf.com/reader/full/brazoria-county-alvin-isd-1998-texas-school-survey-of-drug-and-alcohol 69/213
Grade 11 21.9% 32.9% 49.2% 50.8%Grade 12 20.7% 33.1% 49.0% 51.0%
_____________________________________________________________________________________Marijuana Only All 6.5% 10.7% 18.0% 82.0%
Grade 7 3.2% 4.2% 9.8% 90.2%Grade 8 4.3% 7.8% 13.8% 86.2%Grade 9 7.7% 12.6% 20.1% 79.9%Grade 10 9.7% 15.9% 20.3% 79.7%
Grade 11 7.7% 13.4% 25.5% 74.5%Grade 12 7.5% 12.3% 22.6% 77.4%
_____________________________________________________________________________________Cocaine or Crack All 4.5% 7.3% 11.2% 88.8%
Grade 7 1.9% 2.4% 4.4% 95.6%Grade 8 3.0% 4.4% 7.3% 92.7%Grade 9 6.0% 9.1% 13.5% 86.5%Grade 10 7.2% 11.2% 14.7% 85.3%Grade 11 4.2% 8.4% 12.6% 87.4%Grade 12 4.9% 9.2% 16.9% 83.1%
_____________________________________________________________________________________Cocaine All 4.0% 6.8% 10.6% 89.4%
Grade 7 1.4% 1.9% 3.2% 96.8%Grade 8 2.4% 3.8% 6.3% 93.7%Grade 9 5.3% 8.6% 13.5% 86.5%Grade 10 6.6% 10.9% 14.6% 85.4%Grade 11 4.0% 8.1% 12.4% 87.6%Grade 12 4.3% 8.6% 15.8% 84.2%
AlvinS i 1998

8/14/2019 BRAZORIA COUNTY - Alvin ISD - 1998 Texas School Survey of Drug and Alcohol Use
http://slidepdf.com/reader/full/brazoria-county-alvin-isd-1998-texas-school-survey-of-drug-and-alcohol 70/213
Spring 1998
Table B1 continued from previous page
Past School Ever NeverMonth Year Used Used
_____________________________________________________________________________________Crack All 1.3% 1.9% 3.4% 96.6%
Grade 7 0.7% 0.8% 2.1% 97.9%Grade 8 1.3% 1.7% 3.9% 96.1%Grade 9 2.3% 3.6% 4.5% 95.5%Grade 10 1.4% 2.2% 3.1% 96.9%Grade 11 1.0% 1.4% 2.7% 97.3%Grade 12 0.7% 0.7% 3.6% 96.4%
_____________________________________________________________________________________Hallucinogens All 3.7% 6.0% 9.8% 90.2%
Grade 7 1.1% 1.4% 2.4% 97.6%Grade 8 2.9% 5.2% 8.5% 91.5%Grade 9 3.9% 6.7% 11.2% 88.8%Grade 10 6.6% 8.7% 12.0% 88.0%
Grade 11 4.1% 7.2% 12.5% 87.5%Grade 12 3.7% 8.2% 14.9% 85.1%
_____________________________________________________________________________________Uppers All 4.1% 7.1% 10.8% 89.2%
Grade 7 1.6% 2.0% 3.2% 96.8%Grade 8 5.2% 7.6% 11.3% 88.7%Grade 9 3.4% 7.6% 10.8% 89.2%Grade 10 6.8% 10.2% 15.6% 84.4%Grade 11 3.9% 8.8% 15.3% 84.7%Grade 12 3.7% 6.7% 9.6% 90.4%
_____________________________________________________________________________________Downers All 2.9% 4.9% 8.2% 91.8%
Grade 7 1.0% 1.3% 3.4% 96.6%Grade 8 4.0% 6.1% 9.2% 90.8%Grade 9 3.8% 6.3% 9.4% 90.6%Grade 10 3.4% 5.3% 9.9% 90.1%Grade 11 2.9% 6.8% 10.8% 89.2%Grade 12 1.5% 2.3% 6.0% 94.0%
_____________________________________________________________________________________Rohypnol All 3.0% 4.4% 6.5% 93.5%
Grade 7 1.1% 1.6% 3.2% 96.8%Grade 8 3.5% 4.2% 7.3% 92.7%Grade 9 4.1% 6.1% 8.5% 91.5%
Grade 10 3.9% 6.1% 8.3% 91.7%
Grade 11 2.1% 3.3% 6.0% 94.0%Grade 12 3 0% 4 4% 4 4% 95 6%
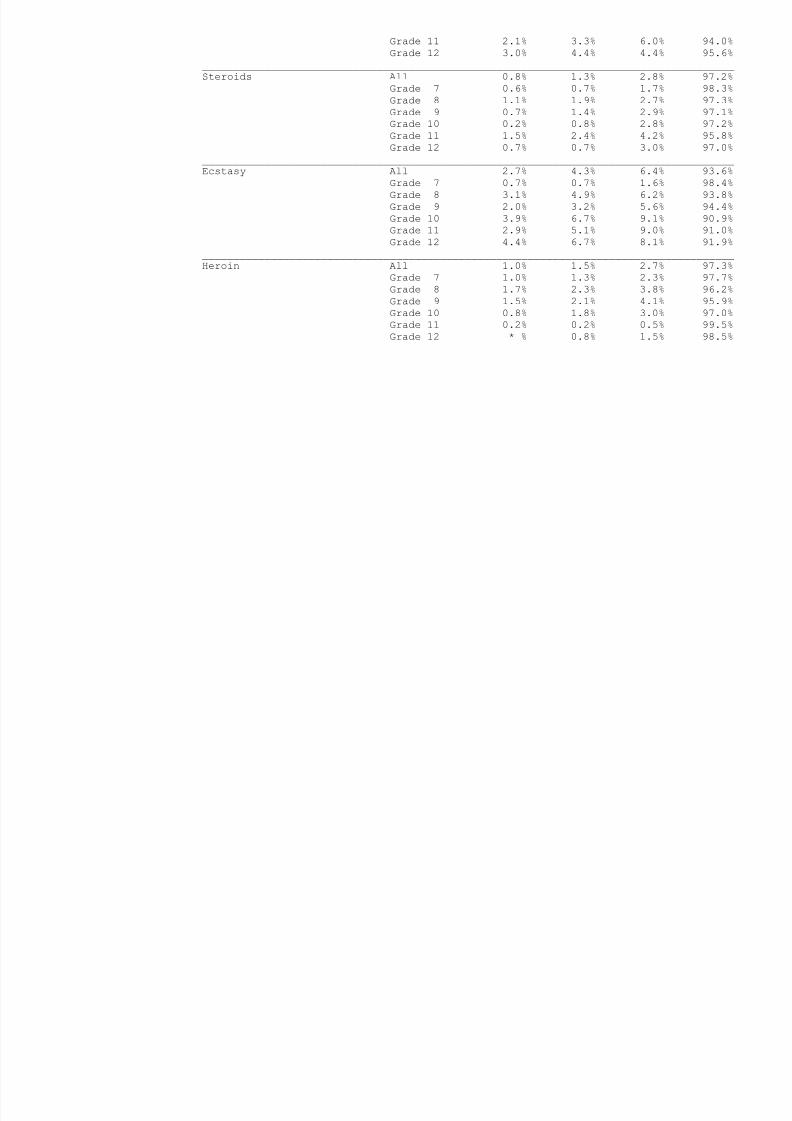
8/14/2019 BRAZORIA COUNTY - Alvin ISD - 1998 Texas School Survey of Drug and Alcohol Use
http://slidepdf.com/reader/full/brazoria-county-alvin-isd-1998-texas-school-survey-of-drug-and-alcohol 71/213
Grade 12 3.0% 4.4% 4.4% 95.6%_____________________________________________________________________________________Steroids All 0.8% 1.3% 2.8% 97.2%
Grade 7 0.6% 0.7% 1.7% 98.3%Grade 8 1.1% 1.9% 2.7% 97.3%Grade 9 0.7% 1.4% 2.9% 97.1%Grade 10 0.2% 0.8% 2.8% 97.2%Grade 11 1.5% 2.4% 4.2% 95.8%
Grade 12 0.7% 0.7% 3.0% 97.0%_____________________________________________________________________________________Ecstasy All 2.7% 4.3% 6.4% 93.6%
Grade 7 0.7% 0.7% 1.6% 98.4%Grade 8 3.1% 4.9% 6.2% 93.8%Grade 9 2.0% 3.2% 5.6% 94.4%Grade 10 3.9% 6.7% 9.1% 90.9%Grade 11 2.9% 5.1% 9.0% 91.0%Grade 12 4.4% 6.7% 8.1% 91.9%
_____________________________________________________________________________________Heroin All 1.0% 1.5% 2.7% 97.3%
Grade 7 1.0% 1.3% 2.3% 97.7%
Grade 8 1.7% 2.3% 3.8% 96.2%Grade 9 1.5% 2.1% 4.1% 95.9%Grade 10 0.8% 1.8% 3.0% 97.0%Grade 11 0.2% 0.2% 0.5% 99.5%Grade 12 * % 0.8% 1.5% 98.5%
AlvinSpring 1998

8/14/2019 BRAZORIA COUNTY - Alvin ISD - 1998 Texas School Survey of Drug and Alcohol Use
http://slidepdf.com/reader/full/brazoria-county-alvin-isd-1998-texas-school-survey-of-drug-and-alcohol 72/213
Spring 1998
Table B2: Prevalence and recency of use of selected substances by grade--> Male students
Past School Ever NeverMonth Year Used Used
_____________________________________________________________________________________
Tobacco All 35.2% 44.6% 63.3% 36.7%Grade 7 17.6% 22.4% 49.0% 51.0%Grade 8 29.8% 42.1% 60.0% 40.0%Grade 9 42.0% 51.4% 67.1% 32.9%Grade 10 37.4% 50.8% 69.7% 30.3%Grade 11 43.4% 50.2% 69.3% 30.7%Grade 12 47.2% 56.9% 69.4% 30.6%
_____________________________________________________________________________________Alcohol All 40.2% 52.9% 74.0% 26.0%
Grade 7 20.3% 29.2% 59.9% 40.1%Grade 8 37.8% 50.0% 72.4% 27.6%Grade 9 45.6% 58.8% 79.2% 20.8%
Grade 10 45.4% 60.4% 77.9% 22.1%Grade 11 50.7% 65.0% 80.3% 19.7%Grade 12 47.9% 62.0% 77.5% 22.5%
_____________________________________________________________________________________Inhalants All 12.4% 17.7% 27.6% 72.4%
Grade 7 11.2% 14.1% 22.1% 77.9%Grade 8 18.5% 24.0% 32.1% 67.9%Grade 9 13.0% 18.3% 28.2% 71.8%Grade 10 10.0% 16.2% 25.7% 74.3%Grade 11 7.4% 12.3% 26.1% 73.9%Grade 12 12.3% 20.5% 32.9% 67.1%
_____________________________________________________________________________________Any Illicit Drug All 24.1% 31.1% 42.1% 57.9%
Grade 7 9.5% 12.0% 22.3% 77.7%Grade 8 16.2% 24.3% 32.7% 67.3%Grade 9 30.2% 37.4% 48.3% 51.7%Grade 10 33.9% 42.1% 50.4% 49.6%Grade 11 31.9% 38.7% 56.4% 43.6%Grade 12 27.4% 38.4% 50.7% 49.3%
_____________________________________________________________________________________Marijuana All 21.8% 29.5% 41.2% 58.8%
Grade 7 7.9% 10.7% 20.7% 79.3%Grade 8 14.5% 22.8% 31.9% 68.1%
Grade 9 27.5% 34.8% 47.5% 52.5%
Grade 10 32.9% 41.5% 50.9% 49.1%Grade 11 28 8% 36 4% 54 5% 45 5%

8/14/2019 BRAZORIA COUNTY - Alvin ISD - 1998 Texas School Survey of Drug and Alcohol Use
http://slidepdf.com/reader/full/brazoria-county-alvin-isd-1998-texas-school-survey-of-drug-and-alcohol 73/213
Grade 11 28.8% 36.4% 54.5% 45.5%Grade 12 23.3% 37.0% 49.3% 50.7%
_____________________________________________________________________________________Marijuana Only All 7.7% 11.1% 18.6% 81.4%
Grade 7 3.2% 4.4% 11.1% 88.9%Grade 8 4.8% 8.0% 13.5% 86.5%Grade 9 9.5% 14.5% 22.8% 77.2%Grade 10 12.3% 17.6% 23.0% 77.0%
Grade 11 10.7% 14.1% 26.7% 73.3%Grade 12 6.8% 9.5% 16.2% 83.8%
_____________________________________________________________________________________Cocaine or Crack All 6.3% 9.4% 14.1% 85.9%
Grade 7 2.1% 2.4% 4.5% 95.5%Grade 8 3.7% 4.9% 8.2% 91.8%Grade 9 9.0% 11.2% 15.4% 84.6%Grade 10 9.7% 15.0% 19.8% 80.2%Grade 11 7.1% 12.2% 16.2% 83.8%Grade 12 6.9% 13.9% 26.4% 73.6%
_____________________________________________________________________________________Cocaine All 5.6% 8.8% 13.7% 86.3%
Grade 7 1.9% 1.9% 3.8% 96.2%Grade 8 3.1% 4.6% 8.4% 91.6%Grade 9 7.6% 10.3% 15.2% 84.8%Grade 10 8.1% 14.0% 19.5% 80.5%Grade 11 6.7% 11.3% 15.5% 84.5%Grade 12 7.0% 14.1% 25.4% 74.6%
AlvinSpring 1998

8/14/2019 BRAZORIA COUNTY - Alvin ISD - 1998 Texas School Survey of Drug and Alcohol Use
http://slidepdf.com/reader/full/brazoria-county-alvin-isd-1998-texas-school-survey-of-drug-and-alcohol 74/213
Spring 1998
Table B2 continued from previous page
Past School Ever NeverMonth Year Used Used
_____________________________________________________________________________________Crack All 1.8% 2.5% 4.6% 95.4%
Grade 7 0.3% 0.6% 1.4% 98.6%Grade 8 0.8% 0.8% 3.1% 96.9%Grade 9 4.1% 5.7% 6.8% 93.2%Grade 10 2.8% 3.7% 5.6% 94.4%Grade 11 1.6% 2.7% 4.8% 95.2%Grade 12 * % * % 5.9% 94.1%
_____________________________________________________________________________________Hallucinogens All 5.5% 8.0% 12.3% 87.7%
Grade 7 1.4% 1.6% 3.3% 96.7%Grade 8 3.8% 6.5% 8.8% 91.2%Grade 9 6.3% 9.6% 14.6% 85.4%Grade 10 10.7% 11.6% 16.9% 83.1%
Grade 11 6.2% 10.4% 15.6% 84.4%Grade 12 5.9% 10.3% 17.6% 82.4%
_____________________________________________________________________________________Uppers All 4.6% 7.9% 11.5% 88.5%
Grade 7 2.1% 2.1% 2.9% 97.1%Grade 8 6.1% 7.8% 9.4% 90.6%Grade 9 3.5% 8.3% 11.8% 88.2%Grade 10 9.4% 10.8% 16.5% 83.5%Grade 11 3.1% 9.4% 16.7% 83.3%Grade 12 4.5% 10.6% 15.2% 84.8%
_____________________________________________________________________________________Downers All 3.2% 6.0% 9.6% 90.4%
Grade 7 1.5% 1.8% 4.2% 95.8%Grade 8 4.6% 7.9% 9.6% 90.4%Grade 9 3.5% 6.9% 10.8% 89.2%Grade 10 5.1% 7.4% 12.4% 87.6%Grade 11 2.7% 8.6% 12.3% 87.7%Grade 12 1.5% 3.0% 9.1% 90.9%
_____________________________________________________________________________________Rohypnol All 3.8% 5.8% 7.8% 92.2%
Grade 7 1.1% 2.0% 4.2% 95.8%Grade 8 5.1% 6.3% 9.1% 90.9%Grade 9 4.3% 6.6% 8.6% 91.4%
Grade 10 4.6% 8.3% 10.6% 89.4%
Grade 11 3.7% 5.2% 7.3% 92.7%Grade 12 4.3% 7.1% 7.1% 92.9%

8/14/2019 BRAZORIA COUNTY - Alvin ISD - 1998 Texas School Survey of Drug and Alcohol Use
http://slidepdf.com/reader/full/brazoria-county-alvin-isd-1998-texas-school-survey-of-drug-and-alcohol 75/213
Grade 12 4.3% 7.1% 7.1% 92.9%_____________________________________________________________________________________Steroids All 1.3% 2.1% 4.0% 96.0%
Grade 7 0.9% 0.9% 1.8% 98.2%Grade 8 1.6% 2.4% 3.3% 96.7%Grade 9 1.4% 2.5% 5.0% 95.0%Grade 10 0.5% 1.4% 4.2% 95.8%Grade 11 2.1% 4.3% 7.4% 92.6%
Grade 12 1.5% 1.5% 2.9% 97.1%_____________________________________________________________________________________Ecstasy All 3.3% 5.2% 7.0% 93.0%
Grade 7 0.6% 0.6% 1.5% 98.5%Grade 8 2.1% 5.0% 5.9% 94.1%Grade 9 3.1% 4.2% 7.0% 93.0%Grade 10 5.6% 9.3% 12.0% 88.0%Grade 11 3.7% 5.3% 8.9% 91.1%Grade 12 5.9% 8.8% 8.8% 91.2%
_____________________________________________________________________________________Heroin All 1.3% 1.8% 3.4% 96.6%
Grade 7 1.4% 1.7% 2.6% 97.4%
Grade 8 1.7% 2.5% 3.4% 96.6%Grade 9 2.1% 2.8% 6.0% 94.0%Grade 10 1.4% 2.3% 4.2% 95.8%Grade 11 0.5% 0.5% 1.1% 98.9%Grade 12 * % * % 1.5% 98.5%
AlvinSpring 1998
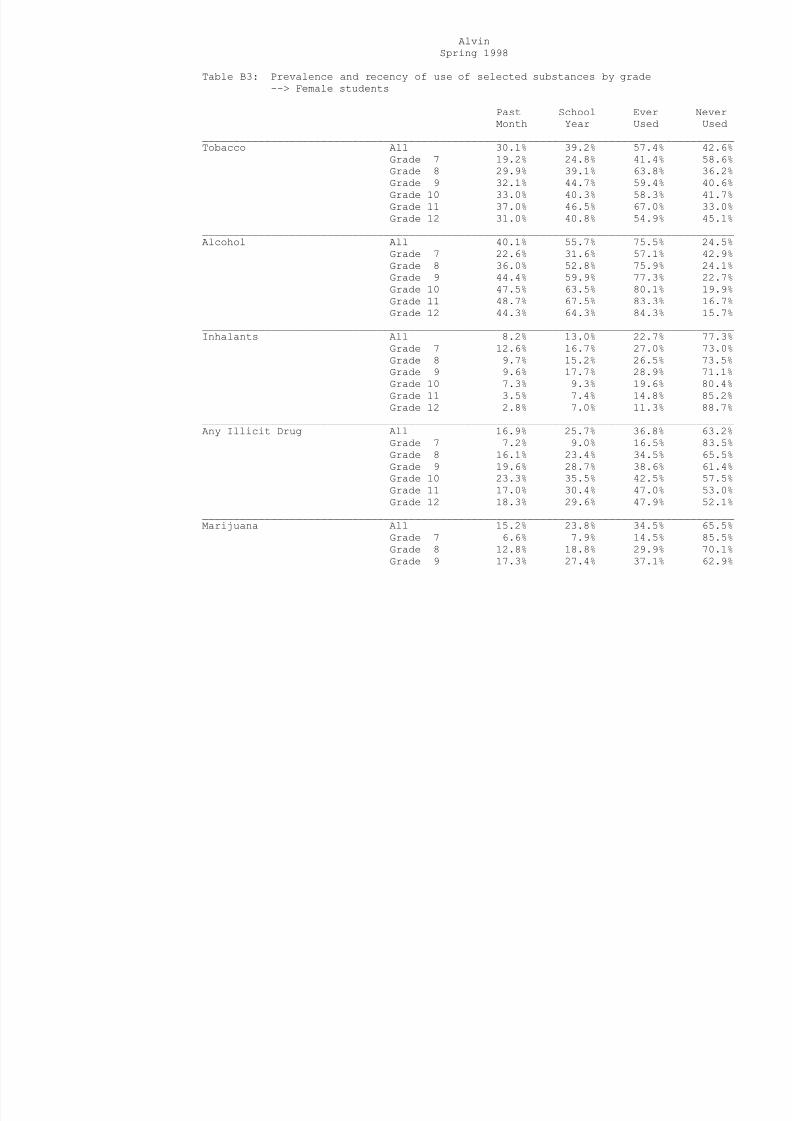
8/14/2019 BRAZORIA COUNTY - Alvin ISD - 1998 Texas School Survey of Drug and Alcohol Use
http://slidepdf.com/reader/full/brazoria-county-alvin-isd-1998-texas-school-survey-of-drug-and-alcohol 76/213
Spring 1998
Table B3: Prevalence and recency of use of selected substances by grade--> Female students
Past School Ever NeverMonth Year Used Used
_____________________________________________________________________________________
Tobacco All 30.1% 39.2% 57.4% 42.6%Grade 7 19.2% 24.8% 41.4% 58.6%Grade 8 29.9% 39.1% 63.8% 36.2%Grade 9 32.1% 44.7% 59.4% 40.6%Grade 10 33.0% 40.3% 58.3% 41.7%Grade 11 37.0% 46.5% 67.0% 33.0%Grade 12 31.0% 40.8% 54.9% 45.1%
_____________________________________________________________________________________Alcohol All 40.1% 55.7% 75.5% 24.5%
Grade 7 22.6% 31.6% 57.1% 42.9%Grade 8 36.0% 52.8% 75.9% 24.1%Grade 9 44.4% 59.9% 77.3% 22.7%
Grade 10 47.5% 63.5% 80.1% 19.9%Grade 11 48.7% 67.5% 83.3% 16.7%Grade 12 44.3% 64.3% 84.3% 15.7%
_____________________________________________________________________________________Inhalants All 8.2% 13.0% 22.7% 77.3%
Grade 7 12.6% 16.7% 27.0% 73.0%Grade 8 9.7% 15.2% 26.5% 73.5%Grade 9 9.6% 17.7% 28.9% 71.1%Grade 10 7.3% 9.3% 19.6% 80.4%Grade 11 3.5% 7.4% 14.8% 85.2%Grade 12 2.8% 7.0% 11.3% 88.7%
_____________________________________________________________________________________Any Illicit Drug All 16.9% 25.7% 36.8% 63.2%
Grade 7 7.2% 9.0% 16.5% 83.5%Grade 8 16.1% 23.4% 34.5% 65.5%Grade 9 19.6% 28.7% 38.6% 61.4%Grade 10 23.3% 35.5% 42.5% 57.5%Grade 11 17.0% 30.4% 47.0% 53.0%Grade 12 18.3% 29.6% 47.9% 52.1%
_____________________________________________________________________________________Marijuana All 15.2% 23.8% 34.5% 65.5%
Grade 7 6.6% 7.9% 14.5% 85.5%Grade 8 12.8% 18.8% 29.9% 70.1%
Grade 9 17.3% 27.4% 37.1% 62.9%
Grade 10 21.7% 32.4% 39.5% 60.5%Grade 11 15.8% 29.8% 44.7% 55.3%
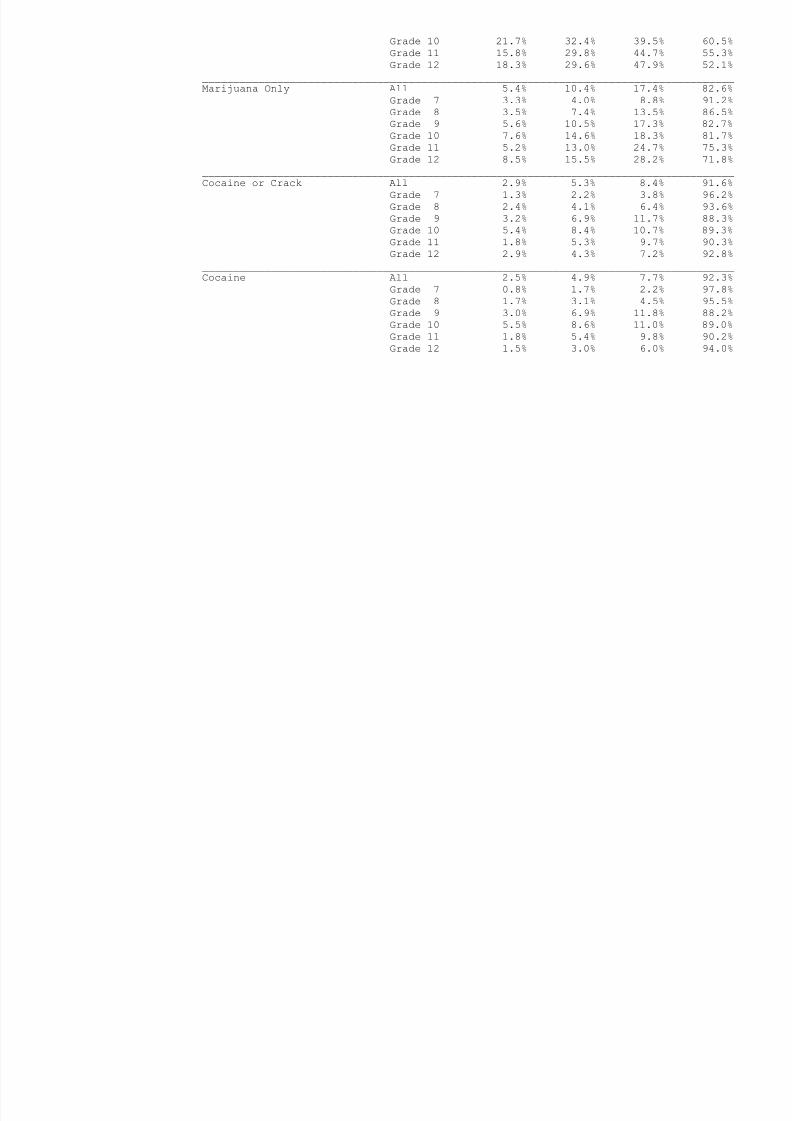
8/14/2019 BRAZORIA COUNTY - Alvin ISD - 1998 Texas School Survey of Drug and Alcohol Use
http://slidepdf.com/reader/full/brazoria-county-alvin-isd-1998-texas-school-survey-of-drug-and-alcohol 77/213
Grade 12 18.3% 29.6% 47.9% 52.1%_____________________________________________________________________________________Marijuana Only All 5.4% 10.4% 17.4% 82.6%
Grade 7 3.3% 4.0% 8.8% 91.2%Grade 8 3.5% 7.4% 13.5% 86.5%Grade 9 5.6% 10.5% 17.3% 82.7%Grade 10 7.6% 14.6% 18.3% 81.7%
Grade 11 5.2% 13.0% 24.7% 75.3%Grade 12 8.5% 15.5% 28.2% 71.8%_____________________________________________________________________________________Cocaine or Crack All 2.9% 5.3% 8.4% 91.6%
Grade 7 1.3% 2.2% 3.8% 96.2%Grade 8 2.4% 4.1% 6.4% 93.6%Grade 9 3.2% 6.9% 11.7% 88.3%Grade 10 5.4% 8.4% 10.7% 89.3%Grade 11 1.8% 5.3% 9.7% 90.3%Grade 12 2.9% 4.3% 7.2% 92.8%
_____________________________________________________________________________________Cocaine All 2.5% 4.9% 7.7% 92.3%
Grade 7 0.8% 1.7% 2.2% 97.8%Grade 8 1.7% 3.1% 4.5% 95.5%Grade 9 3.0% 6.9% 11.8% 88.2%Grade 10 5.5% 8.6% 11.0% 89.0%Grade 11 1.8% 5.4% 9.8% 90.2%Grade 12 1.5% 3.0% 6.0% 94.0%
AlvinSpring 1998
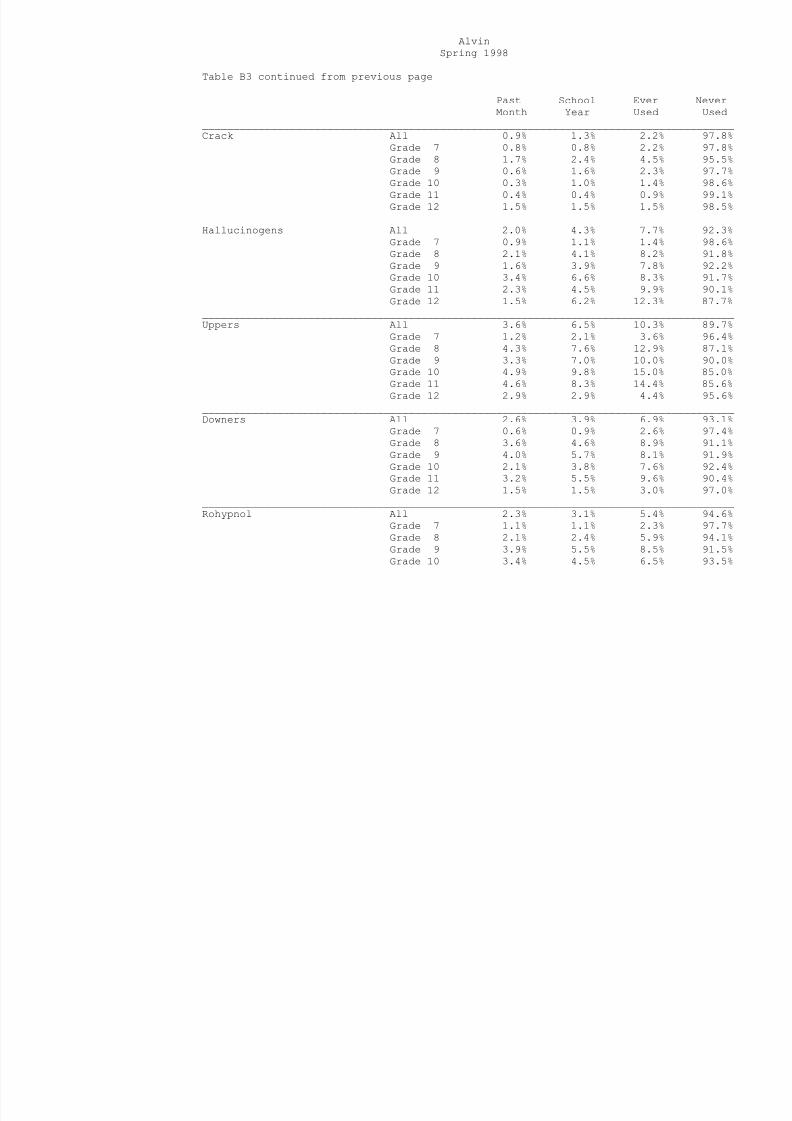
8/14/2019 BRAZORIA COUNTY - Alvin ISD - 1998 Texas School Survey of Drug and Alcohol Use
http://slidepdf.com/reader/full/brazoria-county-alvin-isd-1998-texas-school-survey-of-drug-and-alcohol 78/213
p g
Table B3 continued from previous page
Past School Ever NeverMonth Year Used Used
_____________________________________________________________________________________Crack All 0.9% 1.3% 2.2% 97.8%
Grade 7 0.8% 0.8% 2.2% 97.8%Grade 8 1.7% 2.4% 4.5% 95.5%Grade 9 0.6% 1.6% 2.3% 97.7%Grade 10 0.3% 1.0% 1.4% 98.6%Grade 11 0.4% 0.4% 0.9% 99.1%Grade 12 1.5% 1.5% 1.5% 98.5%
_____________________________________________________________________________________Hallucinogens All 2.0% 4.3% 7.7% 92.3%
Grade 7 0.9% 1.1% 1.4% 98.6%Grade 8 2.1% 4.1% 8.2% 91.8%Grade 9 1.6% 3.9% 7.8% 92.2%Grade 10 3.4% 6.6% 8.3% 91.7%
Grade 11 2.3% 4.5% 9.9% 90.1%Grade 12 1.5% 6.2% 12.3% 87.7%
_____________________________________________________________________________________Uppers All 3.6% 6.5% 10.3% 89.7%
Grade 7 1.2% 2.1% 3.6% 96.4%Grade 8 4.3% 7.6% 12.9% 87.1%Grade 9 3.3% 7.0% 10.0% 90.0%Grade 10 4.9% 9.8% 15.0% 85.0%Grade 11 4.6% 8.3% 14.4% 85.6%Grade 12 2.9% 2.9% 4.4% 95.6%
_____________________________________________________________________________________Downers All 2.6% 3.9% 6.9% 93.1%
Grade 7 0.6% 0.9% 2.6% 97.4%Grade 8 3.6% 4.6% 8.9% 91.1%Grade 9 4.0% 5.7% 8.1% 91.9%Grade 10 2.1% 3.8% 7.6% 92.4%Grade 11 3.2% 5.5% 9.6% 90.4%Grade 12 1.5% 1.5% 3.0% 97.0%
_____________________________________________________________________________________Rohypnol All 2.3% 3.1% 5.4% 94.6%
Grade 7 1.1% 1.1% 2.3% 97.7%Grade 8 2.1% 2.4% 5.9% 94.1%Grade 9 3.9% 5.5% 8.5% 91.5%
Grade 10 3.4% 4.5% 6.5% 93.5%
Grade 11 0.9% 1.8% 4.9% 95.1%Grade 12 1.6% 1.6% 1.6% 98.4%

8/14/2019 BRAZORIA COUNTY - Alvin ISD - 1998 Texas School Survey of Drug and Alcohol Use
http://slidepdf.com/reader/full/brazoria-county-alvin-isd-1998-texas-school-survey-of-drug-and-alcohol 79/213
_____________________________________________________________________________________Steroids All 0.2% 0.6% 1.7% 98.3%
Grade 7 0.3% 0.6% 1.7% 98.3%Grade 8 0.7% 1.4% 2.2% 97.8%Grade 9 * % 0.3% 1.0% 99.0%Grade 10 * % 0.3% 1.7% 98.3%Grade 11 0.5% 0.5% 0.9% 99.1%
Grade 12 * % * % 3.1% 96.9%_____________________________________________________________________________________Ecstasy All 2.3% 3.6% 5.8% 94.2%
Grade 7 0.9% 0.9% 1.8% 98.2%Grade 8 4.0% 4.7% 6.5% 93.5%Grade 9 1.0% 2.3% 4.4% 95.6%Grade 10 2.7% 4.8% 6.9% 93.1%Grade 11 2.3% 4.6% 8.7% 91.3%Grade 12 3.0% 4.5% 7.6% 92.4%
_____________________________________________________________________________________Heroin All 0.7% 1.2% 2.2% 97.8%
Grade 7 0.6% 0.9% 2.0% 98.0%
Grade 8 1.8% 2.1% 4.3% 95.7%Grade 9 1.0% 1.4% 2.4% 97.6%Grade 10 0.3% 1.4% 2.0% 98.0%Grade 11 * % * % * % 100.0%Grade 12 * % 1.5% 1.5% 98.5%
AlvinSpring 1998

8/14/2019 BRAZORIA COUNTY - Alvin ISD - 1998 Texas School Survey of Drug and Alcohol Use
http://slidepdf.com/reader/full/brazoria-county-alvin-isd-1998-texas-school-survey-of-drug-and-alcohol 80/213
Table B4: Prevalence and recency of use of selected substances by grade--> White students
Past School Ever NeverMonth Year Used Used
_____________________________________________________________________________________
Tobacco All 32.6% 41.9% 59.5% 40.5%Grade 7 17.7% 22.7% 44.0% 56.0%Grade 8 28.5% 39.2% 61.3% 38.7%Grade 9 36.6% 48.6% 62.8% 37.2%Grade 10 36.1% 44.8% 62.5% 37.5%Grade 11 42.8% 51.7% 66.9% 33.1%Grade 12 37.2% 47.7% 60.5% 39.5%
_____________________________________________________________________________________Alcohol All 40.0% 55.1% 74.9% 25.1%
Grade 7 19.0% 28.7% 56.7% 43.3%Grade 8 34.9% 50.9% 74.5% 25.5%Grade 9 46.0% 61.1% 79.8% 20.2%
Grade 10 47.1% 63.8% 79.7% 20.3%Grade 11 54.0% 70.0% 82.6% 17.4%Grade 12 41.9% 60.5% 77.9% 22.1%
_____________________________________________________________________________________Inhalants All 9.8% 14.9% 23.9% 76.1%
Grade 7 11.7% 14.3% 23.5% 76.5%Grade 8 13.2% 17.7% 26.2% 73.8%Grade 9 11.3% 18.9% 29.0% 71.0%Grade 10 7.2% 11.7% 21.2% 78.8%Grade 11 5.6% 10.1% 20.1% 79.9%Grade 12 7.0% 14.0% 19.8% 80.2%
_____________________________________________________________________________________Any Illicit Drug All 18.6% 25.6% 36.2% 63.8%
Grade 7 7.5% 8.9% 16.6% 83.4%Grade 8 13.8% 21.0% 29.8% 70.2%Grade 9 22.5% 29.5% 40.2% 59.8%Grade 10 24.3% 34.4% 42.7% 57.3%Grade 11 23.9% 34.3% 50.5% 49.5%Grade 12 22.1% 27.9% 43.0% 57.0%
_____________________________________________________________________________________Marijuana All 16.6% 23.9% 34.5% 65.5%
Grade 7 6.3% 7.8% 14.8% 85.2%Grade 8 10.8% 17.8% 26.5% 73.5%
Grade 9 20.0% 27.4% 39.0% 61.0%
Grade 10 23.5% 33.2% 41.5% 58.5%Grade 11 21.8% 33.3% 48.4% 51.6%
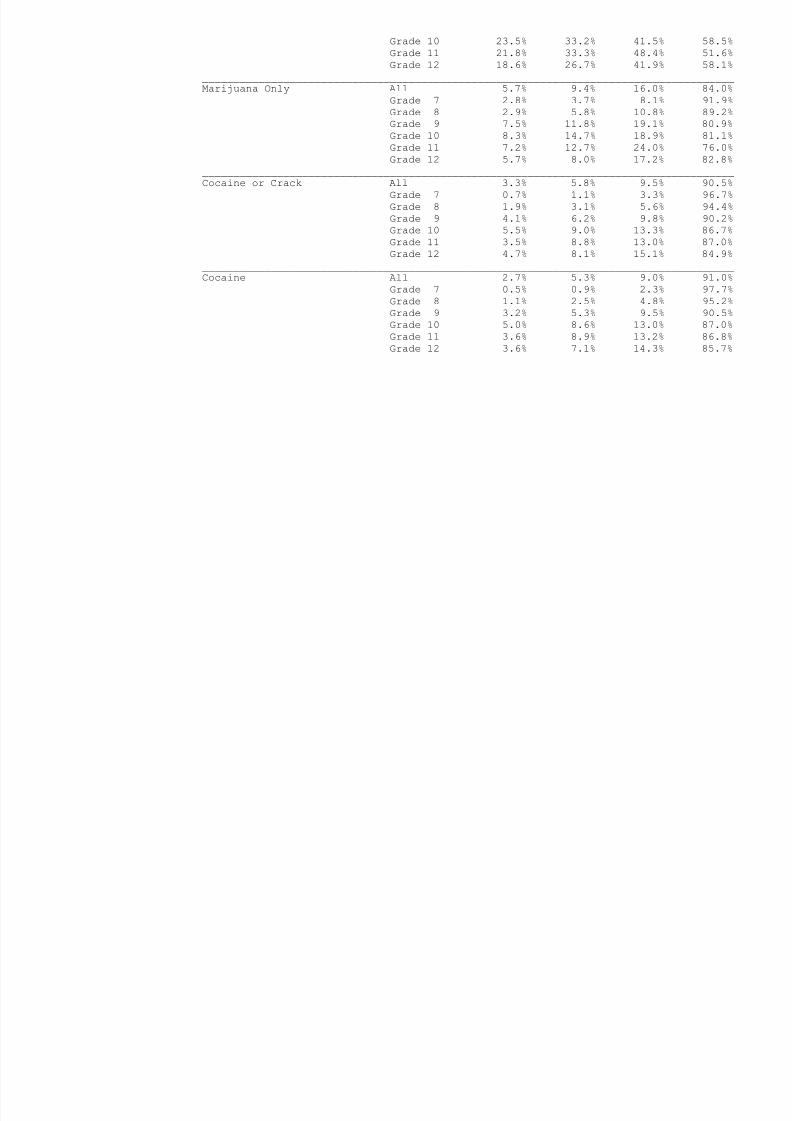
8/14/2019 BRAZORIA COUNTY - Alvin ISD - 1998 Texas School Survey of Drug and Alcohol Use
http://slidepdf.com/reader/full/brazoria-county-alvin-isd-1998-texas-school-survey-of-drug-and-alcohol 81/213
Grade 12 18.6% 26.7% 41.9% 58.1%_____________________________________________________________________________________Marijuana Only All 5.7% 9.4% 16.0% 84.0%
Grade 7 2.8% 3.7% 8.1% 91.9%Grade 8 2.9% 5.8% 10.8% 89.2%Grade 9 7.5% 11.8% 19.1% 80.9%Grade 10 8.3% 14.7% 18.9% 81.1%
Grade 11 7.2% 12.7% 24.0% 76.0%Grade 12 5.7% 8.0% 17.2% 82.8%_____________________________________________________________________________________Cocaine or Crack All 3.3% 5.8% 9.5% 90.5%
Grade 7 0.7% 1.1% 3.3% 96.7%Grade 8 1.9% 3.1% 5.6% 94.4%Grade 9 4.1% 6.2% 9.8% 90.2%Grade 10 5.5% 9.0% 13.3% 86.7%Grade 11 3.5% 8.8% 13.0% 87.0%Grade 12 4.7% 8.1% 15.1% 84.9%
_____________________________________________________________________________________Cocaine All 2.7% 5.3% 9.0% 91.0%
Grade 7 0.5% 0.9% 2.3% 97.7%Grade 8 1.1% 2.5% 4.8% 95.2%Grade 9 3.2% 5.3% 9.5% 90.5%Grade 10 5.0% 8.6% 13.0% 87.0%Grade 11 3.6% 8.9% 13.2% 86.8%Grade 12 3.6% 7.1% 14.3% 85.7%
AlvinSpring 1998

8/14/2019 BRAZORIA COUNTY - Alvin ISD - 1998 Texas School Survey of Drug and Alcohol Use
http://slidepdf.com/reader/full/brazoria-county-alvin-isd-1998-texas-school-survey-of-drug-and-alcohol 82/213
Table B4 continued from previous page
Past School Ever NeverMonth Year Used Used
_____________________________________________________________________________________Crack All 1.1% 1.5% 2.9% 97.1%
Grade 7 0.2% 0.2% 1.9% 98.1%Grade 8 1.1% 1.1% 3.4% 96.6%Grade 9 1.9% 3.2% 3.7% 96.3%Grade 10 1.2% 1.8% 2.7% 97.3%Grade 11 0.7% 1.1% 2.5% 97.5%Grade 12 1.2% 1.2% 2.4% 97.6%
_____________________________________________________________________________________Hallucinogens All 3.8% 6.3% 10.6% 89.4%
Grade 7 1.4% 1.6% 3.2% 96.8%Grade 8 3.1% 5.9% 8.8% 91.2%Grade 9 3.7% 6.6% 11.4% 88.6%Grade 10 5.9% 8.5% 12.6% 87.4%
Grade 11 4.3% 7.5% 12.9% 87.1%Grade 12 4.9% 8.5% 17.1% 82.9%
_____________________________________________________________________________________Uppers All 4.4% 7.6% 11.9% 88.1%
Grade 7 1.7% 1.9% 3.4% 96.6%Grade 8 5.3% 7.1% 11.2% 88.8%Grade 9 2.7% 7.7% 11.7% 88.3%Grade 10 7.0% 9.7% 16.7% 83.3%Grade 11 4.7% 10.9% 17.5% 82.5%Grade 12 6.0% 9.5% 11.9% 88.1%
_____________________________________________________________________________________Downers All 3.1% 5.2% 9.3% 90.7%
Grade 7 1.2% 1.5% 3.9% 96.1%Grade 8 4.2% 5.6% 8.9% 91.1%Grade 9 3.3% 6.7% 10.6% 89.4%Grade 10 3.2% 5.0% 11.2% 88.8%Grade 11 3.7% 8.4% 12.8% 87.2%Grade 12 2.4% 3.6% 8.4% 91.6%
_____________________________________________________________________________________Rohypnol All 3.1% 4.3% 6.0% 94.0%
Grade 7 0.9% 1.4% 3.0% 97.0%Grade 8 4.0% 4.9% 6.6% 93.4%Grade 9 3.2% 5.0% 6.9% 93.1%
Grade 10 4.4% 5.3% 7.7% 92.3%
Grade 11 1.4% 3.2% 5.4% 94.6%Grade 12 4.9% 6.1% 6.1% 93.9%
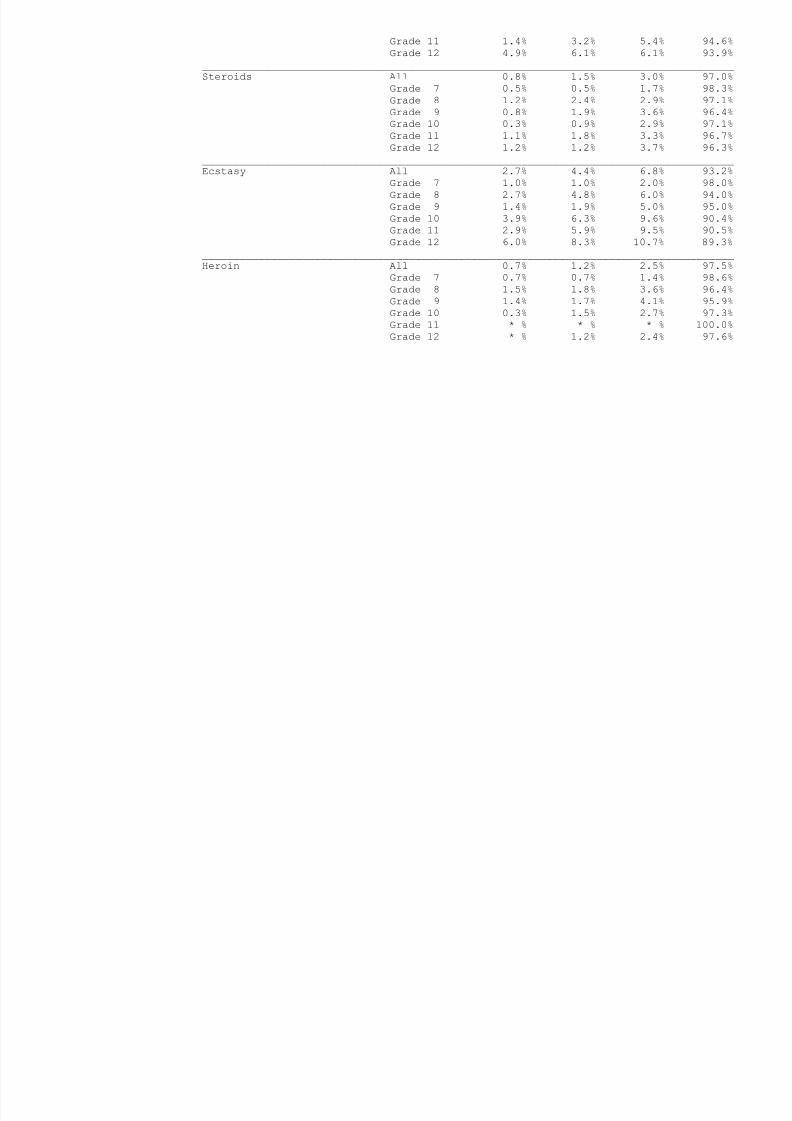
8/14/2019 BRAZORIA COUNTY - Alvin ISD - 1998 Texas School Survey of Drug and Alcohol Use
http://slidepdf.com/reader/full/brazoria-county-alvin-isd-1998-texas-school-survey-of-drug-and-alcohol 83/213
_____________________________________________________________________________________Steroids All 0.8% 1.5% 3.0% 97.0%
Grade 7 0.5% 0.5% 1.7% 98.3%Grade 8 1.2% 2.4% 2.9% 97.1%Grade 9 0.8% 1.9% 3.6% 96.4%Grade 10 0.3% 0.9% 2.9% 97.1%Grade 11 1.1% 1.8% 3.3% 96.7%
Grade 12 1.2% 1.2% 3.7% 96.3%_____________________________________________________________________________________Ecstasy All 2.7% 4.4% 6.8% 93.2%
Grade 7 1.0% 1.0% 2.0% 98.0%Grade 8 2.7% 4.8% 6.0% 94.0%Grade 9 1.4% 1.9% 5.0% 95.0%Grade 10 3.9% 6.3% 9.6% 90.4%Grade 11 2.9% 5.9% 9.5% 90.5%Grade 12 6.0% 8.3% 10.7% 89.3%
_____________________________________________________________________________________Heroin All 0.7% 1.2% 2.5% 97.5%
Grade 7 0.7% 0.7% 1.4% 98.6%
Grade 8 1.5% 1.8% 3.6% 96.4%Grade 9 1.4% 1.7% 4.1% 95.9%Grade 10 0.3% 1.5% 2.7% 97.3%Grade 11 * % * % * % 100.0%Grade 12 * % 1.2% 2.4% 97.6%
AlvinSpring 1998
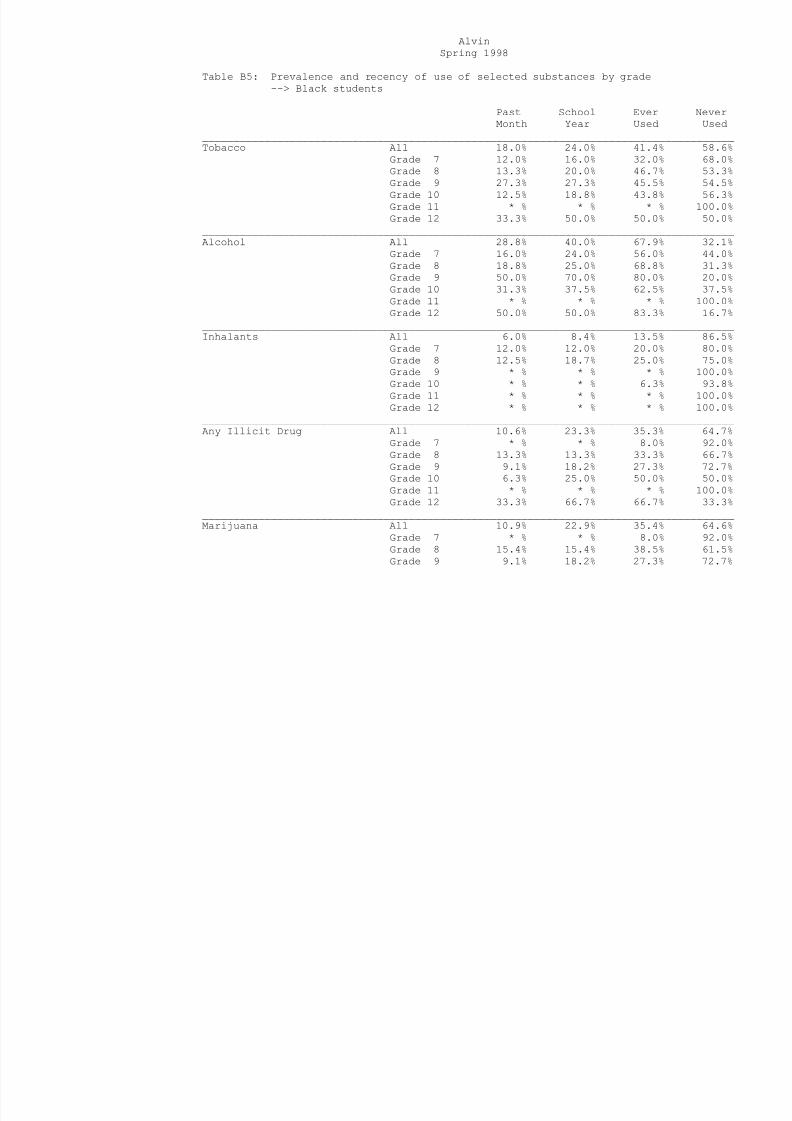
8/14/2019 BRAZORIA COUNTY - Alvin ISD - 1998 Texas School Survey of Drug and Alcohol Use
http://slidepdf.com/reader/full/brazoria-county-alvin-isd-1998-texas-school-survey-of-drug-and-alcohol 84/213
Table B5: Prevalence and recency of use of selected substances by grade--> Black students
Past School Ever NeverMonth Year Used Used
_____________________________________________________________________________________
Tobacco All 18.0% 24.0% 41.4% 58.6%Grade 7 12.0% 16.0% 32.0% 68.0%Grade 8 13.3% 20.0% 46.7% 53.3%Grade 9 27.3% 27.3% 45.5% 54.5%Grade 10 12.5% 18.8% 43.8% 56.3%Grade 11 * % * % * % 100.0%Grade 12 33.3% 50.0% 50.0% 50.0%
_____________________________________________________________________________________Alcohol All 28.8% 40.0% 67.9% 32.1%
Grade 7 16.0% 24.0% 56.0% 44.0%Grade 8 18.8% 25.0% 68.8% 31.3%Grade 9 50.0% 70.0% 80.0% 20.0%
Grade 10 31.3% 37.5% 62.5% 37.5%Grade 11 * % * % * % 100.0%Grade 12 50.0% 50.0% 83.3% 16.7%
_____________________________________________________________________________________Inhalants All 6.0% 8.4% 13.5% 86.5%
Grade 7 12.0% 12.0% 20.0% 80.0%Grade 8 12.5% 18.7% 25.0% 75.0%Grade 9 * % * % * % 100.0%Grade 10 * % * % 6.3% 93.8%Grade 11 * % * % * % 100.0%Grade 12 * % * % * % 100.0%
_____________________________________________________________________________________
Any Illicit Drug All 10.6% 23.3% 35.3% 64.7%Grade 7 * % * % 8.0% 92.0%Grade 8 13.3% 13.3% 33.3% 66.7%Grade 9 9.1% 18.2% 27.3% 72.7%Grade 10 6.3% 25.0% 50.0% 50.0%Grade 11 * % * % * % 100.0%Grade 12 33.3% 66.7% 66.7% 33.3%
_____________________________________________________________________________________Marijuana All 10.9% 22.9% 35.4% 64.6%
Grade 7 * % * % 8.0% 92.0%Grade 8 15.4% 15.4% 38.5% 61.5%
Grade 9 9.1% 18.2% 27.3% 72.7%
Grade 10 6.3% 25.0% 50.0% 50.0%Grade 11 * % * % * % 100.0%G d 12 33 3% 66 7% 66 7% 33 3%
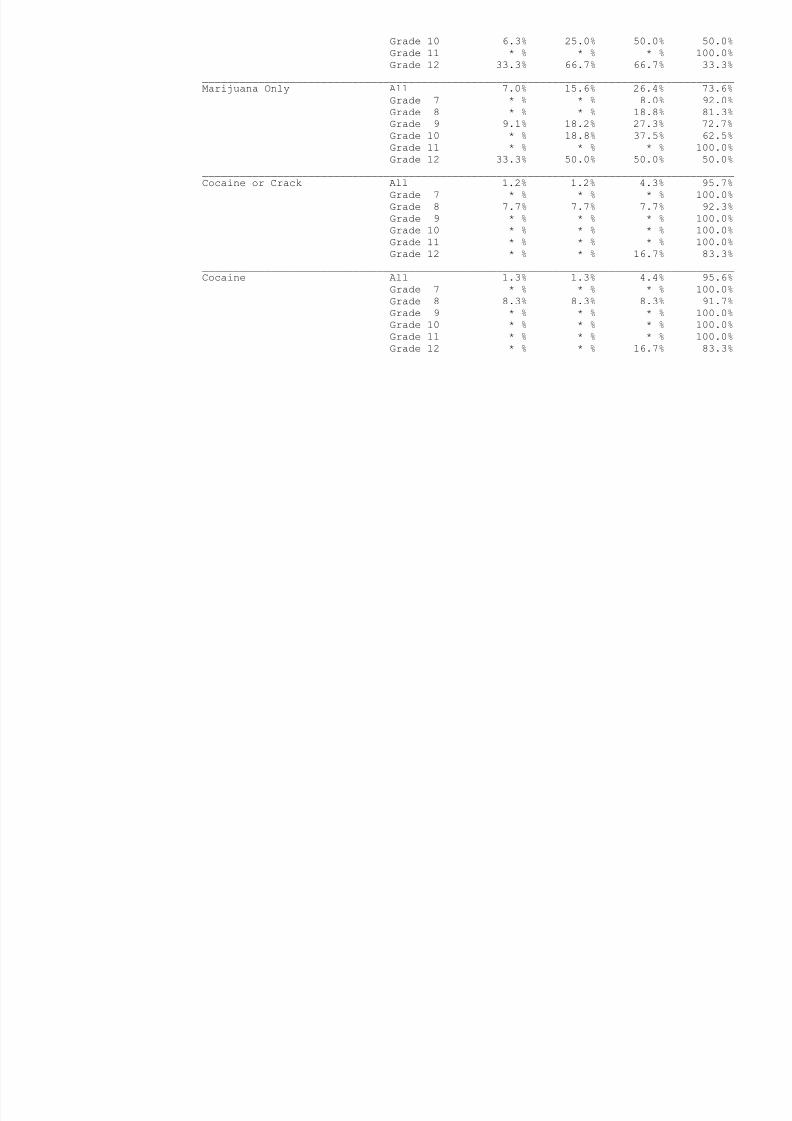
8/14/2019 BRAZORIA COUNTY - Alvin ISD - 1998 Texas School Survey of Drug and Alcohol Use
http://slidepdf.com/reader/full/brazoria-county-alvin-isd-1998-texas-school-survey-of-drug-and-alcohol 85/213
Grade 12 33.3% 66.7% 66.7% 33.3%_____________________________________________________________________________________Marijuana Only All 7.0% 15.6% 26.4% 73.6%
Grade 7 * % * % 8.0% 92.0%Grade 8 * % * % 18.8% 81.3%Grade 9 9.1% 18.2% 27.3% 72.7%Grade 10 * % 18.8% 37.5% 62.5%
Grade 11 * % * % * % 100.0%Grade 12 33.3% 50.0% 50.0% 50.0%_____________________________________________________________________________________Cocaine or Crack All 1.2% 1.2% 4.3% 95.7%
Grade 7 * % * % * % 100.0%Grade 8 7.7% 7.7% 7.7% 92.3%Grade 9 * % * % * % 100.0%Grade 10 * % * % * % 100.0%Grade 11 * % * % * % 100.0%Grade 12 * % * % 16.7% 83.3%
_____________________________________________________________________________________Cocaine All 1.3% 1.3% 4.4% 95.6%
Grade 7 * % * % * % 100.0%Grade 8 8.3% 8.3% 8.3% 91.7%Grade 9 * % * % * % 100.0%Grade 10 * % * % * % 100.0%Grade 11 * % * % * % 100.0%Grade 12 * % * % 16.7% 83.3%
AlvinSpring 1998
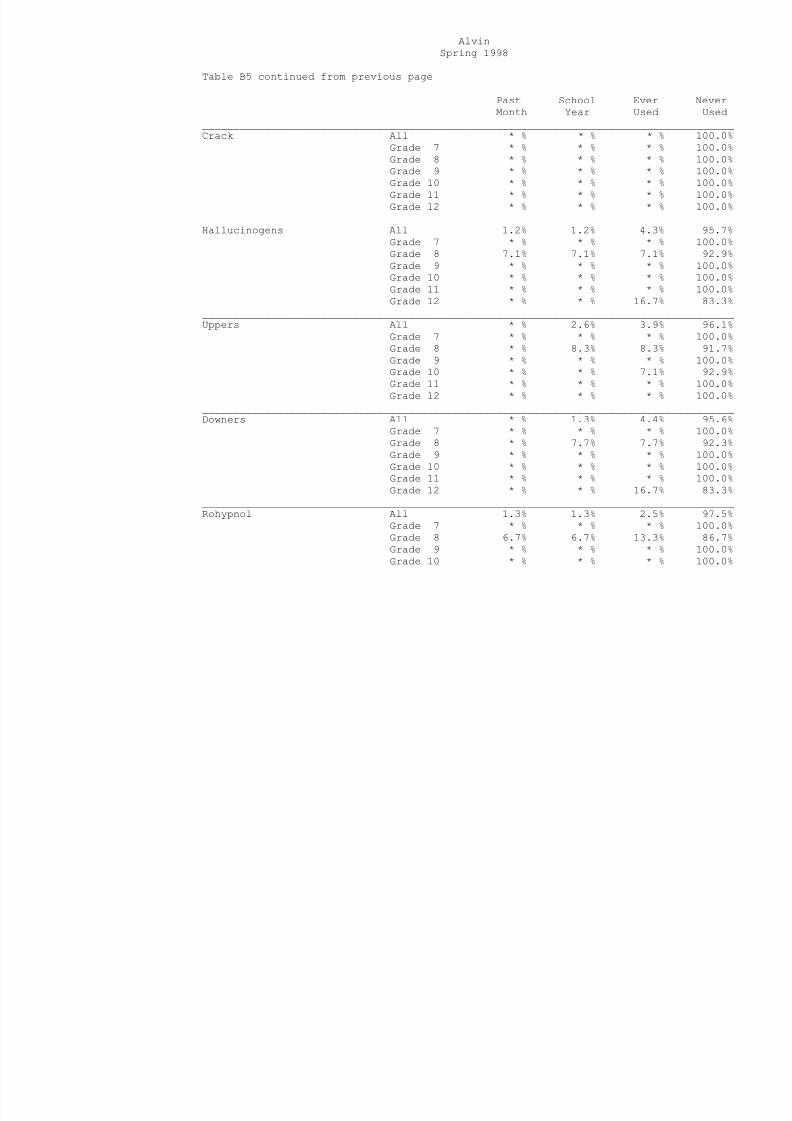
8/14/2019 BRAZORIA COUNTY - Alvin ISD - 1998 Texas School Survey of Drug and Alcohol Use
http://slidepdf.com/reader/full/brazoria-county-alvin-isd-1998-texas-school-survey-of-drug-and-alcohol 86/213
Table B5 continued from previous page
Past School Ever NeverMonth Year Used Used
_____________________________________________________________________________________Crack All * % * % * % 100.0%
Grade 7 * % * % * % 100.0%Grade 8 * % * % * % 100.0%Grade 9 * % * % * % 100.0%Grade 10 * % * % * % 100.0%Grade 11 * % * % * % 100.0%Grade 12 * % * % * % 100.0%
_____________________________________________________________________________________Hallucinogens All 1.2% 1.2% 4.3% 95.7%
Grade 7 * % * % * % 100.0%Grade 8 7.1% 7.1% 7.1% 92.9%Grade 9 * % * % * % 100.0%Grade 10 * % * % * % 100.0%
Grade 11 * % * % * % 100.0%Grade 12 * % * % 16.7% 83.3%
_____________________________________________________________________________________Uppers All * % 2.6% 3.9% 96.1%
Grade 7 * % * % * % 100.0%Grade 8 * % 8.3% 8.3% 91.7%Grade 9 * % * % * % 100.0%Grade 10 * % * % 7.1% 92.9%Grade 11 * % * % * % 100.0%Grade 12 * % * % * % 100.0%
_____________________________________________________________________________________Downers All * % 1.3% 4.4% 95.6%
Grade 7 * % * % * % 100.0%Grade 8 * % 7.7% 7.7% 92.3%Grade 9 * % * % * % 100.0%Grade 10 * % * % * % 100.0%Grade 11 * % * % * % 100.0%Grade 12 * % * % 16.7% 83.3%
_____________________________________________________________________________________Rohypnol All 1.3% 1.3% 2.5% 97.5%
Grade 7 * % * % * % 100.0%Grade 8 6.7% 6.7% 13.3% 86.7%Grade 9 * % * % * % 100.0%
Grade 10 * % * % * % 100.0%
Grade 11 * % * % * % 100.0%Grade 12 * % * % * % 100.0%
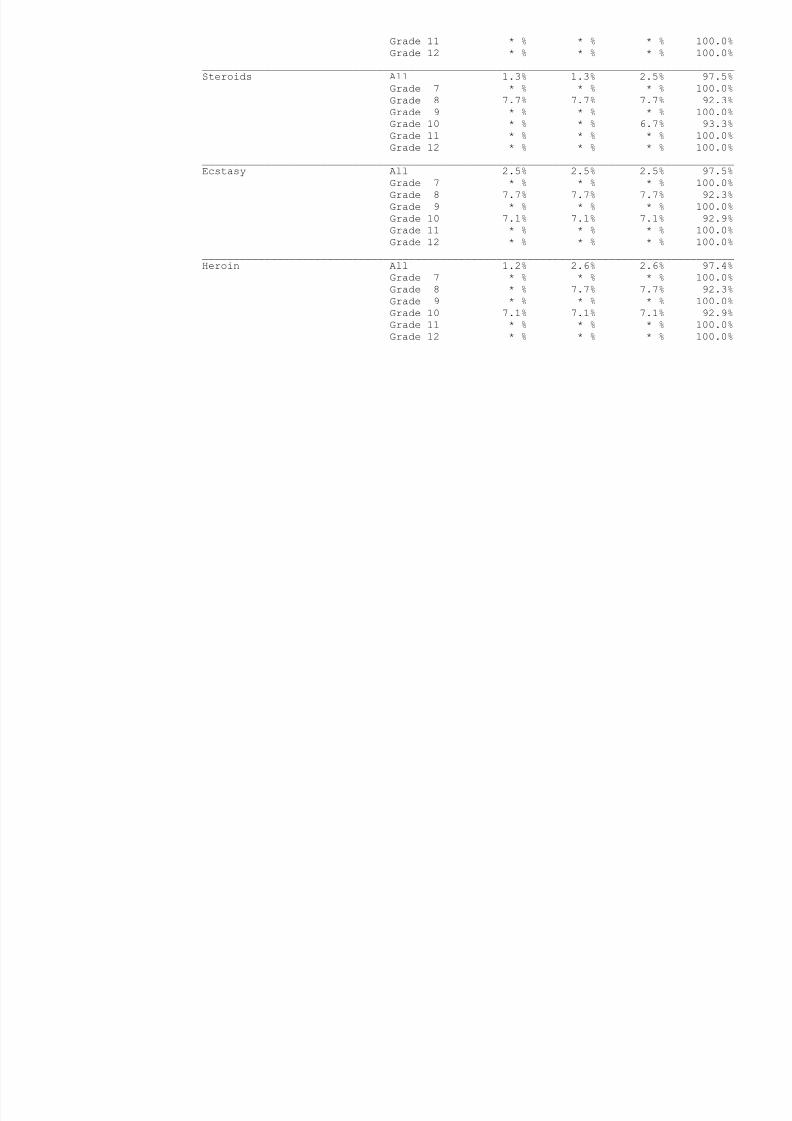
8/14/2019 BRAZORIA COUNTY - Alvin ISD - 1998 Texas School Survey of Drug and Alcohol Use
http://slidepdf.com/reader/full/brazoria-county-alvin-isd-1998-texas-school-survey-of-drug-and-alcohol 87/213
_____________________________________________________________________________________Steroids All 1.3% 1.3% 2.5% 97.5%
Grade 7 * % * % * % 100.0%Grade 8 7.7% 7.7% 7.7% 92.3%Grade 9 * % * % * % 100.0%Grade 10 * % * % 6.7% 93.3%Grade 11 * % * % * % 100.0%
Grade 12 * % * % * % 100.0%_____________________________________________________________________________________Ecstasy All 2.5% 2.5% 2.5% 97.5%
Grade 7 * % * % * % 100.0%Grade 8 7.7% 7.7% 7.7% 92.3%Grade 9 * % * % * % 100.0%Grade 10 7.1% 7.1% 7.1% 92.9%Grade 11 * % * % * % 100.0%Grade 12 * % * % * % 100.0%
_____________________________________________________________________________________Heroin All 1.2% 2.6% 2.6% 97.4%
Grade 7 * % * % * % 100.0%
Grade 8 * % 7.7% 7.7% 92.3%Grade 9 * % * % * % 100.0%Grade 10 7.1% 7.1% 7.1% 92.9%Grade 11 * % * % * % 100.0%Grade 12 * % * % * % 100.0%
AlvinSpring 1998
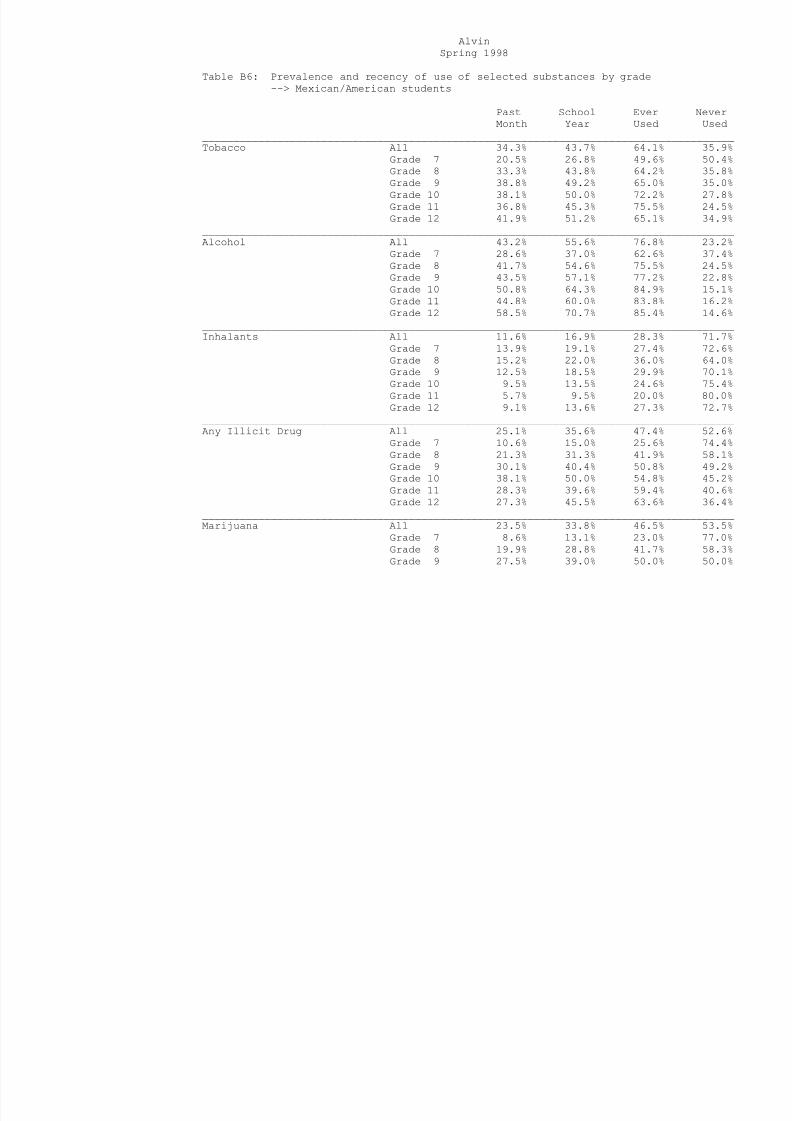
8/14/2019 BRAZORIA COUNTY - Alvin ISD - 1998 Texas School Survey of Drug and Alcohol Use
http://slidepdf.com/reader/full/brazoria-county-alvin-isd-1998-texas-school-survey-of-drug-and-alcohol 88/213
Table B6: Prevalence and recency of use of selected substances by grade--> Mexican/American students
Past School Ever NeverMonth Year Used Used
_____________________________________________________________________________________
Tobacco All 34.3% 43.7% 64.1% 35.9%Grade 7 20.5% 26.8% 49.6% 50.4%Grade 8 33.3% 43.8% 64.2% 35.8%Grade 9 38.8% 49.2% 65.0% 35.0%Grade 10 38.1% 50.0% 72.2% 27.8%Grade 11 36.8% 45.3% 75.5% 24.5%Grade 12 41.9% 51.2% 65.1% 34.9%
_____________________________________________________________________________________Alcohol All 43.2% 55.6% 76.8% 23.2%
Grade 7 28.6% 37.0% 62.6% 37.4%Grade 8 41.7% 54.6% 75.5% 24.5%Grade 9 43.5% 57.1% 77.2% 22.8%
Grade 10 50.8% 64.3% 84.9% 15.1%Grade 11 44.8% 60.0% 83.8% 16.2%Grade 12 58.5% 70.7% 85.4% 14.6%
_____________________________________________________________________________________Inhalants All 11.6% 16.9% 28.3% 71.7%
Grade 7 13.9% 19.1% 27.4% 72.6%Grade 8 15.2% 22.0% 36.0% 64.0%Grade 9 12.5% 18.5% 29.9% 70.1%Grade 10 9.5% 13.5% 24.6% 75.4%Grade 11 5.7% 9.5% 20.0% 80.0%Grade 12 9.1% 13.6% 27.3% 72.7%
_____________________________________________________________________________________
Any Illicit Drug All 25.1% 35.6% 47.4% 52.6%Grade 7 10.6% 15.0% 25.6% 74.4%Grade 8 21.3% 31.3% 41.9% 58.1%Grade 9 30.1% 40.4% 50.8% 49.2%Grade 10 38.1% 50.0% 54.8% 45.2%Grade 11 28.3% 39.6% 59.4% 40.6%Grade 12 27.3% 45.5% 63.6% 36.4%
_____________________________________________________________________________________Marijuana All 23.5% 33.8% 46.5% 53.5%
Grade 7 8.6% 13.1% 23.0% 77.0%Grade 8 19.9% 28.8% 41.7% 58.3%Grade 9 27.5% 39.0% 50.0% 50.0%
Grade 10 37.9% 47.6% 54.0% 46.0%Grade 11 25.0% 36.5% 57.7% 42.3%Grade 12 27 3% 45 5% 63 6% 36 4%

8/14/2019 BRAZORIA COUNTY - Alvin ISD - 1998 Texas School Survey of Drug and Alcohol Use
http://slidepdf.com/reader/full/brazoria-county-alvin-isd-1998-texas-school-survey-of-drug-and-alcohol 89/213
Grade 12 27.3% 45.5% 63.6% 36.4%_____________________________________________________________________________________Marijuana Only All 8.0% 13.5% 22.2% 77.8%
Grade 7 3.0% 4.8% 12.6% 87.4%Grade 8 7.2% 12.7% 19.3% 80.7%Grade 9 7.5% 14.0% 22.6% 77.4%Grade 10 14.3% 19.0% 22.2% 77.8%
Grade 11 10.4% 17.0% 32.1% 67.9%Grade 12 9.1% 18.2% 31.8% 68.2%_____________________________________________________________________________________Cocaine or Crack All 7.1% 11.1% 15.7% 84.3%
Grade 7 5.0% 5.9% 6.8% 93.2%Grade 8 4.5% 7.1% 11.7% 88.3%Grade 9 9.9% 14.4% 21.5% 78.5%Grade 10 10.0% 17.5% 20.0% 80.0%Grade 11 5.8% 8.7% 13.5% 86.5%Grade 12 7.3% 14.6% 22.0% 78.0%
_____________________________________________________________________________________Cocaine All 6.7% 10.7% 15.0% 85.0%
Grade 7 3.8% 4.7% 5.7% 94.3%Grade 8 4.0% 6.0% 10.0% 90.0%Grade 9 9.2% 14.5% 22.0% 78.0%Grade 10 10.3% 18.1% 20.7% 79.3%Grade 11 5.9% 7.9% 12.9% 87.1%Grade 12 7.5% 15.0% 20.0% 80.0%
AlvinSpring 1998
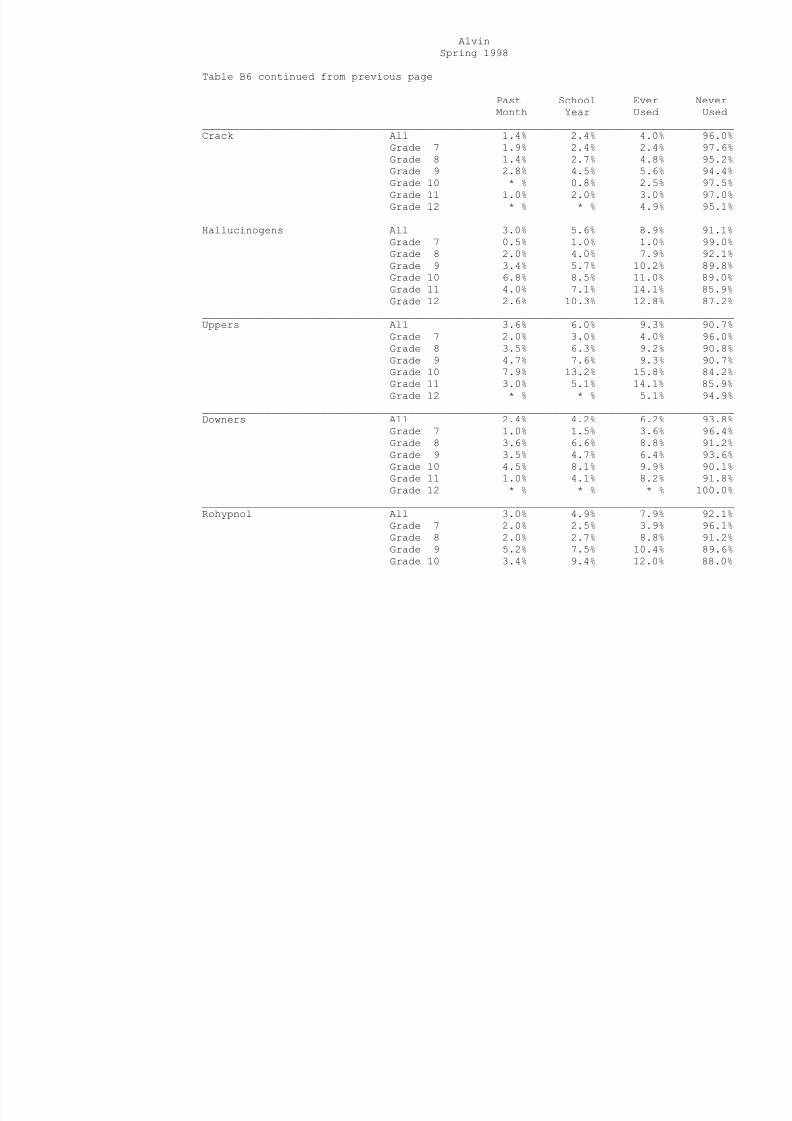
8/14/2019 BRAZORIA COUNTY - Alvin ISD - 1998 Texas School Survey of Drug and Alcohol Use
http://slidepdf.com/reader/full/brazoria-county-alvin-isd-1998-texas-school-survey-of-drug-and-alcohol 90/213
Table B6 continued from previous page
Past School Ever NeverMonth Year Used Used
_____________________________________________________________________________________Crack All 1.4% 2.4% 4.0% 96.0%
Grade 7 1.9% 2.4% 2.4% 97.6%Grade 8 1.4% 2.7% 4.8% 95.2%Grade 9 2.8% 4.5% 5.6% 94.4%Grade 10 * % 0.8% 2.5% 97.5%Grade 11 1.0% 2.0% 3.0% 97.0%Grade 12 * % * % 4.9% 95.1%
_____________________________________________________________________________________Hallucinogens All 3.0% 5.6% 8.9% 91.1%
Grade 7 0.5% 1.0% 1.0% 99.0%Grade 8 2.0% 4.0% 7.9% 92.1%Grade 9 3.4% 5.7% 10.2% 89.8%Grade 10 6.8% 8.5% 11.0% 89.0%
Grade 11 4.0% 7.1% 14.1% 85.9%Grade 12 2.6% 10.3% 12.8% 87.2%
_____________________________________________________________________________________Uppers All 3.6% 6.0% 9.3% 90.7%
Grade 7 2.0% 3.0% 4.0% 96.0%Grade 8 3.5% 6.3% 9.2% 90.8%Grade 9 4.7% 7.6% 9.3% 90.7%Grade 10 7.9% 13.2% 15.8% 84.2%Grade 11 3.0% 5.1% 14.1% 85.9%Grade 12 * % * % 5.1% 94.9%
_____________________________________________________________________________________Downers All 2.4% 4.2% 6.2% 93.8%
Grade 7 1.0% 1.5% 3.6% 96.4%Grade 8 3.6% 6.6% 8.8% 91.2%Grade 9 3.5% 4.7% 6.4% 93.6%Grade 10 4.5% 8.1% 9.9% 90.1%Grade 11 1.0% 4.1% 8.2% 91.8%Grade 12 * % * % * % 100.0%
_____________________________________________________________________________________Rohypnol All 3.0% 4.9% 7.9% 92.1%
Grade 7 2.0% 2.5% 3.9% 96.1%Grade 8 2.0% 2.7% 8.8% 91.2%Grade 9 5.2% 7.5% 10.4% 89.6%Grade 10 3.4% 9.4% 12.0% 88.0%
Grade 11 4.0% 4.0% 8.9% 91.1%Grade 12 * % 2.6% 2.6% 97.4%

8/14/2019 BRAZORIA COUNTY - Alvin ISD - 1998 Texas School Survey of Drug and Alcohol Use
http://slidepdf.com/reader/full/brazoria-county-alvin-isd-1998-texas-school-survey-of-drug-and-alcohol 91/213
_____________________________________________________________________________________Steroids All 0.7% 1.2% 2.6% 97.4%
Grade 7 1.0% 1.5% 2.0% 98.0%Grade 8 0.7% 0.7% 1.4% 98.6%Grade 9 0.6% 0.6% 1.8% 98.2%Grade 10 * % 0.9% 2.6% 97.4%Grade 11 2.0% 4.1% 7.1% 92.9%
Grade 12 * % * % 2.6% 97.4%_____________________________________________________________________________________Ecstasy All 2.3% 4.0% 5.7% 94.3%
Grade 7 0.5% 0.5% 1.6% 98.4%Grade 8 2.9% 4.4% 6.6% 93.4%Grade 9 2.4% 5.3% 6.5% 93.5%Grade 10 2.5% 5.9% 6.8% 93.2%Grade 11 3.0% 3.0% 7.9% 92.1%Grade 12 2.6% 5.3% 5.3% 94.7%
_____________________________________________________________________________________Heroin All 1.3% 1.9% 3.4% 96.6%
Grade 7 2.0% 3.0% 5.0% 95.0%
Grade 8 2.1% 2.9% 4.3% 95.7%Grade 9 1.8% 3.0% 4.9% 95.1%Grade 10 0.8% 0.8% 2.5% 97.5%Grade 11 * % * % 1.1% 98.9%Grade 12 * % * % * % 100.0%
AlvinSpring 1998

8/14/2019 BRAZORIA COUNTY - Alvin ISD - 1998 Texas School Survey of Drug and Alcohol Use
http://slidepdf.com/reader/full/brazoria-county-alvin-isd-1998-texas-school-survey-of-drug-and-alcohol 92/213
Table B7: Prevalence and recency of use of selected substances by grade--> Students reporting A and B grades
Past School Ever NeverMonth Year Used Used
_____________________________________________________________________________________Tobacco All 26.7% 35.5% 54.6% 45.4%
Grade 7 14.8% 19.1% 40.2% 59.8%Grade 8 25.6% 36.5% 58.1% 41.9%Grade 9 29.3% 40.4% 55.5% 44.5%Grade 10 28.5% 37.2% 57.0% 43.0%Grade 11 37.0% 45.3% 65.3% 34.7%Grade 12 28.6% 39.0% 55.2% 44.8%
_____________________________________________________________________________________Alcohol All 35.1% 49.5% 71.1% 28.9%
Grade 7 20.2% 27.2% 55.5% 44.5%Grade 8 32.2% 47.8% 71.2% 28.8%Grade 9 39.0% 54.3% 74.0% 26.0%
Grade 10 42.0% 58.5% 77.3% 22.7%Grade 11 46.1% 64.1% 79.7% 20.3%Grade 12 35.9% 52.4% 73.8% 26.2%
_____________________________________________________________________________________Inhalants All 8.4% 12.4% 20.8% 79.2%
Grade 7 10.9% 13.9% 22.4% 77.6%Grade 8 12.5% 16.7% 24.7% 75.3%Grade 9 6.5% 12.5% 22.5% 77.5%Grade 10 7.0% 9.6% 19.0% 81.0%Grade 11 4.6% 8.3% 17.5% 82.5%Grade 12 6.6% 11.3% 14.2% 85.8%
_____________________________________________________________________________________
Any Illicit Drug All 15.5% 22.2% 33.3% 66.7%Grade 7 6.8% 8.5% 16.4% 83.6%Grade 8 12.6% 19.9% 29.5% 70.5%Grade 9 16.5% 23.9% 34.4% 65.6%Grade 10 21.9% 31.1% 39.4% 60.6%Grade 11 20.4% 30.5% 46.8% 53.2%Grade 12 18.9% 24.5% 42.5% 57.5%
_____________________________________________________________________________________Marijuana All 13.4% 20.4% 31.4% 68.6%
Grade 7 5.5% 7.3% 14.5% 85.5%Grade 8 9.7% 16.5% 26.4% 73.6%Grade 9 14.7% 22.1% 33.0% 67.0%
Grade 10 20.3% 29.6% 37.3% 62.7%Grade 11 18.2% 29.1% 45.0% 55.0%Grade 12 16.0% 23.6% 41.5% 58.5%
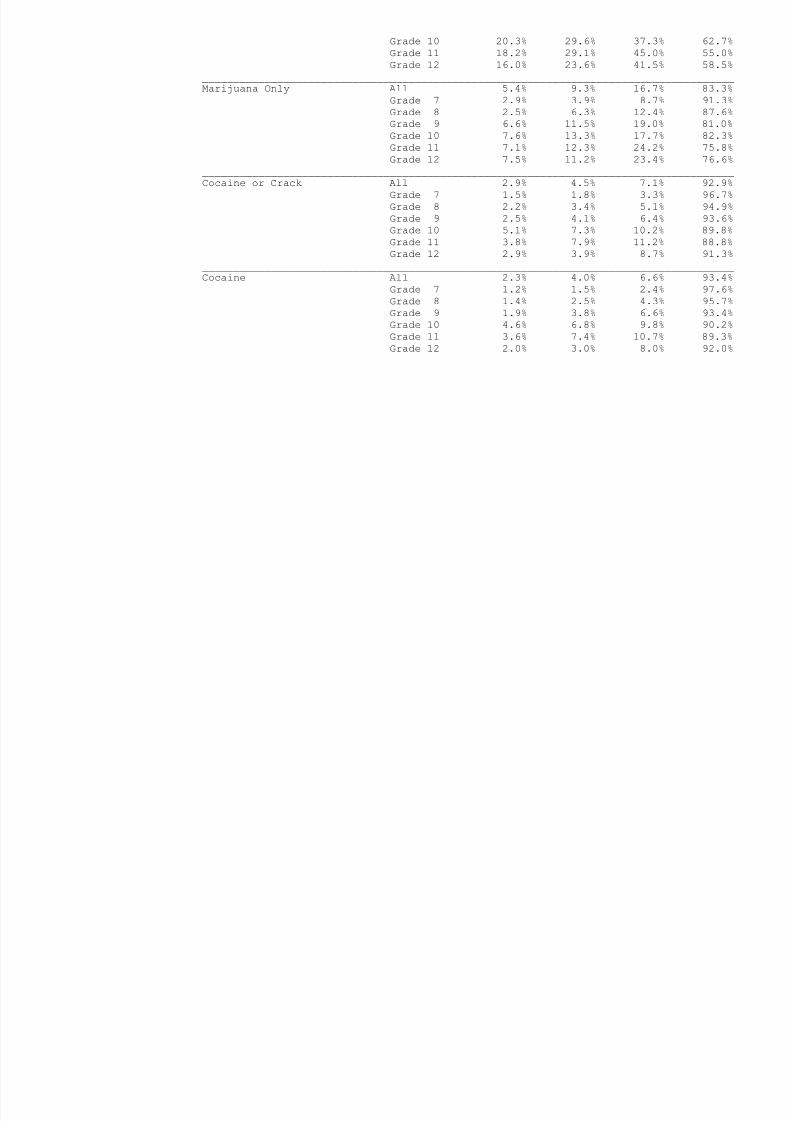
8/14/2019 BRAZORIA COUNTY - Alvin ISD - 1998 Texas School Survey of Drug and Alcohol Use
http://slidepdf.com/reader/full/brazoria-county-alvin-isd-1998-texas-school-survey-of-drug-and-alcohol 93/213
_____________________________________________________________________________________Marijuana Only All 5.4% 9.3% 16.7% 83.3%
Grade 7 2.9% 3.9% 8.7% 91.3%Grade 8 2.5% 6.3% 12.4% 87.6%Grade 9 6.6% 11.5% 19.0% 81.0%Grade 10 7.6% 13.3% 17.7% 82.3%Grade 11 7.1% 12.3% 24.2% 75.8%Grade 12 7.5% 11.2% 23.4% 76.6%
_____________________________________________________________________________________Cocaine or Crack All 2.9% 4.5% 7.1% 92.9%
Grade 7 1.5% 1.8% 3.3% 96.7%Grade 8 2.2% 3.4% 5.1% 94.9%Grade 9 2.5% 4.1% 6.4% 93.6%Grade 10 5.1% 7.3% 10.2% 89.8%Grade 11 3.8% 7.9% 11.2% 88.8%Grade 12 2.9% 3.9% 8.7% 91.3%
_____________________________________________________________________________________Cocaine All 2.3% 4.0% 6.6% 93.4%
Grade 7 1.2% 1.5% 2.4% 97.6%Grade 8 1.4% 2.5% 4.3% 95.7%Grade 9 1.9% 3.8% 6.6% 93.4%Grade 10 4.6% 6.8% 9.8% 90.2%Grade 11 3.6% 7.4% 10.7% 89.3%Grade 12 2.0% 3.0% 8.0% 92.0%
AlvinSpring 1998
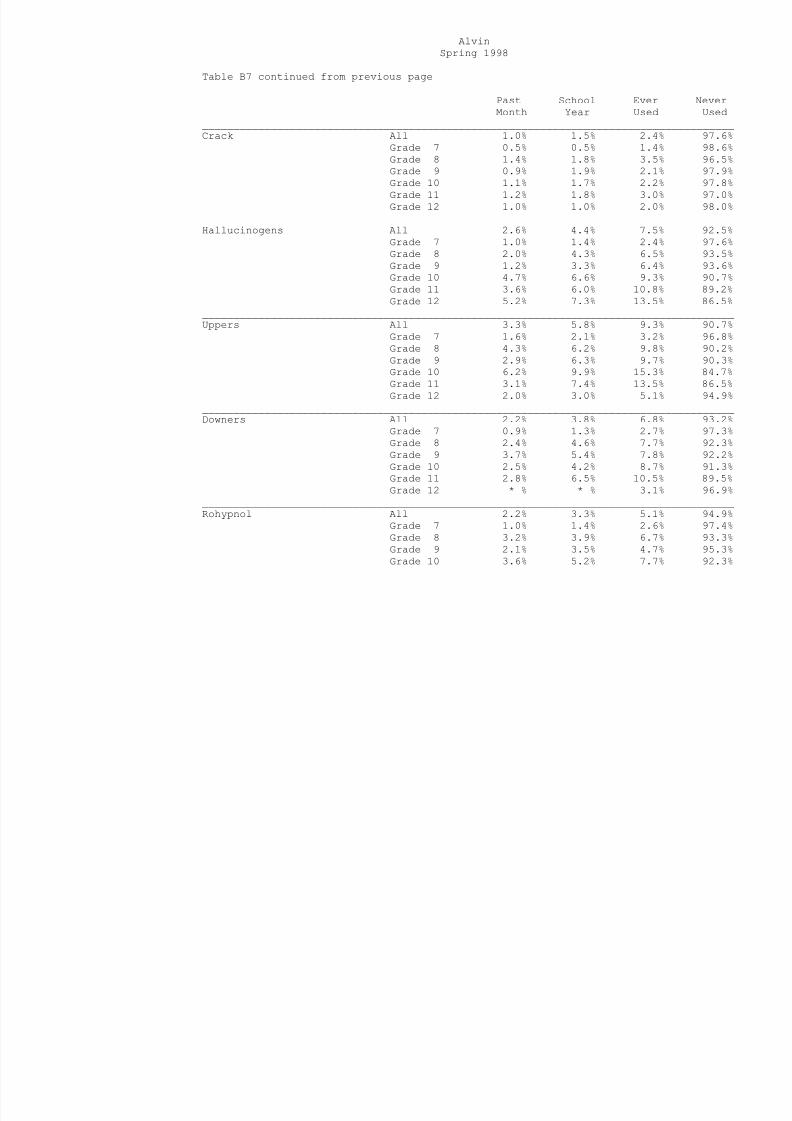
8/14/2019 BRAZORIA COUNTY - Alvin ISD - 1998 Texas School Survey of Drug and Alcohol Use
http://slidepdf.com/reader/full/brazoria-county-alvin-isd-1998-texas-school-survey-of-drug-and-alcohol 94/213
Table B7 continued from previous page
Past School Ever NeverMonth Year Used Used
_____________________________________________________________________________________Crack All 1.0% 1.5% 2.4% 97.6%
Grade 7 0.5% 0.5% 1.4% 98.6%Grade 8 1.4% 1.8% 3.5% 96.5%Grade 9 0.9% 1.9% 2.1% 97.9%Grade 10 1.1% 1.7% 2.2% 97.8%Grade 11 1.2% 1.8% 3.0% 97.0%Grade 12 1.0% 1.0% 2.0% 98.0%
_____________________________________________________________________________________Hallucinogens All 2.6% 4.4% 7.5% 92.5%
Grade 7 1.0% 1.4% 2.4% 97.6%Grade 8 2.0% 4.3% 6.5% 93.5%Grade 9 1.2% 3.3% 6.4% 93.6%Grade 10 4.7% 6.6% 9.3% 90.7%
Grade 11 3.6% 6.0% 10.8% 89.2%Grade 12 5.2% 7.3% 13.5% 86.5%
_____________________________________________________________________________________Uppers All 3.3% 5.8% 9.3% 90.7%
Grade 7 1.6% 2.1% 3.2% 96.8%Grade 8 4.3% 6.2% 9.8% 90.2%Grade 9 2.9% 6.3% 9.7% 90.3%Grade 10 6.2% 9.9% 15.3% 84.7%Grade 11 3.1% 7.4% 13.5% 86.5%Grade 12 2.0% 3.0% 5.1% 94.9%
_____________________________________________________________________________________Downers All 2.2% 3.8% 6.8% 93.2%
Grade 7 0.9% 1.3% 2.7% 97.3%Grade 8 2.4% 4.6% 7.7% 92.3%Grade 9 3.7% 5.4% 7.8% 92.2%Grade 10 2.5% 4.2% 8.7% 91.3%Grade 11 2.8% 6.5% 10.5% 89.5%Grade 12 * % * % 3.1% 96.9%
_____________________________________________________________________________________Rohypnol All 2.2% 3.3% 5.1% 94.9%
Grade 7 1.0% 1.4% 2.6% 97.4%Grade 8 3.2% 3.9% 6.7% 93.3%Grade 9 2.1% 3.5% 4.7% 95.3%Grade 10 3.6% 5.2% 7.7% 92.3%
Grade 11 1.5% 2.7% 5.4% 94.6%Grade 12 2.1% 3.1% 3.1% 96.9%
_____________________________________________________________________________________

8/14/2019 BRAZORIA COUNTY - Alvin ISD - 1998 Texas School Survey of Drug and Alcohol Use
http://slidepdf.com/reader/full/brazoria-county-alvin-isd-1998-texas-school-survey-of-drug-and-alcohol 95/213
_____________________________________________________________________________________Steroids All 0.6% 1.0% 2.4% 97.6%
Grade 7 0.5% 0.7% 1.4% 98.6%Grade 8 1.2% 2.1% 3.1% 96.9%Grade 9 * % 0.5% 2.0% 98.0%Grade 10 0.3% 0.3% 1.9% 98.1%Grade 11 0.6% 1.5% 3.4% 96.6%Grade 12 1.1% 1.1% 3.2% 96.8%
_____________________________________________________________________________________Ecstasy All 2.1% 3.2% 4.9% 95.1%
Grade 7 0.4% 0.4% 1.1% 98.9%Grade 8 2.4% 3.9% 4.9% 95.1%Grade 9 * % 1.2% 2.9% 97.1%Grade 10 3.6% 6.1% 8.0% 92.0%Grade 11 2.8% 4.3% 8.0% 92.0%Grade 12 5.2% 5.2% 6.3% 93.8%
_____________________________________________________________________________________Heroin All 0.8% 1.1% 2.1% 97.9%
Grade 7 0.5% 0.5% 1.4% 98.6%
Grade 8 1.9% 2.1% 3.6% 96.4%Grade 9 1.0% 1.0% 3.0% 97.0%Grade 10 0.6% 1.4% 1.9% 98.1%Grade 11 0.3% 0.3% 0.6% 99.4%Grade 12 * % 1.1% 1.1% 98.9%
AlvinSpring 1998

8/14/2019 BRAZORIA COUNTY - Alvin ISD - 1998 Texas School Survey of Drug and Alcohol Use
http://slidepdf.com/reader/full/brazoria-county-alvin-isd-1998-texas-school-survey-of-drug-and-alcohol 96/213
Table B8: Prevalence and recency of use of selected substances by grade--> Students reporting C, D, and F grades
Past School Ever NeverMonth Year Used Used
_____________________________________________________________________________________Tobacco All 50.6% 60.8% 78.1% 21.9%
Grade 7 33.8% 43.2% 66.9% 33.1%Grade 8 46.3% 55.3% 76.4% 23.6%Grade 9 54.6% 65.9% 82.2% 17.8%Grade 10 50.6% 63.6% 79.9% 20.1%Grade 11 52.4% 59.5% 79.8% 20.2%Grade 12 66.7% 75.0% 80.6% 19.4%
_____________________________________________________________________________________Alcohol All 56.3% 70.1% 87.2% 12.8%
Grade 7 29.7% 45.9% 73.0% 27.0%Grade 8 56.6% 66.4% 86.1% 13.9%Grade 9 59.2% 72.8% 89.1% 10.9%
Grade 10 58.4% 72.1% 85.7% 14.3%Grade 11 63.1% 73.8% 91.7% 8.3%Grade 12 72.2% 91.7% 100.0% 0.0%
_____________________________________________________________________________________Inhalants All 16.5% 24.6% 39.2% 60.8%
Grade 7 17.1% 21.7% 34.2% 65.8%Grade 8 19.2% 29.6% 46.4% 53.6%Grade 9 23.2% 31.4% 43.2% 56.8%Grade 10 12.3% 19.5% 31.2% 68.8%Grade 11 8.4% 15.7% 30.1% 69.9%Grade 12 11.1% 22.2% 47.2% 52.8%
_____________________________________________________________________________________
Any Illicit Drug All 35.8% 47.5% 58.6% 41.4%Grade 7 16.1% 18.8% 32.2% 67.8%Grade 8 28.7% 37.7% 49.2% 50.8%Grade 9 44.6% 54.9% 65.2% 34.8%Grade 10 43.2% 57.4% 63.9% 36.1%Grade 11 38.1% 50.0% 70.2% 29.8%Grade 12 36.1% 61.1% 69.4% 30.6%
_____________________________________________________________________________________Marijuana All 34.1% 45.7% 57.5% 42.5%
Grade 7 14.9% 18.4% 31.2% 68.8%Grade 8 27.9% 36.1% 47.5% 52.5%Grade 9 40.1% 52.2% 64.3% 35.7%
Grade 10 42.8% 53.9% 63.2% 36.8%Grade 11 35.7% 47.6% 66.7% 33.3%Grade 12 36.1% 61.1% 69.4% 30.6%
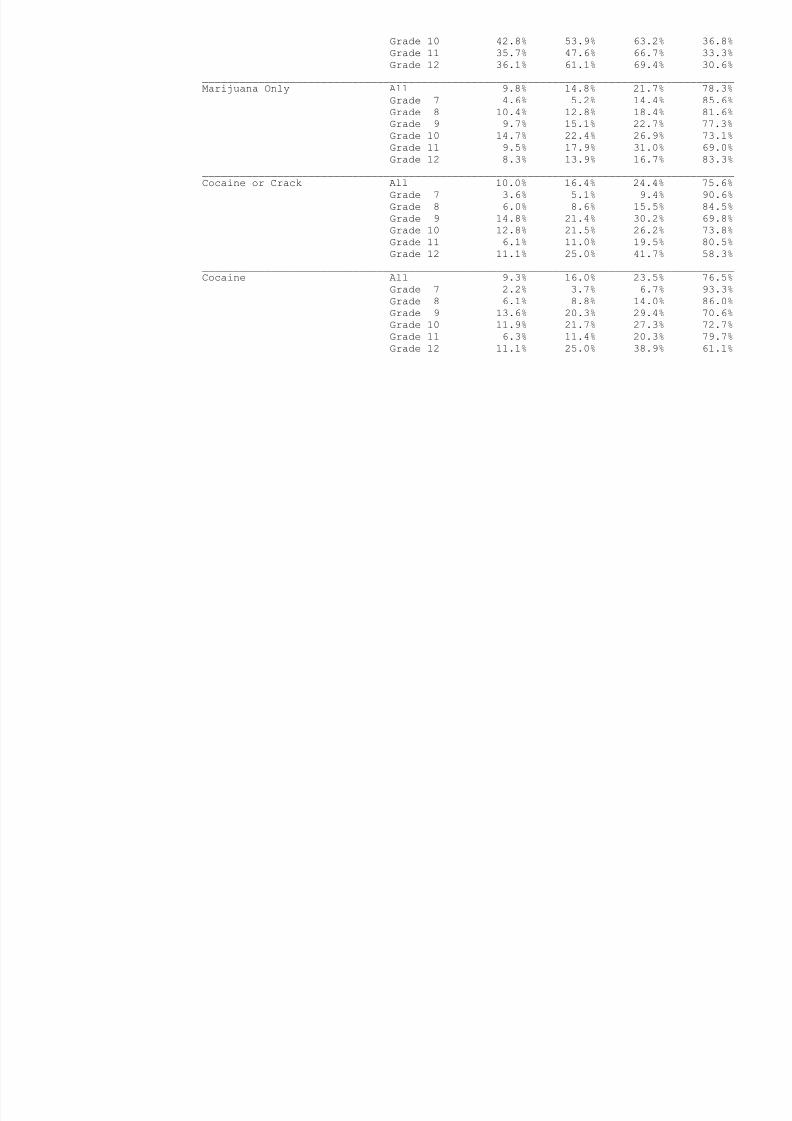
8/14/2019 BRAZORIA COUNTY - Alvin ISD - 1998 Texas School Survey of Drug and Alcohol Use
http://slidepdf.com/reader/full/brazoria-county-alvin-isd-1998-texas-school-survey-of-drug-and-alcohol 97/213
_____________________________________________________________________________________Marijuana Only All 9.8% 14.8% 21.7% 78.3%
Grade 7 4.6% 5.2% 14.4% 85.6%Grade 8 10.4% 12.8% 18.4% 81.6%Grade 9 9.7% 15.1% 22.7% 77.3%Grade 10 14.7% 22.4% 26.9% 73.1%Grade 11 9.5% 17.9% 31.0% 69.0%Grade 12 8.3% 13.9% 16.7% 83.3%
_____________________________________________________________________________________Cocaine or Crack All 10.0% 16.4% 24.4% 75.6%
Grade 7 3.6% 5.1% 9.4% 90.6%Grade 8 6.0% 8.6% 15.5% 84.5%Grade 9 14.8% 21.4% 30.2% 69.8%Grade 10 12.8% 21.5% 26.2% 73.8%Grade 11 6.1% 11.0% 19.5% 80.5%Grade 12 11.1% 25.0% 41.7% 58.3%
_____________________________________________________________________________________Cocaine All 9.3% 16.0% 23.5% 76.5%
Grade 7 2.2% 3.7% 6.7% 93.3%Grade 8 6.1% 8.8% 14.0% 86.0%Grade 9 13.6% 20.3% 29.4% 70.6%Grade 10 11.9% 21.7% 27.3% 72.7%Grade 11 6.3% 11.4% 20.3% 79.7%Grade 12 11.1% 25.0% 38.9% 61.1%
AlvinSpring 1998

8/14/2019 BRAZORIA COUNTY - Alvin ISD - 1998 Texas School Survey of Drug and Alcohol Use
http://slidepdf.com/reader/full/brazoria-county-alvin-isd-1998-texas-school-survey-of-drug-and-alcohol 98/213
Table B8 continued from previous page
Past School Ever NeverMonth Year Used Used
_____________________________________________________________________________________Crack All 2.3% 3.3% 6.7% 93.3%
Grade 7 1.6% 2.4% 5.5% 94.5%Grade 8 0.9% 0.9% 5.6% 94.4%Grade 9 5.7% 8.0% 10.3% 89.7%Grade 10 2.1% 3.4% 5.5% 94.5%Grade 11 * % * % 1.2% 98.8%Grade 12 * % * % 8.3% 91.7%
_____________________________________________________________________________________Hallucinogens All 7.0% 11.3% 17.6% 82.4%
Grade 7 1.6% 1.6% 2.4% 97.6%Grade 8 6.4% 9.1% 16.4% 83.6%Grade 9 10.1% 14.6% 22.5% 77.5%Grade 10 11.5% 14.2% 18.9% 81.1%
Grade 11 6.3% 12.5% 20.0% 80.0%Grade 12 * % 11.4% 20.0% 80.0%_____________________________________________________________________________________Uppers All 6.4% 11.6% 16.2% 83.8%
Grade 7 1.8% 1.8% 3.5% 96.5%Grade 8 7.7% 12.5% 16.3% 83.7%Grade 9 4.7% 11.2% 14.2% 85.8%Grade 10 8.6% 11.4% 17.1% 82.9%Grade 11 7.5% 15.0% 23.8% 76.2%Grade 12 9.1% 18.2% 24.2% 75.8%
_____________________________________________________________________________________Downers All 5.3% 8.4% 12.9% 87.1%
Grade 7 1.7% 1.7% 7.0% 93.0%Grade 8 10.5% 12.4% 15.2% 84.8%Grade 9 4.1% 8.9% 13.6% 86.4%Grade 10 5.5% 8.2% 13.0% 87.0%Grade 11 3.7% 8.6% 12.3% 87.7%Grade 12 6.1% 9.1% 15.2% 84.8%
_____________________________________________________________________________________Rohypnol All 5.7% 8.1% 11.2% 88.8%
Grade 7 1.6% 2.4% 6.5% 93.5%Grade 8 4.6% 5.6% 10.2% 89.8%Grade 9 9.2% 12.7% 17.3% 82.7%Grade 10 4.9% 8.4% 9.8% 90.2%
Grade 11 5.0% 6.2% 8.7% 91.3%Grade 12 5.6% 8.3% 8.3% 91.7%
_____________________________________________________________________________________S id ll 1 3% 2 2% 4 1% 95 9%
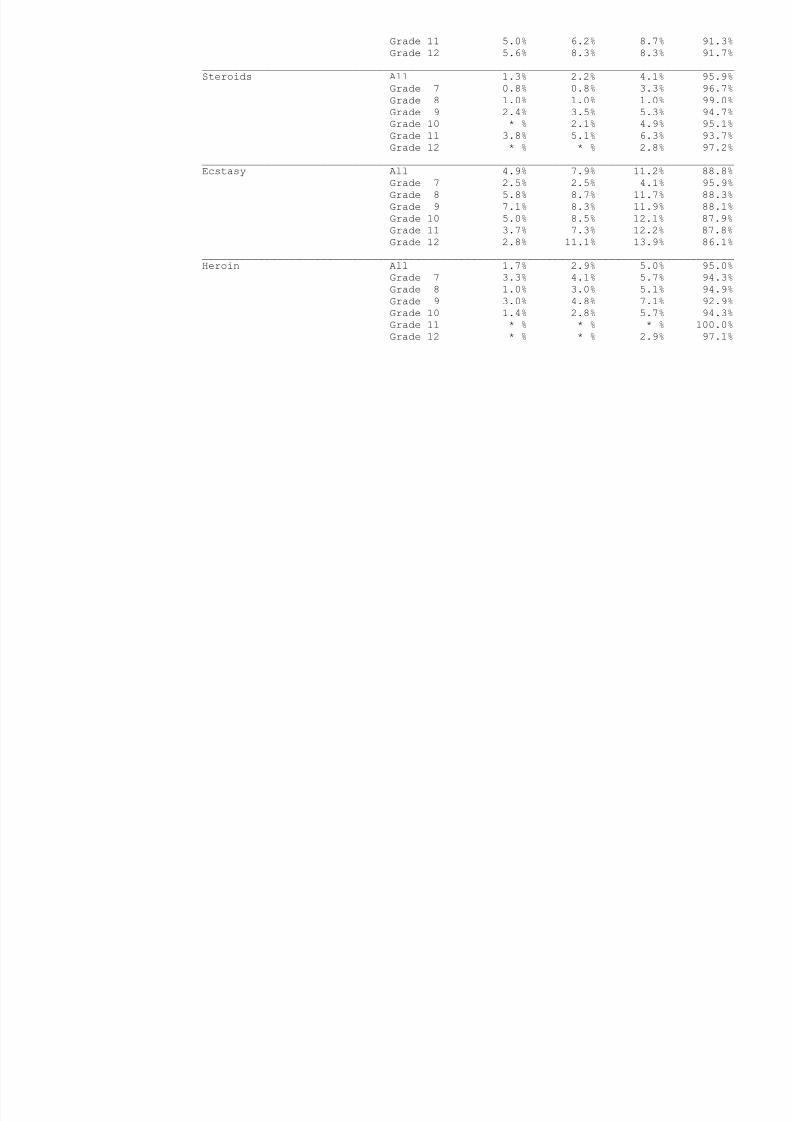
8/14/2019 BRAZORIA COUNTY - Alvin ISD - 1998 Texas School Survey of Drug and Alcohol Use
http://slidepdf.com/reader/full/brazoria-county-alvin-isd-1998-texas-school-survey-of-drug-and-alcohol 99/213
Steroids All 1.3% 2.2% 4.1% 95.9%Grade 7 0.8% 0.8% 3.3% 96.7%Grade 8 1.0% 1.0% 1.0% 99.0%Grade 9 2.4% 3.5% 5.3% 94.7%Grade 10 * % 2.1% 4.9% 95.1%Grade 11 3.8% 5.1% 6.3% 93.7%Grade 12 * % * % 2.8% 97.2%
_____________________________________________________________________________________Ecstasy All 4.9% 7.9% 11.2% 88.8%
Grade 7 2.5% 2.5% 4.1% 95.9%Grade 8 5.8% 8.7% 11.7% 88.3%Grade 9 7.1% 8.3% 11.9% 88.1%Grade 10 5.0% 8.5% 12.1% 87.9%Grade 11 3.7% 7.3% 12.2% 87.8%Grade 12 2.8% 11.1% 13.9% 86.1%
_____________________________________________________________________________________Heroin All 1.7% 2.9% 5.0% 95.0%
Grade 7 3.3% 4.1% 5.7% 94.3%
Grade 8 1.0% 3.0% 5.1% 94.9%Grade 9 3.0% 4.8% 7.1% 92.9%Grade 10 1.4% 2.8% 5.7% 94.3%Grade 11 * % * % * % 100.0%Grade 12 * % * % 2.9% 97.1%
AlvinSpring 1998
T bl B9 P l d f f l t d b t b d

8/14/2019 BRAZORIA COUNTY - Alvin ISD - 1998 Texas School Survey of Drug and Alcohol Use
http://slidepdf.com/reader/full/brazoria-county-alvin-isd-1998-texas-school-survey-of-drug-and-alcohol 100/213
Table B9: Prevalence and recency of use of selected substances by grade--> Students living with two parents
Past School Ever NeverMonth Year Used Used
_____________________________________________________________________________________Tobacco All 29.2% 36.8% 54.1% 45.9%
Grade 7 15.8% 19.7% 41.0% 59.0%Grade 8 26.7% 35.8% 55.9% 44.1%Grade 9 31.4% 40.9% 53.3% 46.7%Grade 10 32.5% 41.8% 59.3% 40.7%Grade 11 36.7% 42.7% 61.8% 38.2%Grade 12 37.9% 45.3% 57.9% 42.1%
_____________________________________________________________________________________Alcohol All 36.3% 49.4% 70.0% 30.0%
Grade 7 18.7% 25.6% 54.2% 45.8%Grade 8 33.2% 45.7% 69.3% 30.7%Grade 9 38.7% 53.2% 71.8% 28.2%
Grade 10 44.5% 60.2% 77.0% 23.0%Grade 11 43.8% 60.0% 76.2% 23.8%Grade 12 45.7% 60.6% 76.6% 23.4%
_____________________________________________________________________________________Inhalants All 8.8% 13.4% 21.8% 78.2%
Grade 7 9.8% 12.2% 20.3% 79.7%Grade 8 10.9% 15.6% 23.9% 76.1%Grade 9 8.3% 15.4% 22.7% 77.3%Grade 10 7.8% 11.7% 20.4% 79.6%Grade 11 5.6% 8.6% 17.6% 82.4%Grade 12 9.5% 15.8% 26.3% 73.7%
_____________________________________________________________________________________
Any Illicit Drug All 16.5% 24.0% 33.3% 66.7%Grade 7 6.1% 7.9% 14.9% 85.1%Grade 8 12.1% 18.8% 26.5% 73.5%Grade 9 18.3% 25.8% 34.2% 65.8%Grade 10 26.3% 36.3% 41.6% 58.4%Grade 11 21.7% 31.8% 45.3% 54.7%Grade 12 17.9% 29.5% 47.4% 52.6%
_____________________________________________________________________________________Marijuana All 14.9% 22.3% 31.7% 68.3%
Grade 7 4.8% 6.6% 13.2% 86.8%Grade 8 9.4% 15.2% 23.8% 76.2%Grade 9 16.4% 24.3% 32.8% 67.2%
Grade 10 25.2% 35.0% 40.4% 59.6%Grade 11 19.7% 29.9% 43.2% 56.8%Grade 12 16.8% 28.4% 46.3% 53.7%
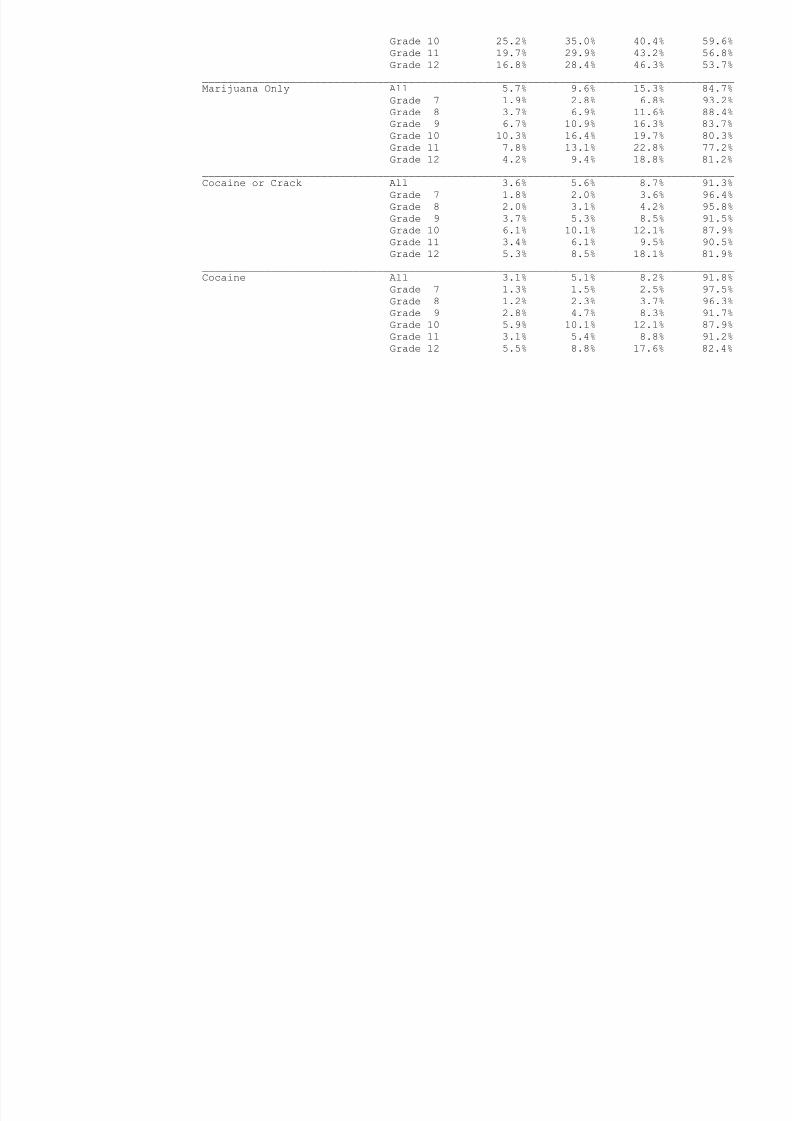
8/14/2019 BRAZORIA COUNTY - Alvin ISD - 1998 Texas School Survey of Drug and Alcohol Use
http://slidepdf.com/reader/full/brazoria-county-alvin-isd-1998-texas-school-survey-of-drug-and-alcohol 101/213
_____________________________________________________________________________________Marijuana Only All 5.7% 9.6% 15.3% 84.7%
Grade 7 1.9% 2.8% 6.8% 93.2%Grade 8 3.7% 6.9% 11.6% 88.4%Grade 9 6.7% 10.9% 16.3% 83.7%Grade 10 10.3% 16.4% 19.7% 80.3%Grade 11 7.8% 13.1% 22.8% 77.2%Grade 12 4.2% 9.4% 18.8% 81.2%
_____________________________________________________________________________________Cocaine or Crack All 3.6% 5.6% 8.7% 91.3%
Grade 7 1.8% 2.0% 3.6% 96.4%Grade 8 2.0% 3.1% 4.2% 95.8%Grade 9 3.7% 5.3% 8.5% 91.5%Grade 10 6.1% 10.1% 12.1% 87.9%Grade 11 3.4% 6.1% 9.5% 90.5%Grade 12 5.3% 8.5% 18.1% 81.9%
_____________________________________________________________________________________Cocaine All 3.1% 5.1% 8.2% 91.8%
Grade 7 1.3% 1.5% 2.5% 97.5%Grade 8 1.2% 2.3% 3.7% 96.3%Grade 9 2.8% 4.7% 8.3% 91.7%Grade 10 5.9% 10.1% 12.1% 87.9%Grade 11 3.1% 5.4% 8.8% 91.2%Grade 12 5.5% 8.8% 17.6% 82.4%
AlvinSpring 1998
Table B9 continued from previous page
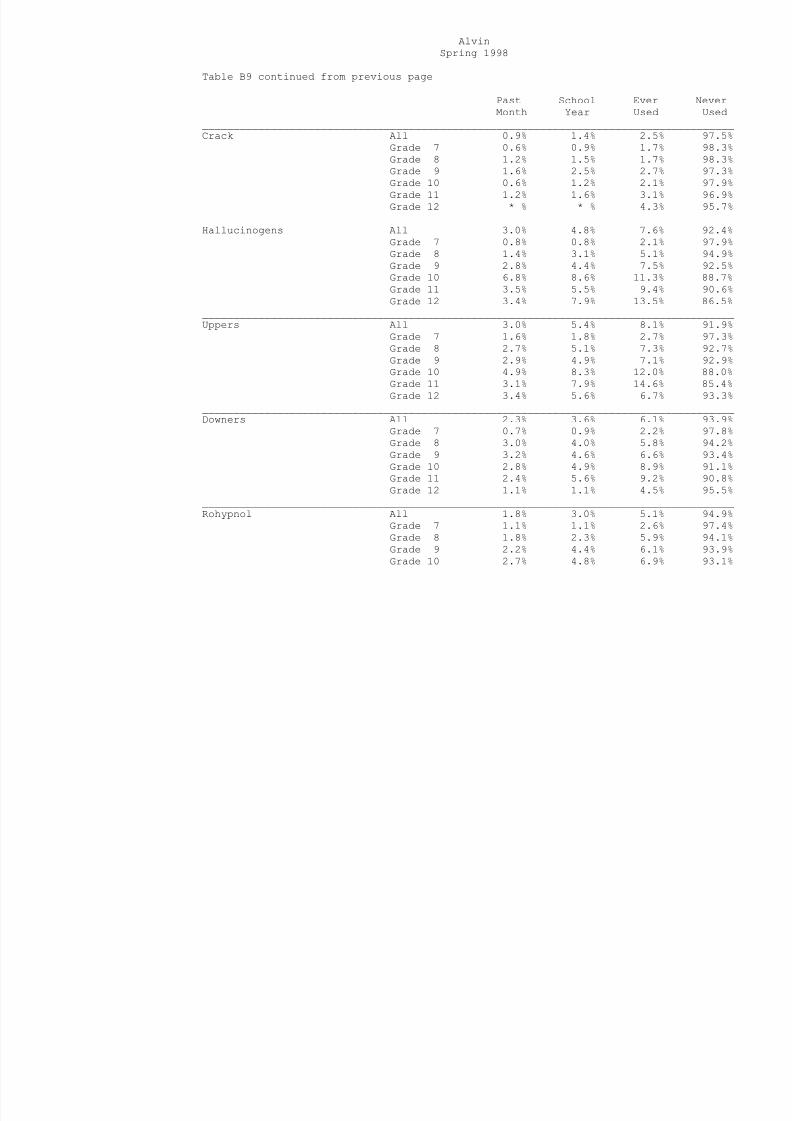
8/14/2019 BRAZORIA COUNTY - Alvin ISD - 1998 Texas School Survey of Drug and Alcohol Use
http://slidepdf.com/reader/full/brazoria-county-alvin-isd-1998-texas-school-survey-of-drug-and-alcohol 102/213
Table B9 continued from previous page
Past School Ever NeverMonth Year Used Used
_____________________________________________________________________________________Crack All 0.9% 1.4% 2.5% 97.5%
Grade 7 0.6% 0.9% 1.7% 98.3%Grade 8 1.2% 1.5% 1.7% 98.3%Grade 9 1.6% 2.5% 2.7% 97.3%Grade 10 0.6% 1.2% 2.1% 97.9%Grade 11 1.2% 1.6% 3.1% 96.9%Grade 12 * % * % 4.3% 95.7%
_____________________________________________________________________________________Hallucinogens All 3.0% 4.8% 7.6% 92.4%
Grade 7 0.8% 0.8% 2.1% 97.9%Grade 8 1.4% 3.1% 5.1% 94.9%Grade 9 2.8% 4.4% 7.5% 92.5%Grade 10 6.8% 8.6% 11.3% 88.7%
Grade 11 3.5% 5.5% 9.4% 90.6%Grade 12 3.4% 7.9% 13.5% 86.5%_____________________________________________________________________________________Uppers All 3.0% 5.4% 8.1% 91.9%
Grade 7 1.6% 1.8% 2.7% 97.3%Grade 8 2.7% 5.1% 7.3% 92.7%Grade 9 2.9% 4.9% 7.1% 92.9%Grade 10 4.9% 8.3% 12.0% 88.0%Grade 11 3.1% 7.9% 14.6% 85.4%Grade 12 3.4% 5.6% 6.7% 93.3%
_____________________________________________________________________________________Downers All 2.3% 3.6% 6.1% 93.9%
Grade 7 0.7% 0.9% 2.2% 97.8%Grade 8 3.0% 4.0% 5.8% 94.2%Grade 9 3.2% 4.6% 6.6% 93.4%Grade 10 2.8% 4.9% 8.9% 91.1%Grade 11 2.4% 5.6% 9.2% 90.8%Grade 12 1.1% 1.1% 4.5% 95.5%
_____________________________________________________________________________________Rohypnol All 1.8% 3.0% 5.1% 94.9%
Grade 7 1.1% 1.1% 2.6% 97.4%Grade 8 1.8% 2.3% 5.9% 94.1%Grade 9 2.2% 4.4% 6.1% 93.9%Grade 10 2.7% 4.8% 6.9% 93.1%
Grade 11 1.6% 1.9% 5.1% 94.9%Grade 12 1.1% 3.3% 3.3% 96.7%
_____________________________________________________________________________________Steroids All 0 7% 1 2% 2 6% 97 4%

8/14/2019 BRAZORIA COUNTY - Alvin ISD - 1998 Texas School Survey of Drug and Alcohol Use
http://slidepdf.com/reader/full/brazoria-county-alvin-isd-1998-texas-school-survey-of-drug-and-alcohol 103/213
Steroids All 0.7% 1.2% 2.6% 97.4%Grade 7 0.7% 0.7% 1.6% 98.4%Grade 8 1.2% 2.1% 2.7% 97.3%Grade 9 * % 0.9% 2.3% 97.7%Grade 10 0.3% 0.6% 2.1% 97.9%Grade 11 1.6% 2.4% 3.2% 96.8%Grade 12 1.1% 1.1% 4.5% 95.5%
_____________________________________________________________________________________Ecstasy All 2.5% 3.6% 5.1% 94.9%
Grade 7 0.7% 0.7% 1.4% 98.6%Grade 8 2.5% 4.0% 5.2% 94.8%Grade 9 1.1% 2.3% 3.7% 96.3%Grade 10 3.6% 6.0% 7.6% 92.4%Grade 11 3.5% 4.3% 6.3% 93.7%Grade 12 4.5% 5.6% 7.9% 92.1%
_____________________________________________________________________________________Heroin All 0.8% 1.0% 2.2% 97.8%
Grade 7 0.7% 0.7% 2.0% 98.0%
Grade 8 1.5% 2.5% 2.8% 97.2%Grade 9 1.1% 1.1% 3.4% 96.6%Grade 10 0.6% 0.6% 2.1% 97.9%Grade 11 0.4% 0.4% 0.8% 99.2%Grade 12 * % * % 1.1% 98.9%
AlvinSpring 1998
Table B10: Prevalence and recency of use of selected substances by grade

8/14/2019 BRAZORIA COUNTY - Alvin ISD - 1998 Texas School Survey of Drug and Alcohol Use
http://slidepdf.com/reader/full/brazoria-county-alvin-isd-1998-texas-school-survey-of-drug-and-alcohol 104/213
Table B10: Prevalence and recency of use of selected substances by grade--> Students not living with two parents
Past School Ever NeverMonth Year Used Used
_____________________________________________________________________________________Tobacco All 38.6% 50.5% 71.2% 28.8%
Grade 7 23.6% 30.9% 54.1% 45.9%Grade 8 35.5% 49.1% 72.0% 28.0%Grade 9 45.3% 58.7% 78.3% 21.7%Grade 10 40.1% 51.1% 71.4% 28.6%Grade 11 44.9% 56.9% 77.8% 22.2%Grade 12 41.7% 56.3% 70.8% 29.2%
_____________________________________________________________________________________Alcohol All 47.2% 63.4% 83.5% 16.5%
Grade 7 28.1% 41.2% 67.7% 32.3%Grade 8 44.2% 62.3% 83.3% 16.7%Grade 9 54.3% 68.8% 87.9% 12.1%
Grade 10 50.8% 66.1% 83.6% 16.4%Grade 11 58.2% 75.8% 90.9% 9.1%Grade 12 46.8% 68.1% 89.4% 10.6%
_____________________________________________________________________________________Inhalants All 12.6% 18.5% 30.7% 69.3%
Grade 7 15.6% 21.4% 32.8% 67.2%Grade 8 18.8% 25.2% 38.1% 61.9%Grade 9 15.6% 21.9% 37.5% 62.5%Grade 10 9.8% 13.7% 26.2% 73.8%Grade 11 4.9% 11.6% 23.8% 76.2%Grade 12 4.1% 10.2% 14.3% 85.7%
_____________________________________________________________________________________
Any Illicit Drug All 27.2% 35.8% 50.0% 50.0%Grade 7 12.6% 15.7% 28.4% 71.6%Grade 8 22.9% 31.8% 45.8% 54.2%Grade 9 35.0% 43.7% 57.5% 42.5%Grade 10 31.7% 43.2% 55.2% 44.8%Grade 11 27.7% 38.6% 60.8% 39.2%Grade 12 32.7% 42.9% 53.1% 46.9%
_____________________________________________________________________________________Marijuana All 24.6% 33.9% 48.1% 51.9%
Grade 7 11.4% 14.5% 25.9% 74.1%Grade 8 20.8% 29.7% 42.5% 57.5%Grade 9 31.5% 41.0% 56.6% 43.4%
Grade 10 29.7% 39.6% 52.7% 47.3%Grade 11 25.2% 37.4% 58.3% 41.7%Grade 12 28.6% 42.9% 53.1% 46.9%
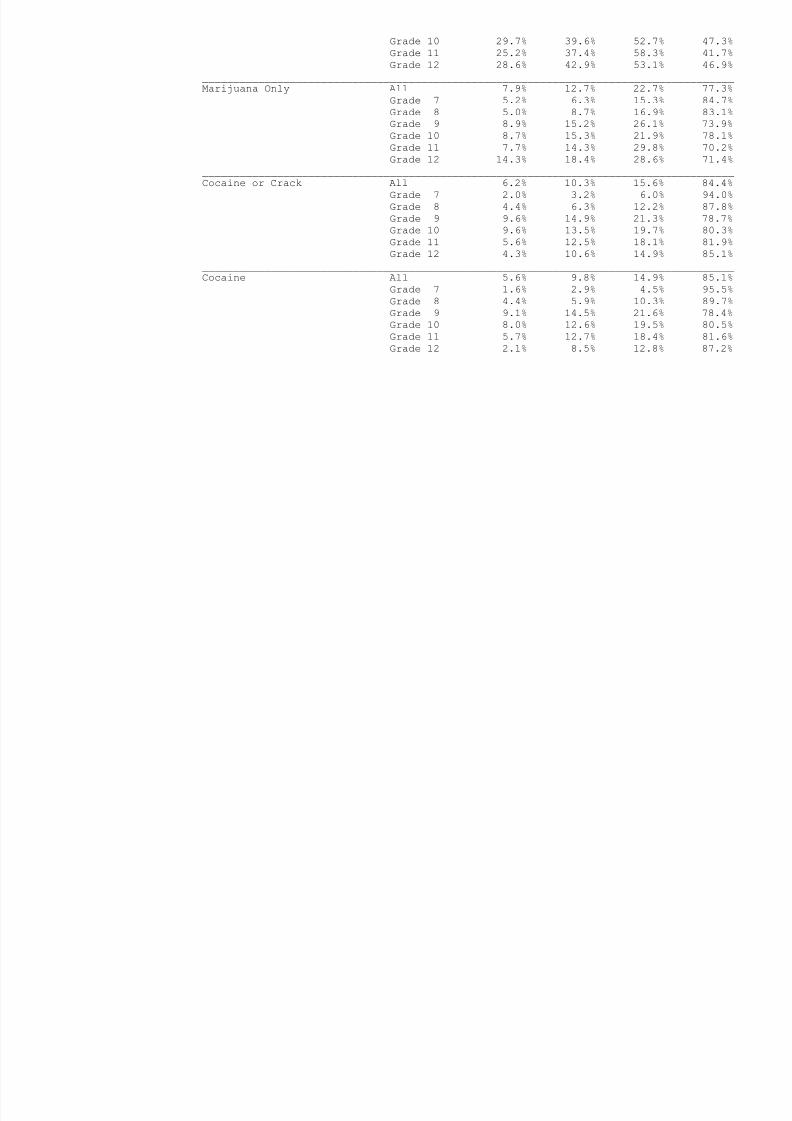
8/14/2019 BRAZORIA COUNTY - Alvin ISD - 1998 Texas School Survey of Drug and Alcohol Use
http://slidepdf.com/reader/full/brazoria-county-alvin-isd-1998-texas-school-survey-of-drug-and-alcohol 105/213
_____________________________________________________________________________________Marijuana Only All 7.9% 12.7% 22.7% 77.3%
Grade 7 5.2% 6.3% 15.3% 84.7%Grade 8 5.0% 8.7% 16.9% 83.1%Grade 9 8.9% 15.2% 26.1% 73.9%Grade 10 8.7% 15.3% 21.9% 78.1%Grade 11 7.7% 14.3% 29.8% 70.2%Grade 12 14.3% 18.4% 28.6% 71.4%
_____________________________________________________________________________________Cocaine or Crack All 6.2% 10.3% 15.6% 84.4%
Grade 7 2.0% 3.2% 6.0% 94.0%Grade 8 4.4% 6.3% 12.2% 87.8%Grade 9 9.6% 14.9% 21.3% 78.7%Grade 10 9.6% 13.5% 19.7% 80.3%Grade 11 5.6% 12.5% 18.1% 81.9%Grade 12 4.3% 10.6% 14.9% 85.1%
_____________________________________________________________________________________Cocaine All 5.6% 9.8% 14.9% 85.1%
Grade 7 1.6% 2.9% 4.5% 95.5%Grade 8 4.4% 5.9% 10.3% 89.7%Grade 9 9.1% 14.5% 21.6% 78.4%Grade 10 8.0% 12.6% 19.5% 80.5%Grade 11 5.7% 12.7% 18.4% 81.6%Grade 12 2.1% 8.5% 12.8% 87.2%
AlvinSpring 1998
Table B10 continued from previous page

8/14/2019 BRAZORIA COUNTY - Alvin ISD - 1998 Texas School Survey of Drug and Alcohol Use
http://slidepdf.com/reader/full/brazoria-county-alvin-isd-1998-texas-school-survey-of-drug-and-alcohol 106/213
Table B10 continued from previous page
Past School Ever NeverMonth Year Used Used
_____________________________________________________________________________________Crack All 1.9% 2.8% 4.9% 95.1%
Grade 7 0.8% 0.8% 2.9% 97.1%Grade 8 1.0% 1.5% 7.1% 92.9%Grade 9 3.4% 5.5% 7.2% 92.8%Grade 10 2.9% 4.0% 5.2% 94.8%Grade 11 0.6% 1.3% 1.9% 98.1%Grade 12 2.3% 2.3% 2.3% 97.7%
_____________________________________________________________________________________Hallucinogens All 4.9% 8.3% 13.6% 86.4%
Grade 7 1.7% 2.5% 2.9% 97.1%Grade 8 5.5% 8.5% 13.9% 86.1%Grade 9 5.8% 10.3% 16.5% 83.5%Grade 10 6.2% 9.0% 13.5% 86.5%
Grade 11 5.0% 10.0% 17.5% 82.5%Grade 12 4.5% 9.1% 18.2% 81.8%_____________________________________________________________________________________Uppers All 5.8% 10.1% 15.6% 84.4%
Grade 7 1.8% 2.6% 4.4% 95.6%Grade 8 8.9% 11.6% 17.9% 82.1%Grade 9 4.2% 11.9% 16.1% 83.9%Grade 10 10.5% 14.0% 22.7% 77.3%Grade 11 5.1% 10.3% 16.7% 83.3%Grade 12 4.4% 8.9% 15.6% 84.4%
_____________________________________________________________________________________Downers All 4.0% 7.1% 11.7% 88.3%
Grade 7 1.8% 2.2% 5.8% 94.2%Grade 8 5.8% 9.5% 14.8% 85.2%Grade 9 4.7% 8.9% 13.6% 86.4%Grade 10 4.5% 6.1% 11.2% 88.8%Grade 11 3.8% 8.9% 13.4% 86.6%Grade 12 2.3% 4.5% 9.1% 90.9%
_____________________________________________________________________________________Rohypnol All 5.3% 6.7% 8.9% 91.1%
Grade 7 1.3% 2.6% 4.8% 95.2%Grade 8 6.5% 7.5% 9.5% 90.5%Grade 9 7.1% 8.3% 11.6% 88.4%Grade 10 6.2% 8.5% 10.7% 89.3%
Grade 11 3.1% 5.6% 7.5% 92.5%Grade 12 6.8% 6.8% 6.8% 93.2%
_____________________________________________________________________________________Steroids All 0.7% 1.3% 3.0% 97.0%

8/14/2019 BRAZORIA COUNTY - Alvin ISD - 1998 Texas School Survey of Drug and Alcohol Use
http://slidepdf.com/reader/full/brazoria-county-alvin-isd-1998-texas-school-survey-of-drug-and-alcohol 107/213
Ste o ds 0. .3 3.0 9 .0Grade 7 0.4% 0.9% 2.1% 97.9%Grade 8 0.5% 1.1% 2.1% 97.9%Grade 9 1.7% 2.2% 3.4% 96.6%Grade 10 * % 1.1% 4.0% 96.0%Grade 11 0.6% 1.9% 5.1% 94.9%Grade 12 * % * % * % 100.0%
_____________________________________________________________________________________Ecstasy All 3.2% 5.5% 8.5% 91.5%
Grade 7 0.9% 0.9% 2.2% 97.8%Grade 8 4.3% 6.4% 8.0% 92.0%Grade 9 3.4% 4.7% 8.2% 91.8%Grade 10 4.6% 8.0% 12.0% 88.0%Grade 11 1.9% 5.8% 12.9% 87.1%Grade 12 4.4% 8.9% 8.9% 91.1%
_____________________________________________________________________________________Heroin All 1.4% 2.5% 3.7% 96.3%
Grade 7 1.8% 2.6% 3.1% 96.9%
Grade 8 2.1% 2.1% 5.2% 94.8%Grade 9 2.2% 3.5% 5.2% 94.8%Grade 10 1.1% 4.0% 4.5% 95.5%Grade 11 * % * % * % 100.0%Grade 12 * % 2.3% 2.3% 97.7%
AlvinSpring 1998
Table B11: Prevalence and recency of use of selected substances by grade
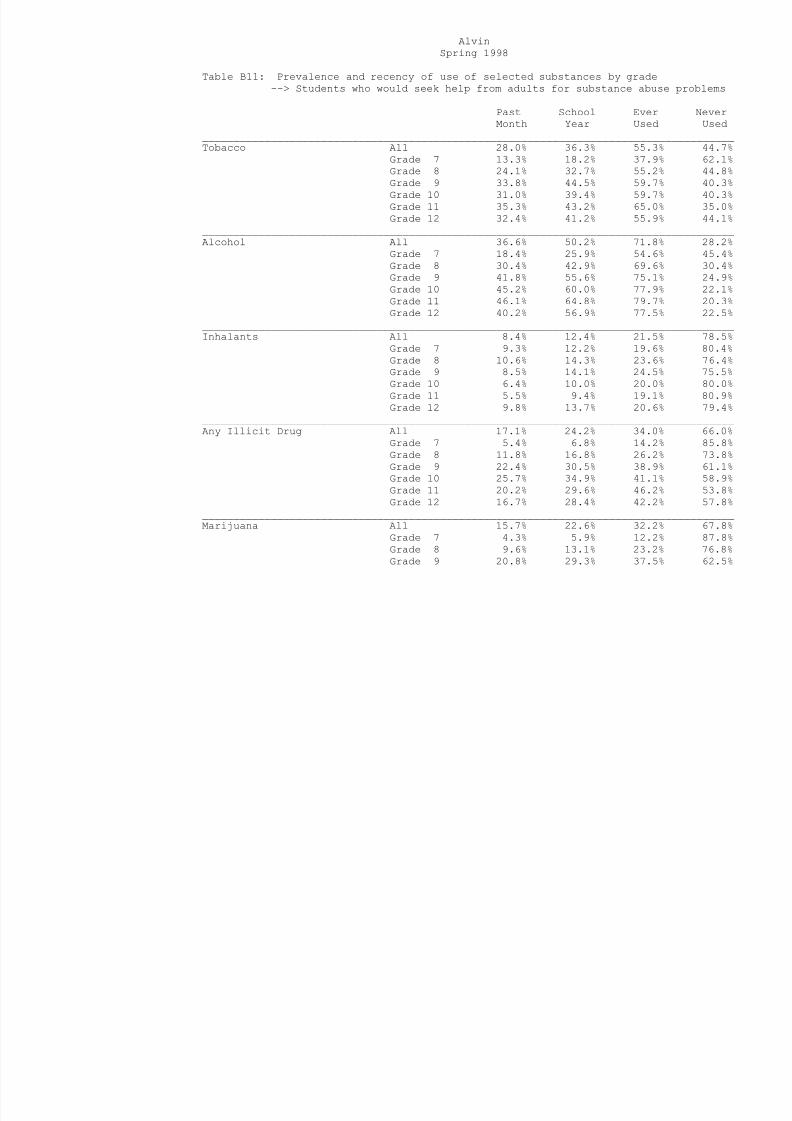
8/14/2019 BRAZORIA COUNTY - Alvin ISD - 1998 Texas School Survey of Drug and Alcohol Use
http://slidepdf.com/reader/full/brazoria-county-alvin-isd-1998-texas-school-survey-of-drug-and-alcohol 108/213
y y g--> Students who would seek help from adults for substance abuse problems
Past School Ever NeverMonth Year Used Used
_____________________________________________________________________________________Tobacco All 28.0% 36.3% 55.3% 44.7%
Grade 7 13.3% 18.2% 37.9% 62.1%Grade 8 24.1% 32.7% 55.2% 44.8%Grade 9 33.8% 44.5% 59.7% 40.3%Grade 10 31.0% 39.4% 59.7% 40.3%Grade 11 35.3% 43.2% 65.0% 35.0%Grade 12 32.4% 41.2% 55.9% 44.1%
_____________________________________________________________________________________Alcohol All 36.6% 50.2% 71.8% 28.2%
Grade 7 18.4% 25.9% 54.6% 45.4%Grade 8 30.4% 42.9% 69.6% 30.4%Grade 9 41.8% 55.6% 75.1% 24.9%
Grade 10 45.2% 60.0% 77.9% 22.1%Grade 11 46.1% 64.8% 79.7% 20.3%Grade 12 40.2% 56.9% 77.5% 22.5%
_____________________________________________________________________________________Inhalants All 8.4% 12.4% 21.5% 78.5%
Grade 7 9.3% 12.2% 19.6% 80.4%Grade 8 10.6% 14.3% 23.6% 76.4%Grade 9 8.5% 14.1% 24.5% 75.5%Grade 10 6.4% 10.0% 20.0% 80.0%Grade 11 5.5% 9.4% 19.1% 80.9%Grade 12 9.8% 13.7% 20.6% 79.4%
_____________________________________________________________________________________
Any Illicit Drug All 17.1% 24.2% 34.0% 66.0%Grade 7 5.4% 6.8% 14.2% 85.8%Grade 8 11.8% 16.8% 26.2% 73.8%Grade 9 22.4% 30.5% 38.9% 61.1%Grade 10 25.7% 34.9% 41.1% 58.9%Grade 11 20.2% 29.6% 46.2% 53.8%Grade 12 16.7% 28.4% 42.2% 57.8%
_____________________________________________________________________________________Marijuana All 15.7% 22.6% 32.2% 67.8%
Grade 7 4.3% 5.9% 12.2% 87.8%Grade 8 9.6% 13.1% 23.2% 76.8%Grade 9 20.8% 29.3% 37.5% 62.5%
Grade 10 24.3% 32.5% 39.3% 60.7%Grade 11 18.5% 28.2% 44.2% 55.8%Grade 12 15.7% 27.5% 41.2% 58.8%
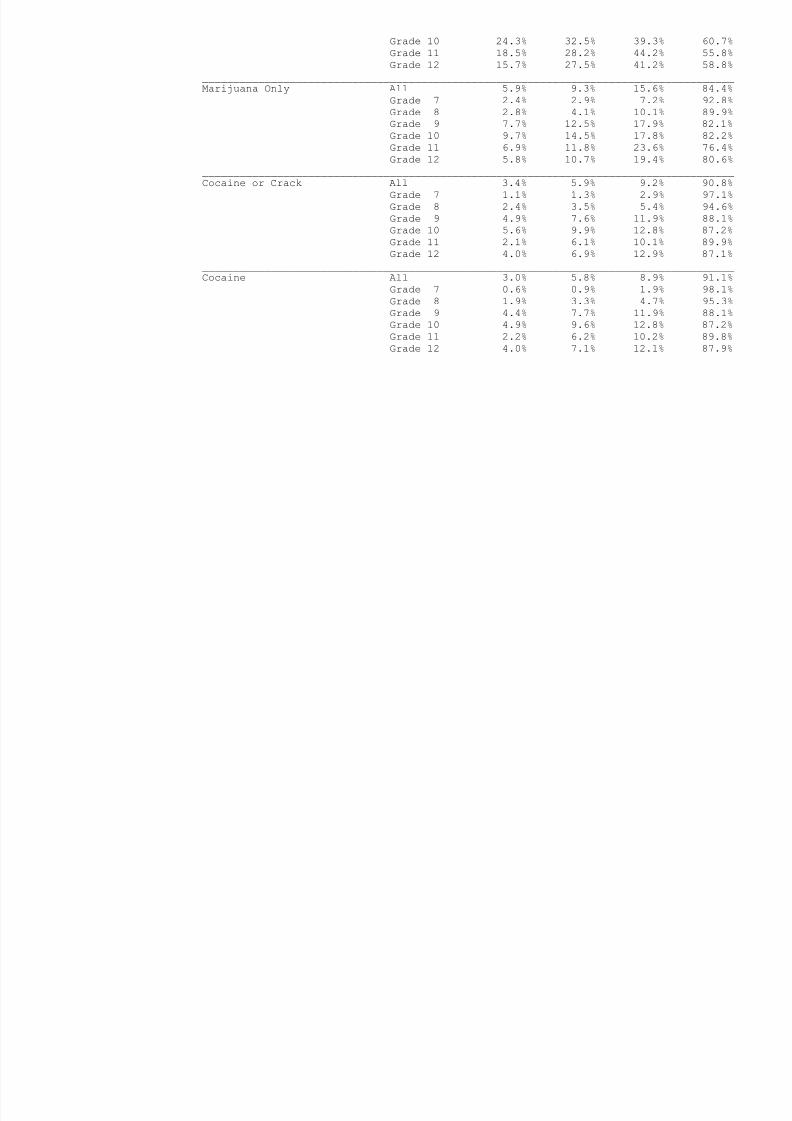
8/14/2019 BRAZORIA COUNTY - Alvin ISD - 1998 Texas School Survey of Drug and Alcohol Use
http://slidepdf.com/reader/full/brazoria-county-alvin-isd-1998-texas-school-survey-of-drug-and-alcohol 109/213
_____________________________________________________________________________________Marijuana Only All 5.9% 9.3% 15.6% 84.4%
Grade 7 2.4% 2.9% 7.2% 92.8%Grade 8 2.8% 4.1% 10.1% 89.9%Grade 9 7.7% 12.5% 17.9% 82.1%Grade 10 9.7% 14.5% 17.8% 82.2%Grade 11 6.9% 11.8% 23.6% 76.4%
Grade 12 5.8% 10.7% 19.4% 80.6%_____________________________________________________________________________________Cocaine or Crack All 3.4% 5.9% 9.2% 90.8%
Grade 7 1.1% 1.3% 2.9% 97.1%Grade 8 2.4% 3.5% 5.4% 94.6%Grade 9 4.9% 7.6% 11.9% 88.1%Grade 10 5.6% 9.9% 12.8% 87.2%Grade 11 2.1% 6.1% 10.1% 89.9%Grade 12 4.0% 6.9% 12.9% 87.1%
_____________________________________________________________________________________Cocaine All 3.0% 5.8% 8.9% 91.1%
Grade 7 0.6% 0.9% 1.9% 98.1%Grade 8 1.9% 3.3% 4.7% 95.3%Grade 9 4.4% 7.7% 11.9% 88.1%Grade 10 4.9% 9.6% 12.8% 87.2%Grade 11 2.2% 6.2% 10.2% 89.8%Grade 12 4.0% 7.1% 12.1% 87.9%
AlvinSpring 1998
Table B11 continued from previous page

8/14/2019 BRAZORIA COUNTY - Alvin ISD - 1998 Texas School Survey of Drug and Alcohol Use
http://slidepdf.com/reader/full/brazoria-county-alvin-isd-1998-texas-school-survey-of-drug-and-alcohol 110/213
Past School Ever NeverMonth Year Used Used
_____________________________________________________________________________________Crack All 0.8% 1.2% 2.3% 97.7%
Grade 7 0.6% 0.6% 1.3% 98.7%
Grade 8 1.1% 1.4% 2.8% 97.2%Grade 9 1.5% 2.4% 2.9% 97.1%Grade 10 0.7% 1.5% 2.7% 97.3%Grade 11 0.3% 0.3% 1.9% 98.1%Grade 12 * % * % 2.0% 98.0%
_____________________________________________________________________________________Hallucinogens All 2.7% 4.9% 8.1% 91.9%
Grade 7 0.6% 0.8% 1.3% 98.7%Grade 8 1.9% 3.9% 6.9% 93.1%Grade 9 3.1% 5.3% 9.2% 90.8%Grade 10 5.2% 7.2% 10.4% 89.6%
Grade 11 3.1% 5.9% 11.3% 88.8%Grade 12 2.1% 7.4% 10.5% 89.5%_____________________________________________________________________________________Uppers All 3.4% 6.3% 9.7% 90.3%
Grade 7 1.0% 1.2% 1.8% 98.2%Grade 8 2.9% 4.3% 7.5% 92.5%Grade 9 2.5% 6.3% 9.4% 90.6%Grade 10 6.1% 9.6% 14.2% 85.8%Grade 11 4.4% 9.2% 15.5% 84.5%Grade 12 4.2% 8.3% 11.5% 88.5%
_____________________________________________________________________________________Downers All 2.3% 4.0% 6.8% 93.2%
Grade 7 0.8% 1.2% 2.2% 97.8%Grade 8 2.6% 3.8% 5.5% 94.5%Grade 9 3.2% 5.0% 8.1% 91.9%Grade 10 3.0% 5.5% 9.5% 90.5%Grade 11 2.5% 5.4% 9.9% 90.1%Grade 12 1.1% 2.1% 5.3% 94.7%
_____________________________________________________________________________________Rohypnol All 2.1% 3.4% 5.1% 94.9%
Grade 7 0.6% 1.2% 2.1% 97.9%Grade 8 1.9% 2.8% 5.6% 94.4%Grade 9 3.3% 5.0% 6.5% 93.5%Grade 10 2.7% 4.9% 6.9% 93.1%
Grade 11 1.5% 2.5% 5.2% 94.8%Grade 12 2.1% 3.1% 3.1% 96.9%
_____________________________________________________________________________________Steroids All 0.6% 1.0% 2.1% 97.9%

8/14/2019 BRAZORIA COUNTY - Alvin ISD - 1998 Texas School Survey of Drug and Alcohol Use
http://slidepdf.com/reader/full/brazoria-county-alvin-isd-1998-texas-school-survey-of-drug-and-alcohol 111/213
Grade 7 0.4% 0.4% 1.0% 99.0%Grade 8 0.9% 1.5% 2.0% 98.0%Grade 9 0.2% 0.7% 1.4% 98.6%Grade 10 * % 0.7% 2.0% 98.0%Grade 11 1.3% 2.2% 3.8% 96.2%Grade 12 1.1% 1.1% 3.2% 96.8%
_____________________________________________________________________________________Ecstasy All 1.9% 3.5% 5.2% 94.8%
Grade 7 0.4% 0.4% 1.0% 99.0%Grade 8 0.6% 2.7% 4.1% 95.9%Grade 9 1.6% 2.9% 5.0% 95.0%Grade 10 2.8% 5.0% 7.3% 92.7%Grade 11 2.8% 4.7% 7.6% 92.4%Grade 12 4.2% 6.3% 7.3% 92.7%
_____________________________________________________________________________________Heroin All 0.5% 0.8% 1.8% 98.2%
Grade 7 * % 0.4% 1.2% 98.8%
Grade 8 1.5% 1.8% 2.6% 97.4%Grade 9 0.7% 0.9% 2.5% 97.5%Grade 10 0.5% 1.5% 2.5% 97.5%Grade 11 * % * % 0.3% 99.7%Grade 12 * % * % 1.1% 98.9%
AlvinSpring 1998
Table B12: Prevalence and recency of use of selected substances by grade
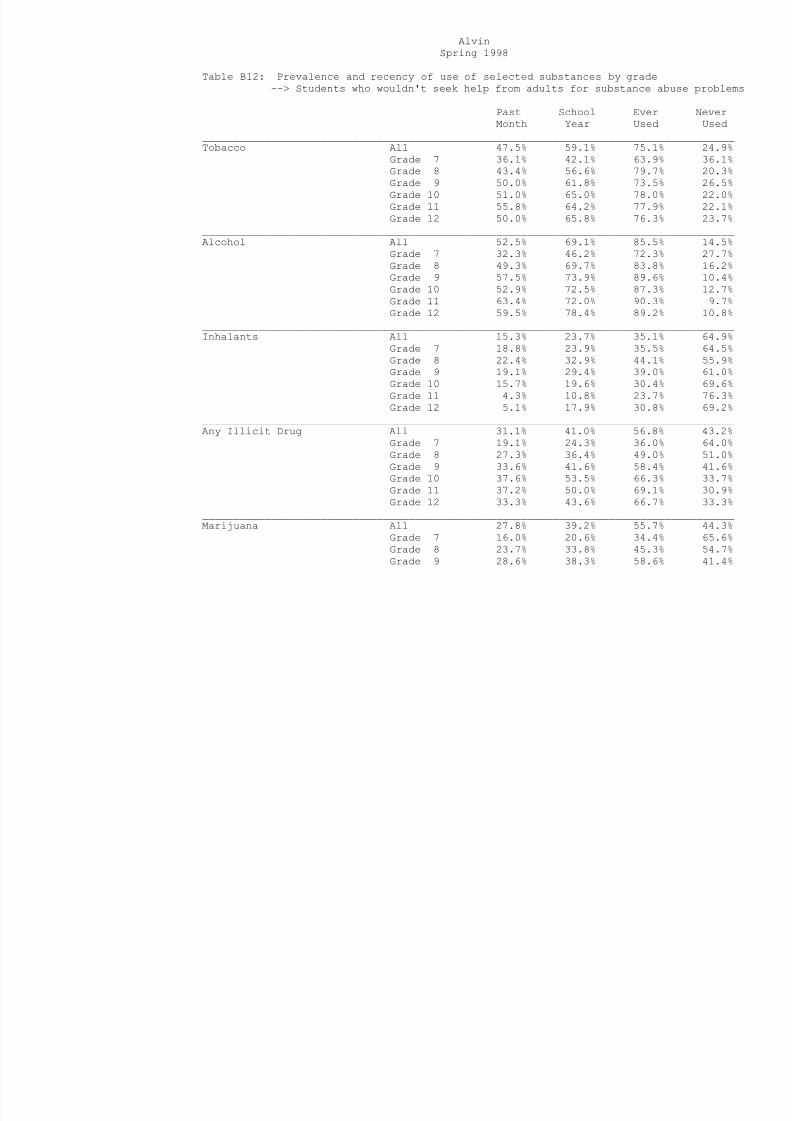
8/14/2019 BRAZORIA COUNTY - Alvin ISD - 1998 Texas School Survey of Drug and Alcohol Use
http://slidepdf.com/reader/full/brazoria-county-alvin-isd-1998-texas-school-survey-of-drug-and-alcohol 112/213
--> Students who wouldn't seek help from adults for substance abuse problems
Past School Ever NeverMonth Year Used Used
_____________________________________________________________________________________Tobacco All 47.5% 59.1% 75.1% 24.9%
Grade 7 36.1% 42.1% 63.9% 36.1%Grade 8 43.4% 56.6% 79.7% 20.3%Grade 9 50.0% 61.8% 73.5% 26.5%Grade 10 51.0% 65.0% 78.0% 22.0%Grade 11 55.8% 64.2% 77.9% 22.1%Grade 12 50.0% 65.8% 76.3% 23.7%
_____________________________________________________________________________________Alcohol All 52.5% 69.1% 85.5% 14.5%
Grade 7 32.3% 46.2% 72.3% 27.7%Grade 8 49.3% 69.7% 83.8% 16.2%Grade 9 57.5% 73.9% 89.6% 10.4%
Grade 10 52.9% 72.5% 87.3% 12.7%Grade 11 63.4% 72.0% 90.3% 9.7%Grade 12 59.5% 78.4% 89.2% 10.8%
_____________________________________________________________________________________Inhalants All 15.3% 23.7% 35.1% 64.9%
Grade 7 18.8% 23.9% 35.5% 64.5%Grade 8 22.4% 32.9% 44.1% 55.9%Grade 9 19.1% 29.4% 39.0% 61.0%Grade 10 15.7% 19.6% 30.4% 69.6%Grade 11 4.3% 10.8% 23.7% 76.3%Grade 12 5.1% 17.9% 30.8% 69.2%
_____________________________________________________________________________________
Any Illicit Drug All 31.1% 41.0% 56.8% 43.2%Grade 7 19.1% 24.3% 36.0% 64.0%Grade 8 27.3% 36.4% 49.0% 51.0%Grade 9 33.6% 41.6% 58.4% 41.6%Grade 10 37.6% 53.5% 66.3% 33.7%Grade 11 37.2% 50.0% 69.1% 30.9%Grade 12 33.3% 43.6% 66.7% 33.3%
_____________________________________________________________________________________Marijuana All 27.8% 39.2% 55.7% 44.3%
Grade 7 16.0% 20.6% 34.4% 65.6%Grade 8 23.7% 33.8% 45.3% 54.7%Grade 9 28.6% 38.3% 58.6% 41.4%
Grade 10 38.1% 54.6% 67.0% 33.0%Grade 11 34.4% 48.9% 66.7% 33.3%Grade 12 28.2% 43.6% 66.7% 33.3%
_____________________________________________________________________________________

8/14/2019 BRAZORIA COUNTY - Alvin ISD - 1998 Texas School Survey of Drug and Alcohol Use
http://slidepdf.com/reader/full/brazoria-county-alvin-isd-1998-texas-school-survey-of-drug-and-alcohol 113/213
Marijuana Only All 8.6% 15.4% 26.3% 73.7%Grade 7 7.9% 10.8% 20.1% 79.9%Grade 8 6.9% 13.2% 19.4% 80.6%Grade 9 8.0% 13.8% 27.5% 72.5%Grade 10 10.8% 23.5% 31.4% 68.6%Grade 11 11.6% 21.1% 34.7% 65.3%
Grade 12 7.7% 12.8% 28.2% 71.8%_____________________________________________________________________________________Cocaine or Crack All 8.0% 11.3% 17.4% 82.6%
Grade 7 4.1% 5.7% 8.1% 91.9%Grade 8 4.5% 6.0% 11.2% 88.8%Grade 9 9.2% 13.7% 18.3% 81.7%Grade 10 12.8% 16.0% 22.3% 77.7%Grade 11 11.2% 14.6% 20.2% 79.8%Grade 12 7.9% 13.2% 26.3% 73.7%
_____________________________________________________________________________________Cocaine All 6.8% 9.7% 16.5% 83.5%
Grade 7 3.4% 4.2% 6.8% 93.2%Grade 8 3.0% 3.8% 9.1% 90.9%Grade 9 7.9% 11.9% 19.0% 81.0%Grade 10 12.1% 15.4% 22.0% 78.0%Grade 11 10.3% 13.8% 19.5% 80.5%Grade 12 5.4% 10.8% 24.3% 75.7%
AlvinSpring 1998
Table B12 continued from previous page
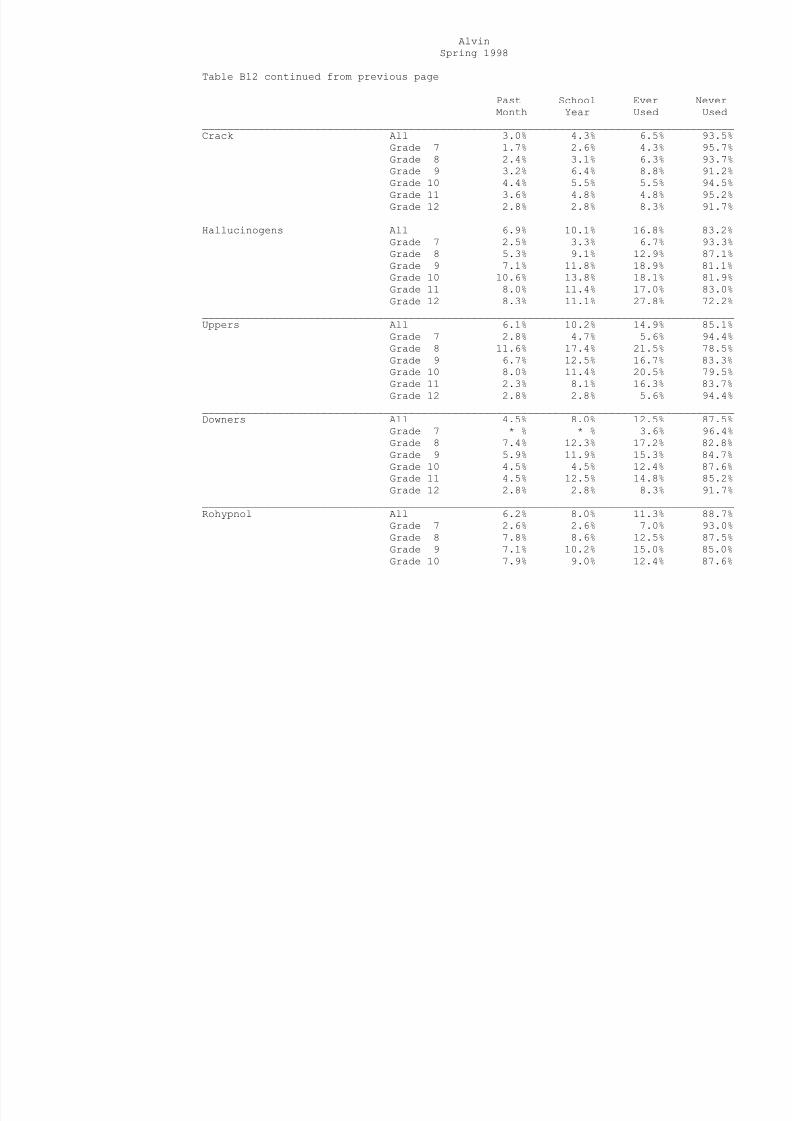
8/14/2019 BRAZORIA COUNTY - Alvin ISD - 1998 Texas School Survey of Drug and Alcohol Use
http://slidepdf.com/reader/full/brazoria-county-alvin-isd-1998-texas-school-survey-of-drug-and-alcohol 114/213
Past School Ever NeverMonth Year Used Used
_____________________________________________________________________________________Crack All 3.0% 4.3% 6.5% 93.5%
Grade 7 1.7% 2.6% 4.3% 95.7%
Grade 8 2.4% 3.1% 6.3% 93.7%Grade 9 3.2% 6.4% 8.8% 91.2%Grade 10 4.4% 5.5% 5.5% 94.5%Grade 11 3.6% 4.8% 4.8% 95.2%Grade 12 2.8% 2.8% 8.3% 91.7%
_____________________________________________________________________________________Hallucinogens All 6.9% 10.1% 16.8% 83.2%
Grade 7 2.5% 3.3% 6.7% 93.3%Grade 8 5.3% 9.1% 12.9% 87.1%Grade 9 7.1% 11.8% 18.9% 81.1%Grade 10 10.6% 13.8% 18.1% 81.9%Grade 11 8.0% 11.4% 17.0% 83.0%Grade 12 8.3% 11.1% 27.8% 72.2%
_____________________________________________________________________________________Uppers All 6.1% 10.2% 14.9% 85.1%
Grade 7 2.8% 4.7% 5.6% 94.4%Grade 8 11.6% 17.4% 21.5% 78.5%Grade 9 6.7% 12.5% 16.7% 83.3%Grade 10 8.0% 11.4% 20.5% 79.5%Grade 11 2.3% 8.1% 16.3% 83.7%Grade 12 2.8% 2.8% 5.6% 94.4%
_____________________________________________________________________________________Downers All 4.5% 8.0% 12.5% 87.5%
Grade 7 * % * % 3.6% 96.4%Grade 8 7.4% 12.3% 17.2% 82.8%Grade 9 5.9% 11.9% 15.3% 84.7%Grade 10 4.5% 4.5% 12.4% 87.6%Grade 11 4.5% 12.5% 14.8% 85.2%Grade 12 2.8% 2.8% 8.3% 91.7%
_____________________________________________________________________________________Rohypnol All 6.2% 8.0% 11.3% 88.7%
Grade 7 2.6% 2.6% 7.0% 93.0%Grade 8 7.8% 8.6% 12.5% 87.5%Grade 9 7.1% 10.2% 15.0% 85.0%Grade 10 7.9% 9.0% 12.4% 87.6%
Grade 11 4.7% 7.1% 9.4% 90.6%Grade 12 5.7% 8.6% 8.6% 91.4%
_____________________________________________________________________________________Steroids All 1.5% 2.4% 5.6% 94.4%
G d 7 0 9% 1 8% 4 4% 95 6%

8/14/2019 BRAZORIA COUNTY - Alvin ISD - 1998 Texas School Survey of Drug and Alcohol Use
http://slidepdf.com/reader/full/brazoria-county-alvin-isd-1998-texas-school-survey-of-drug-and-alcohol 115/213
Grade 7 0.9% 1.8% 4.4% 95.6%Grade 8 2.4% 3.9% 5.5% 94.5%Grade 9 2.5% 4.1% 9.0% 91.0%Grade 10 1.1% 1.1% 5.4% 94.6%Grade 11 1.1% 2.3% 4.6% 95.4%Grade 12 * % * % 2.7% 97.3%
_____________________________________________________________________________________Ecstasy All 5.4% 7.3% 10.5% 89.5%
Grade 7 1.8% 1.8% 2.7% 97.3%Grade 8 9.9% 10.7% 12.4% 87.6%Grade 9 4.1% 4.9% 8.1% 91.9%Grade 10 6.5% 11.8% 15.1% 84.9%Grade 11 3.5% 5.9% 14.1% 85.9%Grade 12 5.6% 8.3% 11.1% 88.9%
_____________________________________________________________________________________Heroin All 2.6% 3.7% 6.0% 94.0%
Grade 7 3.5% 3.5% 6.2% 93.8%Grade 8 3.3% 5.0% 8.3% 91.7%Grade 9 5.0% 5.9% 10.1% 89.9%Grade 10 1.1% 2.2% 4.3% 95.7%Grade 11 1.2% 1.2% 1.2% 98.8%Grade 12 * % 2.8% 2.8% 97.2%
AlvinSpring 1998
Table B13: Prevalence and recency of use of selected substances by grade> St d t li i i t th l

8/14/2019 BRAZORIA COUNTY - Alvin ISD - 1998 Texas School Survey of Drug and Alcohol Use
http://slidepdf.com/reader/full/brazoria-county-alvin-isd-1998-texas-school-survey-of-drug-and-alcohol 116/213
--> Students living in town three years or less
Past School Ever NeverMonth Year Used Used
_____________________________________________________________________________________Tobacco All 32.6% 41.7% 62.3% 37.7%
Grade 7 25.4% 31.8% 50.2% 49.8%Grade 8 25.9% 38.5% 65.7% 34.3%Grade 9 42.7% 53.7% 72.6% 27.4%Grade 10 35.0% 46.3% 63.4% 36.6%Grade 11 34.6% 40.7% 66.7% 33.3%Grade 12 28.6% 28.6% 42.9% 57.1%
_____________________________________________________________________________________Alcohol All 39.0% 51.2% 72.6% 27.4%
Grade 7 28.4% 38.1% 57.9% 42.1%Grade 8 34.5% 47.2% 73.9% 26.1%Grade 9 46.1% 57.0% 78.8% 21.2%Grade 10 39.5% 54.8% 71.8% 28.2%Grade 11 50.0% 63.8% 82.5% 17.5%Grade 12 38.1% 52.4% 76.2% 23.8%
_____________________________________________________________________________________Inhalants All 12.8% 18.1% 28.5% 71.5%
Grade 7 16.7% 21.7% 33.0% 67.0%Grade 8 13.9% 19.4% 31.2% 68.8%Grade 9 13.1% 18.5% 29.2% 70.8%Grade 10 12.1% 16.1% 24.2% 75.8%Grade 11 8.8% 13.8% 26.3% 73.7%Grade 12 4.8% 14.3% 19.0% 81.0%
_____________________________________________________________________________________
Any Illicit Drug All 22.8% 30.4% 43.4% 56.6%Grade 7 16.0% 19.5% 32.0% 68.0%Grade 8 20.4% 30.3% 42.3% 57.7%Grade 9 30.7% 37.3% 49.4% 50.6%Grade 10 28.0% 36.0% 48.8% 51.2%Grade 11 19.8% 34.6% 51.9% 48.1%Grade 12 14.3% 19.0% 33.3% 66.7%
_____________________________________________________________________________________Marijuana All 20.3% 28.5% 41.0% 59.0%
Grade 7 13.9% 18.0% 28.9% 71.1%Grade 8 17.9% 26.4% 38.6% 61.4%Grade 9 28.2% 35.6% 48.5% 51.5%
Grade 10 26.4% 34.4% 47.2% 52.8%Grade 11 16.3% 32.5% 46.3% 53.8%Grade 12 9.5% 19.0% 33.3% 66.7%
_____________________________________________________________________________________Marijuana Only All 6 5% 10 2% 18 5% 81 5%
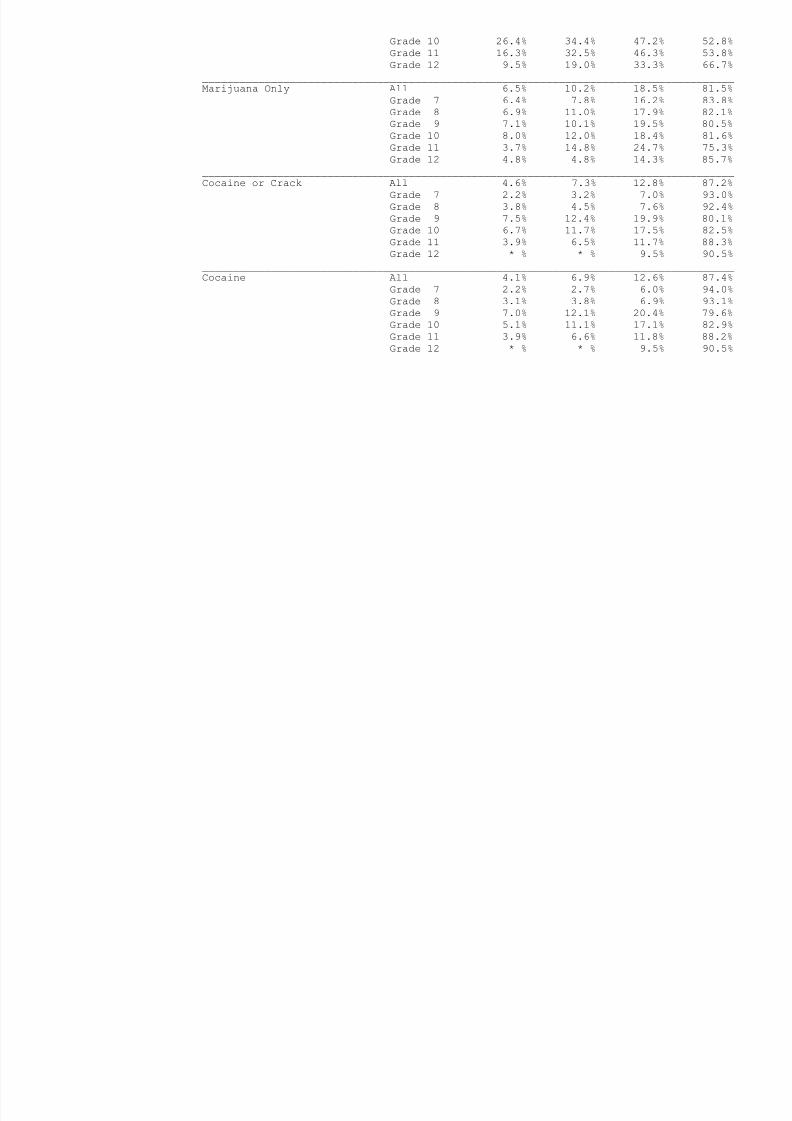
8/14/2019 BRAZORIA COUNTY - Alvin ISD - 1998 Texas School Survey of Drug and Alcohol Use
http://slidepdf.com/reader/full/brazoria-county-alvin-isd-1998-texas-school-survey-of-drug-and-alcohol 117/213
Marijuana Only All 6.5% 10.2% 18.5% 81.5%Grade 7 6.4% 7.8% 16.2% 83.8%Grade 8 6.9% 11.0% 17.9% 82.1%Grade 9 7.1% 10.1% 19.5% 80.5%Grade 10 8.0% 12.0% 18.4% 81.6%Grade 11 3.7% 14.8% 24.7% 75.3%
Grade 12 4.8% 4.8% 14.3% 85.7%_____________________________________________________________________________________Cocaine or Crack All 4.6% 7.3% 12.8% 87.2%
Grade 7 2.2% 3.2% 7.0% 93.0%Grade 8 3.8% 4.5% 7.6% 92.4%Grade 9 7.5% 12.4% 19.9% 80.1%Grade 10 6.7% 11.7% 17.5% 82.5%Grade 11 3.9% 6.5% 11.7% 88.3%Grade 12 * % * % 9.5% 90.5%
_____________________________________________________________________________________Cocaine All 4.1% 6.9% 12.6% 87.4%
Grade 7 2.2% 2.7% 6.0% 94.0%Grade 8 3.1% 3.8% 6.9% 93.1%Grade 9 7.0% 12.1% 20.4% 79.6%Grade 10 5.1% 11.1% 17.1% 82.9%Grade 11 3.9% 6.6% 11.8% 88.2%Grade 12 * % * % 9.5% 90.5%
AlvinSpring 1998
Table B13 continued from previous page
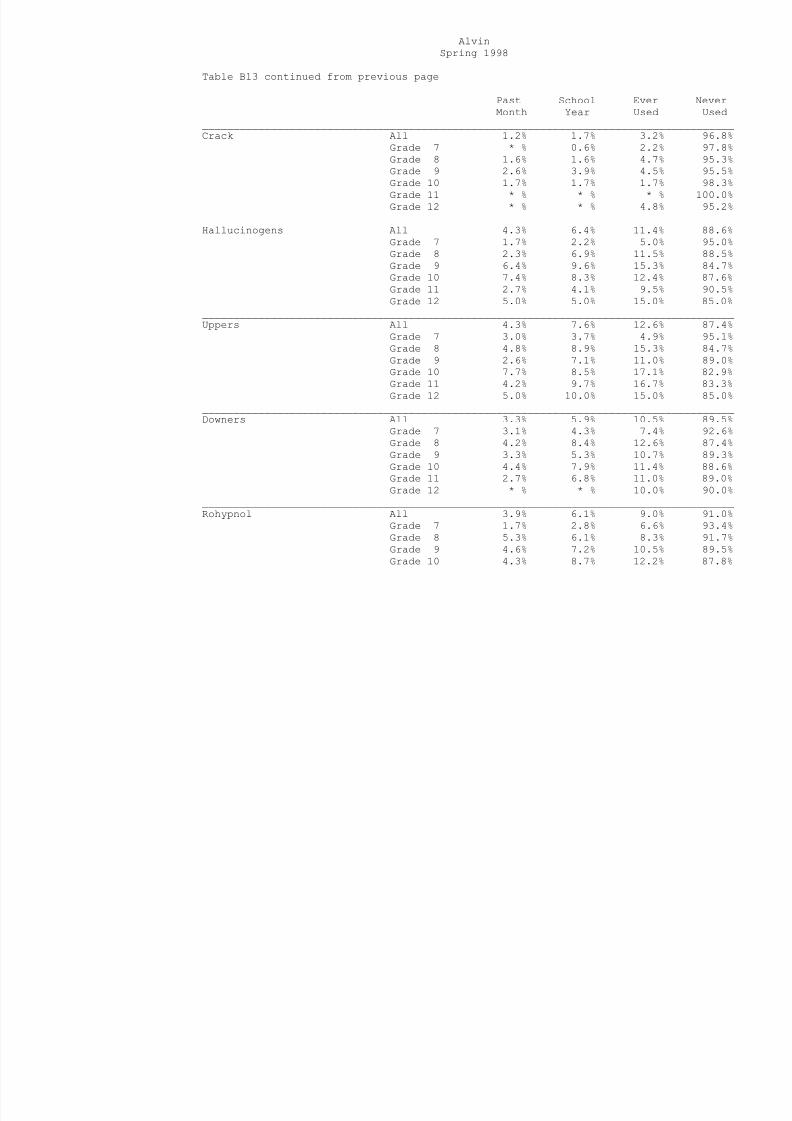
8/14/2019 BRAZORIA COUNTY - Alvin ISD - 1998 Texas School Survey of Drug and Alcohol Use
http://slidepdf.com/reader/full/brazoria-county-alvin-isd-1998-texas-school-survey-of-drug-and-alcohol 118/213
Past School Ever NeverMonth Year Used Used
_____________________________________________________________________________________Crack All 1.2% 1.7% 3.2% 96.8%
Grade 7 * % 0.6% 2.2% 97.8%
Grade 8 1.6% 1.6% 4.7% 95.3%Grade 9 2.6% 3.9% 4.5% 95.5%Grade 10 1.7% 1.7% 1.7% 98.3%Grade 11 * % * % * % 100.0%Grade 12 * % * % 4.8% 95.2%
_____________________________________________________________________________________Hallucinogens All 4.3% 6.4% 11.4% 88.6%
Grade 7 1.7% 2.2% 5.0% 95.0%Grade 8 2.3% 6.9% 11.5% 88.5%Grade 9 6.4% 9.6% 15.3% 84.7%Grade 10 7.4% 8.3% 12.4% 87.6%Grade 11 2.7% 4.1% 9.5% 90.5%Grade 12 5.0% 5.0% 15.0% 85.0%
_____________________________________________________________________________________Uppers All 4.3% 7.6% 12.6% 87.4%
Grade 7 3.0% 3.7% 4.9% 95.1%Grade 8 4.8% 8.9% 15.3% 84.7%Grade 9 2.6% 7.1% 11.0% 89.0%Grade 10 7.7% 8.5% 17.1% 82.9%Grade 11 4.2% 9.7% 16.7% 83.3%Grade 12 5.0% 10.0% 15.0% 85.0%
_____________________________________________________________________________________Downers All 3.3% 5.9% 10.5% 89.5%
Grade 7 3.1% 4.3% 7.4% 92.6%Grade 8 4.2% 8.4% 12.6% 87.4%Grade 9 3.3% 5.3% 10.7% 89.3%Grade 10 4.4% 7.9% 11.4% 88.6%Grade 11 2.7% 6.8% 11.0% 89.0%Grade 12 * % * % 10.0% 90.0%
_____________________________________________________________________________________Rohypnol All 3.9% 6.1% 9.0% 91.0%
Grade 7 1.7% 2.8% 6.6% 93.4%Grade 8 5.3% 6.1% 8.3% 91.7%Grade 9 4.6% 7.2% 10.5% 89.5%Grade 10 4.3% 8.7% 12.2% 87.8%
Grade 11 2.5% 3.8% 6.3% 93.7%Grade 12 5.0% 10.0% 10.0% 90.0%
_____________________________________________________________________________________Steroids All 0.7% 1.1% 2.1% 97.9%
Grade 7 * % * % 0 6% 99 4%
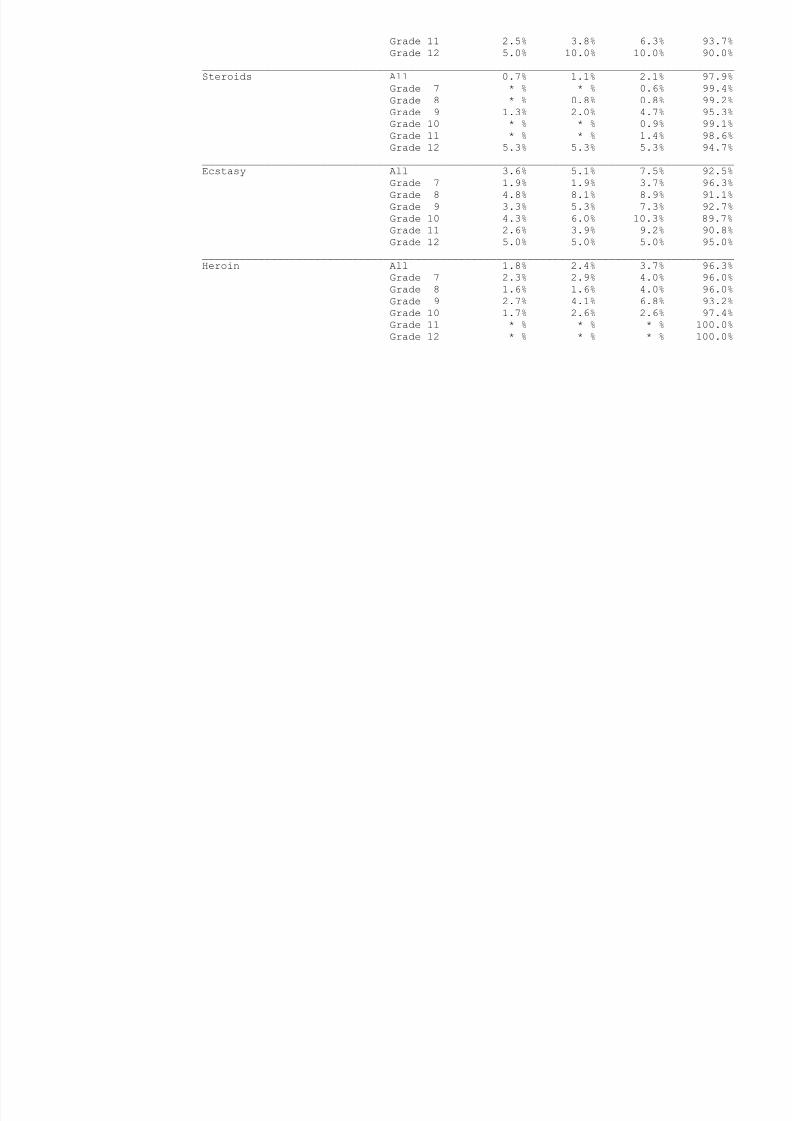
8/14/2019 BRAZORIA COUNTY - Alvin ISD - 1998 Texas School Survey of Drug and Alcohol Use
http://slidepdf.com/reader/full/brazoria-county-alvin-isd-1998-texas-school-survey-of-drug-and-alcohol 119/213
Grade 7 % % 0.6% 99.4%Grade 8 * % 0.8% 0.8% 99.2%Grade 9 1.3% 2.0% 4.7% 95.3%Grade 10 * % * % 0.9% 99.1%Grade 11 * % * % 1.4% 98.6%Grade 12 5.3% 5.3% 5.3% 94.7%
_____________________________________________________________________________________Ecstasy All 3.6% 5.1% 7.5% 92.5%
Grade 7 1.9% 1.9% 3.7% 96.3%Grade 8 4.8% 8.1% 8.9% 91.1%Grade 9 3.3% 5.3% 7.3% 92.7%Grade 10 4.3% 6.0% 10.3% 89.7%Grade 11 2.6% 3.9% 9.2% 90.8%Grade 12 5.0% 5.0% 5.0% 95.0%
_____________________________________________________________________________________Heroin All 1.8% 2.4% 3.7% 96.3%
Grade 7 2.3% 2.9% 4.0% 96.0%Grade 8 1.6% 1.6% 4.0% 96.0%Grade 9 2.7% 4.1% 6.8% 93.2%Grade 10 1.7% 2.6% 2.6% 97.4%Grade 11 * % * % * % 100.0%Grade 12 * % * % * % 100.0%
AlvinSpring 1998
Table B14: Prevalence and recency of use of selected substances by grade--> Students living in town more than three years

8/14/2019 BRAZORIA COUNTY - Alvin ISD - 1998 Texas School Survey of Drug and Alcohol Use
http://slidepdf.com/reader/full/brazoria-county-alvin-isd-1998-texas-school-survey-of-drug-and-alcohol 120/213
> Students living in town more than three years
Past School Ever NeverMonth Year Used Used
_____________________________________________________________________________________Tobacco All 32.7% 41.9% 59.8% 40.2%
Grade 7 15.9% 20.5% 43.2% 56.8%Grade 8 31.4% 41.1% 60.9% 39.1%Grade 9 35.6% 46.6% 60.8% 39.2%Grade 10 34.8% 44.5% 63.0% 37.0%Grade 11 41.2% 50.0% 68.6% 31.4%Grade 12 41.0% 52.5% 65.6% 34.4%
_____________________________________________________________________________________Alcohol All 40.6% 55.4% 75.4% 24.6%
Grade 7 19.4% 28.3% 58.7% 41.3%Grade 8 37.6% 52.9% 74.3% 25.7%Grade 9 44.8% 60.3% 78.1% 21.9%Grade 10 48.4% 64.2% 81.1% 18.9%Grade 11 49.6% 67.0% 81.8% 18.2%Grade 12 47.5% 65.0% 81.7% 18.3%
_____________________________________________________________________________________Inhalants All 9.5% 14.4% 24.0% 76.0%
Grade 7 10.2% 13.1% 21.7% 78.3%Grade 8 14.0% 19.6% 28.5% 71.5%Grade 9 10.9% 18.0% 28.5% 71.5%Grade 10 7.2% 10.6% 21.3% 78.7%Grade 11 4.5% 8.8% 18.8% 81.3%Grade 12 8.1% 13.8% 22.8% 77.2%
_____________________________________________________________________________________
Any Illicit Drug All 19.7% 27.7% 38.3% 61.7%Grade 7 5.5% 7.3% 15.2% 84.8%Grade 8 14.7% 21.7% 30.9% 69.1%Grade 9 23.2% 32.0% 42.1% 57.9%Grade 10 28.0% 38.9% 44.9% 55.1%Grade 11 24.9% 34.3% 51.3% 48.7%Grade 12 24.4% 36.6% 52.0% 48.0%
_____________________________________________________________________________________Marijuana All 17.9% 26.1% 36.9% 63.1%
Grade 7 4.5% 6.1% 13.6% 86.4%Grade 8 12.1% 18.8% 28.3% 71.7%Grade 9 20.8% 30.2% 40.8% 59.2%
Grade 10 26.7% 36.6% 43.3% 56.7%Grade 11 23.1% 32.9% 50.0% 50.0%Grade 12 22.8% 35.8% 51.2% 48.8%
_____________________________________________________________________________________Marijuana Only All 6.6% 11.0% 18.0% 82.0%

8/14/2019 BRAZORIA COUNTY - Alvin ISD - 1998 Texas School Survey of Drug and Alcohol Use
http://slidepdf.com/reader/full/brazoria-county-alvin-isd-1998-texas-school-survey-of-drug-and-alcohol 121/213
Marijuana Only All 6.6% 11.0% 18.0% 82.0%Grade 7 1.9% 2.7% 7.6% 92.4%Grade 8 3.5% 6.9% 12.4% 87.6%Grade 9 8.1% 13.8% 20.9% 79.1%Grade 10 10.3% 17.1% 20.9% 79.1%Grade 11 8.7% 13.2% 25.8% 74.2%
Grade 12 8.1% 13.7% 23.4% 76.6%_____________________________________________________________________________________Cocaine or Crack All 4.5% 7.3% 10.7% 89.3%
Grade 7 1.6% 2.0% 3.4% 96.6%Grade 8 2.8% 4.4% 7.0% 93.0%Grade 9 5.5% 7.9% 11.4% 88.6%Grade 10 7.5% 11.2% 14.0% 86.0%Grade 11 4.3% 8.9% 13.0% 87.0%Grade 12 5.8% 10.8% 18.3% 81.7%
_____________________________________________________________________________________Cocaine All 3.9% 6.8% 10.1% 89.9%
Grade 7 0.9% 1.5% 2.1% 97.9%Grade 8 2.2% 3.8% 6.0% 94.0%Grade 9 4.5% 7.3% 11.1% 88.9%Grade 10 7.1% 10.9% 14.0% 86.0%Grade 11 4.1% 8.5% 12.6% 87.4%Grade 12 5.1% 10.3% 17.1% 82.9%
AlvinSpring 1998
Table B14 continued from previous page

8/14/2019 BRAZORIA COUNTY - Alvin ISD - 1998 Texas School Survey of Drug and Alcohol Use
http://slidepdf.com/reader/full/brazoria-county-alvin-isd-1998-texas-school-survey-of-drug-and-alcohol 122/213
Past School Ever NeverMonth Year Used Used
_____________________________________________________________________________________Crack All 1.3% 1.9% 3.4% 96.6%
Grade 7 1.0% 1.0% 2.1% 97.9%
Grade 8 1.2% 1.7% 3.7% 96.3%Grade 9 2.0% 3.4% 4.3% 95.7%Grade 10 1.3% 2.3% 3.6% 96.4%Grade 11 1.2% 1.8% 3.3% 96.7%Grade 12 0.9% 0.9% 3.5% 96.5%
_____________________________________________________________________________________Hallucinogens All 3.4% 5.9% 9.4% 90.6%
Grade 7 1.0% 1.1% 1.5% 98.5%Grade 8 2.9% 4.5% 7.4% 92.6%Grade 9 2.9% 5.6% 9.7% 90.3%Grade 10 6.4% 9.0% 11.8% 88.2%Grade 11 4.4% 7.9% 13.2% 86.8%Grade 12 3.5% 8.8% 15.0% 85.0%
_____________________________________________________________________________________Uppers All 3.9% 7.0% 10.3% 89.7%
Grade 7 1.2% 1.6% 2.8% 97.2%Grade 8 5.1% 7.1% 9.9% 90.1%Grade 9 3.7% 7.9% 11.0% 89.0%Grade 10 6.3% 10.3% 14.8% 85.2%Grade 11 3.9% 8.6% 15.2% 84.8%Grade 12 3.5% 6.1% 8.8% 91.2%
_____________________________________________________________________________________Downers All 2.8% 4.6% 7.5% 92.5%
Grade 7 0.4% 0.4% 2.2% 97.8%Grade 8 3.8% 5.3% 8.0% 92.0%Grade 9 4.0% 6.7% 9.1% 90.9%Grade 10 3.1% 4.7% 9.0% 91.0%Grade 11 3.0% 6.9% 10.8% 89.2%Grade 12 1.8% 2.7% 5.4% 94.6%
_____________________________________________________________________________________Rohypnol All 2.8% 3.9% 5.9% 94.1%
Grade 7 1.0% 1.2% 2.1% 97.9%Grade 8 2.9% 3.7% 7.1% 92.9%Grade 9 4.0% 5.8% 8.0% 92.0%Grade 10 3.8% 5.4% 7.2% 92.8%
Grade 11 2.1% 3.3% 5.9% 94.1%Grade 12 2.6% 3.5% 3.5% 96.5%
_____________________________________________________________________________________Steroids All 0.8% 1.4% 3.0% 97.0%
Grade 7 0.8% 1.0% 2.2% 97.8%
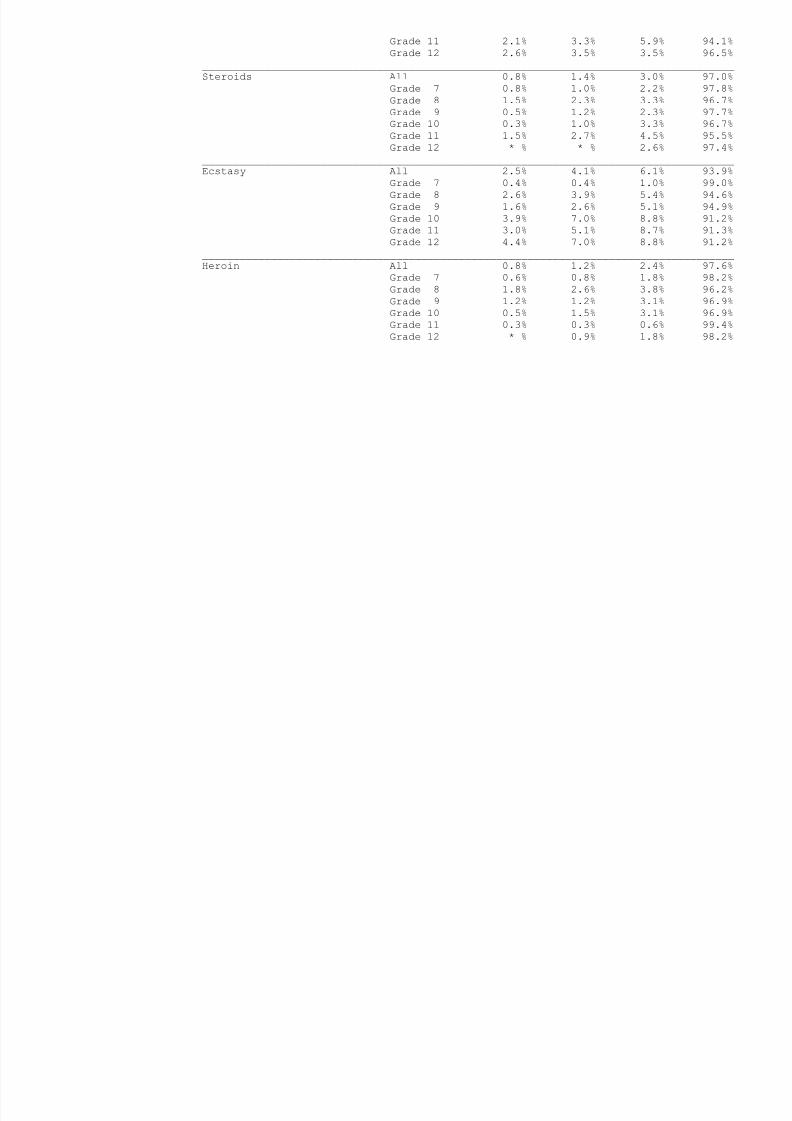
8/14/2019 BRAZORIA COUNTY - Alvin ISD - 1998 Texas School Survey of Drug and Alcohol Use
http://slidepdf.com/reader/full/brazoria-county-alvin-isd-1998-texas-school-survey-of-drug-and-alcohol 123/213
Grade 8 1.5% 2.3% 3.3% 96.7%Grade 9 0.5% 1.2% 2.3% 97.7%Grade 10 0.3% 1.0% 3.3% 96.7%Grade 11 1.5% 2.7% 4.5% 95.5%Grade 12 * % * % 2.6% 97.4%
_____________________________________________________________________________________Ecstasy All 2.5% 4.1% 6.1% 93.9%
Grade 7 0.4% 0.4% 1.0% 99.0%Grade 8 2.6% 3.9% 5.4% 94.6%Grade 9 1.6% 2.6% 5.1% 94.9%Grade 10 3.9% 7.0% 8.8% 91.2%Grade 11 3.0% 5.1% 8.7% 91.3%Grade 12 4.4% 7.0% 8.8% 91.2%
_____________________________________________________________________________________Heroin All 0.8% 1.2% 2.4% 97.6%
Grade 7 0.6% 0.8% 1.8% 98.2%Grade 8 1.8% 2.6% 3.8% 96.2%Grade 9 1.2% 1.2% 3.1% 96.9%Grade 10 0.5% 1.5% 3.1% 96.9%Grade 11 0.3% 0.3% 0.6% 99.4%Grade 12 * % 0.9% 1.8% 98.2%
AlvinSpring 1998
GENDER
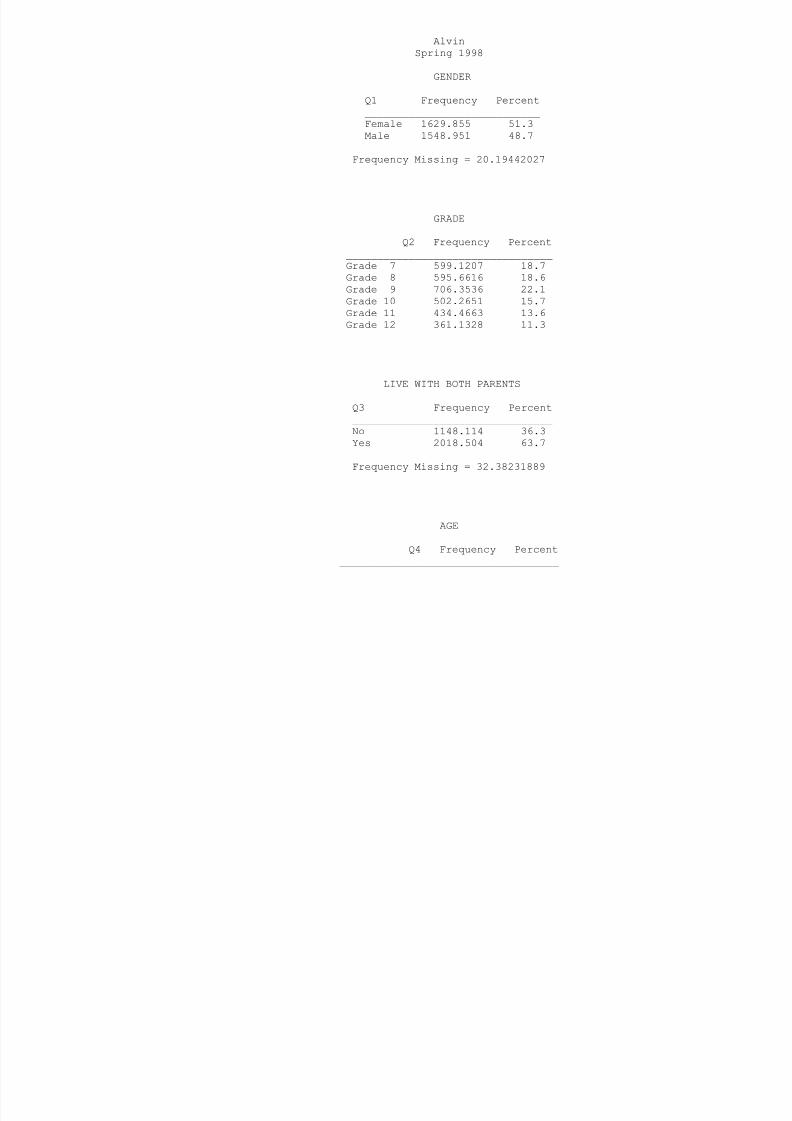
8/14/2019 BRAZORIA COUNTY - Alvin ISD - 1998 Texas School Survey of Drug and Alcohol Use
http://slidepdf.com/reader/full/brazoria-county-alvin-isd-1998-texas-school-survey-of-drug-and-alcohol 124/213
Q1 Frequency Percent____________________________Female 1629.855 51.3Male 1548.951 48.7
Frequency Missing = 20.19442027
GRADE
Q2 Frequency Percent_________________________________Grade 7 599.1207 18.7Grade 8 595.6616 18.6Grade 9 706.3536 22.1Grade 10 502.2651 15.7Grade 11 434.4663 13.6Grade 12 361.1328 11.3
LIVE WITH BOTH PARENTS
Q3 Frequency Percent________________________________
No 1148.114 36.3Yes 2018.504 63.7
Frequency Missing = 32.38231889
AGE
Q4 Frequency Percent___________________________________
11 or younger 25.97538 0.812 187.9161 5.913 495.0223 15.514 592.1804 18.615 609.0504 19.1
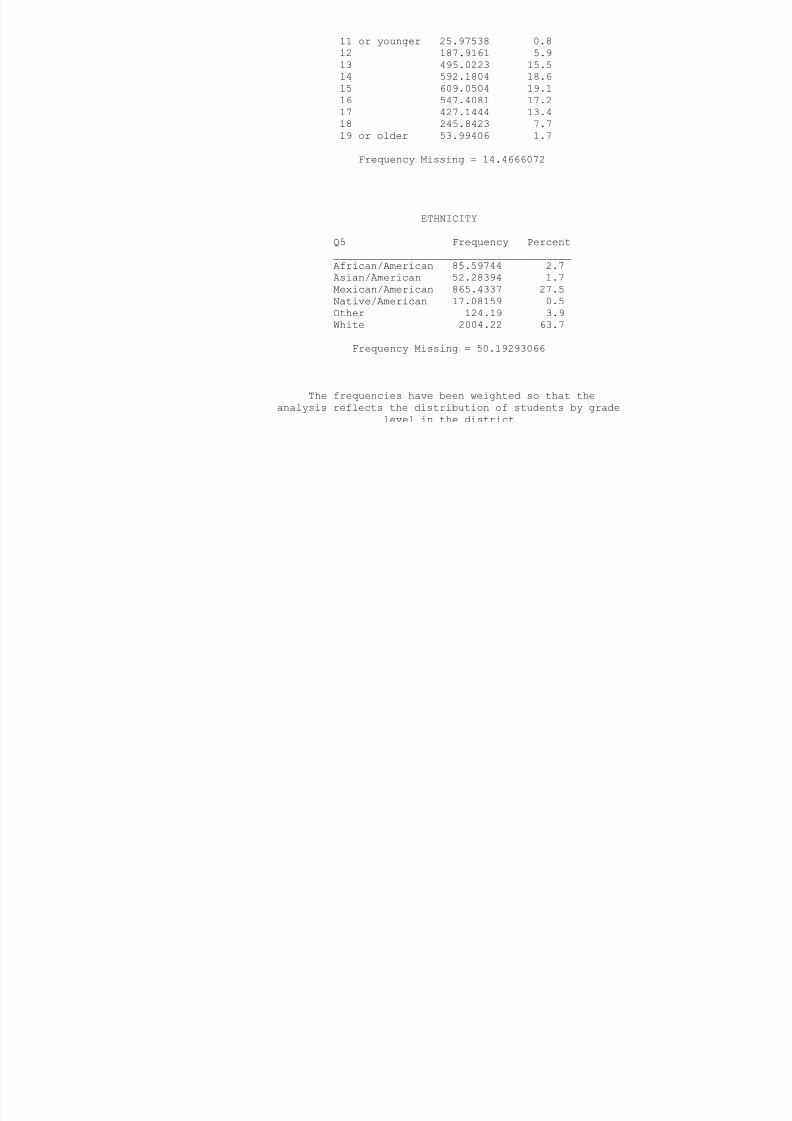
8/14/2019 BRAZORIA COUNTY - Alvin ISD - 1998 Texas School Survey of Drug and Alcohol Use
http://slidepdf.com/reader/full/brazoria-county-alvin-isd-1998-texas-school-survey-of-drug-and-alcohol 125/213
16 547.4081 17.217 427.1444 13.418 245.8423 7.719 or older 53.99406 1.7
Frequency Missing = 14.4666072
ETHNICITY
Q5 Frequency Percent______________________________________African/American 85.59744 2.7Asian/American 52.28394 1.7Mexican/American 865.4337 27.5Native/American 17.08159 0.5Other 124.19 3.9White 2004.22 63.7
Frequency Missing = 50.19293066
The frequencies have been weighted so that the
analysis reflects the distribution of students by gradelevel in the district
AlvinSpring 1998
ON AVERAGE WHAT GRADESDO YOU GET
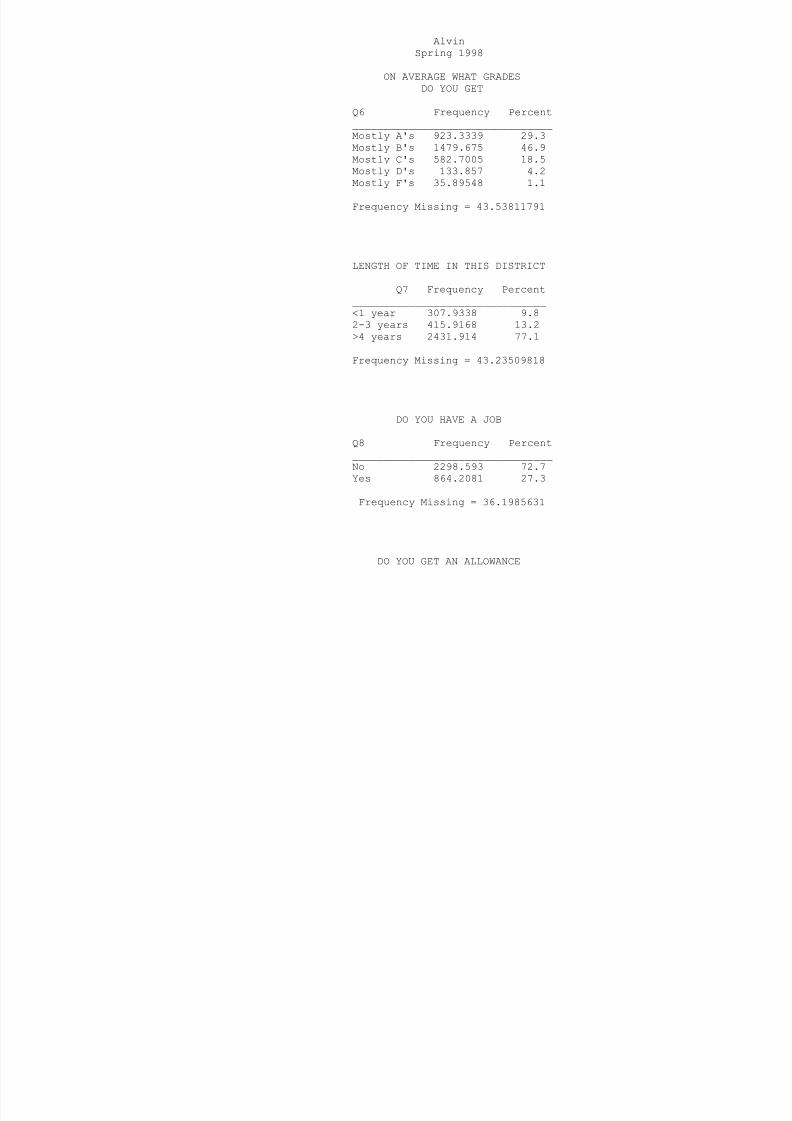
8/14/2019 BRAZORIA COUNTY - Alvin ISD - 1998 Texas School Survey of Drug and Alcohol Use
http://slidepdf.com/reader/full/brazoria-county-alvin-isd-1998-texas-school-survey-of-drug-and-alcohol 126/213
Q6 Frequency Percent________________________________Mostly A's 923.3339 29.3Mostly B's 1479.675 46.9
Mostly C's 582.7005 18.5Mostly D's 133.857 4.2Mostly F's 35.89548 1.1
Frequency Missing = 43.53811791
LENGTH OF TIME IN THIS DISTRICT
Q7 Frequency Percent_______________________________<1 year 307.9338 9.82-3 years 415.9168 13.2>4 years 2431.914 77.1
Frequency Missing = 43.23509818
DO YOU HAVE A JOB
Q8 Frequency Percent________________________________No 2298.593 72.7Yes 864.2081 27.3
Frequency Missing = 36.1985631
DO YOU GET AN ALLOWANCE
Q9 Frequency Percent________________________________No 1937.55 61.6Yes 1208.964 38.4
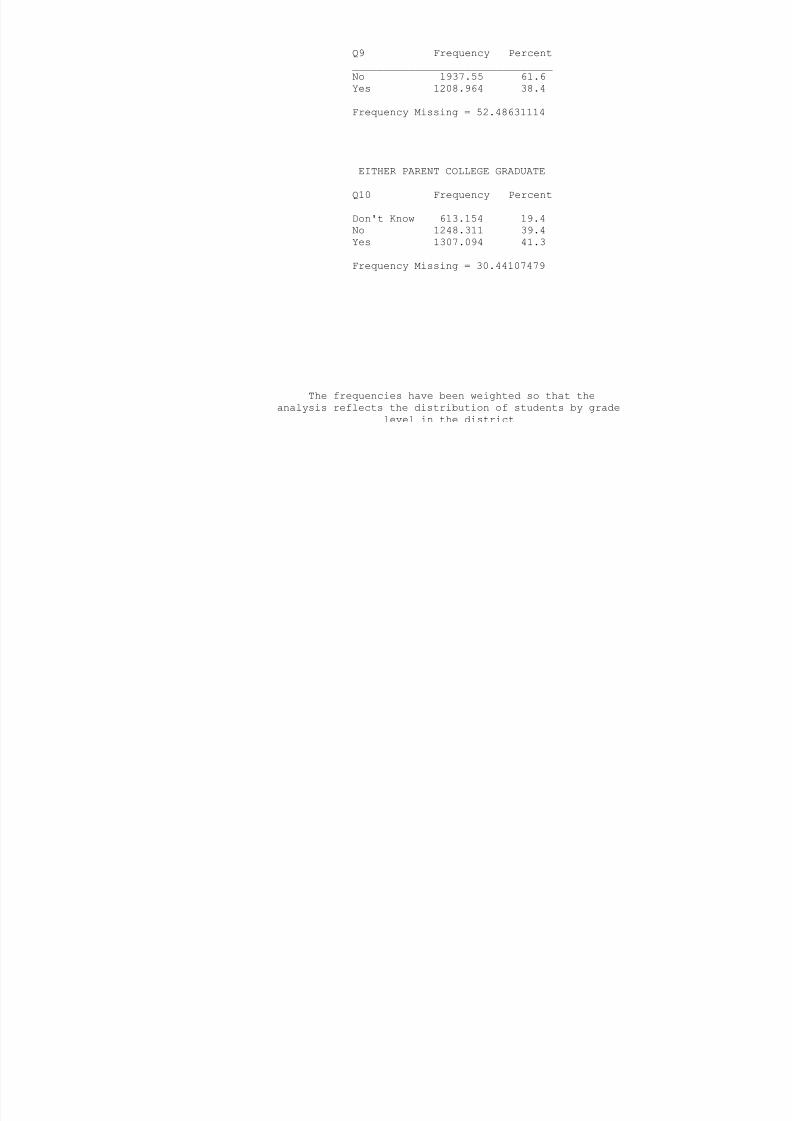
8/14/2019 BRAZORIA COUNTY - Alvin ISD - 1998 Texas School Survey of Drug and Alcohol Use
http://slidepdf.com/reader/full/brazoria-county-alvin-isd-1998-texas-school-survey-of-drug-and-alcohol 127/213
Frequency Missing = 52.48631114
EITHER PARENT COLLEGE GRADUATE
Q10 Frequency Percent________________________________Don't Know 613.154 19.4No 1248.311 39.4Yes 1307.094 41.3
Frequency Missing = 30.44107479
The frequencies have been weighted so that theanalysis reflects the distribution of students by grade
level in the district
AlvinSpring 1998
QUALIFY FOR FREE/REDUCEDPRICE LUNCH
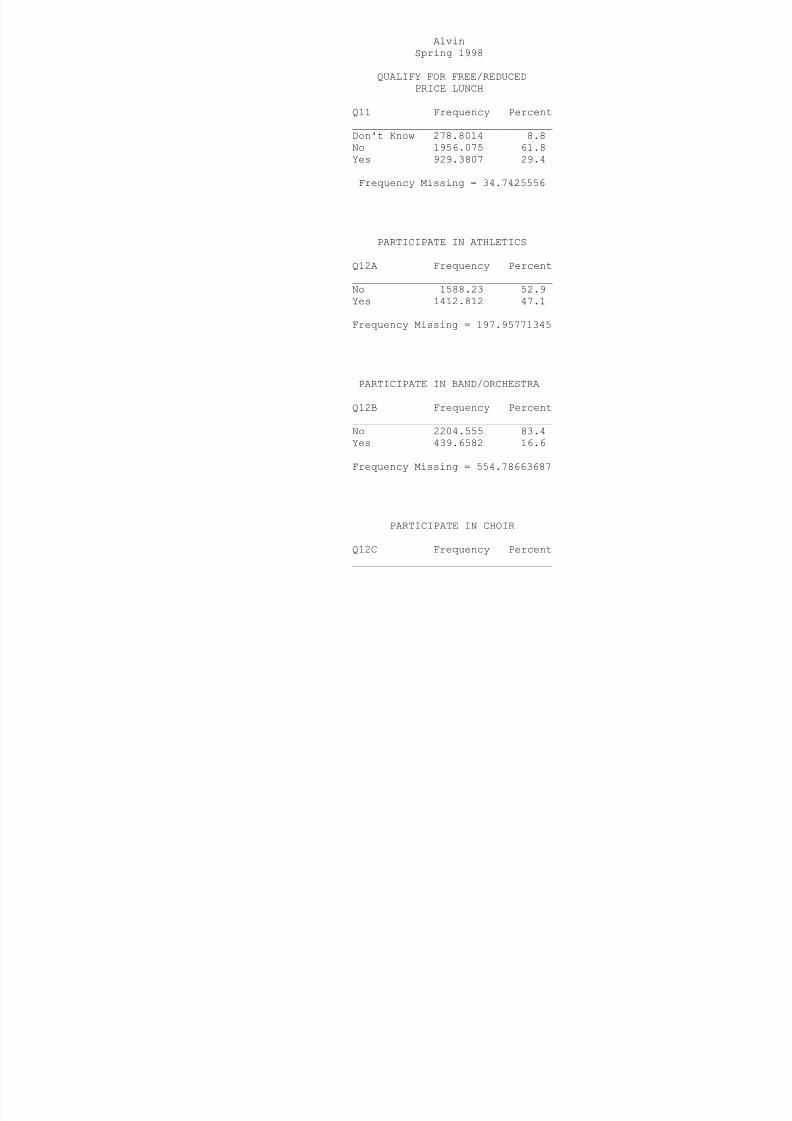
8/14/2019 BRAZORIA COUNTY - Alvin ISD - 1998 Texas School Survey of Drug and Alcohol Use
http://slidepdf.com/reader/full/brazoria-county-alvin-isd-1998-texas-school-survey-of-drug-and-alcohol 128/213
Q11 Frequency Percent________________________________Don't Know 278.8014 8.8No 1956.075 61.8
Yes 929.3807 29.4
Frequency Missing = 34.7425556
PARTICIPATE IN ATHLETICS
Q12A Frequency Percent________________________________No 1588.23 52.9
Yes 1412.812 47.1
Frequency Missing = 197.95771345
PARTICIPATE IN BAND/ORCHESTRA
Q12B Frequency Percent________________________________
No 2204.555 83.4Yes 439.6582 16.6
Frequency Missing = 554.78663687
PARTICIPATE IN CHOIR
Q12C Frequency Percent________________________________
No 2278.798 86.5Yes 357.0486 13.5
Frequency Missing = 563.15301155
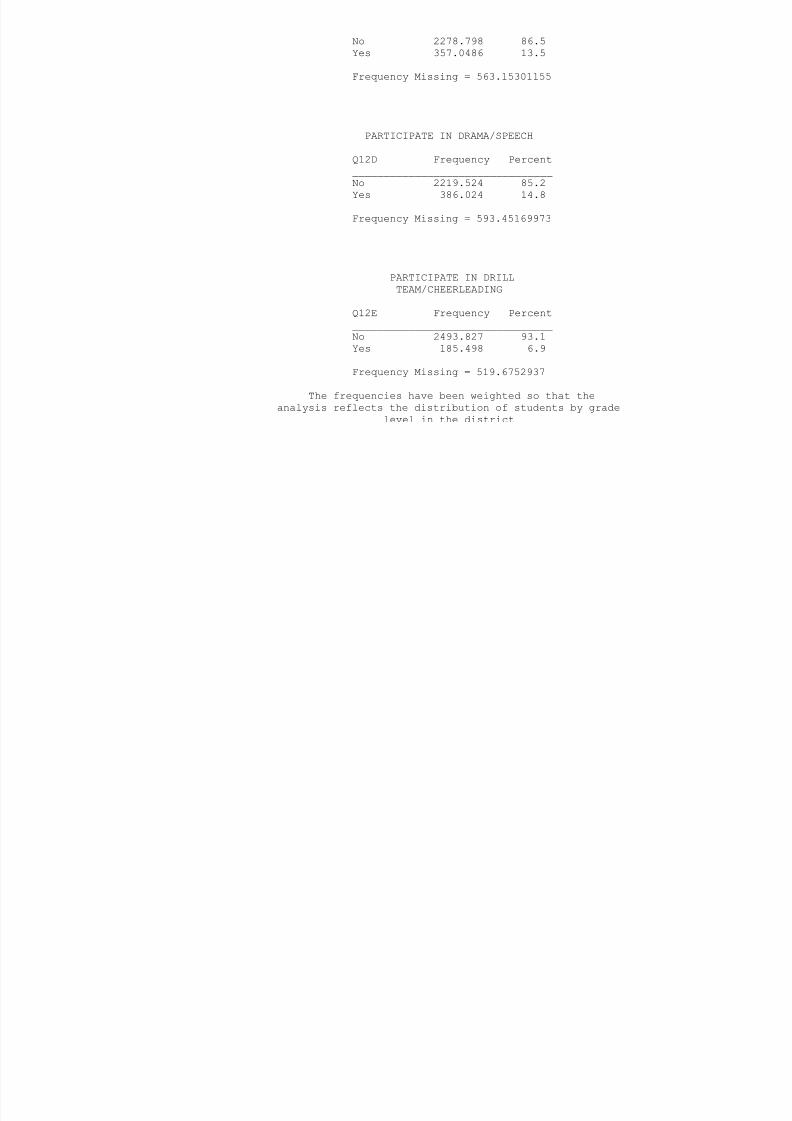
8/14/2019 BRAZORIA COUNTY - Alvin ISD - 1998 Texas School Survey of Drug and Alcohol Use
http://slidepdf.com/reader/full/brazoria-county-alvin-isd-1998-texas-school-survey-of-drug-and-alcohol 129/213
PARTICIPATE IN DRAMA/SPEECH
Q12D Frequency Percent________________________________No 2219.524 85.2Yes 386.024 14.8
Frequency Missing = 593.45169973
PARTICIPATE IN DRILLTEAM/CHEERLEADING
Q12E Frequency Percent________________________________No 2493.827 93.1Yes 185.498 6.9
Frequency Missing = 519.6752937
The frequencies have been weighted so that theanalysis reflects the distribution of students by grade
level in the district
AlvinSpring 1998
PARTICIPATE IN STUDENTGOVERNMENT
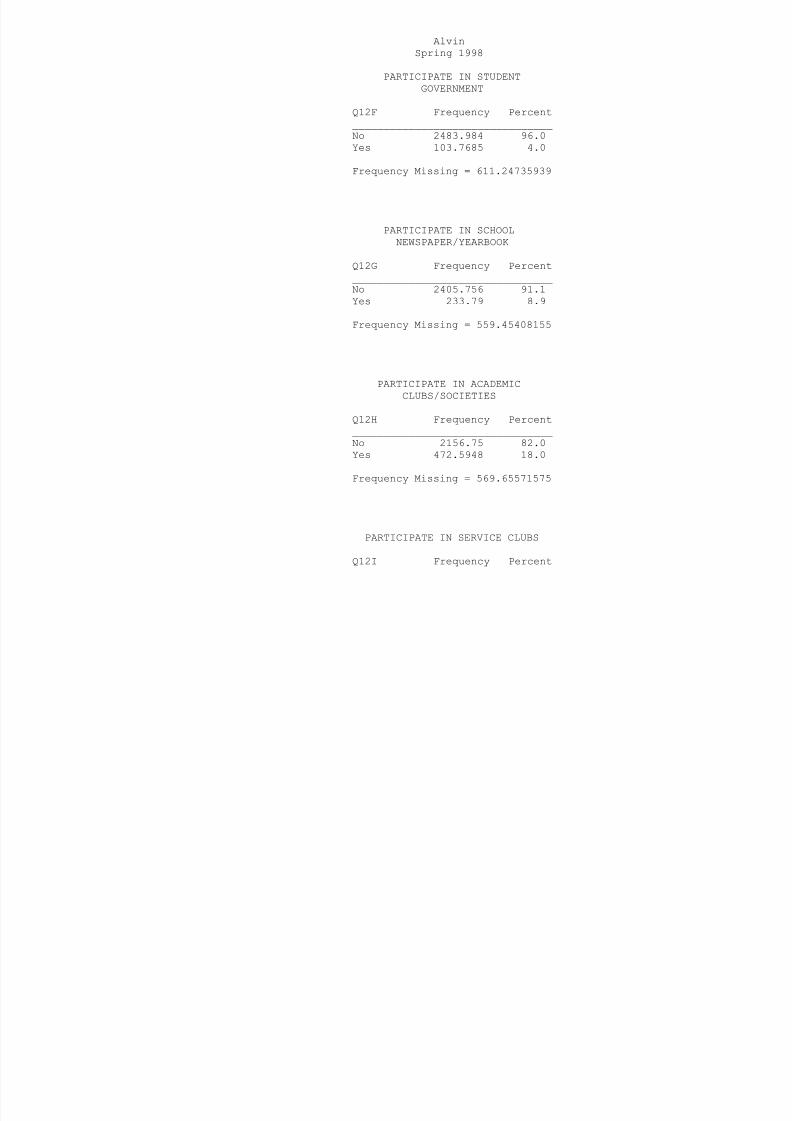
8/14/2019 BRAZORIA COUNTY - Alvin ISD - 1998 Texas School Survey of Drug and Alcohol Use
http://slidepdf.com/reader/full/brazoria-county-alvin-isd-1998-texas-school-survey-of-drug-and-alcohol 130/213
Q12F Frequency Percent________________________________No 2483.984 96.0Yes 103.7685 4.0
Frequency Missing = 611.24735939
PARTICIPATE IN SCHOOLNEWSPAPER/YEARBOOK
Q12G Frequency Percent________________________________No 2405.756 91.1
Yes 233.79 8.9
Frequency Missing = 559.45408155
PARTICIPATE IN ACADEMICCLUBS/SOCIETIES
Q12H Frequency Percent
________________________________No 2156.75 82.0Yes 472.5948 18.0
Frequency Missing = 569.65571575
PARTICIPATE IN SERVICE CLUBS
Q12I Frequency Percent
________________________________No 2377.229 91.5Yes 221.1777 8.5
Frequency Missing = 600.59309769
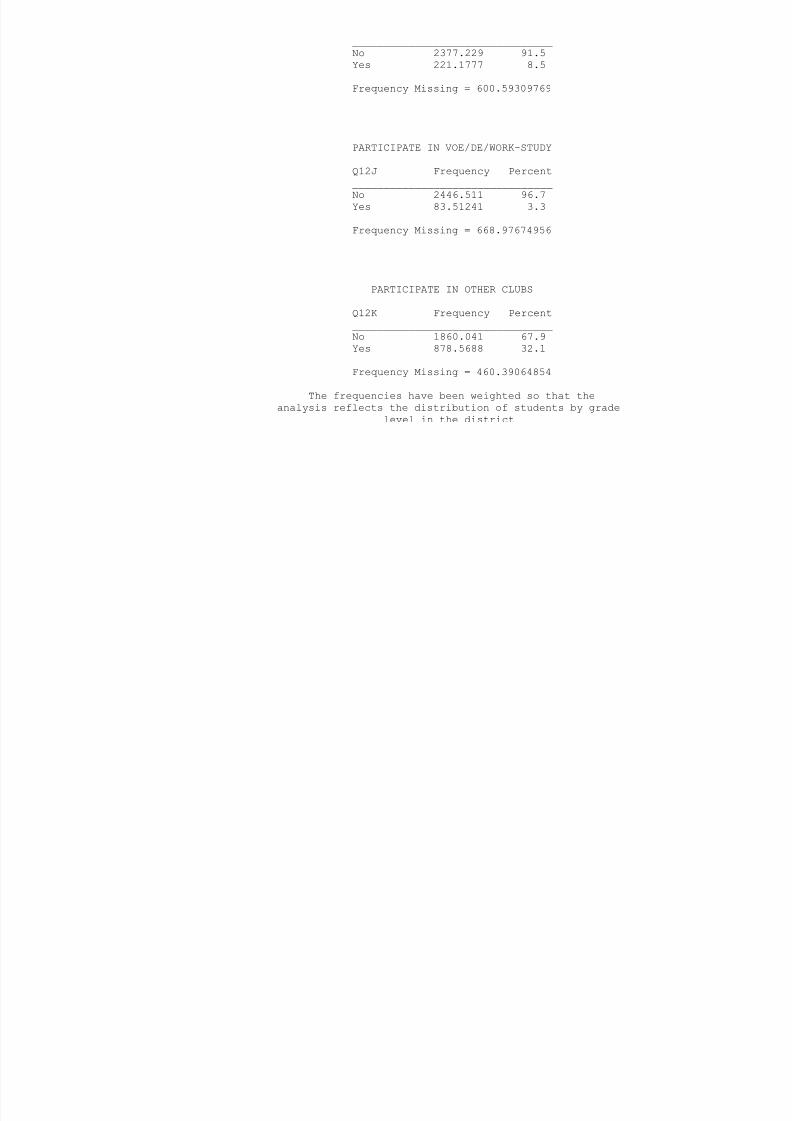
8/14/2019 BRAZORIA COUNTY - Alvin ISD - 1998 Texas School Survey of Drug and Alcohol Use
http://slidepdf.com/reader/full/brazoria-county-alvin-isd-1998-texas-school-survey-of-drug-and-alcohol 131/213
PARTICIPATE IN VOE/DE/WORK-STUDY
Q12J Frequency Percent________________________________No 2446.511 96.7Yes 83.51241 3.3
Frequency Missing = 668.97674956
PARTICIPATE IN OTHER CLUBS
Q12K Frequency Percent________________________________No 1860.041 67.9Yes 878.5688 32.1
Frequency Missing = 460.39064854
The frequencies have been weighted so that theanalysis reflects the distribution of students by grade
level in the district
AlvinSpring 1998
DO YOU FEEL SAFE IN YOUR HOME
Q13A Frequency Percent
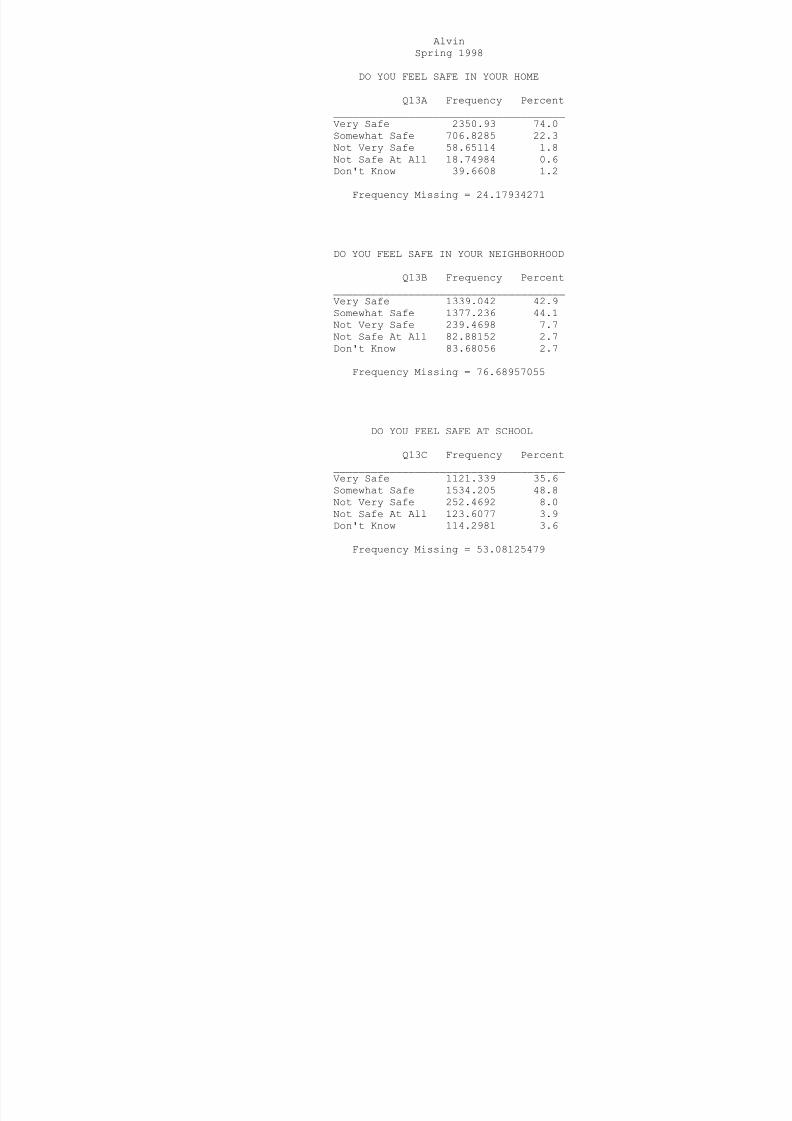
8/14/2019 BRAZORIA COUNTY - Alvin ISD - 1998 Texas School Survey of Drug and Alcohol Use
http://slidepdf.com/reader/full/brazoria-county-alvin-isd-1998-texas-school-survey-of-drug-and-alcohol 132/213
Q13A Frequency Percent_____________________________________Very Safe 2350.93 74.0Somewhat Safe 706.8285 22.3Not Very Safe 58.65114 1.8
Not Safe At All 18.74984 0.6Don't Know 39.6608 1.2
Frequency Missing = 24.17934271
DO YOU FEEL SAFE IN YOUR NEIGHBORHOOD
Q13B Frequency Percent_____________________________________
Very Safe 1339.042 42.9Somewhat Safe 1377.236 44.1Not Very Safe 239.4698 7.7Not Safe At All 82.88152 2.7Don't Know 83.68056 2.7
Frequency Missing = 76.68957055
DO YOU FEEL SAFE AT SCHOOL Q13C Frequency Percent
_____________________________________Very Safe 1121.339 35.6Somewhat Safe 1534.205 48.8Not Very Safe 252.4692 8.0Not Safe At All 123.6077 3.9Don't Know 114.2981 3.6
Frequency Missing = 53.08125479
FRIENDS FEELING CLOSETO THEIR PARENTS

8/14/2019 BRAZORIA COUNTY - Alvin ISD - 1998 Texas School Survey of Drug and Alcohol Use
http://slidepdf.com/reader/full/brazoria-county-alvin-isd-1998-texas-school-survey-of-drug-and-alcohol 133/213
Q14A Frequency Percent___________________________None 186.6152 5.9A Few 933.7908 29.7
Some 894.5616 28.4Most 917.5659 29.2All 212.6161 6.8
Frequency Missing = 53.85032567
The frequencies have been weighted so that theanalysis reflects the distribution of students by grade
level in the district
AlvinSpring 1998
HOW MANY FRIENDSCARRY WEAPONS
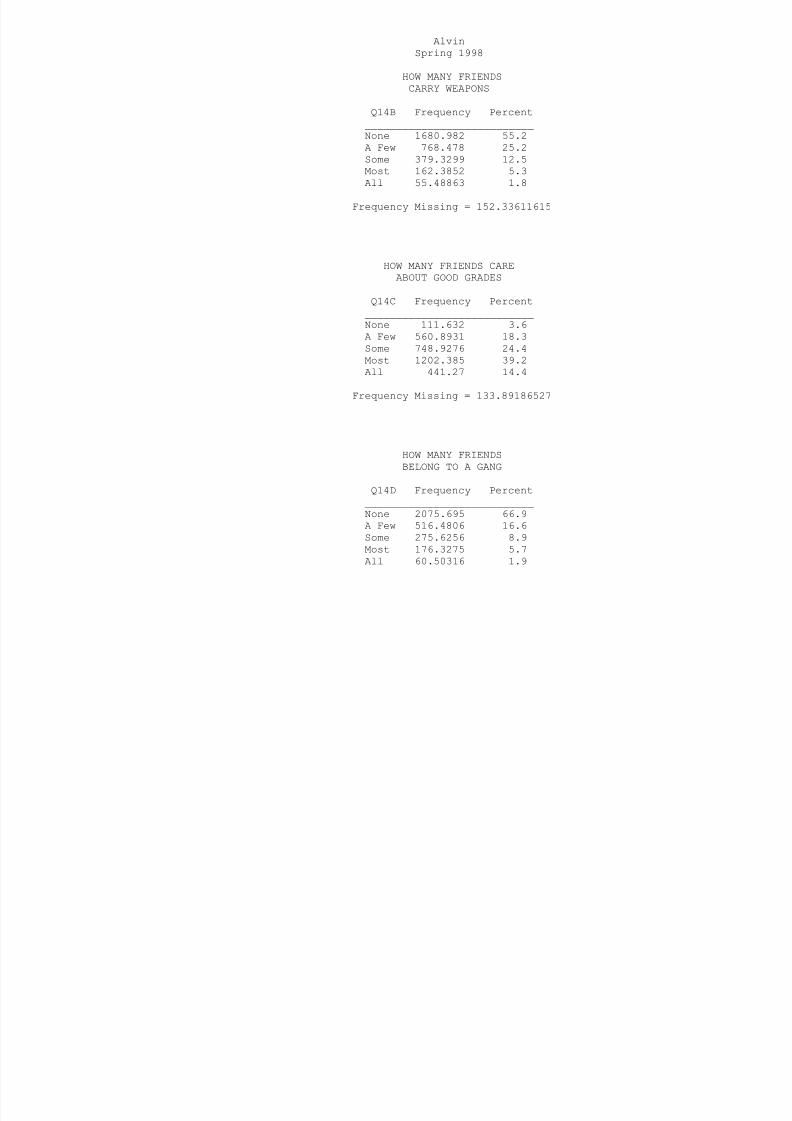
8/14/2019 BRAZORIA COUNTY - Alvin ISD - 1998 Texas School Survey of Drug and Alcohol Use
http://slidepdf.com/reader/full/brazoria-county-alvin-isd-1998-texas-school-survey-of-drug-and-alcohol 134/213
Q14B Frequency Percent___________________________None 1680.982 55.2A Few 768.478 25.2
Some 379.3299 12.5Most 162.3852 5.3All 55.48863 1.8
Frequency Missing = 152.33611615
HOW MANY FRIENDS CAREABOUT GOOD GRADES
Q14C Frequency Percent___________________________None 111.632 3.6A Few 560.8931 18.3Some 748.9276 24.4Most 1202.385 39.2All 441.27 14.4
Frequency Missing = 133.89186527
HOW MANY FRIENDSBELONG TO A GANG
Q14D Frequency Percent___________________________None 2075.695 66.9A Few 516.4806 16.6Some 275.6256 8.9Most 176.3275 5.7All 60.50316 1.9
Frequency Missing = 94.36853234
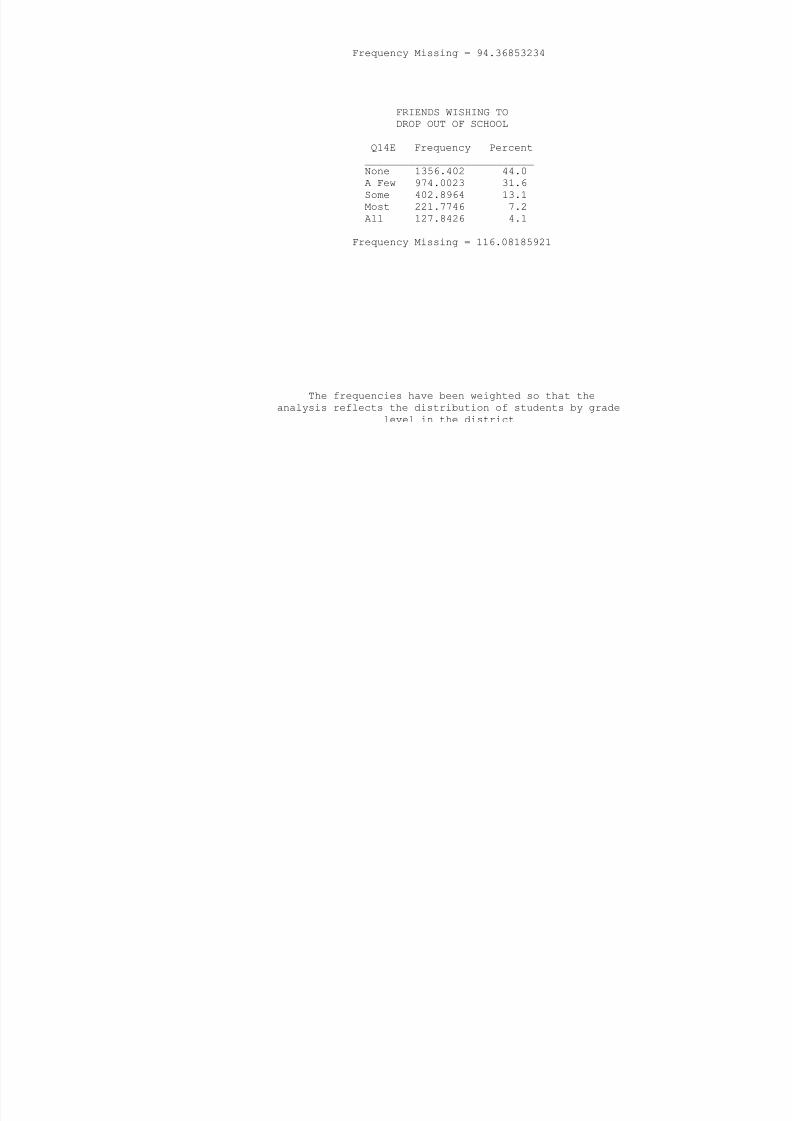
8/14/2019 BRAZORIA COUNTY - Alvin ISD - 1998 Texas School Survey of Drug and Alcohol Use
http://slidepdf.com/reader/full/brazoria-county-alvin-isd-1998-texas-school-survey-of-drug-and-alcohol 135/213
FRIENDS WISHING TODROP OUT OF SCHOOL
Q14E Frequency Percent
___________________________None 1356.402 44.0A Few 974.0023 31.6Some 402.8964 13.1Most 221.7746 7.2All 127.8426 4.1
Frequency Missing = 116.08185921
The frequencies have been weighted so that theanalysis reflects the distribution of students by grade
level in the district
AlvinSpring 1998
PARENTS ATTEND PTA/SCHOOLOPEN HOUSES
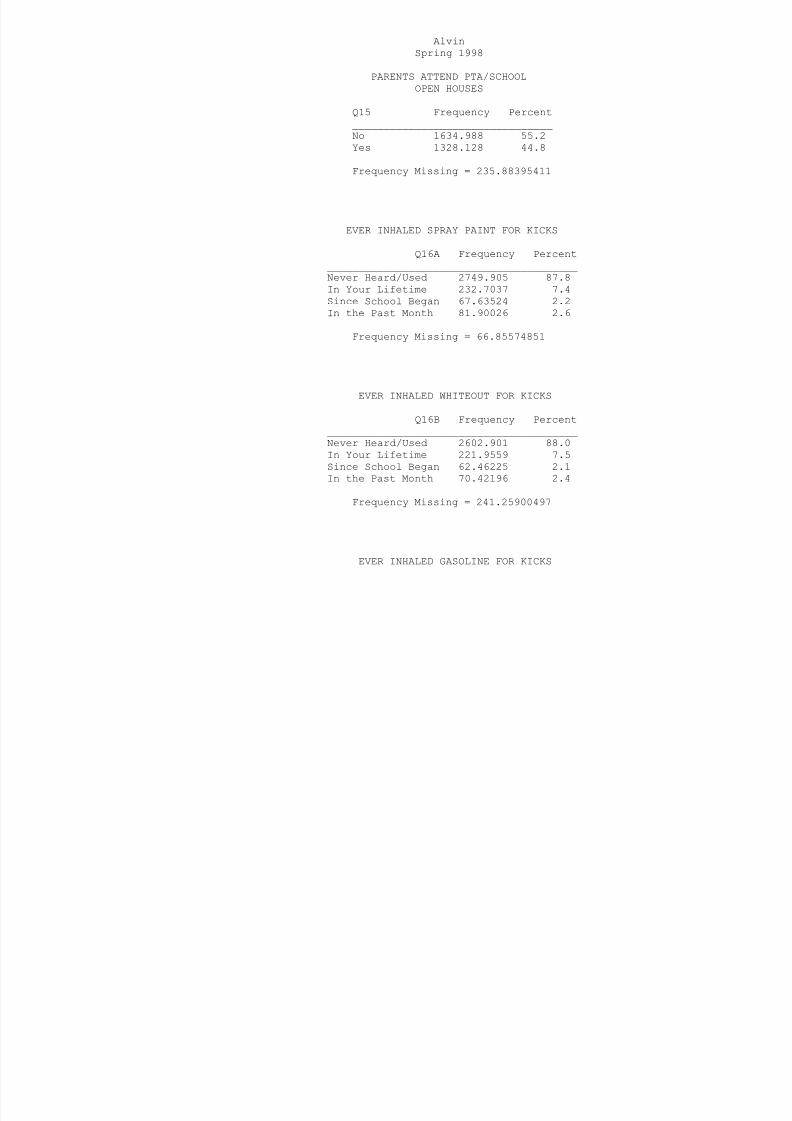
8/14/2019 BRAZORIA COUNTY - Alvin ISD - 1998 Texas School Survey of Drug and Alcohol Use
http://slidepdf.com/reader/full/brazoria-county-alvin-isd-1998-texas-school-survey-of-drug-and-alcohol 136/213
Q15 Frequency Percent________________________________No 1634.988 55.2Yes 1328.128 44.8
Frequency Missing = 235.88395411
EVER INHALED SPRAY PAINT FOR KICKS
Q16A Frequency Percent________________________________________Never Heard/Used 2749.905 87.8In Your Lifetime 232.7037 7.4
Since School Began 67.63524 2.2In the Past Month 81.90026 2.6
Frequency Missing = 66.85574851
EVER INHALED WHITEOUT FOR KICKS
Q16B Frequency Percent________________________________________Never Heard/Used 2602.901 88.0In Your Lifetime 221.9559 7.5Since School Began 62.46225 2.1In the Past Month 70.42196 2.4
Frequency Missing = 241.25900497
EVER INHALED GASOLINE FOR KICKS
Q16C Frequency Percent
________________________________________Never Heard/Used 2720.679 91.7In Your Lifetime 144.6948 4.9Since School Began 42.56335 1.4
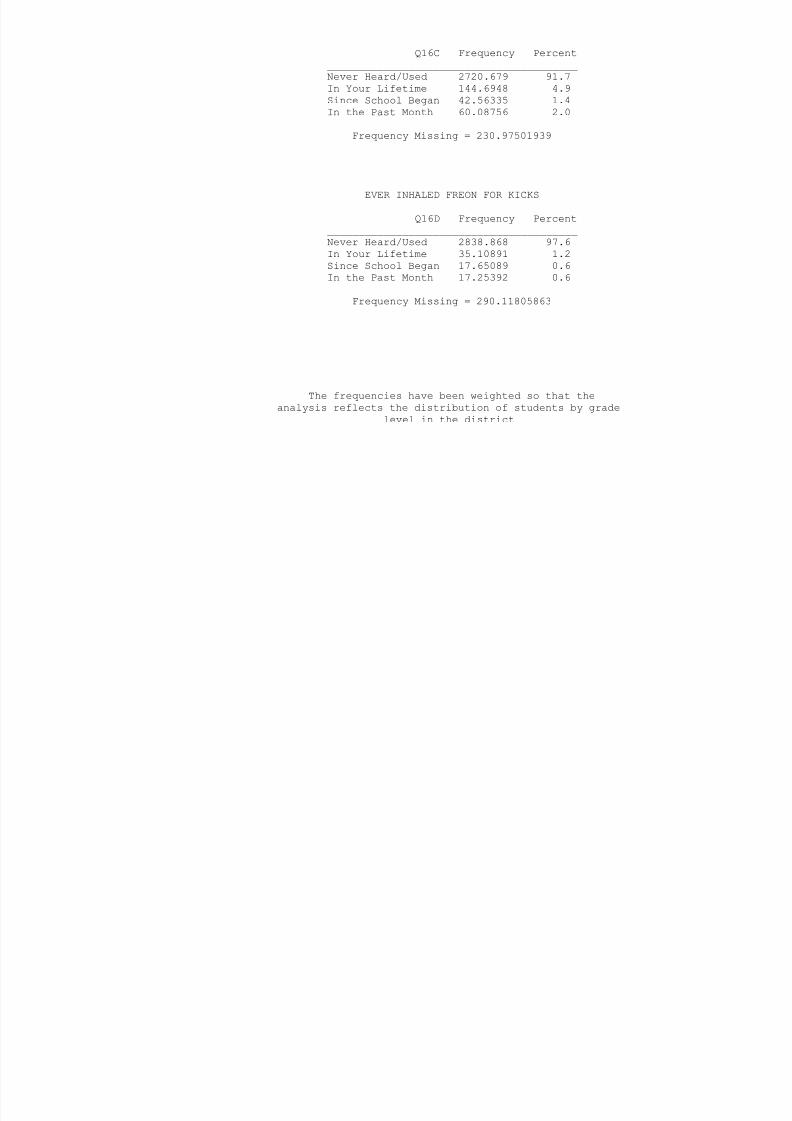
8/14/2019 BRAZORIA COUNTY - Alvin ISD - 1998 Texas School Survey of Drug and Alcohol Use
http://slidepdf.com/reader/full/brazoria-county-alvin-isd-1998-texas-school-survey-of-drug-and-alcohol 137/213
Since School Began 42.56335 1.4In the Past Month 60.08756 2.0
Frequency Missing = 230.97501939
EVER INHALED FREON FOR KICKS
Q16D Frequency Percent________________________________________Never Heard/Used 2838.868 97.6In Your Lifetime 35.10891 1.2Since School Began 17.65089 0.6In the Past Month 17.25392 0.6
Frequency Missing = 290.11805863
The frequencies have been weighted so that theanalysis reflects the distribution of students by grade
level in the district
AlvinSpring 1998
EVER INHALED POPPERS, ETC. FOR KICKS
Q16E Frequency Percent
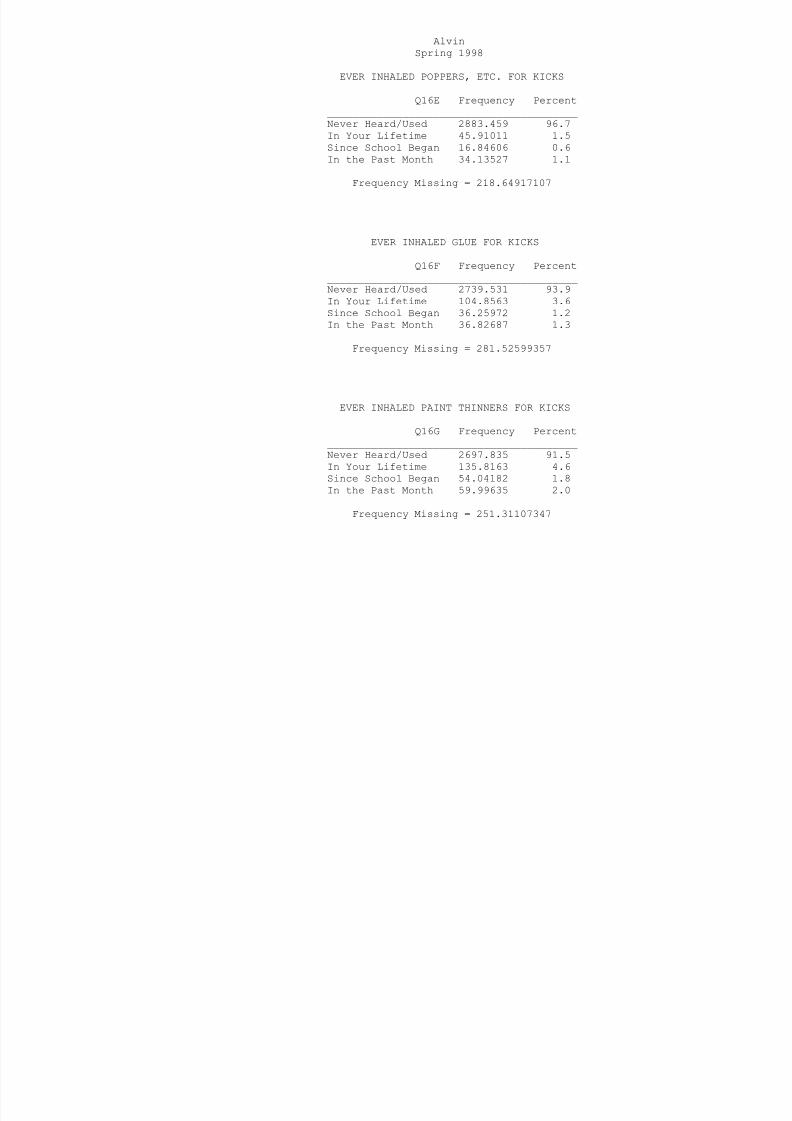
8/14/2019 BRAZORIA COUNTY - Alvin ISD - 1998 Texas School Survey of Drug and Alcohol Use
http://slidepdf.com/reader/full/brazoria-county-alvin-isd-1998-texas-school-survey-of-drug-and-alcohol 138/213
Q q y________________________________________Never Heard/Used 2883.459 96.7In Your Lifetime 45.91011 1.5Since School Began 16.84606 0.6
In the Past Month 34.13527 1.1
Frequency Missing = 218.64917107
EVER INHALED GLUE FOR KICKS
Q16F Frequency Percent________________________________________Never Heard/Used 2739.531 93.9
In Your Lifetime 104.8563 3.6Since School Began 36.25972 1.2In the Past Month 36.82687 1.3
Frequency Missing = 281.52599357
EVER INHALED PAINT THINNERS FOR KICKS
Q16G Frequency Percent________________________________________Never Heard/Used 2697.835 91.5In Your Lifetime 135.8163 4.6Since School Began 54.04182 1.8In the Past Month 59.99635 2.0
Frequency Missing = 251.31107347
EVER INHALED NITROUS OXIDE FOR KICKS
Q16H Frequency Percent________________________________________Never Heard/Used 2677.502 92.1In Your Lifetime 92.3954 3.2
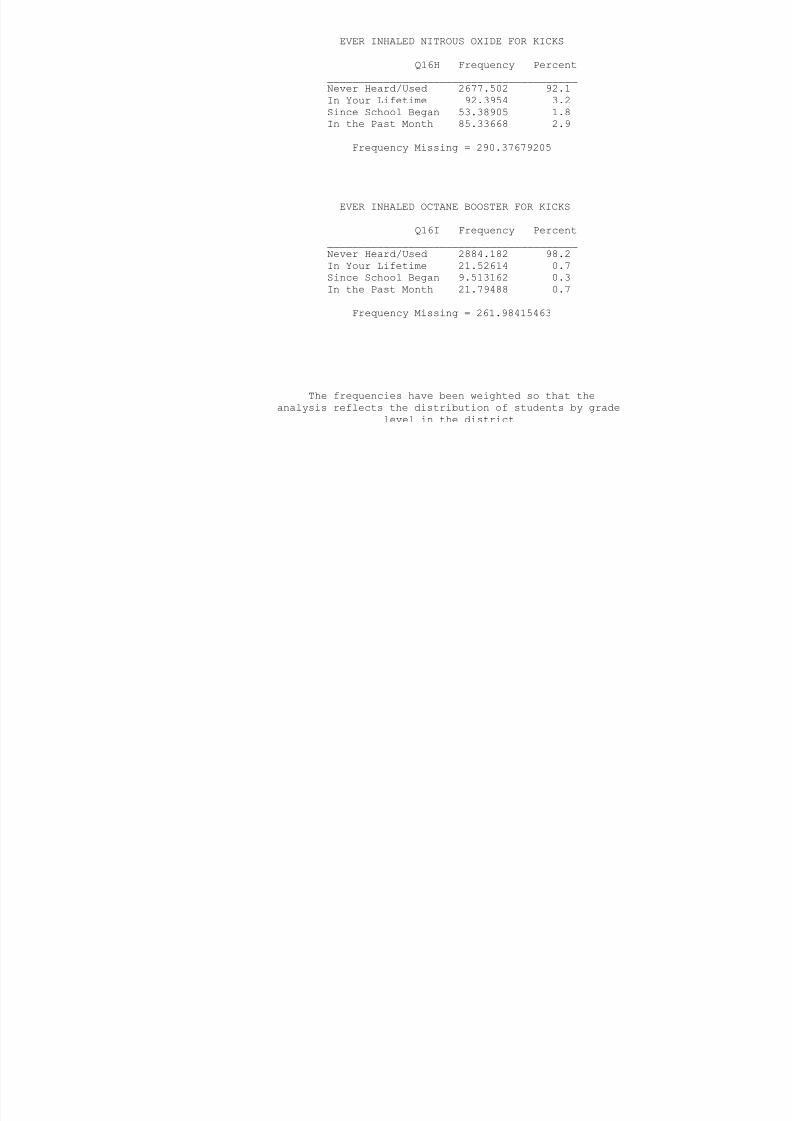
8/14/2019 BRAZORIA COUNTY - Alvin ISD - 1998 Texas School Survey of Drug and Alcohol Use
http://slidepdf.com/reader/full/brazoria-county-alvin-isd-1998-texas-school-survey-of-drug-and-alcohol 139/213
Since School Began 53.38905 1.8In the Past Month 85.33668 2.9
Frequency Missing = 290.37679205
EVER INHALED OCTANE BOOSTER FOR KICKS
Q16I Frequency Percent________________________________________Never Heard/Used 2884.182 98.2In Your Lifetime 21.52614 0.7Since School Began 9.513162 0.3In the Past Month 21.79488 0.7
Frequency Missing = 261.98415463
The frequencies have been weighted so that theanalysis reflects the distribution of students by grade
level in the district
AlvinSpring 1998
EVER INHALED OTHER SPRAYS FOR KICKS
Q16J Frequency Percent
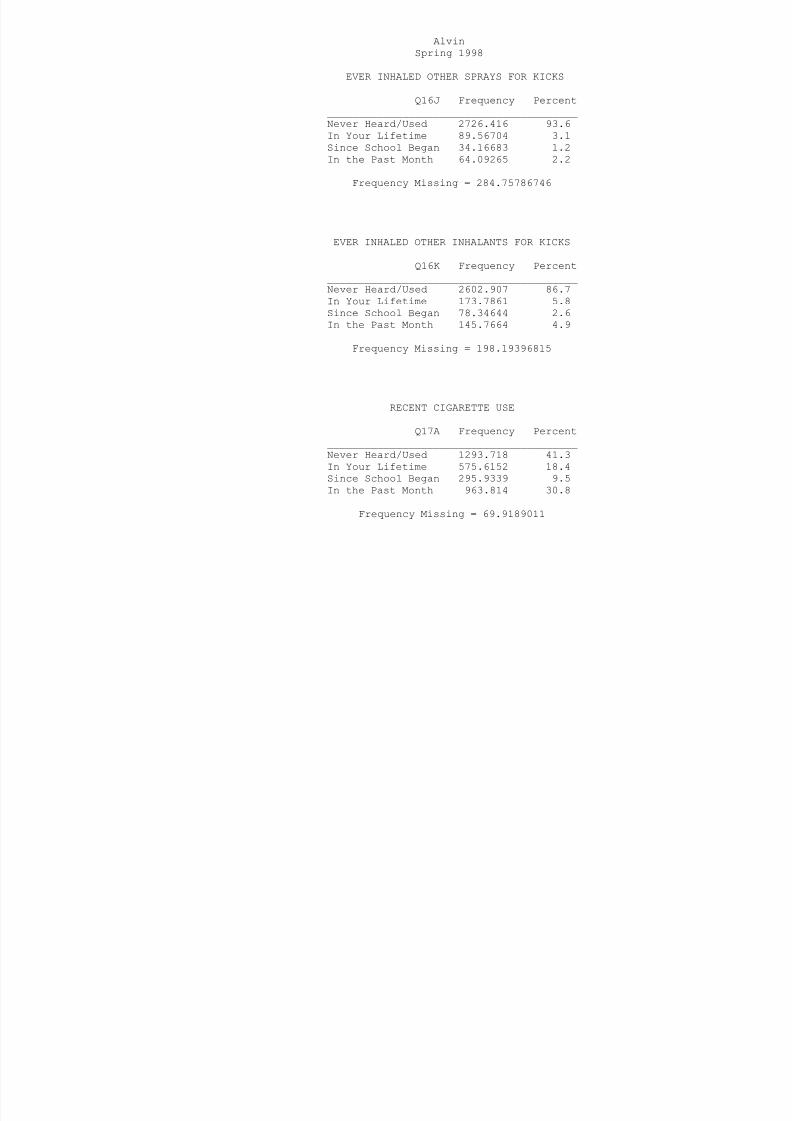
8/14/2019 BRAZORIA COUNTY - Alvin ISD - 1998 Texas School Survey of Drug and Alcohol Use
http://slidepdf.com/reader/full/brazoria-county-alvin-isd-1998-texas-school-survey-of-drug-and-alcohol 140/213
q y________________________________________Never Heard/Used 2726.416 93.6In Your Lifetime 89.56704 3.1Since School Began 34.16683 1.2
In the Past Month 64.09265 2.2
Frequency Missing = 284.75786746
EVER INHALED OTHER INHALANTS FOR KICKS
Q16K Frequency Percent________________________________________Never Heard/Used 2602.907 86.7
In Your Lifetime 173.7861 5.8Since School Began 78.34644 2.6In the Past Month 145.7664 4.9
Frequency Missing = 198.19396815
RECENT CIGARETTE USE
Q17A Frequency Percent________________________________________Never Heard/Used 1293.718 41.3In Your Lifetime 575.6152 18.4Since School Began 295.9339 9.5In the Past Month 963.814 30.8
Frequency Missing = 69.9189011
RECENT SMOKELESS TOBACCO USE
Q17B Frequency Percent________________________________________Never Heard/Used 2457.582 81.2In Your Lifetime 255.1744 8.4
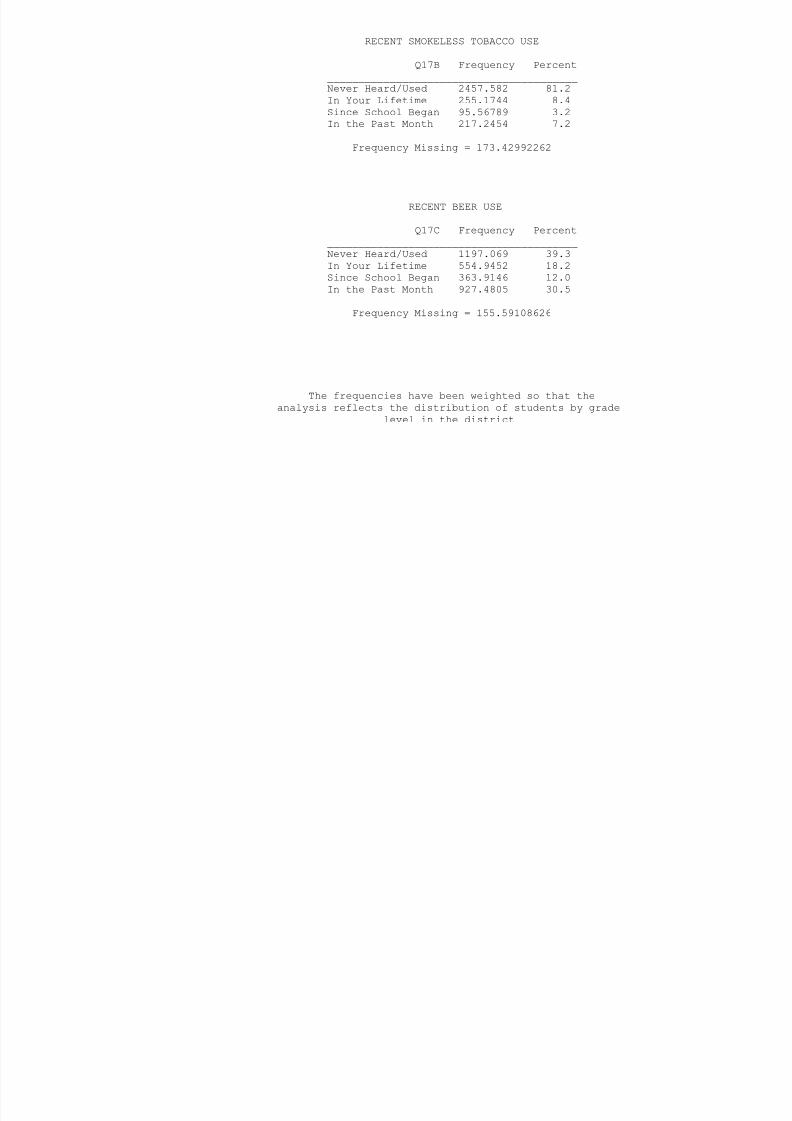
8/14/2019 BRAZORIA COUNTY - Alvin ISD - 1998 Texas School Survey of Drug and Alcohol Use
http://slidepdf.com/reader/full/brazoria-county-alvin-isd-1998-texas-school-survey-of-drug-and-alcohol 141/213
Since School Began 95.56789 3.2In the Past Month 217.2454 7.2
Frequency Missing = 173.42992262
RECENT BEER USE
Q17C Frequency Percent________________________________________Never Heard/Used 1197.069 39.3In Your Lifetime 554.9452 18.2Since School Began 363.9146 12.0In the Past Month 927.4805 30.5
Frequency Missing = 155.59108626
The frequencies have been weighted so that theanalysis reflects the distribution of students by grade
level in the district
AlvinSpring 1998
RECENT WINE COOLER USE
Q17D Frequency Percent

8/14/2019 BRAZORIA COUNTY - Alvin ISD - 1998 Texas School Survey of Drug and Alcohol Use
http://slidepdf.com/reader/full/brazoria-county-alvin-isd-1998-texas-school-survey-of-drug-and-alcohol 142/213
________________________________________Never Heard/Used 1095.107 36.4In Your Lifetime 642.4893 21.3Since School Began 431.591 14.3
In the Past Month 840.5899 27.9
Frequency Missing = 189.22335318
RECENT WINE USE
Q17E Frequency Percent________________________________________Never Heard/Used 1410.758 47.2
In Your Lifetime 627.7731 21.0Since School Began 389.6623 13.0In the Past Month 562.1169 18.8
Frequency Missing = 208.69022901
RECENT LIQUOR USE
Q17F Frequency Percent________________________________________Never Heard/Used 1275.68 42.6In Your Lifetime 466.247 15.6Since School Began 377.9613 12.6In the Past Month 872.8314 29.2
Frequency Missing = 206.28011484
RECENT MARIJUANA USE
Q18A Frequency Percent________________________________________Never Heard/Used 1928.327 62.2In Your Lifetime 347.3114 11.2
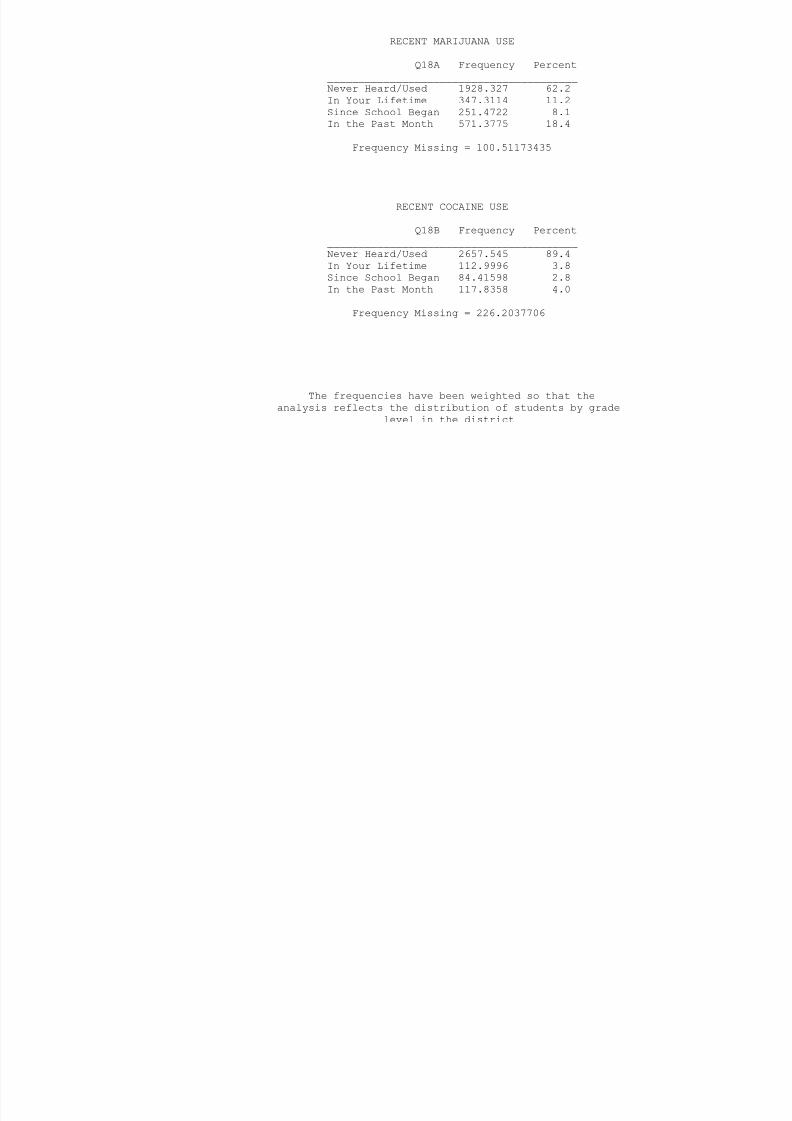
8/14/2019 BRAZORIA COUNTY - Alvin ISD - 1998 Texas School Survey of Drug and Alcohol Use
http://slidepdf.com/reader/full/brazoria-county-alvin-isd-1998-texas-school-survey-of-drug-and-alcohol 143/213
Since School Began 251.4722 8.1In the Past Month 571.3775 18.4
Frequency Missing = 100.51173435
RECENT COCAINE USE
Q18B Frequency Percent________________________________________Never Heard/Used 2657.545 89.4In Your Lifetime 112.9996 3.8Since School Began 84.41598 2.8In the Past Month 117.8358 4.0
Frequency Missing = 226.2037706
The frequencies have been weighted so that theanalysis reflects the distribution of students by grade
level in the district
AlvinSpring 1998
RECENT CRACK USE
Q18C Frequency Percent
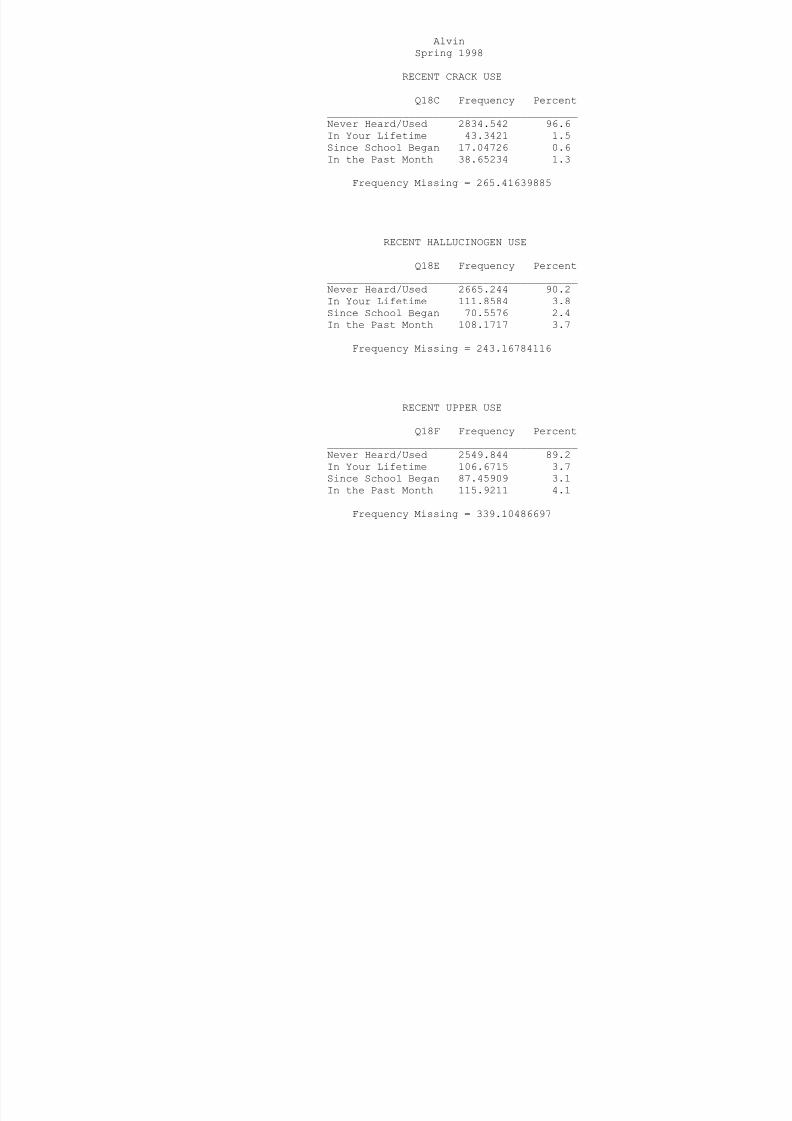
8/14/2019 BRAZORIA COUNTY - Alvin ISD - 1998 Texas School Survey of Drug and Alcohol Use
http://slidepdf.com/reader/full/brazoria-county-alvin-isd-1998-texas-school-survey-of-drug-and-alcohol 144/213
________________________________________Never Heard/Used 2834.542 96.6In Your Lifetime 43.3421 1.5Since School Began 17.04726 0.6
In the Past Month 38.65234 1.3
Frequency Missing = 265.41639885
RECENT HALLUCINOGEN USE
Q18E Frequency Percent________________________________________Never Heard/Used 2665.244 90.2
In Your Lifetime 111.8584 3.8Since School Began 70.5576 2.4In the Past Month 108.1717 3.7
Frequency Missing = 243.16784116
RECENT UPPER USE
Q18F Frequency Percent________________________________________Never Heard/Used 2549.844 89.2In Your Lifetime 106.6715 3.7Since School Began 87.45909 3.1In the Past Month 115.9211 4.1
Frequency Missing = 339.10486697
RECENT DOWNER USE
Q18G Frequency Percent________________________________________Never Heard/Used 2617.016 91.8In Your Lifetime 94.97678 3.3i h l 56 08669 2 0

8/14/2019 BRAZORIA COUNTY - Alvin ISD - 1998 Texas School Survey of Drug and Alcohol Use
http://slidepdf.com/reader/full/brazoria-county-alvin-isd-1998-texas-school-survey-of-drug-and-alcohol 145/213
Since School Began 56.08669 2.0In the Past Month 82.20794 2.9
Frequency Missing = 348.7130004
RECENT ROHYPNOL USE
Q18H Frequency Percent________________________________________Never Heard/Used 2746.718 93.5In Your Lifetime 62.8922 2.1Since School Began 39.18548 1.3In the Past Month 88.96874 3.0
Frequency Missing = 261.23594112
The frequencies have been weighted so that theanalysis reflects the distribution of students by grade
level in the district
AlvinSpring 1998
RECENT STEROID USE
Q18I Frequency Percent

8/14/2019 BRAZORIA COUNTY - Alvin ISD - 1998 Texas School Survey of Drug and Alcohol Use
http://slidepdf.com/reader/full/brazoria-county-alvin-isd-1998-texas-school-survey-of-drug-and-alcohol 146/213
________________________________________Never Heard/Used 2787.152 97.2In Your Lifetime 42.40655 1.5Since School Began 15.73775 0.5
In the Past Month 22.53275 0.8
Frequency Missing = 331.17138086
RECENT ECSTASY USE
Q18J Frequency Percent________________________________________Never Heard/Used 2660.652 93.6
In Your Lifetime 58.31136 2.1Since School Began 45.67161 1.6In the Past Month 77.5984 2.7
Frequency Missing = 356.76706888
RECENT HEROIN USE
Q18K Frequency Percent________________________________________Never Heard/Used 2777.432 97.3In Your Lifetime 35.0618 1.2Since School Began 14.76544 0.5In the Past Month 28.48123 1.0
Frequency Missing = 343.25961722
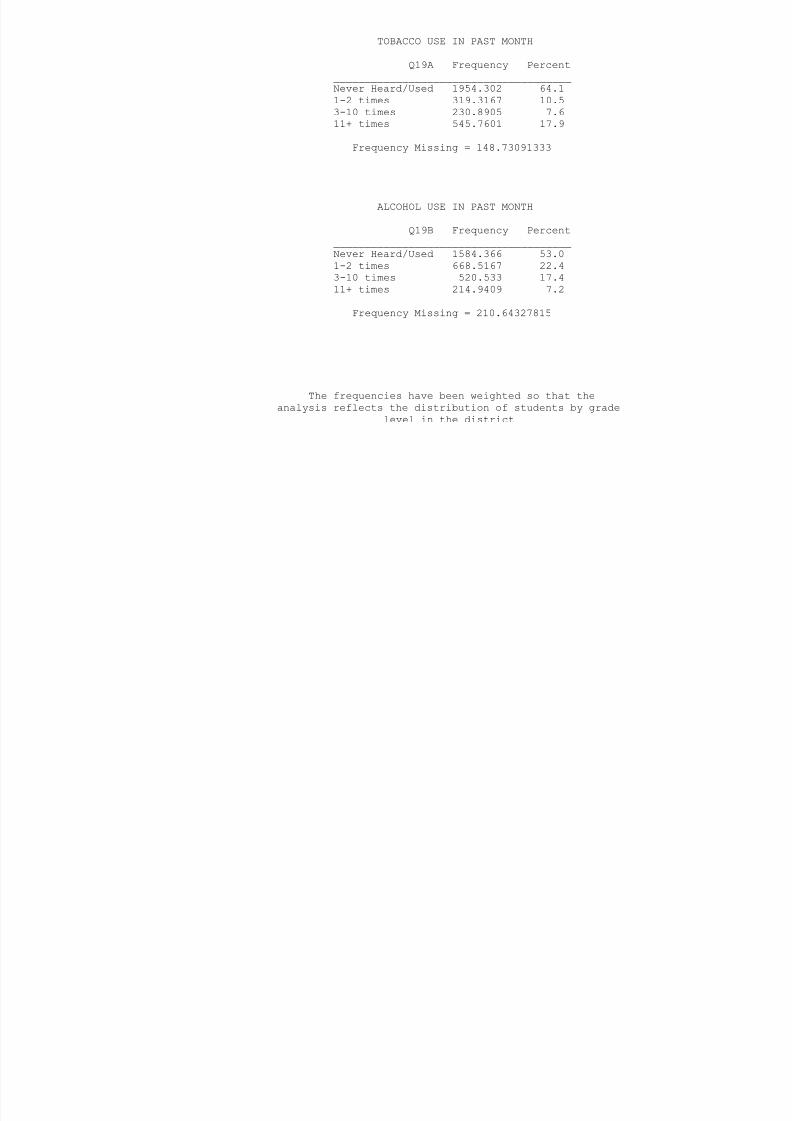
8/14/2019 BRAZORIA COUNTY - Alvin ISD - 1998 Texas School Survey of Drug and Alcohol Use
http://slidepdf.com/reader/full/brazoria-county-alvin-isd-1998-texas-school-survey-of-drug-and-alcohol 147/213
AlvinSpring 1998
INHALANT USE IN PAST MONTH
Q19C Frequency Percent
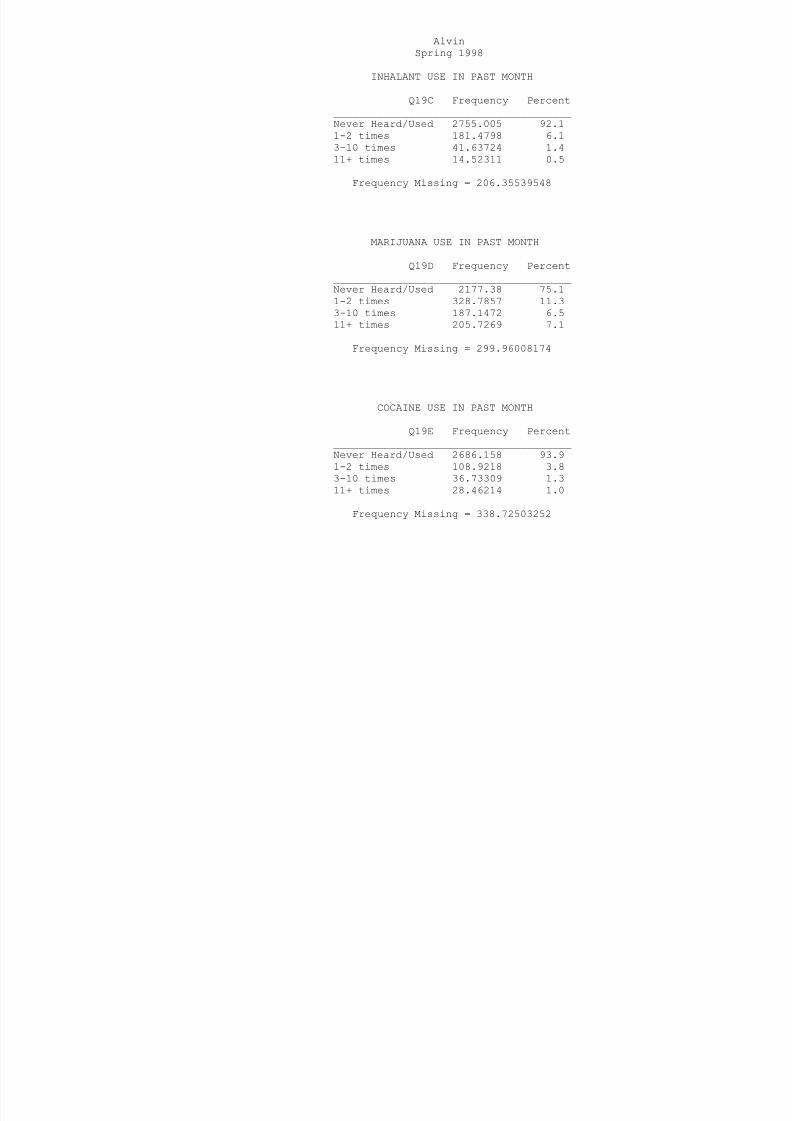
8/14/2019 BRAZORIA COUNTY - Alvin ISD - 1998 Texas School Survey of Drug and Alcohol Use
http://slidepdf.com/reader/full/brazoria-county-alvin-isd-1998-texas-school-survey-of-drug-and-alcohol 148/213
______________________________________Never Heard/Used 2755.005 92.11-2 times 181.4798 6.13-10 times 41.63724 1.4
11+ times 14.52311 0.5
Frequency Missing = 206.35539548
MARIJUANA USE IN PAST MONTH
Q19D Frequency Percent______________________________________Never Heard/Used 2177.38 75.1
1-2 times 328.7857 11.33-10 times 187.1472 6.511+ times 205.7269 7.1
Frequency Missing = 299.96008174
COCAINE USE IN PAST MONTH
Q19E Frequency Percent______________________________________Never Heard/Used 2686.158 93.91-2 times 108.9218 3.83-10 times 36.73309 1.311+ times 28.46214 1.0
Frequency Missing = 338.72503252
CRACK USE IN PAST MONTH
Q19F Frequency Percent______________________________________Never Heard/Used 2835.172 97.71-2 times 38.01305 1.33-10 times 17 07095 0 6
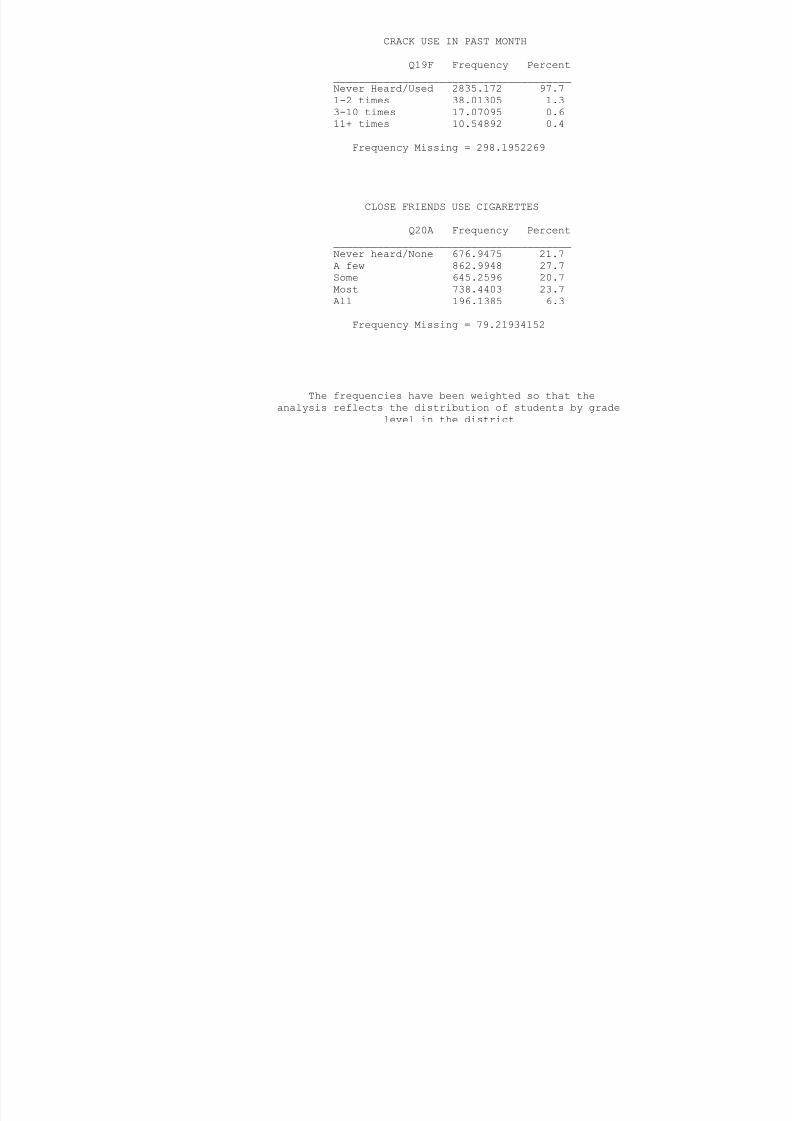
8/14/2019 BRAZORIA COUNTY - Alvin ISD - 1998 Texas School Survey of Drug and Alcohol Use
http://slidepdf.com/reader/full/brazoria-county-alvin-isd-1998-texas-school-survey-of-drug-and-alcohol 149/213
3-10 times 17.07095 0.611+ times 10.54892 0.4
Frequency Missing = 298.1952269
CLOSE FRIENDS USE CIGARETTES
Q20A Frequency Percent______________________________________Never heard/None 676.9475 21.7A few 862.9948 27.7Some 645.2596 20.7Most 738.4403 23.7
All 196.1385 6.3
Frequency Missing = 79.21934152
The frequencies have been weighted so that theanalysis reflects the distribution of students by grade
level in the district
AlvinSpring 1998
CLOSE FRIENDS USE SMOKELESS TOBACCO
Q20B Frequency Percent
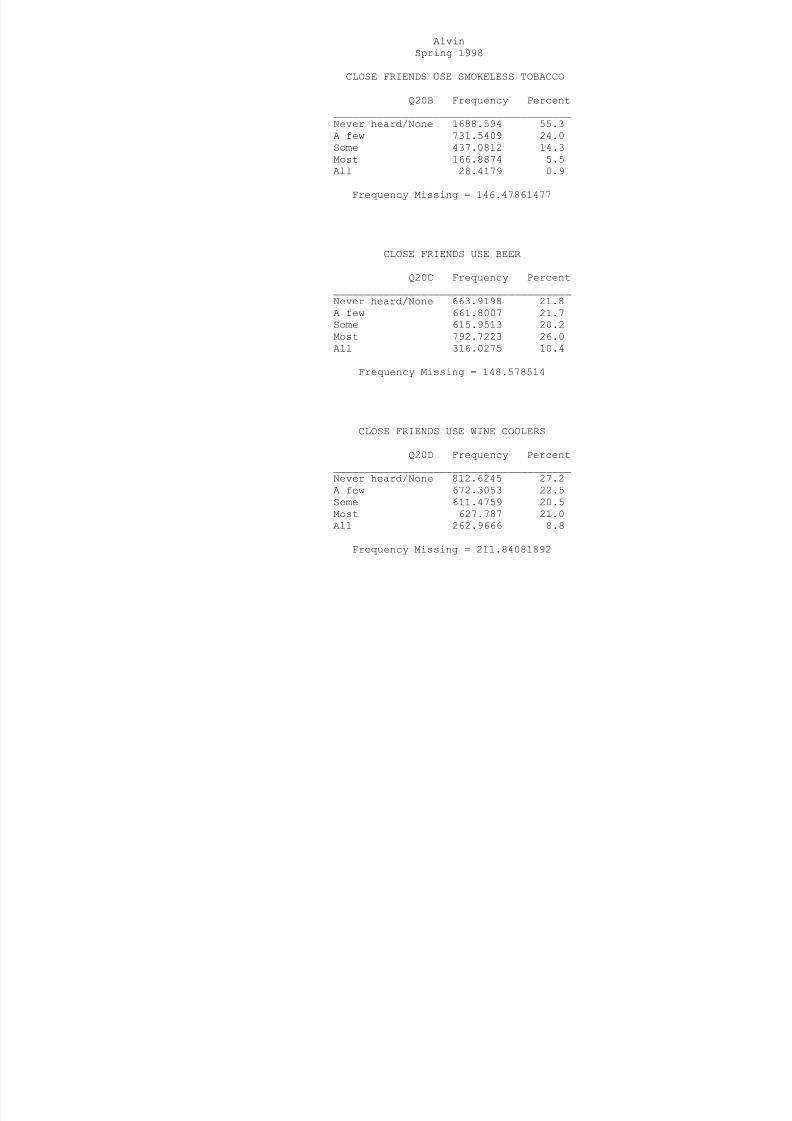
8/14/2019 BRAZORIA COUNTY - Alvin ISD - 1998 Texas School Survey of Drug and Alcohol Use
http://slidepdf.com/reader/full/brazoria-county-alvin-isd-1998-texas-school-survey-of-drug-and-alcohol 150/213
______________________________________Never heard/None 1688.594 55.3A few 731.5409 24.0Some 437.0812 14.3
Most 166.8874 5.5All 28.4179 0.9
Frequency Missing = 146.47861477
CLOSE FRIENDS USE BEER
Q20C Frequency Percent______________________________________
Never heard/None 663.9198 21.8A few 661.8007 21.7Some 615.9513 20.2Most 792.7223 26.0All 316.0275 10.4
Frequency Missing = 148.578514
CLOSE FRIENDS USE WINE COOLERS
Q20D Frequency Percent
______________________________________Never heard/None 812.6245 27.2A few 672.3053 22.5Some 611.4759 20.5Most 627.787 21.0All 262.9666 8.8
Frequency Missing = 211.84081892
CLOSE FRIENDS USE WINE
Q20E Frequency Percent
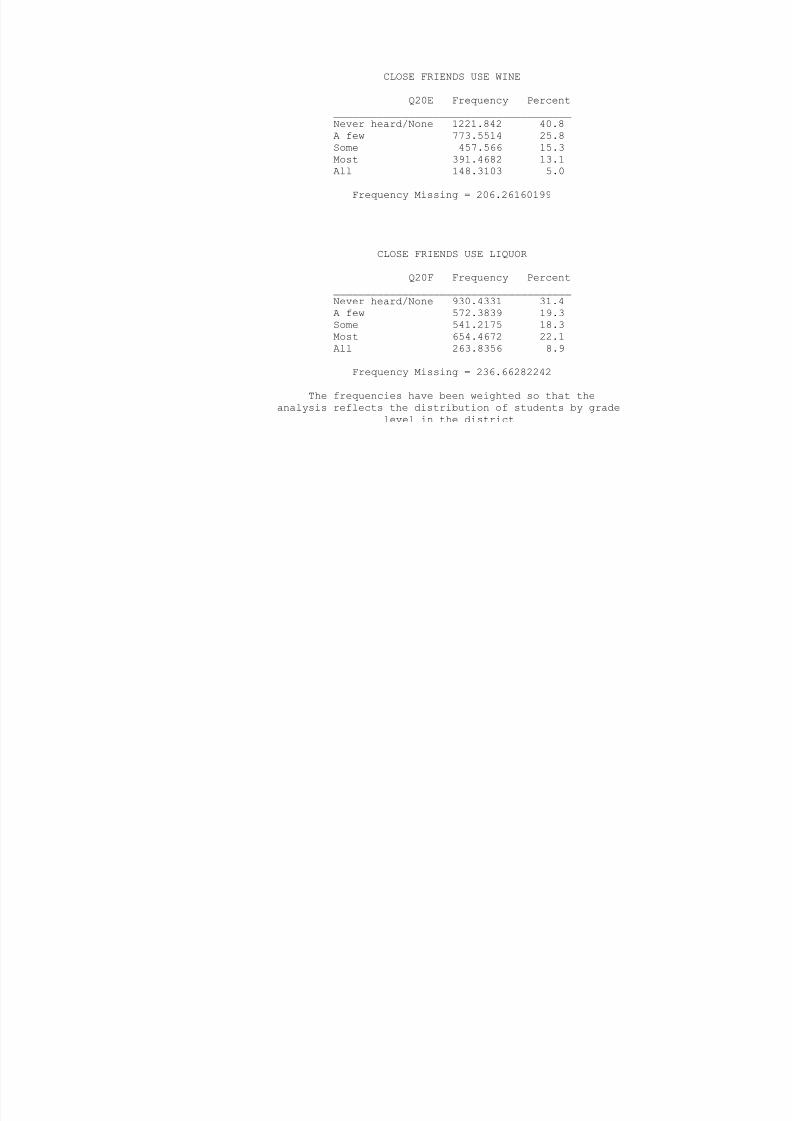
8/14/2019 BRAZORIA COUNTY - Alvin ISD - 1998 Texas School Survey of Drug and Alcohol Use
http://slidepdf.com/reader/full/brazoria-county-alvin-isd-1998-texas-school-survey-of-drug-and-alcohol 151/213
______________________________________Never heard/None 1221.842 40.8A few 773.5514 25.8Some 457.566 15.3
Most 391.4682 13.1All 148.3103 5.0
Frequency Missing = 206.26160199
CLOSE FRIENDS USE LIQUOR
Q20F Frequency Percent______________________________________
Never heard/None 930.4331 31.4A few 572.3839 19.3Some 541.2175 18.3Most 654.4672 22.1All 263.8356 8.9
Frequency Missing = 236.66282242
The frequencies have been weighted so that theanalysis reflects the distribution of students by grade
level in the district
AlvinSpring 1998
CLOSE FRIENDS USE INHALANTS
Q20G Frequency Percent
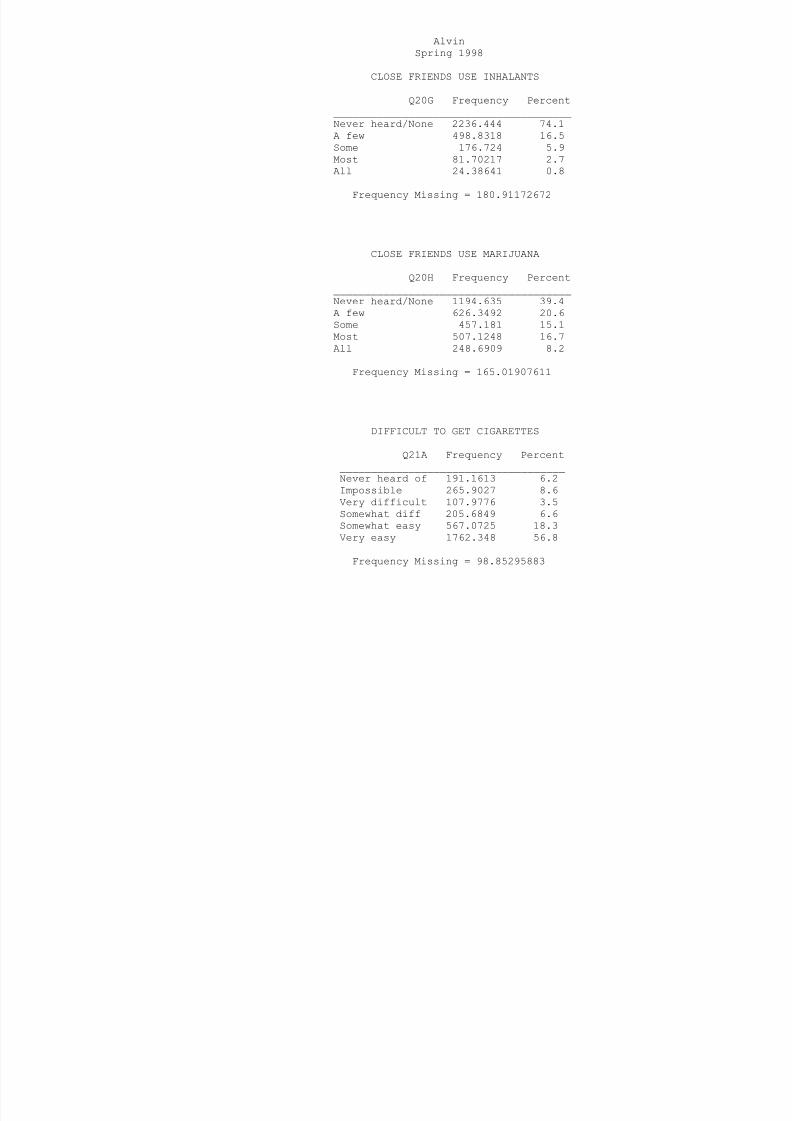
8/14/2019 BRAZORIA COUNTY - Alvin ISD - 1998 Texas School Survey of Drug and Alcohol Use
http://slidepdf.com/reader/full/brazoria-county-alvin-isd-1998-texas-school-survey-of-drug-and-alcohol 152/213
______________________________________Never heard/None 2236.444 74.1A few 498.8318 16.5Some 176.724 5.9
Most 81.70217 2.7All 24.38641 0.8
Frequency Missing = 180.91172672
CLOSE FRIENDS USE MARIJUANA
Q20H Frequency Percent______________________________________
Never heard/None 1194.635 39.4A few 626.3492 20.6Some 457.181 15.1Most 507.1248 16.7All 248.6909 8.2
Frequency Missing = 165.01907611
DIFFICULT TO GET CIGARETTES
Q21A Frequency Percent
____________________________________Never heard of 191.1613 6.2Impossible 265.9027 8.6Very difficult 107.9776 3.5Somewhat diff 205.6849 6.6Somewhat easy 567.0725 18.3Very easy 1762.348 56.8
Frequency Missing = 98.85295883
DIFFICULT TO GET SMOKELESS TOBACCO
Q21B Frequency Percent
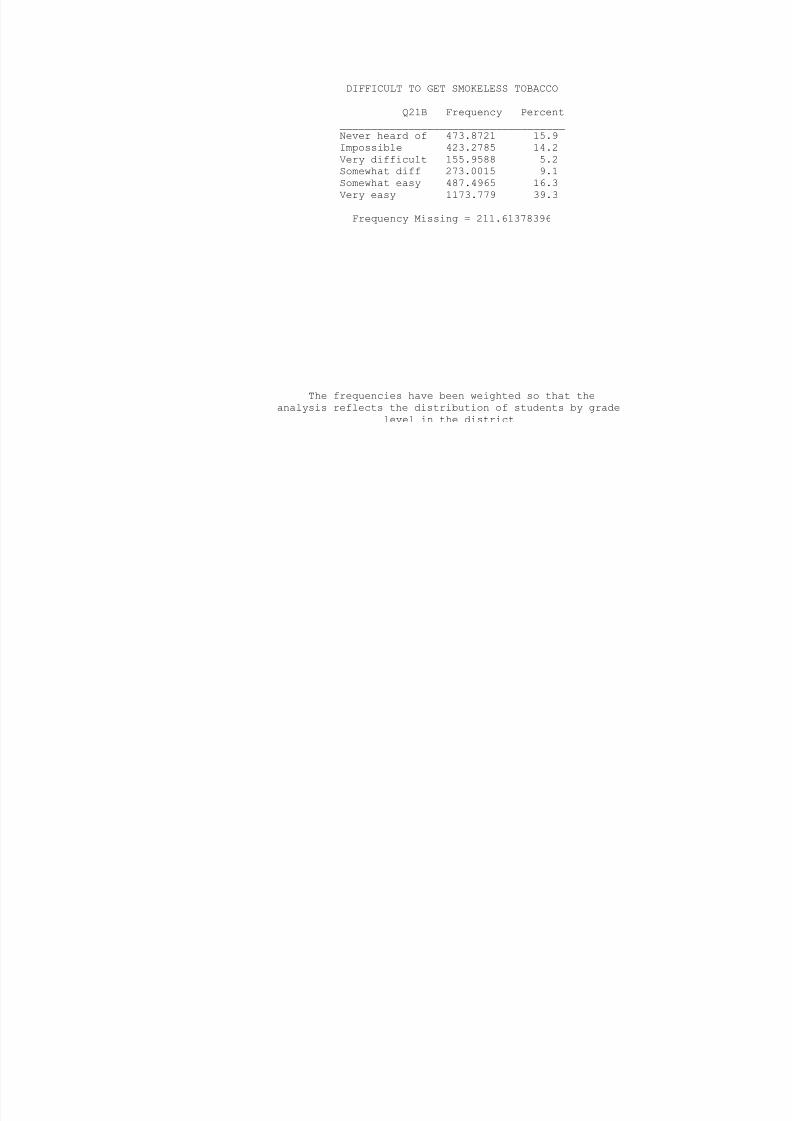
8/14/2019 BRAZORIA COUNTY - Alvin ISD - 1998 Texas School Survey of Drug and Alcohol Use
http://slidepdf.com/reader/full/brazoria-county-alvin-isd-1998-texas-school-survey-of-drug-and-alcohol 153/213
Q21B Frequency Percent____________________________________Never heard of 473.8721 15.9Impossible 423.2785 14.2
Very difficult 155.9588 5.2Somewhat diff 273.0015 9.1Somewhat easy 487.4965 16.3Very easy 1173.779 39.3
Frequency Missing = 211.61378396
The frequencies have been weighted so that theanalysis reflects the distribution of students by grade
level in the district
AlvinSpring 1998
DIFFICULT TO GET BEER
Q21C Frequency Percent
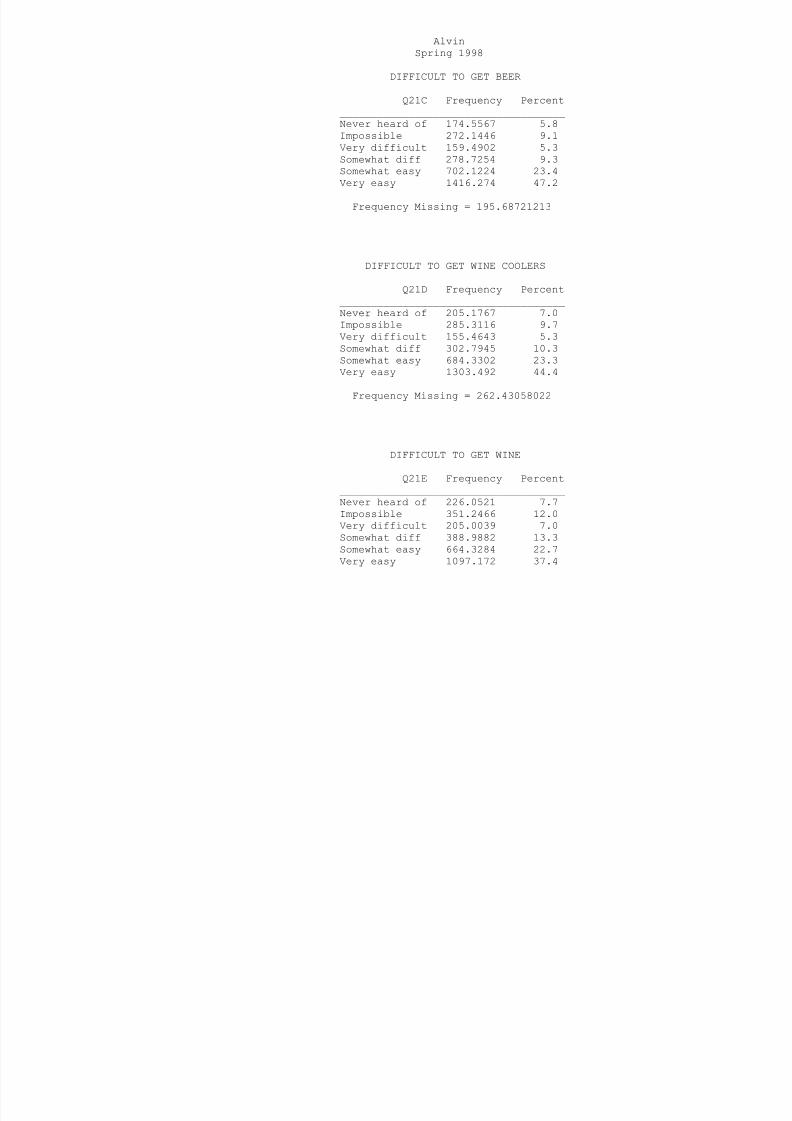
8/14/2019 BRAZORIA COUNTY - Alvin ISD - 1998 Texas School Survey of Drug and Alcohol Use
http://slidepdf.com/reader/full/brazoria-county-alvin-isd-1998-texas-school-survey-of-drug-and-alcohol 154/213
____________________________________Never heard of 174.5567 5.8Impossible 272.1446 9.1Very difficult 159.4902 5.3
Somewhat diff 278.7254 9.3Somewhat easy 702.1224 23.4Very easy 1416.274 47.2
Frequency Missing = 195.68721213
DIFFICULT TO GET WINE COOLERS
Q21D Frequency Percent
____________________________________Never heard of 205.1767 7.0Impossible 285.3116 9.7Very difficult 155.4643 5.3Somewhat diff 302.7945 10.3Somewhat easy 684.3302 23.3Very easy 1303.492 44.4
Frequency Missing = 262.43058022
DIFFICULT TO GET WINE
Q21E Frequency Percent____________________________________Never heard of 226.0521 7.7Impossible 351.2466 12.0Very difficult 205.0039 7.0Somewhat diff 388.9882 13.3Somewhat easy 664.3284 22.7Very easy 1097.172 37.4
Frequency Missing = 266.20904937
DIFFICULT TO GET LIQUOR
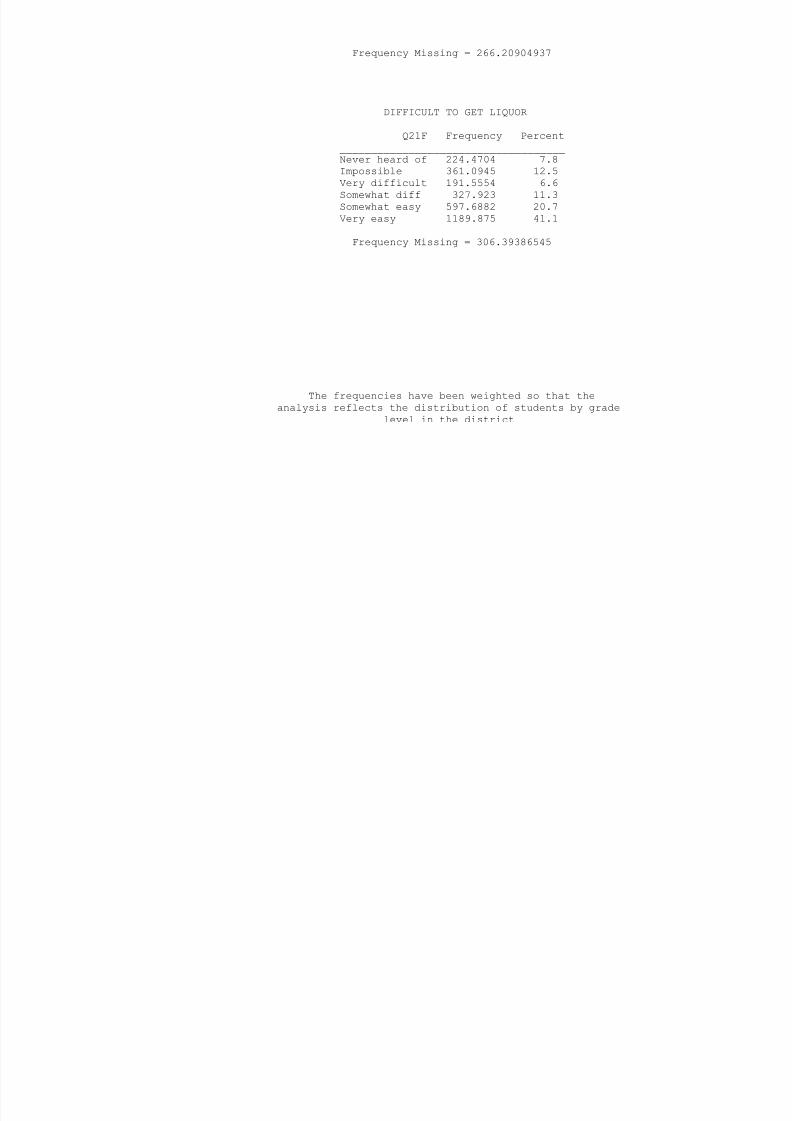
8/14/2019 BRAZORIA COUNTY - Alvin ISD - 1998 Texas School Survey of Drug and Alcohol Use
http://slidepdf.com/reader/full/brazoria-county-alvin-isd-1998-texas-school-survey-of-drug-and-alcohol 155/213
Q21F Frequency Percent
____________________________________
Never heard of 224.4704 7.8Impossible 361.0945 12.5Very difficult 191.5554 6.6Somewhat diff 327.923 11.3Somewhat easy 597.6882 20.7Very easy 1189.875 41.1
Frequency Missing = 306.39386545
The frequencies have been weighted so that theanalysis reflects the distribution of students by grade
level in the district
AlvinSpring 1998
DIFFICULT TO GET INHALANTS
Q21G Frequency Percent
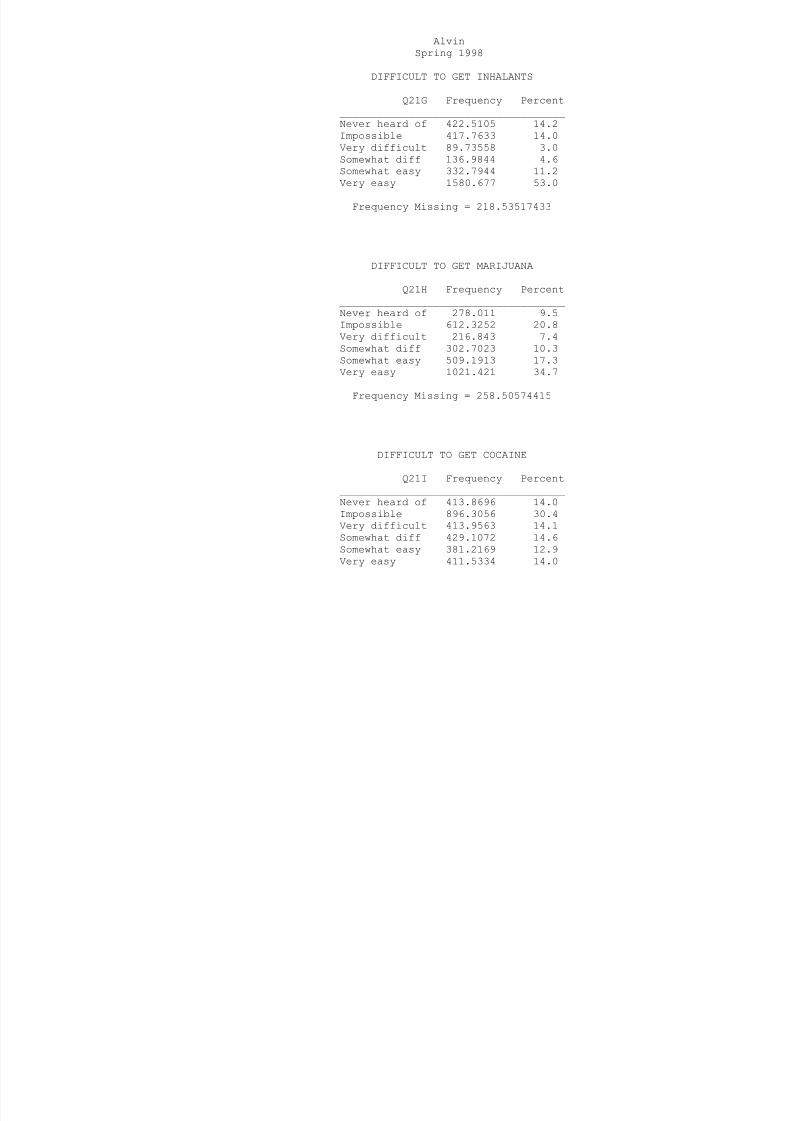
8/14/2019 BRAZORIA COUNTY - Alvin ISD - 1998 Texas School Survey of Drug and Alcohol Use
http://slidepdf.com/reader/full/brazoria-county-alvin-isd-1998-texas-school-survey-of-drug-and-alcohol 156/213
____________________________________Never heard of 422.5105 14.2Impossible 417.7633 14.0Very difficult 89.73558 3.0
Somewhat diff 136.9844 4.6Somewhat easy 332.7944 11.2Very easy 1580.677 53.0
Frequency Missing = 218.53517433
DIFFICULT TO GET MARIJUANA
Q21H Frequency Percent
____________________________________Never heard of 278.011 9.5Impossible 612.3252 20.8Very difficult 216.843 7.4Somewhat diff 302.7023 10.3Somewhat easy 509.1913 17.3Very easy 1021.421 34.7
Frequency Missing = 258.50574415
DIFFICULT TO GET COCAINE
Q21I Frequency Percent____________________________________Never heard of 413.8696 14.0Impossible 896.3056 30.4Very difficult 413.9563 14.1Somewhat diff 429.1072 14.6Somewhat easy 381.2169 12.9Very easy 411.5334 14.0
Frequency Missing = 253.01119851
DIFFICULT TO GET CRACK

8/14/2019 BRAZORIA COUNTY - Alvin ISD - 1998 Texas School Survey of Drug and Alcohol Use
http://slidepdf.com/reader/full/brazoria-county-alvin-isd-1998-texas-school-survey-of-drug-and-alcohol 157/213
Q21J Frequency Percent
____________________________________
Never heard of 421.2773 14.9Impossible 872.9312 30.9Very difficult 457.3144 16.2Somewhat diff 434.5122 15.4Somewhat easy 335.874 11.9Very easy 301.1383 10.7
Frequency Missing = 375.95260518
The frequencies have been weighted so that theanalysis reflects the distribution of students by grade
level in the district
AlvinSpring 1998
DIFFICULT TO GET HALLUCINOGENS
Q21L Frequency Percent____________________________________
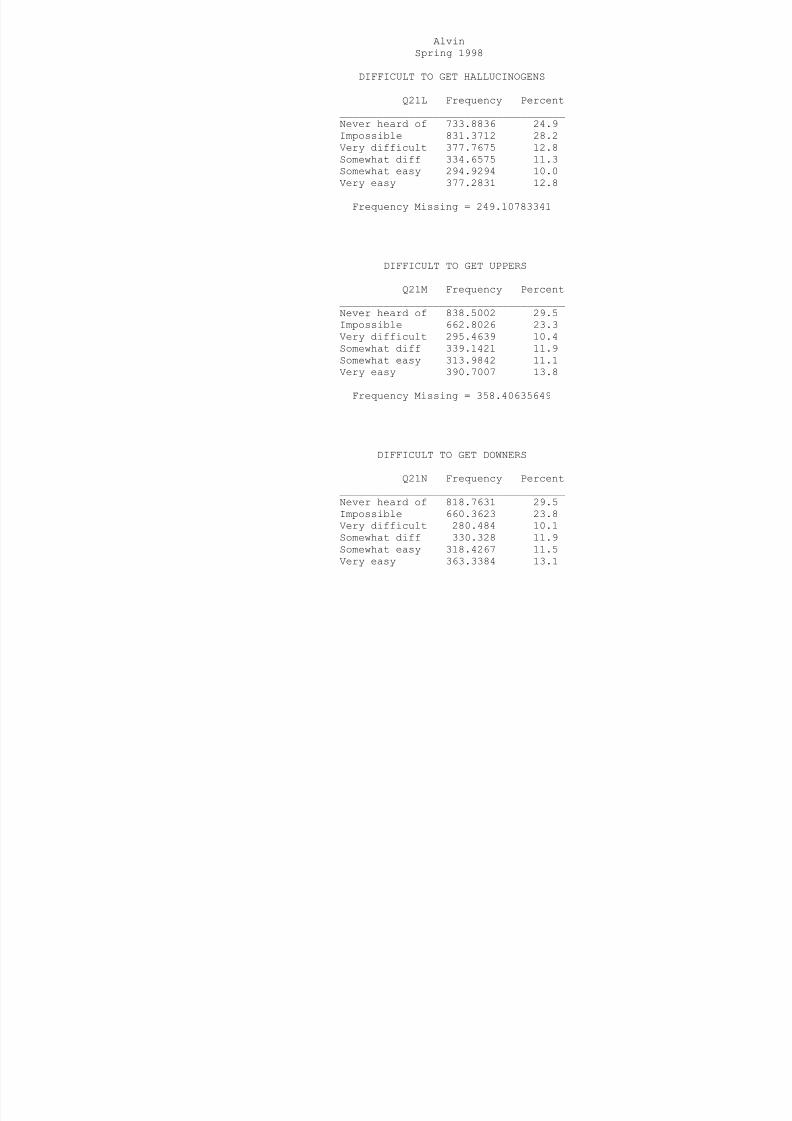
8/14/2019 BRAZORIA COUNTY - Alvin ISD - 1998 Texas School Survey of Drug and Alcohol Use
http://slidepdf.com/reader/full/brazoria-county-alvin-isd-1998-texas-school-survey-of-drug-and-alcohol 158/213
Never heard of 733.8836 24.9Impossible 831.3712 28.2Very difficult 377.7675 12.8
Somewhat diff 334.6575 11.3Somewhat easy 294.9294 10.0Very easy 377.2831 12.8
Frequency Missing = 249.10783341
DIFFICULT TO GET UPPERS
Q21M Frequency Percent
____________________________________Never heard of 838.5002 29.5Impossible 662.8026 23.3Very difficult 295.4639 10.4Somewhat diff 339.1421 11.9Somewhat easy 313.9842 11.1Very easy 390.7007 13.8
Frequency Missing = 358.40635649
DIFFICULT TO GET DOWNERS
Q21N Frequency Percent____________________________________Never heard of 818.7631 29.5Impossible 660.3623 23.8Very difficult 280.484 10.1Somewhat diff 330.328 11.9Somewhat easy 318.4267 11.5Very easy 363.3384 13.1
Frequency Missing = 427.297502
DIFFICULT TO GET ROHYPNOL
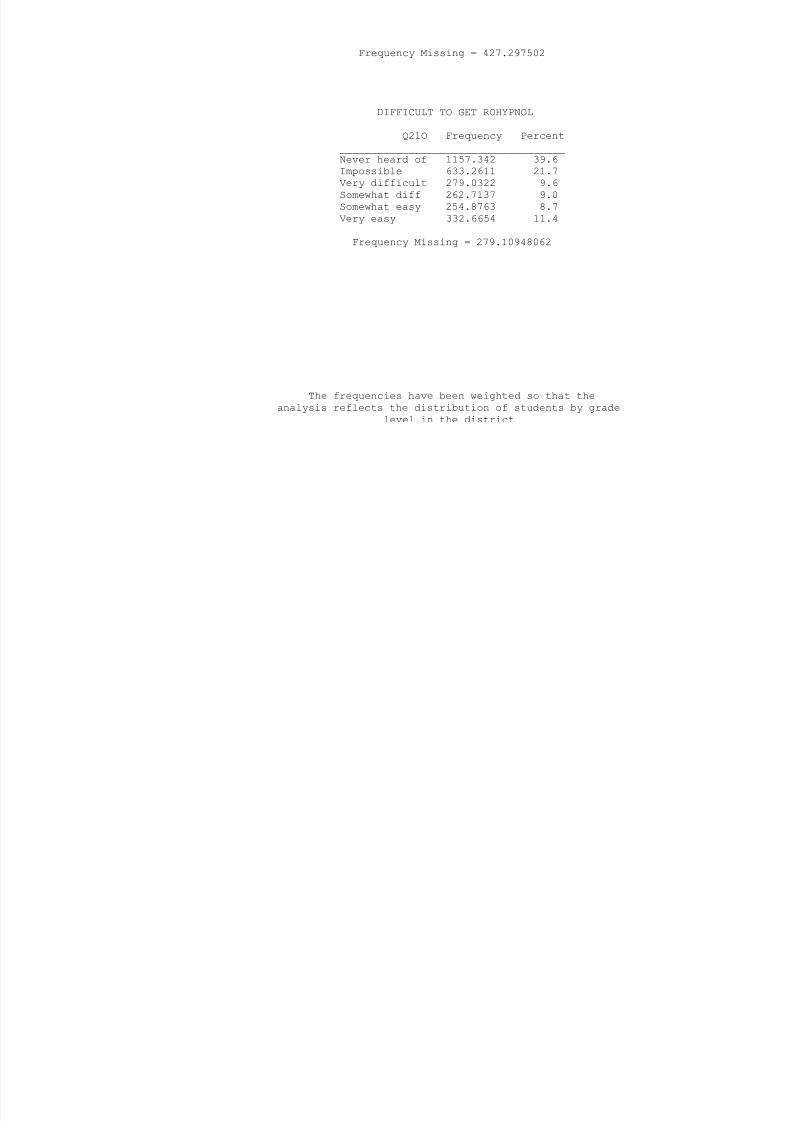
8/14/2019 BRAZORIA COUNTY - Alvin ISD - 1998 Texas School Survey of Drug and Alcohol Use
http://slidepdf.com/reader/full/brazoria-county-alvin-isd-1998-texas-school-survey-of-drug-and-alcohol 159/213
Q21O Frequency Percent
____________________________________
Never heard of 1157.342 39.6Impossible 633.2611 21.7Very difficult 279.0322 9.6Somewhat diff 262.7137 9.0Somewhat easy 254.8763 8.7Very easy 332.6654 11.4
Frequency Missing = 279.10948062
The frequencies have been weighted so that theanalysis reflects the distribution of students by grade
level in the district
AlvinSpring 1998
DIFFICULT TO GET STEROIDS
Q21P Frequency Percent____________________________________
h d f 546 1544 19 4

8/14/2019 BRAZORIA COUNTY - Alvin ISD - 1998 Texas School Survey of Drug and Alcohol Use
http://slidepdf.com/reader/full/brazoria-county-alvin-isd-1998-texas-school-survey-of-drug-and-alcohol 160/213
Never heard of 546.1544 19.4Impossible 917.6423 32.5Very difficult 408.1979 14.5Somewhat diff 352.307 12.5Somewhat easy 288.6434 10.2Very easy 306.8577 10.9
Frequency Missing = 379.19743001
DIFFICULT TO GET ECSTASY
Q21Q Frequency Percent
____________________________________Never heard of 998.7517 34.7Impossible 686.8384 23.9Very difficult 327.1009 11.4Somewhat diff 268.5478 9.3Somewhat easy 263.8456 9.2Very easy 329.1157 11.5
Frequency Missing = 324.79989744
DIFFICULT TO GET HEROIN
Q21R Frequency Percent____________________________________Never heard of 530.3888 18.4Impossible 1057.598 36.7Very difficult 484.2259 16.8Somewhat diff 326.5361 11.3Somewhat easy 235.549 8.2Very easy 249.2111 8.6
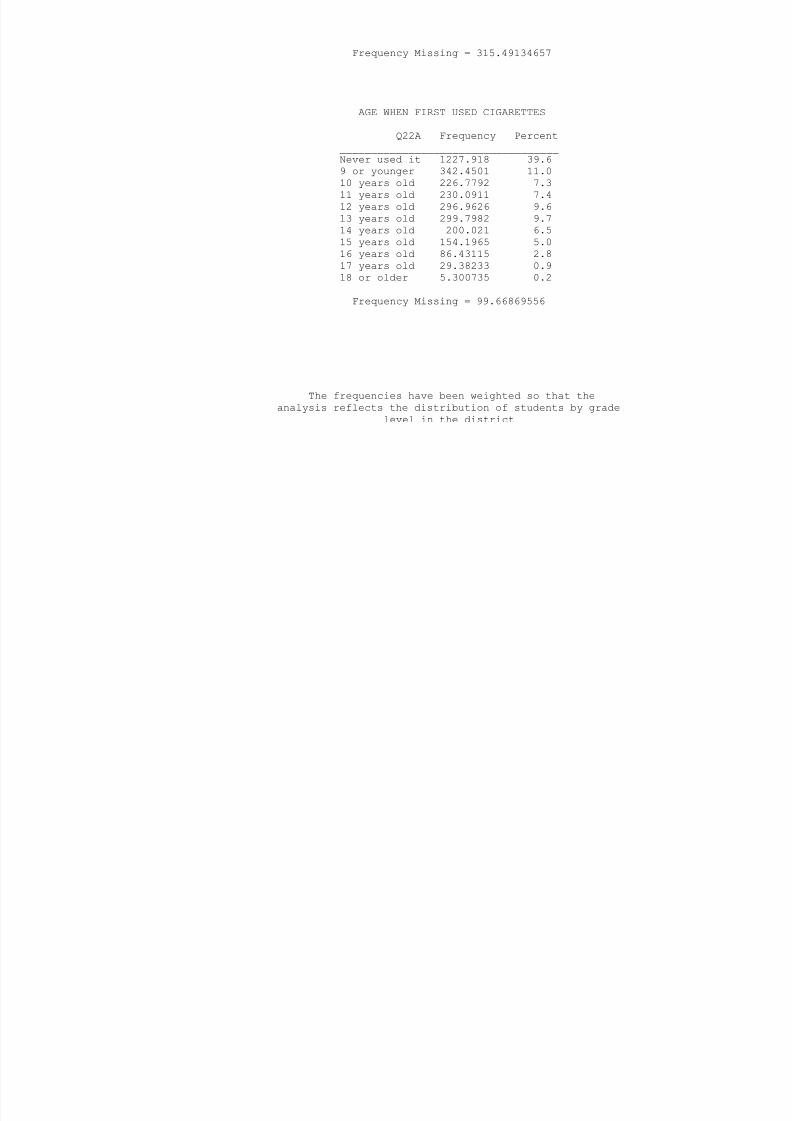
8/14/2019 BRAZORIA COUNTY - Alvin ISD - 1998 Texas School Survey of Drug and Alcohol Use
http://slidepdf.com/reader/full/brazoria-county-alvin-isd-1998-texas-school-survey-of-drug-and-alcohol 161/213
AlvinSpring 1998
AGE WHEN FIRST USEDSMOKELESS TOBACCO
Q22B Frequency Percent
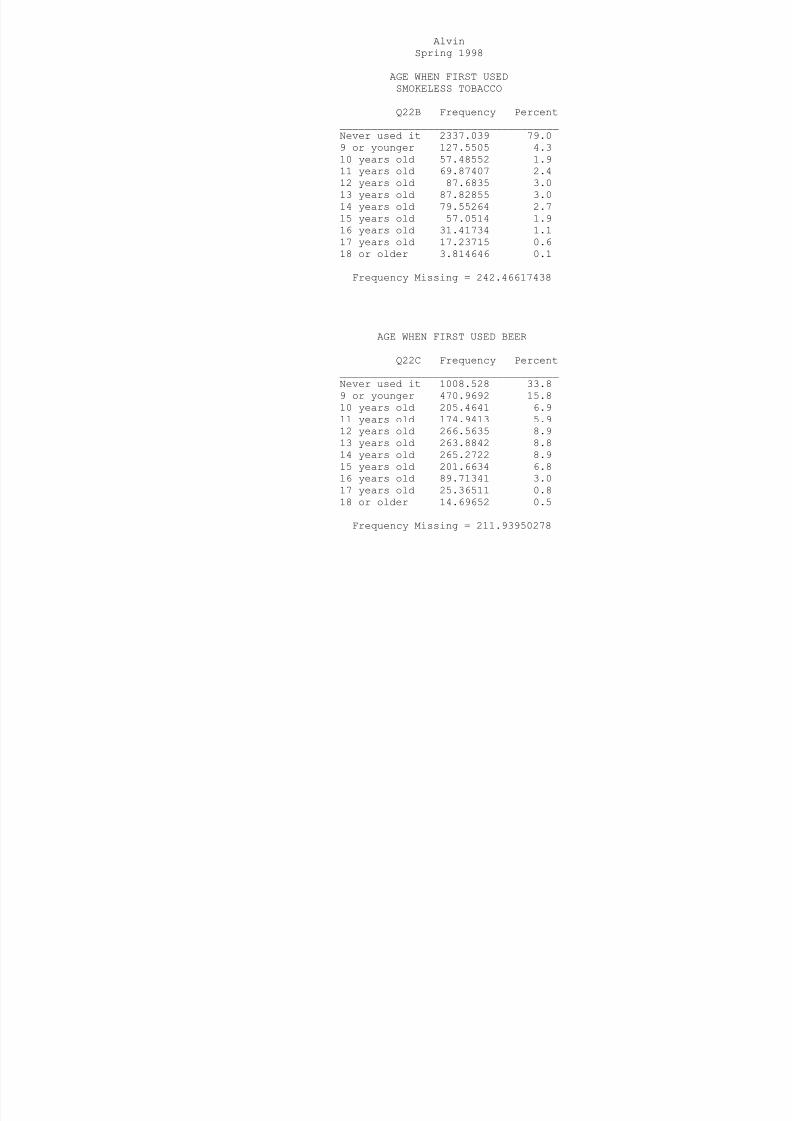
8/14/2019 BRAZORIA COUNTY - Alvin ISD - 1998 Texas School Survey of Drug and Alcohol Use
http://slidepdf.com/reader/full/brazoria-county-alvin-isd-1998-texas-school-survey-of-drug-and-alcohol 162/213
___________________________________Never used it 2337.039 79.09 or younger 127.5505 4.310 years old 57.48552 1.911 years old 69.87407 2.412 years old 87.6835 3.013 years old 87.82855 3.014 years old 79.55264 2.715 years old 57.0514 1.916 years old 31.41734 1.117 years old 17.23715 0.618 or older 3.814646 0.1
Frequency Missing = 242.46617438
AGE WHEN FIRST USED BEER
Q22C Frequency Percent___________________________________Never used it 1008.528 33.89 or younger 470.9692 15.810 years old 205.4641 6.911 years old 174.9413 5.912 years old 266.5635 8.9
13 years old 263.8842 8.814 years old 265.2722 8.915 years old 201.6634 6.816 years old 89.71341 3.017 years old 25.36511 0.818 or older 14.69652 0.5
Frequency Missing = 211.93950278
AGE WHEN FIRST USED WINE COOLERS
Q22D Frequency Percent___________________________________Never used it 986.6324 33.49 or younger 288.3953 9.810 years old 188 7786 6 4
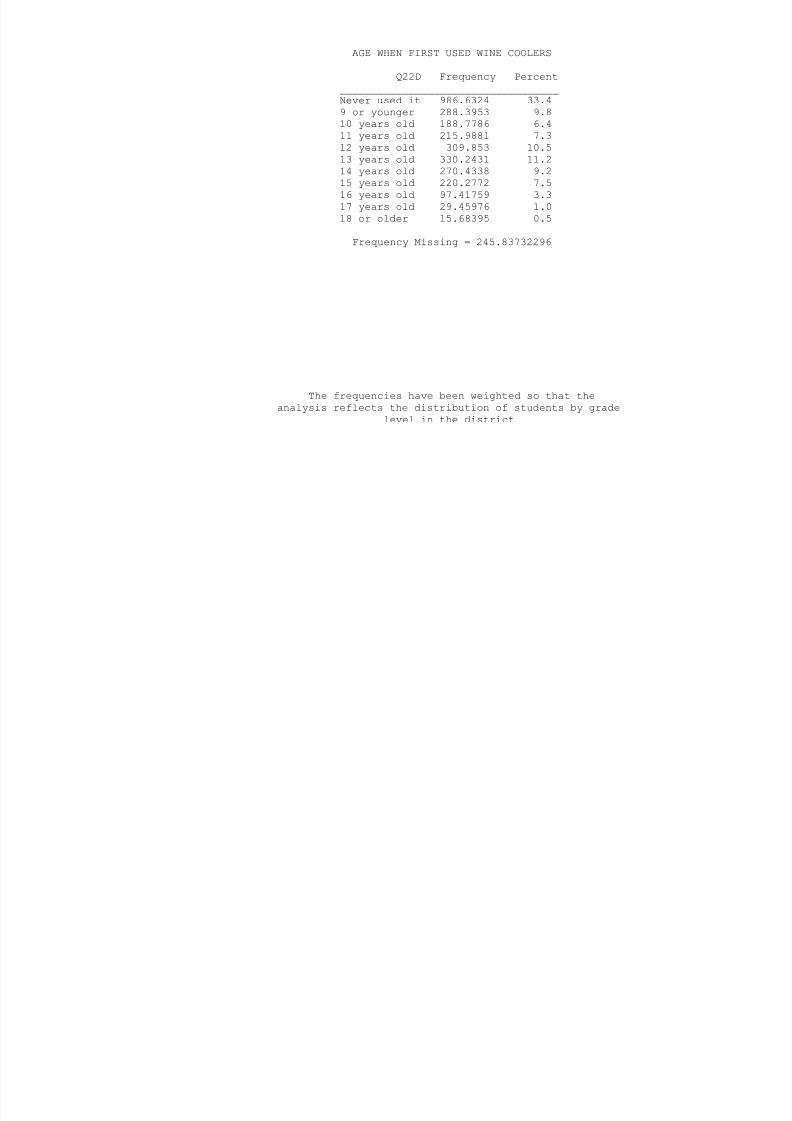
8/14/2019 BRAZORIA COUNTY - Alvin ISD - 1998 Texas School Survey of Drug and Alcohol Use
http://slidepdf.com/reader/full/brazoria-county-alvin-isd-1998-texas-school-survey-of-drug-and-alcohol 163/213
10 years old 188.7786 6.411 years old 215.9881 7.312 years old 309.853 10.513 years old 330.2431 11.214 years old 270.4338 9.215 years old 220.2772 7.516 years old 97.41759 3.317 years old 29.45976 1.018 or older 15.68395 0.5
Frequency Missing = 245.83732296
The frequencies have been weighted so that theanalysis reflects the distribution of students by grade
level in the district
AlvinSpring 1998
AGE WHEN FIRST USED WINE
Q22E Frequency Percent___________________________________Never used it 1281 665 43 8
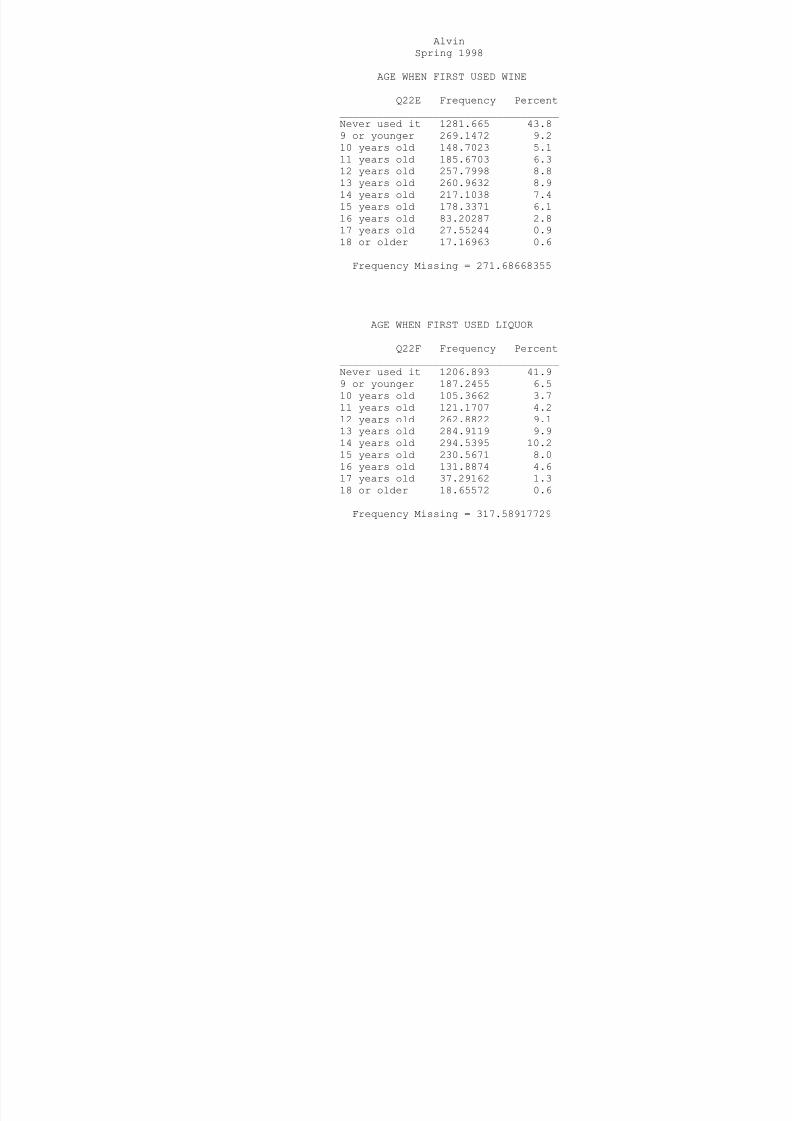
8/14/2019 BRAZORIA COUNTY - Alvin ISD - 1998 Texas School Survey of Drug and Alcohol Use
http://slidepdf.com/reader/full/brazoria-county-alvin-isd-1998-texas-school-survey-of-drug-and-alcohol 164/213
Never used it 1281.665 43.89 or younger 269.1472 9.210 years old 148.7023 5.111 years old 185.6703 6.312 years old 257.7998 8.813 years old 260.9632 8.914 years old 217.1038 7.415 years old 178.3371 6.116 years old 83.20287 2.817 years old 27.55244 0.918 or older 17.16963 0.6
Frequency Missing = 271.68668355
AGE WHEN FIRST USED LIQUOR
Q22F Frequency Percent___________________________________Never used it 1206.893 41.99 or younger 187.2455 6.510 years old 105.3662 3.711 years old 121.1707 4.212 years old 262.8822 9.113 years old 284.9119 9.9
14 years old 294.5395 10.215 years old 230.5671 8.016 years old 131.8874 4.617 years old 37.29162 1.318 or older 18.65572 0.6
Frequency Missing = 317.58917729
AGE WHEN FIRST USED INHALANTS
Q22G Frequency Percent___________________________________Never used it 2471.473 83.99 or younger 69.09973 2.310 years old 46.39177 1.611 years old 60 36426 2 0

8/14/2019 BRAZORIA COUNTY - Alvin ISD - 1998 Texas School Survey of Drug and Alcohol Use
http://slidepdf.com/reader/full/brazoria-county-alvin-isd-1998-texas-school-survey-of-drug-and-alcohol 165/213
11 years old 60.36426 2.012 years old 87.43231 3.013 years old 79.64605 2.714 years old 63.04869 2.115 years old 37.53345 1.316 years old 19.38331 0.717 years old 8.340436 0.318 or older 4.313311 0.1
Frequency Missing = 251.97352518
The frequencies have been weighted so that theanalysis reflects the distribution of students by grade
level in the district
AlvinSpring 1998
AGE WHEN FIRST USED MARIJUANA
Q22H Frequency Percent___________________________________Never used it 1708 689 60 1

8/14/2019 BRAZORIA COUNTY - Alvin ISD - 1998 Texas School Survey of Drug and Alcohol Use
http://slidepdf.com/reader/full/brazoria-county-alvin-isd-1998-texas-school-survey-of-drug-and-alcohol 166/213
Never used it 1708.689 60.19 or younger 57.09437 2.010 years old 51.57655 1.811 years old 78.87129 2.812 years old 175.3638 6.213 years old 231.2995 8.114 years old 214.0258 7.515 years old 165.853 5.816 years old 117.2951 4.117 years old 37.11295 1.318 or older 4.313311 0.2
Frequency Missing = 357.5057819
AGE WHEN FIRST USED COCAINE
Q22I Frequency Percent___________________________________Never used it 2505.248 89.19 or younger 8.892093 0.310 years old 9.080911 0.311 years old 16.64852 0.612 years old 16.06568 0.613 years old 45.21443 1.6
14 years old 59.58215 2.115 years old 66.56265 2.416 years old 52.54285 1.917 years old 26.41015 0.918 or older 5.866924 0.2
Frequency Missing = 386.885795
AGE WHEN FIRST USED CRACK
Q22J Frequency Percent___________________________________Never used it 2594.795 96.49 or younger 4.380835 0.210 years old 2.992758 0.111 years old 13.1587 0.5

8/14/2019 BRAZORIA COUNTY - Alvin ISD - 1998 Texas School Survey of Drug and Alcohol Use
http://slidepdf.com/reader/full/brazoria-county-alvin-isd-1998-texas-school-survey-of-drug-and-alcohol 167/213
11 years old 13.1587 0.512 years old 7.093421 0.313 years old 17.87976 0.714 years old 19.34175 0.715 years old 13.67416 0.516 years old 8.71432 0.317 years old 8.340436 0.318 or older 1.907323 0.1
Frequency Missing = 506.72135757
The frequencies have been weighted so that theanalysis reflects the distribution of students by grade
level in the district
AlvinSpring 1998
AGE WHEN FIRST USED HALLUCINOGENS
Q22L Frequency Percent___________________________________Never used it 2548.445 89.8
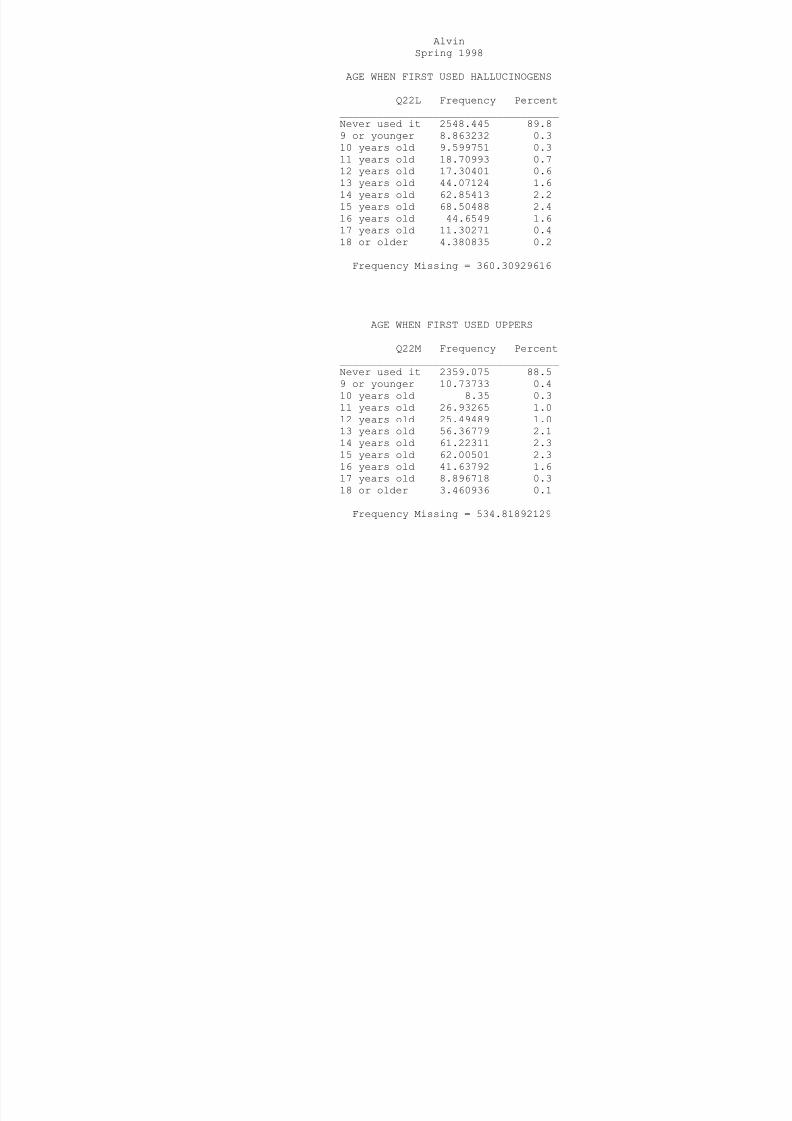
8/14/2019 BRAZORIA COUNTY - Alvin ISD - 1998 Texas School Survey of Drug and Alcohol Use
http://slidepdf.com/reader/full/brazoria-county-alvin-isd-1998-texas-school-survey-of-drug-and-alcohol 168/213
Never used it 2548.445 89.89 or younger 8.863232 0.310 years old 9.599751 0.311 years old 18.70993 0.712 years old 17.30401 0.613 years old 44.07124 1.614 years old 62.85413 2.215 years old 68.50488 2.416 years old 44.6549 1.617 years old 11.30271 0.418 or older 4.380835 0.2
Frequency Missing = 360.30929616
AGE WHEN FIRST USED UPPERS
Q22M Frequency Percent___________________________________Never used it 2359.075 88.59 or younger 10.73733 0.410 years old 8.35 0.311 years old 26.93265 1.012 years old 25.49489 1.013 years old 56.36779 2.1
14 years old 61.22311 2.315 years old 62.00501 2.316 years old 41.63792 1.617 years old 8.896718 0.318 or older 3.460936 0.1
Frequency Missing = 534.81892129
AGE WHEN FIRST USED DOWNERS
Q22N Frequency Percent___________________________________Never used it 2386.442 91.19 or younger 13.1176 0.510 years old 7.264971 0.311 years old 19.08652 0.7

8/14/2019 BRAZORIA COUNTY - Alvin ISD - 1998 Texas School Survey of Drug and Alcohol Use
http://slidepdf.com/reader/full/brazoria-county-alvin-isd-1998-texas-school-survey-of-drug-and-alcohol 169/213
y12 years old 24.44416 0.913 years old 49.21583 1.914 years old 52.18698 2.015 years old 37.0047 1.416 years old 24.2768 0.917 years old 6.921871 0.318 or older 0.9199 0.0
Frequency Missing = 578.11836819
The frequencies have been weighted so that theanalysis reflects the distribution of students by grade
level in the district
AlvinSpring 1998
AGE WHEN FIRST USED ROHYPNOL
Q22O Frequency Percent___________________________________Never used it 2656.598 93.4

8/14/2019 BRAZORIA COUNTY - Alvin ISD - 1998 Texas School Survey of Drug and Alcohol Use
http://slidepdf.com/reader/full/brazoria-county-alvin-isd-1998-texas-school-survey-of-drug-and-alcohol 170/213
9 or younger 7.762416 0.310 years old 11.97566 0.411 years old 14.25477 0.512 years old 13.58034 0.513 years old 31.64348 1.114 years old 43.87765 1.515 years old 33.55367 1.216 years old 20.06728 0.717 years old 8.829194 0.318 or older 3.393412 0.1
Frequency Missing = 353.46418356
AGE WHEN FIRST USED STEROIDS
Q22P Frequency Percent___________________________________Never used it 2522.279 97.09 or younger 7.081997 0.310 years old 5.802543 0.211 years old 7.692021 0.312 years old 2.461682 0.113 years old 9.269492 0.4
14 years old 19.41816 0.715 years old 8.192202 0.316 years old 10.90165 0.417 years old 5.934448 0.218 or older 1.656825 0.1
Frequency Missing = 598.31030007
AGE WHEN FIRST USED ECSTASY
Q22Q Frequency Percent___________________________________Never used it 2535.967 93.59 or younger 4.717514 0.210 years old 2.072859 0.111 years old 9.738483 0.4
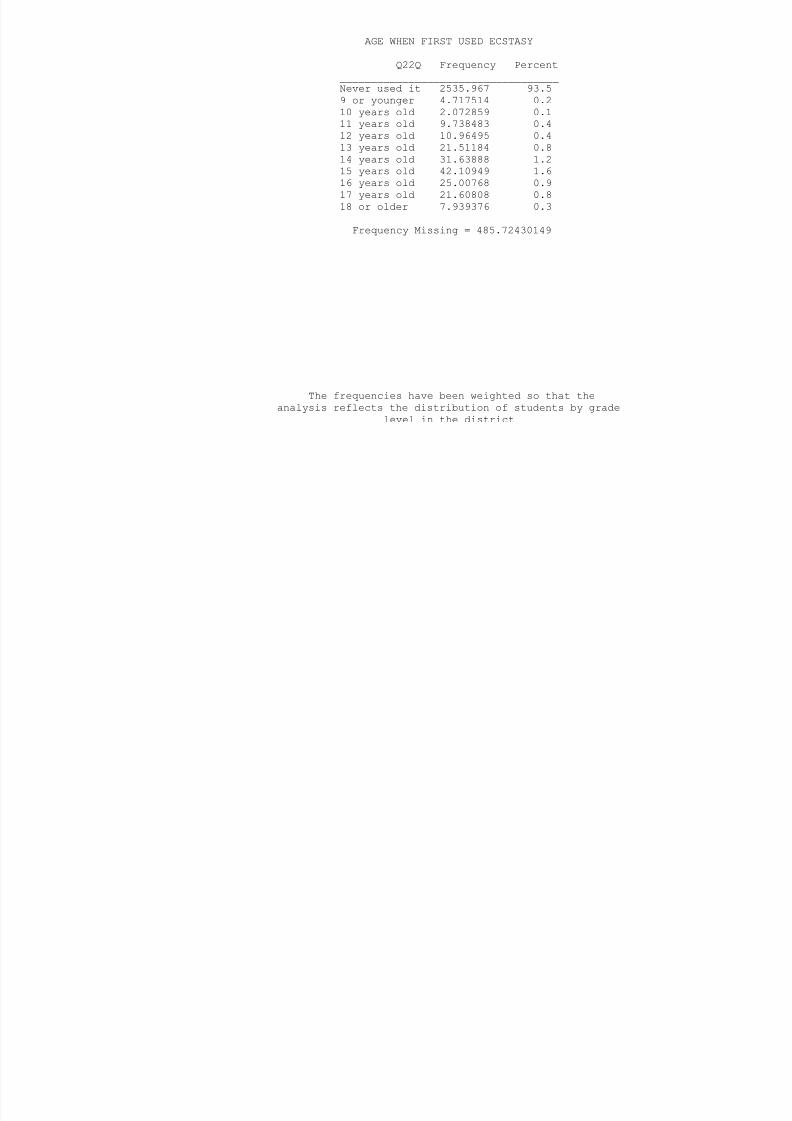
8/14/2019 BRAZORIA COUNTY - Alvin ISD - 1998 Texas School Survey of Drug and Alcohol Use
http://slidepdf.com/reader/full/brazoria-county-alvin-isd-1998-texas-school-survey-of-drug-and-alcohol 171/213
12 years old 10.96495 0.413 years old 21.51184 0.814 years old 31.63888 1.215 years old 42.10949 1.616 years old 25.00768 0.917 years old 21.60808 0.818 or older 7.939376 0.3
Frequency Missing = 485.72430149
The frequencies have been weighted so that theanalysis reflects the distribution of students by grade
level in the district
AlvinSpring 1998
AGE WHEN FIRST USED HEROIN
Q22R Frequency Percent___________________________________Never used it 2653.949 97.2

8/14/2019 BRAZORIA COUNTY - Alvin ISD - 1998 Texas School Survey of Drug and Alcohol Use
http://slidepdf.com/reader/full/brazoria-county-alvin-isd-1998-texas-school-survey-of-drug-and-alcohol 172/213
9 or younger 2.906983 0.110 years old 3.935533 0.111 years old 4.186438 0.212 years old 9.457904 0.313 years old 14.88944 0.514 years old 17.0892 0.615 years old 12.33015 0.516 years old 9.378115 0.317 years old 1.907323 0.118 or older 0.9199 0.0
Frequency Missing = 468.05013958
HOW OFTEN NORMALLY USE CIGARETTES
Q23A Frequency Percent______________________________________Every day 385.4232 12.8Several times/wk 186.3679 6.2Several times/mo 259.8204 8.6About once/month 306.9388 10.2About once/year 213.2726 7.1< once/year 333.9235 11.1
Never used 1318.536 43.9
Frequency Missing = 194.71717654
HOW OFTEN NORMALLY USESMOKELESS TOBACCO
Q23B Frequency Percent
______________________________________Every day 55.23783 2.0Several times/wk 43.10631 1.6Several times/mo 63.11692 2.3About once/month 96.41367 3.5About once/year 76.13502 2.7< once/year 181.0933 6.5Never used 2261.276 81.4
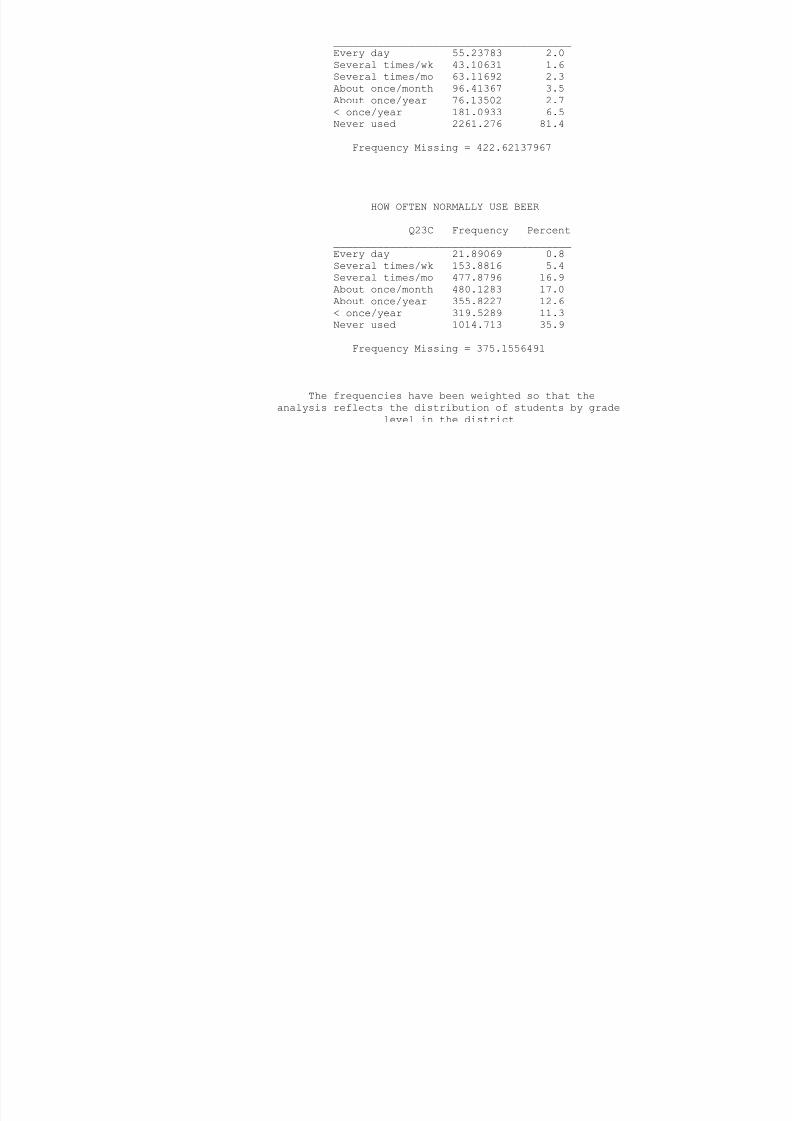
8/14/2019 BRAZORIA COUNTY - Alvin ISD - 1998 Texas School Survey of Drug and Alcohol Use
http://slidepdf.com/reader/full/brazoria-county-alvin-isd-1998-texas-school-survey-of-drug-and-alcohol 173/213
Frequency Missing = 422.62137967
HOW OFTEN NORMALLY USE BEER
Q23C Frequency Percent______________________________________Every day 21.89069 0.8Several times/wk 153.8816 5.4Several times/mo 477.8796 16.9About once/month 480.1283 17.0
About once/year 355.8227 12.6< once/year 319.5289 11.3Never used 1014.713 35.9
Frequency Missing = 375.1556491
The frequencies have been weighted so that the
analysis reflects the distribution of students by gradelevel in the district
AlvinSpring 1998
HOW OFTEN NORMALLY USE WINE COOLERS
Q23D Frequency Percent______________________________________Every day 8.919332 0.3
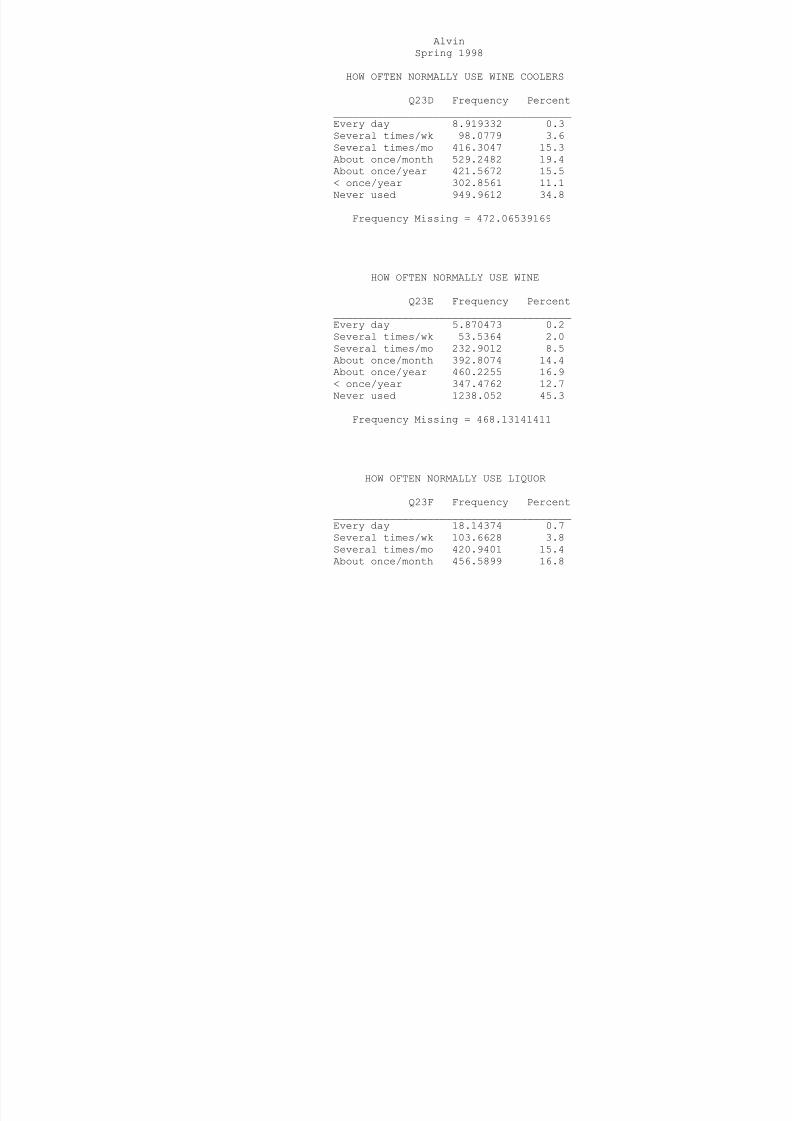
8/14/2019 BRAZORIA COUNTY - Alvin ISD - 1998 Texas School Survey of Drug and Alcohol Use
http://slidepdf.com/reader/full/brazoria-county-alvin-isd-1998-texas-school-survey-of-drug-and-alcohol 174/213
Several times/wk 98.0779 3.6Several times/mo 416.3047 15.3About once/month 529.2482 19.4About once/year 421.5672 15.5< once/year 302.8561 11.1Never used 949.9612 34.8
Frequency Missing = 472.06539169
HOW OFTEN NORMALLY USE WINE
Q23E Frequency Percent______________________________________Every day 5.870473 0.2Several times/wk 53.5364 2.0Several times/mo 232.9012 8.5About once/month 392.8074 14.4About once/year 460.2255 16.9< once/year 347.4762 12.7Never used 1238.052 45.3
Frequency Missing = 468.13141411
HOW OFTEN NORMALLY USE LIQUOR
Q23F Frequency Percent______________________________________Every day 18.14374 0.7Several times/wk 103.6628 3.8Several times/mo 420.9401 15.4About once/month 456.5899 16.8
About once/year 318.2418 11.7< once/year 245.7482 9.0Never used 1162.184 42.6
Frequency Missing = 473.48932491

8/14/2019 BRAZORIA COUNTY - Alvin ISD - 1998 Texas School Survey of Drug and Alcohol Use
http://slidepdf.com/reader/full/brazoria-county-alvin-isd-1998-texas-school-survey-of-drug-and-alcohol 175/213
HOW OFTEN NORMALLY USE INHALANTS
Q23G Frequency Percent______________________________________Every day 11.64581 0.4Several times/wk 25.29012 0.9Several times/mo 40.91009 1.4About once/month 93.16308 3.2About once/year 84.41903 2.9< once/year 150.4586 5.2Never used 2465.667 85.9
Frequency Missing = 327.44646692
The frequencies have been weighted so that theanalysis reflects the distribution of students by grade
level in the district
AlvinSpring 1998
HOW OFTEN NORMALLY USE MARIJUANA
Q23H Frequency Percent______________________________________Every day 102.2792 4.0S l ti / k 128 1114 5 0

8/14/2019 BRAZORIA COUNTY - Alvin ISD - 1998 Texas School Survey of Drug and Alcohol Use
http://slidepdf.com/reader/full/brazoria-county-alvin-isd-1998-texas-school-survey-of-drug-and-alcohol 176/213
Several times/wk 128.1114 5.0Several times/mo 189.6591 7.4About once/month 224.0505 8.7
About once/year 170.272 6.6< once/year 183.7034 7.1Never used 1572.552 61.2
Frequency Missing = 628.37209755
HOW OFTEN NORMALLY USE COCAINE
Q23I Frequency Percent______________________________________Every day 6.247437 0.2Several times/wk 17.76675 0.7Several times/mo 51.32329 2.0About once/month 74.87858 2.9About once/year 62.62069 2.4< once/year 64.63829 2.5Never used 2314.022 89.3
Frequency Missing = 607.50285576
HOW OFTEN NORMALLY USE CRACK
Q23J Frequency Percent______________________________________Every day 4.145311 0.2Several times/wk 6.105591 0.2Several times/mo 16.82319 0.7About once/month 22.71438 0.9
About once/year 17.63731 0.7< once/year 22.21798 0.9Never used 2425.251 96.4
Frequency Missing = 684.10536063
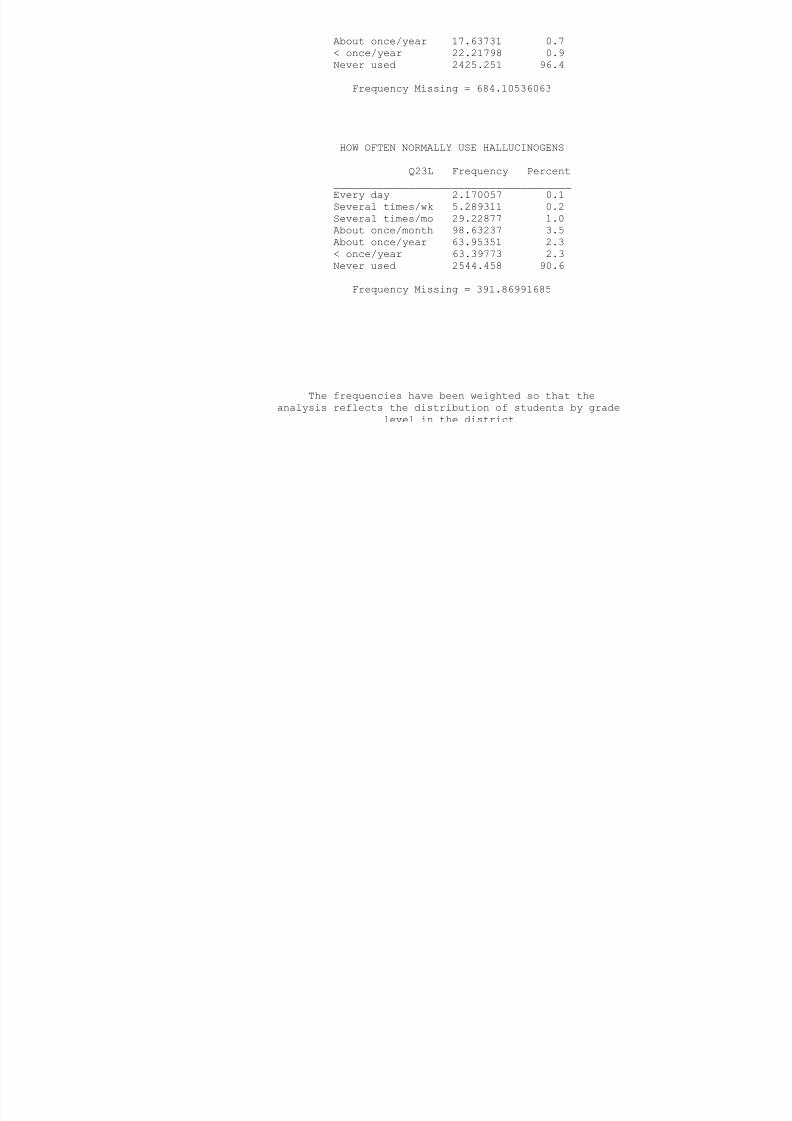
8/14/2019 BRAZORIA COUNTY - Alvin ISD - 1998 Texas School Survey of Drug and Alcohol Use
http://slidepdf.com/reader/full/brazoria-county-alvin-isd-1998-texas-school-survey-of-drug-and-alcohol 177/213
HOW OFTEN NORMALLY USE HALLUCINOGENS
Q23L Frequency Percent______________________________________Every day 2.170057 0.1Several times/wk 5.289311 0.2Several times/mo 29.22877 1.0About once/month 98.63237 3.5About once/year 63.95351 2.3< once/year 63.39773 2.3Never used 2544.458 90.6
Frequency Missing = 391.86991685
The frequencies have been weighted so that theanalysis reflects the distribution of students by grade
level in the district
AlvinSpring 1998
HOW OFTEN NORMALLY USE UPPERS
Q23M Frequency Percent______________________________________Every day 7.990038 0.3Several times/wk 18 22746 0 7
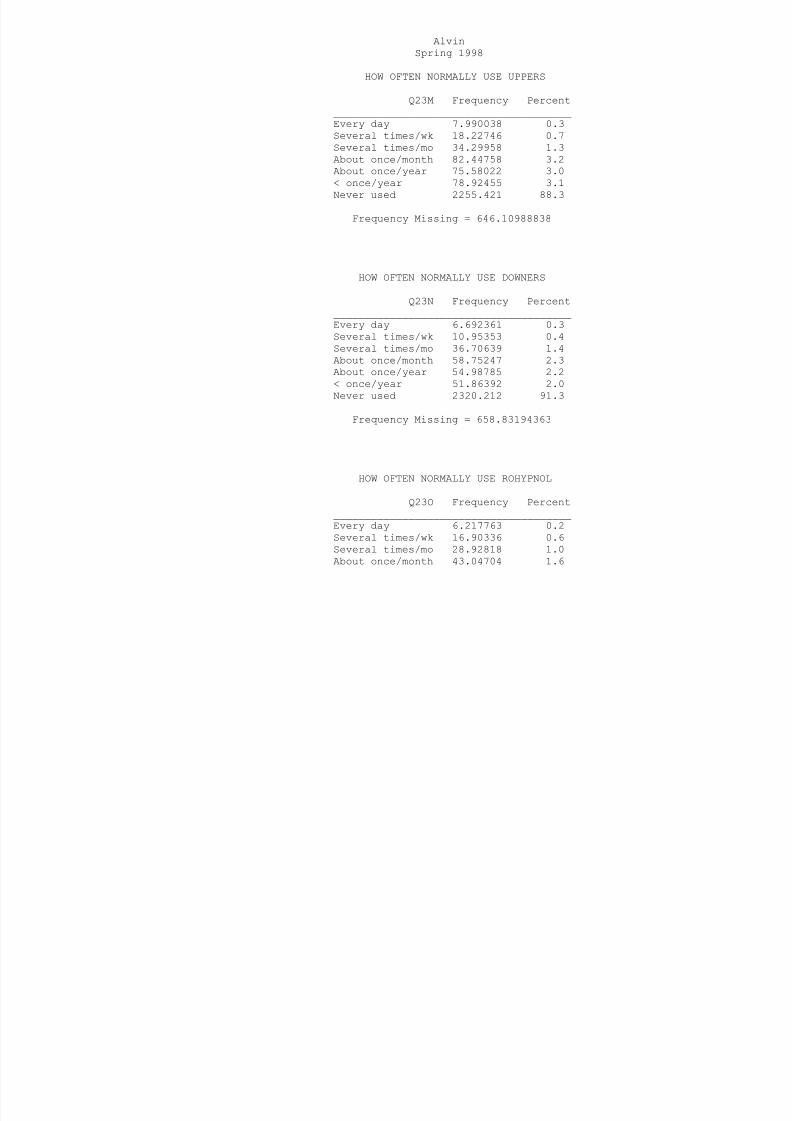
8/14/2019 BRAZORIA COUNTY - Alvin ISD - 1998 Texas School Survey of Drug and Alcohol Use
http://slidepdf.com/reader/full/brazoria-county-alvin-isd-1998-texas-school-survey-of-drug-and-alcohol 178/213
Several times/wk 18.22746 0.7Several times/mo 34.29958 1.3About once/month 82.44758 3.2
About once/year 75.58022 3.0< once/year 78.92455 3.1Never used 2255.421 88.3
Frequency Missing = 646.10988838
HOW OFTEN NORMALLY USE DOWNERS
Q23N Frequency Percent______________________________________Every day 6.692361 0.3Several times/wk 10.95353 0.4Several times/mo 36.70639 1.4About once/month 58.75247 2.3About once/year 54.98785 2.2< once/year 51.86392 2.0Never used 2320.212 91.3
Frequency Missing = 658.83194363
HOW OFTEN NORMALLY USE ROHYPNOL
Q23O Frequency Percent______________________________________Every day 6.217763 0.2Several times/wk 16.90336 0.6Several times/mo 28.92818 1.0About once/month 43.04704 1.6
About once/year 40.80066 1.5< once/year 40.26292 1.5Never used 2594.758 93.6
Frequency Missing = 428.08164756

8/14/2019 BRAZORIA COUNTY - Alvin ISD - 1998 Texas School Survey of Drug and Alcohol Use
http://slidepdf.com/reader/full/brazoria-county-alvin-isd-1998-texas-school-survey-of-drug-and-alcohol 179/213
HOW OFTEN NORMALLY USE STEROIDS
Q23P Frequency Percent______________________________________Every day 9.93288 0.4Several times/wk 3.060282 0.1Several times/mo 12.04318 0.5About once/month 6.79243 0.3About once/year 13.02517 0.5< once/year 27.04333 1.1Never used 2355.529 97.0
Frequency Missing = 771.57392958
The frequencies have been weighted so that theanalysis reflects the distribution of students by grade
level in the district
AlvinSpring 1998
HOW OFTEN NORMALLY USE ECSTASY
Q23Q Frequency Percent______________________________________Every day 2.072859 0.1Several times/wk 8 057968 0 3
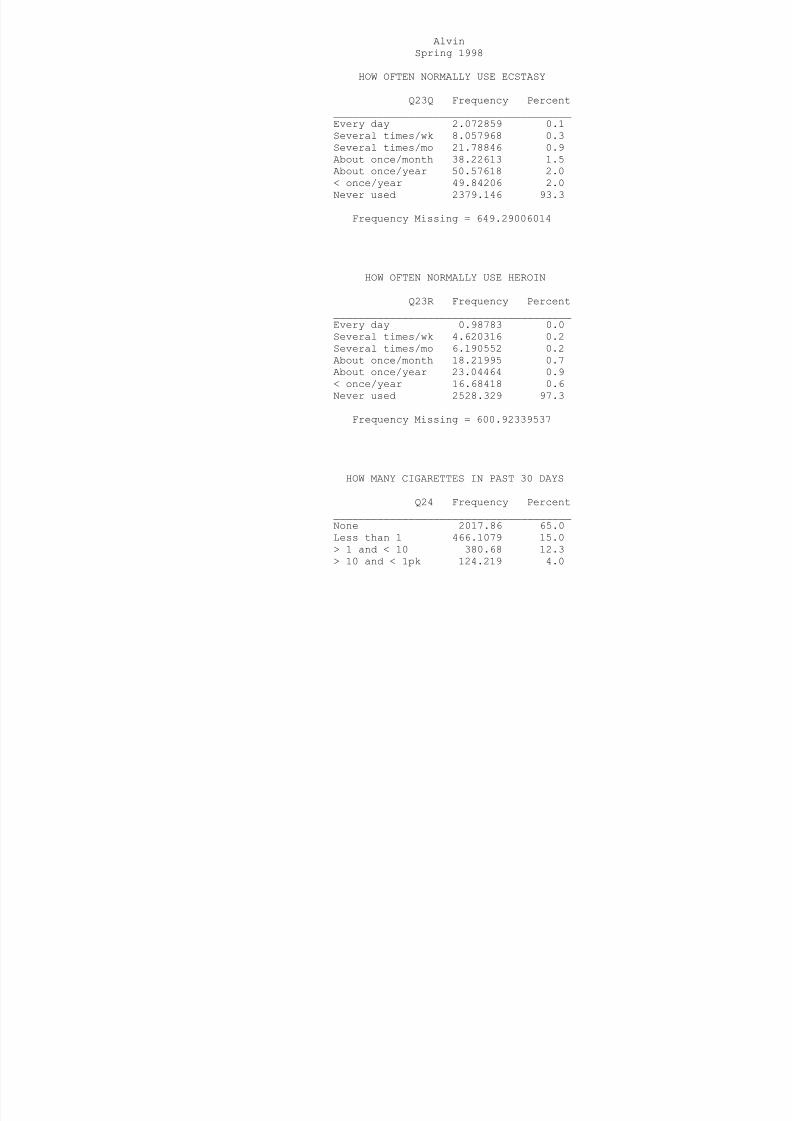
8/14/2019 BRAZORIA COUNTY - Alvin ISD - 1998 Texas School Survey of Drug and Alcohol Use
http://slidepdf.com/reader/full/brazoria-county-alvin-isd-1998-texas-school-survey-of-drug-and-alcohol 180/213
Several times/wk 8.057968 0.3Several times/mo 21.78846 0.9About once/month 38.22613 1.5
About once/year 50.57618 2.0< once/year 49.84206 2.0Never used 2379.146 93.3
Frequency Missing = 649.29006014
HOW OFTEN NORMALLY USE HEROIN
Q23R Frequency Percent______________________________________Every day 0.98783 0.0Several times/wk 4.620316 0.2Several times/mo 6.190552 0.2About once/month 18.21995 0.7About once/year 23.04464 0.9< once/year 16.68418 0.6Never used 2528.329 97.3
Frequency Missing = 600.92339537
HOW MANY CIGARETTES IN PAST 30 DAYS
Q24 Frequency Percent______________________________________None 2017.86 65.0Less than 1 466.1079 15.0> 1 and < 10 380.68 12.3> 10 and < 1pk 124.219 4.0
> 1pk and < 2pks 88.25985 2.8More than 2pks 27.33615 0.9
Frequency Missing = 94.53718252
AMOUNT OF BEER AT ONE TIME
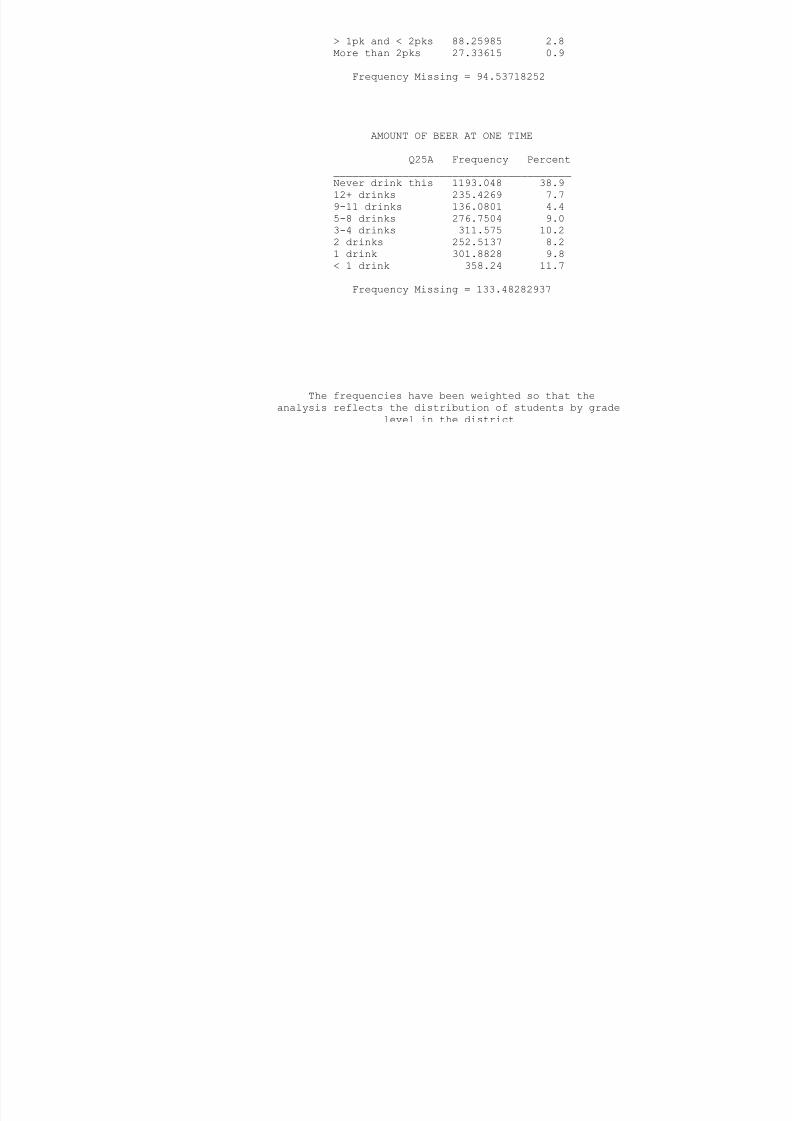
8/14/2019 BRAZORIA COUNTY - Alvin ISD - 1998 Texas School Survey of Drug and Alcohol Use
http://slidepdf.com/reader/full/brazoria-county-alvin-isd-1998-texas-school-survey-of-drug-and-alcohol 181/213
AMOUNT OF BEER AT ONE TIME
Q25A Frequency Percent
______________________________________Never drink this 1193.048 38.912+ drinks 235.4269 7.79-11 drinks 136.0801 4.45-8 drinks 276.7504 9.03-4 drinks 311.575 10.22 drinks 252.5137 8.21 drink 301.8828 9.8< 1 drink 358.24 11.7
Frequency Missing = 133.48282937
The frequencies have been weighted so that theanalysis reflects the distribution of students by grade
level in the district
AlvinSpring 1998
AMOUNT OF WINE COOLERS AT ONE TIME
Q25B Frequency Percent______________________________________Never drink this 1077.44 36.112+ drinks 206 1807 6 9
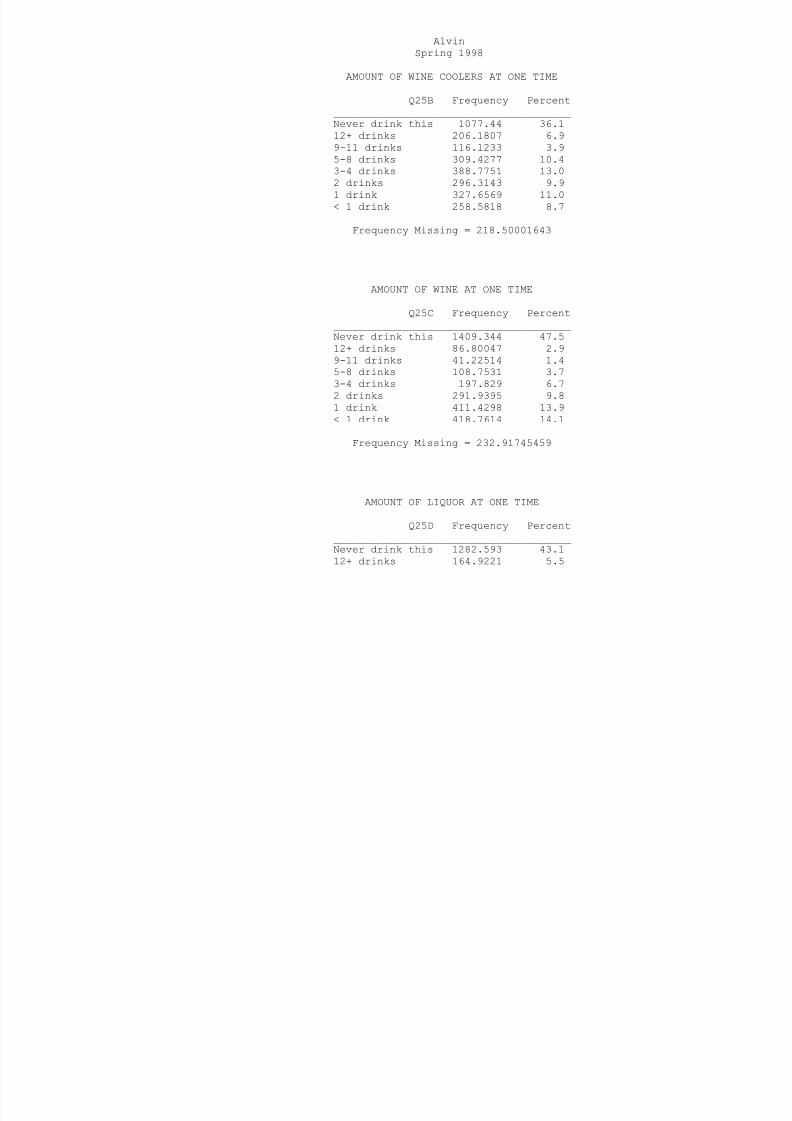
8/14/2019 BRAZORIA COUNTY - Alvin ISD - 1998 Texas School Survey of Drug and Alcohol Use
http://slidepdf.com/reader/full/brazoria-county-alvin-isd-1998-texas-school-survey-of-drug-and-alcohol 182/213
12+ drinks 206.1807 6.99-11 drinks 116.1233 3.95-8 drinks 309.4277 10.4
3-4 drinks 388.7751 13.02 drinks 296.3143 9.91 drink 327.6569 11.0< 1 drink 258.5818 8.7
Frequency Missing = 218.50001643
AMOUNT OF WINE AT ONE TIME
Q25C Frequency Percent______________________________________Never drink this 1409.344 47.512+ drinks 86.80047 2.99-11 drinks 41.22514 1.45-8 drinks 108.7531 3.73-4 drinks 197.829 6.72 drinks 291.9395 9.81 drink 411.4298 13.9< 1 drink 418.7614 14.1
Frequency Missing = 232.91745459
AMOUNT OF LIQUOR AT ONE TIME
Q25D Frequency Percent______________________________________Never drink this 1282.593 43.112+ drinks 164.9221 5.5
9-11 drinks 77.93491 2.65-8 drinks 293.3169 9.93-4 drinks 375.8498 12.62 drinks 231.0284 7.81 drink 258.3458 8.7< 1 drink 290.0579 9.8
Frequency Missing = 224.95100323
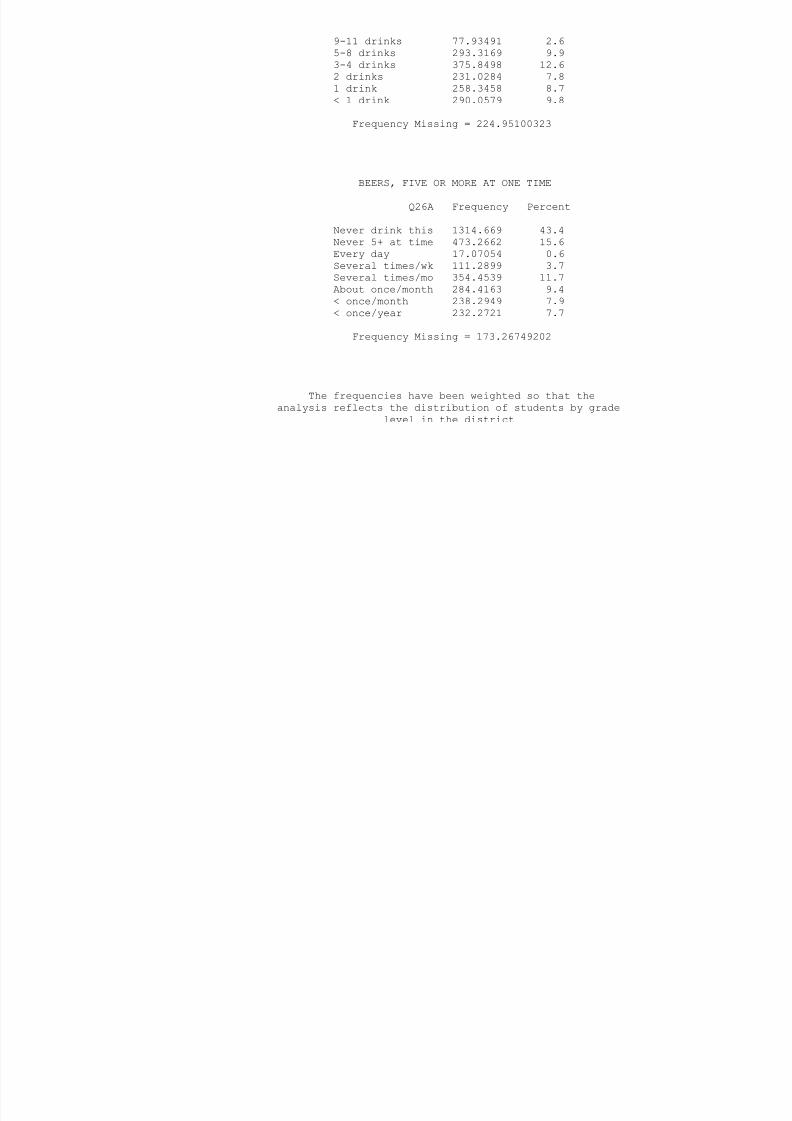
8/14/2019 BRAZORIA COUNTY - Alvin ISD - 1998 Texas School Survey of Drug and Alcohol Use
http://slidepdf.com/reader/full/brazoria-county-alvin-isd-1998-texas-school-survey-of-drug-and-alcohol 183/213
BEERS, FIVE OR MORE AT ONE TIME
Q26A Frequency Percent______________________________________Never drink this 1314.669 43.4Never 5+ at time 473.2662 15.6Every day 17.07054 0.6Several times/wk 111.2899 3.7Several times/mo 354.4539 11.7About once/month 284.4163 9.4< once/month 238.2949 7.9< once/year 232.2721 7.7
Frequency Missing = 173.26749202
The frequencies have been weighted so that the
analysis reflects the distribution of students by gradelevel in the district
AlvinSpring 1998
WINE COOLERS, FIVE OR MORE AT ONE TIME
Q26B Frequency Percent______________________________________Never drink this 1224.063 41.3Never 5+ at time 433.991 14.6
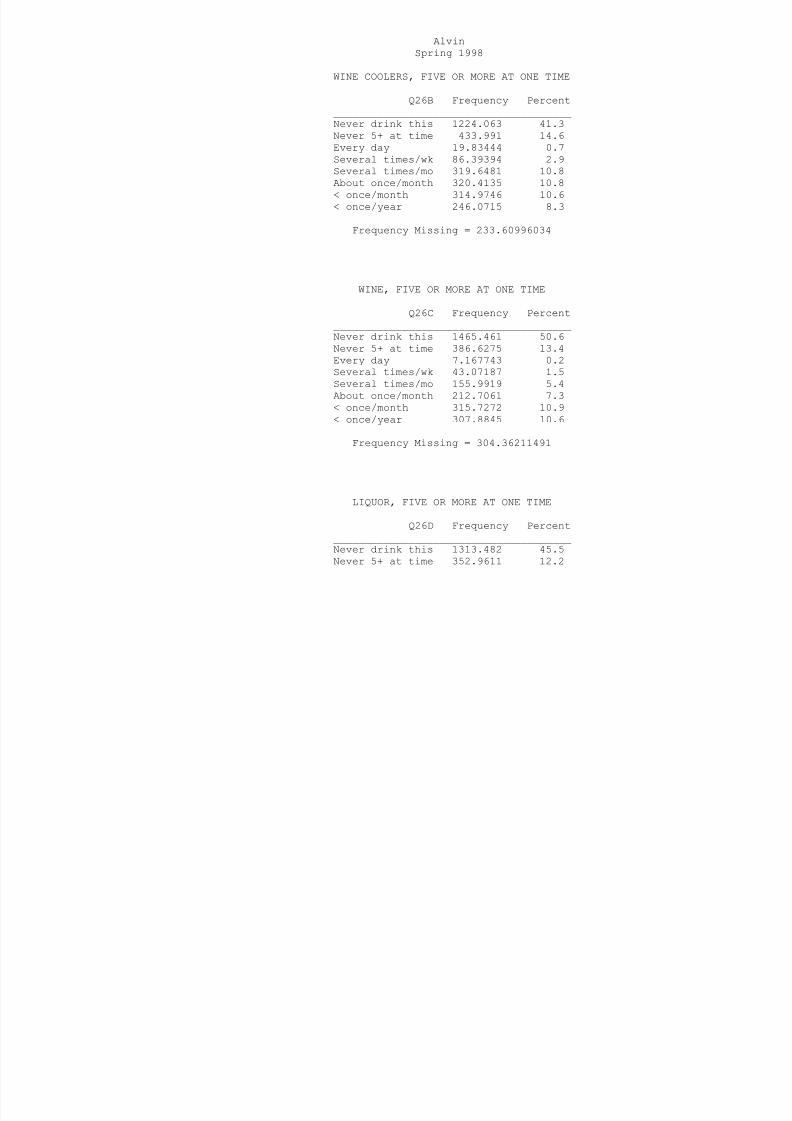
8/14/2019 BRAZORIA COUNTY - Alvin ISD - 1998 Texas School Survey of Drug and Alcohol Use
http://slidepdf.com/reader/full/brazoria-county-alvin-isd-1998-texas-school-survey-of-drug-and-alcohol 184/213
Every day 19.83444 0.7Several times/wk 86.39394 2.9
Several times/mo 319.6481 10.8About once/month 320.4135 10.8< once/month 314.9746 10.6< once/year 246.0715 8.3
Frequency Missing = 233.60996034
WINE, FIVE OR MORE AT ONE TIME
Q26C Frequency Percent______________________________________Never drink this 1465.461 50.6Never 5+ at time 386.6275 13.4Every day 7.167743 0.2Several times/wk 43.07187 1.5Several times/mo 155.9919 5.4About once/month 212.7061 7.3< once/month 315.7272 10.9< once/year 307.8845 10.6
Frequency Missing = 304.36211491
LIQUOR, FIVE OR MORE AT ONE TIME
Q26D Frequency Percent______________________________________Never drink this 1313.482 45.5Never 5+ at time 352.9611 12.2
Every day 19.14627 0.7Several times/wk 95.73927 3.3Several times/mo 315.1692 10.9About once/month 313.8007 10.9< once/month 269.7677 9.3< once/year 205.9996 7.1
Frequency Missing = 312.93448015
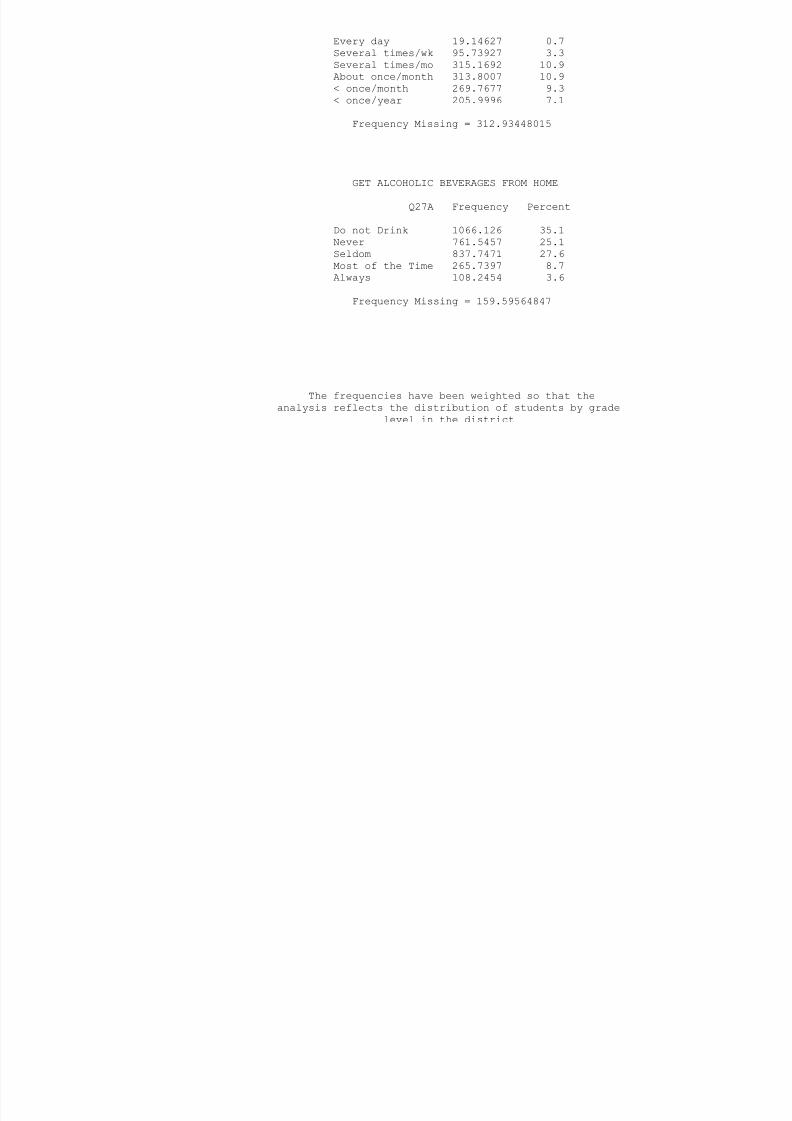
8/14/2019 BRAZORIA COUNTY - Alvin ISD - 1998 Texas School Survey of Drug and Alcohol Use
http://slidepdf.com/reader/full/brazoria-county-alvin-isd-1998-texas-school-survey-of-drug-and-alcohol 185/213
GET ALCOHOLIC BEVERAGES FROM HOME
Q27A Frequency Percent______________________________________Do not Drink 1066.126 35.1Never 761.5457 25.1Seldom 837.7471 27.6Most of the Time 265.7397 8.7Always 108.2454 3.6
Frequency Missing = 159.59564847
The frequencies have been weighted so that theanalysis reflects the distribution of students by grade
level in the district
AlvinSpring 1998
GET ALCOHOLIC BEVERAGES FROM FRIENDS
Q27B Frequency Percent______________________________________Do not Drink 872.4049 29.5Never 395.0902 13.3
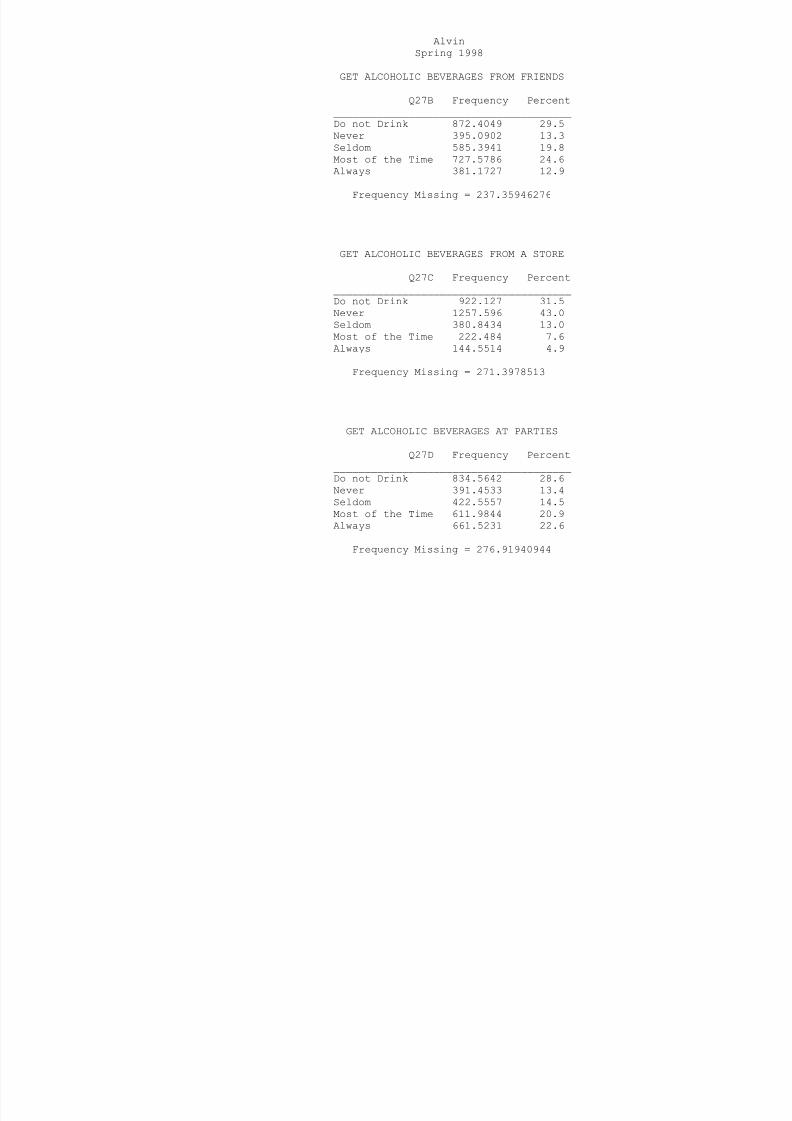
8/14/2019 BRAZORIA COUNTY - Alvin ISD - 1998 Texas School Survey of Drug and Alcohol Use
http://slidepdf.com/reader/full/brazoria-county-alvin-isd-1998-texas-school-survey-of-drug-and-alcohol 186/213
Seldom 585.3941 19.8Most of the Time 727.5786 24.6
Always 381.1727 12.9
Frequency Missing = 237.35946276
GET ALCOHOLIC BEVERAGES FROM A STORE
Q27C Frequency Percent______________________________________Do not Drink 922.127 31.5Never 1257.596 43.0Seldom 380.8434 13.0Most of the Time 222.484 7.6Always 144.5514 4.9
Frequency Missing = 271.3978513
GET ALCOHOLIC BEVERAGES AT PARTIES
Q27D Frequency Percent______________________________________Do not Drink 834.5642 28.6Never 391.4533 13.4Seldom 422.5557 14.5Most of the Time 611.9844 20.9Always 661.5231 22.6
Frequency Missing = 276.91940944
GET ALCOHOLIC BEVERAGES FROM OTHER
Q27E Frequency Percent______________________________________Do not Drink 907.1344 31.9Never 660.6643 23.2
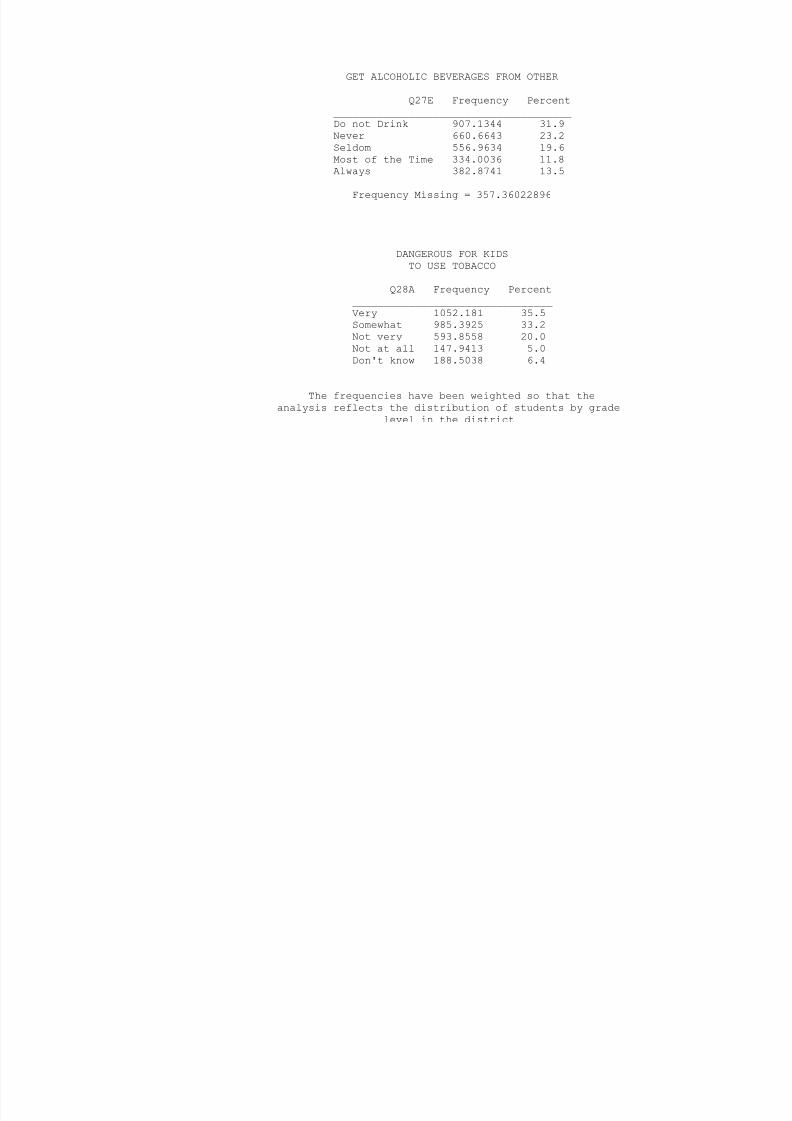
8/14/2019 BRAZORIA COUNTY - Alvin ISD - 1998 Texas School Survey of Drug and Alcohol Use
http://slidepdf.com/reader/full/brazoria-county-alvin-isd-1998-texas-school-survey-of-drug-and-alcohol 187/213
Seldom 556.9634 19.6Most of the Time 334.0036 11.8
Always 382.8741 13.5
Frequency Missing = 357.36022896
DANGEROUS FOR KIDSTO USE TOBACCO
Q28A Frequency Percent
________________________________Very 1052.181 35.5Somewhat 985.3925 33.2Not very 593.8558 20.0Not at all 147.9413 5.0Don't know 188.5038 6.4
The frequencies have been weighted so that theanalysis reflects the distribution of students by grade
level in the district
AlvinSpring 1998
Frequency Missing = 231.12562432
DANGEROUS FOR KIDS
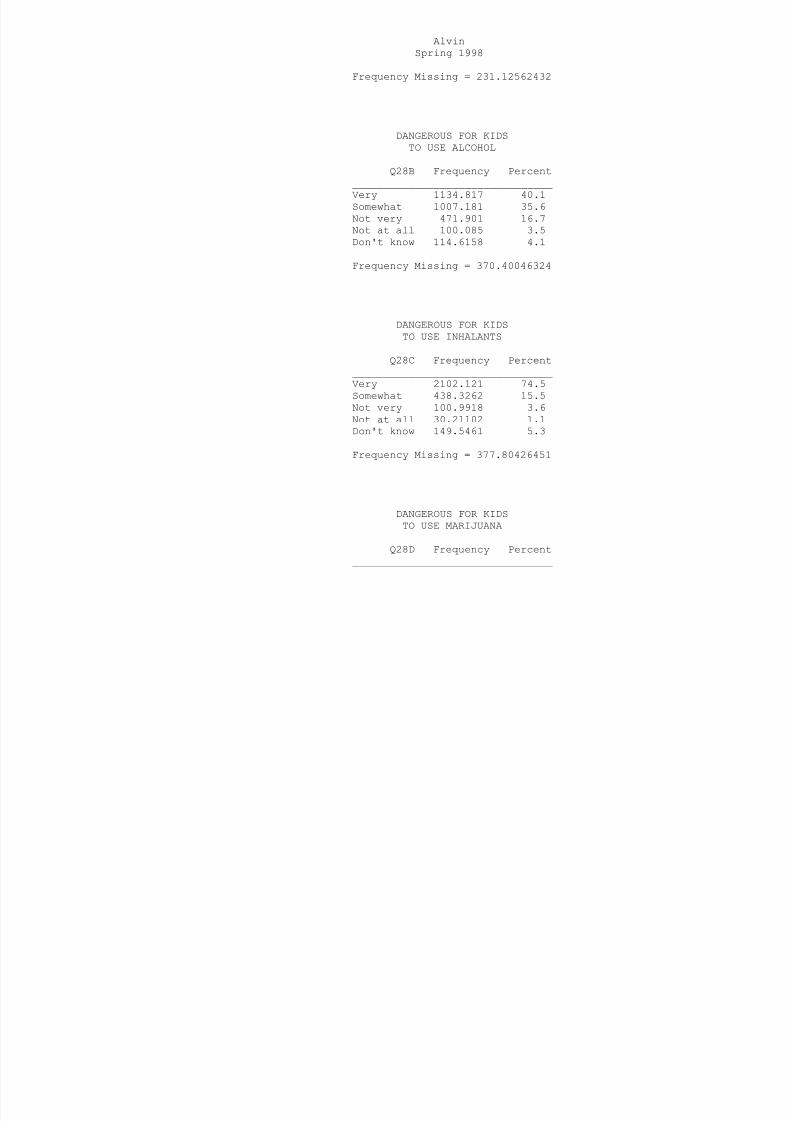
8/14/2019 BRAZORIA COUNTY - Alvin ISD - 1998 Texas School Survey of Drug and Alcohol Use
http://slidepdf.com/reader/full/brazoria-county-alvin-isd-1998-texas-school-survey-of-drug-and-alcohol 188/213
TO USE ALCOHOL
Q28B Frequency Percent________________________________Very 1134.817 40.1Somewhat 1007.181 35.6Not very 471.901 16.7Not at all 100.085 3.5Don't know 114.6158 4.1
Frequency Missing = 370.40046324
DANGEROUS FOR KIDSTO USE INHALANTS
Q28C Frequency Percent
________________________________Very 2102.121 74.5Somewhat 438.3262 15.5Not very 100.9918 3.6Not at all 30.21102 1.1Don't know 149.5461 5.3
Frequency Missing = 377.80426451
DANGEROUS FOR KIDSTO USE MARIJUANA
Q28D Frequency Percent
________________________________
Very 1550.675 56.2Somewhat 576.2663 20.9Not very 319.0032 11.6Not at all 208.3863 7.6Don't know 102.7568 3.7
Frequency Missing = 441.9123433
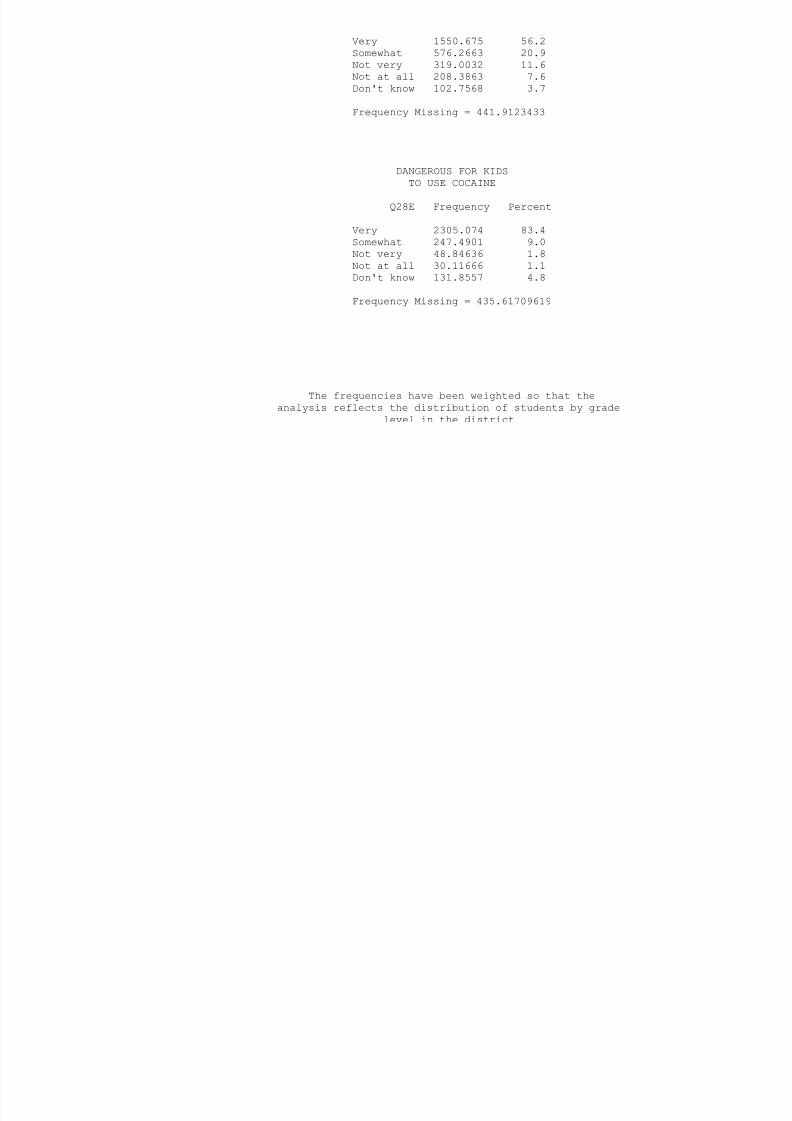
8/14/2019 BRAZORIA COUNTY - Alvin ISD - 1998 Texas School Survey of Drug and Alcohol Use
http://slidepdf.com/reader/full/brazoria-county-alvin-isd-1998-texas-school-survey-of-drug-and-alcohol 189/213
DANGEROUS FOR KIDSTO USE COCAINE
Q28E Frequency Percent
________________________________Very 2305.074 83.4Somewhat 247.4901 9.0Not very 48.84636 1.8Not at all 30.11666 1.1Don't know 131.8557 4.8
Frequency Missing = 435.61709619
The frequencies have been weighted so that theanalysis reflects the distribution of students by grade
level in the district
AlvinSpring 1998
DANGEROUS FOR KIDS TO USE CRACK
Q28F Frequency Percent________________________________Very 2321.335 86.7Somewhat 169.3384 6.3
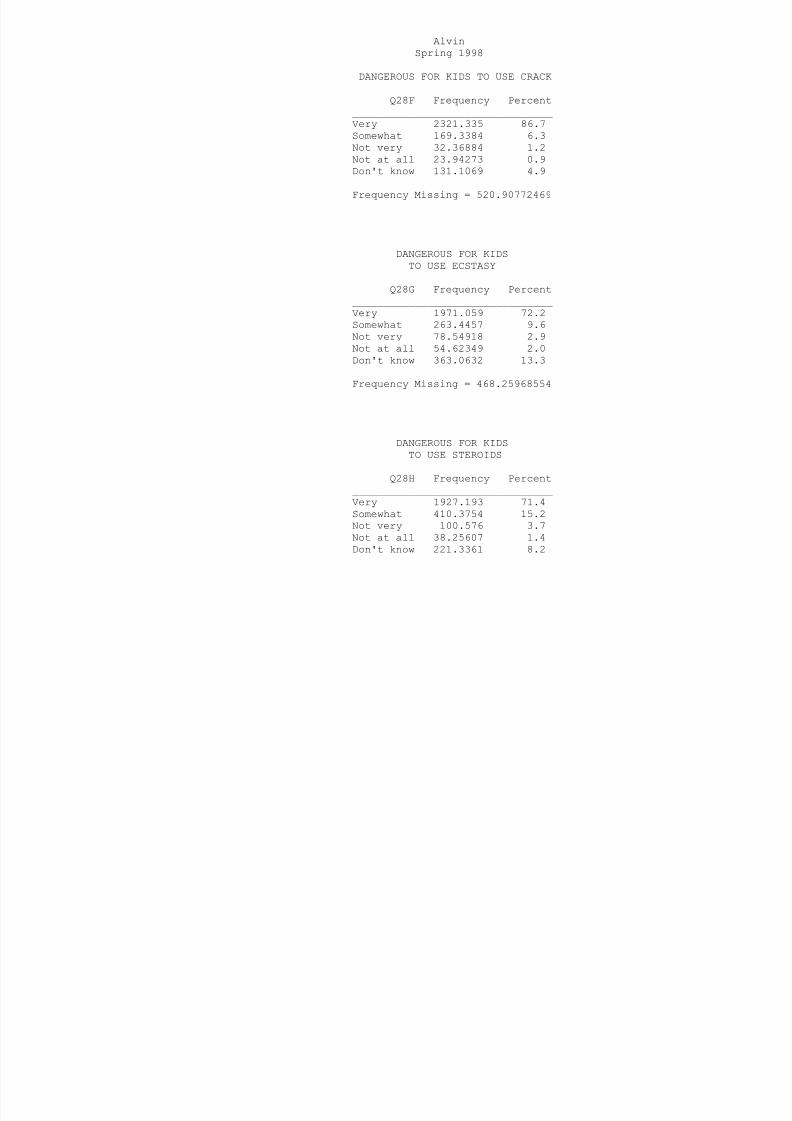
8/14/2019 BRAZORIA COUNTY - Alvin ISD - 1998 Texas School Survey of Drug and Alcohol Use
http://slidepdf.com/reader/full/brazoria-county-alvin-isd-1998-texas-school-survey-of-drug-and-alcohol 190/213
Not very 32.36884 1.2Not at all 23.94273 0.9
Don't know 131.1069 4.9
Frequency Missing = 520.90772469
DANGEROUS FOR KIDSTO USE ECSTASY
Q28G Frequency Percent
________________________________Very 1971.059 72.2Somewhat 263.4457 9.6Not very 78.54918 2.9Not at all 54.62349 2.0Don't know 363.0632 13.3
Frequency Missing = 468.25968554
DANGEROUS FOR KIDSTO USE STEROIDS
Q28H Frequency Percent________________________________Very 1927.193 71.4Somewhat 410.3754 15.2Not very 100.576 3.7Not at all 38.25607 1.4Don't know 221.3361 8.2
Frequency Missing = 501.26378495
DANGEROUS FOR KIDS TO USE HEROIN
Q28I Frequency Percent________________________________
2435 551 87 2
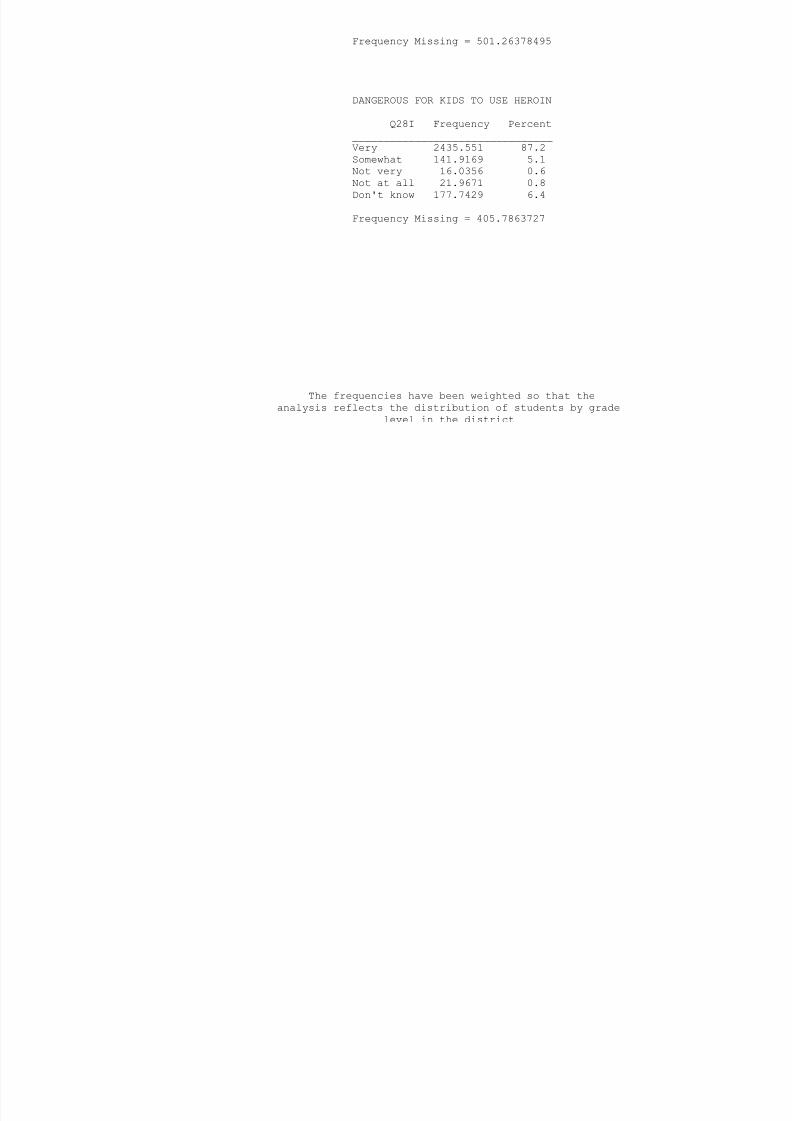
8/14/2019 BRAZORIA COUNTY - Alvin ISD - 1998 Texas School Survey of Drug and Alcohol Use
http://slidepdf.com/reader/full/brazoria-county-alvin-isd-1998-texas-school-survey-of-drug-and-alcohol 191/213
Very 2435.551 87.2Somewhat 141.9169 5.1
Not very 16.0356 0.6Not at all 21.9671 0.8Don't know 177.7429 6.4
Frequency Missing = 405.7863727
The frequencies have been weighted so that theanalysis reflects the distribution of students by grade
level in the district
AlvinSpring 1998
USE MARIJUANA AS JOINTS
Q29A Frequency Percent______________________________________Never 1451.781 64.3Seldom 242.0049 10.7H lf th ti 144 9041 6 4

8/14/2019 BRAZORIA COUNTY - Alvin ISD - 1998 Texas School Survey of Drug and Alcohol Use
http://slidepdf.com/reader/full/brazoria-county-alvin-isd-1998-texas-school-survey-of-drug-and-alcohol 192/213
Half the time 144.9041 6.4Most of the time 238.9346 10.6
Always 158.6075 7.0Don't know 21.26137 0.9
Frequency Missing = 941.5065025
USE MARIJUANA AS BLUNTS
Q29B Frequency Percent______________________________________Never 1628.038 74.6Seldom 269.3985 12.3Half the time 101.3521 4.6Most of the time 71.68761 3.3Always 74.31655 3.4Don't know 38.04613 1.7
Frequency Missing = 1016.1608657
USE MARIJUANA IN BONGS OR WATER PIPES
Q29C Frequency Percent______________________________________Never 1639.996 74.6Seldom 225.8845 10.3Half the time 131.104 6.0Most of the time 101.9051 4.6Always 82.96376 3.8Don't know 17.83554 0.8
Frequency Missing = 999.31125193
USE MARIJUANA IN PIPES
Q29D Frequency Percent
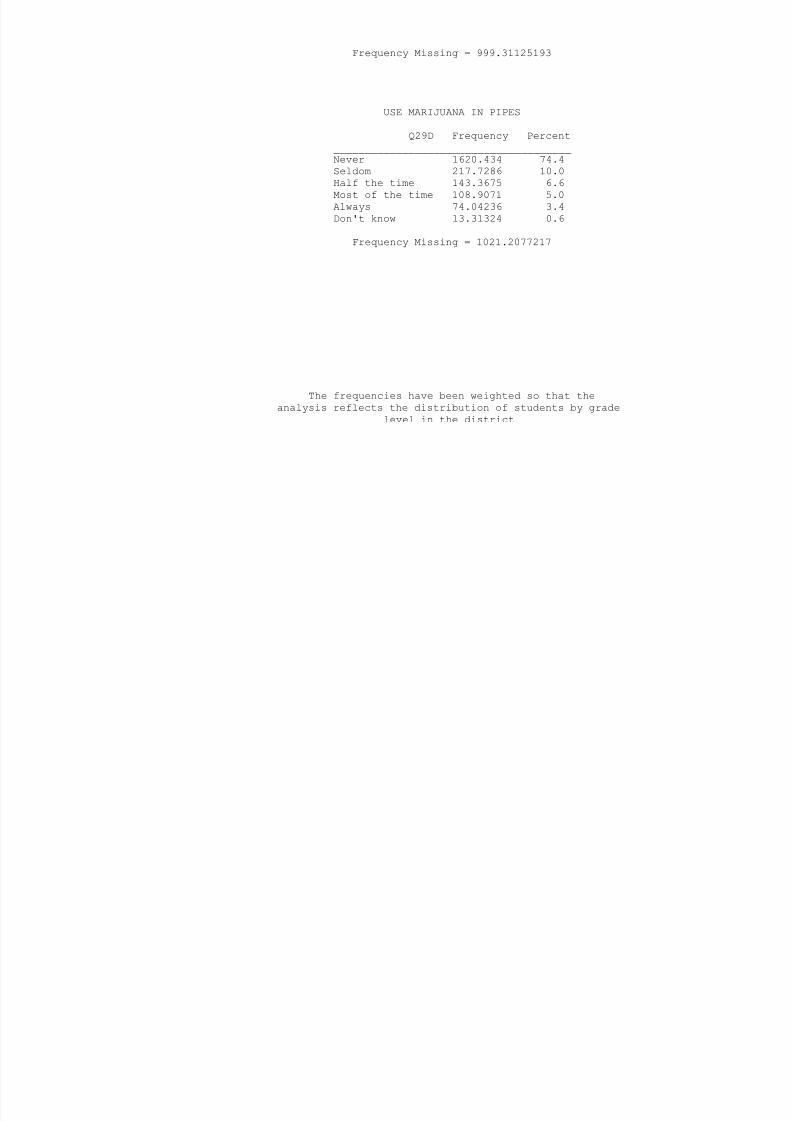
8/14/2019 BRAZORIA COUNTY - Alvin ISD - 1998 Texas School Survey of Drug and Alcohol Use
http://slidepdf.com/reader/full/brazoria-county-alvin-isd-1998-texas-school-survey-of-drug-and-alcohol 193/213
______________________________________Never 1620.434 74.4
Seldom 217.7286 10.0Half the time 143.3675 6.6Most of the time 108.9071 5.0Always 74.04236 3.4Don't know 13.31324 0.6
Frequency Missing = 1021.2077217
The frequencies have been weighted so that theanalysis reflects the distribution of students by grade
level in the district
AlvinSpring 1998
USE MARIJUANA OTHER WAYS
Q29E Frequency Percent______________________________________Never 1767.537 80.6Seldom 207.3376 9.5Half the time 53 60538 2 4
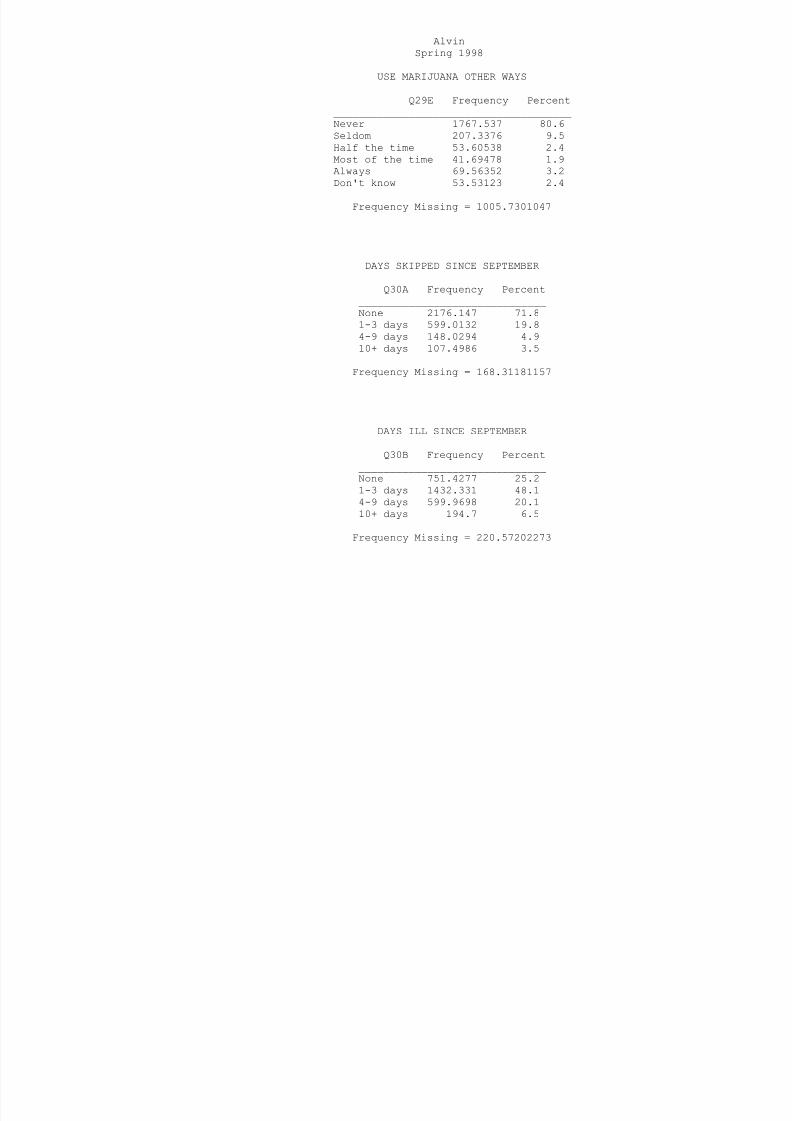
8/14/2019 BRAZORIA COUNTY - Alvin ISD - 1998 Texas School Survey of Drug and Alcohol Use
http://slidepdf.com/reader/full/brazoria-county-alvin-isd-1998-texas-school-survey-of-drug-and-alcohol 194/213
Half the time 53.60538 2.4Most of the time 41.69478 1.9
Always 69.56352 3.2Don't know 53.53123 2.4
Frequency Missing = 1005.7301047
DAYS SKIPPED SINCE SEPTEMBER
Q30A Frequency Percent______________________________None 2176.147 71.81-3 days 599.0132 19.84-9 days 148.0294 4.910+ days 107.4986 3.5
Frequency Missing = 168.31181157
DAYS ILL SINCE SEPTEMBER
Q30B Frequency Percent______________________________None 751.4277 25.21-3 days 1432.331 48.14-9 days 599.9698 20.110+ days 194.7 6.5
Frequency Missing = 220.57202273
OTHER DAYS MISSEDSINCE SEPTEMBER
Q30C Frequency Percent
______________________________None 1210.9 40.81-3 days 1422.527 47.94-9 days 275 9059 9 3
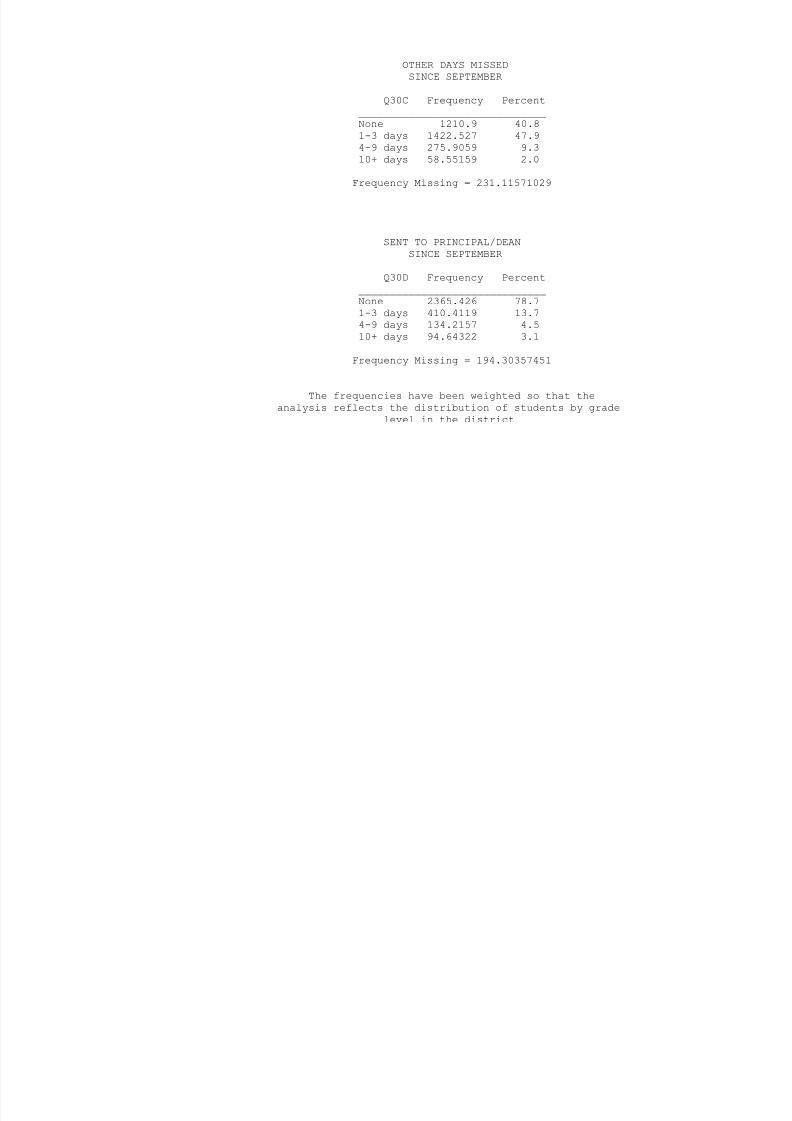
8/14/2019 BRAZORIA COUNTY - Alvin ISD - 1998 Texas School Survey of Drug and Alcohol Use
http://slidepdf.com/reader/full/brazoria-county-alvin-isd-1998-texas-school-survey-of-drug-and-alcohol 195/213
4-9 days 275.9059 9.310+ days 58.55159 2.0
Frequency Missing = 231.11571029
SENT TO PRINCIPAL/DEANSINCE SEPTEMBER
Q30D Frequency Percent
______________________________None 2365.426 78.71-3 days 410.4119 13.74-9 days 134.2157 4.510+ days 94.64322 3.1
Frequency Missing = 194.30357451
The frequencies have been weighted so that the
analysis reflects the distribution of students by gradelevel in the district
AlvinSpring 1998
SOMEONE CALLED HOMESINCE SEPTEMBER
Q30E Frequency Percent
______________________________None 2572.841 85.71-3 days 317 9432 10 6

8/14/2019 BRAZORIA COUNTY - Alvin ISD - 1998 Texas School Survey of Drug and Alcohol Use
http://slidepdf.com/reader/full/brazoria-county-alvin-isd-1998-texas-school-survey-of-drug-and-alcohol 196/213
1 3 days 317.9432 10.64-9 days 68.21987 2.3
10+ days 43.55746 1.5
Frequency Missing = 196.43892552
IN TROUBLE FOR DRINKINGSINCE SEPTEMBER
Q30F Frequency Percent
______________________________
None 2892.025 97.81-3 days 50.30332 1.74-9 days 6.972533 0.210+ days 8.140194 0.3
Frequency Missing = 241.5591964
IN TROUBLE FOR DRUG
USE SINCE SEPTEMBER Q30G Frequency Percent
______________________________None 2899.443 97.71-3 days 46.13459 1.64-9 days 7.0527 0.210+ days 14.32787 0.5
Frequency Missing = 232.04194321
DAYS SKIPPED IN PAST MONTH
Q31A Frequency Percent______________________________None 2574.906 85.91-3 days 348.2213 11.64-9 days 46 74542 1 6
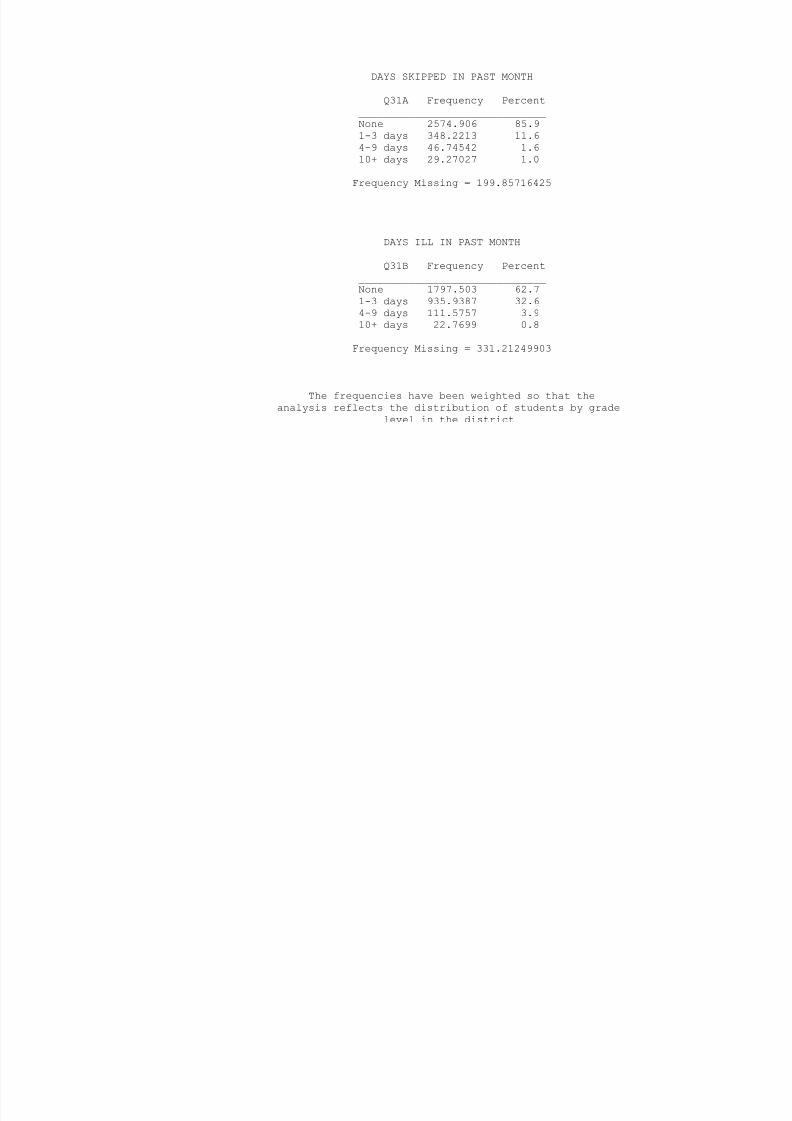
8/14/2019 BRAZORIA COUNTY - Alvin ISD - 1998 Texas School Survey of Drug and Alcohol Use
http://slidepdf.com/reader/full/brazoria-county-alvin-isd-1998-texas-school-survey-of-drug-and-alcohol 197/213
4 9 days 46.74542 1.610+ days 29.27027 1.0
Frequency Missing = 199.85716425
DAYS ILL IN PAST MONTH
Q31B Frequency Percent______________________________None 1797.503 62.71-3 days 935.9387 32.6
4-9 days 111.5757 3.910+ days 22.7699 0.8
Frequency Missing = 331.21249903
The frequencies have been weighted so that the
analysis reflects the distribution of students by gradelevel in the district
AlvinSpring 1998
OTHER DAYS MISSEDIN PAST MONTH
Q31C Frequency Percent
______________________________None 2043.887 71.01-3 days 748.5174 26.0
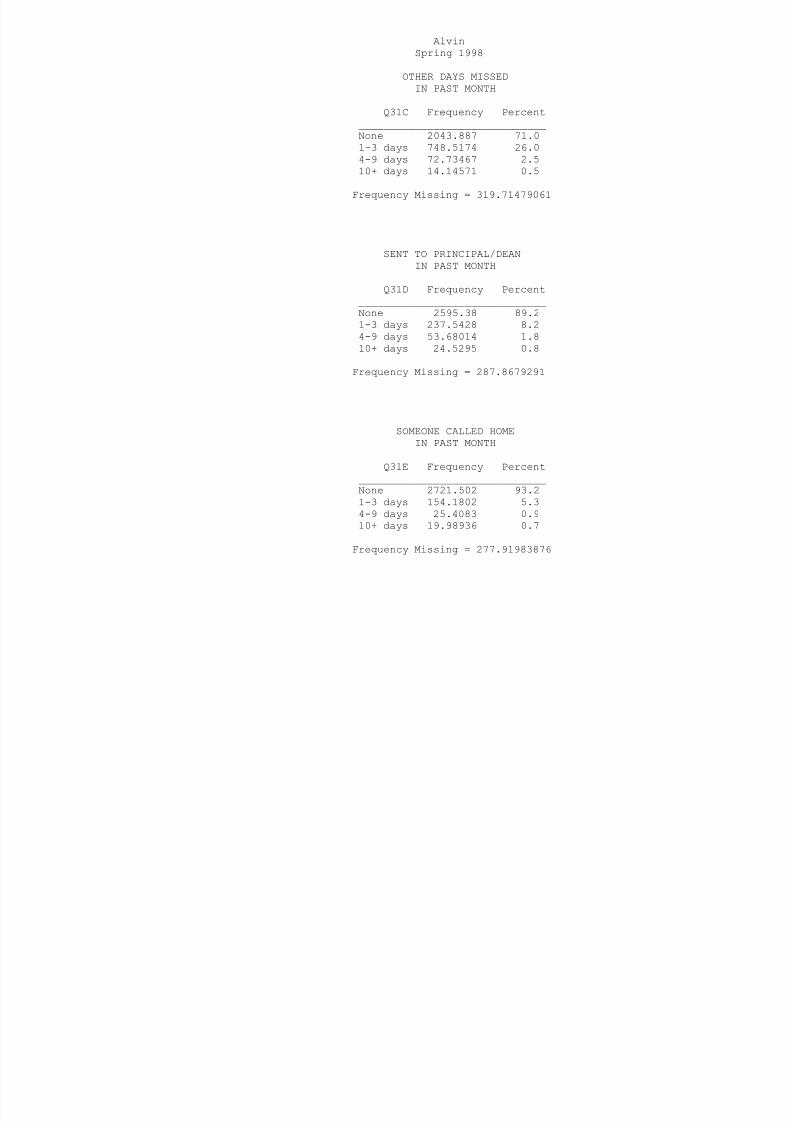
8/14/2019 BRAZORIA COUNTY - Alvin ISD - 1998 Texas School Survey of Drug and Alcohol Use
http://slidepdf.com/reader/full/brazoria-county-alvin-isd-1998-texas-school-survey-of-drug-and-alcohol 198/213
1 3 days 748.5174 26.04-9 days 72.73467 2.5
10+ days 14.14571 0.5
Frequency Missing = 319.71479061
SENT TO PRINCIPAL/DEANIN PAST MONTH
Q31D Frequency Percent
______________________________
None 2595.38 89.21-3 days 237.5428 8.24-9 days 53.68014 1.810+ days 24.5295 0.8
Frequency Missing = 287.8679291
SOMEONE CALLED HOME
IN PAST MONTH Q31E Frequency Percent
______________________________None 2721.502 93.21-3 days 154.1802 5.34-9 days 25.4083 0.910+ days 19.98936 0.7
Frequency Missing = 277.91983876

8/14/2019 BRAZORIA COUNTY - Alvin ISD - 1998 Texas School Survey of Drug and Alcohol Use
http://slidepdf.com/reader/full/brazoria-county-alvin-isd-1998-texas-school-survey-of-drug-and-alcohol 199/213
AlvinSpring 1998
CRITICIZED BY DATEBECAUSE OF DRINKING
Q32C Frequency Percent
_______________________________None 2592.177 91.61-3 times 175.5796 6.2
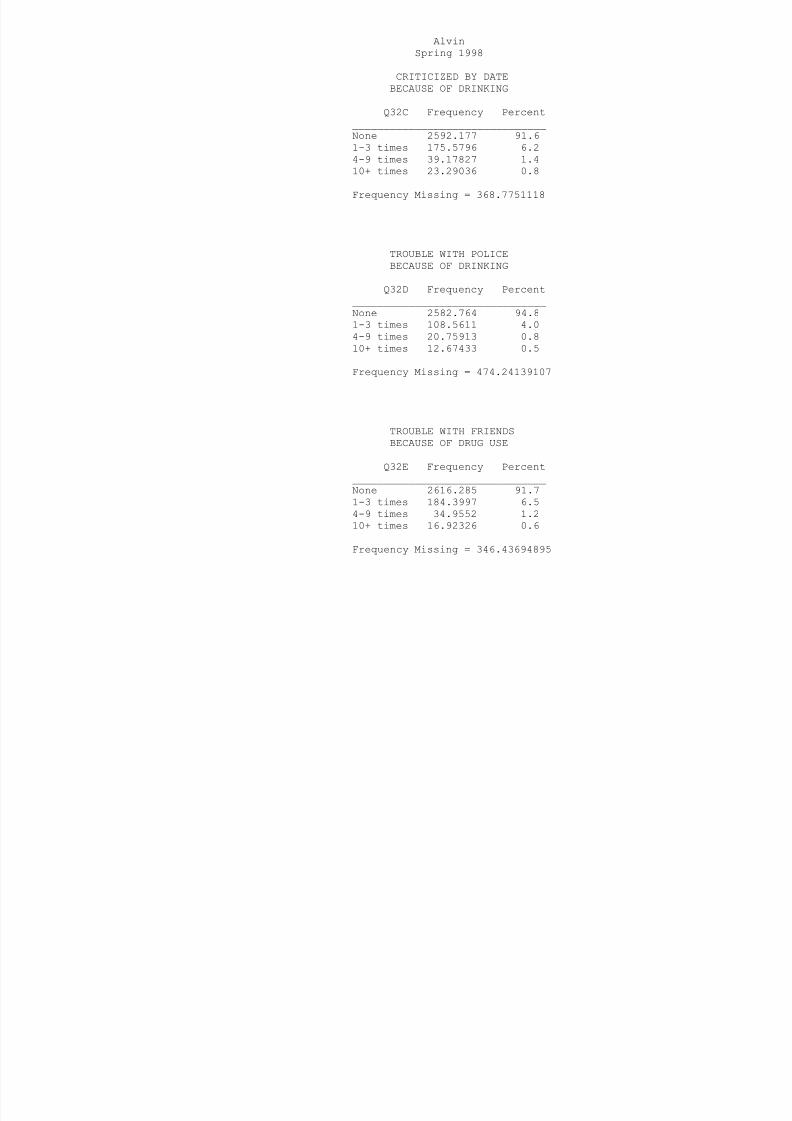
8/14/2019 BRAZORIA COUNTY - Alvin ISD - 1998 Texas School Survey of Drug and Alcohol Use
http://slidepdf.com/reader/full/brazoria-county-alvin-isd-1998-texas-school-survey-of-drug-and-alcohol 200/213
4-9 times 39.17827 1.4
10+ times 23.29036 0.8
Frequency Missing = 368.7751118
TROUBLE WITH POLICEBECAUSE OF DRINKING
Q32D Frequency Percent
_______________________________
None 2582.764 94.81-3 times 108.5611 4.04-9 times 20.75913 0.810+ times 12.67433 0.5
Frequency Missing = 474.24139107
TROUBLE WITH FRIENDS
BECAUSE OF DRUG USE Q32E Frequency Percent
_______________________________None 2616.285 91.71-3 times 184.3997 6.54-9 times 34.9552 1.210+ times 16.92326 0.6
Frequency Missing = 346.43694895
DRIVEN A CAR WHILEHIGH FROM DRUGS
Q32F Frequency Percent
_______________________________None 2323.665 87.61-3 times 206.1937 7.8
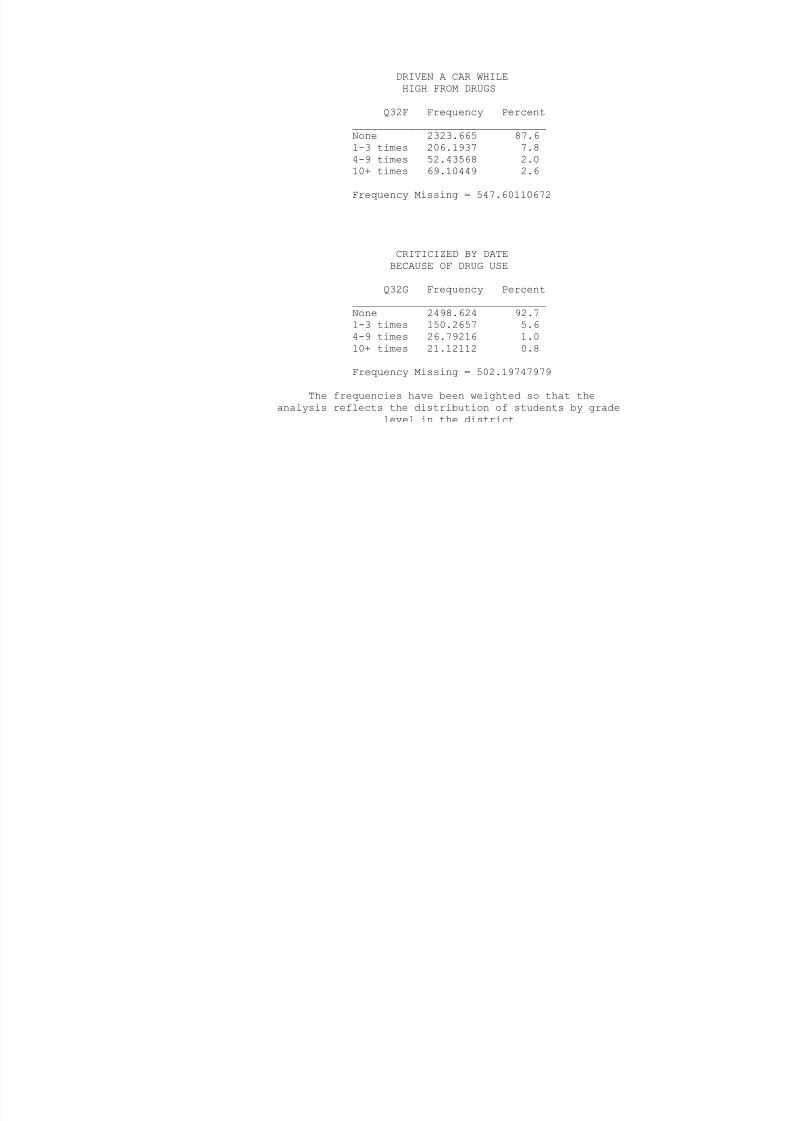
8/14/2019 BRAZORIA COUNTY - Alvin ISD - 1998 Texas School Survey of Drug and Alcohol Use
http://slidepdf.com/reader/full/brazoria-county-alvin-isd-1998-texas-school-survey-of-drug-and-alcohol 201/213
4-9 times 52.43568 2.0
10+ times 69.10449 2.6
Frequency Missing = 547.60110672
CRITICIZED BY DATEBECAUSE OF DRUG USE
Q32G Frequency Percent
_______________________________
None 2498.624 92.71-3 times 150.2657 5.64-9 times 26.79216 1.010+ times 21.12112 0.8
Frequency Missing = 502.19747979
The frequencies have been weighted so that theanalysis reflects the distribution of students by grade
level in the district
AlvinSpring 1998
TROUBLE WITH POLICEBECAUSE OF DRUG USE
Q32H Frequency Percent
_______________________________None 2620.237 95.81-3 times 85.40797 3.1
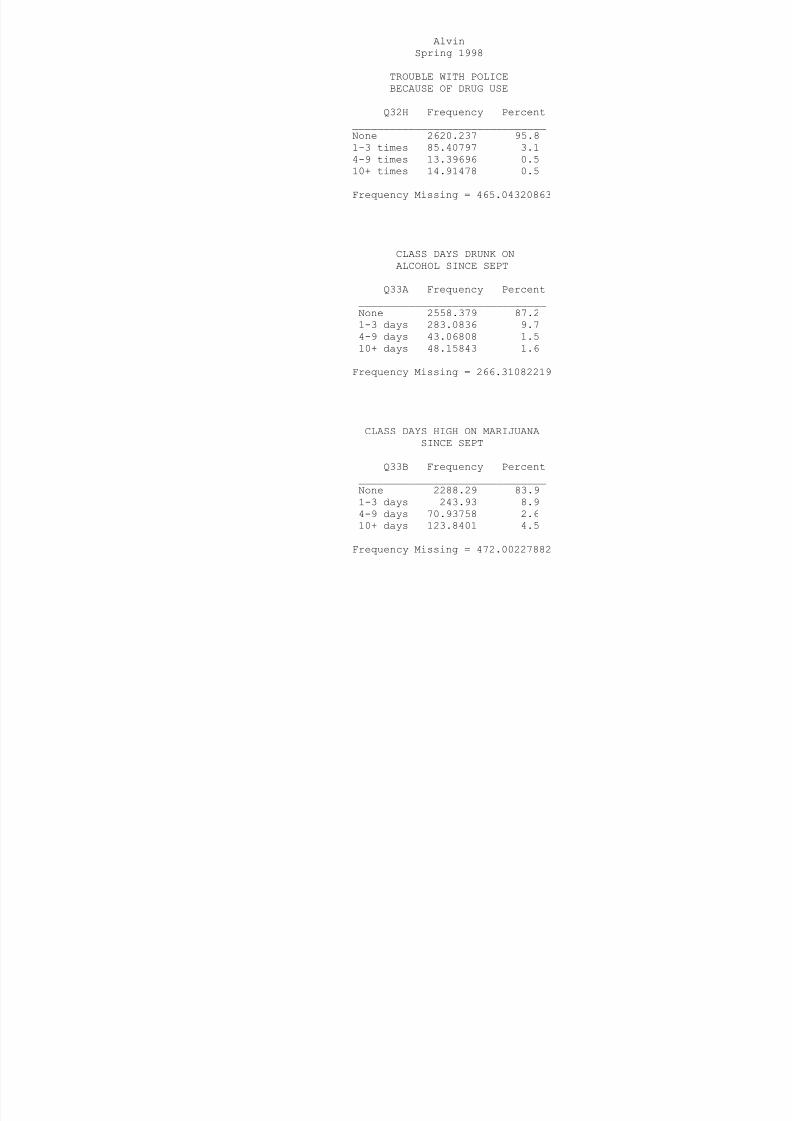
8/14/2019 BRAZORIA COUNTY - Alvin ISD - 1998 Texas School Survey of Drug and Alcohol Use
http://slidepdf.com/reader/full/brazoria-county-alvin-isd-1998-texas-school-survey-of-drug-and-alcohol 202/213
4-9 times 13.39696 0.5
10+ times 14.91478 0.5
Frequency Missing = 465.04320863
CLASS DAYS DRUNK ONALCOHOL SINCE SEPT
Q33A Frequency Percent
______________________________
None 2558.379 87.21-3 days 283.0836 9.74-9 days 43.06808 1.510+ days 48.15843 1.6
Frequency Missing = 266.31082219
CLASS DAYS HIGH ON MARIJUANASINCE SEPT
Q33B Frequency Percent
______________________________None 2288.29 83.91-3 days 243.93 8.94-9 days 70.93758 2.610+ days 123.8401 4.5
Frequency Missing = 472.00227882
CLASS DAYS HIGH ON INHALANTSSINCE SEPT
Q33C Frequency Percent
______________________________None 2663.212 95.61-3 days 79.22601 2.8
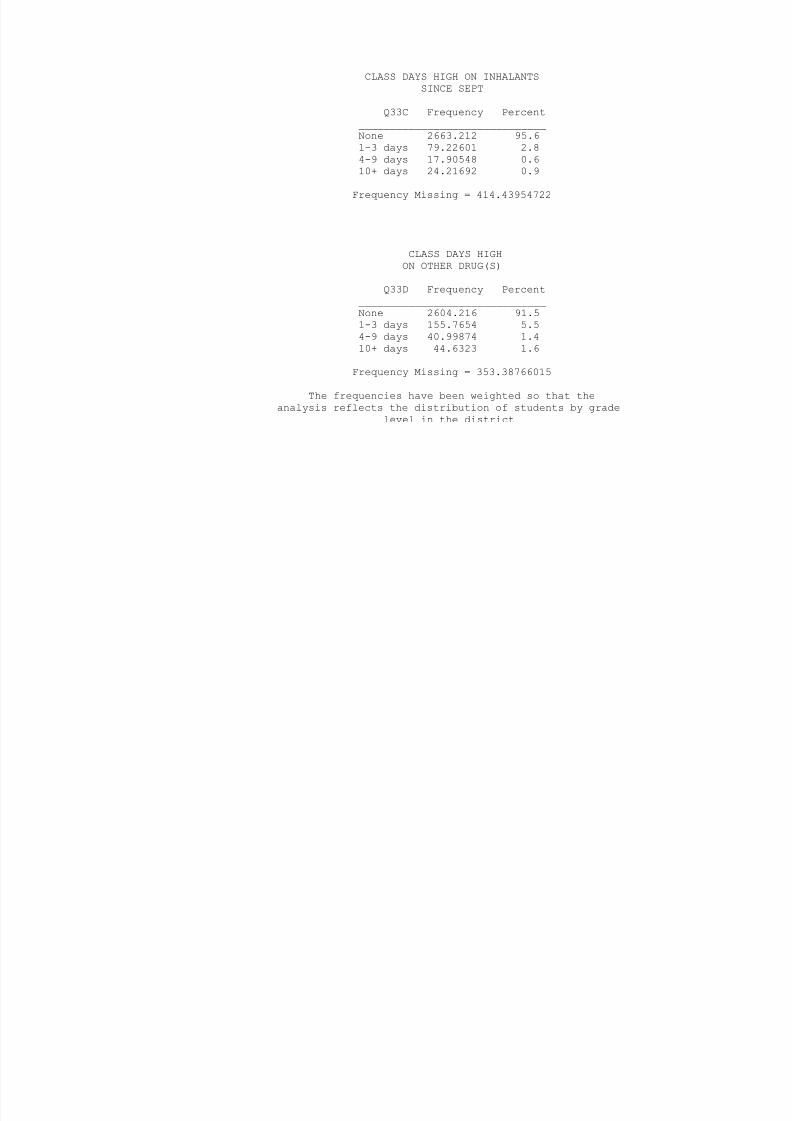
8/14/2019 BRAZORIA COUNTY - Alvin ISD - 1998 Texas School Survey of Drug and Alcohol Use
http://slidepdf.com/reader/full/brazoria-county-alvin-isd-1998-texas-school-survey-of-drug-and-alcohol 203/213
4-9 days 17.90548 0.6
10+ days 24.21692 0.9
Frequency Missing = 414.43954722
CLASS DAYS HIGHON OTHER DRUG(S)
Q33D Frequency Percent
______________________________
None 2604.216 91.51-3 days 155.7654 5.54-9 days 40.99874 1.410+ days 44.6323 1.6
Frequency Missing = 353.38766015
The frequencies have been weighted so that theanalysis reflects the distribution of students by grade
level in the district
AlvinSpring 1998
ALCOHOL USE AT PARTIESTHIS SCHOOL YEAR
Q34A Frequency Percent
______________________________________Never 910.3312 30.4Seldom 315.0251 10.5
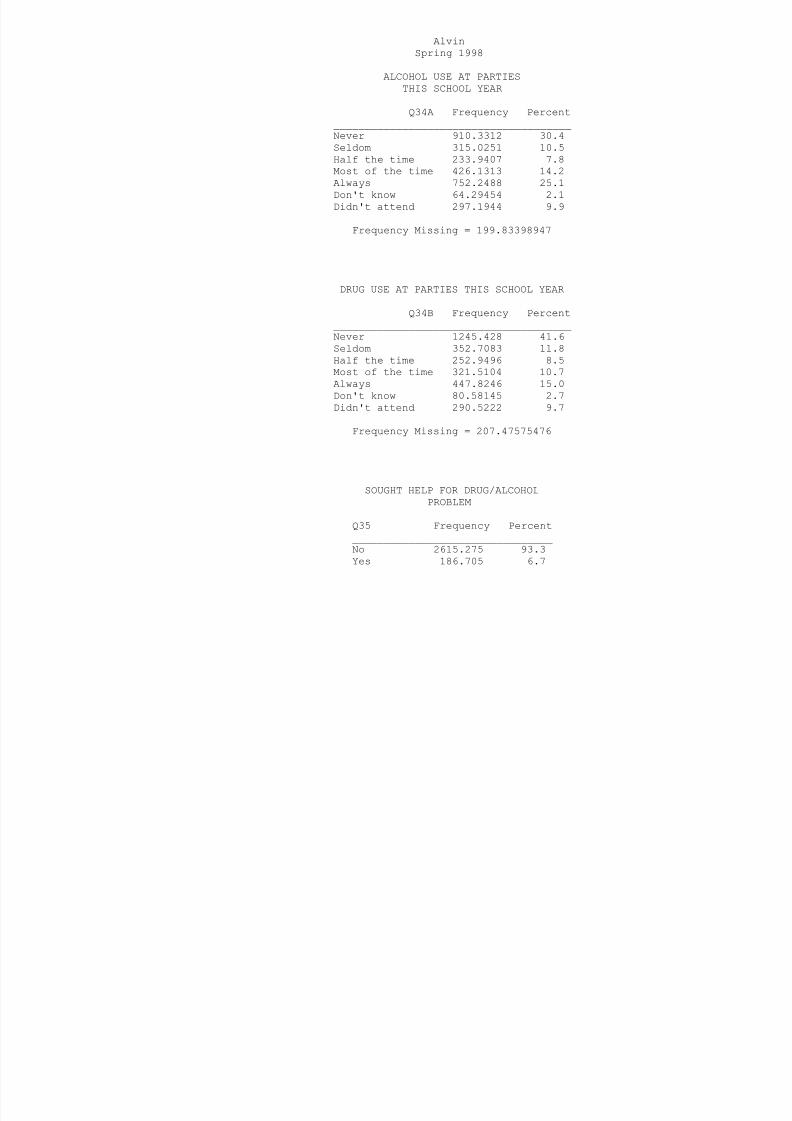
8/14/2019 BRAZORIA COUNTY - Alvin ISD - 1998 Texas School Survey of Drug and Alcohol Use
http://slidepdf.com/reader/full/brazoria-county-alvin-isd-1998-texas-school-survey-of-drug-and-alcohol 204/213
Half the time 233.9407 7.8
Most of the time 426.1313 14.2Always 752.2488 25.1Don't know 64.29454 2.1Didn't attend 297.1944 9.9
Frequency Missing = 199.83398947
DRUG USE AT PARTIES THIS SCHOOL YEAR
Q34B Frequency Percent______________________________________Never 1245.428 41.6Seldom 352.7083 11.8Half the time 252.9496 8.5Most of the time 321.5104 10.7Always 447.8246 15.0Don't know 80.58145 2.7Didn't attend 290.5222 9.7
Frequency Missing = 207.47575476
SOUGHT HELP FOR DRUG/ALCOHOLPROBLEM
Q35 Frequency Percent________________________________No 2615.275 93.3Yes 186.705 6.7
Frequency Missing = 397.02032072
WOULD SEEK HELP FROMSCHOOL COUNSELOR
Q36A Frequency Percent
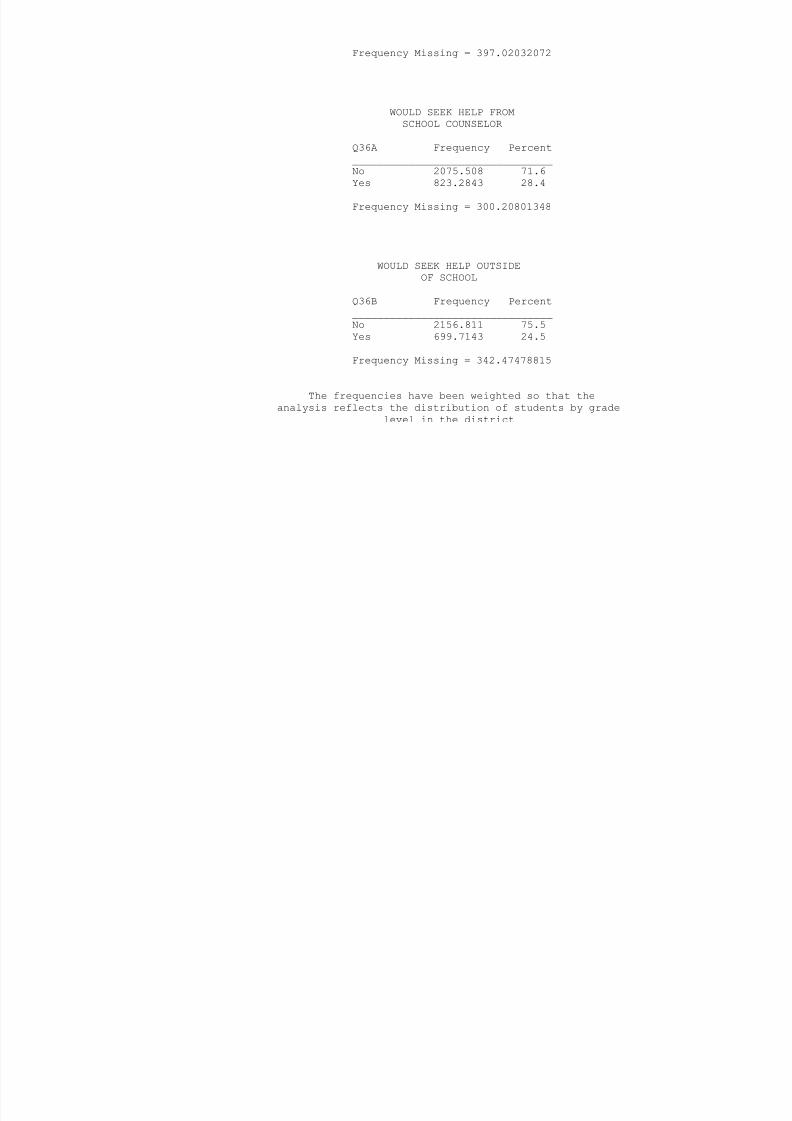
8/14/2019 BRAZORIA COUNTY - Alvin ISD - 1998 Texas School Survey of Drug and Alcohol Use
http://slidepdf.com/reader/full/brazoria-county-alvin-isd-1998-texas-school-survey-of-drug-and-alcohol 205/213
________________________________
No 2075.508 71.6Yes 823.2843 28.4
Frequency Missing = 300.20801348
WOULD SEEK HELP OUTSIDEOF SCHOOL
Q36B Frequency Percent
________________________________No 2156.811 75.5Yes 699.7143 24.5
Frequency Missing = 342.47478815
The frequencies have been weighted so that the
analysis reflects the distribution of students by gradelevel in the district
AlvinSpring 1998
WOULD SEEK HELP FROMOTHER COUNSELOR
Q36C Frequency Percent________________________________No 1729.028 63.5Yes 994.3147 36.5
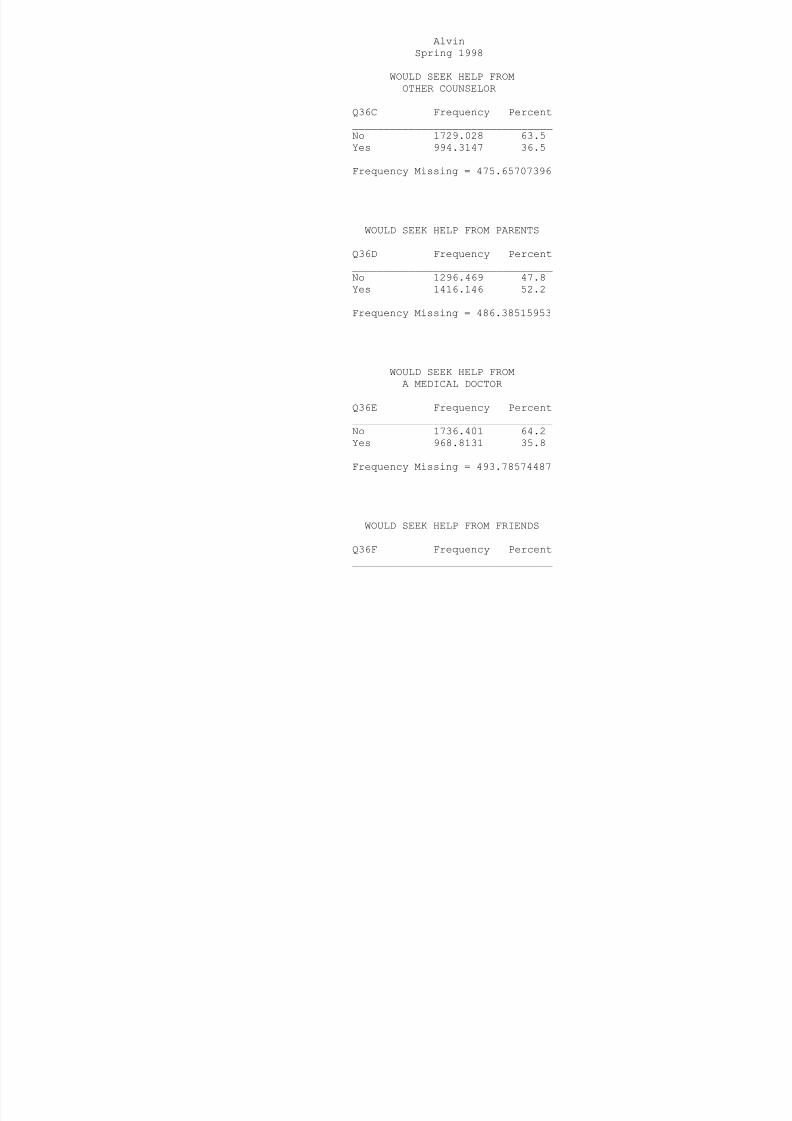
8/14/2019 BRAZORIA COUNTY - Alvin ISD - 1998 Texas School Survey of Drug and Alcohol Use
http://slidepdf.com/reader/full/brazoria-county-alvin-isd-1998-texas-school-survey-of-drug-and-alcohol 206/213
Frequency Missing = 475.65707396
WOULD SEEK HELP FROM PARENTS
Q36D Frequency Percent________________________________No 1296.469 47.8Yes 1416.146 52.2
Frequency Missing = 486.38515953
WOULD SEEK HELP FROMA MEDICAL DOCTOR
Q36E Frequency Percent________________________________No 1736.401 64.2Yes 968.8131 35.8
Frequency Missing = 493.78574487
WOULD SEEK HELP FROM FRIENDS
Q36F Frequency Percent________________________________
No 710.3815 25.8Yes 2041.239 74.2
Frequency Missing = 447.37993944
WOULD SEEK HELP FROMANOTHER ADULT
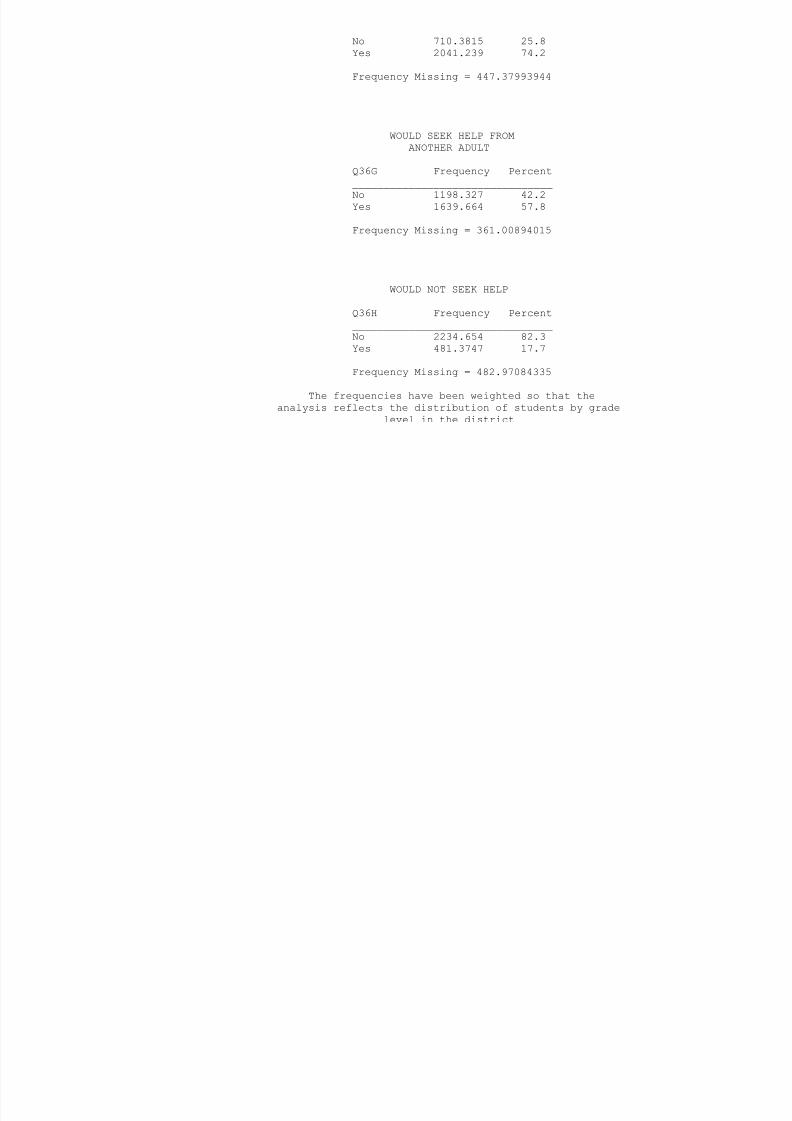
8/14/2019 BRAZORIA COUNTY - Alvin ISD - 1998 Texas School Survey of Drug and Alcohol Use
http://slidepdf.com/reader/full/brazoria-county-alvin-isd-1998-texas-school-survey-of-drug-and-alcohol 207/213
Q36G Frequency Percent________________________________No 1198.327 42.2Yes 1639.664 57.8
Frequency Missing = 361.00894015
WOULD NOT SEEK HELP
Q36H Frequency Percent________________________________No 2234.654 82.3Yes 481.3747 17.7
Frequency Missing = 482.97084335
The frequencies have been weighted so that theanalysis reflects the distribution of students by grade
level in the district
AlvinSpring 1998
DRUG/ALCOHOL INFO--HEALTH CLASS
Q37A Frequency Percent________________________________No 1248.588 48.8Yes 1308.812 51.2
F Mi i 641 59945699
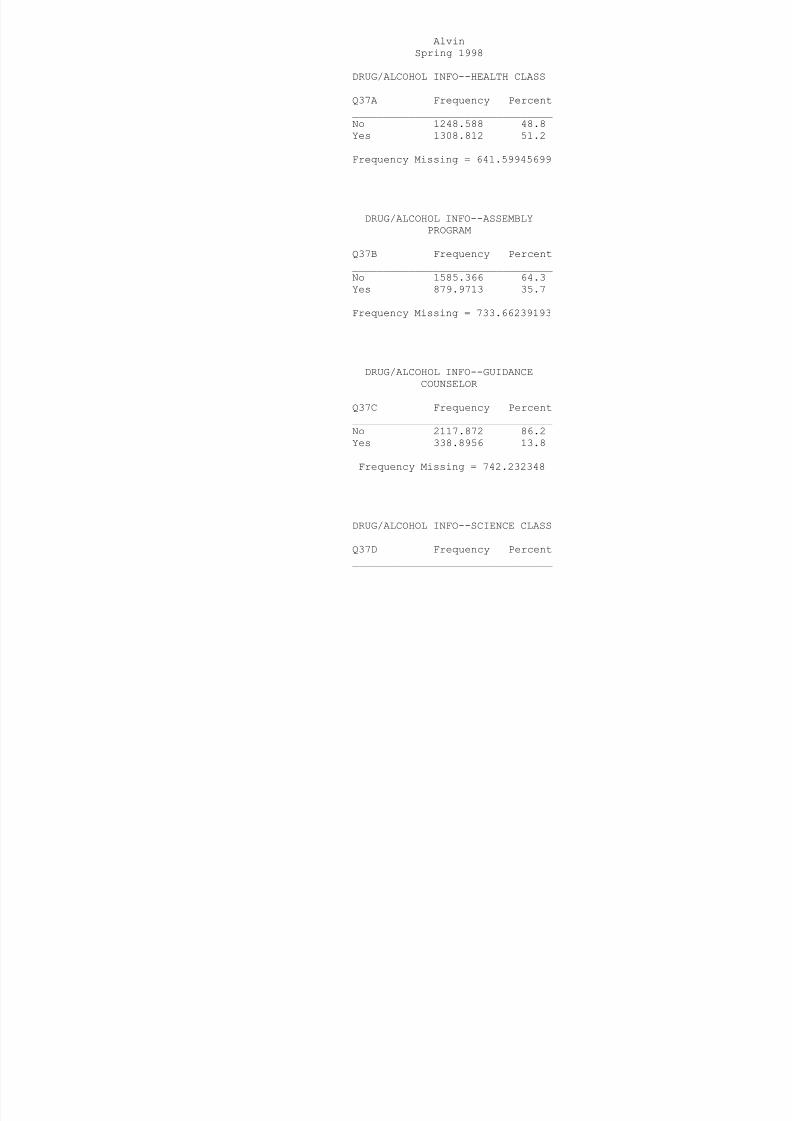
8/14/2019 BRAZORIA COUNTY - Alvin ISD - 1998 Texas School Survey of Drug and Alcohol Use
http://slidepdf.com/reader/full/brazoria-county-alvin-isd-1998-texas-school-survey-of-drug-and-alcohol 208/213
Frequency Missing = 641.59945699
DRUG/ALCOHOL INFO--ASSEMBLYPROGRAM
Q37B Frequency Percent________________________________No 1585.366 64.3Yes 879.9713 35.7
Frequency Missing = 733.66239193
DRUG/ALCOHOL INFO--GUIDANCECOUNSELOR
Q37C Frequency Percent________________________________No 2117.872 86.2Yes 338.8956 13.8
Frequency Missing = 742.232348
DRUG/ALCOHOL INFO--SCIENCE CLASS
Q37D Frequency Percent________________________________
No 1791.115 73.9Yes 634.0963 26.1
Frequency Missing = 773.78858634
DRUG/ALCOHOL INFO--SOCIALSTUDIES CLASS
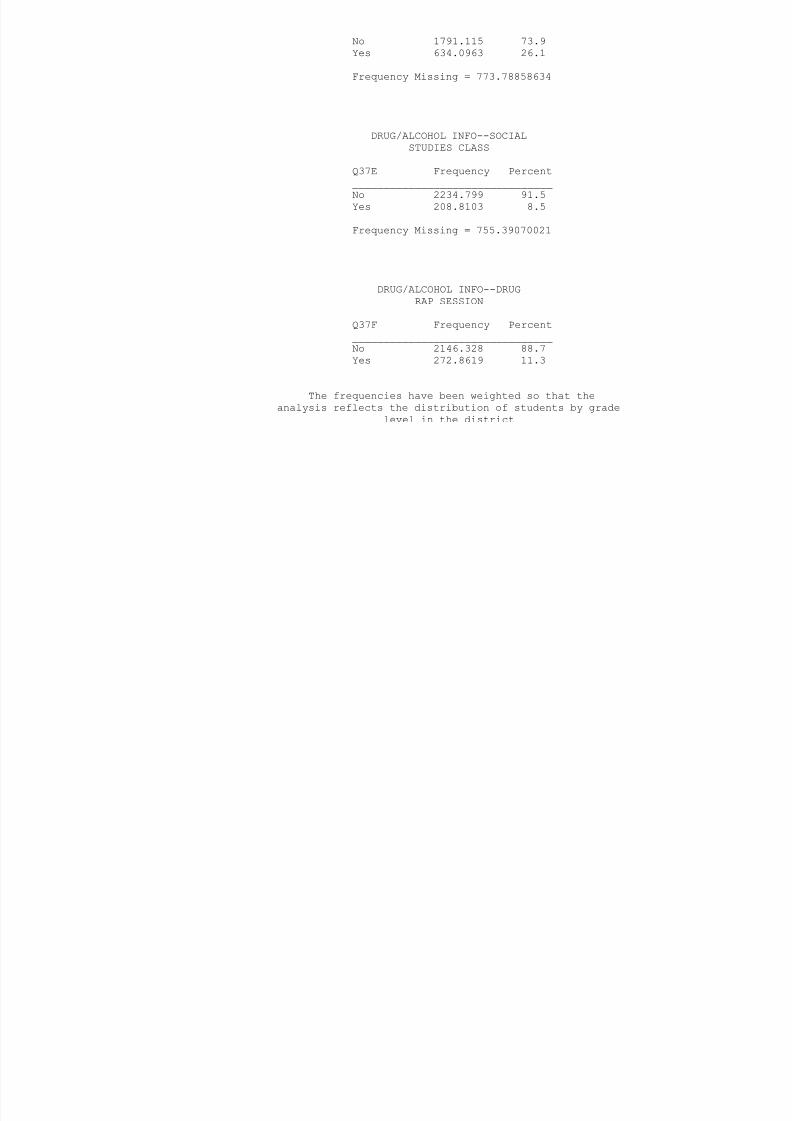
8/14/2019 BRAZORIA COUNTY - Alvin ISD - 1998 Texas School Survey of Drug and Alcohol Use
http://slidepdf.com/reader/full/brazoria-county-alvin-isd-1998-texas-school-survey-of-drug-and-alcohol 209/213
Q37E Frequency Percent________________________________No 2234.799 91.5Yes 208.8103 8.5
Frequency Missing = 755.39070021
DRUG/ALCOHOL INFO--DRUGRAP SESSION
Q37F Frequency Percent________________________________No 2146.328 88.7Yes 272.8619 11.3
The frequencies have been weighted so that theanalysis reflects the distribution of students by grade
level in the district
AlvinSpring 1998
Frequency Missing = 779.81020324
DRUG/ALCOHOL INFO--INVITEDSCHOOL GUEST
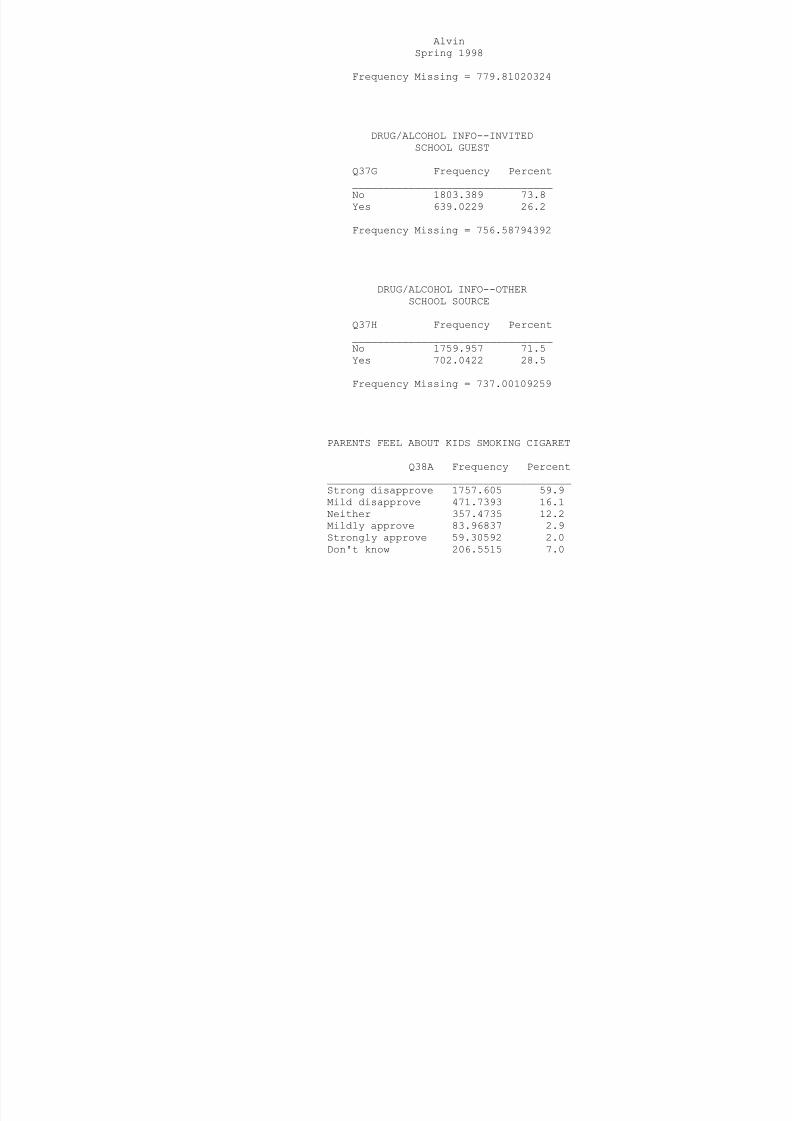
8/14/2019 BRAZORIA COUNTY - Alvin ISD - 1998 Texas School Survey of Drug and Alcohol Use
http://slidepdf.com/reader/full/brazoria-county-alvin-isd-1998-texas-school-survey-of-drug-and-alcohol 210/213
Q37G Frequency Percent________________________________No 1803.389 73.8Yes 639.0229 26.2
Frequency Missing = 756.58794392
DRUG/ALCOHOL INFO--OTHERSCHOOL SOURCE
Q37H Frequency Percent________________________________No 1759.957 71.5Yes 702.0422 28.5
Frequency Missing = 737.00109259
PARENTS FEEL ABOUT KIDS SMOKING CIGARET
Q38A Frequency Percent_______________________________________Strong disapprove 1757.605 59.9Mild disapprove 471.7393 16.1Neither 357.4735 12.2Mildly approve 83.96837 2.9Strongly approve 59.30592 2.0Don't know 206.5515 7.0
Frequency Missing = 262.35617896
PARENTS FEEL ABOUT KIDS DRINKING BEER
Q38B Frequency Percent_______________________________________Strong disapprove 1636.7 57.6Mild disapprove 504 497 17 7
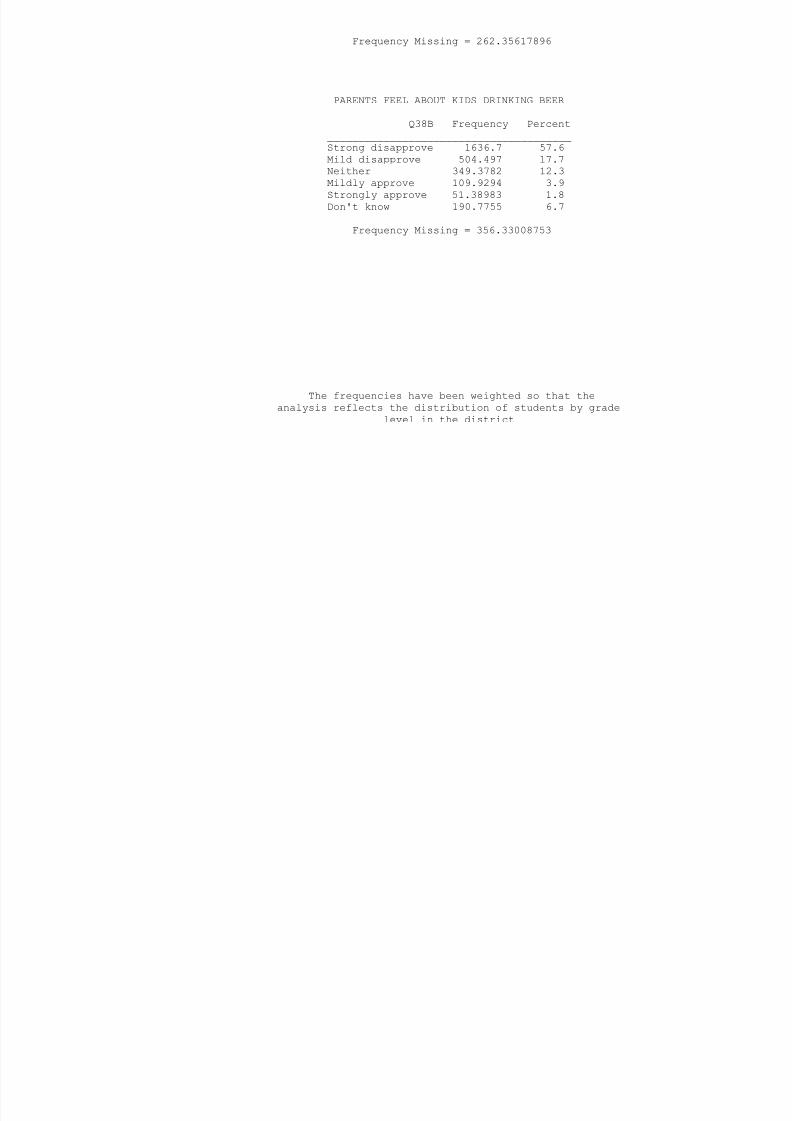
8/14/2019 BRAZORIA COUNTY - Alvin ISD - 1998 Texas School Survey of Drug and Alcohol Use
http://slidepdf.com/reader/full/brazoria-county-alvin-isd-1998-texas-school-survey-of-drug-and-alcohol 211/213
Mild disapprove 504.497 17.7
Neither 349.3782 12.3Mildly approve 109.9294 3.9Strongly approve 51.38983 1.8Don't know 190.7755 6.7
Frequency Missing = 356.33008753
The frequencies have been weighted so that theanalysis reflects the distribution of students by grade
level in the district
AlvinSpring 1998
PARENTS FEEL ABOUT KIDS USING MARIJUANA
Q38C Frequency Percent_______________________________________Strong disapprove 2302.958 79.5Mild disapprove 180.9502 6.2Neither 139.7094 4.8Mildly approve 34 61855 1 2
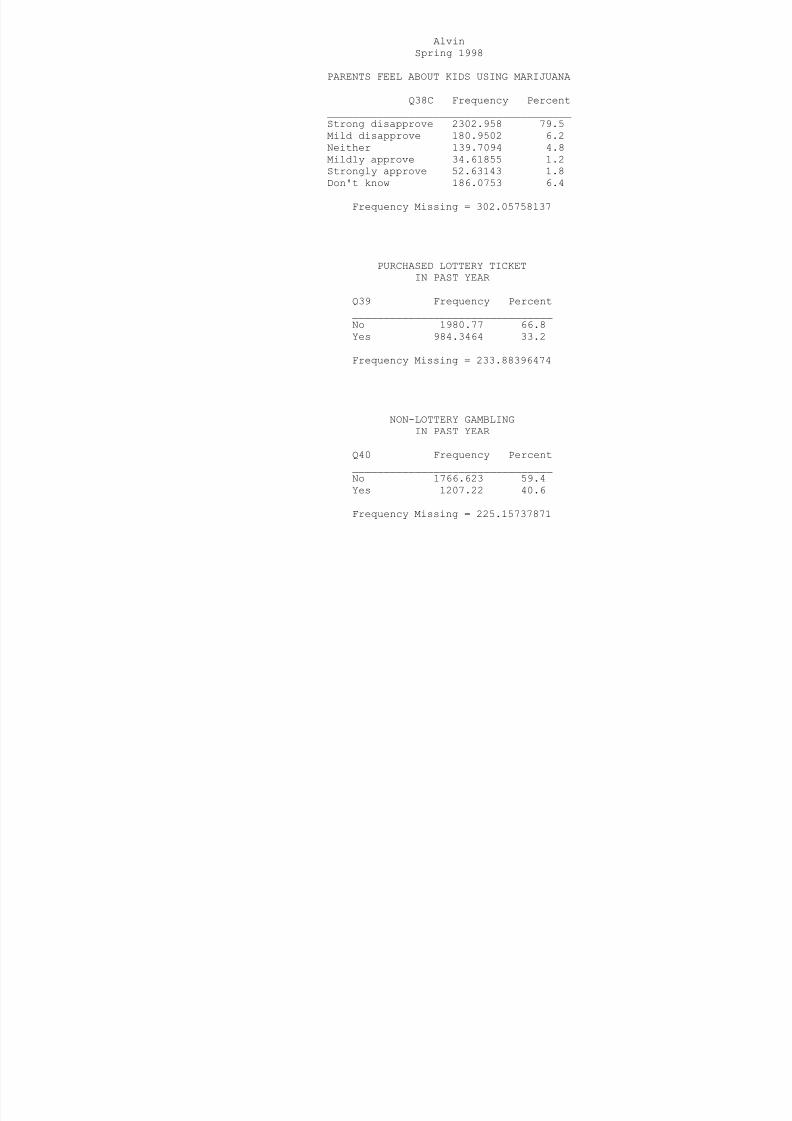
8/14/2019 BRAZORIA COUNTY - Alvin ISD - 1998 Texas School Survey of Drug and Alcohol Use
http://slidepdf.com/reader/full/brazoria-county-alvin-isd-1998-texas-school-survey-of-drug-and-alcohol 212/213
Mildly approve 34.61855 1.2
Strongly approve 52.63143 1.8Don't know 186.0753 6.4
Frequency Missing = 302.05758137
PURCHASED LOTTERY TICKETIN PAST YEAR
Q39 Frequency Percent
________________________________No 1980.77 66.8Yes 984.3464 33.2
Frequency Missing = 233.88396474
NON-LOTTERY GAMBLINGIN PAST YEAR
Q40 Frequency Percent________________________________No 1766.623 59.4Yes 1207.22 40.6
Frequency Missing = 225.15737871
MONEY SPENT ON GAMBLINGIN PAST YEAR
Q41 Frequency Percent
________________________________$0 1557.839 52.3$1 - $10 718.7499 24.1$11 - $50 392.9531 13.2$51 - $100 148.8102 5.0$100+ 160.624 5.4
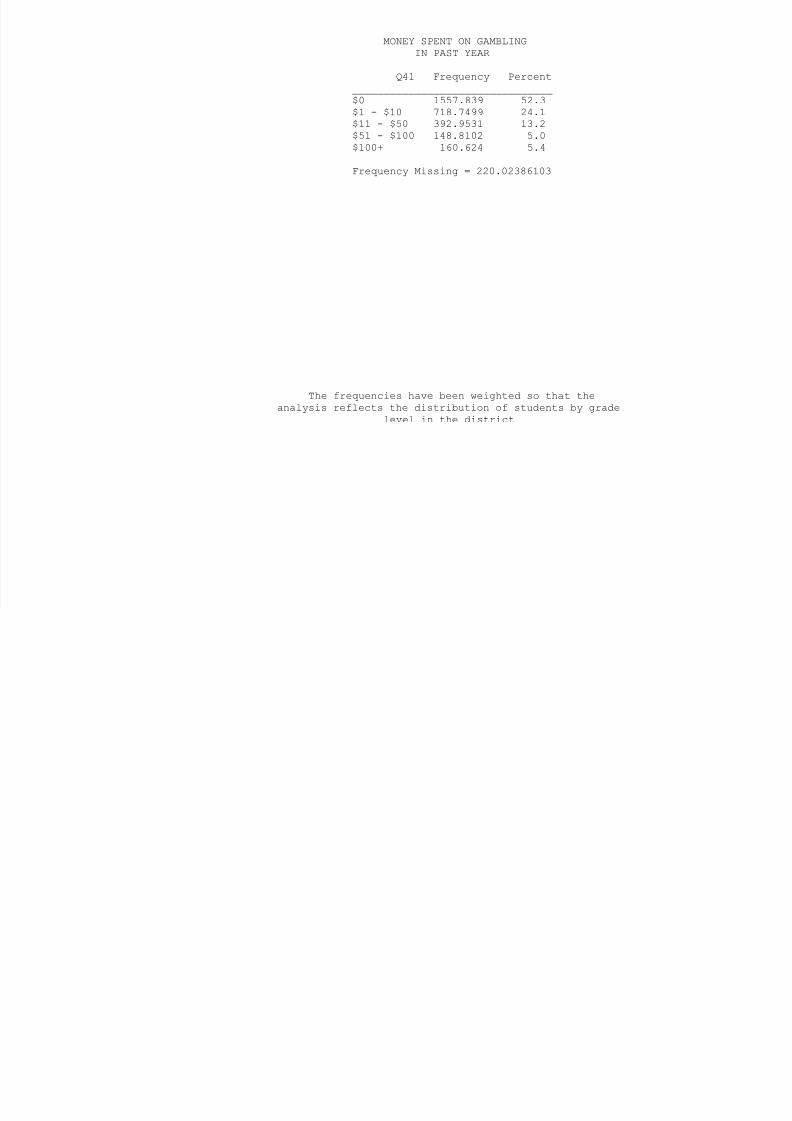
8/14/2019 BRAZORIA COUNTY - Alvin ISD - 1998 Texas School Survey of Drug and Alcohol Use
http://slidepdf.com/reader/full/brazoria-county-alvin-isd-1998-texas-school-survey-of-drug-and-alcohol 213/213
Frequency Missing = 220.02386103
The frequencies have been weighted so that theanalysis reflects the distribution of students by grade
level in the district