Brazil’s Coffee Production Vietnam’s Coffee...
22
1984/85 United States Department of Agriculture Foreign Agricultural Service Circular Series FTROP 4-04 December 2004 Brazil’s Coffee Crop in 2004/05 Lowered From Previous Forecast to 41.7 Million Bags Brazil’s Coffee Production Vietnam’s Coffee Production (Million 60-kilogram bags) (Million 60-kilogram bags) 16 50 14 12 40 10 30 8 6 20 4 10 2 0 0 World coffee production in 2004/05 is forecast at 119.0 million bags (60 kilograms or 132.276 pounds), up 1 percent from the first forecast made in June, and up 9 percent from the 2003/04 season. Most of the upward adjustment from the June forecast comes from the Vietnam crop. Vietnam’s coffee production in 2004/05 is now estimated at 14.2 million bags, up nearly 2.2 million bags from the June forecast. Brazil’s coffee production in 2004/05 is now estimated at 41.7 million bags, down 700,000 bags from the June 2004 forecast. Total coffee supply in producing countries in 2004/05 is forecast at 143.2 million bags, up 1 percent from the revised 2003/04 level. World coffee exports in 2004/05 are forecast to decrease by 2 percent or 2.1 million bags from last year’s revised level. Brazil’s total exports of coffee in 2004/05 are forecast at 23.6 million bags, a decrease of 1.4 million bags from the 2003/04 level. Vietnam’s exports of coffee in 2004/05 are estimated at 13.3 million bags, down about 8 percent from 2003/04. This circular was prepared or estimated on the basis of official statistics of foreign governments, other foreign source material, and in particular, reports of agricultural attachés, office research, and related information. For further information, please contact Debra A. Pumphrey at 202-720-8899 ([email protected]), or send an email to [email protected] 1986/87 1988/89 1990/91 1992/93 1994/95 1996/97 1998/99 2000/01 2002/03 2004/05 1984/85 1986/87 1988/89 1990/91 1992/93 1994/95 1996/97 1998/99 2000/01 2002/03 2004/05 Approved by the World Agricultural Outlook Board/USDA
Transcript of Brazil’s Coffee Production Vietnam’s Coffee...

1984/85
United States Department of Agriculture
Foreign Agricultural Service
Circular Series FTROP 4-04 December 2004
Brazil’s Coffee Crop in 2004/05 Lowered From Previous Forecast to 41.7 Million Bags
Brazil’s Coffee Production Vietnam’s Coffee Production (Million 60-kilogram bags) (Million 60-kilogram bags)
16
50 14
1240
10
30 8
620
4 10
2
0 0
World coffee production in 2004/05 is forecast at 119.0 million bags (60 kilograms or 132.276 pounds), up 1 percent from the first forecast made in June, and up 9 percent from the 2003/04 season. Most of the upward adjustment from the June forecast comes from the Vietnam crop. Vietnam’s coffee production in 2004/05 is now estimated at 14.2 million bags, up nearly 2.2 million bags from the June forecast. Brazil’s coffee production in 2004/05 is now estimated at 41.7 million bags, down 700,000 bags from the June 2004 forecast. Total coffee supply in producing countries in 2004/05 is forecast at 143.2 million bags, up 1 percent from the revised 2003/04 level.
World coffee exports in 2004/05 are forecast to decrease by 2 percent or 2.1 million bags from last year’s revised level. Brazil’s total exports of coffee in 2004/05 are forecast at 23.6 million bags, a decrease of 1.4 million bags from the 2003/04 level. Vietnam’s exports of coffee in 2004/05 are estimated at 13.3 million bags, down about 8 percent from 2003/04.
This circular was prepared or estimated on the basis of official statistics of foreign governments, other foreign source material, and in particular, reports of agricultural attachés, office research, and related information.
For further information, please contact Debra A. Pumphrey at 202-720-8899 ([email protected]), or send an email to [email protected]
1986/87
1988/89
1990/91
1992/93
1994/95
1996/97
1998/99
2000/01
2002/03
2004/05
1984/85
1986/87
1988/89
1990/91
1992/93
1994/95
1996/97
1998/99
2000/01
2002/03
2004/05
Approved by the World Agricultural Outlook Board/USDA

Coffee Updates
Summary World coffee production in 2004/05 is forecast at 119.0 million bags (60 kilograms or 132.276 pounds), up 1 percent from the first forecast made in June, and up 9 percent from the 2003/04 season. Most of the upward adjustment from the June forecast comes from the Vietnam crop. Vietnam’s coffee production in 2004/05 is now estimated at 14.2 million bags, up nearly 2.2 million bags from the June forecast. Brazil’s coffee production in 2004/05 is now estimated at 41.7 million bags, down 700,000 bags from the June 2004 forecast.
Total coffee supply in producing countries in 2004/05 is forecast at 143.2 million bags, up 1 percent from the revised 2003/04 level. All of the increase is the result of higher production, as beginning stocks for 2004/05 are estimated to have declined 7.7 million bags, or about 25 percent from the previous year’s level.
World coffee exports in 2004/05 are forecast to decrease by 2 percent or 2.1 million bags from last year’s revised level. Brazil’s total exports of coffee in 2004/05 are forecast at 23.6 million bags, a decrease of 1.4 million bags from the 2003/04 level. Vietnam’s exports of coffee in 2004/05 are estimated at 13.3 million bags, down about 8 percent from 2003/04. Because of the higher production of coffee in 2004/05 and the lower level of exports compared to last year, ending stocks in 2004/05 are estimated to recover to 25.8 million bags.
World coffee consumption in 2003/04 is estimated at 117.3 million bags, up less than 1 percent from the preliminary 2002/03 level–89.5 million bags in importing countries and 27.8 million bags in exporting countries. Although USDA does not maintain an official database for importing and consuming countries, world consumption is calculated using the information that is available. World consumption can be estimated based on net exports from producing countries, the change in major importers’ stock levels, plus consumption in producer countries. Exports from producing countries are assumed to be consumed in the importing countries, after adjusting for changes in the stock levels in the importing countries.
Brazil
The coffee production estimate for Brazil’s 2004/05 crop has been revised downward to 41.7 million bags, a nearly 2-percent decrease compared to the previous estimate, but up 9.7 million bags from 2003/04, since coffee trees are mostly in the on-year of the biennial production cycle. Excessive rainfall, especially in southern-Minas Gerais and Sao Paulo, caused losses in harvested volumes due to bean droppage, beans with different maturation stages, and irregular fruit formation. No changes have been made to area harvested and tree inventory. The table below shows the coffee production estimate by state and variety of coffee from marketing year (MY) 1999/00 to MY 2004/05.

Brazil's Coffee Production State/Variety 1999/00 2000/01 2001/02 2002/03 2003/04 2004/05
(Million 60-kilogram bags) Minas Gerais 15.40 16.00 16.20 26.7 13.70 20.60 Southwest 1/ 8.40 9.00 8.50 15.00 7.00 11.00 Central-western 1/ 3.50 3.00 3.20 4.85 3.00 4.00 Southeast 1/ 3.50 4.00 4.50 6.85 3.70 5.60 Espirito Santo 4.70 7.40 9.70 11.50 7.70 7.80 Arabica 2.00 2.60 2.20 3.00 1.70 2.50 Robusta 2.70 4.80 7.50 8.50 6.00 5.30 Sao Paulo 1/ 3.70 3.60 3.20 5.90 3.00 4.70 Parana 1/ 2.80 2.20 0.50 2.60 2.20 2.60 Others 4.20 4.90 5.50 6.90 5.40 6.00 Arabica 1.90 2.20 2.30 3.40 2.00 2.50 Robusta 2.30 2.70 3.20 3.50 3.40 3.50
Total 30.80 34.10 35.10 53.60 32.00 41.70 Arabica 25.80 26.60 24.40 41.60 22.60 32.90 Robusta 5.00 7.50 10.70 12.00 9.40 8.80
1/ Arabica.
Brazil’s government and coffee industry officials have raised the volume limit at the official coffee auctions to 80,000 bags.
Brazil: Auctions of Government-Owned Coffee Stocks Date of Auction Quantity Offered Quantity Sold Price Range
60-kilogram bags Brazil reais/bag 2004 June 2 200,000 200,000 241.20 June 15 80,000 75,069 161.00-170.50 July 1 80,000 79,551 150.50-158.70 August 4 40,000 39,849 147.50-161.30 August 25 40,000 39,990 146.00-158.50 September 9 40,000 39,785 150.10-157.00 September 29 40,000 39,080 160.50-165.80 October 14 45,000 44,471 146.00-161.00 November 4 45,000 44,928 140.00-160.00 November 24 50,000 49,785 135.50-162.70
United States
Stocks
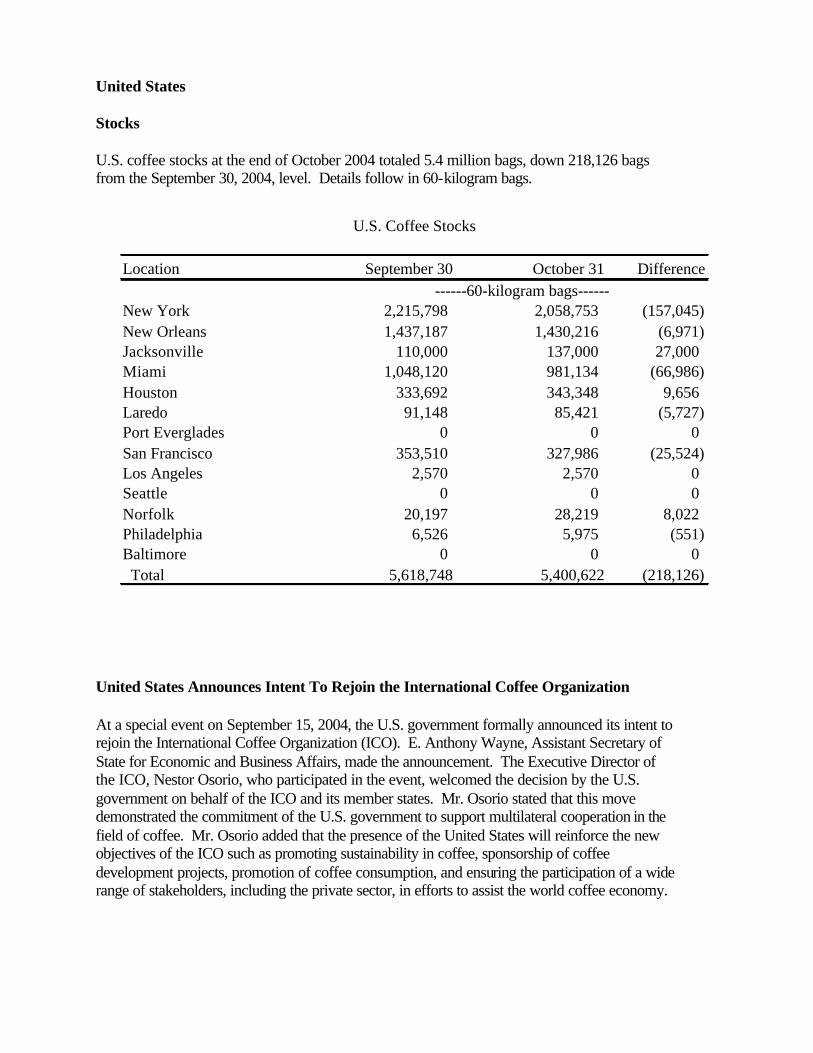
U.S. coffee stocks at the end of October 2004 totaled 5.4 million bags, down 218,126 bags from the September 30, 2004, level. Details follow in 60-kilogram bags.
U.S. Coffee Stocks
Location September 30 October 31 Difference ------60-kilogram bags------
New York 2,215,798 2,058,753 (157,045) New Orleans 1,437,187 1,430,216 (6,971) Jacksonville 110,000 137,000 27,000 Miami 1,048,120 981,134 (66,986) Houston 333,692 343,348 9,656 Laredo 91,148 85,421 (5,727) Port Everglades 0 0 0 San Francisco 353,510 327,986 (25,524) Los Angeles 2,570 2,570 0 Seattle 0 0 0 Norfolk 20,197 28,219 8,022 Philadelphia 6,526 5,975 (551) Baltimore 0 0 0 Total 5,618,748 5,400,622 (218,126)
United States Announces Intent To Rejoin the International Coffee Organization
At a special event on September 15, 2004, the U.S. government formally announced its intent to rejoin the International Coffee Organization (ICO). E. Anthony Wayne, Assistant Secretary of State for Economic and Business Affairs, made the announcement. The Executive Director of the ICO, Nestor Osorio, who participated in the event, welcomed the decision by the U.S. government on behalf of the ICO and its member states. Mr. Osorio stated that this move demonstrated the commitment of the U.S. government to support multilateral cooperation in the field of coffee. Mr. Osorio added that the presence of the United States will reinforce the new objectives of the ICO such as promoting sustainability in coffee, sponsorship of coffee development projects, promotion of coffee consumption, and ensuring the participation of a wide range of stakeholders, including the private sector, in efforts to assist the world coffee economy.

2004 National Coffee Drinking Trends
The National Coffee Association (NCA) published the 2004 National Coffee Drinking Trends (NCDT). This year’s nationwide survey confirmed the continuing growth of occasional coffee drinkers, but notably uncovered a significant jump in the ranks of “dual drinkers”; that is, those who regularly drink both traditional coffee and gourmet coffee beverages. Overall coffee consumption remained strong and steady in 2004, totaling 8 in 10 American adults. About half the population continues to drink coffee daily, although down by 2 percent from 2003. For more information about obtaining the 2004 NCDT or the full data set, contact Steve Wolfe at [email protected].

Coffee: World Supply and Distribution for Producing Countries
Crop Beginning Total Total Total Total Bean Rst/Grn Soluble Domestic Ending Year Stocks Production Imports Supply Exports Exports Exports Exports Use Stocks
----------Thousand 60-kilogram bags 1/----------
1981/82 30,979 98,023 755 129,757 65,359 61,056 235 4,068 20,556 43,842 1982/83 43,842 81,904 733 126,479 66,059 63,344 220 2,495 20,221 40,199 1983/84 40,199 88,801 606 129,606 68,191 65,069 351 2,771 20,577 40,838 1984/85 40,838 90,362 456 131,656 72,322 68,675 306 3,341 21,968 37,366 1985/86 37,366 95,750 397 133,513 70,478 67,724 248 2,506 21,220 41,815 1986/87 41,815 79,394 262 121,471 66,982 64,351 298 2,333 21,202 33,287 1987/88 33,287 103,170 296 136,753 67,504 64,838 337 2,329 21,075 48,174 1988/89 48,174 94,165 415 142,754 71,371 68,108 162 3,101 21,190 50,193 1989/90 50,193 96,958 258 147,409 83,402 80,034 129 3,239 20,995 43,012 1990/91 43,012 100,181 331 143,524 76,163 73,278 83 2,802 22,265 45,096 1991/92 45,096 104,064 291 149,451 80,887 77,844 53 2,990 22,266 46,298 1992/93 46,298 92,959 713 139,970 77,869 73,881 117 3,871 21,579 40,522 1993/94 40,522 92,406 585 133,513 76,284 71,779 108 4,397 22,928 34,301 1994/95 34,301 97,042 1,070 132,413 68,672 64,432 230 4,010 22,526 41,215 1995/96 41,215 88,946 1,079 131,240 74,103 69,021 231 4,851 24,049 33,088 1996/97 33,088 103,786 1,091 137,965 84,509 79,918 196 4,395 24,361 29,095 1997/98 29,095 97,687 1,220 128,002 77,939 73,249 193 4,497 25,180 24,883 1998/99 24,883 108,953 1,435 135,271 85,133 80,855 269 4,009 25,738 24,400 1999/00 24,400 113,819 1,274 139,493 92,660 87,499 288 4,873 25,608 21,225 2000/01 21,225 118,170 1,484 140,879 90,966 84,882 289 5,795 26,315 23,598 2001/02 23,598 111,351 1,617 136,566 87,662 81,108 338 6,216 27,746 21,158 2002/03 21,158 126,649 1,494 149,301 91,882 85,200 281 6,401 27,130 30,289 2003/04 30,289 109,506 1,553 141,348 90,950 83,940 322 6,688 27,847 22,551 2004/05 F 22,551 119,020 1,625 143,196 88,830 82,244 315 6,271 28,563 25,803
1/ One bag = 132.276 pounds. Green Bean Equivalent. F--Forecast.
December 2004 Horticultural and Tropical Products Division, FAS/USDA

Green Coffee: Total Production in Selected Countries 1/
Region and Country Year 1999/00 2000/01 2001/02 2002/03 2003/04 2004/05 Beg. Forecast
----------Thousand 60-kilogram bags 2/----------
North America: Costa Rica October 2,688 2,502 2,338 2,207 2,119 1,955 Cuba July 328 313 285 239 254 275 Dominican Republic July 694 437 432 426 416 500 El Salvador October 2,612 1,624 1,610 1,351 1,250 1,285 Guatemala October 4,364 4,564 3,530 3,802 3,802 3,671 Haiti July 402 423 402 384 373 400 Honduras October 3,067 2,821 3,098 2,661 2,975 2,753 Jamaica October 39 37 30 38 47 30 Mexico October 6,193 4,800 4,200 4,350 4,500 4,500 Nicaragua October 1,514 1,610 895 997 1,380 1,500 Panama October 167 170 160 140 170 160 Trinidad & Tobago October 16 14 15 16 12 12 United States 3/ October 185 183 163 163 171 170 Total 22,269 19,498 17,158 16,774 17,469 17,211
South America: Bolivia April 184 173 124 149 125 125 Brazil July 30,800 34,100 35,100 53,600 32,000 41,700 Colombia October 9,512 10,500 11,950 11,712 11,053 11,600 Ecuador April 1,295 1,005 910 790 796 750 Guyana October 2 0 3 3 3 3 Paraguay April 23 25 22 26 26 30 Peru April 2,571 2,824 2,550 2,760 2,870 2,980 Venezuela October 880 1,027 1,065 920 825 840 Total 45,267 49,654 51,724 69,960 47,698 58,028
Africa: Angola April 55 50 21 56 43 40 Benin October 0 0 0 0 1 1 Burundi April 507 337 257 433 102 617 Cameroon October 1,370 1,113 686 801 1,150 1,100 Central African Republic October 241 122 75 92 158 125 Congo July 3 3 3 3 3 3 Congo, Dem. Rep. of the October 457 433 430 335 688 550 Cote d'Ivoire October 5,700 5,100 3,568 2,119 1,610 1,550 Equatorial Guinea October 0 0 0 0 3 3 Ethiopia October 3,833 3,683 3,756 3,693 4,333 4,000 Gabon October 2 0 1 1 2 2 Ghana October 48 52 25 24 35 35 Guinea October 382 368 254 302 300 300 Kenya October 1,685 864 869 926 1,002 1,085 Liberia October 12 14 10 12 10 10 Madagascar April 427 366 147 445 479 540 Malawi April 59 63 60 42 41 45 Nigeria October 46 48 43 50 43 45 Rwanda April 308 273 296 319 275 500 Sierra Leone October 59 53 53 26 35 35 Tanzania July 837 821 624 824 608 750 Togo October 263 197 116 80 225 225 Uganda October 3,097 3,205 3,166 2,910 3,100 3,000 Zambia July 59 94 100 121 101 100 Zimbabwe April 125 109 121 104 94 115 Total 19,575 17,368 14,681 13,718 14,441 14,776
Asia and Oceania: India October 4,870 5,020 5,010 4,588 4,500 4,840 Indonesia April 6,660 6,495 6,160 6,140 6,000 5,800 Laos October 292 392 430 537 537 500 Malaysia October 250 700 800 950 800 800 New Caledonia October 1 0 1 0 1 1 Papua New Guinea April 1,387 1,041 1,041 1,108 1,147 1,025 Philippines July 740 745 735 726 690 690 Sri Lanka October 41 43 32 32 40 40 Thailand October 1,271 1,692 548 757 991 950 Vietnam October 11,010 15,333 12,833 11,167 15,000 14,167 Yemen October 186 189 198 192 192 192 Total 26,708 31,650 27,788 26,197 29,898 29,005
Grand Total 113,819 118,170 111,351 126,649 109,506 119,020
1/ Coffee marketing year begins October in some countries and April or July in others. Attaché reports were the basis for 84 percent of the forecast total. 2/ One bag = 132.276 pounds. Green Bean Equivalent. 3/ Includes Puerto Rico and Hawaii.
Note: Production estimates for some countries include cross-border movements.
December 2004 Horticultural and Tropical Products Division, FAS/USDA
Green Coffee: Exportable Production in Specified Countries 1/
Forecast Region and Country 1999/00 2000/01 2001/02 2002/03 2003/04 2004/05
----------Thousand 60-kilogram bags 2/----------
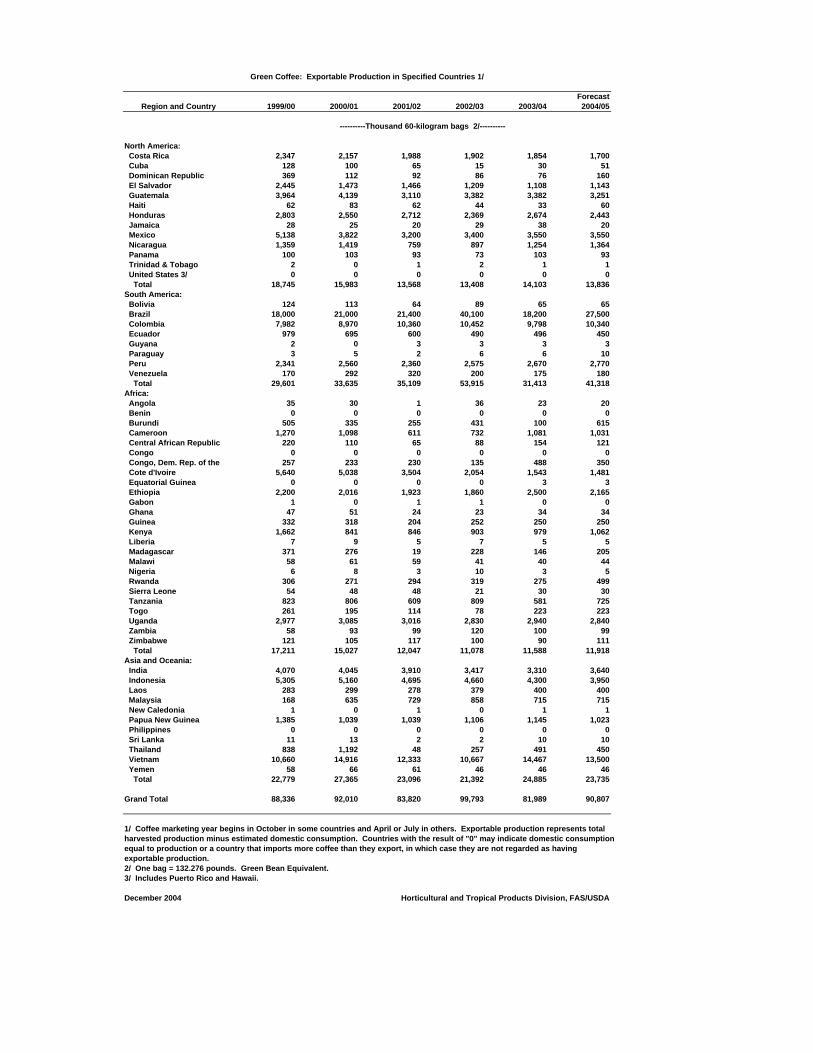
North America: Costa Rica 2,347 2,157 1,988 1,902 1,854 1,700 Cuba 128 100 65 15 30 51 Dominican Republic 369 112 92 86 76 160 El Salvador 2,445 1,473 1,466 1,209 1,108 1,143 Guatemala 3,964 4,139 3,110 3,382 3,382 3,251 Haiti 62 83 62 44 33 60 Honduras 2,803 2,550 2,712 2,369 2,674 2,443 Jamaica 28 25 20 29 38 20 Mexico 5,138 3,822 3,200 3,400 3,550 3,550 Nicaragua 1,359 1,419 759 897 1,254 1,364 Panama 100 103 93 73 103 93 Trinidad & Tobago 2 0 1 2 1 1 United States 3/ 0 0 0 0 0 0
Total 18,745 15,983 13,568 13,408 14,103 13,836 South America: Bolivia 124 113 64 89 65 65 Brazil 18,000 21,000 21,400 40,100 18,200 27,500 Colombia 7,982 8,970 10,360 10,452 9,798 10,340 Ecuador 979 695 600 490 496 450 Guyana 2 0 3 3 3 3 Paraguay 3 5 2 6 6 10 Peru 2,341 2,560 2,360 2,575 2,670 2,770 Venezuela 170 292 320 200 175 180
Total 29,601 33,635 35,109 53,915 31,413 41,318 Africa: Angola 35 30 1 36 23 20 Benin 0 0 0 0 0 0 Burundi 505 335 255 431 100 615 Cameroon 1,270 1,098 611 732 1,081 1,031 Central African Republic 220 110 65 88 154 121 Congo 0 0 0 0 0 0 Congo, Dem. Rep. of the 257 233 230 135 488 350 Cote d'Ivoire 5,640 5,038 3,504 2,054 1,543 1,481 Equatorial Guinea 0 0 0 0 3 3 Ethiopia 2,200 2,016 1,923 1,860 2,500 2,165 Gabon 1 0 1 1 0 0 Ghana 47 51 24 23 34 34 Guinea 332 318 204 252 250 250 Kenya 1,662 841 846 903 979 1,062 Liberia 7 9 5 7 5 5 Madagascar 371 276 19 228 146 205 Malawi 58 61 59 41 40 44 Nigeria 6 8 3 10 3 5 Rwanda 306 271 294 319 275 499 Sierra Leone 54 48 48 21 30 30 Tanzania 823 806 609 809 581 725 Togo 261 195 114 78 223 223 Uganda 2,977 3,085 3,016 2,830 2,940 2,840 Zambia 58 93 99 120 100 99 Zimbabwe 121 105 117 100 90 111
Total 17,211 15,027 12,047 11,078 11,588 11,918 Asia and Oceania: India 4,070 4,045 3,910 3,417 3,310 3,640 Indonesia 5,305 5,160 4,695 4,660 4,300 3,950 Laos 283 299 278 379 400 400 Malaysia 168 635 729 858 715 715 New Caledonia 1 0 1 0 1 1 Papua New Guinea 1,385 1,039 1,039 1,106 1,145 1,023 Philippines 0 0 0 0 0 0 Sri Lanka 11 13 2 2 10 10 Thailand 838 1,192 48 257 491 450 Vietnam 10,660 14,916 12,333 10,667 14,467 13,500 Yemen 58 66 61 46 46 46
Total 22,779 27,365 23,096 21,392 24,885 23,735
Grand Total 88,336 92,010 83,820 99,793 81,989 90,807
1/ Coffee marketing year begins in October in some countries and April or July in others. Exportable production represents total harvested production minus estimated domestic consumption. Countries with the result of "0" may indicate domestic consumption equal to production or a country that imports more coffee than they export, in which case they are not regarded as having exportable production. 2/ One bag = 132.276 pounds. Green Bean Equivalent. 3/ Includes Puerto Rico and Hawaii.
December 2004 Horticultural and Tropical Products Division, FAS/USDA

World Coffee Supply and Distribution for Producing Countries, 2001/02
Region and Country Beginning Production Imports Total Domestic Exports Ending Stocks Supply Use Stocks
----------Thousand 60-kilogram bags 1/----------
North America: Costa Rica 1,445 2,338 0 3,783 350 2,017 1,416 Cuba 251 285 0 536 220 92 224 Dominican Republic 350 432 0 782 340 87 355 El Salvador 2 1,610 70 1,682 144 1,536 2 Guatemala 75 3,530 150 3,755 420 3,330 5 Haiti 172 402 0 574 340 62 172 Honduras 167 3,098 0 3,265 386 2,617 262 Jamaica 21 30 0 51 10 28 13 Mexico 0 4,200 0 4,200 1,000 3,200 0 Nicaragua 258 895 0 1,153 136 917 100 Panama 58 160 0 218 67 78 73 Trinidad & Tobago 0 15 0 15 14 1 0 United States 2/ 0 163 0 163 163 0 0 Total 2,799 17,158 220 20,177 3,590 13,965 2,622
South America: Bolivia 176 124 0 300 60 64 176 Brazil 10,630 35,100 0 45,730 13,700 24,795 7,235 Colombia 1,618 11,950 80 13,648 1,590 10,665 1,393 Ecuador 14 910 108 1,032 310 713 9 Guyana 0 3 0 3 0 3 0 Paraguay 107 22 0 129 20 2 107 Peru 20 2,550 0 2,570 190 2,360 20 Venezuela 407 1,065 40 1,512 745 164 603 Total 12,972 51,724 228 64,924 16,615 38,766 9,543
Africa: Angola 15 21 0 36 20 11 5 Benin 0 0 0 0 0 0 0 Burundi 236 257 0 493 2 215 276 Cameroon 20 686 0 706 75 617 14 Central African Republic 268 75 0 343 10 100 233 Congo 0 3 0 3 3 0 0 Congo, Dem. Rep. of the 223 430 0 653 200 171 282 Cote d'Ivoire 2,340 3,568 0 5,908 64 3,058 2,786 Equatorial Guinea 2 0 0 2 0 0 2 Ethiopia 1,694 3,756 0 5,450 1,833 1,939 1,678 Gabon 0 1 0 1 0 1 0 Ghana 11 25 0 36 1 24 11 Guinea 113 254 0 367 50 201 116 Kenya 237 869 3 1,109 23 832 254 Liberia 0 10 0 10 5 5 0 Madagascar 343 147 0 490 128 74 288 Malawi 3 60 0 63 1 59 3 Nigeria 49 43 13 105 40 3 62 Rwanda 85 296 0 381 2 294 85 Sierra Leone 30 53 0 83 5 48 30 Tanzania 266 624 0 890 15 657 218 Togo 65 116 0 181 2 114 65 Uganda 141 3,166 0 3,307 150 3,153 4 Zambia 0 100 0 100 1 99 0 Zimbabwe 37 121 0 158 4 117 37 Total 6,178 14,681 16 20,875 2,634 11,792 6,449
Asia and Oceania: India 363 5,010 0 5,373 1,100 3,442 831 Indonesia 86 6,160 136 6,382 1,465 4,729 188 Laos 0 430 0 430 152 278 0 Malaysia 0 800 725 1,525 71 1,454 0 New Caledonia 0 1 0 1 0 1 0 Papua New Guinea 391 1,041 0 1,432 2 1,073 357 Philippines 144 735 292 1,171 950 6 215 Sri Lanka 24 32 0 56 30 2 24 Thailand 132 548 0 680 500 93 87 Vietnam 509 12,833 0 13,342 500 12,000 842 Yemen 0 198 0 198 137 61 0 Total 1,649 27,788 1,153 30,590 4,907 23,139 2,544
Grand Total 23,598 111,351 1,617 136,566 27,746 87,662 21,158
1/ One bag = 132.276 pounds. Green Bean Equivalent. 2/ Refers to Puerto Rico and Hawaii only.
December 2004 Horticultural and Tropical Products Division, FAS/USDA

World Coffee Supply and Distribution for Producing Countries, 2002/03
Region and Country Beginning Production Imports Total Domestic Exports Ending Stocks Supply Use Stocks
----------Thousand 60-kilogram bags 1/----------
North America: Costa Rica 1,416 2,207 0 3,623 305 1,945 1,373 Cuba 224 239 0 463 224 58 181 Dominican Republic 355 426 0 781 340 144 297 El Salvador 2 1,351 139 1,492 142 1,348 2 Guatemala 5 3,802 150 3,957 420 3,500 37 Haiti 172 384 0 556 340 37 179 Honduras 262 2,661 0 2,923 292 2,438 193 Jamaica 13 38 0 51 9 25 17 Mexico 0 4,350 0 4,350 950 3,400 0 Nicaragua 100 997 0 1,097 100 955 42 Panama 73 140 0 213 67 84 62 Trinidad & Tobago 0 16 0 16 14 2 0 United States 2/ 0 163 0 163 163 0 0 Total 2,622 16,774 289 19,685 3,366 13,936 2,383
South America: Bolivia 176 149 0 325 60 89 176 Brazil 7,235 53,600 0 60,835 13,500 29,396 17,939 Colombia 1,393 11,712 70 13,175 1,260 10,478 1,437 Ecuador 9 790 130 929 300 600 29 Guyana 0 3 0 3 0 3 0 Paraguay 107 26 0 133 20 6 107 Peru 20 2,760 0 2,780 185 2,575 20 Venezuela 603 920 6 1,529 720 281 528 Total 9,543 69,960 206 79,709 16,045 43,428 20,236
Africa: Angola 5 56 0 61 20 11 30 Benin 0 0 0 0 0 0 0 Burundi 276 433 0 709 2 431 276 Cameroon 14 801 0 815 69 732 14 Central African Republic 233 92 0 325 4 38 283 Congo 0 3 0 3 3 0 0 Congo, Dem. Rep. of the 282 335 0 617 200 192 225 Cote d'Ivoire 2,786 2,119 0 4,905 65 2,522 2,318 Equatorial Guinea 2 0 0 2 0 0 2 Ethiopia 1,678 3,693 0 5,371 1,833 2,277 1,261 Gabon 0 1 0 1 0 1 0 Ghana 11 24 0 35 1 23 11 Guinea 116 302 0 418 50 252 116 Kenya 254 926 3 1,183 23 853 307 Liberia 0 12 0 12 5 7 0 Madagascar 288 445 0 733 217 194 322 Malawi 3 42 0 45 1 43 1 Nigeria 62 50 13 125 40 10 75 Rwanda 85 319 0 404 0 308 96 Sierra Leone 30 26 0 56 5 21 30 Tanzania 218 824 0 1,042 15 820 207 Togo 65 80 0 145 2 78 65 Uganda 4 2,910 0 2,914 80 2,810 24 Zambia 0 121 0 121 1 120 0 Zimbabwe 37 104 0 141 4 100 37 Total 6,449 13,718 16 20,183 2,640 11,843 5,700
Asia and Oceania: India 831 4,588 53 5,472 1,171 3,553 748 Indonesia 188 6,140 84 6,412 1,480 4,801 131 Laos 0 537 0 537 158 379 0 Malaysia 0 950 554 1,504 92 1,412 0 New Caledonia 0 0 0 0 0 0 0 Papua New Guinea 357 1,108 0 1,465 2 1,076 387 Philippines 215 726 292 1,233 1,000 6 227 Sri Lanka 24 32 0 56 30 2 24 Thailand 87 757 0 844 500 224 120 Vietnam 842 11,167 0 12,009 500 11,176 333 Yemen 0 192 0 192 146 46 0 Total 2,544 26,197 983 29,724 5,079 22,675 1,970
Grand Total 21,158 126,649 1,494 149,301 27,130 91,882 30,289
1/ One bag = 132.276 pounds. Green Bean Equivalent. 2/ Refers to Puerto Rico and Hawaii only.
December 2004 Horticultural and Tropical Products Division, FAS/USDA

World Coffee Supply and Distribution for Producing Countries, Preliminary 2003/04
Region and Country Beginning Production Imports Total Domestic Exports Ending Stocks Supply Use Stocks
----------Thousand 60-kilogram bags 1/----------
North America: Costa Rica 1,373 2,119 0 3,492 265 1,808 1,419 Cuba 181 254 0 435 224 30 181 Dominican Republic 297 416 0 713 340 76 297 El Salvador 2 1,250 139 1,391 142 1,247 2 Guatemala 37 3,802 50 3,889 420 3,450 19 Haiti 179 373 0 552 340 33 179 Honduras 193 2,975 0 3,168 301 2,798 69 Jamaica 17 47 0 64 9 27 28 Mexico 0 4,500 0 4,500 950 3,550 0 Nicaragua 42 1,380 0 1,422 126 1,270 26 Panama 62 170 0 232 67 77 88 Trinidad & Tobago 0 12 0 12 11 1 0 United States 2/ 0 171 0 171 171 0 0 Total 2,383 17,469 189 20,041 3,366 14,367 2,308
South America: Bolivia 176 125 0 301 60 65 176 Brazil 17,939 32,000 0 49,939 13,800 24,920 11,219 Colombia 1,437 11,053 50 12,540 1,255 10,154 1,131 Ecuador 29 796 140 965 300 627 38 Guyana 0 3 0 3 0 3 0 Paraguay 107 26 0 133 20 6 107 Peru 20 2,870 0 2,890 200 2,685 5 Venezuela 528 825 7 1,360 650 335 375 Total 20,236 47,698 197 68,131 16,285 38,795 13,051
Africa: Angola 30 43 0 73 20 13 40 Benin 0 1 0 1 1 0 0 Burundi 276 102 0 378 2 324 52 Cameroon 14 1,150 0 1,164 69 877 218 Central African Republic 283 158 0 441 4 68 369 Congo 0 3 0 3 3 0 0 Congo, Dem. Rep. of the 225 688 0 913 200 254 459 Cote d'Ivoire 2,318 1,610 0 3,928 67 2,712 1,149 Equatorial Guinea 2 3 0 5 0 0 5 Ethiopia 1,261 4,333 0 5,594 1,833 2,374 1,387 Gabon 0 2 0 2 2 0 0 Ghana 11 35 0 46 1 16 29 Guinea 116 300 0 416 50 264 102 Kenya 307 1,002 3 1,312 23 896 393 Liberia 0 10 0 10 5 5 0 Madagascar 322 479 0 801 333 146 322 Malawi 1 41 0 42 1 41 0 Nigeria 75 43 13 131 40 3 88 Rwanda 96 275 0 371 0 275 96 Sierra Leone 30 35 0 65 5 19 41 Tanzania 207 608 0 815 27 581 207 Togo 65 225 0 290 2 147 141 Uganda 24 3,100 0 3,124 160 2,524 440 Zambia 0 101 0 101 1 100 0 Zimbabwe 37 94 0 131 4 90 37 Total 5,700 14,441 16 20,157 2,853 11,729 5,575
Asia and Oceania: India 748 4,500 0 5,248 1,190 3,764 294 Indonesia 131 6,000 90 6,221 1,700 4,408 113 Laos 0 537 0 537 137 400 0 Malaysia 0 800 743 1,543 85 1,458 0 New Caledonia 0 1 0 1 0 1 0 Papua New Guinea 387 1,147 0 1,534 2 1,152 380 Philippines 227 690 318 1,235 1,020 6 209 Sri Lanka 24 40 0 64 30 1 33 Thailand 120 991 0 1,111 500 340 271 Vietnam 333 15,000 0 15,333 533 14,483 317 Yemen 0 192 0 192 146 46 0 Total 1,970 29,898 1,151 33,019 5,343 26,059 1,617
Grand Total 30,289 109,506 1,553 141,348 27,847 90,950 22,551
1/ One bag = 132.276 pounds. Green Bean Equivalent. 2/ Refers to Puerto Rico and Hawaii only.
December 2004 Horticultural and Tropical Products Division, FAS/USDA

World Coffee Supply and Distribution for Producing Countries, Forecast 2004/05
Region and Country Beginning Production Imports Total Domestic Exports Ending Stocks Supply Use Stocks
----------Thousand 60-kilogram bags 1/----------
North America: Costa Rica 1,419 1,955 0 3,374 255 1,750 1,369 Cuba 181 275 0 456 224 75 157 Dominican Republic 297 500 0 797 340 131 326 El Salvador 2 1,285 138 1,425 142 1,281 2 Guatemala 19 3,671 50 3,740 420 3,300 20 Haiti 179 400 0 579 340 50 189 Honduras 69 2,753 0 2,822 310 2,450 62 Jamaica 28 30 0 58 10 20 28 Mexico 0 4,500 0 4,500 950 3,550 0 Nicaragua 26 1,500 0 1,526 136 1,230 160 Panama 88 160 0 248 67 100 81 Trinidad & Tobago 0 12 0 12 11 1 0 United States 2/ 0 170 0 170 170 0 0 Total 2,308 17,211 188 19,707 3,375 13,938 2,394
South America: Bolivia 176 125 0 301 60 65 176 Brazil 11,219 41,700 0 52,919 14,200 23,550 15,169 Colombia 1,131 11,600 55 12,786 1,260 10,390 1,136 Ecuador 38 750 200 988 300 651 37 Guyana 0 3 0 3 0 3 0 Paraguay 107 30 0 137 20 10 107 Peru 5 2,980 0 2,985 210 2,750 25 Venezuela 375 840 13 1,228 660 285 283 Total 13,051 58,028 268 71,347 16,710 37,704 16,933
Africa: Angola 40 40 0 80 20 15 45 Benin 0 1 0 1 1 0 0 Burundi 52 617 0 669 2 400 267 Cameroon 218 1,100 0 1,318 69 1,100 149 Central African Republic 369 125 0 494 4 100 390 Congo 0 3 0 3 3 0 0 Congo, Dem. Rep. of the 459 550 0 1,009 200 325 484 Cote d'Ivoire 1,149 1,550 0 2,699 69 2,163 467 Equatorial Guinea 5 3 0 8 0 0 8 Ethiopia 1,387 4,000 0 5,387 1,835 2,300 1,252 Gabon 0 2 0 2 2 0 0 Ghana 29 35 0 64 1 25 38 Guinea 102 300 0 402 50 250 102 Kenya 393 1,085 3 1,481 23 1,100 358 Liberia 0 10 0 10 5 5 0 Madagascar 322 540 0 862 335 200 327 Malawi 0 45 0 45 1 44 0 Nigeria 88 45 0 133 40 5 88 Rwanda 96 500 0 596 1 500 95 Sierra Leone 41 35 0 76 5 25 46 Tanzania 207 750 0 957 25 685 247 Togo 141 225 0 366 2 200 164 Uganda 440 3,000 0 3,440 160 3,000 280 Zambia 0 100 0 100 1 99 0 Zimbabwe 37 115 0 152 4 100 48 Total 5,575 14,776 3 20,354 2,858 12,641 4,855
Asia and Oceania: India 294 4,840 0 5,134 1,200 3,751 183 Indonesia 113 5,800 95 6,008 1,850 4,000 158 Laos 0 500 0 500 100 400 0 Malaysia 0 800 743 1,543 85 1,458 0 New Caledonia 0 1 0 1 0 1 0 Papua New Guinea 380 1,025 0 1,405 2 1,101 302 Philippines 209 690 328 1,227 1,040 6 181 Sri Lanka 33 40 0 73 30 1 42 Thailand 271 950 0 1,221 500 450 271 Vietnam 317 14,167 0 14,484 667 13,333 484 Yemen 0 192 0 192 146 46 0 Total 1,617 29,005 1,166 31,788 5,620 24,547 1,621
Grand Total 22,551 119,020 1,625 143,196 28,563 88,830 25,803
1/ One bag = 132.276 pounds. Green Bean Equivalent. 2/ Refers to Puerto Rico and Hawaii only.
December 2004 Horticultural and Tropical Products Division, FAS/USDA

Coffee: Exports By ICO Exporting Members To All Destinations October-September
1999/00 2000/01 2001/02 2002/03 2003/04 1/
----------Thousand 60-kilogram bags 2/----------
Colombian Milds: 10,978 11,531 11,997 12,197 11,533 Colombia Kenya Tanzania
Other Milds: Bolivia Burundi Costa Rica Cuba Dominican Republic Ecuador El Salvador Guatemala Haiti Honduras India Jamaica Malawi Mexico Nicaragua Panama Papua New Guinea Peru Rwanda Venezuela Zambia Zimbabwe
Brazil/Other Arabicas:
9,035 1,196
747 29,084
115 463
1,984 127 189 835
2,490 4,901
62 2,857 4,500
30 55
5,164 1,302
78 1,050 2,311
304 96 59
112 20,830
9,437 1,220
874 25,066
73 314
2,111 90
102 763
1,715 4,414
97 2,470 3,715
29 70
3,637 1,445
70 1,060 2,418
267 26 88 92
23,041
10,625 793 579
22,179 67
250 1,881
87 114 568
1,473 3,330
49 2,617 3,441
28 53
2,893 920 78
1,026 2,689
274 131 98
112 28,108
10,478 878 841
22,726 82
552 1,676
58 141 667
1,320 3,965
37 2,439 3,560
25 39
2,561 978 84
1,143 2,664
237 271 127 100
29,915
10,154831548
21,85676
2521,502
3052
6231,3443,285
332,7943,778
2741
2,4221,270
771,1192,447
3861209682
27,717 Brazil Ethiopia Paraguay
Robustas: Angola Benin Cameroon Central African Rep. Congo Congo, Dem. Rep. of Cote d'Ivoire Equatorial Guinea Gabon Ghana Guinea Indonesia Liberia Madagascar Nigeria Philippines Sierra Leone Sri Lanka Thailand Togo Trinidad and Tobago Uganda Vietnam
Grand Total
18,816 2,005
9 28,345
30 0
1,272 188
0 333
5,834 0 0
35 28
5,204 0
277 3 4
64 1
960 279
2 2,917
10,914
89,237
21,612 1,418
11 30,327
17 0
1,145 104
0 222
4,270 0 2
34 64
5,372 0
177 5 3
13 3
1,184 195
0 3,075
14,442
89,965
26,158 1,939
11 23,816
10 0
617 100
0 171
3,284 0 1
16 48
4,118 0
107 1 6
10 1
93 114
0 3,153
11,966
86,100
27,633 2,277
5 23,277
15 0
732 38 0
192 2,608
0 1
23 252
4,517 0
188 10 9
21 2
224 78 2
2,810 11,555
88,115
25,3362,374
7 26,387
70
877680
2542,638
00
16264
4,558
1483
25191
340147
12,524
14,497
87,493
1/ Preliminary. 2/ One bag = 132.276 pounds. Green Bean Equivalent.
Source: International Coffee Organization (ICO).
December 2004 Horticultural and Tropical Products Divsision, FAS/USDA

World Coffee Consumption By Importing Country
Importing Country 1998 1999 2000 2001 2002 2003 1/
----------Thousand 60-kilogram bags 2/----------
Europe: EU:
Austria 1,104 1,138 888 1,049 952 757 Belgium-Luxembourg 1,336 940 1,304 987 1,635 1,719 Denmark 845 858 784 863 806 728 Finland 1,005 985 972 952 974 988 France 5,345 5,570 5,400 5,241 5,492 5,428 Germany 9,583 10,200 9,183 9,468 9,064 9,133 Greece 679 648 713 579 865 1,003 Ireland 92 135 83 147 136 151 Italy 4,952 4,936 5,163 5,252 5,180 5,503 Netherlands 1,979 1,504 1,911 1,732 1,641 1,857 Portugal 715 798 681 768 739 745 Spain 3,070 3,385 3,058 2,869 2,908 2,826 Sweden 1,249 1,284 1,182 1,259 1,235 1,181 United Kingdom 2,586 2,255 2,363 2,185 2,225 2,189
Total EU 34,540 34,636 33,685 33,351 33,852 34,208 Other:
Bosnia & Herzegovina 314 84 63 112 179 Bulgaria 294 357 271 349 338 Croatia 320 337 327 337 355 Cyprus 49 54 68 55 53 54 Czech Republic 523 623 550 655 646 556 Estonia 90 97 99 110 112 118 Hungary 652 730 733 740 709 Latvia 133 121 112 156 151 170 Lithuania 146 157 172 203 207 176 Norway 703 785 658 711 692 682 Poland 1,797 1,768 1,765 1,958 1,952 Romania 584 506 551 631 737 Russia 1,523 1,228 1,729 2,801 3,301 Serbia & Montenegro 460 451 644 671 731 Switzerland 811 863 826 819 824 844 Slovakia 240 266 262 308 298 318 Slovenia 162 174 177 193 201 182 Ukraine 126 253 179 228 321 Others 156 172 192 261 288
Total Europe 43,623 43,662 43,063 44,649 45,947
Other: Algeria 475 2,228 1,779 1,455 1,852 1,752 Argentina 640 642 623 636 522 Armenia 104 115 135 180 172 Australia 856 906 832 765 976 Canada 2,317 2,303 2,377 2,535 2,302 Chile 127 155 218 214 170 China 95 83 105 32 25 Israel 457 395 287 367 366 Japan 6,122 6,343 6,693 7,004 6,934 6,812 Jordan 110 101 157 126 191 Korea, Republic of 988 1,087 1,246 1,258 1,306 Lebanon 337 315 310 462 236 Malaysia 101 -9 -244 -489 -508 Morocco 445 373 503 490 505 New Zealand 183 168 186 257 275 Puerto Rico 95 165 131 66 111 Saudi Arabia 338 358 403 372 446 Singapore 0 0 0 0 0 0 South Africa, Republic of 236 289 366 298 322 Sudan 140 161 129 178 224 Syria 268 277 221 641 426 Taiwan 260 303 376 417 446 Tunisia 147 164 174 233 230 Turkey 286 265 291 299 408 United Arab Emirates 139 136 161 151 161 United States 18,549 19,197 18,558 19,343 18,870 20,505 Other Africa 252 330 253 251 336 Other Asia 231 229 275 312 341 Other Latin America 103 88 104 119 123 Other North America 15 12 18 14 19 Other Oceania 1 3 4 4 4 Other Producing Non-Members -178 -252 -305 -254 -331
Total 34,239 36,930 36,366 37,736 37,460
Grand Total 77,862 80,592 79,429 82,385 83,407 3/ 85,105
1/ Preliminary. 2/ One bag = 132.276 pounds. Green Bean Equivalent. 3/ Estimated.
Note: Disappearance is derived on the basis of the data on net imports of all forms of coffee adjusted for changes in visibleinventories. U.S. data are derived from roastings and net imports of processed coffee. Data for some countries refer to net imports.
Source: International Coffee Organization.
December 2004 Horticultural and Tropical Products Division, FAS/USDA
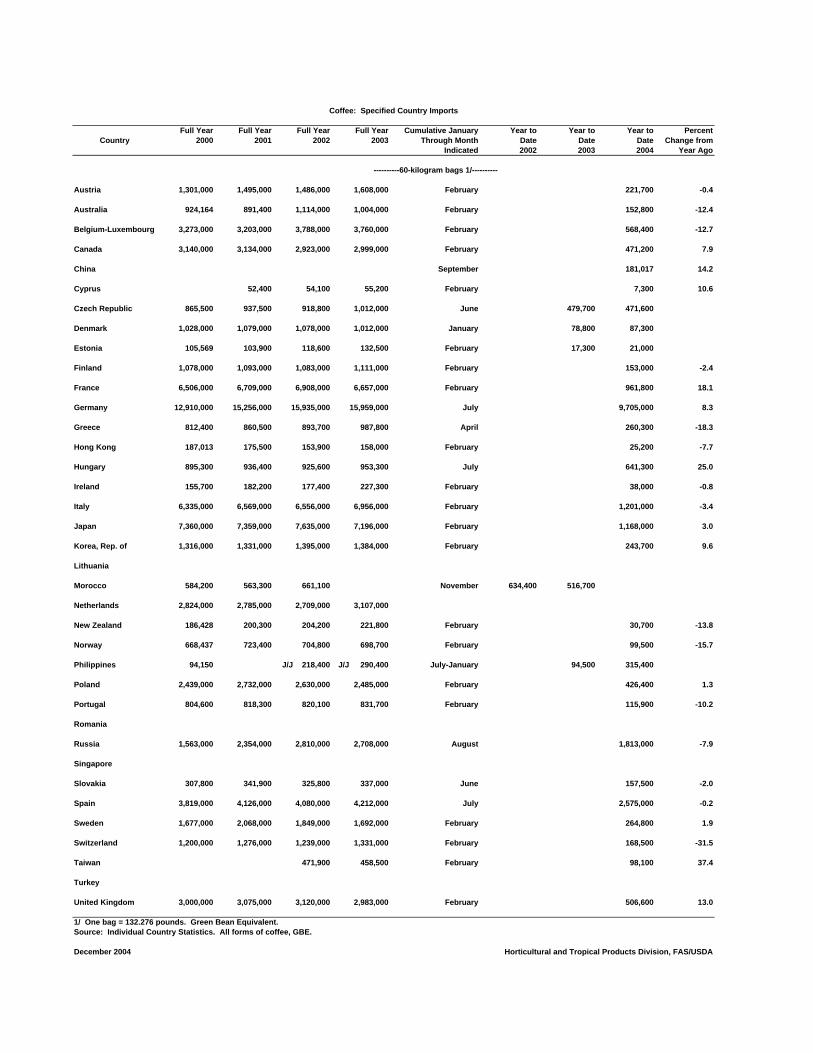
Coffee: Specified Country Imports
Full Year Full Year Full Year Full Year Cumulative January Year to Year to Year to Percent Country 2000 2001 2002 2003 Through Month Date Date Date Change from
Indicated 2002 2003 2004 Year Ago
Austria 1,301,000 1,495,000 1,486,000
Australia 924,164 891,400 1,114,000
Belgium-Luxembourg 3,273,000 3,203,000 3,788,000
Canada 3,140,000 3,134,000 2,923,000
China
Cyprus 52,400 54,100
Czech Republic 865,500 937,500 918,800
Denmark 1,028,000 1,079,000 1,078,000
Estonia 105,569 103,900 118,600
Finland 1,078,000 1,093,000 1,083,000
France 6,506,000 6,709,000 6,908,000
Germany 12,910,000 15,256,000 15,935,000
Greece 812,400 860,500 893,700
Hong Kong 187,013 175,500 153,900
Hungary 895,300 936,400 925,600
Ireland 155,700 182,200 177,400
Italy 6,335,000 6,569,000 6,556,000
Japan 7,360,000 7,359,000 7,635,000
Korea, Rep. of 1,316,000 1,331,000 1,395,000
Lithuania
Morocco 584,200 563,300 661,100
Netherlands 2,824,000 2,785,000 2,709,000
New Zealand 186,428 200,300 204,200
Norway 668,437 723,400 704,800
Philippines 94,150 J/J 218,400
Poland 2,439,000 2,732,000 2,630,000
Portugal 804,600 818,300 820,100
Romania
Russia 1,563,000 2,354,000 2,810,000
Singapore
Slovakia 307,800 341,900 325,800
Spain 3,819,000 4,126,000 4,080,000
Sweden 1,677,000 2,068,000 1,849,000
Switzerland 1,200,000 1,276,000 1,239,000
Taiwan 471,900
Turkey
United Kingdom 3,000,000 3,075,000 3,120,000
----------60-kilogram bags 1/----------
1,608,000 February 221,700 -0.4
1,004,000 February 152,800 -12.4
3,760,000 February 568,400 -12.7
2,999,000 February 471,200 7.9
September 181,017 14.2
55,200 February 7,300 10.6
1,012,000 June 479,700 471,600
1,012,000 January 78,800 87,300
132,500 February 17,300 21,000
1,111,000 February 153,000 -2.4
6,657,000 February 961,800 18.1
15,959,000 July 9,705,000 8.3
987,800 April 260,300 -18.3
158,000 February 25,200 -7.7
953,300 July 641,300 25.0
227,300 February 38,000 -0.8
6,956,000 February 1,201,000 -3.4
7,196,000 February 1,168,000 3.0
1,384,000 February 243,700 9.6
November 634,400 516,700
3,107,000
221,800 February 30,700 -13.8
698,700 February 99,500 -15.7
J/J 290,400 July-January 94,500 315,400
2,485,000 February 426,400 1.3
831,700 February 115,900 -10.2
2,708,000 August 1,813,000 -7.9
337,000 June 157,500 -2.0
4,212,000 July 2,575,000 -0.2
1,692,000 February 264,800 1.9
1,331,000 February 168,500 -31.5
458,500 February 98,100 37.4
2,983,000 February 506,600 13.0
1/ One bag = 132.276 pounds. Green Bean Equivalent. Source: Individual Country Statistics. All forms of coffee, GBE.
December 2004 Horticultural and Tropical Products Division, FAS/USDA

Coffee: ICO Monthly and Composite Indicator Prices on the New York Market 1979 ICA Agreement Basis
Jan. Feb. Mar. Apr. May June July Aug. Sept. Oct. Nov. Dec. Annual
--------Cents per pound--------
Colombian: (Mild Arabicas) 1995 177.23 175.07 185.75 180.30 177.18 170.89 157.22 163.21 141.49 132.08 129.09 110.47 158.33 1996 119.08 134.94 130.60 134.31 142.56 133.25 135.39 137.68 123.30 127.77 129.41 126.41 131.23 1997 146.18 188.62 212.96 199.22 318.50 227.15 190.57 193.46 196.29 169.40 161.38 183.32 198.92 1998 184.21 190.59 166.07 158.17 146.33 135.83 125.03 129.45 117.56 115.01 121.74 123.96 142.83 1999 123.07 116.92 117.05 114.02 123.95 121.45 107.05 105.28 97.77 103.69 126.76 140.35 116.45 2000 130.13 124.73 119.51 112.67 110.31 100.30 101.67 91.87 89.98 90.25 84.01 75.81 102.60 2001 75.33 76.70 76.94 78.25 80.92 74.38 69.70 73.50 68.80 63.85 65.72 62.57 72.22 2002 63.46 65.64 71.16 70.17 63.44 60.86 59.60 58.98 62.49 66.54 72.83 67.92 65.26 2003 69.68 69.60 61.82 66.12 67.56 65.01 67.84 68.65 68.37 66.59 67.04 69.38 67.31 2004 76.61 79.34 80.12 77.08 80.61 85.62 78.27 78.85 85.71 85.52 95.63 82.12 1/
Other: (Mild Arabicas) 1995 171.74 168.71 178.22 172.81 168.83 151.56 143.83 151.41 131.87 125.38 123.23 103.99 149.30 1996 109.38 122.71 119.05 122.01 128.56 124.46 120.47 122.49 114.05 120.62 119.90 115.01 119.89 1997 131.83 167.20 193.82 204.43 264.50 212.55 186.52 185.17 184.38 161.45 154.15 174.25 185.02 1998 175.04 175.87 154.82 147.08 134.35 121.56 113.86 119.89 108.07 107.07 113.84 115.54 132.25 1999 110.99 103.24 103.23 99.69 109.10 104.21 90.85 87.64 81.06 92.22 112.74 123.56 101.54 2000 109.17 101.17 98.26 92.41 91.76 84.10 85.20 74.52 73.83 75.43 70.47 64.81 85.09 2001 64.98 67.00 65.88 65.68 68.94 63.79 58.47 59.68 57.71 56.53 58.96 55.63 61.94 2002 57.34 60.51 66.38 65.78 58.45 55.12 53.07 52.02 57.58 64.05 70.15 64.75 60.43 2003 65.22 67.60 61.66 65.35 66.47 61.34 62.32 63.60 65.50 62.58 62.36 65.01 64.08 2004 74.25 77.51 77.29 74.24 76.40 82.24 73.64 72.99 81.22 79.90 89.88 78.14 1/
Brazilian and Other: (Arabicas) 1995 162.81 161.07 171.48 166.54 161.72 145.22 139.68 149.54 130.26 127.23 125.33 110.46 145.95 1996 127.54 144.05 140.99 132.92 134.76 125.44 106.93 108.28 103.10 105.77 103.76 103.71 119.77 1997 127.28 160.21 179.75 183.73 209.62 184.21 158.52 158.25 167.77 152.12 149.07 171.12 166.80 1998 179.83 177.78 154.84 141.11 124.89 104.09 96.22 101.92 92.76 91.32 96.67 100.28 121.81 1999 99.43 91.72 88.90 86.14 96.29 91.69 78.13 76.67 70.43 78.74 98.41 109.47 88.84 2000 97.68 91.51 89.93 86.46 87.23 78.32 79.89 70.57 71.14 72.28 68.95 64.39 79.86 2001 62.38 62.50 60.35 55.11 57.19 51.86 46.43 46.49 42.42 37.67 42.28 41.60 50.52 2002 42.56 42.79 48.79 49.90 45.19 42.96 43.58 40.55 44.46 45.28 48.37 46.70 45.09 2003 49.14 48.54 42.99 48.71 51.06 47.11 49.64 52.88 55.19 53.51 54.15 56.92 50.82 2004 64.32 66.08 65.79 62.89 64.31 67.62 59.39 60.25 69.46 68.63 80.20 66.27 1/
Robustas: 1995 132.26 135.22 146.83 145.47 141.89 129.53 120.89 131.28 116.41 114.15 112.79 94.72 126.79 1996 91.99 98.99 91.99 91.45 92.10 86.46 78.14 80.16 74.83 72.97 70.51 63.08 82.72 1997 67.66 76.65 81.31 78.48 95.74 91.94 82.52 76.92 77.43 76.90 78.20 84.65 80.70 1998 86.03 85.79 84.67 90.60 92.64 84.55 78.40 79.98 80.88 80.36 80.40 82.82 83.93 1999 81.65 77.68 72.70 68.89 68.28 66.20 62.28 63.80 60.44 59.25 64.10 66.40 67.64 2000 53.62 49.41 47.26 45.21 45.19 43.72 41.93 38.94 39.47 36.55 33.34 30.78 42.12 2001 32.97 31.96 30.96 28.59 29.71 29.33 27.59 25.86 23.79 21.26 22.03 23.57 27.30 2002 22.88 24.46 29.77 30.35 29.43 29.26 29.31 28.74 33.31 34.44 39.38 38.68 30.83 2003 42.75 42.35 38.36 38.68 38.90 35.33 36.71 37.92 38.76 37.32 36.05 37.59 38.39 2004 41.32 39.10 38.61 38.02 38.04 41.09 36.44 34.81 35.10 31.77 34.07 37.12 1/
Average 1976 OMs & Robustas: 1994 69.06 72.47 76.02 80.94 109.01 127.94 191.16 180.38 201.53 184.58 167.48 148.98 134.13 1995 152.01 151.97 162.53 159.14 155.36 140.55 132.36 141.35 124.14 119.77 118.01 99.36 138.05 1996 100.69 110.85 105.52 106.73 110.33 105.46 99.31 101.32 94.44 96.80 95.21 89.04 101.31 1997 99.75 121.93 137.56 141.46 180.12 152.25 134.52 131.05 130.91 119.18 116.17 129.45 132.86 1998 130.53 130.84 119.75 118.84 113.50 103.05 96.13 99.94 94.48 93.75 N/A N/A 110.08
Composite 1979 ICA: 1995 152.08 152.24 162.73 159.59 155.96 141.66 132.71 141.70 124.76 120.02 117.99 99.57 138.42 1996 100.33 110.50 105.89 107.09 110.24 105.79 99.97 102.73 96.52 98.56 97.14 90.04 102.07 1997 100.03 121.89 137.47 142.20 180.44 155.38 135.04 132.63 132.51 121.09 118.16 130.02 133.91 1998 130.61 130.78 119.93 119.66 114.23 103.84 97.32 101.25 95.82 95.01 98.26 100.73 108.95 1999 97.63 92.36 89.41 85.72 89.51 86.41 78.21 77.22 71.94 76.36 88.22 95.63 85.72 2000 82.15 76.15 73.49 69.53 69.23 64.56 64.09 57.59 57.31 56.40 52.18 48.27 64.25 2001 49.19 49.39 48.52 47.31 49.38 46.54 43.07 42.77 41.17 42.21 44.24 43.36 45.60 2002 43.46 44.30 49.49 50.19 47.30 45.56 44.70 42.79 47.96 50.79 54.69 51.68 47.74 2003 54.04 54.07 49.61 51.87 53.19 48.90 50.89 52.22 54.10 51.72 49.81 52.44 51.91 2004 58.69 59.87 60.80 58.80 59.91 64.28 58.46 56.98 61.47 61.10 67.74 60.74 1/
Source: International Coffee Organization (ICO).Note: N/A = not available.International Coffee Agreement (ICA) Other milds (OMs)1/ Cumulative through the latest month. New series for the calculation of the composite price from October 1, 2001.
December 2004

New York Spot Prices for Brazil's Arabica Coffee 1/
Year Jan. Feb. Mar. Apr. May June July Aug. Sept. Oct. Nov. Dec. Annual
----------Cents per pound----------
1967 38.59 38.15 37.84 38.30 39.26 39.04 38.14 37.86 37.34 36.36 36.52 36.67 37.84 1968 37.32 37.05 37.01 37.43 37.50 37.48 37.46 37.14 37.27 37.35 37.08 37.46 37.30 1969 38.48 38.47 37.50 37.27 37.13 37.23 37.06 N/A 42.93 47.00 48.11 48.58 40.89 1970 52.54 52.75 52.63 53.08 53.50 54.05 55.93 57.73 58.74 58.09 58.45 56.11 55.30 1971 55.49 51.21 44.10 42.92 42.59 43.44 41.70 41.74 42.07 42.27 42.20 43.87 44.47 1972 44.27 44.45 45.52 46.01 47.43 48.07 55.38 59.88 57.08 55.83 56.22 56.29 51.37 1973 57.58 61.81 64.58 65.67 66.80 68.70 71.71 71.99 71.21 71.78 72.02 72.39 68.02 1974 69.14 72.61 75.88 75.98 76.75 74.58 69.51 67.50 63.85 67.58 68.53 69.77 70.97 1975 71.22 73.01 71.80 70.43 75.16 75.19 68.50 96.04 95.50 95.36 94.06 98.15 82.04 1976 109.05 118.83 116.13 133.90 148.60 150.63 151.08 150.45 154.59 162.28 182.82 212.53 149.24 1977 247.26 262.55 359.09 369.00 326.89 319.95 316.84 315.00 315.00 315.00 317.50 227.86 307.66 1978 216.36 200.44 166.56 168.95 161.26 167.09 147.46 144.63 152.99 153.33 150.21 143.15 164.37 1979 135.43 128.82 138.44 145.01 154.38 192.33 201.98 197.86 208.95 211.26 214.14 213.52 178.51 1980 213.04 197.25 204.21 208.12 215.13 181.33 207.26 208.95 211.14 210.39 208.15 212.93 206.49 1981 221.72 N/A 218.58 218.50 N/A 224.76 169.43 143.05 137.50 149.18 158.56 154.21 181.54 1982 148.95 153.11 143.70 143.86 141.33 144.42 138.17 142.05 142.92 141.31 141.63 142.69 143.68 1983 140.73 142.29 142.02 140.86 141.51 142.81 142.51 138.70 136.65 145.31 146.88 152.76 142.75 1984 155.15 155.38 152.82 149.80 145.91 149.45 146.99 150.62 151.55 147.63 144.93 145.59 149.65 1985 152.10 157.25 155.56 146.33 143.84 136.71 130.81 133.25 139.03 150.27 174.28 201.70 151.76 1986 303.42 276.26 286.68 288.55 280.24 229.10 183.40 190.43 210.36 187.99 175.58 162.40 231.20 1987 119.75 114.42 97.41 101.68 111.96 98.34 89.95 91.40 100.67 111.68 122.05 117.09 106.37 1988 117.35 130.40 126.21 123.30 121.02 122.81 120.01 111.89 118.79 115.65 118.53 136.11 121.84 1989 145.29 128.72 128.06 131.45 128.94 115.02 78.75 67.32 67.75 60.32 65.53 67.93 98.76 1990 70.36 77.59 86.17 87.45 86.31 82.94 78.94 90.25 92.20 85.78 77.46 80.17 82.97 1991 75.59 79.39 83.83 81.58 75.56 72.44 69.24 68.15 75.08 65.91 66.03 62.14 72.91 1992 62.03 58.05 59.60 54.94 51.11 49.08 48.53 46.40 49.43 59.64 64.64 74.39 56.49 1993 67.13 66.34 62.60 54.92 57.26 55.70 65.76 73.25 75.58 71.65 74.20 74.51 66.58 1994 71.42 80.14 84.72 87.14 118.37 136.43 211.81 192.38 212.73 191.21 172.83 159.73 143.24 1995 162.81 161.07 171.48 166.54 161.72 145.22 139.68 149.54 130.26 127.23 125.33 110.46 145.95 1996 127.54 144.05 140.99 132.92 134.76 125.44 106.93 108.28 103.10 105.77 103.76 103.71 119.77 1997 127.28 160.21 179.75 183.73 209.62 184.21 158.52 158.25 167.77 152.12 149.07 171.12 166.80 1998 179.83 177.78 154.84 141.11 124.89 104.09 96.22 101.92 92.76 91.32 96.67 100.28 121.81 1999 99.43 91.72 88.90 86.14 96.29 91.69 78.13 76.67 70.43 78.74 98.41 109.47 88.84 2000 97.68 91.51 89.93 86.46 87.23 78.32 79.89 70.57 71.14 72.28 68.95 64.39 79.86 2001 62.38 62.50 60.35 55.11 57.19 51.86 46.43 46.49 42.42 37.67 42.28 41.6 50.52 2002 42.56 42.79 48.79 49.90 45.19 42.96 43.58 40.55 44.46 45.28 48.37 46.7 45.09 2003 49.14 48.54 42.99 48.71 51.06 47.11 49.64 52.88 55.19 53.51 54.15 56.92 50.82 2004 64.32 66.08 65.79 62.89 64.31 67.62 59.39 60.25 69.46 68.63 80.2 66.27
1/ Prices through 1980 New York spot Santos #4. Prices from 1981 are International Coffee Organization's quotes for New York spot market prices for Brazilian and Other Arabicas.
Note: N/A = not available.
Note: Cumulative for current year is cumulative through latest available month.
December 2004 Horticultural and Tropical Products Division, FAS/USDA

Average Monthly U.S. Retail Coffee Prices for Roasted Coffee 1/
Year Jan. Feb. Mar. Apr. May June July Aug. Sept. Oct. Nov. Dec. Annual
----------Dollars per pound----------
1985 2.685 2.705 2.709 2.701 2.693 2.698 2.701 2.649 2.637 2.648 2.637 2.559 2.669 1986 2.762 3.601 3.805 3.737 3.698 3.666 3.593 3.458 3.262 3.245 3.281 3.275 3.449 1987 3.244 3.165 3.109 3.015 2.917 2.904 2.874 2.777 2.816 2.880 2.760 2.729 2.933 1988 2.830 2.833 2.768 2.845 2.827 2.812 2.874 2.831 2.840 2.855 2.892 2.925 2.844 1989 2.964 3.052 3.039 3.115 3.163 3.167 3.225 3.171 3.098 3.038 2.903 2.937 3.073 1990 2.917 2.965 2.891 2.885 2.938 2.977 3.054 3.027 3.025 3.030 2.945 2.941 2.966 1991 2.945 2.971 2.894 2.924 2.879 2.866 2.805 2.724 2.692 2.706 2.673 2.625 2.809 1992 2.668 2.688 2.631 2.612 2.660 2.625 2.652 2.613 2.537 2.492 2.391 2.364 2.578 1993 2.352 2.452 2.462 2.477 2.514 2.533 2.548 2.500 2.493 2.415 2.433 2.480 2.472 1994 2.530 2.529 2.515 2.516 2.535 2.598 3.341 4.480 4.458 4.450 4.482 4.382 3.401 1995 4.398 4.234 4.108 4.084 4.067 4.059 4.027 4.051 3.996 3.865 3.814 3.752 4.038 1996 3.577 3.590 3.550 3.527 3.444 3.438 3.380 3.390 3.333 3.344 3.283 3.307 3.430 1997 3.300 3.316 3.512 3.894 4.109 4.428 4.628 4.669 4.617 4.392 4.303 4.161 4.111 1998 4.025 3.973 4.033 3.959 3.878 3.786 3.771 3.704 3.620 3.503 3.482 3.446 3.765 1999 3.435 3.428 3.476 3.466 3.495 3.421 3.420 3.428 3.393 3.482 3.337 3.347 3.427 2000 3.540 3.677 3.633 3.584 3.531 3.431 3.446 3.444 3.339 3.317 3.243 3.212 3.450 2001 3.224 3.217 3.205 3.128 3.097 3.156 3.097 3.046 3.025 3.015 2.988 2.913 3.093 2002 2.936 2.946 2.859 2.976 3.011 2.938 2.977 2.929 2.921 2.872 2.882 2.838 2.924 2003 2.999 2.924 2.933 3.008 2.937 2.931 2.944 2.921 2.919 2.825 2.779 2.875 2.916 2004 2.892 2.856 2.932 2.908 2.831 2.750 2.878 2.878 2.874 2.840 2.864 2/
1/ Roasted coffee in 13.1- to 20-ounce cans. Any size packs beginning September 1988. 2/ Cumulative through the latest month.
Source: Bureau of Labor Statistics, U.S. Department of Labor.
Average Monthly U.S. Retail Coffee Prices for Instant Coffee 1/
Year Jan. Feb. Mar. Apr. May June July Aug. Sept. Oct. Nov. Dec. Annual
----------Dollars per pound----------
1995 10.691 10.765 10.616 10.569 10.415 10.299 10.559 1996 10.313 10.318 10.233 10.147 10.066 9.972 9.790 9.846 9.721 9.693 9.696 9.711 9.959 1997 9.695 9.907 10.110 10.263 10.365 10.602 10.686 10.619 10.511 10.581 10.465 10.346 10.346 1998 10.607 10.516 10.436 10.447 10.416 10.445 10.444 10.413 10.451 10.547 10.530 10.544 10.483 1999 10.446 10.493 10.395 10.328 10.400 10.342 10.354 10.445 10.430 10.428 10.280 10.285 10.386 2000 10.497 10.445 10.516 10.512 10.918 11.375 11.314 11.338 11.271 11.253 11.242 11.379 11.005 2001 11.450 11.466 11.545 11.549 11.522 11.586 11.570 11.590 11.995 12.089 12.104 11.964 11.703 2002 11.970 11.909 11.925 11.900 12.129 12.113 12.111 12.155 12.087 12.155 12.166 12.332 12.079 2003 12.302 12.264 12.327 12.261 11.923 11.823 12.049 12.140 12.169 N/A N/A N/A 12.140 2/
1/ Instant coffee refers to soluble coffee that is neither flavored nor decaffeinated. Calculation of average retail prices for instant coffee began in July 1995. 2/ Cumulative through the latest month. N/A - Not Available.
Source: Bureau of Labor Statistics, U.S. Department of Labor.
December 2004 Horticultural and Tropical Products Division, FAS/USDA

U.S. Coffee Stocks 1/
Month End 1997 1998 1999 2000 2001 2002 2003 2004
--------Thousand 60-kilogram bags--------
January 1,342 1,421 1,751 3,136 5,603 5,381 5,866 5,624 February 1,546 1,712 1,936 3,501 5,778 5,361 6,063 5,828 March 1,657 1,827 2,410 4,056 5,958 5,283 6,269 5,955 April 1,855 1,862 2,534 4,618 5,894 5,315 6,373 5,845 May 1,977 1,997 2,672 5,012 5,973 5,061 6,458 5,836 June 2,116 1,907 2,750 5,443 6,054 5,137 6,326 6,110 July 2,335 1,811 2,880 6,133 5,996 5,285 6,365 6,004 August 2,583 1,821 2,883 6,245 5,910 5,343 6,227 5,873 September 2,294 1,680 2,824 6,259 5,793 5,488 6,090 5,619 October 1,911 1,477 2,713 6,023 5,566 5,513 5,984 5,401 November 1,515 1,268 2,397 5,758 5,356 5,545 5,678 December 1,428 1,408 2,627 5,593 5,398 5,720 5,490
1/ In bags of original weight. Includes Exchange and non-Exchange stocks.
Source: Green Coffee Association of New York City, Inc.
December 2004 Horticultural and Tropical Products Division, FAS/USDA
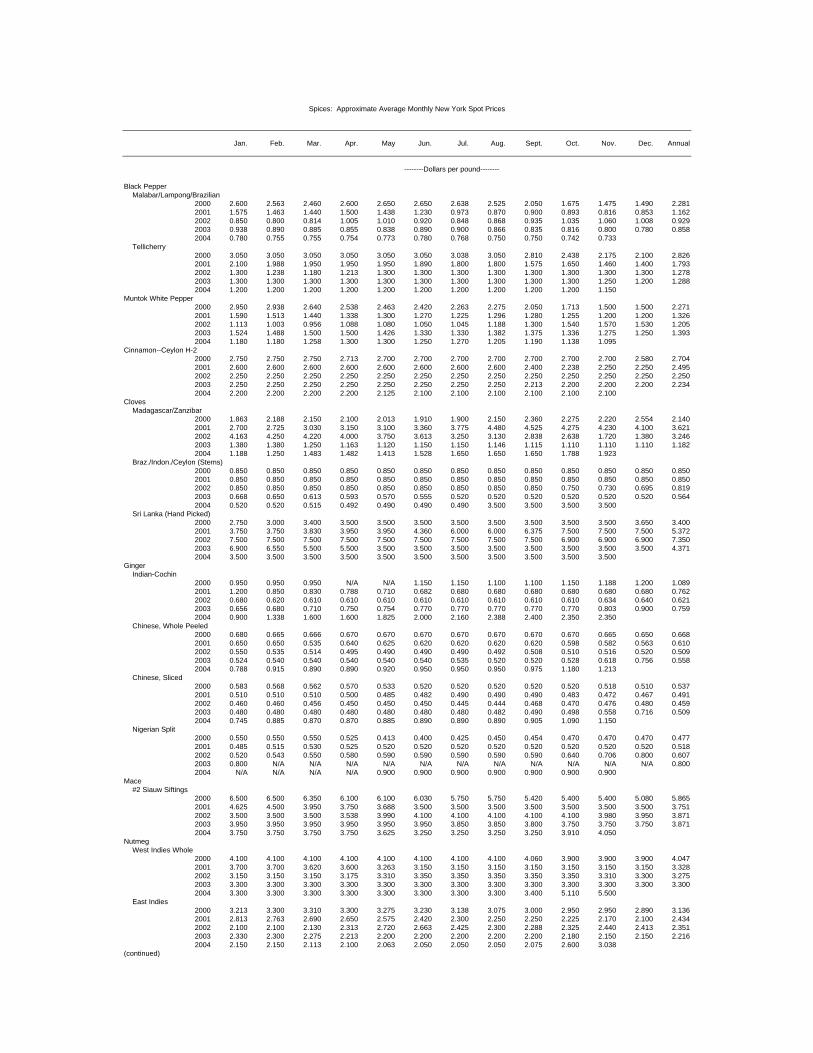
Spices: Approximate Average Monthly New York Spot Prices
Jan. Feb. Mar. Apr. May Jun. Jul. Aug. Sept. Oct. Nov. Dec. Annual
--------Dollars per pound--------
Black Pepper Malabar/Lampong/Brazilian
2000 2.600 2.563 2.460 2.600 2.650 2.650 2.638 2.525 2.050 1.675 1.475 1.490 2.281 2001 1.575 1.463 1.440 1.500 1.438 1.230 0.973 0.870 0.900 0.893 0.816 0.853 1.162 2002 0.850 0.800 0.814 1.005 1.010 0.920 0.848 0.868 0.935 1.035 1.060 1.008 0.929 2003 0.938 0.890 0.885 0.855 0.838 0.890 0.900 0.866 0.835 0.816 0.800 0.780 0.858 2004 0.780 0.755 0.755 0.754 0.773 0.780 0.768 0.750 0.750 0.742 0.733
Tellicherry 2000 3.050 3.050 3.050 3.050 3.050 3.050 3.038 3.050 2.810 2.438 2.175 2.100 2.826 2001 2.100 1.988 1.950 1.950 1.950 1.890 1.800 1.800 1.575 1.650 1.460 1.400 1.793 2002 1.300 1.238 1.180 1.213 1.300 1.300 1.300 1.300 1.300 1.300 1.300 1.300 1.278 2003 1.300 1.300 1.300 1.300 1.300 1.300 1.300 1.300 1.300 1.300 1.250 1.200 1.288 2004 1.200 1.200 1.200 1.200 1.200 1.200 1.200 1.200 1.200 1.200 1.150
Muntok White Pepper 2000 2.950 2.938 2.640 2.538 2.463 2.420 2.263 2.275 2.050 1.713 1.500 1.500 2.271 2001 1.590 1.513 1.440 1.338 1.300 1.270 1.225 1.296 1.280 1.255 1.200 1.200 1.326 2002 1.113 1.003 0.956 1.088 1.080 1.050 1.045 1.188 1.300 1.540 1.570 1.530 1.205 2003 1.524 1.488 1.500 1.500 1.426 1.330 1.330 1.382 1.375 1.336 1.275 1.250 1.393 2004 1.180 1.180 1.258 1.300 1.300 1.250 1.270 1.205 1.190 1.138 1.095
Cinnamon--Ceylon H-2 2000 2.750 2.750 2.750 2.713 2.700 2.700 2.700 2.700 2.700 2.700 2.700 2.580 2.704 2001 2.600 2.600 2.600 2.600 2.600 2.600 2.600 2.600 2.400 2.238 2.250 2.250 2.495 2002 2.250 2.250 2.250 2.250 2.250 2.250 2.250 2.250 2.250 2.250 2.250 2.250 2.250 2003 2.250 2.250 2.250 2.250 2.250 2.250 2.250 2.250 2.213 2.200 2.200 2.200 2.234 2004 2.200 2.200 2.200 2.200 2.125 2.100 2.100 2.100 2.100 2.100 2.100
Cloves Madagascar/Zanzibar
2000 1.863 2.188 2.150 2.100 2.013 1.910 1.900 2.150 2.360 2.275 2.220 2.554 2.140 2001 2.700 2.725 3.030 3.150 3.100 3.360 3.775 4.480 4.525 4.275 4.230 4.100 3.621 2002 4.163 4.250 4.220 4.000 3.750 3.613 3.250 3.130 2.838 2.638 1.720 1.380 3.246 2003 1.380 1.380 1.250 1.163 1.120 1.150 1.150 1.146 1.115 1.110 1.110 1.110 1.182 2004 1.188 1.250 1.483 1.482 1.413 1.528 1.650 1.650 1.650 1.788 1.923
Braz./Indon./Ceylon (Stems) 2000 0.850 0.850 0.850 0.850 0.850 0.850 0.850 0.850 0.850 0.850 0.850 0.850 0.850 2001 0.850 0.850 0.850 0.850 0.850 0.850 0.850 0.850 0.850 0.850 0.850 0.850 0.850 2002 0.850 0.850 0.850 0.850 0.850 0.850 0.850 0.850 0.850 0.750 0.730 0.695 0.819 2003 0.668 0.650 0.613 0.593 0.570 0.555 0.520 0.520 0.520 0.520 0.520 0.520 0.564 2004 0.520 0.520 0.515 0.492 0.490 0.490 0.490 3.500 3.500 3.500 3.500
Sri Lanka (Hand Picked) 2000 2.750 3.000 3.400 3.500 3.500 3.500 3.500 3.500 3.500 3.500 3.500 3.650 3.400 2001 3.750 3.750 3.830 3.950 3.950 4.360 6.000 6.000 6.375 7.500 7.500 7.500 5.372 2002 7.500 7.500 7.500 7.500 7.500 7.500 7.500 7.500 7.500 6.900 6.900 6.900 7.350 2003 6.900 6.550 5.500 5.500 3.500 3.500 3.500 3.500 3.500 3.500 3.500 3.500 4.371 2004 3.500 3.500 3.500 3.500 3.500 3.500 3.500 3.500 3.500 3.500 3.500
Ginger Indian-Cochin
2000 0.950 0.950 0.950 N/A N/A 1.150 1.150 1.100 1.100 1.150 1.188 1.200 1.089 2001 1.200 0.850 0.830 0.788 0.710 0.682 0.680 0.680 0.680 0.680 0.680 0.680 0.762 2002 0.680 0.620 0.610 0.610 0.610 0.610 0.610 0.610 0.610 0.610 0.634 0.640 0.621 2003 0.656 0.680 0.710 0.750 0.754 0.770 0.770 0.770 0.770 0.770 0.803 0.900 0.759 2004 0.900 1.338 1.600 1.600 1.825 2.000 2.160 2.388 2.400 2.350 2.350
Chinese, Whole Peeled 2000 0.680 0.665 0.666 0.670 0.670 0.670 0.670 0.670 0.670 0.670 0.665 0.650 0.668 2001 0.650 0.650 0.535 0.640 0.625 0.620 0.620 0.620 0.620 0.598 0.582 0.563 0.610 2002 0.550 0.535 0.514 0.495 0.490 0.490 0.490 0.492 0.508 0.510 0.516 0.520 0.509 2003 0.524 0.540 0.540 0.540 0.540 0.540 0.535 0.520 0.520 0.528 0.618 0.756 0.558 2004 0.788 0.915 0.890 0.890 0.920 0.950 0.950 0.950 0.975 1.180 1.213
Chinese, Sliced 2000 0.583 0.568 0.562 0.570 0.533 0.520 0.520 0.520 0.520 0.520 0.518 0.510 0.537 2001 0.510 0.510 0.510 0.500 0.485 0.482 0.490 0.490 0.490 0.483 0.472 0.467 0.491 2002 0.460 0.460 0.456 0.450 0.450 0.450 0.445 0.444 0.468 0.470 0.476 0.480 0.459 2003 0.480 0.480 0.480 0.480 0.480 0.480 0.480 0.482 0.490 0.498 0.558 0.716 0.509 2004 0.745 0.885 0.870 0.870 0.885 0.890 0.890 0.890 0.905 1.090 1.150
Nigerian Split 2000 0.550 0.550 0.550 0.525 0.413 0.400 0.425 0.450 0.454 0.470 0.470 0.470 0.477 2001 0.485 0.515 0.530 0.525 0.520 0.520 0.520 0.520 0.520 0.520 0.520 0.520 0.518 2002 0.520 0.543 0.550 0.580 0.590 0.590 0.590 0.590 0.590 0.640 0.706 0.800 0.607 2003 0.800 N/A N/A N/A N/A N/A N/A N/A N/A N/A N/A N/A 0.800 2004 N/A N/A N/A N/A 0.900 0.900 0.900 0.900 0.900 0.900 0.900
Mace #2 Siauw Siftings
2000 6.500 6.500 6.350 6.100 6.100 6.030 5.750 5.750 5.420 5.400 5.400 5.080 5.865 2001 4.625 4.500 3.950 3.750 3.688 3.500 3.500 3.500 3.500 3.500 3.500 3.500 3.751 2002 3.500 3.500 3.500 3.538 3.990 4.100 4.100 4.100 4.100 4.100 3.980 3.950 3.871 2003 3.950 3.950 3.950 3.950 3.950 3.950 3.850 3.850 3.800 3.750 3.750 3.750 3.871 2004 3.750 3.750 3.750 3.750 3.625 3.250 3.250 3.250 3.250 3.910 4.050
Nutmeg West Indies Whole
2000 4.100 4.100 4.100 4.100 4.100 4.100 4.100 4.100 4.060 3.900 3.900 3.900 4.047 2001 3.700 3.700 3.620 3.600 3.263 3.150 3.150 3.150 3.150 3.150 3.150 3.150 3.328 2002 3.150 3.150 3.150 3.175 3.310 3.350 3.350 3.350 3.350 3.350 3.310 3.300 3.275 2003 3.300 3.300 3.300 3.300 3.300 3.300 3.300 3.300 3.300 3.300 3.300 3.300 3.300 2004 3.300 3.300 3.300 3.300 3.300 3.300 3.300 3.300 3.400 5.110 5.500
East Indies 2000 3.213 3.300 3.310 3.300 3.275 3.230 3.138 3.075 3.000 2.950 2.950 2.890 3.136 2001 2.813 2.763 2.690 2.650 2.575 2.420 2.300 2.250 2.250 2.225 2.170 2.100 2.434 2002 2.100 2.100 2.130 2.313 2.720 2.663 2.425 2.300 2.288 2.325 2.440 2.413 2.351 2003 2.330 2.300 2.275 2.213 2.200 2.200 2.200 2.200 2.200 2.180 2.150 2.150 2.216 2004 2.150 2.150 2.113 2.100 2.063 2.050 2.050 2.050 2.075 2.600 3.038
(continued)

Spices: Approximate Average Monthly New York Spot Prices
Jan. Feb. Mar. Apr. May Jun. Jul. Aug. Sept. Oct. Nov. Dec. Annual
--------Dollars per pound--------Pimento (Allspice)
Guatemalan/Honduran 2000 2.738 3.200 2.930 2.600 2.200 2.020 2.000 2.413 2.420 2.300 2.300 2.300 2.452 2001 2.163 2.100 2.000 1.900 1.888 1.770 1.625 1.350 1.400 1.450 1.410 1.283 1.695 2002 1.265 1.290 1.322 1.413 1.390 1.400 1.363 1.580 2.150 2.150 2.130 2.100 1.629 2003 2.100 2.000 1.900 1.900 1.870 1.688 1.650 1.690 1.600 1.550 1.550 1.674 1.764 2004 1.815 2.138 2.150 2.100 2.050 2.013 1.950 1.888 1.813 1.800 1.800
Jamaican 2000 3.645 4.000 3.960 3.688 3.300 3.000 3.000 3.400 3.600 3.825 3.775 3.750 3.579 2001 3.700 3.588 3.330 3.088 2.950 2.950 2.900 2.750 2.720 2.690 2.690 2.690 3.004 2002 2.690 2.910 3.240 3.663 3.700 3.700 3.625 3.870 5.738 6.913 7.850 7.850 4.646 2003 7.850 7.850 7.850 7.850 7.040 6.113 5.800 5.990 6.000 6.000 5.950 6.200 6.708 2004 6.200 6.200 6.200 6.200 6.200 5.975 5.730 5.250 5.250 5.250 4.750
Mexican 2000 2.738 3.200 2.930 2.600 2.200 2.020 2.000 2.325 2.100 2.100 2.063 2.050 2.360 2001 1.913 1.800 1.760 1.688 1.650 1.590 1.425 1.210 1.225 1.250 1.240 1.150 1.492 2002 1.165 1.200 1.226 1.338 1.350 1.350 1.313 1.440 1.750 1.638 1.580 1.550 1.408 2003 1.550 1.550 1.450 1.450 1.430 1.363 1.375 1.540 1.450 1.400 1.400 1.580 1.461 2004 1.740 2.088 2.100 2.050 2.000 1.963 1.880 1.650 1.525 1.500 1.500
Turmeric Indian Alleppey 5.00 Curcumin
2000 0.820 0.810 0.778 0.750 0.730 0.686 0.660 0.660 0.660 0.660 0.660 0.660 0.711 2001 0.660 0.660 0.658 0.650 0.598 0.580 0.580 0.580 0.580 0.580 0.580 0.580 0.607 2002 0.580 0.580 0.588 0.665 0.680 0.680 0.665 0.660 0.660 0.660 0.664 0.680 0.647 2003 0.708 0.750 0.750 0.750 0.750 0.750 0.750 0.750 0.750 0.750 0.750 0.750 0.747 2004 0.750 0.750 0.800 0.800 0.823 0.850 0.870 0.870 0.870 0.870 0.870
Indian Alleppey 5.50 Curcumin 2000 0.850 0.840 0.808 0.780 0.760 0.706 0.680 0.680 0.680 0.680 0.680 0.680 0.735 2001 0.680 0.680 0.676 0.660 0.615 0.600 0.600 0.600 0.600 0.600 0.600 0.600 0.626 2002 0.600 0.600 0.608 0.688 0.700 0.700 0.685 0.680 0.680 0.680 0.684 0.700 0.667 2003 0.732 0.795 0.800 0.800 0.800 0.800 0.800 0.800 0.800 0.800 0.800 0.800 0.794 2004 0.800 0.820 0.850 0.850 0.873 0.890 0.900 0.900 0.900 0.900 0.900
Madras 2000 0.620 0.620 0.620 0.590 0.590 0.590 0.590 0.590 0.590 0.590 0.590 0.590 0.598 2001 0.590 0.590 0.590 0.590 0.560 0.550 0.550 0.550 0.550 0.550 0.550 0.550 0.564 2002 0.550 0.550 0.550 0.550 0.550 0.550 0.550 0.550 0.550 0.550 0.550 0.550 0.550 2003 0.580 N/A N/A 0.550 0.550 N/A N/A N/A N/A N/A N/A N/A 0.560 2004 N/A N/A N/A N/A N/A N/A N/A N/A N/A N/A N/A
Anise Seed Chinese Star Whole
2000 1.950 1.950 2.290 2.500 2.500 3.160 3.250 3.388 3.830 4.075 4.225 4.310 3.119 2001 4.800 4.950 6.140 7.363 8.175 9.000 9.000 8.810 6.188 4.688 4.760 4.500 6.531 2002 4.313 4.250 4.080 4.000 3.780 3.438 3.250 3.170 3.150 3.150 3.100 3.050 3.561 2003 2.460 2.125 2.100 2.100 2.060 2.050 2.025 1.950 1.950 1.950 1.950 2.080 2.067 2004 1.988 1.950 1.950 1.910 1.850 1.805 1.790 1.750 1.750 1.750 1.750
Syrian 2000 1.030 1.040 1.050 1.050 1.050 1.046 1.023 0.913 0.888 0.865 0.845 0.830 0.969 2001 0.830 0.830 0.830 0.830 0.830 0.830 0.853 0.880 0.880 0.880 0.880 0.880 0.853 2002 0.888 0.890 0.910 0.930 0.930 0.930 0.930 0.930 0.930 0.910 0.898 0.870 0.912 2003 0.850 0.850 0.830 0.825 0.810 0.813 0.810 0.784 0.780 0.780 0.780 0.780 0.808 2004 0.820 0.825 0.840 0.840 0.830 0.820 0.820 0.820 0.800 0.790 0.790
Turkish 2000 1.100 1.115 1.130 1.130 1.130 1.102 1.073 0.963 0.938 0.885 0.865 0.850 1.023 2001 0.850 0.850 0.850 0.850 0.850 0.850 0.878 0.920 0.920 0.943 0.962 0.980 0.892 2002 1.028 1.050 1.066 1.070 1.070 1.070 1.070 1.070 1.070 1.070 1.070 1.000 1.059 2003 0.946 0.930 0.900 0.898 0.890 0.928 0.973 0.950 0.950 0.950 0.950 0.950 0.934 2004 0.950 0.950 0.950 0.950 0.935 0.920 0.920 0.920 0.880 0.850 0.850
Cardamom Bleached "AA"
2000 12.000 12.000 12.000 12.000 12.000 12.000 12.000 12.000 12.000 12.000 12.000 12.000 12.000 2001 12.000 12.000 12.000 12.000 12.000 12.000 12.000 12.000 12.000 12.000 12.000 11.667 11.972 2002 11.500 11.500 11.500 11.500 11.500 11.500 11.500 11.500 11.500 11.500 11.500 11.500 11.500 2003 11.500 11.500 11.500 11.500 11.500 11.500 11.500 11.500 11.500 11.500 11.500 11.500 11.500 2004 11.500 11.500 11.500 11.500 11.500 11.500 11.500 11.500 11.500 11.500 11.500
Fancy Greens 2000 8.500 9.000 9.000 9.000 9.000 9.000 9.000 9.000 9.000 9.000 9.000 9.000 8.958 2001 9.375 9.500 9.500 9.500 9.500 9.500 9.500 9.350 9.250 8.625 7.600 7.500 9.058 2002 7.500 7.500 7.500 7.500 7.500 7.500 7.500 7.300 6.938 6.500 5.710 5.375 7.027 2003 5.250 5.250 5.250 5.188 5.000 5.000 5.000 5.000 5.000 4.900 4.500 4.500 4.986 2004 4.500 4.500 4.500 4.500 4.500 4.500 4.500 4.500 4.500 4.440 4.088
Decorticated 2000 5.575 8.350 8.900 8.900 8.900 8.700 8.700 8.700 8.700 8.700 8.700 8.800 8.469 2001 10.100 10.500 10.500 10.500 10.063 9.450 9.250 8.700 8.500 8.000 7.750 7.600 9.243 2002 7.600 7.600 7.520 7.325 7.250 7.150 6.900 6.380 5.825 5.250 4.780 4.600 6.515 2003 4.120 3.250 3.250 3.188 2.940 2.738 2.700 2.700 2.700 2.220 2.100 2.040 2.829 2004 2.000 2.000 1.975 1.870 1.850 1.850 1.850 1.850 1.813 1.680 1.575
Mixed Greens 2000 4.838 6.438 6.920 6.850 6.575 5.840 5.750 5.750 5.750 5.750 5.750 5.750 5.997 2001 5.750 5.750 5.750 5.750 5.750 5.750 5.750 5.550 5.500 4.950 4.900 4.900 5.504 2002 4.900 4.900 4.780 4.650 4.650 4.650 4.650 4.530 4.188 3.750 3.250 3.125 4.335 2003 2.750 2.100 2.100 2.050 1.900 1.900 1.900 1.900 1.900 1.900 1.900 1.810 2.009 2004 1.750 1.675 1.600 1.570 1.550 1.550 1.550 1.550 1.550 1.510 1.338
Celery Seed Indian
2000 0.430 0.430 0.430 0.430 0.420 0.414 0.420 0.420 0.420 0.420 0.420 0.420 0.423 2001 0.420 0.420 0.420 0.420 0.420 0.420 0.420 0.420 0.420 0.420 0.420 0.420 0.420 2002 0.420 0.420 0.414 0.410 0.410 0.410 0.410 0.410 0.410 0.410 0.410 0.415 0.412 2003 0.420 0.420 0.420 0.420 0.424 0.450 0.445 0.430 0.430 0.430 0.430 0.430 0.429 2004 0.438 0.440 0.440 0.440 0.440 0.440 0.440 0.440 0.440 0.440 0.450
(continued)

Spices: Approximate Average Monthly New York Spot Prices
Jan. Feb. Mar. Apr. May Jun. Jul. Aug. Sept. Oct. Nov. Dec. Annual
--------Dollars per pound--------Dill Seed
Indian 2000 0.680 0.735 0.823 0.890 0.890 0.830 0.860 0.860 0.854 0.850 0.850 0.850 0.831 2001 0.850 0.850 0.850 0.838 0.770 0.760 0.738 0.700 0.670 0.665 0.650 0.650 0.749 2002 0.650 0.625 0.550 0.550 0.550 0.550 0.550 0.550 0.550 0.565 0.580 0.580 0.571 2003 0.580 0.580 0.580 0.580 0.580 0.580 0.580 0.580 0.580 0.568 0.520 0.520 0.520 2004 0.520 0.520 0.520 0.520 0.520 0.510 0.510 0.510 0.510 0.510 0.510
Mustard Seed Canadian #1 Yellow
2000 0.300 0.300 0.300 0.300 0.300 0.300 0.300 0.300 0.300 0.295 0.280 0.280 0.296 2001 0.280 0.280 0.280 0.280 0.280 0.280 0.280 0.320 0.320 0.400 0.430 0.477 0.326 2002 0.553 0.650 0.650 0.650 0.650 0.650 0.650 0.650 0.583 0.470 0.482 0.470 0.592 2003 0.534 0.550 0.550 0.550 0.550 0.550 0.490 0.430 0.393 0.368 0.350 0.350 0.472 2004 0.350 0.350 0.350 0.350 0.350 0.350 0.350 0.350 0.350 0.350 0.328
Oriental/Brown 2000 0.310 0.310 0.310 0.310 0.310 0.310 0.310 0.310 0.310 0.305 0.290 0.290 0.306 2001 0.290 0.290 0.290 0.290 0.290 0.290 0.290 0.300 0.300 0.350 0.350 0.350 0.307 2002 0.350 0.350 0.350 0.350 0.350 0.350 0.350 0.350 0.350 0.350 0.350 0.350 0.350 2003 0.390 0.400 0.400 0.500 0.500 0.500 0.500 0.496 0.413 0.378 0.360 0.360 0.433 2004 0.360 0.360 0.360 0.360 0.360 0.360 0.360 0.360 0.360 0.360 0.333
Poppy Seed Dutch A-1
2000 0.520 0.520 0.520 0.520 0.520 0.588 0.650 0.650 0.650 0.630 0.630 0.630 0.586 2001 0.645 0.648 0.616 0.580 0.550 0.504 0.500 0.500 0.490 0.490 0.490 0.520 0.544 2002 0.580 0.580 0.460 0.460 0.460 0.460 0.460 0.460 0.460 0.483 0.498 0.513 0.489 2003 0.524 0.530 0.520 0.498 0.490 0.490 0.485 0.472 0.480 0.500 0.520 0.544 0.504 2004 0.585 0.720 0.740 0.736 0.720 0.690 0.704 0.720 0.720 0.720 0.720
Australian 2000 0.505 0.490 0.474 0.470 0.475 0.548 0.590 0.590 0.590 0.590 0.590 0.594 0.542 2001 0.635 0.640 0.616 0.580 0.535 0.484 0.480 0.480 0.450 0.450 0.450 0.457 0.521 2002 0.470 0.470 0.470 0.460 0.450 0.450 0.440 0.430 0.440 0.458 0.488 0.520 0.462 2003 0.524 0.530 0.520 0.498 0.490 0.490 0.485 0.472 0.480 0.500 0.520 0.554 0.505 2004 0.605 0.743 0.760 0.752 0.720 0.695 0.722 0.740 0.740 0.740 0.740
Turkish 2000 0.410 N/A N/A N/A N/A 0.500 0.560 0.560 0.560 0.560 0.560 0.568 0.535 2001 0.580 0.580 0.568 0.498 0.420 0.384 0.380 0.380 0.380 0.380 0.388 0.417 0.446 2002 0.470 0.470 0.470 N/A N/A N/A N/A N/A N/A N/A N/A N/A 0.470 2003 N/A N/A N/A N/A N/A N/A N/A N/A N/A N/A N/A N/A N/A 2004 N/A N/A N/A N/A N/A N/A N/A N/A N/A N/A N/A
Sesame Seed Central American Hulled
2000 0.803 0.825 0.830 0.823 0.800 0.800 0.800 0.800 0.800 0.800 0.800 0.800 0.807 2001 0.763 0.750 0.750 0.750 0.713 0.700 0.700 0.650 0.650 0.650 0.650 0.650 0.698 2002 0.630 0.630 0.630 0.630 0.602 0.560 0.560 0.580 0.610 0.625 0.640 0.660 0.613 2003 0.690 0.713 0.730 0.740 0.740 0.740 0.720 0.700 0.700 0.712 0.850 0.880 0.743 2004 0.938 0.950 0.950 0.950 0.965 0.965 0.970 0.970 0.970 0.970 0.970
Central American Natural 2000 0.600 0.600 0.600 0.615 0.620 0.620 0.620 0.620 0.620 0.620 0.620 0.620 0.615 2001 0.620 N/A N/A N/A N/A N/A N/A N/A N/A N/A N/A N/A 0.620 2002 N/A N/A N/A N/A N/A N/A N/A N/A N/A N/A N/A N/A N/A
Indian Natural 2000 0.473 0.470 0.470 0.470 0.445 0.430 0.423 0.420 0.420 0.415 0.410 0.402 0.437 2001 0.400 0.400 0.400 0.400 0.385 0.380 0.380 0.380 0.380 0.380 0.362 0.350 0.383 2002 0.348 0.340 0.328 0.355 0.360 0.360 0.360 0.360 0.360 0.360 0.382 0.415 0.361 2003 0.458 0.470 0.470 0.470 0.470 0.460 0.458 0.460 0.460 0.492 0.550 0.560 0.481 2004 0.555 0.548 0.570 0.602 0.620 0.615 0.610 0.615 0.625 0.662 0.680
Saffron Spanish
2000 340.000 330.000 330.000 330.000 325.000 320.000 320.000 320.000 320.000 310.000 308.750 305.000 321.563 2001 308.750 310.000 310.000 310.000 300.000 290.000 290.000 293.000 311.250 315.000 313.000 296.667 303.972 2002 295.000 290.000 289.000 285.000 285.000 305.000 350.000 354.000 355.000 355.000 355.000 355.000 322.750 2003 357.000 365.000 365.000 365.000 375.000 375.000 375.000 375.000 375.000 375.000 370.000 368.000 370.000 2004 370.000 370.000 370.000 354.000 350.000 350.000 350.000 350.000 350.000 350.000 345.000
Source: A. A. Sayia & Company, Inc.
Note: For a historical series of prices, see the Tropical Products: World Markets and Trade circular dated December 1996.
Latest available month is cumulative through latest available week prior to publication.
Note: N/A = not available.
December 2004 Horticultural and Tropical Products Division, FAS/USDA