"Brazilian Livestock Profile. Annual Report 2016." · Unfortunately IBGE has recently announced...
46
Brazilian Livestock Profile Annual Report 2016
Transcript of "Brazilian Livestock Profile. Annual Report 2016." · Unfortunately IBGE has recently announced...

Brazilian LivestockProfileAnnual Report 2016

Contents
Industries ..................................................................... p.2804.Livestock Retrospective and Projections ....................................................... p.3605.Sustainability ............................................................ p.3806.6.1 Forest Code
6.2 Deforestation and monitoring
6.3 GTPS – Round Table
6.4 Green Municipalities Program (PMV)
6.5 ABC Plan
6.6 ABC Program
6.7 Animal Health
Livestock Farming in Brazil ........................... p.1203.3.1 Brazilian Beef Profile 2015
3.2 Brazilian cattle herd
3.3 Production cost
3.4 Worldwide livestock maps
Chain quantification ........................................... p.0802.Profile Overview: Livestock Farming ..... p.0401.

A few words from the CEO
Antônio Jorge Camardelli President of ABIEC
“The country is certainly facing difficult
times in its history. We have an economic
crisis aggravated by a political crisis.
Agribusiness is still one of the main pillars
of Brazil’s economic development and it is
what supports our net exports.
Despite the negative wave that has been
affecting most sectors of the Brazilian
economy the agriculture sectors keeps
growing, and the beef agroindustrial system is one of the
most dynamic in the sector.
In 2010 ABIEC began a pioneering survey to quantify the
value chain of beef.
The update we are now releasing indicates that in 2015 the
whole chain had R$ 483 billion in transaction, which rep-
resents an outstanding growth of 44.7% compared to 2010.
In addition to this information the document is intended
to consolidate other relevant information and data for any
person that wishes to understand livestock farming and beef
chain in Brazil.
ABIEC believes that a solid information base is not only essen-
tial for sectors to provide a clear communication channel with
society, but also for decision making by the relevant private
and government agents or those interested in the develop-
ment of such chain.
Unfortunately IBGE has recently announced that they were
going to once again postpone the Agriculture Census (Censo
Agropecuário), which is now expected to be carried out in
2017 due to lack of resources. Faced with so many uncertain-
ties and lacking reliable sources of information ABIEC has un-
dertaken to gather the best available information in a single
document every year.
This way we hope to further contribute to the development of
our sector and country.”

Profile Overview: Livestock Farming
01.

6
Profi
le O
verv
iew
: Liv
esto
ck F
arm
ing
The Brazilian Gross Domestic Product (GDP) has reached R$ 5.9 trillion in 2015, a 3.85% decrease over the previous result. Agribusiness GDP has reached R$ 1.26 trillion, which is 21% of Brazil’s total GDP. Livestock farming GDP has reached R$ 400.7 billion, which is 30% of Brazil’s agribusiness.
“LIVESTOCK FARMING PRODUCTION CHAIN IN BRAZIL HAD MORE THAN R$ 483.5 BILLION IN TRANSACTIONS IN 2015.“
The Brazilian Net exports Balance in 2015 was
US$ 19.69 billion. Agribusiness exports reached
US$ 88.22 billion and contributed to a positive
balance for the sector, which was essential for a
positive net exports balance in Brazil.
Livestock farming production chain in Brazil
had more than R$ 483.5 billion in transactions
in 2015, a 27% increase over the previous year.
Beef exports generated a US$ 5.9 billion reve-
nue in 2015, a 17% decrease over the previous
year due to conjectural problems in one of the
major Brazilian beef buyer’s markets.
Nevertheless beef exports amounted in reve-
nue for 3% of all Brazilian exports in 2015.

7
Annual Report - 2016Pr
ofile
Ove
rvie
w: L
ives
tock
Far
min
g
Graph 1Agribusiness GDP representation in Brazil in 2015.
Graph 2Livestock farming GDP representation in Brazil’s agribusiness GDP.
Source: IBGE /Cepea - Prepared by ABIEC
2015 R$ - trillion
Other sectors GDP 4.64
Agribusiness GDP 1.27
Total GDP in Brazil 5.9
Agribusiness GDP
21%
Other sectors GDP
79%
Livestock farming GDP
Agribusiness GDP minus livestock farming
30%
70%
Source: IBGE /Cepea - Prepared by ABIEC
2015 R$ - billion
Agribusiness GDP minus livestock farming 866.6
Livestock farming GDP 400.7
Total Agribusiness GDP in Brazil 1,267.2

Brazilian Livestock Profile
8
Profi
le O
verv
iew
: Liv
esto
ck F
arm
ing
Graph 3Net exports Balance in Brazil and the importance of agribusiness - billion US$.
Source: Agroconsult / Agrostat / SECEX / MDIC / Conab - Prepared by ABIEC
Table 1Total GDP, Agribusiness GDP, and Livestock farming GDP.
Source: IBGE /Cepea - Prepared by ABIEC
2015 R$ - trillion Total GDP percentage
Total GDP 5.9 -
Agribusiness GDP 1.27 21.5%
Livestock farming GDP 0.40 6.8%
100.0
80.0
60.0
19
89
19
90
19
91
19
92
19
93
19
94
19
95
19
96
19
97
19
98
19
99
20
00
20
01
20
02
20
03
20
04
20
05
20
06
20
07
20
08
20
09
20
10
20
11
20
12
20
13
20
15
40.0
20.0
0.0
-20.0
-40.0
-60.0
-80.0
-100.0
20
14
Agribusinessbalance
Other productsbalance
Total balance of Brazil

Chain quantification
02.

10
Cha
in q
uant
ifica
tion
The beef agroindustrial system had R$ 483.5 billion in transactions in 2015. Wages and duties of the employees directly employed in the sector (farms and industries) amounted to more than R$ 11.37 billion.
Of the R$ 483.5 billion total in transactions of the
livestock farming production chain in 2015, R$
147.03 billion results from activities prior and at
the farms, R$ 145.88 billion from the plants, and
R$ 176.36 from retail.
“FROM THE FIRST QUANTIFICATION CARRIED
OUT IN 2010 WE HAVE REGISTERED A 44.7%
INCREASE IN TRANSACTION AMOUNTS
THROUGHOUT THE CHAIN.”
Comparing to 2010 the transactions prior to
farms have increased 21.72% and at farms we
registered a 28.01% increase in revenue. Slaugh-
terhouse revenue has increased 36.37% over
2010, and retail registered a 26.12% increase.
Inputs related to feed, reproduction, animal
health, diesel, agricultural inputs, maintenance,
and others were responsible for R$ 49 billion.
The sales from cattle for slaughter, replenishment
animals, and live cattle exports were responsible
for R$ 98 billion.
Inputs used in the slaughterhouse
industry, including packing, electric
power, parts, boiler oil, cleaning prod-
ucts, and others were responsible for
approx. R$ 6.9 billion.
Slaughterhouse revenue registered
R$ 93.98 billion in transactions
regarding beef sales in the domestic
market and R$ 19.49 billion regard-
ing beef exports. Leather revenue
in domestic and foreign markets has
reached R$ 10.19 billion, while other
leather products have reached R$
15.29 billion.
Of the R$ 176.36 billion total retail
transactions 87% was related to beef
sales, and the other 13% to the sales
of other products in 2015.

11
Cha
in q
uant
ifica
tion
Annual Report - 2016
Slaughtered cattle79,707.4R$ million Beef Domestic Market
93,989.4R$ million
Beef exports19,489.7R$ million
Leather exports7,591.6R$ million
Leather Domestic Market2,601.2R$ million
Tallow Domestic Market1,566.6R$ million
Other subproducts13,725.6R$ million
Slaughterhouse revenue138.96
R$ billion
Packaging1,639.0R$ million
Electric Power1,639.0R$ million
Parts, Equip. Maint.307.9R$ million
Boiler oil169.5R$ million
Cleaning products85.4R$ million
Cooling Gases84.4R$ million
Water filters75.6R$ million
PPEs55.8R$ million
Lubricant oil and grease18.1R$ million
Wages and duties2,842.8R$ million
Inputs and industry services6.92
R$ billion
BEEF AGROINDUSTRIAL SYSTEM - 2015
Feed 11,667.4R$ million
Protocols and Semen514.0R$ million
Cattle Health1,896.9R$ million
Diesel3,590.7R$ million
Agricultural Inputs7,756.5R$ million
Electric Power179.5R$ million
Maintenance, services and parts4,482.3R$ million
Employees and duties8,528.4R$ million
Administrative Expenses852.8R$ million
Reinvestments9,513.5R$ million
Replenishment Cattle18,030.1R$ million
Live CattleExports686.5R$ million
Males57,639.9R$ million
Females21,692.1R$ million
Males14,214.2R$ million
Females3,815.9
R$ million
Livestock farming Agribusiness Transactions in 2015 483.50 R$ billion
Before farms48.98
R$ billion
At farms98.05
R$ billion
Beef Retail153,888.9R$ million
Other products retail22,472.910R$ million
Total Retail 176.36
R$ billion
Facilitating agents
Third party Services
Fre and internal Diesel
Traceability
Export Transportation
R&D
9,423.4
4,589.5
46.9
121.2
47.1
R$ million
Scheme 1Chain mapping

12
Cha
in q
uant
ifica
tion
Brazilian Livestock Profile
Slaughtered cattle79,707.4R$ million Beef Domestic Market
93,989.4R$ million
Beef exports19,489.7R$ million
Leather exports7,591.6R$ million
Leather Domestic Market2,601.2R$ million
Tallow Domestic Market1,566.6R$ million
Other subproducts13,725.6R$ million
Slaughterhouse revenue138.96
R$ billion
Packaging1,639.0R$ million
Electric Power1,639.0R$ million
Parts, Equip. Maint.307.9R$ million
Boiler oil169.5R$ million
Cleaning products85.4R$ million
Cooling Gases84.4R$ million
Water filters75.6R$ million
PPEs55.8R$ million
Lubricant oil and grease18.1R$ million
Wages and duties2,842.8R$ million
Inputs and industry services6.92
R$ billion
BEEF AGROINDUSTRIAL SYSTEM - 2015
Feed 11,667.4R$ million
Protocols and Semen514.0R$ million
Cattle Health1,896.9R$ million
Diesel3,590.7R$ million
Agricultural Inputs7,756.5R$ million
Electric Power179.5R$ million
Maintenance, services and parts4,482.3R$ million
Employees and duties8,528.4R$ million
Administrative Expenses852.8R$ million
Reinvestments9,513.5R$ million
Replenishment Cattle18,030.1R$ million
Live CattleExports686.5R$ million
Males57,639.9R$ million
Females21,692.1R$ million
Males14,214.2R$ million
Females3,815.9
R$ million
Livestock farming Agribusiness Transactions in 2015 483.50 R$ billion
Before farms48.98
R$ billion
At farms98.05
R$ billion
Beef Retail153,888.9R$ million
Other products retail22,472.910R$ million
Total Retail 176.36
R$ billion
Facilitating agents
Third party Services
Fre and internal Diesel
Traceability
Export Transportation
R&D
9,423.4
4,589.5
46.9
121.2
47.1
R$ million
Source: Agroconsult - using adapted methodology created by PENSA/USP, and data from IBGE (2014), Abiec/Markestrat (2010), secex (2015)
Livestock Farming in Brazil
03.

14
Live
stoc
k Fa
rmin
g in
Bra
zil
3.1 Brazilian Beef Profile 2015
Brazil has 209.13 million cattle heads over 167 million hectares. A stocking rate of 1.25 heads per hectare.
167.49 million pasture hectares
Stocking rate: 1.25 heads/ha
Cattle Herd209.13 million heads
Live cattle Import
1.776 heads
Carcass Average weight: 244.2 kg
Average Carcass Yield: (Zebu)52.3%-55%
EXPORTS(19.63%)
1.88 MT CWE
Live cattle Export212,183 heads
Offtake: 18.78%Confinement: 5.05 million heads (12.9% of total slaughter)
Beef production9.56 MT CWE
Slaughter39.16 million heads
74.47% In Natura1.40 MT CWE
85 countries
Egypt: 17%Russian Federation: 16%
Hong Kong: 15%�Iran: 9%
Others: 43%
EU-27:41%USA: 28%
Others: 31%
90 countries
14.11% Processed265.54 TT CWE
Hong Kong: 55%Egypt: 8%
Others: 37%
69 countries
11.4% Offals and Others214.85 TT CWE
Domestic market (81.38%)7.68 MT CWE
Consumption per capita:38.6 kg/year
In 2015 the Brazilian beef production has
reached 9.56 million tons carcass-weight
equivalent (CWE) of a total of 39.16 mil-
lion heads slaughtered.
Exports have reached 1.88 million tons
carcass-weight equivalent, correspond-
ing to 19.63% of the production. The
domestic market was responsible for
the consumption of 81% of the beef
produced in 2015.

15
Live
stoc
k Fa
rmin
g in
Bra
zil
Annual Report - 2016
Graph 4Brazilian Cattle Herd - million heads.
3.2 Brazilian Cattle Herd
Source: IBGE / Mapa / Agroconsult - Prepared by ABIEC
Source: IBGE / Agroconsult - Prepared by ABIEC
Graph 5Brazilian cattle herd development per region - million heads.
1974
1976
1978
1980
1982
1984
1986
1988
1990
1992
1994
1996
1998
2000
2002
2004
2006
2008
2010
2012
2015
2014
230
210
190
170
150
130
110
90
1974
1975
1976
1977
1978
1979
1980
1981
1982
1983
1984
1985
1986
1987
1988
1989
1990
1991
1992
1993
1994
1995
1996
1997
1998
1999
2000
2001
2002
2003
2004
2005
2006
2007
2008
2009
2010
2011
2012
2013
2015
2014
200
150
100
50
0
North Northeast Southeast South Central-West
16
Live
stoc
k Fa
rmin
g in
Bra
zil
Brazilian Livestock Profile
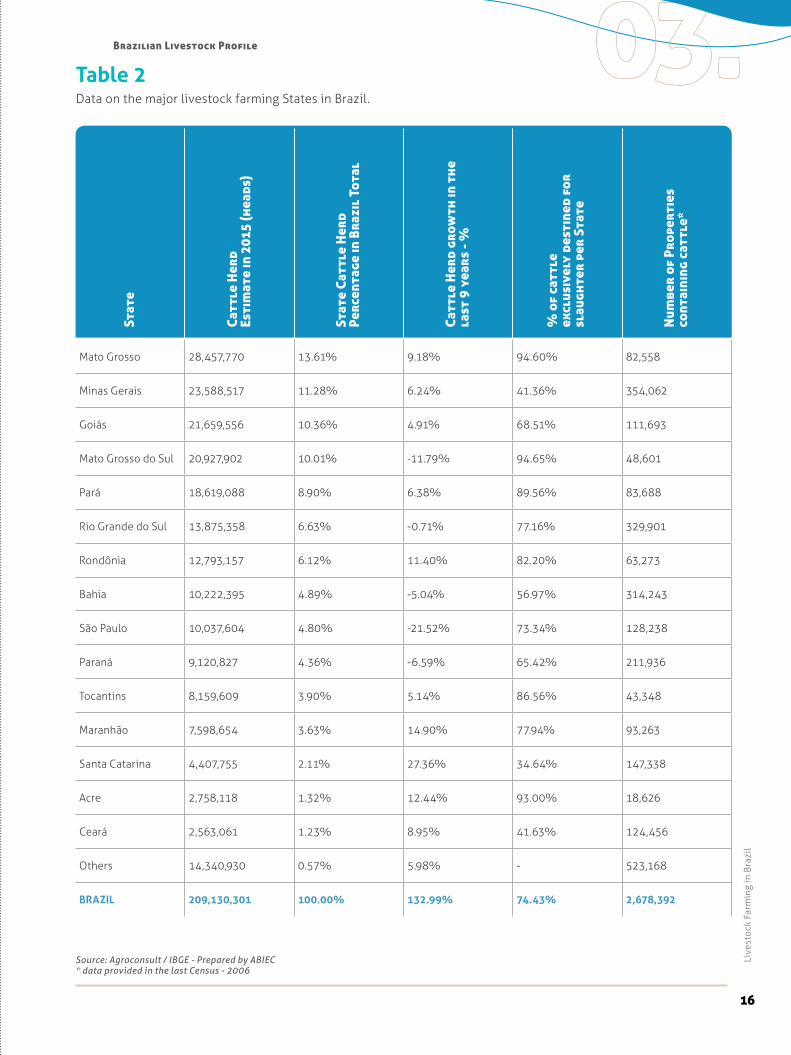
Table 2Data on the major livestock farming States in Brazil.
Source: Agroconsult / IBGE - Prepared by ABIEC* data provided in the last Census - 2006
Mato Grosso 28,457,770 13.61% 9.18% 94.60% 82,558
Minas Gerais 23,588,517 11.28% 6.24% 41.36% 354,062
Goiás 21,659,556 10.36% 4.91% 68.51% 111,693
Mato Grosso do Sul 20,927,902 10.01% -11.79% 94.65% 48,601
Pará 18,619,088 8.90% 6.38% 89.56% 83,688
Rio Grande do Sul 13,875,358 6.63% -0.71% 77.16% 329,901
Rondônia 12,793,157 6.12% 11.40% 82.20% 63,273
Bahia 10,222,395 4.89% -5.04% 56.97% 314,243
São Paulo 10,037,604 4.80% -21.52% 73.34% 128,238
Paraná 9,120,827 4.36% -6.59% 65.42% 211,936
Tocantins 8,159,609 3.90% 5.14% 86.56% 43,348
Maranhão 7,598,654 3.63% 14.90% 77.94% 93,263
Santa Catarina 4,407,755 2.11% 27.36% 34.64% 147,338
Acre 2,758,118 1.32% 12.44% 93.00% 18,626
Ceará 2,563,061 1.23% 8.95% 41.63% 124,456
Others 14,340,930 0.57% 5.98% - 523,168
BRAZIL 209,130,301 100.00% 132.99% 74.43% 2,678,392
Stat
e
Catt
le H
erd
Esti
mat
e in
201
5 (h
eads
)
Stat
e Ca
ttle
Her
d Pe
rcen
tage
in B
razi
l To
tal
Catt
le H
erd
grow
th in
the
la
st 9
yea
rs -
%
% o
f ca
ttle
ex
clus
ivel
y de
stin
ed f
or
slau
ghte
r pe
r St
ate
Num
ber
of P
rope
rtie
s co
ntai
ning
cat
tle*

17
Live
stoc
k Fa
rmin
g in
Bra
zil
Annual Report - 2016
Table 3Number of properties per area per State - Base year 2006.
Number of properties per area (hectares) - Base year 2006
Pasture Area (hectares) (2015)
Less than 20
Between 20 and 200
Between 200 and 1000
Between 1000 and 2500
More than 2500 Total
Brazil 167,487,880 1,392,016 1,075,350 170,726 27,647 12,653 2,678,392
Rondônia 8,048,622 12,738 44,515 4,978 775 267 63,273
Acre 1,855,894 3,417 12,407 2,436 243 123 18,626
Amazonas 2,708,674 4,653 7,650 1,168 198 113 13,782
Roraima 904,082 420 3,251 783 184 94 4,732
Pará 20,688,254 16,531 55,167 9,704 1,802 1,145 84,349
Amapá 308,083 84 386 134 36 21 661
Tocantins 7,983,934 7,809 25,257 7,755 1,669 858 43,348
Maranhão 6,329,098 39,542 43,939 8,355 1,009 418 93,263
Piauí 3,068,977 36,423 33,510 4,768 569 199 75,469
Ceará 3,574,714 80,840 37,511 5,546 432 127 124,456
Rio Grande do Norte
2,104,001 29,950 14,808 2,379 293 50 47,480
Paraíba 2,458,039 66,713 22,076 2,934 267 34 92,024
Pernambuco 5,256,402 107,273 29,936 2,787 179 51 140,226
Alagoas 516,305 35,429 8,494 1,077 104 31 45,135
Sergipe 983,803 29,564 10,103 922 62 12 40,663
Bahia 10,324,188 172,240 125,272 14,213 1,835 683 314,243
Minas Gerais 14,686,676 166,223 159,909 24,853 2,329 748 354,062
Espírito Santo 1,907,089 14,072 15,165 1,572 101 25 30,935
Rio de Janeiro 1,205,099 17,389 11,326 1,615 118 16 30,464
São Paulo 5,200,734 63,436 54,480 9,068 982 272 128,238
Paraná 4,103,013 133,546 69,287 8,244 724 135 211,936
Santa Catarina 1,882,455 94,338 50,382 2,347 221 50 147,338
Rio Grande do Sul
8,340,702 204,533 110,684 12,239 2,010 435 329,901
Mato Grosso do Sul
15,548,578 14,290 18,079 9,836 3,978 2,418 48,601
Mato Grosso 22,392,865 12,771 49,936 12,576 4,048 3,227 82,558
Goiás + DF 15,107,599 27,876 62,206 18,571 3,515 1,122 113,290Source: Agroconsult , IBGE (Census 2006 and PPM 2006) - Prepared by ABIEC

18
Live
stoc
k Fa
rmin
g in
Bra
zil
Brazilian Livestock Profile
Cattle Herd per property size (hectares) - Census 2006
Pasture Area (hectares) (2015)
Less than 20
Between 20 and 200
Between 200 and 1000
Between 1000 and 2500
More than 2500 Total
Brazil 167,487,880 16,807,184 52,587,423 47,408,774 25,223,654 34,120,466 176,147,501
Rondônia 8,048,622 330,960 4,126,217 2,224,446 965,169 895,934 8,542,726
Acre 1,855,894 50,412 698,373 391,966 198,137 397,212 1,736,100
Amazonas 2,708,674 112,052 443,521 269,397 111,839 233,829 1,170,638
Roraima 904,082 14,111 144,867 168,013 98,132 111,273 536,396
Pará 20,688,254 565,677 3,948,458 3,353,904 2,026,588 4,118,071 14,012,698
Amapá 308,083 4,413 19,372 19,464 15,451 20,115 78,815
Tocantins 7,983,934 208,927 1,622,429 2,041,112 1,230,497 1,462,764 6,565,729
Maranhão 6,329,098 498,519 2,046,349 1,742,259 722,525 802,512 5,812,164
Piauí 3,068,977 365,716 743,849 368,003 108,207 81,681 1,667,456
Ceará 3,574,714 652,392 818,248 453,155 163,920 75,128 2,162,843
Rio Grande do Norte
2,104,001 219,071 347,672 242,996 86,130 11,316 907,185
Paraíba 2,458,039 443,065 539,718 299,452 63,314 8,908 1,354,457
Pernambuco 5,256,402 723,314 761,808 332,702 50,176 12,432 1,880,432
Alagoas 516,305 263,407 341,613 242,858 61,325 10,662 919,865
Sergipe 983,803 277,766 371,967 207,639 37,326 4,600 899,298
Bahia 10,324,188 1,778,467 4,129,837 2,595,941 1,047,069 678,145 10,229,459
Minas Gerais 14,686,676 2,362,639 8,345,945 6,228,333 1,892,888 1,502,530 20,332,335
Espírito Santo 1,907,089 241,593 785,460 576,174 135,551 52,723 1,791,501
Rio de Janeiro 1,205,099 397,874 862,549 539,880 107,837 16,077 1,924,217
São Paulo 5,200,734 1,305,113 3,969,832 3,395,094 1,152,151 684,240 10,506,430
Paraná 4,103,013 1,764,943 3,420,194 2,930,429 779,853 222,688 9,118,107
Santa Catarina 1,882,455 1,096,310 1,515,541 397,223 85,704 31,224 3,126,002
Rio Grande do Sul
8,340,702 1,975,939 3,328,309 3,258,892 1,830,353 941,017 11,334,510
Mato Grosso do Sul
15,548,578 269,427 1,275,634 4,487,282 4,981,759 9,620,715 20,634,817
Mato Grosso 22,392,865 318,250 3,613,906 4,312,092 3,637,450 8,784,449 20,666,147
Goiás + DF 15,107,599 571,240 4,385,127 6,349,532 3,649,754 3,360,336 18,315,989Source: Agroconsult , IBGE (Census 2006 and PPM 2006) - Prepared by ABIEC
Table 4Cattle Herd per property size per State - Base year 2006.

19
Live
stoc
k Fa
rmin
g in
Bra
zil
Annual Report - 2016
Table 5Cattle Herd in the major livestock farming municipalities in Brazil and cattle herd growth in previous years.
Municipality / StateCattle Herd in 1994 (heads)
Cattle Herd in 2004 (heads)
Cattle Herd in 2014 (heads)
Cattle Herd growth from 1994 to 2014 - %
Cattle Herd growth from 2004 to 2014 - %
São Félix do Xingu - PA 72,840 1,527,017 2,213,310 2938.59% 44.94%
Corumbá - MS 1,380,400 1,889,553 1,761,574 27.61% -6.77%
Ribas do Rio Pardo - MS 1,473,371 1,380,930 1,099,052 -25.41% -20.41%
Cáceres - MT 443,594 943,577 1,024,196 130.89% 8.54%
Novo Repartimento - PA 135,000 454,051 959,056 610.41% 111.22%
Vila Bela da Santíssima Trindade - MT 295,643 863,079 943,217 219.04% 9.29%
Juara - MT 319,360 919,964 926,563 190.13% 0.72%
Marabá - PA 84,000 816,738 900,000 971.43% 10.19%
Aquidauana - MS 726,451 621,985 803,976 10.67% 29.26%
Nova Crixás - GO 400,000 676,340 751,000 87.75% 11.04%
Alta Floresta - MT 339,246 723,871 747,578 120.36% 3.28%
Cumaru do Norte - PA 22,143 611,151 743,174 3256.25% 21.60%
Porto Velho - RO 46,689 426,479 741,165 1487.45% 73.79%
Porto Murtinho - MS 550,100 698,378 724,505 31.70% 3.74%
Altamira - PA 80,000 314,217 687,535 759.42% 118.81%
Pontes e Lacerda - MT 356,049 639,389 663,535 86.36% 3.78%
Vila Rica - MT 110,625 526,000 655,938 492.94% 24.70%
Alegrete - RS 567,110 648,698 641,348 13.09% -1.13%
Sant’Ana do Livramento - RS 531,000 587,387 636,950 19.95% 8.44%
Juína - MT 182,168 533,199 633,492 247.75% 18.81%
Três Lagoas - MS 881,550 957,151 616,018 -30.12% -35.64%
Santana do Araguaia - PA 336,198 565,775 613,911 82.60% 8.51%
Novo Progresso - PA 105,000 378,573 590,273 462.16% 55.92%
São Miguel do Araguaia - GO 315,000 491,000 586,000 86.03% 19.35%
Água Azul do Norte - PA 52,000 587,216 585,400 1025.77% -0.31%
Camapuã - MS 589,220 842,080 579,699 -1.62% -31.16%
Porto Esperidião - MT 134,170 496,594 574,404 328.12% 15.67%
Rio Verde de Mato Grosso - MS 557,402 606,595 557,741 0.06% -8.05%
Campo Grande - MS 557,189 679,274 548,665 -1.53% -19.23%
Santa Maria das Barreiras - PA 128,319 564,019 544,541 324.37% -3.45%
Pacajá - PA 135,000 283,204 536,460 297.38% 89.43%
Coxim - MS 449,068 562,515 518,516 15.46% -7.82%
Nova Mamoré - RO 38,819 216,403 518,311 1235.20% 139.51%
Santo Antônio do Leverger - MT 261,937 412,535 515,738 96.89% 25.02%
Santa Rita do Pardo - MS 496,642 609,240 514,940 3.68% -15.48%
Rio Branco - AC 67,896 412,486 513,259 655.95% 24.43%
Paranaíba - MS 637,410 574,890 512,916 -19.53% -10.78%
Jaru - RO 163,392 504,004 512,236 213.50% 1.63%
Xinguara - PA 507,000 529,337 492,104 -2.94% -7.03%
Inocência - MS 461,650 540,946 476,654 3.25% -11.89%
Água Clara - MS 680,039 808,456 468,286 -31.14% -42.08%
Source: Agroconsult / IBGE - Prepared by ABIEC

20
Live
stoc
k Fa
rmin
g in
Bra
zil
Brazilian Livestock Profile
% of cattle slaughtered in confinement of the total slaughter in Brazil
Graph 6Cattle confinement in Brazil - million heads.
Source: Agroconsult / IBGE - Prepared by ABIEC
6.00
0.00
1.00
2.00
3.00
4.00
5.00
Confinement - milion heads
2001
2002
2003
2004
2005
2006
2007
2008
2009
2010
2011
2012
2015
2014
2013
2.062.42
2.90
3.56 3.463.85
4.06 4.084.38
3.08 3.053.38
3.90
4.675.05
Cattle slaughtered in confinement
13%
Slaughter - milion heads
87%

21
Live
stoc
k Fa
rmin
g in
Bra
zil
Annual Report - 2016
Map 1Effective cattle in Brazil
Graph 7Slaughter development of males older than 36 months.
Source: Agroconsult
Source: IBGE (2014), Agroconsult.
Herd distribuition by municipality (2014)
50,000 - 150,000
0 - 50,000
350,000 - 800,000
150,000 - 350,000
800,000 - 2,500,000
State Borders
52.18%50.71%
36.55%29.95%
21.12%15.72%
16.14%23.76%
21.27%11.74%
11.30% 15.81%16.80% 9.33%
10.05%9.47%
7.96%7.81%
6.94%
Percentage of slaughtered cattle (does not include bulls)over 36 months from the total number of males
1997 1998 1999 2000 2001 2002 2003 2004 2005 2006 2007 20092008 2010 2011 2012 2013 2014 2015

22
Live
stoc
k Fa
rmin
g in
Bra
zil
Brazilian Livestock Profile
Map 2Cattle density in Brazil.
Source: IBGE (2014), Agroconsult.
Density (head of cattle per hectare)
0.6 - 0.9
State Borders
0.9 - 1.2
0.0 - 0.3
0.3 - 0.6
Slaughterhouse
1.5 - 3.0
1.2 - 1.5
3.0 - 5.0

23
Live
stoc
k Fa
rmin
g in
Bra
zil
Annual Report - 2016
Graph 8Production cost in full cycle farms for six technology levels - Full cycle - 2015 Average
3.3 Production Cost
Source: Agroconsult
Full Cycle - R$/@ Extractivism Low Tech Average Tech Proper High Tech Intensive
RESULT COMPONENTS 1 - 3 @/ha 3 - 6@/ha 6-12@/ha 12-18@/ha 18-26@/ha 26-38@/ha
Feed 14.42 16.96 20.00 30.74 33.68 38.50
Health program 3.09 3.14 3.44 3.31 3.47 3.17
Correctives and Fertilizers 0.00 4.29 18.46 19.14 22.93 21.54
Agrochemicals 0.00 8.00 4.66 3.30 1.64 0.87
Fuels and Lubricants 9.58 5.76 5.31 4.82 4.68 4.32
Reproduction 0.00 1.11 4.01 7.70 8.09 7.26
Employees 18.63 16.60 12.38 9.10 7.67 6.00
Maintenance 15.76 7.57 5.35 5.19 4.60 3.53
Management 1.86 1.66 1.24 0.91 0.77 0.60
Electric Power 0.48 0.29 0.27 0.24 0.23 0.22
Depreciations 48.30 26.23 18.49 9.68 6.68 4.74
Total Operating Costs 112.13 91.62 93.61 94.13 94.43 90.76
Feed
Health program
Correctives and fertilizer
Agrochemicals
Fuels and Lubricants
Reproduction
Employees
Maintenance
Management
Electric Power
Depreciations
100%
90%
80%
70%
60%
50%
40%
30%
20%
10%
0%1-3@/ha 3-6@/ha 6-12@/ha 12-18@/ha 18-26@/ha 26-38@/ha
24
Live
stoc
k Fa
rmin
g in
Bra
zil
Brazilian Livestock Profile
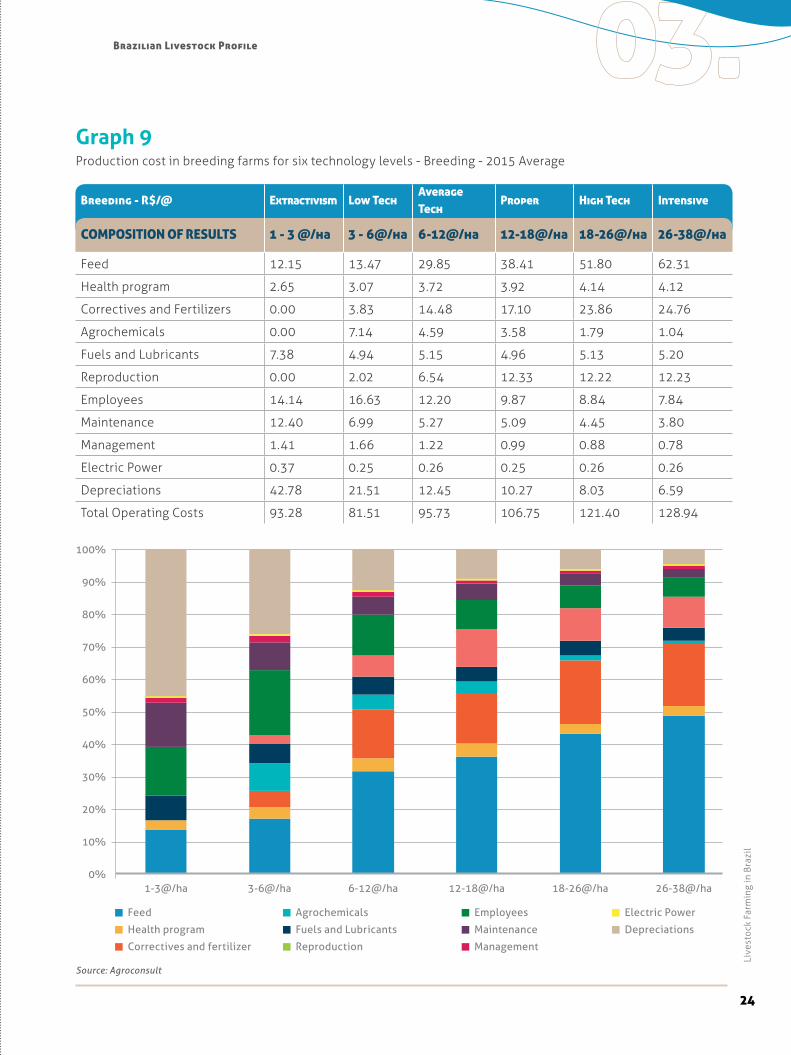
Graph 9 Production cost in breeding farms for six technology levels - Breeding - 2015 Average
Source: Agroconsult
100%
90%
80%
70%
60%
50%
40%
30%
20%
10%
0%1-3@/ha 3-6@/ha 6-12@/ha 12-18@/ha 18-26@/ha 26-38@/ha
Feed
Health program
Correctives and fertilizer
Agrochemicals
Fuels and Lubricants
Reproduction
Employees
Maintenance
Management
Electric Power
Depreciations
Breeding - R$/@ Extractivism Low TechAverage Tech
Proper High Tech Intensive
COMPOSITION OF RESULTS 1 - 3 @/ha 3 - 6@/ha 6-12@/ha 12-18@/ha 18-26@/ha 26-38@/ha
Feed 12.15 13.47 29.85 38.41 51.80 62.31
Health program 2.65 3.07 3.72 3.92 4.14 4.12
Correctives and Fertilizers 0.00 3.83 14.48 17.10 23.86 24.76
Agrochemicals 0.00 7.14 4.59 3.58 1.79 1.04
Fuels and Lubricants 7.38 4.94 5.15 4.96 5.13 5.20
Reproduction 0.00 2.02 6.54 12.33 12.22 12.23
Employees 14.14 16.63 12.20 9.87 8.84 7.84
Maintenance 12.40 6.99 5.27 5.09 4.45 3.80
Management 1.41 1.66 1.22 0.99 0.88 0.78
Electric Power 0.37 0.25 0.26 0.25 0.26 0.26
Depreciations 42.78 21.51 12.45 10.27 8.03 6.59
Total Operating Costs 93.28 81.51 95.73 106.75 121.40 128.94

25
Live
stoc
k Fa
rmin
g in
Bra
zil
Annual Report - 2016
Graph 10 Production cost in rearing and finishing farms for six technology levels - rearing and finishing - 2015 Average.
Source: Agroconsult
100%
90%
80%
70%
60%
50%
40%
30%
20%
10%
0%1-3@/ha 3-6@/ha 6-12@/ha 12-18@/ha 18-26@/ha 26-38@/ha
Feed
Health program
Correctives and fertilizer
Agrochemicals
Fuels and Lubricants
Replenishment
Employees
Maintenance
Management
Electric Power
Depreciations
Rearing and finishing - R$/@
Extractivism Low Tech Medium Tech Proper High Tech Intensive
RESULT COMPONENTS 1 - 3 @/ha 3 - 6@/ha 6-12@/ha 12-18@/ha 18-26@/ha 26-38@/ha
Feed 9.61 19.22 26.01 31.66 37.62 41.03
Health program 2.05 2.76 2.88 2.13 2.10 2.11
Correctives and Fertilizers
0.00 4.71 12.31 12.63 17.39 16.29
Agrochemicals 0.00 8.77 3.90 2.64 1.31 0.69
Fuels and Lubricants 8.56 6.47 5.17 3.89 3.88 3.63
Replenishment 118.08 118.08 118.08 118.08 118.08 118.08
Employees 12.60 11.89 6.07 4.50 4.21 3.39
Maintenance 14.14 7.90 4.27 3.32 2.85 2.39
Management 1.26 1.19 0.61 0.45 0.42 0.34
Electric Power 0.43 0.32 0.26 0.19 0.19 0.18
Depreciations 51.11 32.44 17.09 7.40 3.37 3.51
Total Operating Costs 217.83 213.74 196.64 186.89 191.41 191.63
26
Live
stoc
k Fa
rmin
g in
Bra
zil
Brazilian Livestock Profile
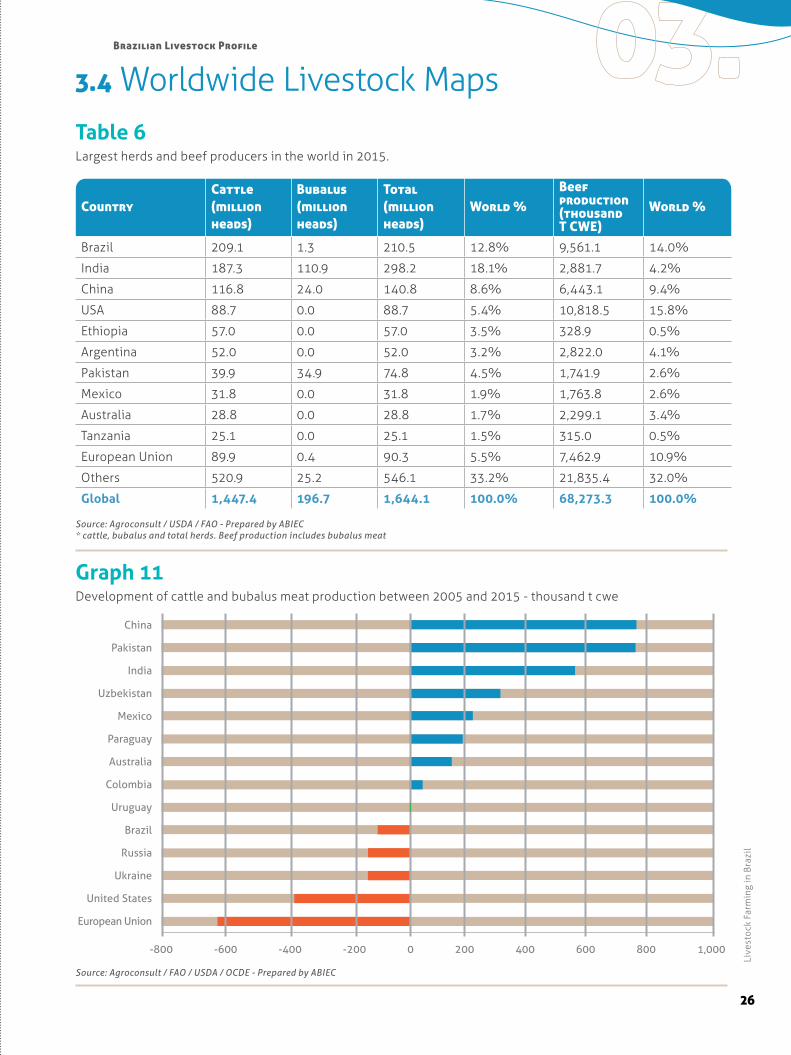
Table 6Largest herds and beef producers in the world in 2015.
Source: Agroconsult / FAO / USDA / OCDE - Prepared by ABIEC
Source: Agroconsult / USDA / FAO - Prepared by ABIEC* cattle, bubalus and total herds. Beef production includes bubalus meat
3.4 Worldwide Livestock Maps
Graph 11Development of cattle and bubalus meat production between 2005 and 2015 - thousand t cwe
China
Pakistan
India
Uzbekistan
Mexico
Paraguay
Australia
Colombia
Uruguay
Brazil
Russia
Ukraine
United States
European Union
-800 -200 0 200 400 600 800 1,000-600 -400
CountryCattle (million heads)
Bubalus (million heads)
Total (million heads)
World %Beef production (thousand T CWE)
World %
Brazil 209.1 1.3 210.5 12.8% 9,561.1 14.0%
India 187.3 110.9 298.2 18.1% 2,881.7 4.2%
China 116.8 24.0 140.8 8.6% 6,443.1 9.4%
USA 88.7 0.0 88.7 5.4% 10,818.5 15.8%
Ethiopia 57.0 0.0 57.0 3.5% 328.9 0.5%
Argentina 52.0 0.0 52.0 3.2% 2,822.0 4.1%
Pakistan 39.9 34.9 74.8 4.5% 1,741.9 2.6%
Mexico 31.8 0.0 31.8 1.9% 1,763.8 2.6%
Australia 28.8 0.0 28.8 1.7% 2,299.1 3.4%
Tanzania 25.1 0.0 25.1 1.5% 315.0 0.5%
European Union 89.9 0.4 90.3 5.5% 7,462.9 10.9%
Others 520.9 25.2 546.1 33.2% 21,835.4 32.0%
Global 1,447.4 196.7 1,644.1 100.0% 68,273.3 100.0%

27
Live
stoc
k Fa
rmin
g in
Bra
zil
Annual Report - 2016
Table 8Largest beef importers worldwide and Brazil’s representation in those markets in 2015.
Source: OECD / USDA / Agroconsult - Prepared by ABIEC
Table 7Largest beef exporters in 2015.
* cattle and bubalus meatSource: FAO / USDA / FAPRI / IBGE / Agroconsult - Prepared by ABIEC
CountryTons Carcass-Weight Equivalent Exports (thousand T CWE)*
Exports % over production
Tons Carcass-Weight Equivalent Production (thousand T CWE)
India 1,722.4 59.77% 2,881.7
Brazil 1,882.0 19.68% 9,561.1
Australia 1,498.7 65.19% 2,299.1
USA 1,060.1 9.80% 10,818.5
New Zealand 524.4 88.73% 591.0
Uruguay 396.0 66.66% 594.0
Canada 320.5 31.53% 1,016.6
Paraguay 285.4 67.68% 421.7
Argentina 222.3 7.88% 2,822.0
Belarus 183.5 52.21% 351.4
European Union 2,991.3 40.08% 7,462.9
Others 720.4 2.45% 29,453.2
Global 11,807.0 17.29% 68,273.3
Countries 2015 (Thousand T CWE) Brazilian Imports (Thousand T CWE) Brazilian % in each market
USA 1,163.9 75.9 7%
China 971.4 126.8 13%
Hong Kong 844.9 347.7 41%
Japan 686.0 0.3 0%
Russian Federation 676.6 230.0 34%
Vietnam 615.9 19.7 3%
Italy 478.5 47.7 10%
The Netherlands 435.8 32.3 7%
United Kingdom 420.2 67.9 16%
France 393.8 3.5 1%
Germany 387.3 12.1 3%
South Korea 353.0 0.6 0%
Egypt 314.1 254.0 81%
Canada 274.1 4.5 2%
Venezuela 270.1 121.2 45%
Chile 217.9 72.3 33%
Mexico 212.5 4.7 2%
Saudi Arabia 194.4 0.0 0%
Malaysia 192.4 40.4 21%
Spain 144.6 13.5 9%
Taiwan 134.3 0.0 0%
Denmark 129.8 0.4 0%
Sweden 127.3 5.1 4%
Others 1,252.6 401.5 32%
Global 10,891.4 1,882.0 17.3%

28
Live
stoc
k Fa
rmin
g in
Bra
zil
Brazilian Livestock Profile
Source: FAO / USDA / FMI / Agroconsult - Prepared by ABIEC
Table 9Largest beef consumers in 2015.
Graph 12Development of cattle and bubalus meat exports between 2005 and 2015 - thousand t cwe.
Source: Agroconsult, FAO, USDA, OCDE
India
United States
European Union
Australia
Mexico
Belarus
Paraguay
Nicaragua
China
Pakistan
Jordan
Colombia
Uruguay
New Zealand
Ukraine
Brazil
Canada
Argentina
-600 -400 -200 200 400 600 800 1.000 1.2000
Ranking Total beef consumption (thousand T CWE)
Consumption per capita (kg/person/year) Population (Millions)
USA 10,971.4 34.1 321.8
Brazil 7,681.9 38.6 201.6
China 6,390.9 4.5 1,407.3
Argentina 2,803.1 64.6 43.4
Australia 2,116.9 88.3 24.0
Mexico 1,710.1 13.5 127.0
Russian Federation 1,602.4 11.2 143.5
France 1,348.3 20.9 64.4
India 1,092.4 0.8 1,311.1
Germany 1,081.1 13.4 80.7
Italy 1,064.3 17.8 59.8
Turkey 1,016.7 12.9 78.7
Canada 968.3 26.9 35.9
South Africa 856.0 15.7 54.5
United Kingdom 855.6 13.2 64.7
Colombia 846.8 17.6 48.2
Pakistan 818.3 4.3 188.9
Uzbekistan 803.7 26.9 29.9
Indonesia 563.0 2.2 257.6
Egypt 552.9 6.0 91.5
Spain 540.3 11.7 46.1
Others 18,838.7 4.6 4,076.0
Global 64,523.0 7.4 8,756.6

Industries04.

30
Ind
ustr
ies
Map 3Location of slaughterhouses with Federal Inspection Service (SIF).
Source: Agroconsult / IBGE/ MAPA, CODESAV, IDARON, DIAGRO, ADAPEC, AGED, ADAPI, IDIARN, ADAGRO, ADEAL, SEAGRI, ADAB, IMA, IDAF, SEAPEC, SISP, ESEB, CIDASC, SEAPA, IAGRO/GIPOA, AGRODEFESA, INDEA
Table 10Slaughtering capacity in Brazilian States, considering federal, state and municipal surveillance services (SIF, SIE, and SIM respectively).
Ranking State Slaughter capacity SIF slaughter %
SIE slaughter %
SIM slaughter %
1st Mato Grosso 35,466 91.32% 8.19% 0.49%
2nd São Paulo 24,308 85.38% 13.74% 0.88%
3rd Mato Grosso do Sul 23,213 94.71% 4.82% 0.46%
4th Goiás 20,354 83.87% 15.46% 0.67%
5th Minas Gerais 15,541 80.44% 12.71% 6.84%
6th Rondônia 13,424 96.21% 2.69% 0.43%
7th Paraná 12,975 67.72% 28.66% 3.62%
8th Rio Grande do Sul 10,248 36.17% 52.44% 11.39%
9th Pará 9,750 73.71% 18.84% 7.45%
10th Bahia 9,620 36.91% 61.14% 1.95%
11th Tocantins 6,249 92.28% 6.24% 1.48%
12th Santa Catarina 4,692 24.41% 71.07% 4.52%
13th Espírito Santo 3,170 62.11% - -
14th Rio de Janeiro 3,026 94.92% -
15th Maranhão 2,600 58.94% 41.06%
16th Amazonas 1,233 68.69% -
17th Acre 1,180 33.95% -
18th Alagoas 680 38.62% 61.38%
19th Sergipe 400 - - -
20th Roraima 400 - - -
TOTAL 198,529 74.39% 18.78% 6.84%

31
Ind
ustr
ies
Annual Report - 2016
CATEGORY2014 Thousand US$
2015 Thousand US$
US$ Variation
2014 Tons
2015 Tons
Tons Variation
2014 US$/t
2015 US$/t
Average Price Variation
In natura 5,789,124.84 4,658,815.84 -19.52% 1,227,120.54 1,078,182.94 -12.14% 4,717.65 4,320.99 -8.41%
Processed 646,296.25 659,281.99 2.01% 102,807.83 106,216.56 3.32% 6,286.45 6,206.96 -1.26%
Offals 604,866.57 535,803.95 -11.42% 186,928.77 189,234.90 1.23% 3,235.81 2,831.42 -12.50%
Casing 102,827.99 62,232.68 -39.48% 24,320.30 21,521.17 -11.51% 4,228.07 2,891.70 -31.61%
Salted 26,981.29 22,786.58 -15.55% 4,711.80 4,103.20 -12.92% 5,726.33 5,553.37 -3.02%
Total 7,170,096.94 5,938,921.05 -17.17% 1,545,889.23 1,399,258.77 -9.49% 4,638.17 4,244.33 -8.49%
Table 11Exports, imports and total balances per sector.
4.1 Exports
Source: Agroconsult, MAPA, Secex/MDIC
Source: Agroconsult, MAPA, Secex/MDIC, AgroStat
Net exports US$ billion
Sectors Exports Imports Balance
Other Sectors 102.91 158.38 -55.47
Agribusiness 88.22 13.07 75.15
Brazil Total 191.13 171.45 19.69
Graph 13Importance of beef exports in Brazil’s total exports and agribusiness exports in 2015.
Beef
Other sectors
Total agribusiness exports
3.0%
53.8%
43.1%
Table 12Brazilian beef exports per product - 2014 and 2015.
Source: MDIC / Secex / Abiec

32
Ind
ustr
ies
Brazilian Livestock Profile
Meats 16.69%
Leather and leather goods 3.08%
Other livestock farming products
0.93%
Total other sectors (excluding livestock farming)
79.31%
Beef 6.57%
Leather and leather goods 3.08%
Live cattle 0.24%
Total other sectors (excluding cattle products)
90.12%
Source: Agroconsult, MAPA, Secex/MDIC, AgroStat
MeatsUS$ Million14,724.20
Thousand Tons6,445
% US$16.69%
Chicken meat 7,130.97 4,225.85 8.08%
in natura 2,270.67 1,402.99 2.57%
Processed 399.69 157.41 0.45%
Beef 5,795.41 1,361 6.57%
in natura 4,642.74 1,070.64 5.26%
Processed 633.58 104.41 0.72%
Pork 1,263.89 542.13 1.43%
in natura 1,121.98 446.04 1.27%
Turkey meat 288.26 133 0.33%
in natura 140.58 84 0.16%
Processed 147.67 49 0.17%
Leather and leather goods
2,713.21 473 3.08%
Other livestock farming products
817.50 212 0.93%
Live animals 278.16 101 0.32%
Live cattle 210.60 100 0.24%
Fishes 220.16 35 0.25%
Dairy products 319.19 77 0.36%
Total livestock farming exports
18,254.91 7,130 20.69%
Total other sectors (excluding cattle products)
79,504.90 90.12%
Total other sectors (excluding livestock farming)
69,969.21 79.31%
Total agribusiness exports
88,224.12 100.00%
Agribusiness Exports 2015

33
Ind
ustr
ies
Annual Report - 2016
Hong Kong - 18% Iran - 6%
China - 8%
USA - 5%
Russian Federation - 10% Angola - 2%
European Union - 14%
Algeria - 2%Venezuela - 9%
Others - 13%
Egypt - 11% Chile - 4%
Source: MDIC / SECEX - Prepared by ABIEC
Source: MDIC / SECEX - Prepared by ABIEC
Graph 14Development of Brazilian beef exports.
Graph 15Main destination of Brazilian beef exports in 2015 - by revenue
0
1,000
2,000
3,000
4,000
5,000
6,000
0
1,000,000
2,000,000
3,000,000
4,000,000
5,000,000
6,000,000
7,000,000
8,000,000
Average Price (US$/Ton)TonsRevenue (US$ Thousand)
1996 1997 1998 1999 2000 2001 2002 2003 2004 2005 2006 2007 2008 2009 2010 2011 2012 2013 20152014

34
Ind
ustr
ies
Brazilian Livestock Profile
Graph 16Main destination of Brazilian beef exports in 2015 - by volume.
Source: MDIC / SECEX - Prepared by ABIEC
Source: Agrosatélite/Agroconsult /Secex/MDIC - Assembled by ABIEC
Map 4Brazilian beef exports in 2015.
Exports in 2015 (ton)25,806 - 315,570550 - 25,80616 - 5500 - 16

35
Ind
ustr
ies
Annual Report - 2016
Graph 17Largest Brazilian beef markets, by revenue.
Source: MDIC / SECEX - Prepared by ABIEC
Source: MDIC / SECEX - Prepared by ABIEC
Graph 18Largest Brazilian beef markets, by revenue - %.
8,000,000
1.00
0 U
S$
7,000,000
6,000,000
5,000,000
4,000,000
3,000,000
2,000,000
1,000,000
0
2005 2006 2007 2008 2009 2010 2011 2012 2013 2014 2015
Iran OtherVenezuela
Russia
Egypt
European Union 28
Hong Kong
Argelia
Chile
United StatesChina
Iran OtherVenezuela
Russia
Egypt
European Union 28
Hong Kong
Argelia
Chile
United StatesChina
0% 20%10% 40%30% 60%50% 80% 90%70% 100%
2005
2006
2007
2008
2009
2010
2011
2012
2013
2014
2015
Iran OtherVenezuela
Russia
Egypt
European Union 28
Hong Kong
Argelia
Chile
United StatesChina
Iran OtherVenezuela
Russia
Egypt
European Union 28
Hong Kong
Argelia
Chile
United StatesChina

36
Ind
ustr
ies
Brazilian Livestock Profile
Source: MDIC / SECEX - Prepared by ABIEC
Source: MDIC / SECEX - Prepared by ABIEC
Graph 19Largest Brazilian beef markets, by volume.
Graph 20Largest Brazilian beef markets, by volume - %.
Iran OtherVenezuela
Russia
Egypt
European Union 28
Hong Kong
Argelia
Chile
United StatesChina
1,800
1,600
1,400
1,00
0 to
ns o
f m
eat
1,200
1,000
800
600
400
200
0
2005 2006 2007 2008 2009 2010 2011 2012 2013 2014 2015
Iran OtherVenezuela
Russia
Egypt
European Union 28
Hong Kong
Argelia
Chile
United StatesChina
0% 20%10% 40%30% 60%50% 80% 90%70% 100%
2005
2006
2007
2008
2009
2010
2011
2012
2013
2014
2015
1.000 ton beef
Iran OtherVenezuela
Russia
Egypt
European Union 28
Hong Kong
Argelia
Chile
United StatesChina
Iran OtherVenezuela
Russia
Egypt
European Union 28
Hong Kong
Argelia
Chile
United StatesChina

Livestock Retrospective and Projections
05.

38
Live
stoc
k Re
tros
pec
tive
and
Pro
ject
ions
Table 14 Livestock Farming History data and Forecasts by 2025.
Variable Unit 1995 2000 2005 2010 2015 2020 2025
Pasture areaThousand Hectares
187,024 177,520 175,785 171,138 167,488 162,211 158,019
Production
TT CWE
5,251 6,289 9,666 9,365 9,562 10,706 11,407
Domestic Consumption
5,251 5,684 7,709 7,701 7,682 7,823 7,855
Net Exports 0 604 1,957 1,702 1,882 2,883 3,552
Total Herd Thousand Heads
161,228 169,876 207,157 209,541 209,130 215,138 221,326
Slaughter 24,300 27,552 42,697 39,277 39,156 43,487 45,958
Stocking rate head/ha 0.86 0.96 1.18 1.22 1.25 1.33 1.40
Offtake Percentage 17.08% 19.62% 22.03% 20.98% 20% 21% 21%
Table 13Brazilian herd, meat production, exports, imports, consumption, and consumption per capita in the last 10 years.
Source: Agroconsult, Secex/MDIC, IBGE - Prepared by ABIEC
Source: Agroconsult, IBGE, Secex/MDIC - Prepared by ABIEC
Unit 2005 2006 2007 2008 2009
Cattle Herd Million heads 207.2 205.9 199.8 202.3 205.3
Beef production Thousand T CWE 9,666.2 10,749.7 10,644.3 9,325.4 9,180.0
Exports Thousand T CWE 1,956.9 2,204.3 2,324.4 1,989.7 1,767.0
Imports Thousand T CWE n/a n/a n/a 29,7 39,5
Consumption Thousand T CWE 7,709.3 8,545.4 8,319.9 7,365.4 7,452.5
Per capita consumption
kg/person/year 41.86 46.05 44.34 38.86 38.93
Unit 2010 2011 2012 2013 2014 2015
Cattle Herd Million heads 209.5 212.8 211.3 211.8 207.4 209.1
Beef production Thousand T CWE 9,364.5 9,102.3 9,703.6 10,227.1 10,101.2 9,561.9
Exports Thousand T CWE 1,701.5 1,495.0 1,684.7 2,007.3 2,057.6 1,882.0
Imports Thousand T CWE 38.5 44.6 59.7 56.4 76.5 59.2
Consumption Thousand T CWE 7,701.5 7,651.9 8,078.6 8,276.2 8,120.1 7,681.9
Consumption per capita
kg/person/year 39.86 39.25 41.11 41.79 40.64 38.59
Sustainability06.

40
Sust
aina
bilit
y
Graph 21Land use in Brazil.
Source: Agroconsult, Agrosatélite, IBGE, Inpe, Mapa
Pastures in working conditions
Pastures at advanced stage of degradation
Agriculture (annual, forests, semiperennial, and perennial)
Cities, roads, water courses, and other uses
19.12%
0.72%
8.87%
4.46%
Native Forest Regeneration (Amazon Biome)
Legal Reserves and APPs
Untouched Wilderness
2.68%
12.88%
51.27%
Land use in Brazil Total area (million ha) %
Pastures in working conditions 162.8 19.12%
Pastures at advanced stage of degradation 6.1 0.72%
Agriculture (annual, forests, semiperennial, and perennial) 75.5 8.87%
Cities, roads, water courses, and other uses 38 4.46%
Native Forest Regeneration (Amazon Biome) 22.8 2.68%
Legal reserves and APPs 109.7 12.88%
Untouched Wilderness 436.6 51.27%
Brazil 851.5 100.00%

41
Sust
aina
bilit
yAnnual Report - 2016
6.1 Forest Code
Graph 22Development of pasture areas and yield in Brazil .
Legal Reserve (RL)
Rural property area that, covered by
natural vegetation, can be exploited for
sustainable forest management, within the
limits established by law for the biome in
which it is located.
80% of rural properties situated in
Forest formations, in Legal Amazon;
35% of rural properties situated in
Savana formations, in Legal Amazon;
20% of rural properties situated in
Campos Gerais areas, in Legal Amazon;
20% os rural properties in
other regions.
Source: Agroconsult, IBGE
Pasture Area (million ha) yield (@/ha/year)
190.0 4.6
4.1
3.6
3.1
2.6
2.1
1.6
1.1
0.6
187.5
185.0
182.5
180.0
177.5
175.0
172.5
170.0
167.5
165.0
1990
1991
1992
1993
1994
1995
1996
1997
1998
1999
200
0
2001
2002
2003
2004
2005
2006
2007
2008
2009
2010
2011
2012
2013
2014
2015
Legal Amazon80% of rural properties
situated in Forest formations
35 % of rural properties
situated in Savana formations
Other regions20% of rural properties
Legal Amazon
Amazon Biome
Savana Biome (Cerrado) within the Legal Amazon
Others Biomes
Pantanal Biome
42
Sust
aina
bilit
y
Brazilian Livestock Profile
30,000.0
25,000.0
20,000.0
15,000.0
10,000.0
5,000.0
0.020042003200220012000 2005 2006 2007 2008 2009 2010 2011 2012 2013 2014 2015
Environmental Regulation Program (PRA) and Rural Environmental Registry (CAR)
Environmental Regulation Program (PRA):
a set of actions to be developed by rural
landowners and squatters to adapt and
promote environmental compliance.
Rural Environmental Registry (CAR): a set of
geo-referenced property information, with divi-
sion of APPs, RLs, remnants of native vegetation
and others in order to draw a digital map from
which the values of the areas for environmental
diagnosis are calculated.
Permanent Preservation Area (APP)
Untouchable natural areas, with strict limits on
exploitation where direct economic exploitation is
not permitted.
Protection of river banks (30 to 500 meters);
Protection of lakes (30-100 meters);
Springs (50 meters);
Hills with an incline of over 45°;
Others.
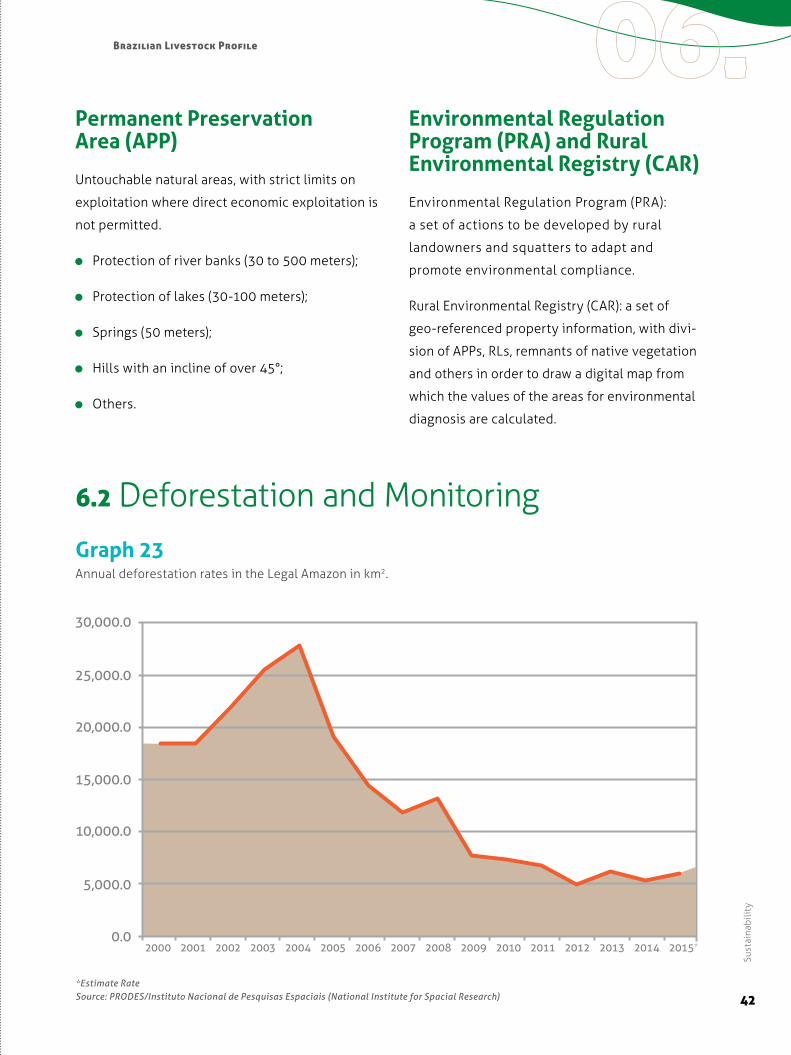
*Estimate RateSource: PRODES/Instituto Nacional de Pesquisas Espaciais (National Institute for Spacial Research)
Graph 23Annual deforestation rates in the Legal Amazon in km2.
6.2 Deforestation and Monitoring

43
Sust
aina
bilit
yAnnual Report - 2016
The largest industries in Brazil maintain agreements
with the public and private sector to control their
network of suppliers.
Our monitoring system uses geotechnology to en-
sure that cattle is not received from:
Sustainable Farming Group (GTPS), the Bra-
zilian round table for sustainable meat was
established in late 2007.
The Group debates and formulates princi-
ples, standards and common practices for
the development of sustainable beef pro-
duction.
GTPS is committed to zero deforestation, with
the creation of conditions and forms of com-
pensation for this practice to become viable.
GTPS Members Producers
Industries
Companies from the retail and services sectors
Financial institutions
NGO s
GTPS pillars Continuous improvement of sustainability
Transparency and ethics
Best practices in crop and livestock production
Legal compliance
- protected areas such as indigenous reserves
and conservation areas
- areas with illegal logging
- suppliers listed by the Ministry of Labor as
associated with slave labor
6.3 GTPS – Round Table
Map 5Amazon Biome with details of protected areas and indigenous areas.
www.pecuariasustentavel.org.br
44
Sust
aina
bilit
y
Brazilian Livestock Profile
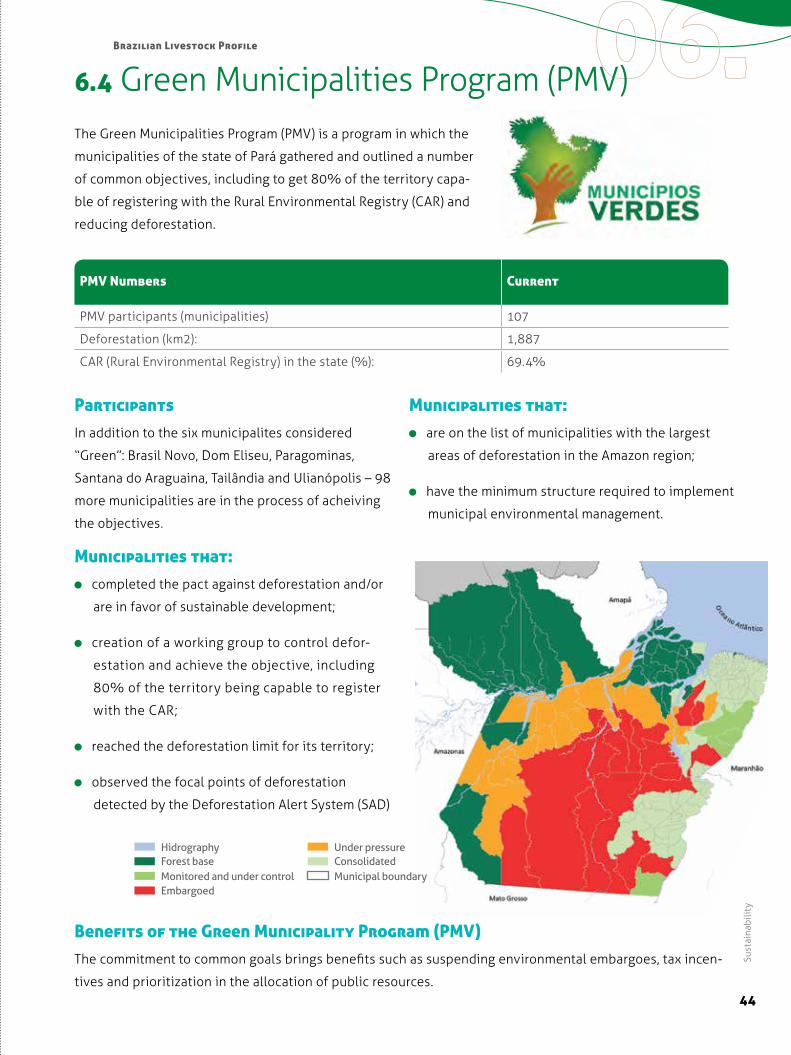
ParticipantsIn addition to the six municipalites considered
“Green”: Brasil Novo, Dom Eliseu, Paragominas,
Santana do Araguaina, Tailândia and Ulianópolis – 98
more municipalities are in the process of acheiving
the objectives.
Municipalities that: completed the pact against deforestation and/or
are in favor of sustainable development;
creation of a working group to control defor-
estation and achieve the objective, including
80% of the territory being capable to register
with the CAR;
reached the deforestation limit for its territory;
observed the focal points of deforestation
detected by the Deforestation Alert System (SAD)
Municipalities that: are on the list of municipalities with the largest
areas of deforestation in the Amazon region;
have the minimum structure required to implement
municipal environmental management.
The Green Municipalities Program (PMV) is a program in which the
municipalities of the state of Pará gathered and outlined a number
of common objectives, including to get 80% of the territory capa-
ble of registering with the Rural Environmental Registry (CAR) and
reducing deforestation.
PMV Numbers Current
PMV participants (municipalities) 107
Deforestation (km2): 1,887
CAR (Rural Environmental Registry) in the state (%): 69.4%
6.4 Green Municipalities Program (PMV)
Benefits of the Green Municipality Program (PMV)The commitment to common goals brings benefits such as suspending environmental embargoes, tax incen-
tives and prioritization in the allocation of public resources.
Under pressureConsolidatedMunicipal boundary
HidrographyForest base Monitored and under controlEmbargoed

45
Sust
aina
bilit
yAnnual Report - 2016
What is it?Public policy that details the actions to mitigate and
adapt to climate change for the agricultural sector.
ObjectiveTo promote the reduction of Greenhouse Gas Emis-
sions (GHG)
Technologies focused on livestockRecovery of Degraded Pastures;
Crop-Livestock-Forest integration;
Validity: 2020
Scope: national
Beneficiaries: rural producers, individuals or legal
entities and their cooperatives
Financiable value: Up to R$ 1 million per beneficiary
per harvest. Funding limit: up to 100% of the invest-
ment value
Charges: 5% per year
6.5 ABC Plan 6.6 ABC ProgramWhat is it? Rural credit line that enables the implementation of
the ABC Plan
Who provides funding?
The funds come from the BNDES System, Hand-
book of Rural Savings and constitutional Funds.
Livestock-related projects ABC Pastures Recovery
ABC Crop-Livestock-Forest Integration
Principal eligible items
Acquisition of inputs and payment services
intended for the implementation and maintenance
of the financed projects;
Acquisition, transport, application and
incorporation of agricultural correctives
(limestone and others);
Marking and construction of terraces and
implementation of soil conservation practices.
Federal Government has pledged to reduce the emission of greenhouse gases at COP 15
National Policy on climate change
ABC Plan Public Policy to encourage the reduction of climate change and the adoption of measures for the agricul-ture and livestock industry.
ABC Program Credit lines to promote low-carbon agriculture technologies and investments.

46
Sust
aina
bilit
y
Brazilian Livestock Profile
6.7 Animal Health
Funded investments Pasture recovery
Crop-Livestock-Forest integration systems
No-till systems
Biological nitrogen fixation
Forest planting
Animal waste treatment
Adaptation to climate change
Foot and Mouth DiseaseMap 6 FMD situation in South America.
Bovine Spongiform Encephalopathy - BSETable 15Risky situation with respect to BSE, according to the 82nd General Session of the World Organisation for Animal Health (OIE).
Member countries known to pose a negligable risk of BSE according to Chapter 11.4 of the Land Code.
Argentina Hungary Norway
Australia Iceland Panama
Austria India Paraguay
Belgium Israel Peru
Brazil Italy Portugal
Bulgaria Japan Romania
Chile Korea (Rep. of) Singapore
Colombia Latvia Slovakia
Croatia Luxembourg Slovenia
Denmark Malta Sweden
Estonia Netherland United States of America
Finland New Zealand Uruguay
Free zone where vaccination is practisedFree zone where vaccination is not practisedNon-Free zone
Protection zone
Source: OIE (http://www.oie.int/?id=495)

Brazilian Beef Exporters Association
+55 11 3531.7888Av. Brigadeiro Faria Lima, 1912 14º Andar | Conjunto J São Paulo | SP | 01451-000
@abiec_news fb.com/portalabiec
abiec.com.br brazilianbeef.org.br apexbrasil.com.br
unitri.com.b
r