BRAZILIAN AGRIBUSINESS -...
36
BRAZILIAN AGRIBUSINESS March, 2007
Transcript of BRAZILIAN AGRIBUSINESS -...

BRAZILIAN AGRIBUSINESS
March, 2007
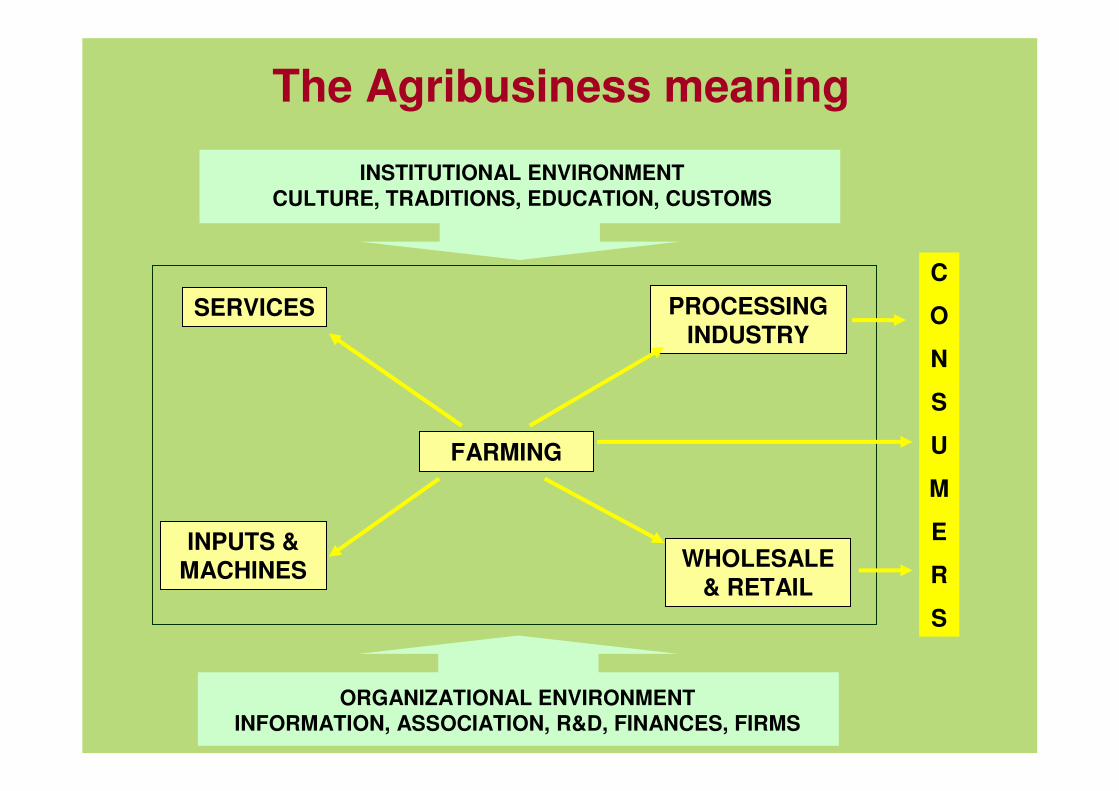
FARMING
WHOLESALE& RETAIL
PROCESSINGINDUSTRY
INPUTS &MACHINES
SERVICESC
O
N
S
U
M
E
R
S
INSTITUTIONAL ENVIRONMENTCULTURE, TRADITIONS, EDUCATION, CUSTOMS
ORGANIZATIONAL ENVIRONMENTINFORMATION, ASSOCIATION, R&D, FINANCES, FIRMS
The Agribusiness meaning

JOBS - 2005
37%
GDP - 2005
27.9%
Total: US$ 796 bi
Agribusiness: US$ 222.1 biAgriculture: US$ 156.1 bi (70.3%)Livestock: US$ 66.0 billion (29.7%)
Non-Agribusiness: US$ 573.9 bi
Agribusiness was responsible for:
EXPORTS - 2006
Total: US$ 137.5 bi
Agribusiness US$ 49.4 bi
Non-Agribusiness US$ 88.1 bi
36%
Sources: CEPEA-USP/CNA, MAPA and IPEA
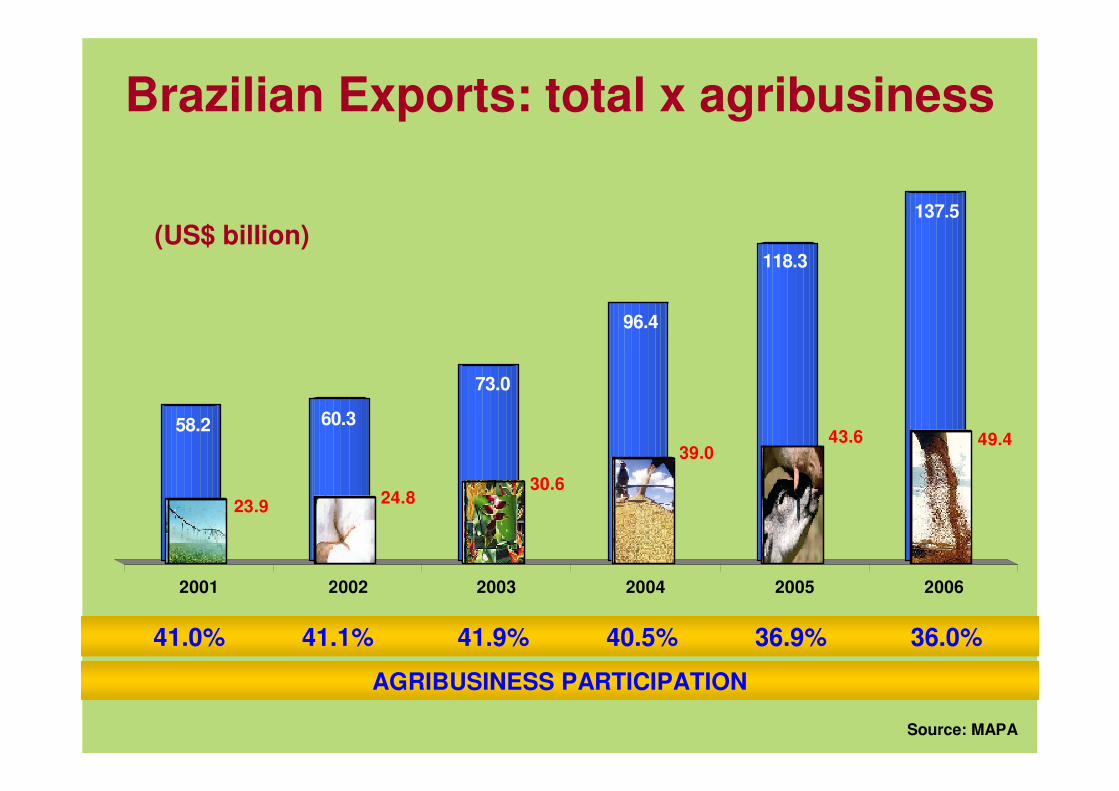
137.5
118.3
96.4
73.0
60.358.249.443.6
39.0
30.624.823.9
2001 2002 2003 2004 2005 2006
(US$ billion)
Brazilian Exports: total x agribusiness
Source: MAPA
AGRIBUSINESS PARTICIPATION
41.0% 41.1% 41.9% 40.5% 36.9% 36.0%

Brazil – Japan Trade Flow
�������������� ������� ���������
0
1
2
3
4
5
1997 1998 1999 2000 2001 2002 2003 2004 2005 2006
U S
$
b i
l l i
o n
TOTAL EXPORTS TOTAL IMPORTS AGRI EXPORTS AGRI IMPORTS
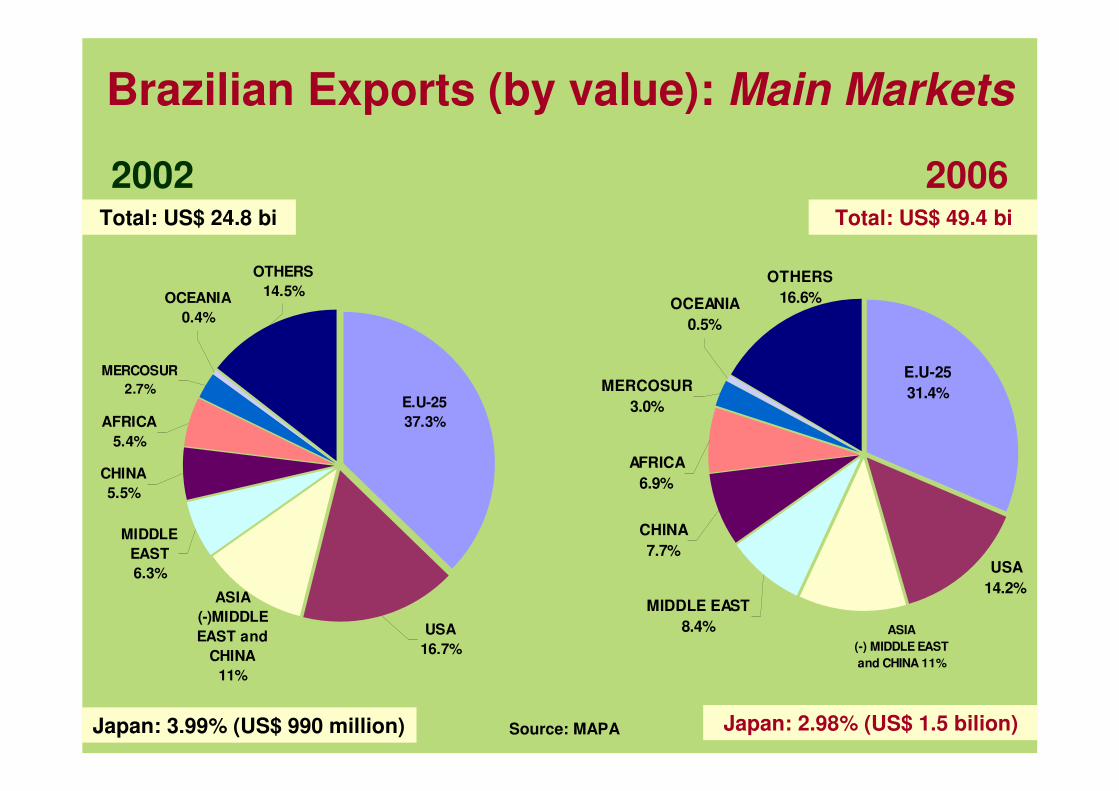
E.U-2537.3%
USA16.7%
ASIA(-)MIDDLE EAST and
CHINA11%
MIDDLE EAST6.3%
OCEANIA0.4%
OTHERS14.5%
CHINA5.5%
AFRICA5.4%
MERCOSUR2.7%
E.U-2531.4%
USA14.2%
ASIA(-) MIDDLE EAST and CHINA 11%
MIDDLE EAST8.4%
OCEANIA0.5%
OTHERS16.6%
CHINA7.7%
AFRICA6.9%
MERCOSUR3.0%
Brazilian Exports (by value): Main Markets
Source: MAPA
20062002
Japan: 3.99% (US$ 990 million) Japan: 2.98% (US$ 1.5 bilion)
Total: US$ 24.8 bi Total: US$ 49.4 bi

Coffee6.8%
Leather and Products
7.0%
Sugar and Alcohol15.7%
Wood and Products
15.9%
Beef17.5%
Soy Complex18.8%
Others8.7%
Textile Products2.8%
Tobacco3.5%
Fruits Juice3.2%
Coffee5.6%
Leather and Products
9.4%
Sugar and Alcohol
9.1%
Wood and Products
17.2%
Beef12.9%
Soy Complex24.2%
Others9.7%
Textile Products
3.5%
Tobacco4.1%
Fruits Juice4.4%
Source: MAPA
Brazilian Exports (by value): Main Products
2002 2006
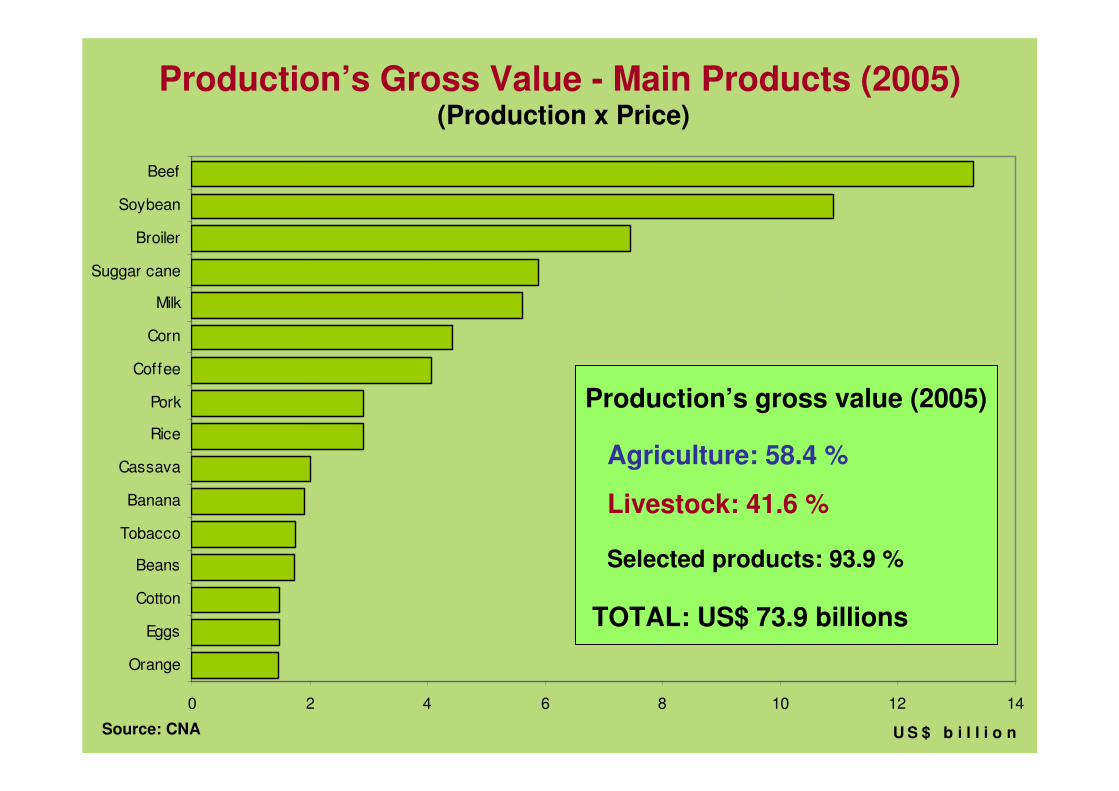
0 2 4 6 8 10 12 14
Orange
Eggs
Cotton
Beans
Tobacco
Banana
Cassava
Rice
Pork
Coffee
Corn
Milk
Suggar cane
Broiler
Soybean
Beef
U S $ b i l l i o n
Production’s Gross Value - Main Products (2005)
Production’s gross value (2005)
Agriculture: 58.4 %
Livestock: 41.6 %
TOTAL: US$ 73.9 billions
Selected products: 93.9 %
Source: CNA
(Production x Price)

Source: Conab / MAPA * Estimate (5th Grain Harvest Survey: February/2007)
Grain Production
GRAINS: cotton, peanut, rice, oats, rye, barley, beans, sunflowers, castor bean, corn, soy, sorgum, wheat and triticale.
45.547.349.047.443.9
40.237.837.836.935.036.637.038.539.135.638.537.9
126.5
57.9
68.4 68.376.0
81.173.6
78.4 76.682.4 83.0
100.3
96.7
123.2 119.1
113.9
120.7
90/91 91/92 92/93 93/94 94/95 95/96 96/97 97/98 98/99 99/00 00/01 01/02 02/03 03/04 04/05 05/06 06/07*
A r
e a
and
P r
o d
u c
t i o
n
( m i
l l i
o n
o f
h a
a n
d
t o n
)
AREA: + 20%
PRODUCTION: + 118.5%
PRODUTIVIDADE: + 86.7%

Meat Production
* Estimate
Sources: ABEF, ABIEC and ABIECS
8,900
5,200
9,200
3,411
2,830
1,330
1.000
2.000
3.000
4.000
5.000
6.000
7.000
8.000
9.000
10.000
1994 1995 1996 1997 1998 1999 2000 2001 2002 2003 2004 2005 2006*
P r
o d
u c
t i o
n
( t
h o
u s
a n
d
t o n
)
Beef: 71%
Pork: 113%
Broiler: 170%

0
2
4
6
8
10
12
14
16
18
20
22
24
26
28
30
32
90/91 91/92 92/93 93/94 94/95 95/96 96/97 97/98 98/99 99/00 00/01 01/02 02/03 03/04 04/05 05/06 06/07*
P r
o d
u c
t i o
n
( m i
l l i
o n
t o
n
a n
d m
³ )
Sugar and Alcohol Production
Sources: SPAE / MAPA and Conab / MAPA * Estimate (3rd Sugar Cane Harvest Survey: November/2006)
SUGAR: + 328.6%
ALCOHOL: + 46.7%

0
10
20
30
40
50
90/9
1
91/9
2
92/9
3
93/9
4
94/9
5
95/9
6
96/9
7
97/9
8
98/9
9
99/0
0
00/0
1
01/0
2
02/0
3
03/0
4
04/0
5
05/0
6
06/0
7
07/0
8*
P R
O D
U C
T I
O N
m
i l l
i o
n s
a c
k s
0,0
0,5
1,0
1,5
2,0
2,5
3,0
3,5
A R
E A
m
i l l
i o
n h
a
Coffee Production
PRODUCTION: + 4.2%
Soures: USDA and EMBRAPA / Conab (after 1996) * Projection (1st Coffee Harvest Survey: December/2006)
AREA: - 38.2%

Ranking 2006: Production and Exports
Total Exports
US$ milhões
Suggar 1st 1st 113 6,167
Coffee 1st 1st 134 3,364
Orange Juice 1st 1st 82 1,469
Soy Complex 2nd 1st 74 9,308
Beef 2nd 1st 144 3,923
Tobacco 2nd 1st 114 1,752
Alcohol 2nd 1st 40 1,605
Broiler 3rd 1st 145 3,203
Corn 3rd 4th 34 460
Pork 4th 4th 72 1,036
ExportsNumber of
MarketsMain
ProductsProduction
Sources: USDA and F.O. Litch’s Preliminary data
AGROENERGY: THE NEW PARADIGM OF WORLD
AGRICULTURE

Coal
Oil
Natural Gas
Hydro Nuclear
Other
Modern Biomass
Biomass (firewood)
0
10
20
30
40
50
60
70
80
90
100
1850 1900 1950 2000 2050 2100
�����
21st Century: the beginning of a New Era
Sources: Nakícenovic, Grübler and MaConald, 1998
�
We are here
Challenge for mankind: TO DIVERSIFY ENERGY SOURCES

Why BIOFUELS?
Economic aspects- new component of the demand
- impacts on trade balance
Renewability- short production cycle
- man-controlled process
Social aspects- jobs creation
- income deconcentration
Environmental gains- carbon capture- lower emission levels in consumption

Brazilian energetic matrix - 2005
WORLD: Renewable Sources 13.3%
Petroleum andderivatives
38.7%
Natural Gas9.4%
Coal 6.3%
Uranium 1.2%
Other renewablesources
2.9%
Hydroelectricity14.8%
Wood 13.0%
Sugar cane13.8%
Source: BEN 2006100% = 218,6 million tep
BRAZIL: Renewable Sources 44.5%
Biomass: 26.8%

Brazilian Experience: nowadays…
1) Since 2003, models of Flex-Fuel Vehicles can use any mixture of gasoline and alcohol.
2) More than 2.7 million flex-fuel vehicles.
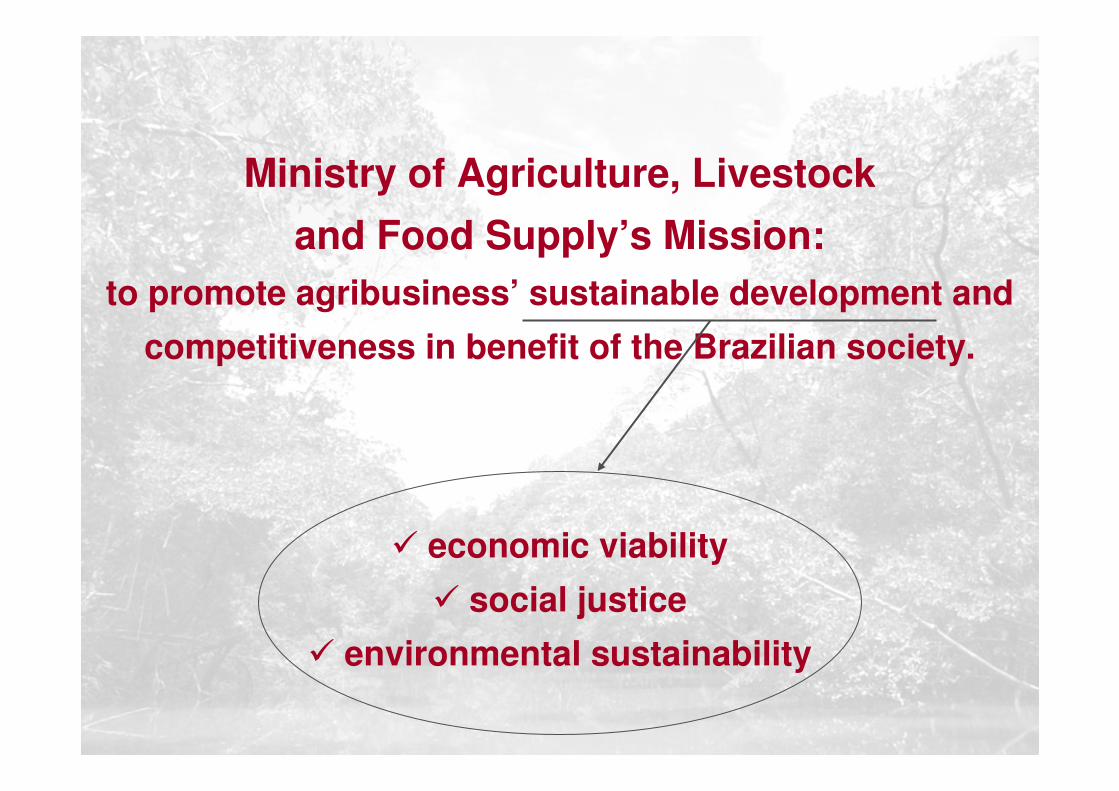
� economic viability� social justice
� environmental sustainability
Ministry of Agriculture, Livestockand Food Supply’s Mission:
to promote agribusiness’ sustainable development and competitiveness in benefit of the Brazilian society.

2% 3% 4% 5%8%
17%
21% 22%
30%
34%
58%
NewZeland
Brazil Australia Russia* China* USA Mexico Canada OCDE EuropeanUnion
Japan
Producer Subsidy Equivalent (PSE)Average (2002-2004)
* Average 2002-2003Source: OCDE

World:
� forced labour = 12,300,000 people (ILO)
Brazil:
� 4,273 rural workers in forced labour in 2005
� 17,700,000 people working in agribusiness
The ILO 2005 Report considered Brazil as an example on fight against forced labour
Forced labour exploitation is a crime in Brazil

Legal Amazon X Amazon Biome
Sources: IBGE / MMA / MAPA
: 5.2 million km2 (61%*)
: 4.2 million km2 (49%*)
* Percentage in relationto Brazilian territory

In 2005, 4.9% of the total soy plantingarea in Brazil were located within the
Amazon Biome. This arearepresented less than 0.3% of the
total Amazon Biome area.Amazon Biome
Legal Amazon
Soy Production - Amazon Biome (2005)
Amazon Biome
Others Biomes
Source: CONAB / IBGE / INPE / MMA / SIPAM / ADA
Ellaborated by: CONAB / DIGEM / SUINF / GEOTE
Areas that are responsible for approximately70% of soy production in the Legal Amazon

Gross tax of deforestation reduction in the Amazon
* Estimate
Source: Ministry of Environment
-
5.000
10.000
15.000
20.000
25.000
30.000
00\01 01\02 02\03 03\04 04\05 05\06*
km2/year
Years
- 31%
- 30%
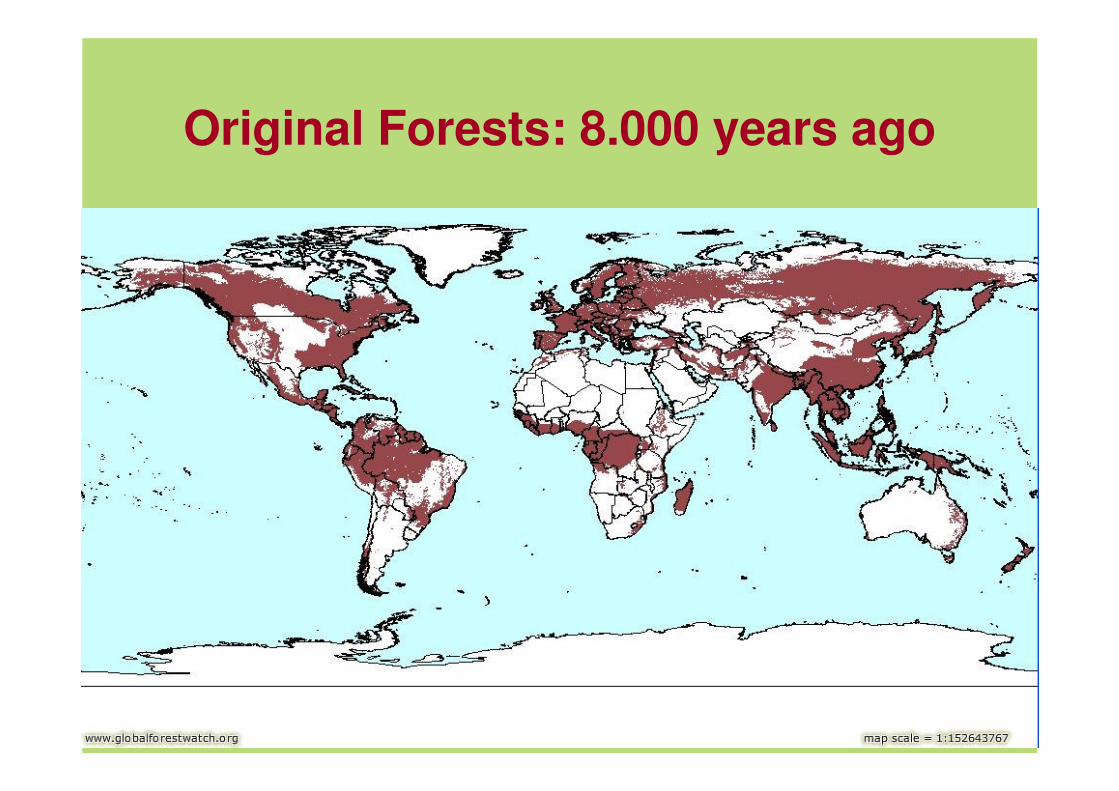
Original Forests: 8.000 years ago
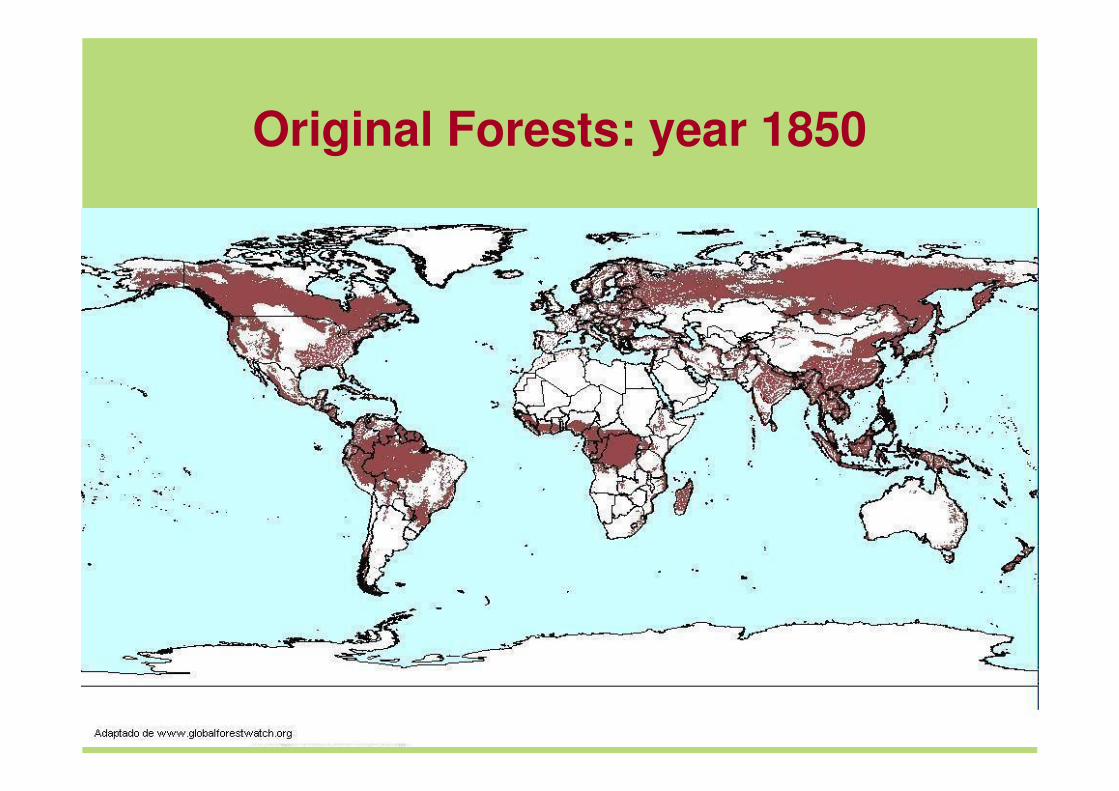
Original Forests: year 1850

Original Forests: year 1950
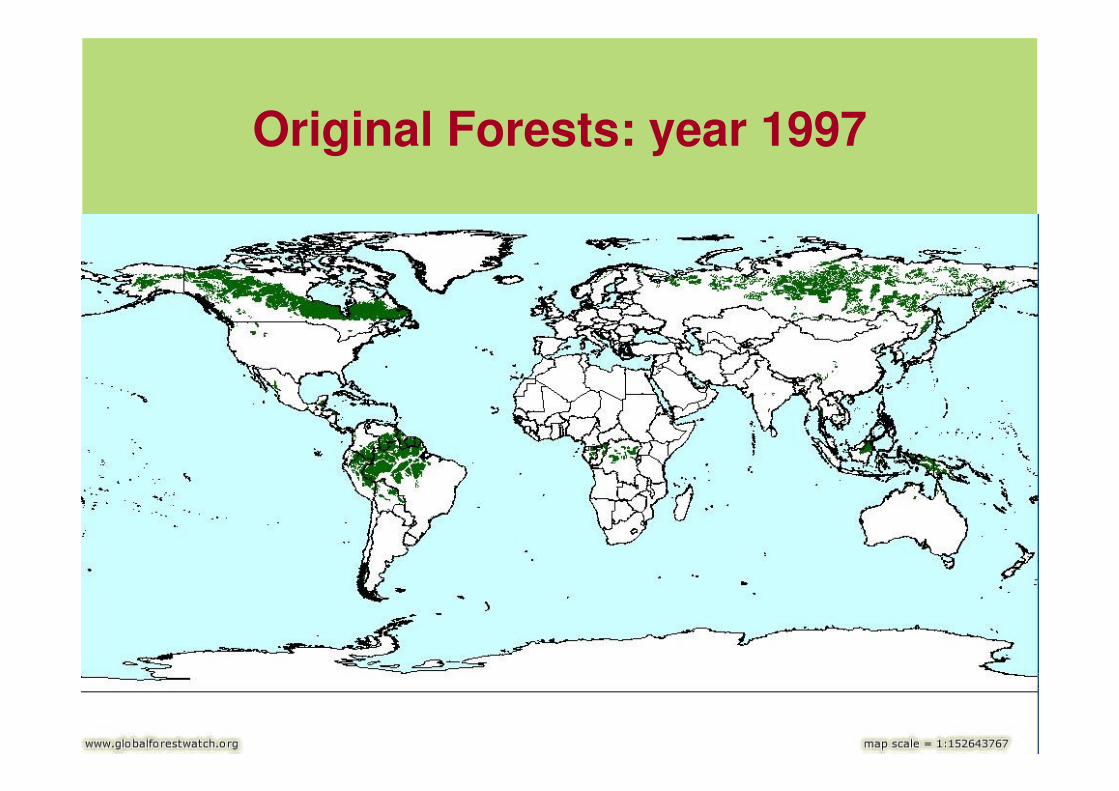
Original Forests: year 1997

Original Forests(1000 km²)
B.P.: Before Present
Original Forest
8000 B.P. % 1000 % 1650 % 1850 % 1950 % Currently %
African 6,799 100 6,459 95 5,779 85 5,099 75 2,380 35 527 7.8
Asia 15,132 100 13,619 90 11,349 75 8,323 55 3,783 25 844 5.6
North America 10,877 100 10,333 95 9,245 85 8,158 75 5,439 50 3,737 34.4
Central America 1,779 100 1,743 98 1,334 75 890 50 712 40 172 9.7
South America 11,709 100 11,592 99 11,475 98 11,124 95 8,196 70 6,412 54.8
Russian 11,759 100 10,583 90 9,407 80 7,055 60 5,880 50 3,448 29.3
Europe 4,690 100 3,752 80 1,407 30 469 10 235 5 14 0.3
Oceania 1,431 100 1,402 98 1,288 90 1,073 75 716 50 319 22.3
World 64,176 100 59,484 92.7 51,285 79,9 42,190 65.7 27,339 42.6 15,473 24.1
Brazil 6,304 100 6,241 99 6,178 98 5,989 95 5,043 80 4,378 69.4

������������ ������
��������

� Land availability: Pasture area = 220 million ha
� Appropriate climate:Up to three harvests during thesame season
� Technology for tropical agriculture
� Qualified human resources
� Public Policies
Potential
Territorial distribution - estimate
(million ha)
851TOTAL
91Non exploited areas stillavailable for agriculture
38Other types of usage
722Subtotal
5Cultivated forests
20Cities, lakes and roads
15Perennial crops
47Yearly crops
55Protect areas
220Pasture
360Amazon Forest
Sustainable Production
Sources: IBGE and ConabAdaptation: MAPA

Potential of Production
Brazilian Livestock
Potential area - 72 million ha
Livestock Area Productivity Livestock Area Productivity
(million heads) (million ha) (head/ha) (million heads) (million ha) (head/ha)
207 220 0.94 207 148 1.4*
2005 Estimate
* Average SP
Sources: IBGE and IEA / SP

�������������
���
AMAZONREGION
TOTAL AREA WITHOUT ENVIRONMENTALRESTRICTIONS . . . . . . . . . . . .
437,2 MM hectares
AREA WITH SLOPEABOVE 12% . . . . . . . . . . . . . . 75,6 MM hectares
TOTAL AVAILABLE ANDSUITABLE LAND . . . . . . . . . . 361,6MM hectares
PANTANAL
How to expand sustainable sugar-cane production?
Current number: 360 units
Estimate for 2010: 77 new units
Plants / distilleries:
POTENTIAL AREAS

2
4
6
8
10
12
14
16
2001 2002 2003 2004 2005
m i
l l i
o n
BOVINE (heads) PASTURE (ha) SUGAR-CANE (ha)
Fonte: Instituto de Economia Agrícola / SP
7,0%
-2,5%
22,1%
São Paulo State: The expansion of sugar-cane
(Head/ha) -(2001)1.27
(2005)1.4
Source: Instituto de Economia Agrícola / SP
7%
- 2.5%
22.1%

Challenges
� Liberalization of world agricultural trade.
Agricultural protectionism: it hampers the growth and the diversification of agricultural activities.
With a greater trade liberalization Brazil would be able to develop a more diversified agribusiness.
� Infrastructure: agribusiness expansion implies bulkyinvestments.
Lucky chances for private investments
Ministry of Agriculture, Livestockand Food Supply
www.agricultura.gov.br