Brazil Oil & Gas Growth prospects and new regulation José Luis Villanueva, Director Brazil Energy...
24
Brazil Oil & Gas Growth prospects and new regulation José Luis Villanueva, Director Brazil Energy Conference Brazilian-American Chamber of Commerce
-
Upload
kianna-gaskin -
Category
Documents
-
view
217 -
download
0
Transcript of Brazil Oil & Gas Growth prospects and new regulation José Luis Villanueva, Director Brazil Energy...

Brazil Oil & GasGrowth prospects and new regulation
José Luis Villanueva, Director
Brazil Energy ConferenceBrazilian-American Chamber of Commerce

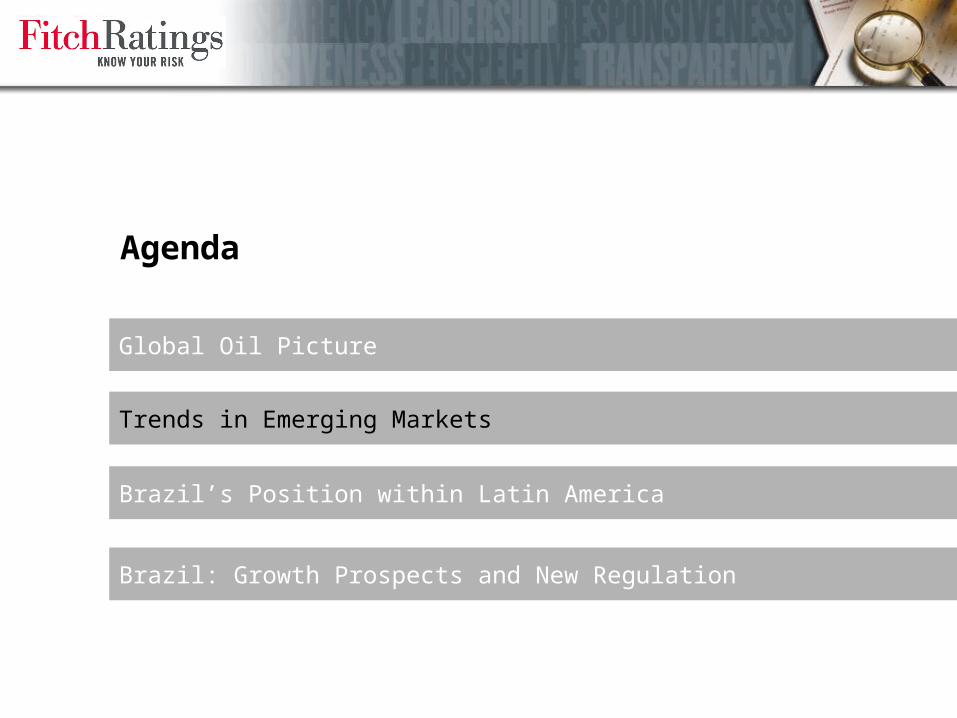
Agenda
Global Oil Picture
Trends in Emerging Markets
Brazil’s Position within Latin America
Brazil: Growth Prospects and New Regulation
www.fitchratings.com 3
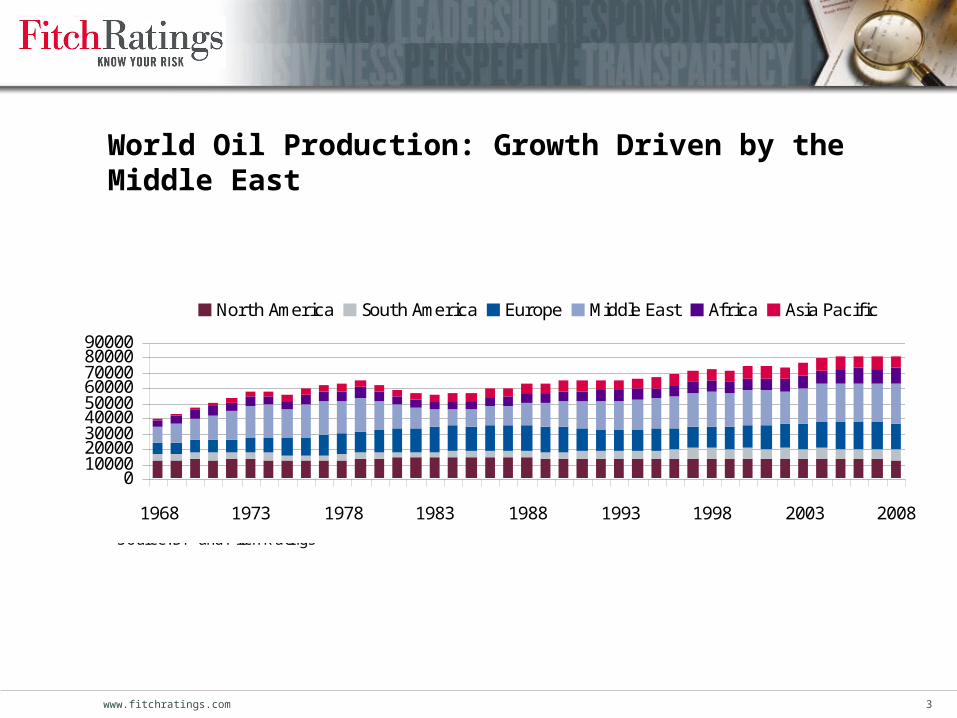
World Oil Production: Growth Driven by the Middle East
0100002000030000400005000060000700008000090000
1968 1973 1978 1983 1988 1993 1998 2003 2008
North America South America Europe Middle East Africa Asia Pacific
Source: BP and Fitch Ratings
(thousand barrels per day)

www.fitchratings.com 4
World Oil Consumption: Growth Driven by Asia Pacific
0100002000030000400005000060000700008000090000
1968 1973 1978 1983 1988 1993 1998 2003 2008
North America South America Europe Middle East Africa Asia Pacific
Source: BP and Fitch Ratings
(thousand barrels per day)

www.fitchratings.com 5
Oil Surplus in Middle East, Africa and South America
-20,000
-15,000
-10,000
-5,000
0
5,000
10,000
15,000
20,000
25,000
NorthAmerica
SouthAmerica
Europe Middle East Africa Asia Pacific
Tho
usan
d ba
rrel
s of
oil
per
day
1978 1988 1998 2008
Sources: BP and Fitch Ratings

www.fitchratings.com 6
World Oil Proved Reserves Concentrated in ME
0250500750
100012501500
1998 1999 2000 2001 2002 2003 2004 2005 2006 2007 2008
North America South America Europe Middle East Africa Asia Pacific
Source: BP and Fitch
(billion barrels)
Agenda
Global Oil Picture
Trends in Emerging Markets
Brazil’s Position within Latin America
Brazil: Growth Prospects and New Regulation
www.fitchratings.com 8
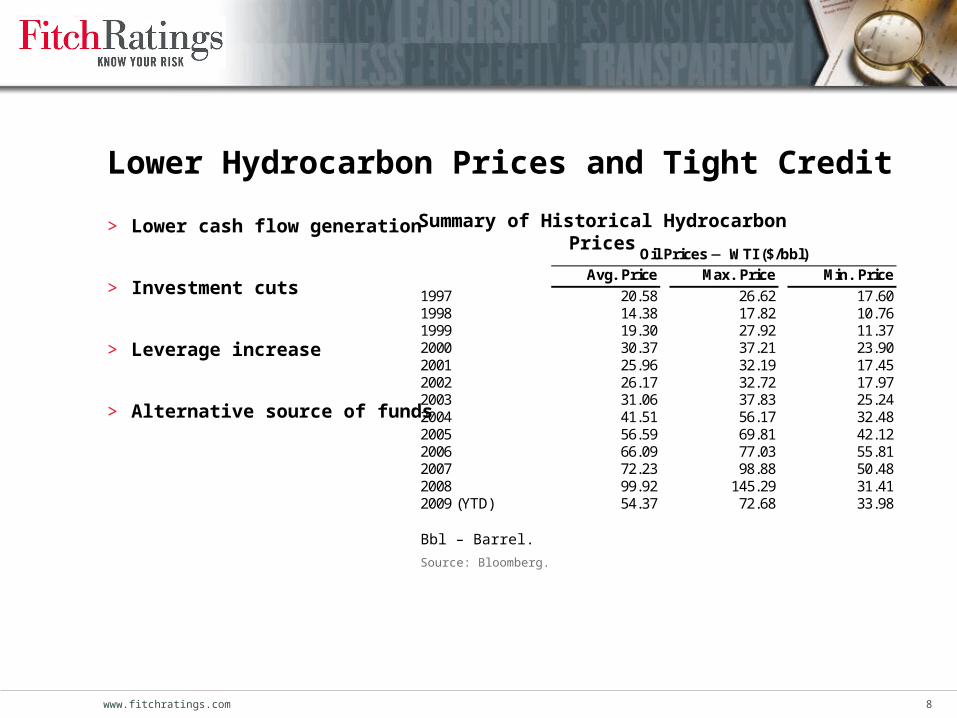
Lower Hydrocarbon Prices and Tight Credit
> Lower cash flow generation
> Investment cuts
> Leverage increase
> Alternative source of funds
Summary of Historical Hydrocarbon Prices
Oil Prices WTI ($/bbl)
Avg. Price Max. Price Min. Price 1997 20.58 26.62 17.60 1998 14.38 17.82 10.76 1999 19.30 27.92 11.37 2000 30.37 37.21 23.90 2001 25.96 32.19 17.45 2002 26.17 32.72 17.97 2003 31.06 37.83 25.24 2004 41.51 56.17 32.48 2005 56.59 69.81 42.12 2006 66.09 77.03 55.81 2007 72.23 98.88 50.48 2008 99.92 145.29 31.41 2009 (YTD) 54.37 72.68 33.98
Bbl – Barrel.
Source: Bloomberg.

www.fitchratings.com 9
Capital Expenditures to Decline in 2009 Declines in Russia and LatAm partially offset by increases in Asia
05,000
10,00015,00020,00025,00030,00035,00040,000
Pem
ex
PD
VS
A
Pet
robr
as
Eco
petr
ol
Luko
il
Ros
neft
TN
K-B
P
Gaz
prom
Nef
t
Kaz
Mun
aiG
asE
&P
Pet
roC
hina
Sin
opec
CN
OO
C
PT
T
Pet
rona
s
2003 2004 2005 2006 2007 2008 2009e
Source: Company reports, Fitch Ratings
Capex 2003-2009(USDbn)

www.fitchratings.com 10
Capex Efficiency Diverges Within RegionsMexico vs Brazil
Oil Production (’000 Bpd) Investments (USD bn)
Sources: Petrobras, Pemex, Fitch Ratings Sources: Petrobras, Pemex, Fitch Ratings
0
5
10
15
20
25
30
35
40
20
00
20
01
20
02
20
03
20
04
20
05
20
06
20
07
20
08
20
09
f
20
10
f
20
11
f
Petrobras Pemex
0
500
1000
1500
2000
2500
3000
3500
4000
20
00
20
01
20
02
20
03
20
04
20
05
20
06
20
07
20
08
20
09
f
20
10
f2
01
1f
Petrobras Pemex

www.fitchratings.com 11
China and State-Owned Banks Finance Sector
Expected Funding Sources in 2009a (USD Bil.)
Pemex ‘BBB’
Stable
PDVSA ‘B+’
Stable
Petrobras ‘BBB’
Stable
Ecopetrol ‘BB+’
Stable
Lukoil ‘BBB ’ Stable
Rosneft ‘BBB ’
Neg.
TNK-BP ‘BBB ’
Neg.
KMG E&P ‘BBB ’
Neg.
PetroChina ‘A+’
Stable
Sinopec ‘A ’
Stable
CNOOC ‘A’
Stable
PTT ‘BBB’
Stable
Petronas ‘A’
Stable Total % Government
Banks 12.5 5.0 3.0 6.6 5.0 3.5 35.6 33 China
Development Bank 4.0b 10.0 10.0 24.0 22
Exim Institutions 1.8 2.0 2.5 6.3 6 Domestic Capital
Markets 2.5 3.0 0.8 6.6 2.6 15.5 14 International
Capital Markets 2.5 2.8 1.5 1.0 1.0 4.5 13.3 12 Other 2.3 2.5 1.5 1.2 0.6 5.0 13.1 12 Total 9.0 9.0 30.3 3.0 8.0 13.0 1.6 0.0 13.2 10.0 3.5 2.6 4.5 106.7 100 aExpected funding sources include incremental debt and refinancing. bPDVSA funding sources includes a USD4 billion loan granted by CDB to Bandes (Venezuela’s Development Bank), which in turn grants loans to PDVSA. Source: Fitch Ratings and company reports.

www.fitchratings.com 12
Lower Oil Prices Not Likely to End Nationalism
> Hydrocarbon related revenues a significant revenue stream for the sovereign
– Close to 50% for Venezuela and Malaysia
– About 35% for Mexico, Russia and Kazakhstan
– Less than 20% for China, India, Thailand, Colombia and Brazil
> Need to attract capital and technical expertise from IOC to EM at risk
– Discouraged by higher royalties and taxes
– Nationalization or coerced sales in Venezuela, Bolivia, Russia and Kazakhstan
> Regulatory changes introduce marginal improvements or significant set-backs
– Mexico’s energy reform improves Pemex’s corporate governance & financial flexibility
– Brazil’s proposed pre-salt regulation increases government intervention in the industry

Agenda
Global Oil Picture
Trends in Emerging Markets
Brazil’s Position within Latin America
Brazil: Growth Prospects and New Regulation

www.fitchratings.com 14
Oil Production in Latin America: 10 mmbpd in 2008
0
20004000
6000
800010000
12000
1968 1973 1978 1983 1988 1993 1998 2003 2008
Brazil Mexico Venezuela Argentina Colombia Ecuador Other
Source: BP and Fitch Ratings
(thousand barrels per day)

www.fitchratings.com 15
Oil Production in Latin America Shifting to Brazil
Peru1%
T&T2%
Ecuador
5%Other
1%
Mexico33%
Brazil19%
Colombia6%
Argentina7%
Venezuela26%
2008 Oil Production in Latin America
(9.8 million barrels per day)
Source: BP and Fitch
Peru1%
T&T1%
Ecuador
5%Other
1%
Mexico34%
Brazil10%
Colombia7%
Argentina9%
Venezuela33%
1998 Oil Production in Latin America
(10.4 million barrels per day)
Source: BP and Fitch

www.fitchratings.com 16
Consistent Production Increases in Brazil
-2000
-1500
-1000
-500
0
500
1000
1500
2000
Brazil Mexico Venezuela Argentina Colombia Ecuador Other
Tho
usan
d ba
rrel
s of
oil
per
day
1970-1980 1980-1990 1990-2000 2000-2008
Sources: BP and Fitch Ratings

www.fitchratings.com 17
Reserves shifting to Venezuela and Brazil
Peru1%
T&T1%
Ecuador
5%
Other1%
Mexico9%
Brazil9%
Colombia1%
Argentina2%
Venezuela73%
2008 Proved Oil Reserves in Latin America
(135 billion barrels)
Source: BP and Fitch Ratings
Venezuela65%
Argentina2%
Colombia2%
Brazil6%
Mexico18%
Other1%
Ecuador
5%
T&T1%Peru
1%
1998 Proved Oil Reserves in Latin America
(117 billion barrels)
Source: BP and Fitch Ratings

Agenda
Global Oil Picture
Trends in Emerging Markets
Brazil’s Position within Latin America
Brazil: Growth Prospects and New Regulation

www.fitchratings.com 19
Brazil: Internal Demand is Robust
Sources: BP and Fitch
0.00
0.50
1.00
1.50
2.00
2.50
19
80
19
81
19
82
19
83
19
84
19
85
19
86
19
87
19
88
19
89
19
90
19
91
19
92
19
93
19
94
19
95
19
96
19
97
19
98
19
99
20
00
20
01
20
02
20
03
20
04
20
05
20
06
20
07
20
08
Mil
lio
n b
arre
ls p
er d
ay
Oil Production Oil Consumption

www.fitchratings.com 20
Strong Production, Reserves and Reserve Life Trends in Brazil
Reserve Life (years)
0
5
10
15
20
25
19
80
19
84
19
88
19
92
19
96
20
00
20
04
20
08
-
2,000
4,000
6,000
8,000
10,000
12,000
14,000
-
0.200
0.400
0.600
0.800
1.000
1.200
1.400
1.600
1.800
2.000
Reserves P roduction
Reserves and Production in Brazil(million barrels)
Source: BP and Fitch Ratings

www.fitchratings.com 21
Discoveries Increase Production and ReserveGrowth Prospects
> With the pre-salt areas reserves are expected to more than double in Brazil
– 5 billion boe to 8 billion boe in Tupi
– 3 billion boe to 4 billlion boe in Iara
– 1 billion boe to 2 billion boe in Guara
> Production also could double by 2020 (excluding PSA)
– 2015E production of 582 mboe
– 2020E production of 1,815 mboe
> Significant investments are required for developing pre-salt (excluding PSA)
– USD29 billion from 2009 to 2013
– USD111 billion from 2009 to 2020
www.fitchratings.com 22
Proposed Regulation Increases Government Intervention
> Creation of Petrosal – Participates in PSA’s operating committees
– Has veto power
> Increased attribution of the CNPE
– Determines areas considered strategic
– Defines the oil profit paid to the government in areas directly assigned to Petrobras
> Government may increase stake in the industry
– “Profit oil” vs royalties and special taxes
– If minority shareholders do not exercise their pre-emptive rights
– By buying Petrobras’ shares with treasury notes

www.fitchratings.com 23
Petrobras to Take a More Active Role in the Industry
> Benefits from proposed regulation:
– Operator in all blocks
– 30% minimum participation in PSAs
– Government contribution of up to 5 billion boe
– Likely to raise more than USD15 billion from minority shareholders
> Burdens from proposed regulation:– Significant investment requirements to develop pre-salt
– Could end up participating in non-economical fields
– Technical and economic challenges
– Resource overextension

Fitch Ratingswww.fitchratings.com
Singapore6 Temasek Blvd.#35-03/04/05Suntec Tower FourSingapore 038986+65 6336 6801
New YorkOne State Street PlazaNew York, NY 10004+1 212 908 0500+1 800 75 FITCH
Fitch Group Fitch Ratings Fitch Solutions Algorithmics
London101 Finsbury PavementLondonEC2A 1RS44 20 7417 4222