Brazil Grain and Feed Annual Low Prices and Large … GAIN Publications/Grain and Feed... · Total...
19
Page 1 THIS REPORT CONTAINS ASSESSMENTS OF COMMODITY AND TRADE ISSUES MADE BY USDA STAFF AND NOT NECESSARILY STATEMENTS OF OFFICIAL U.S. GOVERNMENT POLICY Date: GAIN Report Number: Approved By: Prepared By: Report Highlights: Record corn production at 93 million metric tons (mmt) and low commodity prices will increase corn stocks in 2017/2018 and could encourage government intervention. 2017/2018 wheat production is down on low prices, while 2017/2018 rice production is higher on increased area. Laura J. Geller, Agricultural Attaché Clay Hamilton, Agricultural Counselor Low Prices and Large Stocks Impact Corn Producers Grain and Feed Annual Brazil BR1707 4/6/2017 Required Report - public distribution
Transcript of Brazil Grain and Feed Annual Low Prices and Large … GAIN Publications/Grain and Feed... · Total...

Page 1
THIS REPORT CONTAINS ASSESSMENTS OF COMMODITY AND TRADE ISSUES MADE BY
USDA STAFF AND NOT NECESSARILY STATEMENTS OF OFFICIAL U.S. GOVERNMENT
POLICY
Date:
GAIN Report Number:
Approved By:
Prepared By:
Report Highlights:
Record corn production at 93 million metric tons (mmt) and low commodity prices will increase corn
stocks in 2017/2018 and could encourage government intervention. 2017/2018 wheat production is
down on low prices, while 2017/2018 rice production is higher on increased area.
Laura J. Geller, Agricultural Attaché
Clay Hamilton, Agricultural Counselor
Low Prices and Large Stocks Impact Corn Producers
Grain and Feed Annual
Brazil
BR1707
4/6/2017
Required Report - public distribution

Page 2
Commodities:
Wheat 2015/2016 2016/2017 2017/2018
Market Begin
Year Oct 2015 Oct 2016 Oct 2017
Brazil USDA
Official
New
Post
USDA
Official
New
Post
USDA
Official
New
Post
Area Harvested 2450 2450 2120 2120 0 2000
Beginning Stocks 870 870 1596 1596 0 2026
Production 5540 5540 6730 6730 0 6000
MY Imports 6745 6745 6700 6700 0 6500
TY Imports 5922 5922 7300 7100 0 6500
TY Imp. from
U.S.
422 422 0 1300 0 1000
Total Supply 13155 13155 15026 15026 0 14526
MY Exports 1059 1059 1600 1500 0 1000
TY Exports 1063 1063 1600 1500 0 1000
Feed and
Residual
500 500 700 700 0 500
FSI Consumption 10000 10000 10800 10800 0 10500
Total
Consumption
10500 10500 11500 11500 0 11000
Ending Stocks 1596 1596 1926 2026 0 2526
Total
Distribution
13155 13155 15026 15026 0 14526
(1000 HA) ,(1000 MT)
2017/2018 Wheat Supplies: 2017/2018 wheat area is forecast to decrease slightly to 2 million hectares
(mHA) due to low prices and higher costs of production. Production is also forecast lower at 6 million
metric tons (mmt) on the reduced area. A small amount of area may move to canola production, due to
high prices for canola in the state of Rio Grande do Sul.
In November 2016, wheat prices fell below the government-set minimum prices, triggering government
intervention with two domestic support programs. It’s anticipated that prices will rebound above the
minimum for the next crop year, based on lower production.
2017/2018 Wheat Trade: 2017/2018 imports are expected to decline three percent from the previous
year to 6.5 mmt. 2016/2017 imports are forecast to remain about the same at 6.7 mmt. Brazil needs to
import high quality wheat, usually from Argentina or the United States, to blend with their domestic
wheat in order to meet the baking specifications for the type of bread that is most widely consumed in
Wheat
Page 3
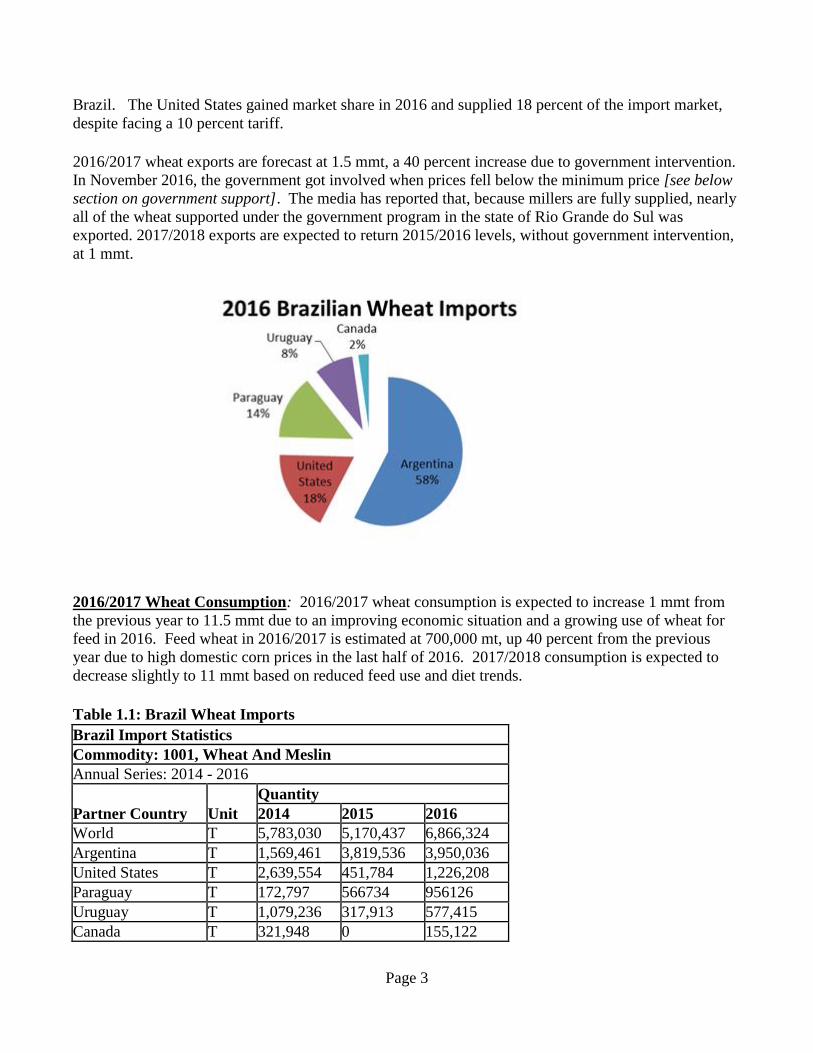
Brazil. The United States gained market share in 2016 and supplied 18 percent of the import market,
despite facing a 10 percent tariff.
2016/2017 wheat exports are forecast at 1.5 mmt, a 40 percent increase due to government intervention.
In November 2016, the government got involved when prices fell below the minimum price [see below
section on government support]. The media has reported that, because millers are fully supplied, nearly
all of the wheat supported under the government program in the state of Rio Grande do Sul was
exported. 2017/2018 exports are expected to return 2015/2016 levels, without government intervention,
at 1 mmt.
2016/2017 Wheat Consumption: 2016/2017 wheat consumption is expected to increase 1 mmt from
the previous year to 11.5 mmt due to an improving economic situation and a growing use of wheat for
feed in 2016. Feed wheat in 2016/2017 is estimated at 700,000 mt, up 40 percent from the previous
year due to high domestic corn prices in the last half of 2016. 2017/2018 consumption is expected to
decrease slightly to 11 mmt based on reduced feed use and diet trends.
Table 1.1: Brazil Wheat Imports
Brazil Import Statistics
Commodity: 1001, Wheat And Meslin
Annual Series: 2014 - 2016
Partner Country Unit
Quantity
2014 2015 2016
World T 5,783,030 5,170,437 6,866,324
Argentina T 1,569,461 3,819,536 3,950,036
United States T 2,639,554 451,784 1,226,208
Paraguay T 172,797 566734 956126
Uruguay T 1,079,236 317,913 577,415
Canada T 321,948 0 155,122

Page 4
Poland T 0 0 1,401
Lebanon T 33 44 15 Source of Data: SECEX – Foreign Trade Secretariat
Table 1.2: Brazil Wheat Flour Imports
Brazil Import Statistics
Commodity: 1101, Wheat Or Meslin Flour
Annual Series: 2014 - 2016
Partner Country Unit
Quantity
2014 2015 2016
World T 246,730 305,909 366,846
Argentina T 197,247 273,595 321,947
Paraguay T 8,728 15,980 26,207
Uruguay T 27,989 12,744 13,707
Belgium T 16 576 1,974
Italy T 942 1,765 1,199
France T 187 336 530
United States T 162 178 347
China T 112 199 306
Turkey T 7,798 96 241
Canada T 923 37 111
Netherlands T 821 20 72
Portugal T 45 26 64
Peru T 1,247 88 59
Greece T 23 23 41
United Kingdom T 44 29 38
Israel T 0 3 2
Germany T 1 1 1 Source of Data: SECEX – Foreign Trade Secretariat
Table 1.3: U.S. Wheat Exports to Brazil
U.S. Wheat Exports to Brazil (tons)
2011 2012 2013 2014 2015 2016
104,248 54,508 3,475,270 2,639,554 451,784 1,226,208 Source of Data: SECEX – Foreign Trade Secretariat

Page 5
Table 1.4: Brazil Wheat Exports
Brazil Export Statistics
Commodity: 1001, Wheat And Meslin
Annual Series: 2014 - 2016
Partner Country Unit
Quantity
2014 2015 2016
World T 277,001 1,778,873 713,313
Philippines T 115,204 311,676 224,747
Vietnam T 69,829 366,541 215,912
Colombia T - 33,000 97,916
Ecuador T - 31,450 62,121
Israel T - - 53,689
Indonesia T - 1,699 53,614
Taiwan T - - 3,547
Malaysia T - - 1,295
Paraguay T 38,094 134 471
Portugal T 2 3 2
Bolivia T - 4 1 Source of Data: SECEX – Foreign Trade Secretariat
Wheat Prices:
Table 1.5: Brazil Wheat Prices
Monthly Average Wheat Prices in Paraná Prices in R$ per Metric Ton (discounted by the NPR tax)
CY 2013 2014 2015 2016
Jan 765.24 764.48 564.07 734.88
Feb 755.78 764.49 569.38 747.61
Mar 736.77 795.35 607.45 762.20
Apr 712.25 836.27 679.51 767.65
May 726.00 821.07 672.48 791.80
Jun 793.94 779.23 656.06 893.77
Jul 884.48 690.33 643.42 904.21
Aug 957.18 587.71 649.98 860.82
Sep 971.96 523.78 659.34 709.68
Oct 898.63 530.97 710.92 635.11

Page 6
Nov 797.53 545.57 727.48 626.03
Dec 757.39 545.27 727.08 621.88 Source: CEPEA
Graph 1: Wheat Prices
Commodities:
Corn 2015/2016 2016/2017 2017/2018 Market Begin Year Mar 2016 7 8
Brazil USDA Official New Post USDA Official New Post USDA Official New Post
Area Harvested 16000 16000 17000 17000 0 16000
Beginning Stocks 7842 7842 6542 6542 0 11142
Production 67000 67000 91500 93000 0 85000
MY Imports 3400 3400 300 600 0 500
TY Imports 1566 1566 2200 2300 0 500
TY Imp. from U.S. 1 1 0 0 0 0
Total Supply 78242 78242 98342 100142 0 96642
MY Exports 14200 14200 31000 30000 0 28000
TY Exports 35382 35382 22500 22000 0 22000
Feed and Residual 49000 49000 50500 50000 0 50500
FSI Consumption 8500 8500 9000 9000 0 9000
Total Consumption 57500 57500 59500 59000 0 59500
Ending Stocks 6542 6542 7842 11142 0 9142
Total Distribution 78242 78242 98342 100142 0 96642
(1000 HA) ,(1000 MT)
2016/2017 Corn Supplies: 2016/2017 planted area is expected to increase to 17 mHa due to increased
second “safrinha” corn plantings. High domestic prices in the last half of 2016 incentivized producers
to plant more. 2016/2017 production is estimated at a record 93 mmt, based on good first crop yields
and the second crop being planted during the ideal planting window. The second crop accounts for
about two thirds of the total corn crop and is planted directly after soybeans are harvested. If the rains in
April are well distributed, the second “safrinha” corn crop will see good yields.
CORN

Page 7
2016/2017 ending stocks are estimated at 11.1 mmt, a 70 percent jump due to the anticipated record
crop. Because of a glut of corn on the global market, prices will likely fall below the minimum
government-set price when the second crop is harvest in June/July. This could possibly force the
government to intervene with a stocks acquisition program which would further increase stocks, but
reduce the price fluctuations seen in 2016.
2017/2018 area is expected to decrease to 16 mHA as lower prices from this year’s record crop
incentivize farmers to switch to a more profitable crop. Production is forecast at 85 mmt, reflecting the
anticipated lower prices.
2016/2017 Corn Consumption: 2016/2017 corn consumption is estimated at 59 mmt, a one percent
increase from the previous year based on the growing poultry and pork sectors. Meat exports are
currently being impacted by the “Weak Meat” scandal, which closed down 21 meat processing plants
due to allegations of bribery that allowed tainted meat onto the market. However, this shouldn’t have an
impact on feed over the coming year.
While most of Brazil’s cattle are grass fed, the number of cows using corn as feed is growing slowly.
According to the Brazilian Feed Association, 4.01 mmt of corn was used in feed lots for dairy or beef
cattle in 2016, a two percent increase from 2015. This trend may continue as the price of agricultural
lands stay high and domestic corn prices stay low.
Corn ethanol is one percent of total ethanol production. In April 2016, the Brazilian company Fiagril
and the U.S. based Summit Agricultural Group broke ground on Brazil’s first corn-only ethanol plant.
The new plant in the largest corn producing state of Mato Grosso is expected to come online in mid-
2017. Currently, any corn ethanol is processed in “flex” plants that can process both sugarcane and
corn. Corn ethanol can be profitable for large vertically-integrated farms in Mato Grosso, where corn
prices are low.
Despite some growth in the feed and ethanol sectors, Brazil will still have ample supplies that will not
be absorbed by domestic consumption. Stocks are expect in increase sharply, but limited on-farm
storage may force producers to choose between storing either corn or soybeans, as both are record crops
and the current pace of commercialization for soybeans is slow. Some farmers may opt to use silo bags
as they wait for higher prices.
2016/2017 Corn Trade:
2016/2017 exports are expected to more than double from the previous low year to 30 mmt, based on
abundant supplies. The exchange rate is important for Brazilian exports, as the stronger the dollar, the
more local currency producers receive. In 2016, the Brazilian Real strengthened against the dollar,
making exports less profitable. But with a record crop, producers will need to decide whether to sell at
low prices, or invest in storage with the hope that the dollar will strengthen.
Iran, Vietnam, and Japan currently account for half of Brazil’s export markets, but Brazil is actively
seeking to gain market share in Mexico, which is traditionally supplied by the United States. 2017/2018
exports are forecast to decrease slightly to 28 mmt on a smaller crop.

Page 8
2016/2017 Imports are estimated at 600,000 mt as the import market returns to normal after the previous
year’s 3.4 mmt imports due to the drought affecting the second “safrinha” crop and many farmer
forward contracting their corn early in the season. 2017/2018 imports are forecast at 500,000 mt.
Table 2.1: Brazil Corn Imports
Brazil Import Statistics
Commodity: 1005, Corn (Maize)
Annual Series: 2014 - 2016
Partner Country Unit
Quantity
2014 2015 2016
World T 773,036 369,990 2,902,560
Paraguay T 768,142 367,316 1,465,053
Argentina T 3,639 2,038 1,436,245
Bolivia T 88 127 711
United States T 761 499 532
Mexico T - - 18 Source of Data: SECEX – Foreign Trade Secretariat

Page 9
Table 2.2: Brazil Corn Exports
Brazil Export Statistics
Commodity: 1005, Corn (Maize)
Annual Series: 2014 - 2016
Partner Country Unit
Quantity
2014 2015 2016
World T 20,654,640 28,923,951 21,873,310
Iran T 4,698,583 4,207,984 4,790,853
Vietnam T 3,185,384 4,841,356 2,877,048
Japan T 1,311,811 2,776,861 2,694,266
Malaysia T 1,260,231 1,682,300 1,609,354
Egypt T 1,246,233 2,008,864 1,500,669
Korea South T 1,900,076 3,004,043 1,482,763
Taiwan T 1,484,866 2,212,402 1,381,126
Indonesia T 1,261,383 1,154,841 777,504
Bangladesh T - 190,187 723,519
Saudi Arabia T 726,267 744,795 667,113
Netherlands T 293,194 390,106 586,943
Algeria T 647,120 962,656 507,014
Dominican Republic T 328,454 543,284 408,146
Spain T 218,159 880,518 365,585
South Africa T - 321,683 317,678
China T 24,397 146,917 172,481
United Arab Emirates T 86,016 298,808 166,809
Morocco T 683,839 672,347 164,257
United States T 3,404 156,202 117,111
Cuba T 177,157 57,853 111,500
Portugal T 35,025 50 86,538
Oman T 37,496 11,476 66,973
Jordan T 109,124 129,638 50,030
Philippines T 113 67,108 41,050
Kuwait T 30,215 85,838 37,758
Italy T 28,249 - 36,309
Puerto Rico (U.S.) T 8,000 56,131 25,658
Senegal T 30,958 75 25,000
Costa Rica T 7,548 171,476 21,512
Guatemala T - 95,074 12,562

Page 10
Paraguay T 5,149 6,632 8,767
Venezuela T 139,743 89,340 6,264
Peru T 5,552 33,410 5,008
Thailand T 50 - 5,000
Nicaragua T 11,328 58,846 4,500
India T 326 5,258 3,372
Turkey T 9,369 5,942 2,208
Bolivia T 3,382 2,032 2,198
Colombia T 878 1,642 2,075
Ecuador T 69,260 34,543 1,524
Guyana T 1,264 1,572 1,415
Argentina T 1,279 934 1,207
Russia T - 702 780
Pakistan T - 2,494 697
Myanmar T - 3,506 562
Chile T 13 785 417
Uruguay T 212 96 290
Honduras T 255 38,946 287
Lebanon T 624 671 284
Nigeria T 58,888 125 227
Trinidad & Tobago T - 145 225
Togo T 400 593 205
Tunisia T 199,526 124,935 130
Angola T 16,706 37,120 108
Benin T 453 594 102
Belgium T 4 322 90
Bulgaria T 125 484 78
Djibouti T - - 50
Belize T - - 31
Cote d Ivoire T - - 26
Panama T 18 92,963 25
Greece T 52 26 25
Equatorial Guinea T 3 2 3
United Kingdom T 2 2 3
Suriname T - - 1 Source of Data: SECEX – Foreign Trade Secretariat

Page 11
Corn Prices:
Table 2.3: Brazilian Corn Prices
Monthly Average Corn Prices in Mato Grosso Prices in R$ per 60 kg bag
(discounted by the CDI/CETIP taxes)
CY 2013 2014 2015 2016
Jan 32.75 26.83 27.41 41.65
Feb 32.34 30.62 27.99 42.78
Mar 30.71 32.84 29.44 43.01
Apr 26.41 31.18 27.61 47.79
May 26.02 28.75 25.34 48.92
Jun 26.45 26.38 25.03 51.48
Jul 25.00 23.70 25.99 44.42
Aug 24.04 22.92 27.40 45.06
Sep 25.07 22.05 31.04 41.91
Oct 24.12 23.44 32.83 42.12
Nov 25.59 27.59 33.57 38.77
Dec 26.45 27.61 35.33 38.30
Source: CEPEA
Graph 2: Corn Prices
Page 12
Commodities:
RICE
Rice, Milled 2015/2016 2016/2017 2017/2018 Market Begin Year Apr 2016 Apr 2017 Apr 2017
Brazil USDA Official New Post USDA Official New Post USDA Official New Post
Area Harvested 2010 2000 1945 2000 0 2100
Beginning Stocks 641 641 241 251 0 151
Milled Production 7210 7210 8068 7900 0 8000
Rough Production 10603 10603 11865 11618 0 11765
Milling Rate (.9999) 6800 6800 6800 6800 0 6800
MY Imports 840 900 600 700 0 700
TY Imports 771 771 600 700 0 700
TY Imp. from U.S. 0 0 0 0 0 0
Total Supply 8691 8751 8909 8851 0 8851
MY Exports 600 700 700 800 0 700
TY Exports 641 641 700 800 0 700
Consumption and Residual 7850 7800 7900 7900 0 7900
Ending Stocks 241 251 309 151 0 251
Total Distribution 8691 8751 8909 8851 0 8851
(1000 HA) ,(1000 MT)
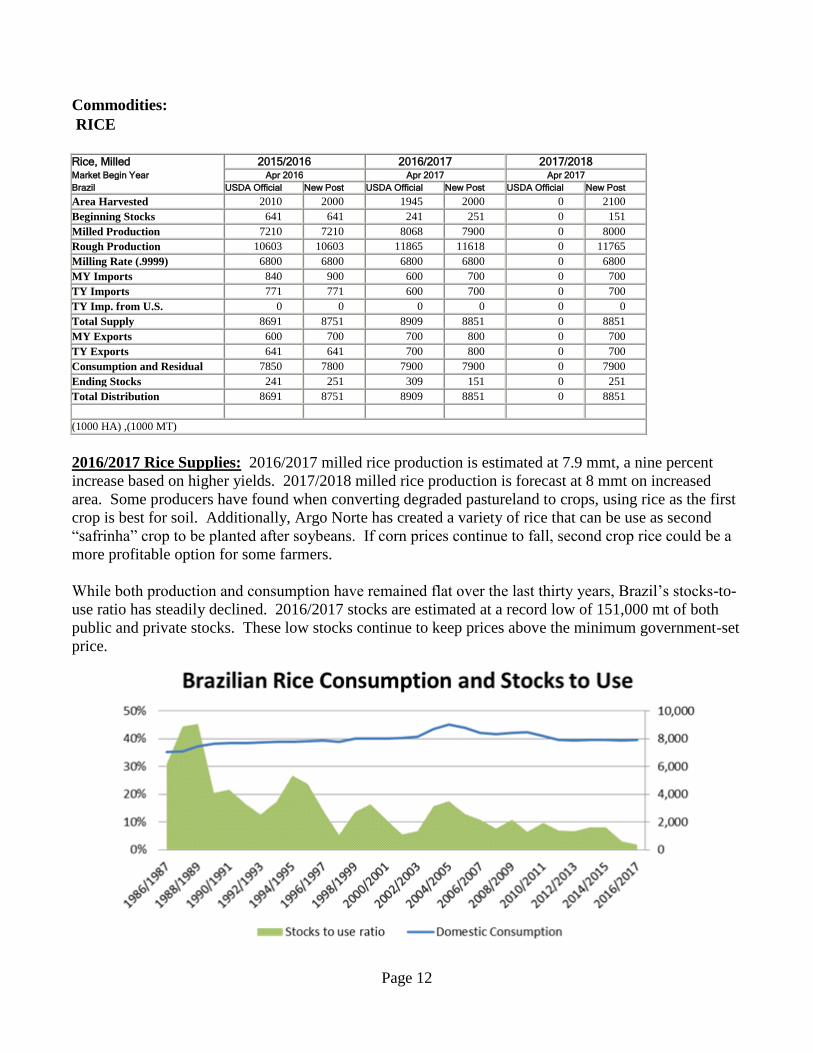
2016/2017 Rice Supplies: 2016/2017 milled rice production is estimated at 7.9 mmt, a nine percent
increase based on higher yields. 2017/2018 milled rice production is forecast at 8 mmt on increased
area. Some producers have found when converting degraded pastureland to crops, using rice as the first
crop is best for soil. Additionally, Argo Norte has created a variety of rice that can be use as second
“safrinha” crop to be planted after soybeans. If corn prices continue to fall, second crop rice could be a
more profitable option for some farmers.
While both production and consumption have remained flat over the last thirty years, Brazil’s stocks-to-
use ratio has steadily declined. 2016/2017 stocks are estimated at a record low of 151,000 mt of both
public and private stocks. These low stocks continue to keep prices above the minimum government-set
price.

Page 13
2016/2017 Rice Trade: 2016/2017 imports are estimated at 700,000 metric tons, a 22 percent decrease
based on a larger domestic supply. Most rice imports are supplied by Brazil’s Mercosul partners,
Paraguay, Uruguay, and Argentina. 2017/2018 imports are expected to remain the same at 700,000 mt.
2016/2017 exports are estimated slightly higher at 800,000 mt, based on growing yearly trends.
Senegal, Nicaragua, and Venezuela were Brazil’s three largest markets in 2016. In Nicaragua, Brazil
has consistently taken market share from the United States over the last five years. 2017/2018 rice
exports are forecast 12 percent lower at 700,000 mt on higher stocks, although Brazil is actively seeking
a market in Mexico, as Mexico looks to reduce its dependence on U.S. grain.
2016/2017 Rice Consumption: 2016/2017 rice consumption is up slightly from the previous year due
to population growth. 2017/2018 consumption is expected to stay the same, offset by population
growth, as some consumers may eat less rice in favor of other starches.
Table 3.1: Brazil Rice Imports
Annual Series: 2014 – 2016
Partner Country Unit
Quantity
2014 2015 2016
World T 624,397 376,987 764,513
Paraguay T 326,527 269,106 397,884
Uruguay T 126,900 31,724 224,040
Argentina T 96,145 48,747 119,846
Guyana T 6,560 19,410 15,464
Italy T 2,214 3,046 3,655
Vietnam T 168 744 1,502
Chile T 4,460 2,866 1,398
Thailand T 60,876 490 430
Pakistan T 312 30 90
United States T 139 718 84
India T 28 42 78
Spain T 15 6 21
Portugal T 6 9 8
Taiwan T - - 7
France T 46 44 5
Source of Data: SECEX – Foreign Trade Secretariat

Page 14
Table 3.2: Brazil Rice Exports
Brazil Export Statistics
Commodity: 1006, Rice
Annual Series: 2014 - 2016
Partner Country Unit
Quantity
2014 2015 2016
World T 929,918 961,542 697,941
Senegal T 112,242 106,467 140,651
Nicaragua T 65,739 78,180 103,538
Venezuela T 141,524 119,975 76,108
Peru T 32,463 66,063 57,652
Gambia T 78,232 42,510 56,417
United States T 14,604 18,606 42,137
Switzerland T 31,526 41,109 39,755
Cuba T 105,024 170,291 30,450
Costa Rica T 24,328 25,092 29,051
Bolivia T 50,684 33,494 20,996
Sierra Leone T 84,589 74,528 19,669
Angola T 21,117 9,101 13,246
Netherlands T 22,323 13,065 8,400
Panama T 7,805 3,613 8,286
Belgium T 1,159 3,454 7,453
Cape Verde T 6,446 11,068 7,231
Trinidad & Tobago T 9,012 8,950 6,904
Saudi Arabia T 8,730 9,903 6,264
Chile T 4,908 7,925 4,812
South Africa T 225 11,100 2,427
Netherlands Antilles T 1,796 1,239 1,623
Barbados T 1,522 1,025 1,126
Paraguay T 653 568 1,013
Puerto Rico (U.S.) T 1,181 8,236 1,000
Honduras T - 2,600 1,000
Benin T 31,412 9,530 1,000
Canada T 326 1,641 880
St. Vincent & the Grenadines T - 1,351 751
Namibia T 925 950 750
Argentina T 755 987 577
Guatemala T 100 150 525
Italy T 22 411 478
Uruguay T 282 448 466
Equatorial Guinea T 710 494 435
Algeria T 650 225 425
Antigua & Barbuda T 203 431 417
Page 15
Bahamas T 775 701 391
Spain T - 214 375
Libya T 1,428 1,446 356
Nigeria T 50 11,072 310
Lebanon T 200 766 272
Singapore T - - 250
United Kingdom T 1,035 1,215 233
United Arab Emirates T - 412 225
Portugal T 75 167 176
Iraq T 30,000 42,000 150
Cote d Ivoire T - - 150
Lithuania T 96 167 143
Aruba T 25 228 127
Jordan T - 701 125
Mexico T 50 50 125
Curacao T - - 120
Germany T - - 106
Grenada T - - 74
Dominica T - - 51
Turkey T 31,500 - 50
Mauritania T - - 50
Canary Islands T - - 50
New Zealand T 50 50 46
St. Kitts & Nevis T - - 25
Vietnam T - - 24
Israel T 172 375 23
Cameroon T - - 2
Mozambique T 139 25 1 Source of Data: SECEX – Foreign Trade Secretariat
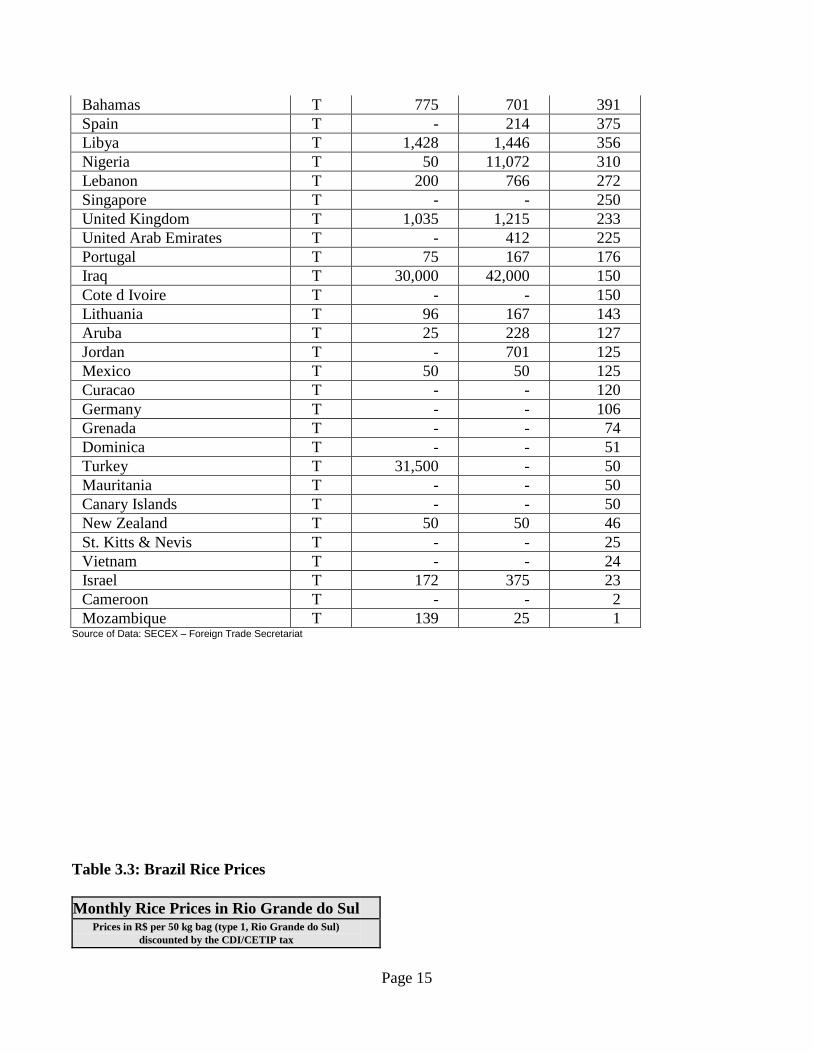
Table 3.3: Brazil Rice Prices
Monthly Rice Prices in Rio Grande do Sul Prices in R$ per 50 kg bag (type 1, Rio Grande do Sul)
discounted by the CDI/CETIP tax

Page 16
CY 2013 2014 2015 2016
Jan 34.50 36.61 38.16 41.52
Feb 33.79 35.65 37.41 41.94
Mar 31.71 33.83 35.80 40.31
Apr 31.30 35.02 35.78 39.80
May 33.39 36.37 34.91 41.77
Jun 33.84 36.61 33.58 46.49
Jul 34.46 35.96 33.69 50.48
Aug 34.64 36.22 34.67 50.51
Sep 34.21 36.80 37.72 50.06
Oct 33.73 36.74 40.49 49.15
Nov 34.11 37.30 41.18 49.47
Dec 36.01 37.99 41.01 49.04
Source: CEPEA
Graph 3: Rice Prices

Page 17
Government Support for Commercialization and Export:
In 2016, government support was only used for wheat. Total government support of 453,000 mt, valued
at R$78 million (USD $26 million) was much higher than the previous year as a result of low prices due
to large supplies. Two programs were used to support wheat in 2016:
Premium for Product Outflow Program (PEP): Through this program, the government pays
the difference between the prevailing market price and the minimum price of the product to the
buyers. The federal government, through the Ministry of Agriculture (MAPA)’s National
Company of Food and Supply (CONAB) conducts public auctions to set a premium for buyers of
a given product. These buyers then contact producers interested in selling their production at the
current minimum support price. Buyers must transport the product to the allowable destination
established by the program.
The Equalization Premium Paid to the Producer (PEPRO): PEPRO functions similar to PEP
but the premium is granted to the farmer or cooperative which sells the product. The
government pays the difference between the market price and the minimum price directly to the
producer once the sale has been completed and the proof of sale to an allowable destination is
received.
Of the two programs, PEPRO was used more in 2016, supporting 405,000 mt valued at R$69 million
(USD 23 million). PEP supported 48,000mt valued at R$9 million (USD 3 million).
The government has the opportunity to update the minimum price once a year, and the price varies by
commodity and classification, and by region of the country. This typically takes place in May/June.
Table 1: 2016 Rice Minimum Prices
Product/Class Covered States and
Regions
2016 Minimum Prices (with US$1=R$4.028)
Eligibility
Period 60kg Sack
Metric
Ton Cwt
BRL USD USD USD
Long Rice
(Paddy) All of Brazil R$24.45 $6.07 $101.17 $4.58 Feb-Jan
Long Rice
(Paddy)
Rio Grande do Sul and
Santa Catarina
R$18.90
(50KG) $4.69 $93.80 $4.25 Feb-Jan

Page 18
Table 2: 2016 Wheat Minimum Prices
Product/Class Covered States and Regions
2016 Minimum Prices (with
US$1=R$4.028) Eligibility
Period Metric ton Bushel
BRL USD USD
Wheat All of Brazil R$641.50 $159.26 $4.33 Jan-May
Wheat Parana, Rio Grande do Sul, and
Santa Catarina R$583.00 $144.74 $3.94 Jan-Jun
Table 3: 2016 Corn Minimum Prices
Product/Class Covered States and
Regions
2016 Minimum Prices (with US$1=R$4.028)
Eligibility
Period 60kg Sack
Metric
Ton Bushel
BRL USD USD USD
Corn Mato Grosso R$13.56 $3.37 $56.11 $1.43 Jan 1-Dec 31
Table 4.1: Government Support for Corn (Quantity Unit: 1,000 mt)
Program 2011 2012 2013 2014 2015 2016
Acquisition (AGF) 1 0 364 16 0 0
PEP 0 0 0 0 0 0
PROP 0 0 0 0 0 0
PEPRO 0 0 8,862 5,803 0 0
Total 1 0 9,226 5,819 0 0
Production 57,514 73,000 81,500 80,000 85,000 67,000
Participation % 0 0 11% 7% 0 0 Source: Brazilian Ministry of Agriculture/SPA/DEAGRO and CONAB
Table 4.2: Government Support for Rice (Quantity Unit: 1,000 mt)
Program 2011 2012 2013 2014 2015 2016 Acquisition (AGF) 396 0.03 0 0 0 0
PEP 0 0 0 0 0 0
PROP 0 0 0 0 0 0
PEPRO 0 0 0 0 0 0
Total 0 0.03 0 0 0 0
Production (rough) 11,600 11,819 12,206 12,449 10,588 11,618
Participation % 0% 0% 0% 0% 0% 0% Source: Brazilian Ministry of Agriculture/SPA/DEAGRO and CONAB

Page 19
Table 4.3: Government Support for Wheat (Quantity Unit: 1,000 mt)
Program 2011 2012 2013 2014 2015 2016 Acquisition (AGF) 1 446 0 15 0 0
PEP 849 1,594 0 0 0 48
PEPRO 53 87 0 795 0 405
Total 903 2,126.45 0 810 0 453
Production 5,882 5,800 4,380 5,300 5,540 6,700
Participation % 15% 36.7% 0 15% 0 6%
Source: Brazilian Ministry of Agriculture/SPA/DEAGRO and CONAB
References:
2017 January Brazil Grain and Feed Update – BR1701
2016 Brazil Grain and Feed Annual – BR1602