brazil banking perf
73
Q3 2015 www.bmiresearch.com BRAZIL COMMERCIAL BANKING REPORT INCLUDES 5-YEAR FORECASTS TO 2019 ISSN 1747-8510 Published by:BMI Research
-
Upload
jitheshgopal -
Category
Documents
-
view
32 -
download
0
description
perf
Transcript of brazil banking perf
Q3 2015www.bmiresearch.com
BRAZILCOMMERCIAL BANKING REPORTINCLUDES 5-YEAR FORECASTS TO 2019
ISSN 1747-8510Published by:BMI Research
Brazil Commercial Banking Report Q3 2015INCLUDES 5-YEAR FORECASTS TO 2019
Part of BMI’s Industry Report & Forecasts Series
Published by: BMI Research
Copy deadline: April 2015
BMI ResearchSenator House85 Queen Victoria StreetLondonEC4V 4ABUnited KingdomTel: +44 (0) 20 7248 0468Fax: +44 (0) 20 7248 0467Email: [email protected]: http://www.bmiresearch.com
© 2015 Business Monitor International LtdAll rights reserved.
All information contained in this publication iscopyrighted in the name of Business MonitorInternational Ltd, and as such no part of thispublication may be reproduced, repackaged,redistributed, resold in whole or in any part, or usedin any form or by any means graphic, electronic ormechanical, including photocopying, recording,taping, or by information storage or retrieval, or byany other means, without the express written consentof the publisher.
DISCLAIMERAll information contained in this publication has been researched and compiled from sources believed to be accurate and reliable at the time ofpublishing. However, in view of the natural scope for human and/or mechanical error, either at source or during production, Business MonitorInternational Ltd accepts no liability whatsoever for any loss or damage resulting from errors, inaccuracies or omissions affecting any part of thepublication. All information is provided without warranty, and Business Monitor International Ltd makes no representation of warranty of any kindas to the accuracy or completeness of any information hereto contained.
CONTENTS
BMI Industry View ............................................................................................................... 7Table: Commercial Banking Sector Indicators . . . . . . . . . . . . . . . . . . . . . . . . . . . . . . . . . . . . . . . . . . . . . . . . . . . . . . . . . . . . . . . . . . . . . . . . . . . . . . . . . . . . . . . . . . . . . . . . . . . . . . . . . 7
Table: Commercial Banking Sector Key Ratios, February 2015 . . . . . . . . . . . . . . . . . . . . . . . . . . . . . . . . . . . . . . . . . . . . . . . . . . . . . . . . . . . . . . . . . . . . . . . . . . . . . . . . . . . . . . . . 7
Table: Annual Growth Rate Projections 2014-2019 (%) . . . . . . . . . . . . . . . . . . . . . . . . . . . . . . . . . . . . . . . . . . . . . . . . . . . . . . . . . . . . . . . . . . . . . . . . . . . . . . . . . . . . . . . . . . . . . . . 7
Table: Ranking Out Of 73 Countries Reviewed In 2015 . . . . . . . . . . . . . . . . . . . . . . . . . . . . . . . . . . . . . . . . . . . . . . . . . . . . . . . . . . . . . . . . . . . . . . . . . . . . . . . . . . . . . . . . . . . . . . . . . 8
Table: Commercial Banking Sector Indicators, 2012-2019 . . . . . . . . . . . . . . . . . . . . . . . . . . . . . . . . . . . . . . . . . . . . . . . . . . . . . . . . . . . . . . . . . . . . . . . . . . . . . . . . . . . . . . . . . . . . 8
SWOT .................................................................................................................................... 9Commercial Banking .................................................................................................................................. 9
Political ................................................................................................................................................. 10
Economic ............................................................................................................................................... 11
Operational Risk ..................................................................................................................................... 12
Industry Forecast .............................................................................................................. 14Table: BRAZIL - BANKING SECTOR OVERVIEW . . . . . . . . . . . . . . . . . . . . . . . . . . . . . . . . . . . . . . . . . . . . . . . . . . . . . . . . . . . . . . . . . . . . . . . . . . . . . . . . . . . . . . . . . . . . . . . . . . . . 20
Industry Risk Reward Ratings .......................................................................................... 21Latin America Commercial Banking Risk/Reward Index .................................................................................. 21
Table: Latin America Commercial Banking Risk/Reward Index . . . . . . . . . . . . . . . . . . . . . . . . . . . . . . . . . . . . . . . . . . . . . . . . . . . . . . . . . . . . . . . . . . . . . . . . . . . . . . . . . . . . . . . 22
Market Overview ............................................................................................................... 23Latin America Commercial Banking Outlook ................................................................................................ 23
Table: Banks' Bond Portfolios, 2013 . . . . . . . . . . . . . . . . . . . . . . . . . . . . . . . . . . . . . . . . . . . . . . . . . . . . . . . . . . . . . . . . . . . . . . . . . . . . . . . . . . . . . . . . . . . . . . . . . . . . . . . . . . . . . . . . . . . 23
Table: Comparison of Loan/Deposit & Loan/Asset & Loan/GDP ratios, 2015 . . . . . . . . . . . . . . . . . . . . . . . . . . . . . . . . . . . . . . . . . . . . . . . . . . . . . . . . . . . . . . . . . . . . . . . . 23
Table: Comparison of Total Assets & Client Loans & Client Deposits (USDbn) . . . . . . . . . . . . . . . . . . . . . . . . . . . . . . . . . . . . . . . . . . . . . . . . . . . . . . . . . . . . . . . . . . . . . . 24
Table: Comparison of USD Per Capita Deposits, 2015 . . . . . . . . . . . . . . . . . . . . . . . . . . . . . . . . . . . . . . . . . . . . . . . . . . . . . . . . . . . . . . . . . . . . . . . . . . . . . . . . . . . . . . . . . . . . . . . . 24
Economic Analysis ................................................................................................................................... 25Table: GDP By Expenditure (Brazil 2012-2019) . . . . . . . . . . . . . . . . . . . . . . . . . . . . . . . . . . . . . . . . . . . . . . . . . . . . . . . . . . . . . . . . . . . . . . . . . . . . . . . . . . . . . . . . . . . . . . . . . . . . . . . 30
Competitive Landscape .................................................................................................... 31Market Structure ..................................................................................................................................... 31
Protagonists .......................................................................................................................................... 31Table: Protagonists In Brazil's Commercial Banking Sector . . . . . . . . . . . . . . . . . . . . . . . . . . . . . . . . . . . . . . . . . . . . . . . . . . . . . . . . . . . . . . . . . . . . . . . . . . . . . . . . . . . . . . . . . . 31
Definition Of The Commercial Banking Universe ......................................................................................... 31
List of Banks ......................................................................................................................................... 32Table: 50 Largest Banks In Brazil (by total assets) . . . . . . . . . . . . . . . . . . . . . . . . . . . . . . . . . . . . . . . . . . . . . . . . . . . . . . . . . . . . . . . . . . . . . . . . . . . . . . . . . . . . . . . . . . . . . . . . . . . . 32
Company Profile ................................................................................................................ 34Banco do Brasil ....................................................................................................................................... 34
Table: Stock Market Indicators . . . . . . . . . . . . . . . . . . . . . . . . . . . . . . . . . . . . . . . . . . . . . . . . . . . . . . . . . . . . . . . . . . . . . . . . . . . . . . . . . . . . . . . . . . . . . . . . . . . . . . . . . . . . . . . . . . . . . . . . . 36
Table: Balance Sheet (BRLmn) . . . . . . . . . . . . . . . . . . . . . . . . . . . . . . . . . . . . . . . . . . . . . . . . . . . . . . . . . . . . . . . . . . . . . . . . . . . . . . . . . . . . . . . . . . . . . . . . . . . . . . . . . . . . . . . . . . . . . . . . . 36
Table: Balance Sheet (USDmn) . . . . . . . . . . . . . . . . . . . . . . . . . . . . . . . . . . . . . . . . . . . . . . . . . . . . . . . . . . . . . . . . . . . . . . . . . . . . . . . . . . . . . . . . . . . . . . . . . . . . . . . . . . . . . . . . . . . . . . . . . 36
Table: Key Ratios (%) . . . . . . . . . . . . . . . . . . . . . . . . . . . . . . . . . . . . . . . . . . . . . . . . . . . . . . . . . . . . . . . . . . . . . . . . . . . . . . . . . . . . . . . . . . . . . . . . . . . . . . . . . . . . . . . . . . . . . . . . . . . . . . . . . . 37
Banco Safra ............................................................................................................................................ 38
Brazil Commercial Banking Report Q3 2015
© Business Monitor International Ltd Page 4
Table: Balance Sheet (BRLmn) . . . . . . . . . . . . . . . . . . . . . . . . . . . . . . . . . . . . . . . . . . . . . . . . . . . . . . . . . . . . . . . . . . . . . . . . . . . . . . . . . . . . . . . . . . . . . . . . . . . . . . . . . . . . . . . . . . . . . . . . . 39
Table: Balance Sheet (USDmn) . . . . . . . . . . . . . . . . . . . . . . . . . . . . . . . . . . . . . . . . . . . . . . . . . . . . . . . . . . . . . . . . . . . . . . . . . . . . . . . . . . . . . . . . . . . . . . . . . . . . . . . . . . . . . . . . . . . . . . . . . 39
Table: Key Ratios (%) . . . . . . . . . . . . . . . . . . . . . . . . . . . . . . . . . . . . . . . . . . . . . . . . . . . . . . . . . . . . . . . . . . . . . . . . . . . . . . . . . . . . . . . . . . . . . . . . . . . . . . . . . . . . . . . . . . . . . . . . . . . . . . . . . . 40
Bradesco ................................................................................................................................................ 41Table: Stock Market Indicators . . . . . . . . . . . . . . . . . . . . . . . . . . . . . . . . . . . . . . . . . . . . . . . . . . . . . . . . . . . . . . . . . . . . . . . . . . . . . . . . . . . . . . . . . . . . . . . . . . . . . . . . . . . . . . . . . . . . . . . . . 42
Table: Balance Sheet (BRLmn) . . . . . . . . . . . . . . . . . . . . . . . . . . . . . . . . . . . . . . . . . . . . . . . . . . . . . . . . . . . . . . . . . . . . . . . . . . . . . . . . . . . . . . . . . . . . . . . . . . . . . . . . . . . . . . . . . . . . . . . . . 43
Table: Balance Sheet (USDmn) . . . . . . . . . . . . . . . . . . . . . . . . . . . . . . . . . . . . . . . . . . . . . . . . . . . . . . . . . . . . . . . . . . . . . . . . . . . . . . . . . . . . . . . . . . . . . . . . . . . . . . . . . . . . . . . . . . . . . . . . . 43
Table: Key Ratios (%) . . . . . . . . . . . . . . . . . . . . . . . . . . . . . . . . . . . . . . . . . . . . . . . . . . . . . . . . . . . . . . . . . . . . . . . . . . . . . . . . . . . . . . . . . . . . . . . . . . . . . . . . . . . . . . . . . . . . . . . . . . . . . . . . . . 43
Caixa Economica Federal ......................................................................................................................... 44Table: Balance Sheet (BRLmn) . . . . . . . . . . . . . . . . . . . . . . . . . . . . . . . . . . . . . . . . . . . . . . . . . . . . . . . . . . . . . . . . . . . . . . . . . . . . . . . . . . . . . . . . . . . . . . . . . . . . . . . . . . . . . . . . . . . . . . . . . 45
Table: Balance Sheet (USDmn) . . . . . . . . . . . . . . . . . . . . . . . . . . . . . . . . . . . . . . . . . . . . . . . . . . . . . . . . . . . . . . . . . . . . . . . . . . . . . . . . . . . . . . . . . . . . . . . . . . . . . . . . . . . . . . . . . . . . . . . . . 46
Table: Key Ratios (%) . . . . . . . . . . . . . . . . . . . . . . . . . . . . . . . . . . . . . . . . . . . . . . . . . . . . . . . . . . . . . . . . . . . . . . . . . . . . . . . . . . . . . . . . . . . . . . . . . . . . . . . . . . . . . . . . . . . . . . . . . . . . . . . . . . 46
Santander .............................................................................................................................................. 47Table: Stock Market Indicators . . . . . . . . . . . . . . . . . . . . . . . . . . . . . . . . . . . . . . . . . . . . . . . . . . . . . . . . . . . . . . . . . . . . . . . . . . . . . . . . . . . . . . . . . . . . . . . . . . . . . . . . . . . . . . . . . . . . . . . . . 49
Table: Balance Sheet (BRLmn) . . . . . . . . . . . . . . . . . . . . . . . . . . . . . . . . . . . . . . . . . . . . . . . . . . . . . . . . . . . . . . . . . . . . . . . . . . . . . . . . . . . . . . . . . . . . . . . . . . . . . . . . . . . . . . . . . . . . . . . . . 49
Table: Balance Sheet (USDmn) . . . . . . . . . . . . . . . . . . . . . . . . . . . . . . . . . . . . . . . . . . . . . . . . . . . . . . . . . . . . . . . . . . . . . . . . . . . . . . . . . . . . . . . . . . . . . . . . . . . . . . . . . . . . . . . . . . . . . . . . . 49
Table: Key Ratios (%) . . . . . . . . . . . . . . . . . . . . . . . . . . . . . . . . . . . . . . . . . . . . . . . . . . . . . . . . . . . . . . . . . . . . . . . . . . . . . . . . . . . . . . . . . . . . . . . . . . . . . . . . . . . . . . . . . . . . . . . . . . . . . . . . . . 50
Regional Overview ............................................................................................................ 51Latin America Overview ........................................................................................................................... 51
Table: Latin America Banking Sector Assets . . . . . . . . . . . . . . . . . . . . . . . . . . . . . . . . . . . . . . . . . . . . . . . . . . . . . . . . . . . . . . . . . . . . . . . . . . . . . . . . . . . . . . . . . . . . . . . . . . . . . . . . . . . 58
Global Industry Overview .................................................................................................. 60Global Commercial Banking Outlook .......................................................................................................... 60
US and Eurozone Banking Outlook ............................................................................................................ 60
Emerging Market Regional Outlooks ......................................................................................................... 61
Demographic Forecast ..................................................................................................... 65Table: Population Headline Indicators (Brazil 1990-2025) . . . . . . . . . . . . . . . . . . . . . . . . . . . . . . . . . . . . . . . . . . . . . . . . . . . . . . . . . . . . . . . . . . . . . . . . . . . . . . . . . . . . . . . . . . . . 66
Table: Key Population Ratios (Brazil 1990-2025) . . . . . . . . . . . . . . . . . . . . . . . . . . . . . . . . . . . . . . . . . . . . . . . . . . . . . . . . . . . . . . . . . . . . . . . . . . . . . . . . . . . . . . . . . . . . . . . . . . . . . 66
Table: Urban/Rural Population & Life Expectancy (Brazil 1990-2025) . . . . . . . . . . . . . . . . . . . . . . . . . . . . . . . . . . . . . . . . . . . . . . . . . . . . . . . . . . . . . . . . . . . . . . . . . . . . . . . 67
Table: Population By Age Group (Brazil 1990-2025) . . . . . . . . . . . . . . . . . . . . . . . . . . . . . . . . . . . . . . . . . . . . . . . . . . . . . . . . . . . . . . . . . . . . . . . . . . . . . . . . . . . . . . . . . . . . . . . . . . 67
Table: Population By Age Group % (Brazil 1990-2025) . . . . . . . . . . . . . . . . . . . . . . . . . . . . . . . . . . . . . . . . . . . . . . . . . . . . . . . . . . . . . . . . . . . . . . . . . . . . . . . . . . . . . . . . . . . . . . . 68
Methodology ...................................................................................................................... 70Industry Forecast Methodology ................................................................................................................ 70
Sector-Specific Methodology .................................................................................................................... 71
Risk/Reward Ratings Methodology ............................................................................................................ 72Table: Commercial Banking Risk/Reward Rating Indicators . . . . . . . . . . . . . . . . . . . . . . . . . . . . . . . . . . . . . . . . . . . . . . . . . . . . . . . . . . . . . . . . . . . . . . . . . . . . . . . . . . . . . . . . . . 73
Table: Weighting Of Indicators . . . . . . . . . . . . . . . . . . . . . . . . . . . . . . . . . . . . . . . . . . . . . . . . . . . . . . . . . . . . . . . . . . . . . . . . . . . . . . . . . . . . . . . . . . . . . . . . . . . . . . . . . . . . . . . . . . . . . . . . 74
Brazil Commercial Banking Report Q3 2015
© Business Monitor International Ltd Page 5
BMI Industry View
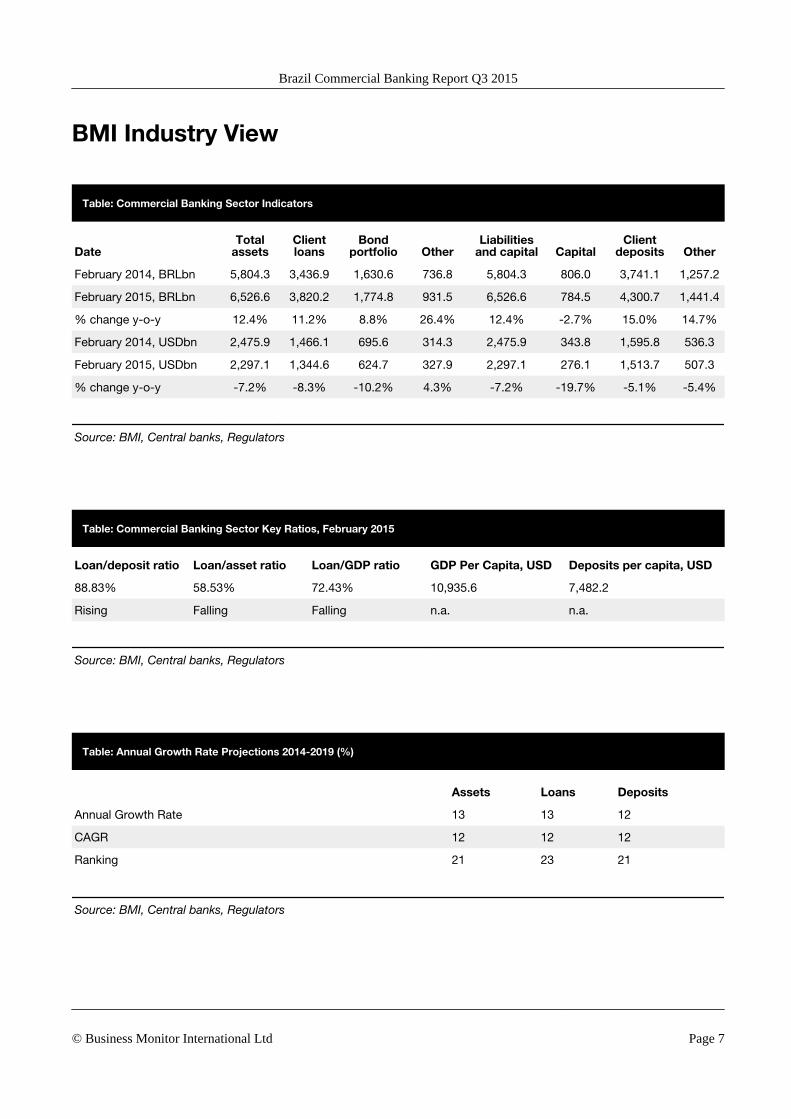
Table: Commercial Banking Sector Indicators
DateTotal
assetsClientloans
Bondportfolio Other
Liabilitiesand capital Capital
Clientdeposits Other
February 2014, BRLbn 5,804.3 3,436.9 1,630.6 736.8 5,804.3 806.0 3,741.1 1,257.2
February 2015, BRLbn 6,526.6 3,820.2 1,774.8 931.5 6,526.6 784.5 4,300.7 1,441.4
% change y-o-y 12.4% 11.2% 8.8% 26.4% 12.4% -2.7% 15.0% 14.7%
February 2014, USDbn 2,475.9 1,466.1 695.6 314.3 2,475.9 343.8 1,595.8 536.3
February 2015, USDbn 2,297.1 1,344.6 624.7 327.9 2,297.1 276.1 1,513.7 507.3
% change y-o-y -7.2% -8.3% -10.2% 4.3% -7.2% -19.7% -5.1% -5.4%
Source: BMI, Central banks, Regulators
Table: Commercial Banking Sector Key Ratios, February 2015
Loan/deposit ratio Loan/asset ratio Loan/GDP ratio GDP Per Capita, USD Deposits per capita, USD
88.83% 58.53% 72.43% 10,935.6 7,482.2
Rising Falling Falling n.a. n.a.
Source: BMI, Central banks, Regulators
Table: Annual Growth Rate Projections 2014-2019 (%)
Assets Loans Deposits
Annual Growth Rate 13 13 12
CAGR 12 12 12
Ranking 21 23 21
Source: BMI, Central banks, Regulators
Brazil Commercial Banking Report Q3 2015
© Business Monitor International Ltd Page 7

Table: Ranking Out Of 73 Countries Reviewed In 2015
Loan/deposit ratio Loan/asset ratio Loan/GDP ratio
36 36 29
Local currency asset growth Local currency loan growth Local currency deposit growth
28 30 24
Source: BMI, Central banks, Regulators
Table: Commercial Banking Sector Indicators, 2012-2019
2012 2013 2014 2015f 2016f 2017f 2018f 2019f
Total assets, BRLbn 5,277.1 5,779.3 6,457.8 7,103.6 7,956.0 8,950.6 10,069.4 11,378.4
Total assets, USDbn 2,572.2 2,446.7 2,429.9 2,059.0 2,241.1 2,594.4 3,098.3 3,670.4
Client loans, BRLbn 3,010.2 3,424.5 3,815.6 4,178.1 4,658.6 5,240.9 5,922.2 6,692.1
Client loans, USDbn 1,467.2 1,449.8 1,435.7 1,211.0 1,312.3 1,519.1 1,822.2 2,158.7
Client deposits, BRLbn 3,394.5 3,695.3 4,203.7 4,624.1 5,202.1 5,852.4 6,554.7 7,341.2
Client deposits, USDbn 1,654.6 1,564.4 1,581.8 1,340.3 1,465.4 1,696.3 2,016.8 2,368.1
e/f = estimate/forecast. Source: BMI, Central banks, Regulators
Brazil Commercial Banking Report Q3 2015
© Business Monitor International Ltd Page 8

SWOT
Commercial Banking
Brazil Commercial Banking SWOT
Strengths ■ Large absolute size.
■ Potential for further development in high-end financial services and company
financing.
Weaknesses ■ Strong state bank dominance of the sector puts artificial pressure on private and
public sector banks to lend at low rates, raising questions about asset quality.
Opportunities ■ Potential for consolidation over the long term, particularly if the government reduces
its intervention.
■ A growing middle class provides opportunity for sector growth.
Threats ■ Long-term corporate lending and some segments of consumer lending may remain
underdeveloped, given the past volatility of the economy and financial markets, as
well as the significant role of the state development bank.
■ Given strong household loan growth by public sector banks, any widespread
deterioration in asset quality is likely to end up on the government's balance sheet,
placing stress on the fiscal accounts.
Brazil Commercial Banking Report Q3 2015
© Business Monitor International Ltd Page 9

Political
SWOT Analysis
Strengths ■ President Dilma Rousseff has largely followed in the footsteps of her predecessor
former President Luiz Inácio Lula da Silva, maintaining relatively market-friendly
policies.
■ Although corruption scandals continue to plague the political landscape, President
Dilma Rousseff's attempts to crack down on corrupt officials has boosted confidence
in the executive's commitment to tackling the issue in recent years.
Weaknesses ■ Massive protests in June 2013, and intermittent demonstrations in the last several
quarters, indicate that Brazil's social fabric is beginning to fray. With the
demonstrations highlighting long-term issues including corruption, high living costs
and the sub-par quality of public services, we cannot rule out further social unrest in
the coming quarters.
Opportunities ■ Brazil's growing political influence in the region may pave the way for the country to
assume the role of a regional leader, pioneering closer integration among Latin
American states.
Threats ■ The smaller members of the ruling legislative coalition could stir up trouble for
Rousseff if they feel she has assigned too many cabinet posts to other parties or
disagree with her policy trajectory.
Brazil Commercial Banking Report Q3 2015
© Business Monitor International Ltd Page 10
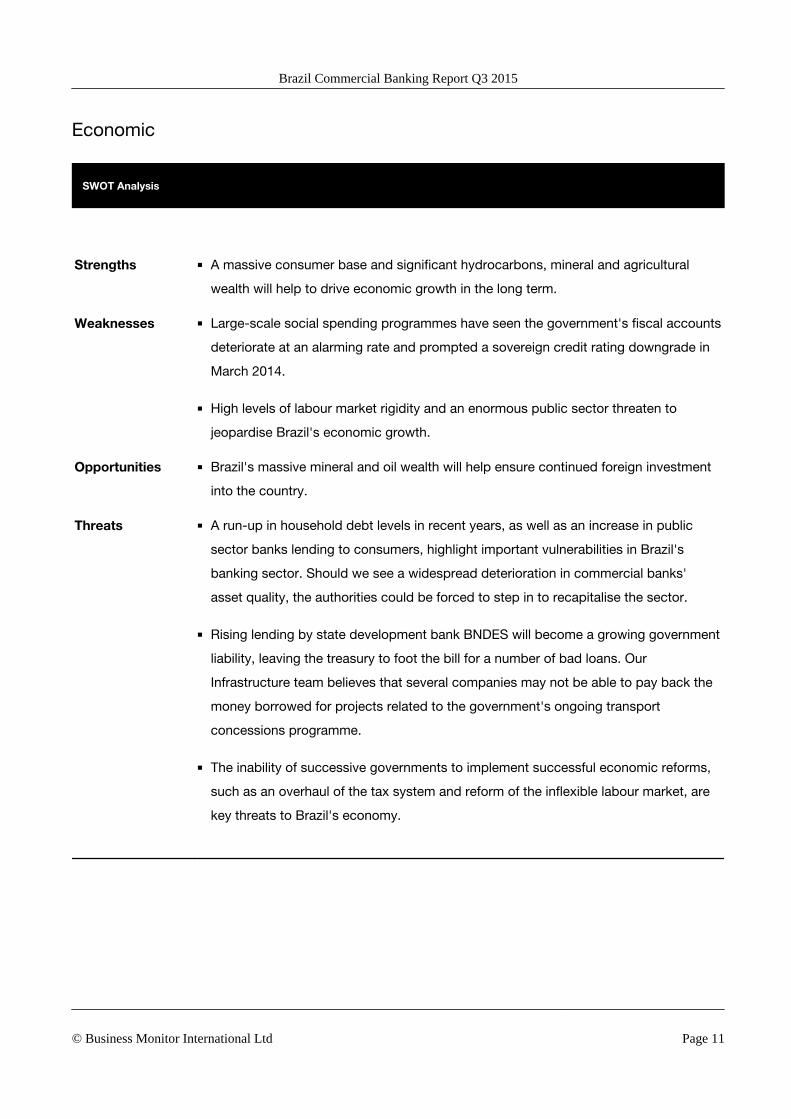
Economic
SWOT Analysis
Strengths ■ A massive consumer base and significant hydrocarbons, mineral and agricultural
wealth will help to drive economic growth in the long term.
Weaknesses ■ Large-scale social spending programmes have seen the government's fiscal accounts
deteriorate at an alarming rate and prompted a sovereign credit rating downgrade in
March 2014.
■ High levels of labour market rigidity and an enormous public sector threaten to
jeopardise Brazil's economic growth.
Opportunities ■ Brazil's massive mineral and oil wealth will help ensure continued foreign investment
into the country.
Threats ■ A run-up in household debt levels in recent years, as well as an increase in public
sector banks lending to consumers, highlight important vulnerabilities in Brazil's
banking sector. Should we see a widespread deterioration in commercial banks'
asset quality, the authorities could be forced to step in to recapitalise the sector.
■ Rising lending by state development bank BNDES will become a growing government
liability, leaving the treasury to foot the bill for a number of bad loans. Our
Infrastructure team believes that several companies may not be able to pay back the
money borrowed for projects related to the government's ongoing transport
concessions programme.
■ The inability of successive governments to implement successful economic reforms,
such as an overhaul of the tax system and reform of the inflexible labour market, are
key threats to Brazil's economy.
Brazil Commercial Banking Report Q3 2015
© Business Monitor International Ltd Page 11
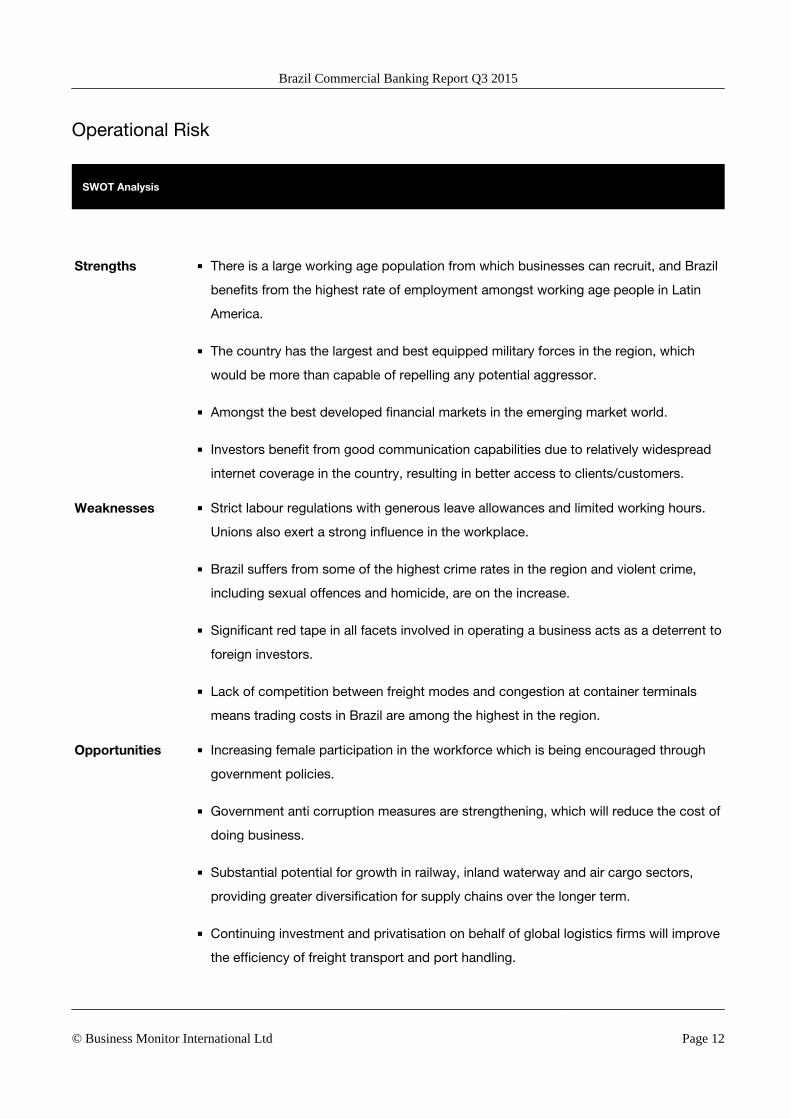
Operational Risk
SWOT Analysis
Strengths ■ There is a large working age population from which businesses can recruit, and Brazil
benefits from the highest rate of employment amongst working age people in Latin
America.
■ The country has the largest and best equipped military forces in the region, which
would be more than capable of repelling any potential aggressor.
■ Amongst the best developed financial markets in the emerging market world.
■ Investors benefit from good communication capabilities due to relatively widespread
internet coverage in the country, resulting in better access to clients/customers.
Weaknesses ■ Strict labour regulations with generous leave allowances and limited working hours.
Unions also exert a strong influence in the workplace.
■ Brazil suffers from some of the highest crime rates in the region and violent crime,
including sexual offences and homicide, are on the increase.
■ Significant red tape in all facets involved in operating a business acts as a deterrent to
foreign investors.
■ Lack of competition between freight modes and congestion at container terminals
means trading costs in Brazil are among the highest in the region.
Opportunities ■ Increasing female participation in the workforce which is being encouraged through
government policies.
■ Government anti corruption measures are strengthening, which will reduce the cost of
doing business.
■ Substantial potential for growth in railway, inland waterway and air cargo sectors,
providing greater diversification for supply chains over the longer term.
■ Continuing investment and privatisation on behalf of global logistics firms will improve
the efficiency of freight transport and port handling.
Brazil Commercial Banking Report Q3 2015
© Business Monitor International Ltd Page 12

SWOT Analysis - Continued
Threats ■ Tight labour market as demand for skilled labour is high, pushing up costs.
■ Due to the absence of terrorism, the security services are largely untested against
external terrorist threats, which could imply limited capability.
■ Despite continued investment, economic and population growth will continue to place
utilities and transport infrastructure under strain, posing a risk to business activity.
■ As the privatisation process continues, strikes across all sectors of the transport
network have the potential to cause delays and disruption to supply chains.
Brazil Commercial Banking Report Q3 2015
© Business Monitor International Ltd Page 13

Industry Forecast
BMI View: Asset and loan growth in Brazil is set for a further slowdown in the coming quarters. Poor
consumer confidence and an ongoing corruption scandal at national oil company Petrobras will weigh on
demand for credit, while a tightening of lending practices by state-owned banks will dampen the supply of
credit as well.
Rising interest rates and an economic recession will drive a further deceleration in Brazilian asset and loan
growth in the coming quarters (see 'Weak Demand And Limited Supply Drive Loan Growth Slowdown',
January 21). An ongoing corruption scandal at national oil company Petrobras will exacerbate these
dynamics, as a cessation of activity on a number of contracts in the oil and gas and construction sectors will
dampen demand for credit (see 'Corruption Scandal Could Prompt Market Restructure', March 6). The
trend of weaker asset and loan growth will continue over the course of our five-year forecast period in light
of slower real GDP growth, a highly-leveraged household sector, and a retrenchment in lending from state-
owned banks. Indeed, we forecast average annual loan growth of 11.9% over the course of our forecast
period to 2019, below 19.4% between 2010 and 2014. As a result, we see little upside for Brazil's score in
our Commercial Banking Risk/Reward Index, underpinning our view that the country will not regain the top
spot in Latin America in the coming quarters.
Brazil Commercial Banking Report Q3 2015
© Business Monitor International Ltd Page 14
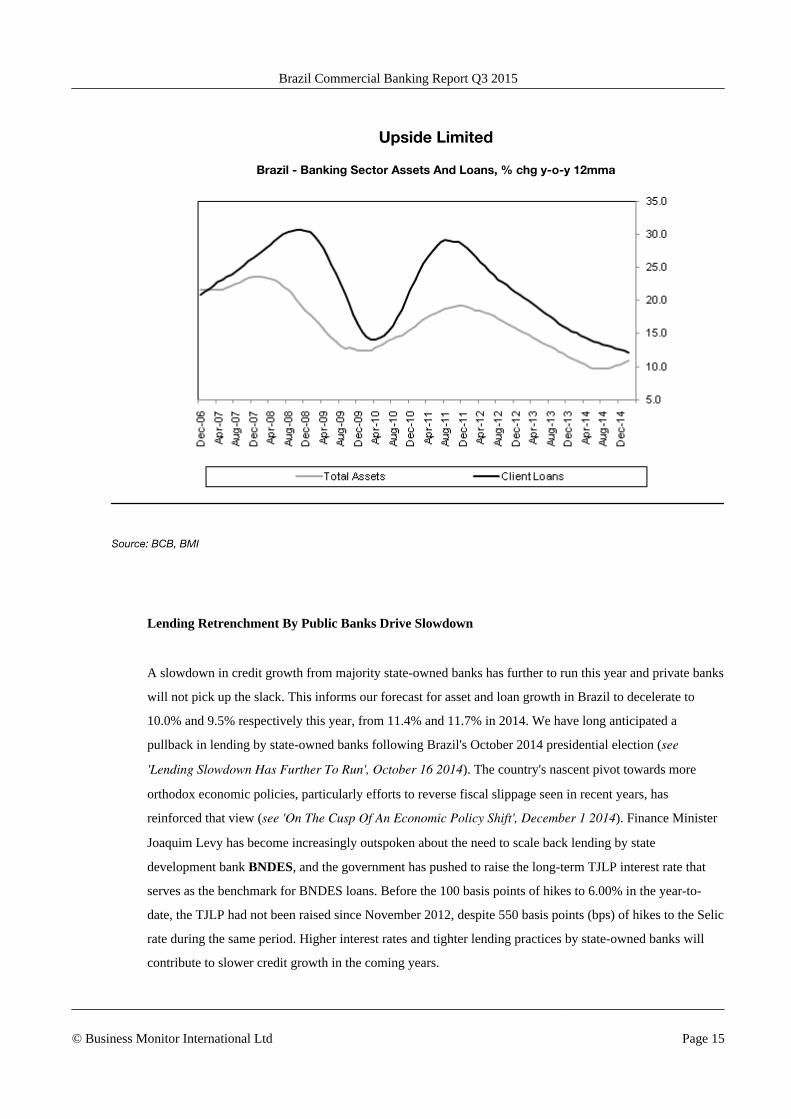
Upside Limited
Brazil - Banking Sector Assets And Loans, % chg y-o-y 12mma
Source: BCB, BMI
Lending Retrenchment By Public Banks Drive Slowdown
A slowdown in credit growth from majority state-owned banks has further to run this year and private banks
will not pick up the slack. This informs our forecast for asset and loan growth in Brazil to decelerate to
10.0% and 9.5% respectively this year, from 11.4% and 11.7% in 2014. We have long anticipated a
pullback in lending by state-owned banks following Brazil's October 2014 presidential election (see
'Lending Slowdown Has Further To Run', October 16 2014). The country's nascent pivot towards more
orthodox economic policies, particularly efforts to reverse fiscal slippage seen in recent years, has
reinforced that view (see 'On The Cusp Of An Economic Policy Shift', December 1 2014). Finance Minister
Joaquim Levy has become increasingly outspoken about the need to scale back lending by state
development bank BNDES, and the government has pushed to raise the long-term TJLP interest rate that
serves as the benchmark for BNDES loans. Before the 100 basis points of hikes to 6.00% in the year-to-
date, the TJLP had not been raised since November 2012, despite 550 basis points (bps) of hikes to the Selic
rate during the same period. Higher interest rates and tighter lending practices by state-owned banks will
contribute to slower credit growth in the coming years.
Brazil Commercial Banking Report Q3 2015
© Business Monitor International Ltd Page 15
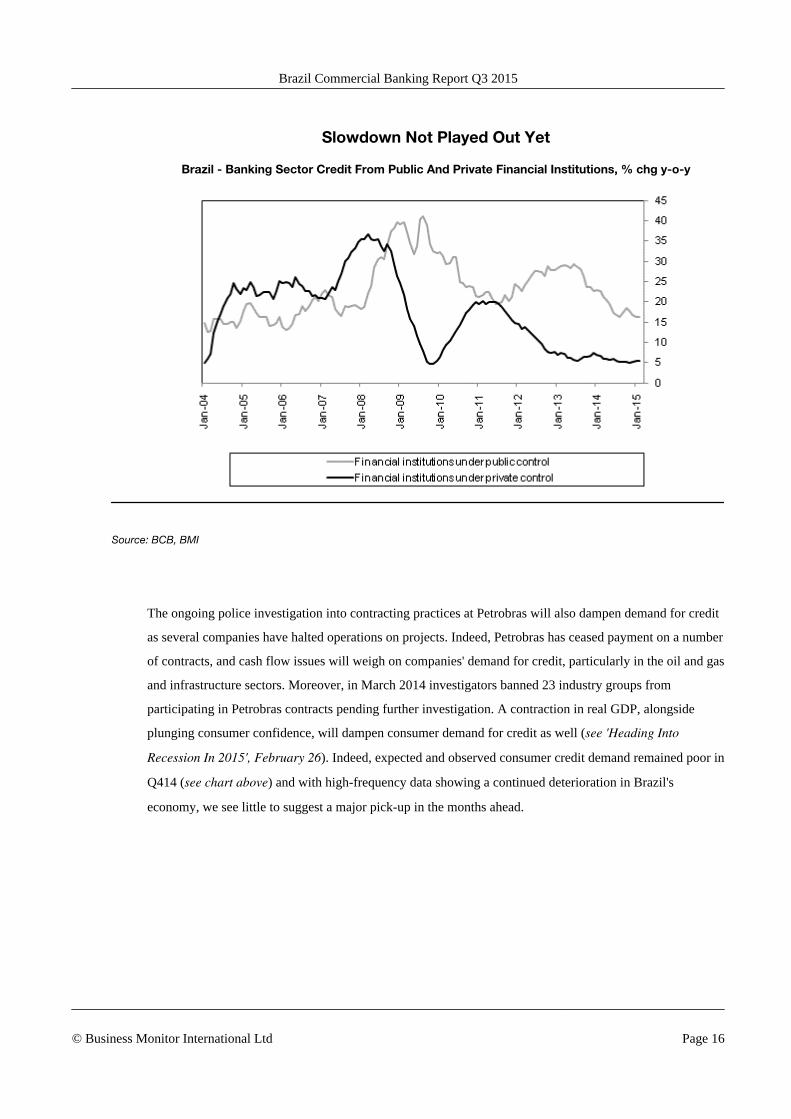
Slowdown Not Played Out Yet
Brazil - Banking Sector Credit From Public And Private Financial Institutions, % chg y-o-y
Source: BCB, BMI
The ongoing police investigation into contracting practices at Petrobras will also dampen demand for credit
as several companies have halted operations on projects. Indeed, Petrobras has ceased payment on a number
of contracts, and cash flow issues will weigh on companies' demand for credit, particularly in the oil and gas
and infrastructure sectors. Moreover, in March 2014 investigators banned 23 industry groups from
participating in Petrobras contracts pending further investigation. A contraction in real GDP, alongside
plunging consumer confidence, will dampen consumer demand for credit as well (see 'Heading Into
Recession In 2015', February 26). Indeed, expected and observed consumer credit demand remained poor in
Q414 (see chart above) and with high-frequency data showing a continued deterioration in Brazil's
economy, we see little to suggest a major pick-up in the months ahead.
Brazil Commercial Banking Report Q3 2015
© Business Monitor International Ltd Page 16

Significant Uptick Unlikely
Brazil - BCB Credit Demand Indicators
Note: Trend indicator of credit demand by financial institutions expressed in a point scale from 2 (best) to -2 (worst); Source: BCB
Weak Labour Market To Weigh On Deposit Growth
On the liabilities side of the balance sheet, deposit growth will slow in the coming months as a weakening
labour market weighs on income growth. Given an increase in the time it takes to find a job, a falling labour
participation rate, and rising reports that companies are looking to lay off workers due to poor economic
conditions, we expect deposit growth to decelerate in 2015. Nevertheless, rising deposit rates, which likely
contributed to a rebound in deposit growth in the latter half of 2014, will provide an incentive to save and
cushion the slowdown in deposits. Given these dynamics, we forecast deposits to increase by 10.0% this
year, down from 13.8% in 2014.
Brazil Commercial Banking Report Q3 2015
© Business Monitor International Ltd Page 17
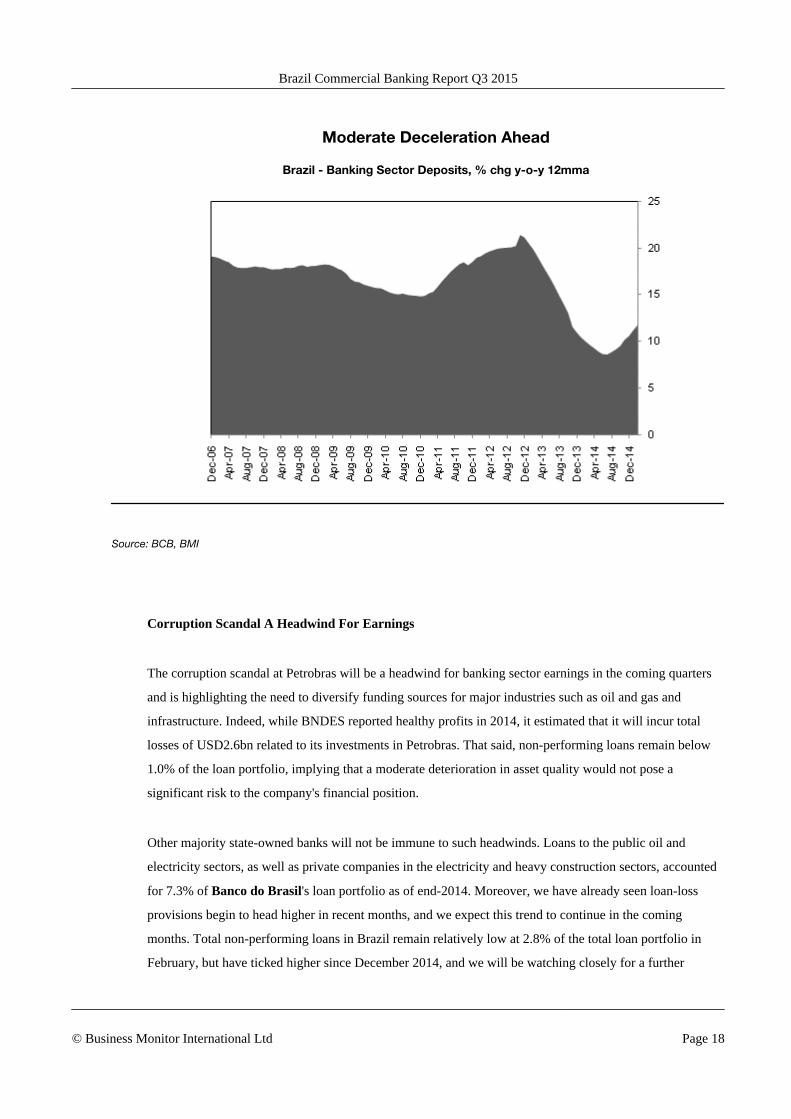
Moderate Deceleration Ahead
Brazil - Banking Sector Deposits, % chg y-o-y 12mma
Source: BCB, BMI
Corruption Scandal A Headwind For Earnings
The corruption scandal at Petrobras will be a headwind for banking sector earnings in the coming quarters
and is highlighting the need to diversify funding sources for major industries such as oil and gas and
infrastructure. Indeed, while BNDES reported healthy profits in 2014, it estimated that it will incur total
losses of USD2.6bn related to its investments in Petrobras. That said, non-performing loans remain below
1.0% of the loan portfolio, implying that a moderate deterioration in asset quality would not pose a
significant risk to the company's financial position.
Other majority state-owned banks will not be immune to such headwinds. Loans to the public oil and
electricity sectors, as well as private companies in the electricity and heavy construction sectors, accounted
for 7.3% of Banco do Brasil's loan portfolio as of end-2014. Moreover, we have already seen loan-loss
provisions begin to head higher in recent months, and we expect this trend to continue in the coming
months. Total non-performing loans in Brazil remain relatively low at 2.8% of the total loan portfolio in
February, but have ticked higher since December 2014, and we will be watching closely for a further
Brazil Commercial Banking Report Q3 2015
© Business Monitor International Ltd Page 18

deterioration in asset quality in the coming months. Nevertheless, with most major banks remaining well
capitalised, we do not expect a significant increase in systemic risk in the banking sector in the next few
quarters.
Risk/Reward Index Affirms Lacklustre Outlook
Given our view for notably slower asset and loan growth in the coming years, Brazil is highly unlikely to
re-take the top spot in our Commercial Banking Risk/Reward Index in the foreseeable future. Indeed, the
country's score dropped from 70.7 this quarter, from 71.4 previously, due to a decline in the 'country
rewards' sub-component. This came on the back of a weakening macroeconomic outlook for Brazil, in line
with our view that real GDP will contract in 2015 and see only a modest return to growth thereafter. With
the risks to our growth forecasts for the next few years lying primarily to the downside, with knock-on
effects for the banking sector, we see little to suggest a rebound in Brazil's Commercial Banking Risk/
Reward Index score in the next several months.
Brazil No Longer The Outperformer
Latin America - Commercial Banking Risk/Reward Index, Out Of 100
Brazil Chile Colombia Mexico Peru
2010 2011 2012 2013 2014 2015f
50
55
60
65
70
75
Source: BMI
Brazil Commercial Banking Report Q3 2015
© Business Monitor International Ltd Page 19
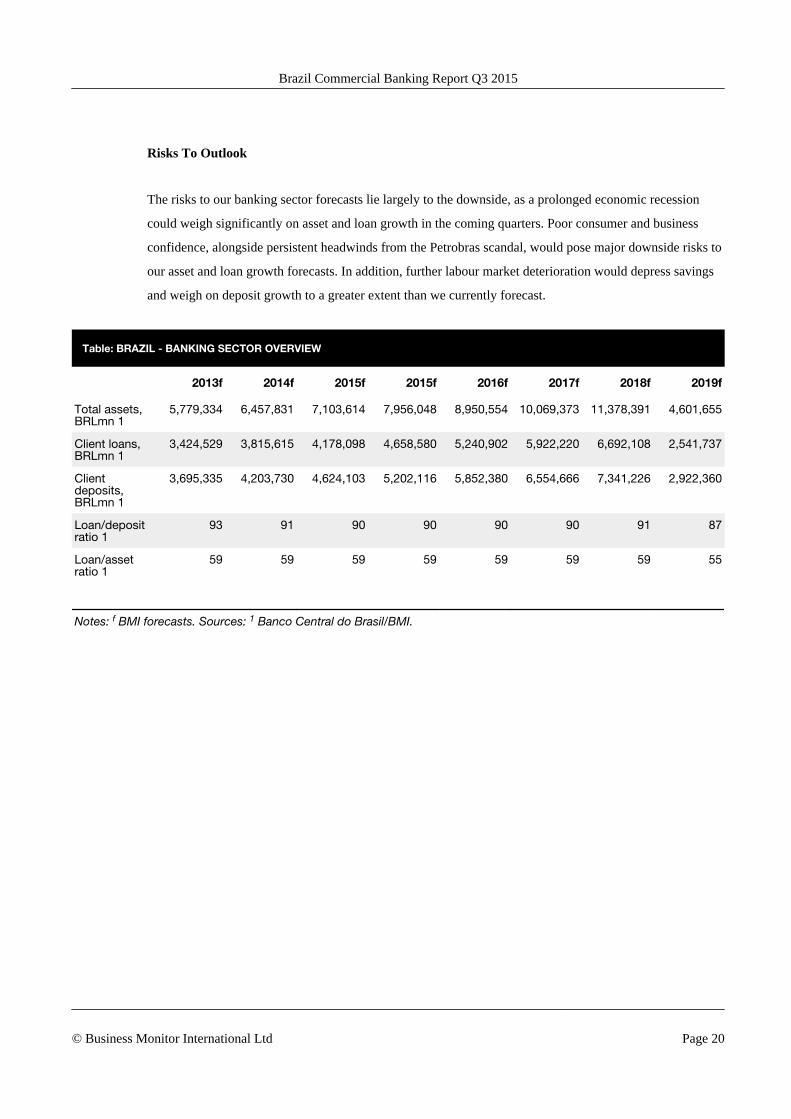
Risks To Outlook
The risks to our banking sector forecasts lie largely to the downside, as a prolonged economic recession
could weigh significantly on asset and loan growth in the coming quarters. Poor consumer and business
confidence, alongside persistent headwinds from the Petrobras scandal, would pose major downside risks to
our asset and loan growth forecasts. In addition, further labour market deterioration would depress savings
and weigh on deposit growth to a greater extent than we currently forecast.
Table: BRAZIL - BANKING SECTOR OVERVIEW
2013f 2014f 2015f 2015f 2016f 2017f 2018f 2019f
Total assets,BRLmn 1
5,779,334 6,457,831 7,103,614 7,956,048 8,950,554 10,069,373 11,378,391 4,601,655
Client loans,BRLmn 1
3,424,529 3,815,615 4,178,098 4,658,580 5,240,902 5,922,220 6,692,108 2,541,737
Clientdeposits,BRLmn 1
3,695,335 4,203,730 4,624,103 5,202,116 5,852,380 6,554,666 7,341,226 2,922,360
Loan/depositratio 1
93 91 90 90 90 90 91 87
Loan/assetratio 1
59 59 59 59 59 59 59 55
Notes: f BMI forecasts. Sources: 1 Banco Central do Brasil/BMI.
Brazil Commercial Banking Report Q3 2015
© Business Monitor International Ltd Page 20

Industry Risk Reward Ratings
Latin America Commercial Banking Risk/Reward Index
Commercial Banking Risk/Reward Index Methodology
Since Q108, we have described numerically the banking business environment for each of the countries
analysed by BMI. We do this through our Commercial Banking Industry Risk/Reward Index (RRI), a
measure that ensures we capture the latest quantitative information available. It also ensures consistency
across all countries. Like all of BMI's Industry Risk/Reward Indices, its takes into account the Rewards on
offer within the banking sector in a given country, but also the Risks to investors being able to realise those
opportunities. The overall index is weighted 70% towards Rewards and 30% towards Risks.
Within the Rewards category, we look at factors that are specific to the banking industry (accounting for
60% of the score within this category), and elements that relate to that country in general (accounting for
40% of the weighting). These include, but are not limited to, total assets, asset and loan growth, GDP and
taxation. Likewise on the Risks side, we look at industry-specific Risks (weighted 40% of the Risks total)
and country-specific Risks (weighted 60%). These include, but are not limited to, the regulatory framework
and environment, the competitive environment, financial risk, legal risk and policy continuity.
In general three aspects need to be borne in mind when interpreting the RRIs. The first is that the Industry
Rewards element is the most heavily weighted of the four elements, accounting for 42% (60% of 70%) of
the overall Index. Second, if the Industry Rewards score is significantly higher than the Country Rewards
score, within the Rewards category, it usually implies that the banking sector is (very) large and/or
developed relative to the general wealth, stability and financial infrastructure in the country. Conversely, if
the industry score is significantly lower, it usually means that the banking sector is small and/or
underdeveloped relative to the general wealth, stability and financial infrastructure in the country. Third,
within the Risks category, the industry-specific elements (i.e. how regulations affect the development of the
sector, how regulations affect competition within it, and Moody's Investor Services' Ratings for local
currency deposits) can be markedly different from BMI's long-term Country Risk Index for a given market.
Brazil Commercial Banking Report Q3 2015
© Business Monitor International Ltd Page 21
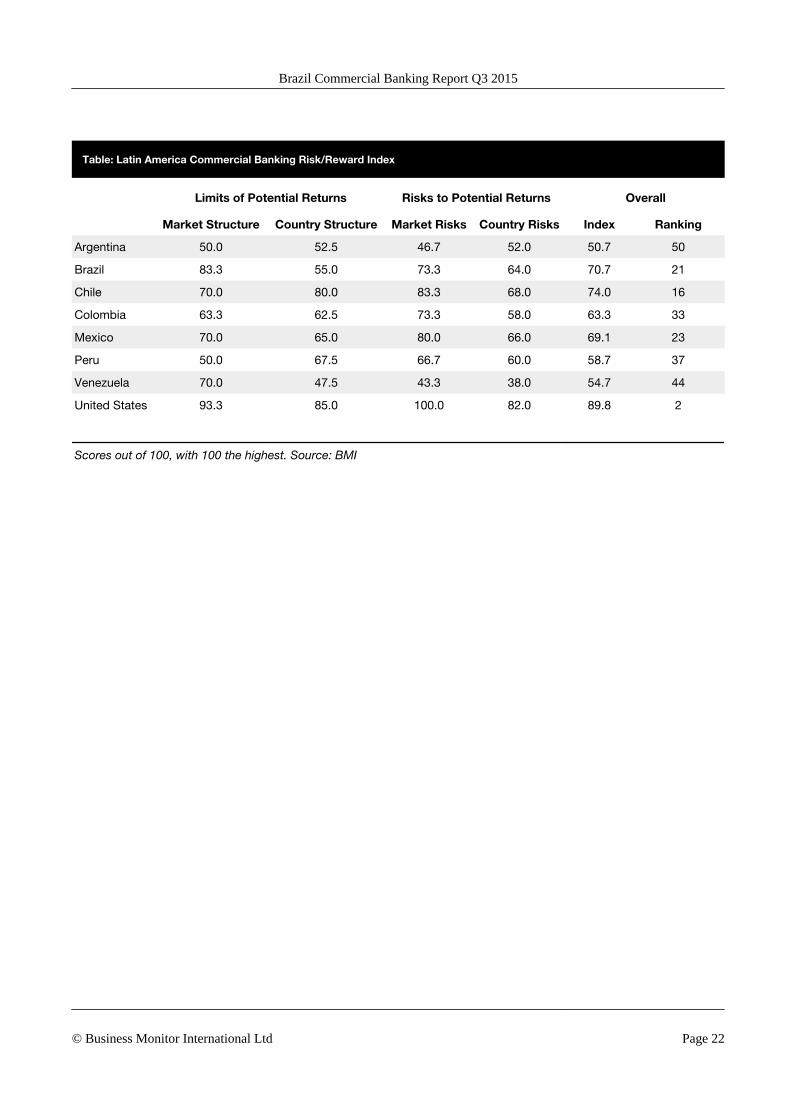
Table: Latin America Commercial Banking Risk/Reward Index
Limits of Potential Returns Risks to Potential Returns Overall
Market Structure Country Structure Market Risks Country Risks Index Ranking
Argentina 50.0 52.5 46.7 52.0 50.7 50
Brazil 83.3 55.0 73.3 64.0 70.7 21
Chile 70.0 80.0 83.3 68.0 74.0 16
Colombia 63.3 62.5 73.3 58.0 63.3 33
Mexico 70.0 65.0 80.0 66.0 69.1 23
Peru 50.0 67.5 66.7 60.0 58.7 37
Venezuela 70.0 47.5 43.3 38.0 54.7 44
United States 93.3 85.0 100.0 82.0 89.8 2
Scores out of 100, with 100 the highest. Source: BMI
Brazil Commercial Banking Report Q3 2015
© Business Monitor International Ltd Page 22

Market Overview
Latin America Commercial Banking Outlook
Table: Banks' Bond Portfolios, 2013
Bond Portfolio, USDbn Bond as % total assets Year-on-year growth %
Argentina 19.2 12.4 7.2
Brazil 725.5 29.7 1.5
Chile 35.0 11.6 9.0
Colombia 43.4 19.7 15.5
Mexico 46.7 9.3 2.6
Peru 6.1 6.5 9.3
Venezuela 70.8 29.2 78.2
United States 486.5 3.5 -8.5
Source: Central banks, regulators, BMI.
Table: Comparison of Loan/Deposit & Loan/Asset & Loan/GDP ratios, 2015
Loan/Deposit
ratio % Rank TrendLoan/Asset
ratio % Rank TrendLoan/GDP
ratio % Rank Trend
Argentina 61.7 69 Falling 42.4 63 Falling 12.1 73 Falling
Brazil 90.4 35 Falling 58.8 35 Falling 74.1 30 Rising
Chile 125.6 6 Rising 69.4 9 Falling 91.5 24 Rising
Colombia 107.5 22 Rising 65.3 19 Rising 43.4 53 Rising
Mexico 91.7 33 Falling 48.2 55 Rising 20.0 67 Rising
Peru 112.0 17 Rising 65.6 21 Rising 34.7 59 Rising
Venezuela 56.5 70 Rising 48.0 58 Rising 37.7 56 Rising
United States 104.8 20 Rising 73.1 7 Rising 64.5 37 Rising
Source: Central banks, regulators, BMI.
Brazil Commercial Banking Report Q3 2015
© Business Monitor International Ltd Page 23
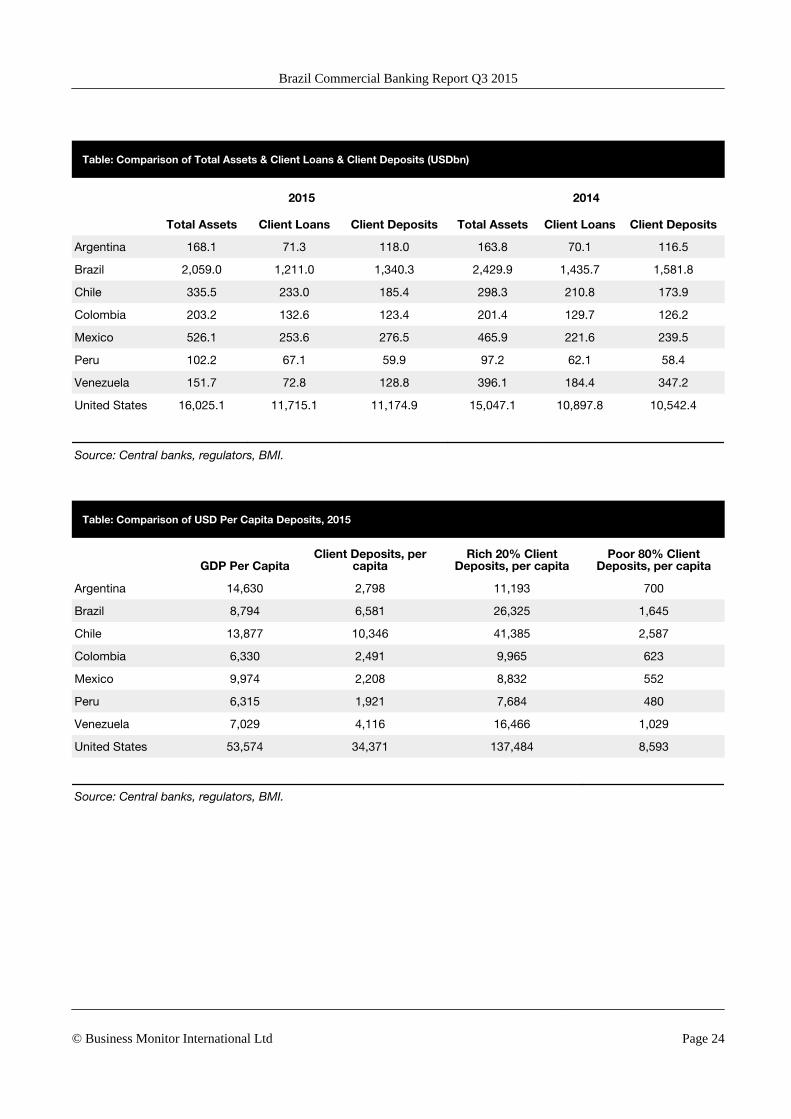
Table: Comparison of Total Assets & Client Loans & Client Deposits (USDbn)
2015 2014
Total Assets Client Loans Client Deposits Total Assets Client Loans Client Deposits
Argentina 168.1 71.3 118.0 163.8 70.1 116.5
Brazil 2,059.0 1,211.0 1,340.3 2,429.9 1,435.7 1,581.8
Chile 335.5 233.0 185.4 298.3 210.8 173.9
Colombia 203.2 132.6 123.4 201.4 129.7 126.2
Mexico 526.1 253.6 276.5 465.9 221.6 239.5
Peru 102.2 67.1 59.9 97.2 62.1 58.4
Venezuela 151.7 72.8 128.8 396.1 184.4 347.2
United States 16,025.1 11,715.1 11,174.9 15,047.1 10,897.8 10,542.4
Source: Central banks, regulators, BMI.
Table: Comparison of USD Per Capita Deposits, 2015
GDP Per CapitaClient Deposits, per
capitaRich 20% Client
Deposits, per capitaPoor 80% Client
Deposits, per capita
Argentina 14,630 2,798 11,193 700
Brazil 8,794 6,581 26,325 1,645
Chile 13,877 10,346 41,385 2,587
Colombia 6,330 2,491 9,965 623
Mexico 9,974 2,208 8,832 552
Peru 6,315 1,921 7,684 480
Venezuela 7,029 4,116 16,466 1,029
United States 53,574 34,371 137,484 8,593
Source: Central banks, regulators, BMI.
Brazil Commercial Banking Report Q3 2015
© Business Monitor International Ltd Page 24
Economic Analysis
BMI View: In light of a poor business environment, weak consumer confidence and a lacklustre external
environment, there is little upside for Brazilian real GDP growth in the next several years. A nascent policy
shift will gradually regain investor confidence following years of unorthodox economic policies, but will be
slow to translate into a significant uptick in growth.
Brazilian real GDP growth will remain anaemic in the coming years. A less favourable external
environment in light of an ongoing slowdown in Chinese growth, a poor domestic business environment
and lack of export competitiveness pose significant headwinds to growth. Brazil is in the early stages of an
economic policy shift with new Finance Minister Joaquim Levy set to reverse the fiscal deterioration of
recent years, and a central bank that is more committed to reining in inflation (see 'On The Cusp Of An
Economic Policy Shift', December 1 2014). However, consumer and business confidence will be slow to
recover given the unorthodox economic policies in place during President Dilma Rousseff's first term. In
addition, interest rates will continue heading higher in the coming months, constraining consumers' take-up
of credit and weighing on household spending. A reduction in government expenditures will also remove
support for growth. As a result, we have downgraded our 2015 real GDP growth forecast to 0.6% from
1.0% previously, implying a more moderate uptick from an estimated 0.2% expansion in 2014.
Brazil Commercial Banking Report Q3 2015
© Business Monitor International Ltd Page 25
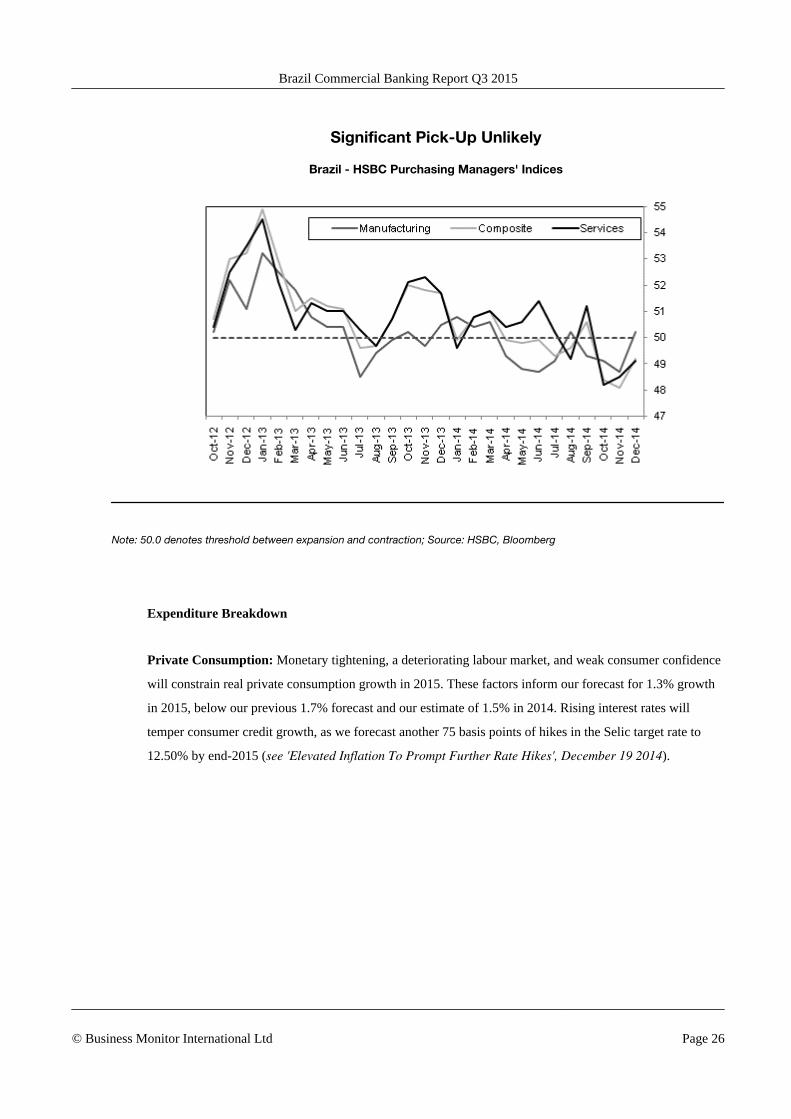
Significant Pick-Up Unlikely
Brazil - HSBC Purchasing Managers' Indices
Note: 50.0 denotes threshold between expansion and contraction; Source: HSBC, Bloomberg
Expenditure Breakdown
Private Consumption: Monetary tightening, a deteriorating labour market, and weak consumer confidence
will constrain real private consumption growth in 2015. These factors inform our forecast for 1.3% growth
in 2015, below our previous 1.7% forecast and our estimate of 1.5% in 2014. Rising interest rates will
temper consumer credit growth, as we forecast another 75 basis points of hikes in the Selic target rate to
12.50% by end-2015 (see 'Elevated Inflation To Prompt Further Rate Hikes', December 19 2014).
Brazil Commercial Banking Report Q3 2015
© Business Monitor International Ltd Page 26
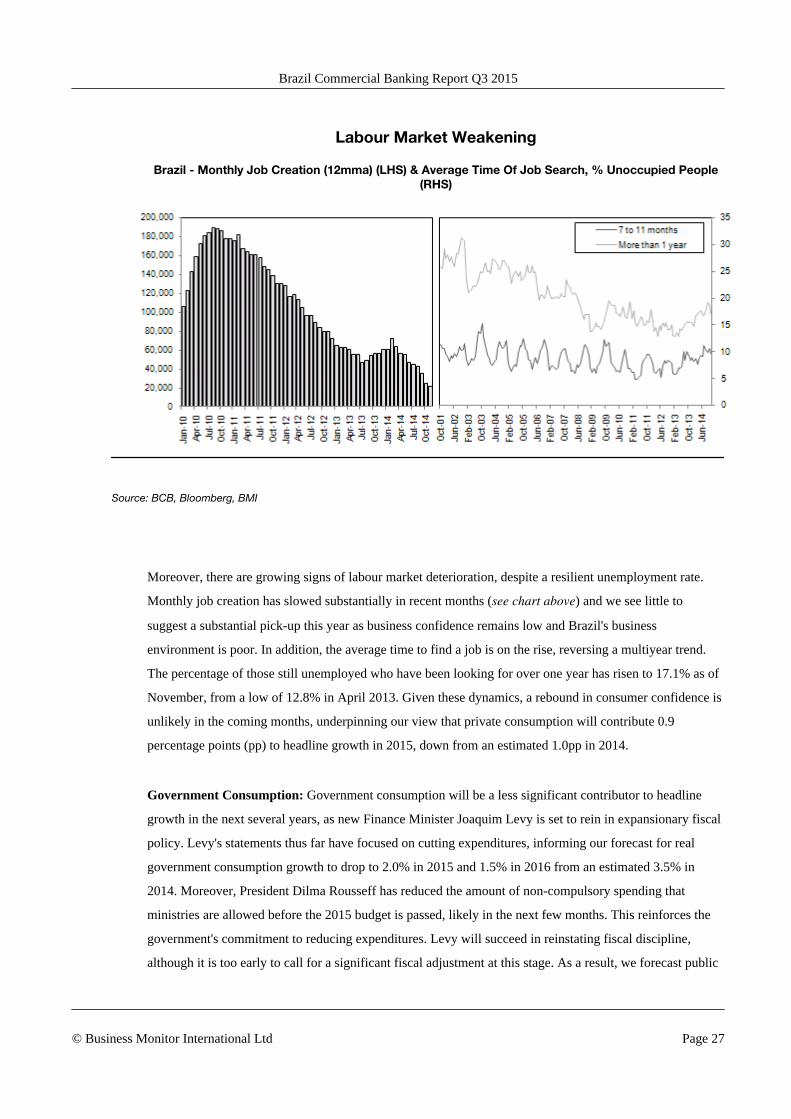
Labour Market Weakening
Brazil - Monthly Job Creation (12mma) (LHS) & Average Time Of Job Search, % Unoccupied People(RHS)
Source: BCB, Bloomberg, BMI
Moreover, there are growing signs of labour market deterioration, despite a resilient unemployment rate.
Monthly job creation has slowed substantially in recent months (see chart above) and we see little to
suggest a substantial pick-up this year as business confidence remains low and Brazil's business
environment is poor. In addition, the average time to find a job is on the rise, reversing a multiyear trend.
The percentage of those still unemployed who have been looking for over one year has risen to 17.1% as of
November, from a low of 12.8% in April 2013. Given these dynamics, a rebound in consumer confidence is
unlikely in the coming months, underpinning our view that private consumption will contribute 0.9
percentage points (pp) to headline growth in 2015, down from an estimated 1.0pp in 2014.
Government Consumption: Government consumption will be a less significant contributor to headline
growth in the next several years, as new Finance Minister Joaquim Levy is set to rein in expansionary fiscal
policy. Levy's statements thus far have focused on cutting expenditures, informing our forecast for real
government consumption growth to drop to 2.0% in 2015 and 1.5% in 2016 from an estimated 3.5% in
2014. Moreover, President Dilma Rousseff has reduced the amount of non-compulsory spending that
ministries are allowed before the 2015 budget is passed, likely in the next few months. This reinforces the
government's commitment to reducing expenditures. Levy will succeed in reinstating fiscal discipline,
although it is too early to call for a significant fiscal adjustment at this stage. As a result, we forecast public
Brazil Commercial Banking Report Q3 2015
© Business Monitor International Ltd Page 27
consumption to contribute 0.4pp and 0.3pp to headline growth in 2015 and 2016 respectively, down from an
estimated 0.7pp in 2014.
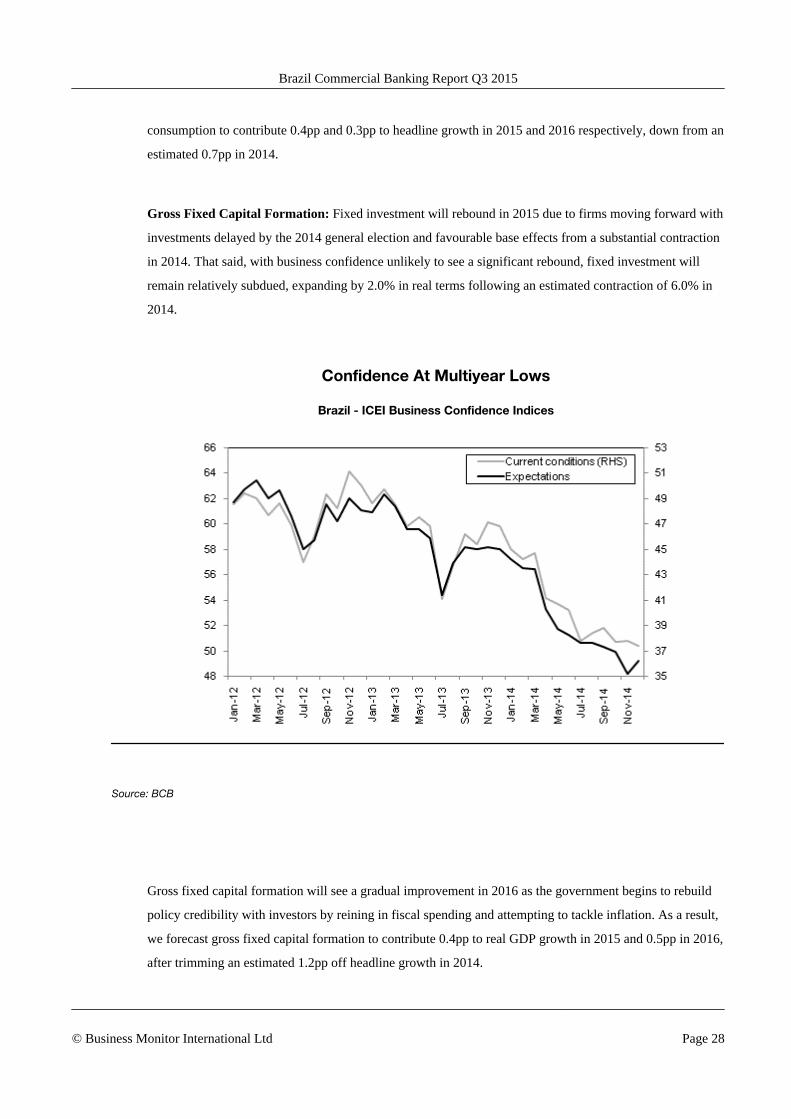
Gross Fixed Capital Formation: Fixed investment will rebound in 2015 due to firms moving forward with
investments delayed by the 2014 general election and favourable base effects from a substantial contraction
in 2014. That said, with business confidence unlikely to see a significant rebound, fixed investment will
remain relatively subdued, expanding by 2.0% in real terms following an estimated contraction of 6.0% in
2014.
Confidence At Multiyear Lows
Brazil - ICEI Business Confidence Indices
Source: BCB
Gross fixed capital formation will see a gradual improvement in 2016 as the government begins to rebuild
policy credibility with investors by reining in fiscal spending and attempting to tackle inflation. As a result,
we forecast gross fixed capital formation to contribute 0.4pp to real GDP growth in 2015 and 0.5pp in 2016,
after trimming an estimated 1.2pp off headline growth in 2014.
Brazil Commercial Banking Report Q3 2015
© Business Monitor International Ltd Page 28
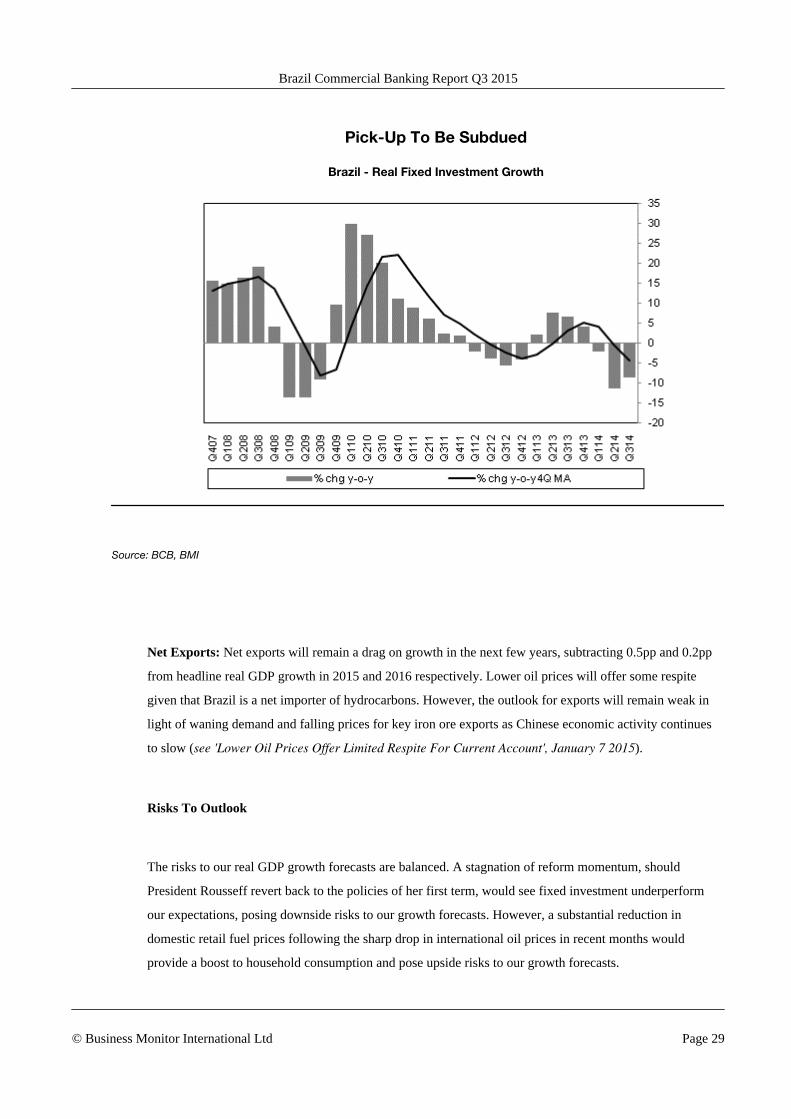
Pick-Up To Be Subdued
Brazil - Real Fixed Investment Growth
Source: BCB, BMI
Net Exports: Net exports will remain a drag on growth in the next few years, subtracting 0.5pp and 0.2pp
from headline real GDP growth in 2015 and 2016 respectively. Lower oil prices will offer some respite
given that Brazil is a net importer of hydrocarbons. However, the outlook for exports will remain weak in
light of waning demand and falling prices for key iron ore exports as Chinese economic activity continues
to slow (see 'Lower Oil Prices Offer Limited Respite For Current Account', January 7 2015).
Risks To Outlook
The risks to our real GDP growth forecasts are balanced. A stagnation of reform momentum, should
President Rousseff revert back to the policies of her first term, would see fixed investment underperform
our expectations, posing downside risks to our growth forecasts. However, a substantial reduction in
domestic retail fuel prices following the sharp drop in international oil prices in recent months would
provide a boost to household consumption and pose upside risks to our growth forecasts.
Brazil Commercial Banking Report Q3 2015
© Business Monitor International Ltd Page 29

Table: GDP By Expenditure (Brazil 2012-2019)
2012 2013 2014e 2015f 2016f 2017f 2018f 2019f
Private final consumption,BRLbn 2,750.2 3,033.7 3,273.2 3,518.0 3,778.0 4,061.8 4,367.0 4,711.2
Private final consumption,USDbn 1,406.9 1,405.6 1,389.7 1,379.6 1,453.1 1,544.4 1,699.2 1,884.5
Private final consumption, realgrowth % y-o-y 3.2 2.6 1.5 1.3 1.6 2.1 2.2 2.5
Government finalconsumption, BRLbn 935.8 1,064.5 1,171.2 1,267.5 1,359.8 1,454.8 1,558.0 1,672.6
Government finalconsumption, USDbn 478.7 493.2 497.3 497.1 523.0 553.2 606.2 669.0
Government finalconsumption, real growth %y-o-y
3.3 2.0 3.5 2.0 1.5 1.6 1.8 2.0
Fixed capital formation,BRLbn 798.1 880.9 891.0 977.9 1,078.5 1,195.3 1,337.6 1,489.6
Fixed capital formation,USDbn 408.3 408.2 378.3 383.5 414.8 454.5 520.5 595.9
Fixed capital formation, realgrowth % y-o-y -4.0 5.2 -6.0 2.0 2.5 3.0 4.0 3.5
Exports of goods andservices, BRLbn 552.8 608.2 632.4 687.2 717.6 754.8 768.4 782.5
Exports of goods andservices, USDbn 282.8 281.8 268.5 269.5 276.0 287.0 299.0 313.0
Exports of goods andservices, real growth % y-o-y 0.5 2.5 -3.5 0.9 -3.0 -2.3 -5.5 -5.4
Imports of goods andservices, BRLbn 616.4 728.5 756.3 831.3 871.0 912.6 925.2 927.5
Imports of goods andservices, USDbn 315.3 337.5 321.1 326.0 335.0 347.0 360.0 371.0
Imports of goods andservices, real growth % y-o-y 0.2 8.3 -2.2 3.6 -1.2 -1.2 -4.4 -5.5
Net exports of goods andservices, BRLbn -63.5 -120.3 -123.9 -144.1 -153.4 -157.8 -156.8 -145.0
Net exports of goods andservices, USDbn -32.5 -55.7 -52.6 -56.5 -59.0 -60.0 -61.0 -58.0
Net exports of goods andservices, real growth % y-o-y -0.9 32.6 2.0 11.8 3.7 1.6 -1.9 -5.7
e/f=BMI estimate/forecast; Source: IBGE/IMF
Brazil Commercial Banking Report Q3 2015
© Business Monitor International Ltd Page 30

Competitive Landscape
Market Structure
Protagonists
Table: Protagonists In Brazil's Commercial Banking Sector
Central bank: Banco Central do Brasil (BCB)
www.bcb.gov.br
Established in 1964, BCB supersedes the previous monetary authorities Banco do Brasil, the National Treasury and theSuperintendency of Currency and Credit. The central bank is governed by the Complementary Law of the NationalFinancial System that describes its activities and structure. BCB is responsible for monetary policy and foreign exchangepolicy. It is also issues notes and is the manager of the national payments system. It regulates the banks and some otherfinancial institutions and is banker to the banks. However, Banco do Brasil remains banker to the government to asignificant extent.
Principal banking regulator: Banco Central do Brasil (BCB)
www.bcb.gov.br
Alongside its other functions, BCB is the principal regulator of the banks.
Banking trade association: Federação Brasileira de Bancos (Febraban)
www.febraban.org.br
Febraban, established in 1967, is the main trade association of the Brazilian commercial banking sector. Its membershipincludes 121 financial institutions, representing 97% of total banking system assets at end-2013. It lobbies to thegovernment on behalf of its members and seeks to improve the efficiency and reach of the Brazilian financial system.
Banking trade association: Associação Brasileira de Bancos Internacionais (ABBI)
www.abbi.com.br
ABBI's aim is to bring together and represent the international banks in Brazil. Its membership also includes major lawfirms and other service providers.
Definition Of The Commercial Banking Universe
According to the Banco Central do Brasil (BCB), there were 132 multiple banks and 22 commercial banks
(including full branches of foreign banks) operating in Brazil as of November 2014. The central bank
currently lists the 50 largest banks as of September 2014.
Brazil Commercial Banking Report Q3 2015
© Business Monitor International Ltd Page 31
List of Banks
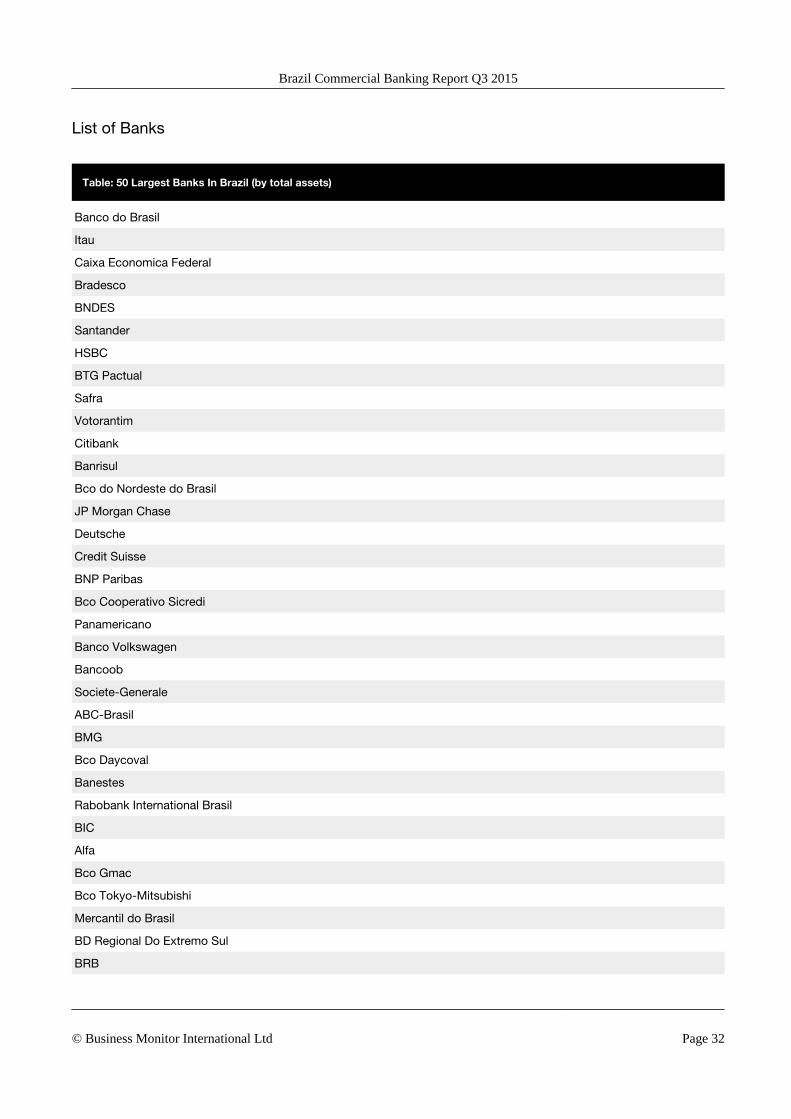
Table: 50 Largest Banks In Brazil (by total assets)
Banco do Brasil
Itau
Caixa Economica Federal
Bradesco
BNDES
Santander
HSBC
BTG Pactual
Safra
Votorantim
Citibank
Banrisul
Bco do Nordeste do Brasil
JP Morgan Chase
Deutsche
Credit Suisse
BNP Paribas
Bco Cooperativo Sicredi
Panamericano
Banco Volkswagen
Bancoob
Societe-Generale
ABC-Brasil
BMG
Bco Daycoval
Banestes
Rabobank International Brasil
BIC
Alfa
Bco Gmac
Bco Tokyo-Mitsubishi
Mercantil do Brasil
BD Regional Do Extremo Sul
BRB
Brazil Commercial Banking Report Q3 2015
© Business Monitor International Ltd Page 32

50 Largest Banks In Brazil (by total assets) - Continued
Morgan Stanley
Bco Da Amazonia
BOFA Merrill Lynch
Mercedez-Benz
Pine
Barclays
Bco Fibra
BES
Banco IBM
Banco CNH Industrial Capital
Credit Agricole
Bco Classico
Bco Des. De MG
Bco de Lage Landen Brasil
J Malucelli
Banco Fidis
Source: BCB, September 2014
Brazil Commercial Banking Report Q3 2015
© Business Monitor International Ltd Page 33
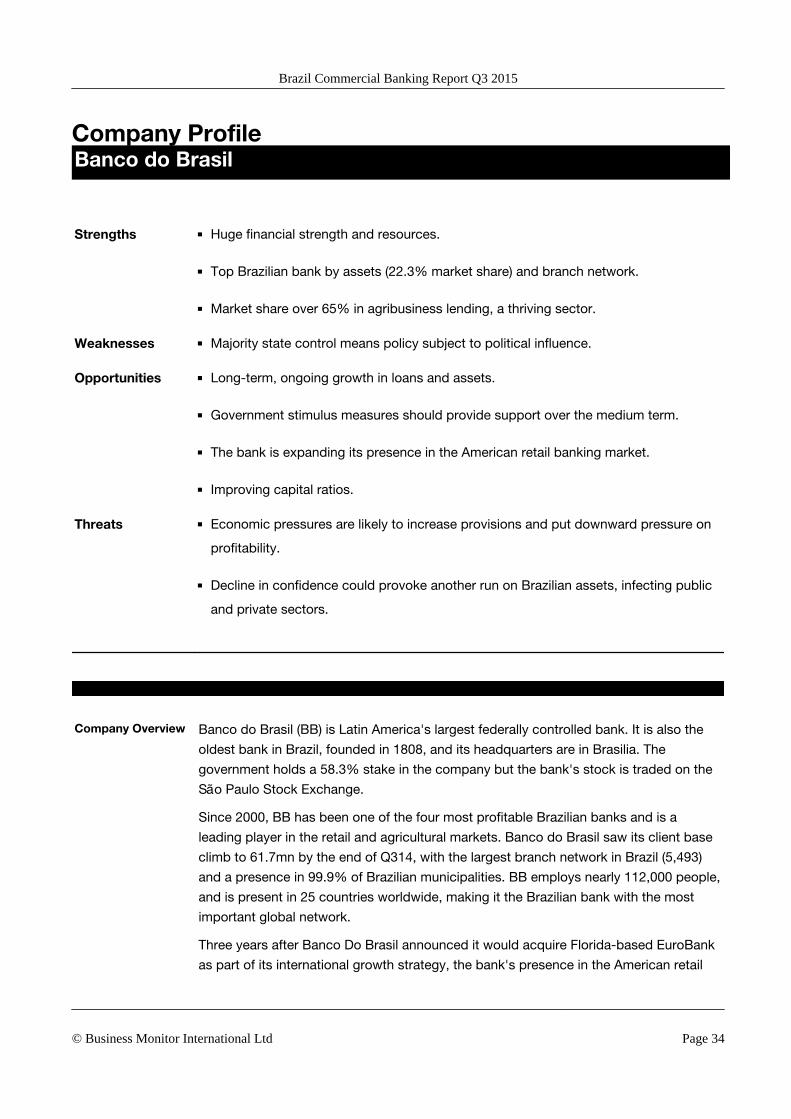
Company ProfileBanco do Brasil
SWOT Analysis
Strengths ■ Huge financial strength and resources.
■ Top Brazilian bank by assets (22.3% market share) and branch network.
■ Market share over 65% in agribusiness lending, a thriving sector.
Weaknesses ■ Majority state control means policy subject to political influence.
Opportunities ■ Long-term, ongoing growth in loans and assets.
■ Government stimulus measures should provide support over the medium term.
■ The bank is expanding its presence in the American retail banking market.
■ Improving capital ratios.
Threats ■ Economic pressures are likely to increase provisions and put downward pressure on
profitability.
■ Decline in confidence could provoke another run on Brazilian assets, infecting public
and private sectors.
Company Overview Banco do Brasil (BB) is Latin America's largest federally controlled bank. It is also the
oldest bank in Brazil, founded in 1808, and its headquarters are in Brasilia. The
government holds a 58.3% stake in the company but the bank's stock is traded on the
São Paulo Stock Exchange.
Since 2000, BB has been one of the four most profitable Brazilian banks and is a
leading player in the retail and agricultural markets. Banco do Brasil saw its client base
climb to 61.7mn by the end of Q314, with the largest branch network in Brazil (5,493)
and a presence in 99.9% of Brazilian municipalities. BB employs nearly 112,000 people,
and is present in 25 countries worldwide, making it the Brazilian bank with the most
important global network.
Three years after Banco Do Brasil announced it would acquire Florida-based EuroBank
as part of its international growth strategy, the bank's presence in the American retail
Brazil Commercial Banking Report Q3 2015
© Business Monitor International Ltd Page 34

banking market continues to grow. The takeover was completed with the launch of
Banco do Brasil Americas in October 2012, and now has five branches in Florida.
The bank's key goals through to 2018 include increasing efficiency and productivity and
producing sustainable results, while also continuing to expand internationally. In
November 2013, the bank issued its first bond denominated in Swiss francs, as part of
an effort to diversify its customer base.
In November 2014, Banco do Brasil announced that it will form a US$4.5bn joint
venture with Cielo, the country's largest card-payment processor, to manage debit and
credit card transactions. BB will hold a 30% share of capital in the new company, but
counting its holdings in Cielo, it will indirectly hold a 50% stake in it overall.
Corporate
HighlightsThe bank was hit hard by the global financial crisis and resulting provisions, though
recovered strongly. According to the latest available data from the company's quarterly
financial statements, Banco do Brasil recorded net income of BRL8.3bn in the first three
quarters of 2014, an increase of 5.0% compared to the profit reported in the same
period of the previous year. The increase in profit was supported by a 7.3% hike in net
interest income to BRL36.7bn.
In keeping with its strategic plan of maintaining its position as the leading Brazilian
bank, the loan portfolio expanded by 12.3% y-o-y to reach BRL732.7bn as of
September 30 2014. Over the same period the bank also saw its total assets rise by
13.7% to BRL1.43trn, up from BRL1.26trn a year earlier.
Banco do Brasil's Core Tier 1 capital ratio stood at 9.3% at end-September 2014, up for
8.4% a year earlier. The Capital Adequacy Ratio also improved from 15.3% to 16.0%
over the same period.
As of end September 2014, BB had a long-term credit rating of 'BBB' at Fitch, 'Baa2' at
Moody's, and 'BBB-' at Standard & Poor's.
Company Data ■ Website: www.bb.com.br
Brazil Commercial Banking Report Q3 2015
© Business Monitor International Ltd Page 35

Table: Stock Market Indicators
2008 2009 2010 2011 2012 2013 2014 17-Apr-2015
Market Capitalisation BRL 37,319 76,275 89,884 67,910 73,355 69,916 68,111 72,610
Market Capitalisation USD 15,977 43,786 54,101 36,405 35,888 29,619 25,725 23,823
Share Price BRL 14.68 29.70 31.42 23.70 25.60 24.40 23.77 25.34
Share Price USD 6.28 17.05 18.91 12.71 12.52 10.34 8.98 8.31
Share Price USD, % change (eop) -63.3 171.3 10.9 -32.8 -1.4 -17.5 -13.1 n.a.
Change, year-to-date n.a. n.a. n.a. n.a. n.a. n.a. n.a. -7.4
Shares Outstanding (mn) 2,568 2,569 2,861 2,865 2,845 2,809 2,797 n.a.
Source: BB (Banco du Brazil), Bloomberg
Table: Balance Sheet (BRLmn)
2008 2009 2010 2011 2012 2013 2014
Total Assets 521,273 702,572 802,820 966,823 1,136,007 1,303,915 1,278,137
Loans & Mortgages 193,849 286,001 338,388 399,032 498,071 561,494 631,633
Total Deposits 256,776 327,102 359,301 429,177 455,515 491,013 437,822
Total Shareholders' Equity 29,937 40,521 54,419 63,269 69,898 72,225 85,440
Earnings per share (BRL) 3.43 5.24 4.17 4.43 3.93 5.58 4.23
Source: BB (Banco du Brazil), Bloomberg
Table: Balance Sheet (USDmn)
2008 2009 2010 2011 2012 2013 2014
Total Assets 225,220 403,313 483,626 518,877 554,556 551,945 482,899
Loans & Mortgages 83,754 164,180 203,848 214,154 243,139 237,680 238,640
Total Deposits 110,942 187,774 216,447 230,332 222,365 207,845 165,416
Total Shareholders' Equity 12,935 23,261 32,782 33,955 34,122 30,573 32,281
Earnings per share (USD) 1.90 2.66 2.37 2.65 2.02 2.60 1.80
Source: BB (Banco du Brazil), Bloomberg
Brazil Commercial Banking Report Q3 2015
© Business Monitor International Ltd Page 36

Table: Key Ratios (%)
2008 2009 2010 2011 2012 2013 2014
Return on Assets 2.0 2.2 1.5 1.4 1.1 1.3 0.9
Return on Equities 32.5 38.2 23.8 21.7 17.1 22.7 15.7
Loan Deposit Ratio 80.7 91.1 97.2 95.8 112.9 119.0 148.6
Loan Asset Ratio 39.7 42.4 43.5 42.5 45.3 44.8 50.9
Equity Asset Ratio 5.7 5.8 6.8 6.5 6.1 5.3 6.4
Total Risk Based Capital Ratio 15.6 13.8 14.1 14.0 14.8 14.5 16.1
Tier 1 Capital Ratio 15.2 10.6 11.0 10.5 10.6 10.5 11.4
Source: BB (Banco du Brazil), Bloomberg
Brazil Commercial Banking Report Q3 2015
© Business Monitor International Ltd Page 37
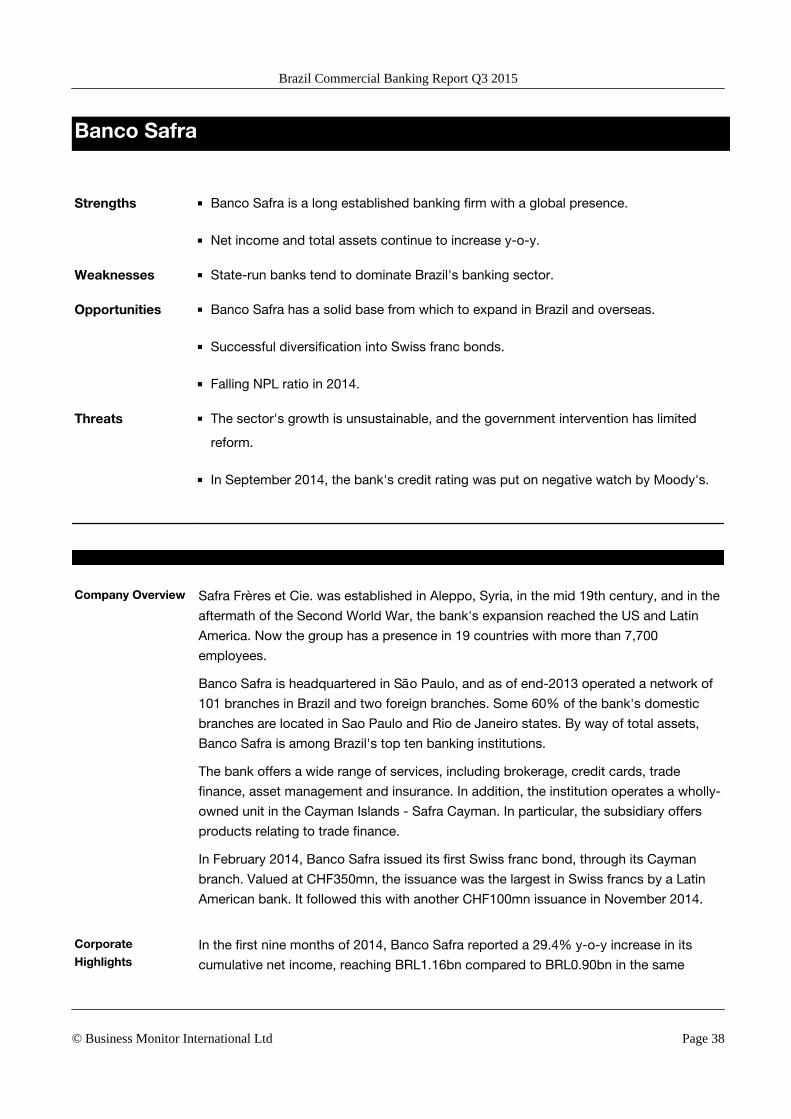
Banco Safra
SWOT Analysis
Strengths ■ Banco Safra is a long established banking firm with a global presence.
■ Net income and total assets continue to increase y-o-y.
Weaknesses ■ State-run banks tend to dominate Brazil's banking sector.
Opportunities ■ Banco Safra has a solid base from which to expand in Brazil and overseas.
■ Successful diversification into Swiss franc bonds.
■ Falling NPL ratio in 2014.
Threats ■ The sector's growth is unsustainable, and the government intervention has limited
reform.
■ In September 2014, the bank's credit rating was put on negative watch by Moody's.
Company Overview Safra Frères et Cie. was established in Aleppo, Syria, in the mid 19th century, and in the
aftermath of the Second World War, the bank's expansion reached the US and Latin
America. Now the group has a presence in 19 countries with more than 7,700
employees.
Banco Safra is headquartered in São Paulo, and as of end-2013 operated a network of
101 branches in Brazil and two foreign branches. Some 60% of the bank's domestic
branches are located in Sao Paulo and Rio de Janeiro states. By way of total assets,
Banco Safra is among Brazil's top ten banking institutions.
The bank offers a wide range of services, including brokerage, credit cards, trade
finance, asset management and insurance. In addition, the institution operates a wholly-
owned unit in the Cayman Islands - Safra Cayman. In particular, the subsidiary offers
products relating to trade finance.
In February 2014, Banco Safra issued its first Swiss franc bond, through its Cayman
branch. Valued at CHF350mn, the issuance was the largest in Swiss francs by a Latin
American bank. It followed this with another CHF100mn issuance in November 2014.
Corporate
HighlightsIn the first nine months of 2014, Banco Safra reported a 29.4% y-o-y increase in its
cumulative net income, reaching BRL1.16bn compared to BRL0.90bn in the same
Brazil Commercial Banking Report Q3 2015
© Business Monitor International Ltd Page 38

period of 2013. This came despite a 6.9% y-o-y increase in administrative expenses
during the same period.
The bank also saw its total assets rise to BRL137.6bn by September 30 2014, up 4.2%
y-o-y from BRL132.0bn in September 2013.
In September 2014, Moody's Investors Service downgraded the credit rating outlook for
several Brazilian banks, including Banco Safra, to negative from stable, in line with the
outlook for the country's sovereign debt. Banco Safra has been rated Baa2 by Moody's
since October 2012. Its equivalent long-term credit rating at Fitch is 'BBB' (stable
outlook) and at Standard & Poor's it is 'BBB-' (stable outlook).
The bank's non-performing loan ration fell to 0.99% in September 2014, from 1.70% a
year earlier.
Table: Balance Sheet (BRLmn)
2008 2009 2010 2011 2012
Total Assets 61,940 65,863 73,313 86,867 111,452
Loans & Mortgages 22,421 25,196 36,478 46,824 47,169
Total Deposits 14,695 13,679 14,567 16,501 11,959
Total Shareholders' Equity 4,126 4,907 5,614 6,016 7,247
Earnings per share (BRL) 776.64 839.15 925.42 0.86 0.85
Source: Bank Safra, Bloomberg
Table: Balance Sheet (USDmn)
2008 2009 2010 2011 2012
Total Assets 26,762 37,809 44,165 46,620 54,407
Loans & Mortgages 9,687 14,464 21,975 25,129 23,026
Total Deposits 6,349 7,853 8,775 8,856 5,838
Total Shareholders' Equity 1,783 2,817 3,382 3,228 3,538
Earnings per share (USD) 431.05 425.51 526.43 0.52 0.44
Source: Bank Safra, Bloomberg
Brazil Commercial Banking Report Q3 2015
© Business Monitor International Ltd Page 39

Table: Key Ratios (%)
2008 2009 2010 2011 2012
Return on Assets n.a. 1.4 1.5 1.6 1.3
Return on Equities n.a. 20.2 19.9 21.6 19.3
Equity Asset Ratio 6.7 7.4 7.7 6.9 6.5
Source: Bank Safra, Bloomberg
Brazil Commercial Banking Report Q3 2015
© Business Monitor International Ltd Page 40

BradescoSWOT Analysis
Strengths ■ Strong brand and revenue growth in recent years.
■ Wide spread of lending to a range of businesses and organisations in Brazil and
worldwide.
■ Successfully raising capital internationally.
Weaknesses ■ Government measures to curb credit growth are impacting lending.
Opportunities ■ Long-term growth in lending and deposits.
■ A slowdown in the expansion of lending by state banks could create room for private
lenders.
■ Strong growth in net income in first nine months of 2014.
Threats ■ Bradesco may experience increases in its level of past due loans as its loans and
advances portfolio becomes more seasoned.
Company Overview Bradesco, based in Osasco, São Paulo, was the largest private bank in Brazil until the
merger of Banco Itaú and Unibanco. It remains a giant institution, with reported assets
of BRL879bn at end-2012, and it ranks as one of Brazil's biggest private-sector
employers with 98,849 staff. It has 74,028 service points around Brazil, including 4,659
branches and over 48,000 ATMs. It lends to individuals, major local and international
corporations and organisations, and to small and medium-sized businesses.
In 2011, the bank opened over 1,000 new branches in a major expansion drive, and
strengthened its position in Brazil via the acquisition of Banco do Estado do Rio de
Janeiro (BANERJ) from the local government, which gave Bradesco responsibility for
handling the state's civil service payroll. In 2012, it launched Bradesco Next, a hi-tech
'branch of the future' offering personalised financial services via digital avatars,
continuing a strategy of being a regional pioneer in internet and digital banking.
It now has offices in New York, London, Buenos Aires, Mexico City, Grand Cayman,
Hong Kong, London, Luxembourg and Tokyo, and an extended network of
correspondent banks.
In November 2014 the head of Bradesco's Asset Management Unit, Joaquim Levy, was
named Finance Minister in the new cabinet following the re-election of President Dilma
Brazil Commercial Banking Report Q3 2015
© Business Monitor International Ltd Page 41

Rousseff in October. He was replaced by Reinaldo Le Grazie, former head of fixed
income and hedge funds.
Corporate
HighlightsFor the first three quarters of 2014 (latest available figures), Bradesco reported an
impressive 28.2% y-o-y increase in cumulative net income to reach BRL3.95bn, up
from BRL3.08bn in the same period of 2013. This was supported by a 14.5% y-o-y
increase in net interest income over the same nine-month period.
At the end of September 2014, total assets stood at BRL987.4bn, up 8.8% y-o-y from
BRL907.7bn reported in September 2013. Over the same period loans to customers
increased by 7.7% y-o-y to BRL444.2bn, while total deposits were down 2.3% to
BRL211.9bn.
The bank's non-performing loan ratio remained steady at 4.4% as of end-September
2014, while Tier 1 and total capital ratios stood at 12.6% and 16.3%, respectively, at
the same period.
Bradesco has a long-term credit rating of BBB+ at Fitch, Baa1 at Moody's, and BBB- at
Standard & Poor's.
Company Data ■ Website: www.bradesco.com.br■ Status: Private Sector Bank
Table: Stock Market Indicators
2008 2009 2010 2011 2012 2013 2014 17-Apr-2015
Market Capitalisation BRL 65,358 103,389 111,588 107,171 132,166 128,406 145,950 156,157
Market Capitalisation USD 27,981 59,351 67,165 57,452 64,660 54,398 55,123 51,238
Share Price BRL 14.03 22.59 24.63 23.26 26.64 24.24 29.22 31.15
Share Price USD 6.00 12.97 14.83 12.47 13.04 10.27 11.03 10.22
Share Price USD, % change (eop) -53.8 115.9 14.3 -15.9 4.5 -21.2 7.4 n.a.
Change, year-to-date n.a. n.a. n.a. n.a. n.a. n.a. n.a. -7.3
Shares Outstanding (mn) 4,923 5,486 4,966 5,040 5,543 5,036 5,034 n.a.
Source: Bradesco, Bloomberg
Brazil Commercial Banking Report Q3 2015
© Business Monitor International Ltd Page 42

Table: Balance Sheet (BRLmn)
2008 2009 2010 2011 2012 2013 2014
Total Assets 435,290 496,815 621,612 722,087 799,541 838,302 930,451
Loans & Mortgages 164,517 165,362 204,160 245,875 269,021 304,121 328,064
Total Deposits 164,501 171,115 193,203 216,321 210,774 216,218 210,032
Total Shareholders' Equity 37,262 46,110 52,832 59,382 71,346 72,103 82,292
Earnings per share (BRL) 1.43 1.70 1.94 2.18 2.04 2.46 3.04
Source: Bradesco, Bloomberg
Table: Balance Sheet (USDmn)
2008 2009 2010 2011 2012 2013 2014
Total Assets 188,071 285,198 374,465 387,531 390,305 354,852 351,538
Loans & Mortgages 71,081 94,927 122,988 131,957 131,326 128,734 123,947
Total Deposits 71,074 98,229 116,387 116,096 102,892 91,525 79,353
Total Shareholders' Equity 16,099 26,470 31,827 31,869 34,829 30,521 31,091
Earnings per share (USD) 0.79 0.86 1.10 1.30 1.05 1.14 1.30
Source: Bradesco, Bloomberg
Table: Key Ratios (%)
2008 2009 2010 2011 2012 2013 2014
Return on Assets 1.8 2.0 1.7 1.6 1.5 1.5 1.7
Return on Equities 20.9 22.3 19.6 19.6 17.3 17.3 19.9
Loan Deposit Ratio 106.3 105.2 113.5 121.8 137.1 149.8 166.3
Loan Asset Ratio 40.2 36.2 35.3 36.5 36.1 38.6 37.5
Equity Asset Ratio 8.5 9.2 8.5 8.2 8.9 8.6 8.8
Total Risk Based Capital Ratio 16.1 17.8 n.a. 15.1 16.2 16.6 16.6
Tier 1 Capital Ratio 12.9 14.8 n.a. 12.4 11.0 12.3 12.9
Source: Bradesco, Bloomberg
Brazil Commercial Banking Report Q3 2015
© Business Monitor International Ltd Page 43
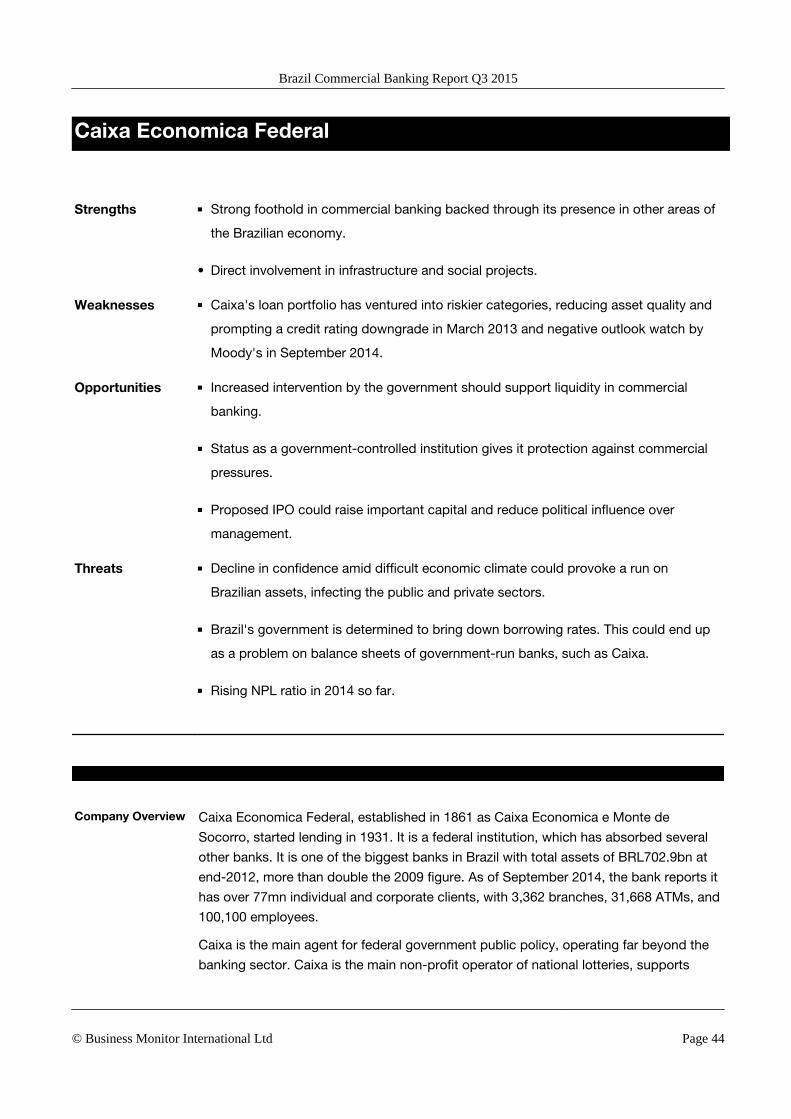
Caixa Economica Federal
SWOT Analysis
Strengths ■ Strong foothold in commercial banking backed through its presence in other areas of
the Brazilian economy.
• Direct involvement in infrastructure and social projects.
Weaknesses ■ Caixa's loan portfolio has ventured into riskier categories, reducing asset quality and
prompting a credit rating downgrade in March 2013 and negative outlook watch by
Moody's in September 2014.
Opportunities ■ Increased intervention by the government should support liquidity in commercial
banking.
■ Status as a government-controlled institution gives it protection against commercial
pressures.
■ Proposed IPO could raise important capital and reduce political influence over
management.
Threats ■ Decline in confidence amid difficult economic climate could provoke a run on
Brazilian assets, infecting the public and private sectors.
■ Brazil's government is determined to bring down borrowing rates. This could end up
as a problem on balance sheets of government-run banks, such as Caixa.
■ Rising NPL ratio in 2014 so far.
Company Overview Caixa Economica Federal, established in 1861 as Caixa Economica e Monte de
Socorro, started lending in 1931. It is a federal institution, which has absorbed several
other banks. It is one of the biggest banks in Brazil with total assets of BRL702.9bn at
end-2012, more than double the 2009 figure. As of September 2014, the bank reports it
has over 77mn individual and corporate clients, with 3,362 branches, 31,668 ATMs, and
100,100 employees.
Caixa is the main agent for federal government public policy, operating far beyond the
banking sector. Caixa is the main non-profit operator of national lotteries, supports
Brazil Commercial Banking Report Q3 2015
© Business Monitor International Ltd Page 44

urban infrastructure projects and manages social programmes such as state benefit
payments. The bank is dominant in the housing sector, with a 67.6% market share.
In December 2014 Brazilian President Dilma Rousseff said Caixa would hold an IPO,
reported Reuters, though she did not indicate when this would occur.
Corporate
HighlightsCaixa posted cumulative net profit of BRL5.3bn in the nine months ending September
2014, up 5.6% compared the same period of 2013. This was supported by a 35.9% y-
o-y increase in revenues over the same period, while operating expenses were up
16.7% y-o-y
The bank held BRL1,019bn in assets at the end of Q314, up 18.6% y-o-y on the
BRL859bn recorded at the same point of 2013. The bank's loan portfolio expanded
24.4% y-o-y over the same period to reach BRL576bn, with strong growth in mortgage
lending (26.1% y-o-y) and credit for infrastructure projects (52.8%).
The non-performing loan ratio inched up to 2.7% by end-September 2014, compared to
2.4% a year earlier. The capital adequacy ratio stood at 15.3%, down from 17.0% a
year earlier, with the Tier 1 capital ratio standing at 12.9%.
At the government's instigation, however, it has ventured into riskier categories, such as
short-term consumer loans, to help kick start the economic recovery. The bank is rated
'BBB' by Fitch and S&P, and 'Baa2' by Moody's, which changed its outlook from stable
to negative in September 2014.
Company Data ■ Website: www.caixa.gov.br■ Status: Public Sector Bank
Table: Balance Sheet (BRLmn)
2008 2009 2010 2011 2012 2013
Total Assets 295,920 341,832 401,412 510,214 703,208 858,325
Loans & Mortgages 21,299 115,516 164,638 233,848 334,022 461,845
Total Deposits 165,528 180,670 215,189 259,829 319,780 360,770
Total Shareholders' Equity 12,705 13,144 15,437 19,561 24,046 35,373
Source: CEF, Bloomberg
Brazil Commercial Banking Report Q3 2015
© Business Monitor International Ltd Page 45

Table: Balance Sheet (USDmn)
2008 2009 2010 2011 2012 2013
Total Assets 127,855 196,230 241,815 273,823 343,279 363,328
Loans & Mortgages 9,203 66,312 99,179 125,502 163,057 195,498
Total Deposits 71,518 103,714 129,632 139,446 156,104 152,713
Total Shareholders' Equity 5,489 7,545 9,299 10,498 11,738 14,973
Source: CEF, Bloomberg
Table: Key Ratios (%)
2008 2009 2010 2011 2012 2013
Return on Assets n.a. 0.9 1.0 1.1 0.9 0.9
Return on Equities n.a. 23.2 26.3 29.6 25.9 22.6
Loan Deposit Ratio n.a. 63.9 n.a. n.a. 110.6 134.6
Loan Asset Ratio n.a. 33.8 n.a. n.a. 50.3 56.6
Equity Asset Ratio 4.3 3.8 3.8 3.8 3.4 4.1
Source: CEF, Bloomberg
Brazil Commercial Banking Report Q3 2015
© Business Monitor International Ltd Page 46
Santander
SWOT Analysis
Strengths ■ Continued expansion is likely to boost income and profit in the medium-to-long term
as it focuses on targeting its services towards Brazil's upper and middle classes.
■ Strong backing of international parent, which has held up well in the financial crisis.
■ The Brazilian economy, the world's sixth largest, continues to provide strong potential
for the Group's business.
Weaknesses ■ Net profit down in 2014.
Opportunities ■ Long-term growth in lending and deposits.
■ Increased lending to small and medium-sized companies (SMEs).
■ In 2011, technology integration and brand unification was completed with Banco
Real. This should help the bank narrow the profitability gap with its local competitors.
■ The currently relatively low penetration of banking products and services in Brazil
represents a major opportunity for commercial banks willing to diversify.
Threats ■ Economic pressures in Brazil could continue to increase provisions and writedowns,
putting downward pressure on profitability.
■ Credit rating placed on negative watch by Moody's due to weakening outlook for
Brazilian economy.
Company Overview Banco Santander Brasil (BSB) established its first commercial office in São Paulo in
1970. In 1982, the bank opened its first office for clients. Since then it has become one
of the largest financial institutions in Brazil through a series of acquisitions. It is the
country's third largest private bank and the largest foreign bank. Within Brazil,
Santander has over 3,400 branches, 17,774 ATMs, 49,481 employees, and 30.8mn
customers. As the largest overseas contributor to profits, Santander Brazil remains
central to the parent group's growth strategy.
Santander's main business areas are retail banking, wholesale banking, asset
management and insurance. It also provides crediting, financing, real estate crediting,
Brazil Commercial Banking Report Q3 2015
© Business Monitor International Ltd Page 47

exchange, insurance and commercial savings services to a range of individual,
commercial and government institutions and agencies.
Technology integration and brand unification with Banco Real was completed
successfully in 2011 and with an optimum commercial banking platform and a wider
range of products and services, left Santander Brazil well placed to carry out its
business. In September 2014, BSB confirmed that it was seeking to acquire 50% of
Superbank, a general use prepaid-card company. Earlier in the year, the bank
purchased card payment processor GetNet Tecnologia for BRL1.1bn.
Corporate
HighlightsIn the first nine months of 2014, Banco Santander Brasil posted net profit of
BRL4.28bn, down slightly from the BRL4.41bn reported in the same period of 2013.
This was largely due to an 8.6% y-o-y fall in net interest income and 2.7% y-o-y rise in
operating expenses.
Total assets at the end of September 2014 were BRL514.9bn, up 10.6% from the
BRL465.4bn at the same point a year earlier. The bank's loan portfolio expanded by
5.6% y-o-y over the same period, driven by growth in corporate lending (up 16.7% y-o-
y).
The bank reported a decline in its non-performing loan (NPL) ratio, from 4.5% at end-
Q313 to 3.7% at end-Q314. Meanwhile, the bank's Core Tier 1 reached 17.3% at end-
September 2014, down from 19.9% a year earlier, largely due to the implementation of
Basel III requirements.
In September 2014, Moody's changed the outlook for Banco Santander's long-term
credit rating (Baa2) to negative, from stable, as part of a deteriorating outlook for all of
Brazil's largest banks. However, Fitch Ratings upgraded the bank's long-term issuer
default rating from BBB to BBB+ in June 2014, following a similar upgrade for the
parent bank.
Company Data ■ Website: www.santander.com/br3
Brazil Commercial Banking Report Q3 2015
© Business Monitor International Ltd Page 48

Table: Stock Market Indicators
2008 2009 2010 2011 2012 2013 2014 17-Apr-2015
Market Capitalisation BRL 19,834 92,047 86,460 60,123 56,133 55,866 48,389 56,280
Market Capitalisation USD 8,491 52,840 52,041 32,231 27,462 23,667 18,276 18,440
Share Price BRL n.a. 21.25 20.05 13.30 13.31 12.43 13.46 15.03
Share Price USD n.a. 12.20 12.06 7.13 6.51 5.26 5.08 4.92
Share Price USD, % change (eop) n.a. n.a. -1.1 -40.9 -8.7 -19.1 -3.4 n.a.
Change, year-to-date n.a. n.a. n.a. n.a. n.a. n.a. n.a. -3.1
Source: Santander, Bloomberg
Table: Balance Sheet (BRLmn)
2008 2009 2010 2011 2012 2013 2014
Total Assets 340,635 315,973 374,663 399,886 422,608 453,053 520,231
Loans & Mortgages 122,149 128,324 151,367 202,757 196,774 212,734 235,690
Total Deposits 123,987 149,440 167,949 174,474 188,595 200,156 220,644
Total Shareholders' Equity 49,157 69,267 73,363 78,032 79,136 81,655 78,683
Source: Santander, Bloomberg
Table: Balance Sheet (USDmn)
2008 2009 2010 2011 2012 2013 2014
Total Assets 147,175 181,385 225,700 214,612 206,301 191,776 196,551
Loans & Mortgages 52,776 73,665 91,185 108,816 96,058 90,050 89,047
Total Deposits 53,570 85,787 101,174 93,637 92,065 84,726 83,363
Total Shareholders' Equity 21,239 39,763 44,195 41,878 38,631 34,565 29,728
Source: Santander, Bloomberg
Brazil Commercial Banking Report Q3 2015
© Business Monitor International Ltd Page 49

Table: Key Ratios (%)
2008 2009 2010 2011 2012 2013 2014
Return on Assets 0.7 1.7 2.1 2.0 1.3 1.3 1.2
Return on Equities 5.4 9.3 10.4 10.2 7.0 7.1 7.1
Loan Deposit Ratio 103.9 92.6 95.6 122.6 111.7 113.0 112.9
Loan Asset Ratio 37.8 43.8 42.9 53.5 49.9 49.9 47.9
Equity Asset Ratio 14.3 21.9 19.6 19.5 18.7 18.0 15.1
Total Risk Based Capital Ratio 14.7 25.6 22.1 19.9 20.8 19.2 17.5
Tier 1 Capital Ratio n.a. 20.7 19.0 17.5 19.3 18.4 16.1
Source: Santander, Bloomberg
Brazil Commercial Banking Report Q3 2015
© Business Monitor International Ltd Page 50

Regional Overview
Latin America Overview
BMI View: Banking sector asset growth will slow in most major Latin American economies in the coming
years, although a two-tiered outlook will emerge. A weaker external environment will pose significant
headwinds to banking sector expansion in Colombia and Brazil, while strengthening private consumption
and low banking sector penetration will see Mexico and Peru buck the trend.
The bulk of the boom in Latin American commercial banking sectors has passed, as weaker real GDP
growth and tightening monetary policy will dampen asset and loan growth while more limited income
increases will dampen deposit growth in most of the region's largest economies (see 'Macroeconomic
Headwinds To Temper Retail Banking Growth', January 20). An environment of lower prices and more
sluggish demand for key commodity exports will weigh on economic activity in several of Latin America's
major metals and oil exporters. This will most significantly temper demand for credit in economies such as
Brazil and Colombia. In addition, a gradual increase in benchmark interest rates in most countries, in line
with monetary policy normalisation in the US, will raise the cost of capital for consumers and businesses.
Brazil Commercial Banking Report Q3 2015
© Business Monitor International Ltd Page 51

Stronger Growth Ahead In Mexico And Peru
Latin America - Average Annual Asset Growth 2010-2014 (Black) & 2015-2019 (Grey), % chg
Note: 2015-2019 figures = BMI forecasts; Source: Respective central banks and national statistical agencies
Some bright spots remain though, as accelerating economic activity and recent reforms will boost asset and
loan growth in Mexico in the coming years. In addition, a rebound in private consumption in Chile on the
back of improved terms of trade and accommodative monetary policy will boost demand for consumer
credit in the coming quarters, while low financial services penetration in Peru will provide long-term
growth opportunities.
Mexico Stands Out
We identify Mexico as our top growth market in Latin America for the commercial banking sector over the
coming years. Strong ties to a strengthening US economy, relatively low banking sector penetration by
regional standards, and reforms aimed at bolstering competition in the sector underpin this view (see
'Macroeconomic Strength To Boost Credit Growth', April 20).
Brazil Commercial Banking Report Q3 2015
© Business Monitor International Ltd Page 52

On The Upswing
Mexico - Banking Sector Loans
Source: CNBV, BMI
Robust US demand for Mexican manufactured goods will boost job creation and feed through to stronger
real private consumption growth in the next several years (see 'Manufacturing And Consumption Will Drive
Stronger Growth', April 9). A recovery in consumer confidence, which dropped sharply in 2014 due to the
imposition of tax hikes on consumer goods, is already feeding through to an uptick in retail sales.
Legislation that passed in 2014 that will reduce interest rates, particularly on consumer loans, will also
bolster consumer credit growth. Meanwhile, the passage of other structural reforms, including the
liberalisation of the energy sector, will support strong demand for commercial loans over the course of our
five-year forecast period.
Brazil Commercial Banking Report Q3 2015
© Business Monitor International Ltd Page 53
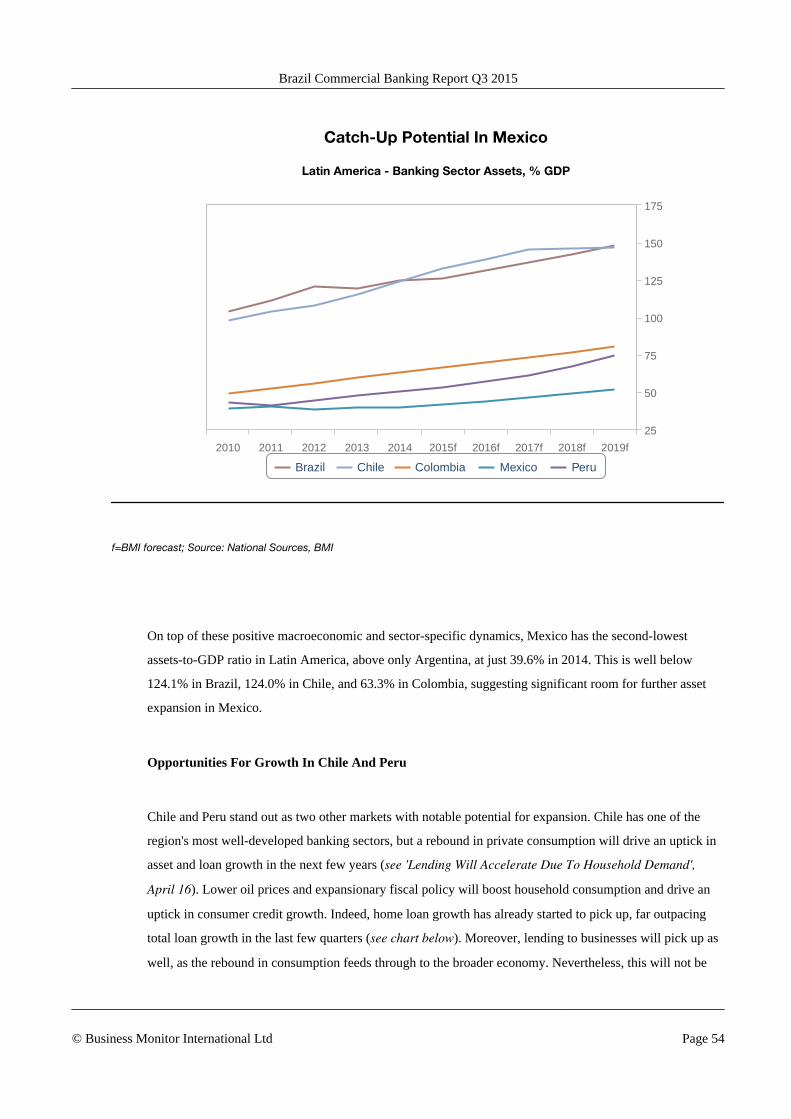
Catch-Up Potential In Mexico
Latin America - Banking Sector Assets, % GDP
Brazil Chile Colombia Mexico Peru
2010 2011 2012 2013 2014 2015f 2016f 2017f 2018f 2019f
25
50
75
100
125
150
175
f=BMI forecast; Source: National Sources, BMI
On top of these positive macroeconomic and sector-specific dynamics, Mexico has the second-lowest
assets-to-GDP ratio in Latin America, above only Argentina, at just 39.6% in 2014. This is well below
124.1% in Brazil, 124.0% in Chile, and 63.3% in Colombia, suggesting significant room for further asset
expansion in Mexico.
Opportunities For Growth In Chile And Peru
Chile and Peru stand out as two other markets with notable potential for expansion. Chile has one of the
region's most well-developed banking sectors, but a rebound in private consumption will drive an uptick in
asset and loan growth in the next few years (see 'Lending Will Accelerate Due To Household Demand',
April 16). Lower oil prices and expansionary fiscal policy will boost household consumption and drive an
uptick in consumer credit growth. Indeed, home loan growth has already started to pick up, far outpacing
total loan growth in the last few quarters (see chart below). Moreover, lending to businesses will pick up as
well, as the rebound in consumption feeds through to the broader economy. Nevertheless, this will not be
Brazil Commercial Banking Report Q3 2015
© Business Monitor International Ltd Page 54

enough to see asset and loan growth surpass their previous highs. We forecast average annual asset growth
of 11.4% over the next five years, below an average expansion of 12.2% between 2010 and 2014.
Housing Sector Driving Credit Growth Pick-Up
Chile - Banking Sector Loan Growth, % chg y-o-y 3mma
Source: BCC, BMI
Peru stands at the other end of the spectrum with the third-lowest assets-to-GDP ratio in Latin America at
50.5%. Slower economic activity will temper demand for credit in the coming years, but we still forecast
moderately stronger average annual asset growth over the next five years than in the previous five. Falling
reserve requirements and loose monetary policy will support loan growth in the next several quarters, before
the central bank begins a gradual hiking cycle in 2016 (see 'Loan Growth To Accelerate, But At A Higher
Financing Cost', March 16). Thereafter, rising access to financial services will help drive average annual
asset growth of 16.2% in the next five years, as compared to an average of 15.1% during the previous five
years.
Slowdown In Play In Colombia And Brazil
Severe macroeconomic headwinds, due in large part to an environment of weaker demand and lower prices
for key commodity exports, will feed through to notably slower loan and deposit growth in Brazil and
Brazil Commercial Banking Report Q3 2015
© Business Monitor International Ltd Page 55
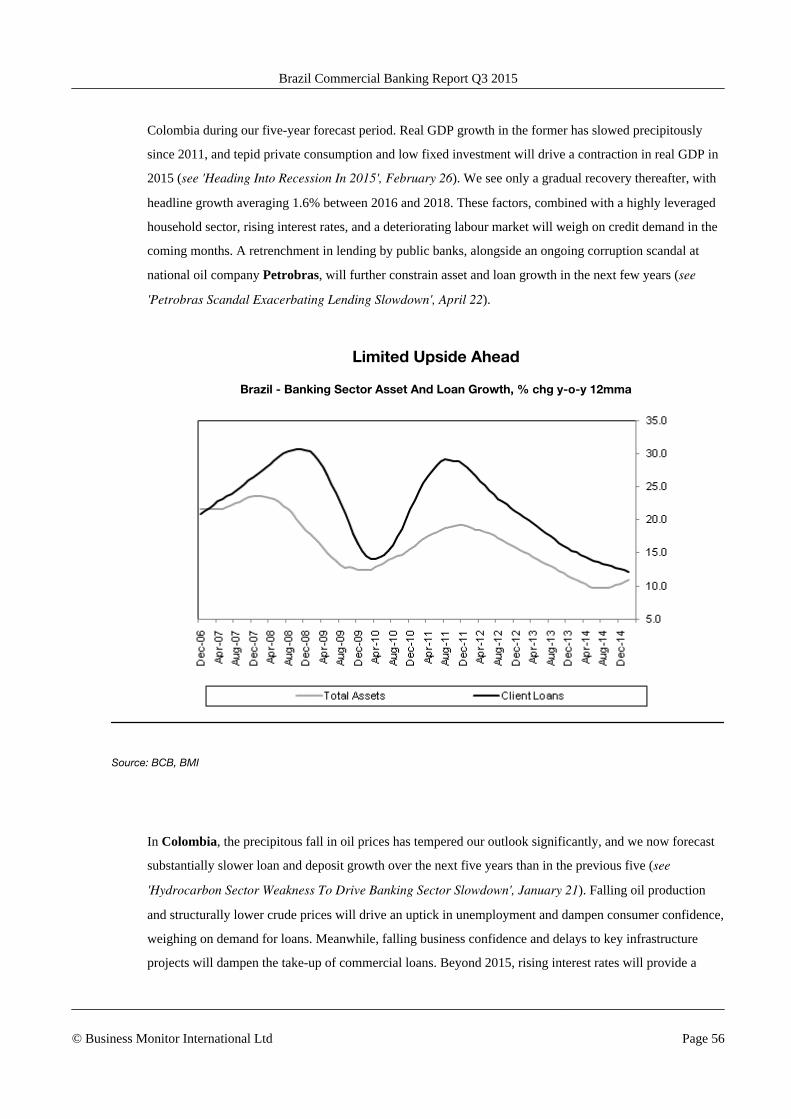
Colombia during our five-year forecast period. Real GDP growth in the former has slowed precipitously
since 2011, and tepid private consumption and low fixed investment will drive a contraction in real GDP in
2015 (see 'Heading Into Recession In 2015', February 26). We see only a gradual recovery thereafter, with
headline growth averaging 1.6% between 2016 and 2018. These factors, combined with a highly leveraged
household sector, rising interest rates, and a deteriorating labour market will weigh on credit demand in the
coming months. A retrenchment in lending by public banks, alongside an ongoing corruption scandal at
national oil company Petrobras, will further constrain asset and loan growth in the next few years (see
'Petrobras Scandal Exacerbating Lending Slowdown', April 22).
Limited Upside Ahead
Brazil - Banking Sector Asset And Loan Growth, % chg y-o-y 12mma
Source: BCB, BMI
In Colombia, the precipitous fall in oil prices has tempered our outlook significantly, and we now forecast
substantially slower loan and deposit growth over the next five years than in the previous five (see
'Hydrocarbon Sector Weakness To Drive Banking Sector Slowdown', January 21). Falling oil production
and structurally lower crude prices will drive an uptick in unemployment and dampen consumer confidence,
weighing on demand for loans. Meanwhile, falling business confidence and delays to key infrastructure
projects will dampen the take-up of commercial loans. Beyond 2015, rising interest rates will provide a
Brazil Commercial Banking Report Q3 2015
© Business Monitor International Ltd Page 56

further headwind to credit demand. Similar factors will weigh on deposit growth, as deteriorating labour
dynamics and high inflation will erode disposable income. In addition, the government's renewal of the
financial transactions tax, which is imposed on withdrawals from checking and savings accounts, will likely
create a disincentive to open new accounts (see ' External Headwinds Will Slow Loan Growth', April 20).
Argentina And Venezuela Do Not Fit The Mould
Argentina and Venezuela will remain regional outliers in the coming years. Double digit inflation will drive
the highest nominal asset growth in the region this year, but assets as a percentage of GDP will continue to
stagnate. An unorthodox macroeconomic policy mix will see these dynamics persist in Venezuela over the
next several years (see 'Inflation-Fuelled Asset Growth Masks Major Headwinds', March 17), while we
have a slightly brighter outlook on the Argentine banking sector post-2015. Following a general election in
October 2015, we expect the next government in Argentina to pivot towards more business-friendly
policies. Efforts to boost investment will result in an end of interest rate caps, and rising gross fixed capital
formation will boost demand for commercial loans.
Chile The Top Of Risk/Reward Index
The maturity of Chile's banking sector, alongside our view for only a moderate slowdown in average asset
and loan growth in the next several years, will see the country retain the top spot in the region in our
Commercial Banking Risk/Reward Index in the coming quarters. These factors will ensure that Chile scores
well in the macroeconomic and industry 'risks' components of our index.
Brazil Commercial Banking Report Q3 2015
© Business Monitor International Ltd Page 57

Chile Will Remain On Top
Latin America - Commercial Banking Risk/Reward Index, Out Of 100
Brazil Chile Colombia Mexico Peru
2010 2011 2012 2013 2014 2015f
50
55
60
65
70
75
Source: BMI
Brazil and Colombia have fallen in our index in the last several quarters, and we see little to suggest that a
rebound is on the cards in light of severe macroeconomic headwinds. In contrast, Mexico, which currently
ranks third in the region, is likely to climb further in our ratings in the coming years, as the country's
economic recovery begins to gain steam and reforms to improve the sector's competitiveness increasingly
bear fruit.
Table: Latin America Banking Sector Assets
Country Indicator 2014 2015f 2016f 2017f 2018f 2019f
ArgentinaTotal assets,ARSmn 1,386,440 1,663,728 2,162,846 2,638,673 3,219,181 3,755,711
ArgentinaTotal assets, %of GDP 33.8 34.7 36.0 37.6 41.2 43.3
ArgentinaTotal assets, %y-o-y 36.9 20.0 30.0 22.0 22.0 16.7
BrazilTotal assets,BRLmn 6,457,831 7,103,614 7,956,048 8,950,554 10,069,373 11,378,391
Brazil Commercial Banking Report Q3 2015
© Business Monitor International Ltd Page 58

Latin America Banking Sector Assets - Continued
Country Indicator 2014 2015f 2016f 2017f 2018f 2019f
BrazilTotal assets, %of GDP 124.2 125.9 130.9 136.5 141.9 147.6
BrazilTotal assets, %y-o-y 11.7 10.0 12.0 12.5 12.5 13.0
ChileTotal assets,CLPmn 180,881,039 208,013,195 232,974,778 263,261,499 285,638,727 309,918,019
ChileTotal assets, %of GDP 124.0 132.7 138.5 144.9 145.8 146.4
ChileTotal assets, %y-o-y 13.9 15.0 12.0 13.0 8.5 8.5
ColombiaTotal assets,COPmn 478,597,495 538,422,182 603,032,844 678,411,949 759,821,383 854,799,056
ColombiaTotal assets, %of GDP 63.3 66.4 69.5 73.2 76.4 80.2
ColombiaTotal assets, %y-o-y 12.6 12.5 12.0 12.5 12.0 12.5
MexicoTotal assets,MXNmn 6,872,937 7,628,960 8,620,725 9,784,523 11,154,356 12,808,919
MexicoTotal assets, %of GDP 39.6 41.4 43.7 46.1 48.9 52.0
MexicoTotal assets, %y-o-y 5.4 11.0 13.0 13.5 14.0 14.8
PeruTotal assets,PENmn 289,482 327,115 372,911 432,576 510,440 612,528
PeruTotal assets, %of GDP 50.5 53.2 56.7 61.2 67.0 74.4
PeruTotal assets, %y-o-y 10.8 13.0 14.0 16.0 18.0 20.0
VenezuelaTotal assets,VEFmn 2,492,324 3,987,718 5,582,805 6,978,507 8,723,133 10,031,603
VenezuelaTotal assets, %of GDP 77.7 78.4 72.4 67.0 67.7 64.1
VenezuelaTotal assets, %y-o-y 63.2 60.0 40.0 25.0 25.0 15.0
e/f = BMI estimate/forecast. Source: National Sources, BMI.
Brazil Commercial Banking Report Q3 2015
© Business Monitor International Ltd Page 59
Global Industry Overview
Global Commercial Banking Outlook
The global outlook for commercial banking remains mixed. Our key theme of developed market
macroeconomic outperformance versus emerging markets (EMs) is broadly playing out in individual
national banking sectors, as reflected by asset and loan growth. The eurozone and US commercial banking
sectors are finally achieving some semblance of lift-off following a difficult period, and we expect loan and
asset growth in both sectors in 2015 following five years of deleveraging. The challenges facing banking
sectors in emerging markets are widely varied, with some sectors in Central and Eastern Europe potentially
impacted by populist government policies, and some African banks restrained by domestic macroeconomic
factors. The tightening of US monetary policy will also impact upon EM banking sectors to varying
degrees, with Asia's banks appearing to be in better shape than their Latin American counterparts for
weathering a more challenging external environment.
US and Eurozone Banking Outlook
Both the US and eurozone banking sectors appear to have decisively turned the corner from a prolonged
period of weakness. Due to structural reforms and regulatory changes, the US banking sector is now the
strongest it has been since the financial crisis of 2008-2009, and we expect that accelerating headline GDP
growth will support continued asset expansion over the coming years. We forecast that asset growth will
reach 6.5% in both 2015 and 2016, in line with historical averages. Banks will increasingly rebalance their
assets towards client loans, as the demand for credit is set to expand in the coming quarters, and non-
performing loan ratios have fallen precipitously since the height of the crisis. The US Federal Reserve (Fed)
concluded its annual 'stress-test' review of the banking system in March, and the results support our view
that the banking sector is much better positioned to absorb exogenous shocks than it has been in recent
years.
Brazil Commercial Banking Report Q3 2015
© Business Monitor International Ltd Page 60
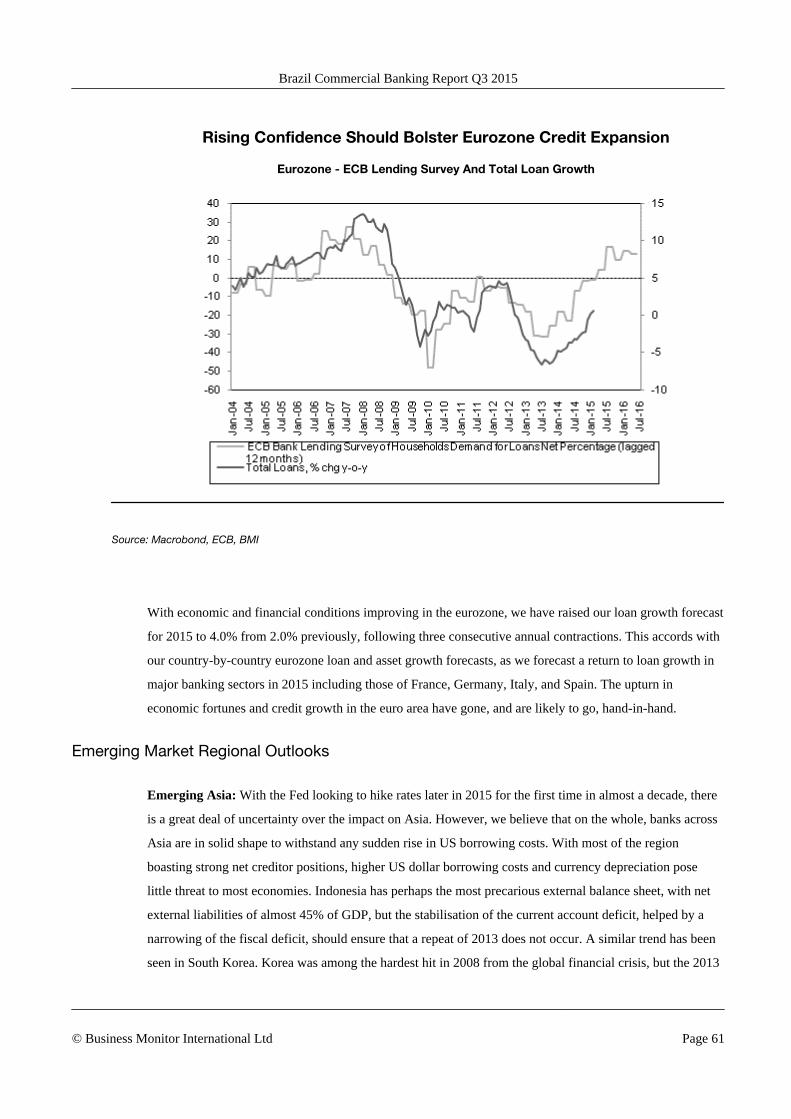
Rising Confidence Should Bolster Eurozone Credit Expansion
Eurozone - ECB Lending Survey And Total Loan Growth
Source: Macrobond, ECB, BMI
With economic and financial conditions improving in the eurozone, we have raised our loan growth forecast
for 2015 to 4.0% from 2.0% previously, following three consecutive annual contractions. This accords with
our country-by-country eurozone loan and asset growth forecasts, as we forecast a return to loan growth in
major banking sectors in 2015 including those of France, Germany, Italy, and Spain. The upturn in
economic fortunes and credit growth in the euro area have gone, and are likely to go, hand-in-hand.
Emerging Market Regional Outlooks
Emerging Asia: With the Fed looking to hike rates later in 2015 for the first time in almost a decade, there
is a great deal of uncertainty over the impact on Asia. However, we believe that on the whole, banks across
Asia are in solid shape to withstand any sudden rise in US borrowing costs. With most of the region
boasting strong net creditor positions, higher US dollar borrowing costs and currency depreciation pose
little threat to most economies. Indonesia has perhaps the most precarious external balance sheet, with net
external liabilities of almost 45% of GDP, but the stabilisation of the current account deficit, helped by a
narrowing of the fiscal deficit, should ensure that a repeat of 2013 does not occur. A similar trend has been
seen in South Korea. Korea was among the hardest hit in 2008 from the global financial crisis, but the 2013
Brazil Commercial Banking Report Q3 2015
© Business Monitor International Ltd Page 61

event barely impacted the domestic banking sector owing to the country's strong current account surplus
and the much lower level of short-term external debt in the banking sector.
Latin America: Banking sector asset growth will slow in most major Latin American economies in the
coming years, although a two-tiered outlook will emerge. A weaker external environment will pose
significant headwinds to banking sector expansion in Colombia and Brazil, while strengthening private
consumption and low banking sector penetration will see Mexico and Peru buck the trend. We also identify
Chile as a market that will see an uptick in asset and loan growth in the coming quarters, as improved terms
of trade and loose monetary policy bolster private consumption and drive stronger demand for credit.
Argentina and Venezuela will have very high inflation-fuelled asset growth but no major movements in
assets as a percentage of GDP. We have a modestly stronger outlook on the Argentine banking sector in the
period following the October 2015 presidential election.
Stronger Growth Ahead In Mexico And Peru
Latin America - Average Annual Asset Growth 2010-2014 (LHS) & 2015-2019 (RHS), % chg
Note: 2015-2019 figures = BMI forecasts; Source: Respective central banks and national statistical agencies
Emerging Europe: Central and Eastern European banking sectors have in recent years been a high-risk
target for populist government policies. However, while we are seeing some indications that the
Brazil Commercial Banking Report Q3 2015
© Business Monitor International Ltd Page 62

environment in typically high policy risk countries such as Hungary could be on the cusp of improving,
risks are growing for historical outperformers such as Poland and Turkey. In Poland, political interference
in the banking sector will become a rising risk in 2015, as the combination of a looming parliamentary
election and a growing financial burden on Swiss franc borrowers draw the authorities into action. In
Turkey, we forecast another year of below average growth for banking sector assets, driven in part by
elevated political risks in the run up to crucial general elections in June.
Still A Lot Of Untapped Potential Across The MENA Region
MENA - Commercial Banks' Asset Growth (Size of Bubble Represents Size Of Total Assets in 2014)
Source: BMI, National Authorities
Middle East and North Africa (MENA): Commercial banks across the MENA region are generally set to
continue growing at a healthy pace over 2015, with rates of asset and credit expansion remaining on par
with the levels recorded since the financial crisis. Lenders in the energy-exporting Gulf economies will
arguably face a more difficult operating environment than in recent years, as lower oil prices and (in some
countries) more stringent regulatory requirements put pressure on balance sheet growth. Yet conversely, the
outlook for financial institutions outside of the Gulf is improving. Stronger economic prospects are set to
bolster lending activity in Egypt and Jordan, while Iranian banks will benefit from the gradual easing of
international sanctions despite a still-tepid macroeconomic backdrop.
Brazil Commercial Banking Report Q3 2015
© Business Monitor International Ltd Page 63
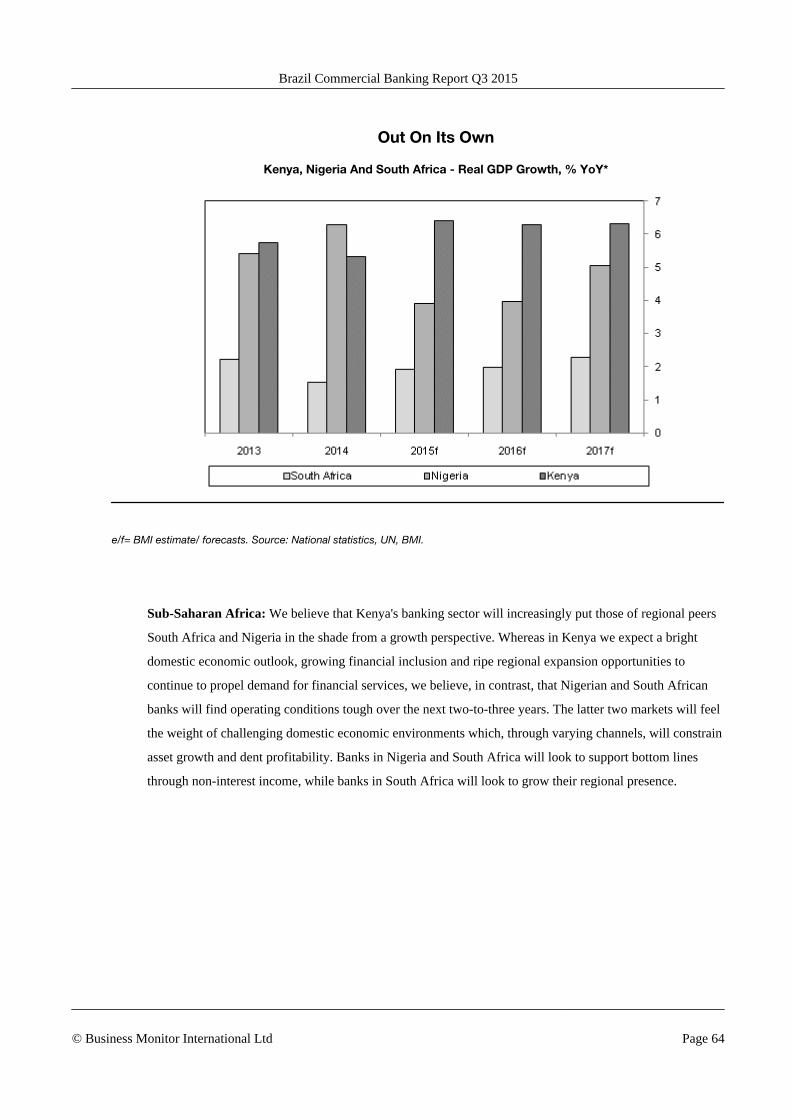
Out On Its Own
Kenya, Nigeria And South Africa - Real GDP Growth, % YoY*
e/f= BMI estimate/ forecasts. Source: National statistics, UN, BMI.
Sub-Saharan Africa: We believe that Kenya's banking sector will increasingly put those of regional peers
South Africa and Nigeria in the shade from a growth perspective. Whereas in Kenya we expect a bright
domestic economic outlook, growing financial inclusion and ripe regional expansion opportunities to
continue to propel demand for financial services, we believe, in contrast, that Nigerian and South African
banks will find operating conditions tough over the next two-to-three years. The latter two markets will feel
the weight of challenging domestic economic environments which, through varying channels, will constrain
asset growth and dent profitability. Banks in Nigeria and South Africa will look to support bottom lines
through non-interest income, while banks in South Africa will look to grow their regional presence.
Brazil Commercial Banking Report Q3 2015
© Business Monitor International Ltd Page 64

Demographic Forecast
Demographic analysis is a key pillar of BMI's macroeconomic and industry forecasting model. Not only
is the total population of a country a key variable in consumer demand, but an understanding of
the demographic profile is essential to understanding issues ranging from future population trends to
productivity growth and government spending requirements.
The accompanying charts detail the population pyramid for 2015, the change in the structure of
the population between 2015 and 2050 and the total population between 1990 and 2050. The tables show
indicators from all of these charts, in addition to key metrics such as population ratios, the urban/rural split
and life expectancy.
Population
(1990-2050)
Brazil - Population, mn
1990
2000
2005
2010
2015
f
2020
f
2025
f
2030
f
2035
f
2040
f
2045
f
2050
f
0
100
200
300
f = BMI forecast. Source: World Bank, UN, BMI
Brazil Commercial Banking Report Q3 2015
© Business Monitor International Ltd Page 65
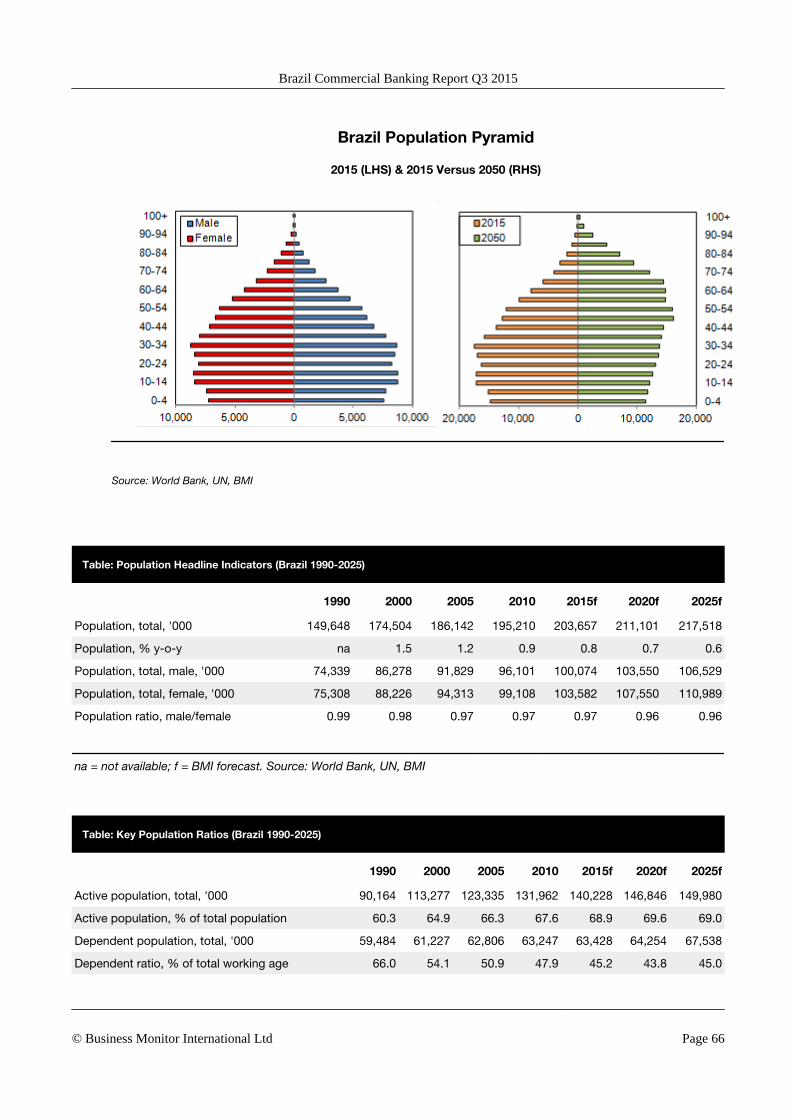
Brazil Population Pyramid
2015 (LHS) & 2015 Versus 2050 (RHS)
Source: World Bank, UN, BMI
Table: Population Headline Indicators (Brazil 1990-2025)
1990 2000 2005 2010 2015f 2020f 2025f
Population, total, '000 149,648 174,504 186,142 195,210 203,657 211,101 217,518
Population, % y-o-y na 1.5 1.2 0.9 0.8 0.7 0.6
Population, total, male, '000 74,339 86,278 91,829 96,101 100,074 103,550 106,529
Population, total, female, '000 75,308 88,226 94,313 99,108 103,582 107,550 110,989
Population ratio, male/female 0.99 0.98 0.97 0.97 0.97 0.96 0.96
na = not available; f = BMI forecast. Source: World Bank, UN, BMI
Table: Key Population Ratios (Brazil 1990-2025)
1990 2000 2005 2010 2015f 2020f 2025f
Active population, total, '000 90,164 113,277 123,335 131,962 140,228 146,846 149,980
Active population, % of total population 60.3 64.9 66.3 67.6 68.9 69.6 69.0
Dependent population, total, '000 59,484 61,227 62,806 63,247 63,428 64,254 67,538
Dependent ratio, % of total working age 66.0 54.1 50.9 47.9 45.2 43.8 45.0
Brazil Commercial Banking Report Q3 2015
© Business Monitor International Ltd Page 66
Key Population Ratios (Brazil 1990-2025) - Continued
1990 2000 2005 2010 2015f 2020f 2025f
Youth population, total, '000 52,802 51,647 51,316 49,762 47,098 44,113 42,799
Youth population, % of total working age 58.6 45.6 41.6 37.7 33.6 30.0 28.5
Pensionable population, '000 6,681 9,580 11,490 13,485 16,330 20,141 24,738
Pensionable population, % of total working age 7.4 8.5 9.3 10.2 11.6 13.7 16.5
f = BMI forecast. Source: World Bank, UN, BMI
Table: Urban/Rural Population & Life Expectancy (Brazil 1990-2025)
1990 2000 2005 2010e 2015f 2020f 2025f
Urban population, '000 110,623.0 141,684.0 154,189.2 164,630.5 174,485.4 183,227.8 190,822.8
Urban population, % of total 73.9 81.2 82.8 84.3 85.7 86.8 87.7
Rural population, '000 39,025.3 32,820.9 31,953.2 30,579.7 29,171.9 27,873.9 26,696.1
Rural population, % of total 26.1 18.8 17.2 15.7 14.3 13.2 12.3
Life expectancy at birth, male,years 62.8 66.5 68.1 69.5 70.9 72.3 73.6
Life expectancy at birth, female,years 70.4 74.2 75.5 76.8 78.1 79.3 80.3
Life expectancy at birth, average,years 66.5 70.3 71.7 73.1 74.5 75.7 77.0
f = BMI forecast. Source: World Bank, UN, BMI
Table: Population By Age Group (Brazil 1990-2025)
1990 2000 2005 2010 2015f 2020f 2025f
Population, 0-4 yrs, total, '000 17,713 17,468 17,324 15,197 14,755 14,293 13,861
Population, 5-9 yrs, total, '000 18,321 16,666 17,370 17,236 15,138 14,706 14,253
Population, 10-14 yrs, total, '000 16,767 17,513 16,621 17,327 17,204 15,113 14,684
Population, 15-19 yrs, total, '000 14,921 18,177 17,384 16,504 17,253 17,137 15,055
Population, 20-24 yrs, total, '000 13,990 16,511 17,913 17,141 16,349 17,105 17,000
Population, 25-29 yrs, total, '000 13,454 14,582 16,240 17,647 16,954 16,181 16,944
Population, 30-34 yrs, total, '000 11,441 13,608 14,328 15,986 17,437 16,765 16,014
Population, 35-39 yrs, total, '000 9,630 13,025 13,359 14,090 15,769 17,219 16,572
Brazil Commercial Banking Report Q3 2015
© Business Monitor International Ltd Page 67
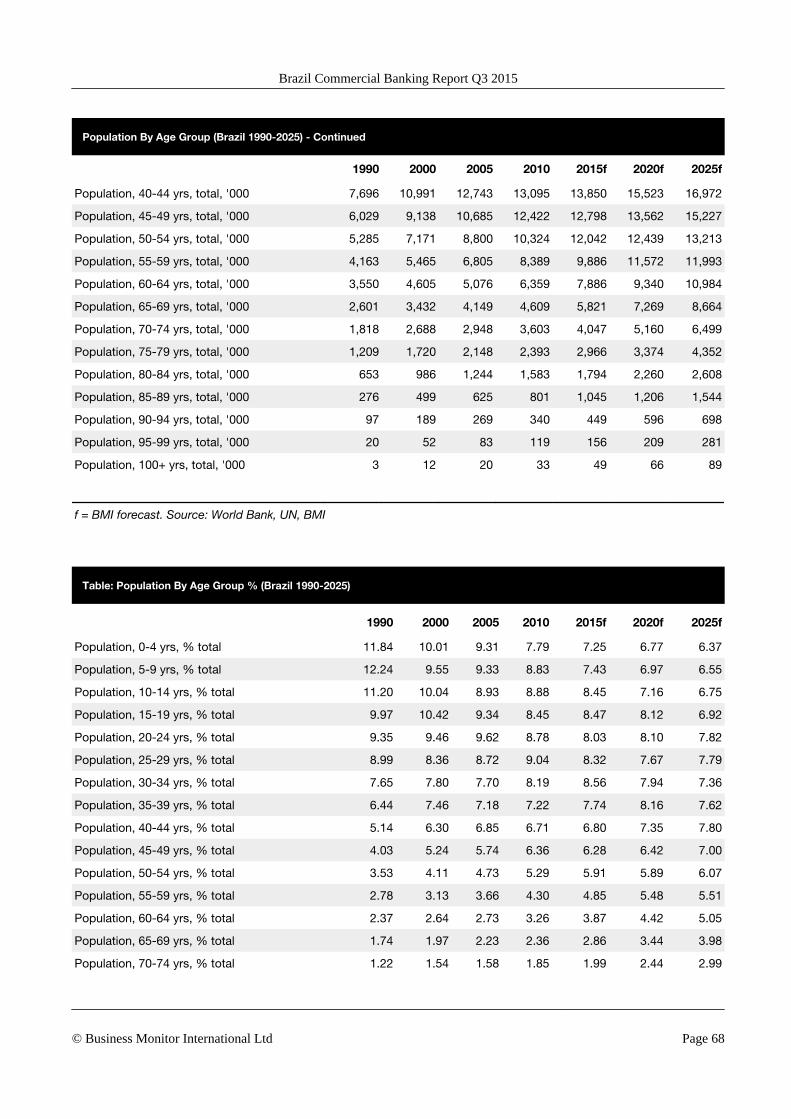
Population By Age Group (Brazil 1990-2025) - Continued
1990 2000 2005 2010 2015f 2020f 2025f
Population, 40-44 yrs, total, '000 7,696 10,991 12,743 13,095 13,850 15,523 16,972
Population, 45-49 yrs, total, '000 6,029 9,138 10,685 12,422 12,798 13,562 15,227
Population, 50-54 yrs, total, '000 5,285 7,171 8,800 10,324 12,042 12,439 13,213
Population, 55-59 yrs, total, '000 4,163 5,465 6,805 8,389 9,886 11,572 11,993
Population, 60-64 yrs, total, '000 3,550 4,605 5,076 6,359 7,886 9,340 10,984
Population, 65-69 yrs, total, '000 2,601 3,432 4,149 4,609 5,821 7,269 8,664
Population, 70-74 yrs, total, '000 1,818 2,688 2,948 3,603 4,047 5,160 6,499
Population, 75-79 yrs, total, '000 1,209 1,720 2,148 2,393 2,966 3,374 4,352
Population, 80-84 yrs, total, '000 653 986 1,244 1,583 1,794 2,260 2,608
Population, 85-89 yrs, total, '000 276 499 625 801 1,045 1,206 1,544
Population, 90-94 yrs, total, '000 97 189 269 340 449 596 698
Population, 95-99 yrs, total, '000 20 52 83 119 156 209 281
Population, 100+ yrs, total, '000 3 12 20 33 49 66 89
f = BMI forecast. Source: World Bank, UN, BMI
Table: Population By Age Group % (Brazil 1990-2025)
1990 2000 2005 2010 2015f 2020f 2025f
Population, 0-4 yrs, % total 11.84 10.01 9.31 7.79 7.25 6.77 6.37
Population, 5-9 yrs, % total 12.24 9.55 9.33 8.83 7.43 6.97 6.55
Population, 10-14 yrs, % total 11.20 10.04 8.93 8.88 8.45 7.16 6.75
Population, 15-19 yrs, % total 9.97 10.42 9.34 8.45 8.47 8.12 6.92
Population, 20-24 yrs, % total 9.35 9.46 9.62 8.78 8.03 8.10 7.82
Population, 25-29 yrs, % total 8.99 8.36 8.72 9.04 8.32 7.67 7.79
Population, 30-34 yrs, % total 7.65 7.80 7.70 8.19 8.56 7.94 7.36
Population, 35-39 yrs, % total 6.44 7.46 7.18 7.22 7.74 8.16 7.62
Population, 40-44 yrs, % total 5.14 6.30 6.85 6.71 6.80 7.35 7.80
Population, 45-49 yrs, % total 4.03 5.24 5.74 6.36 6.28 6.42 7.00
Population, 50-54 yrs, % total 3.53 4.11 4.73 5.29 5.91 5.89 6.07
Population, 55-59 yrs, % total 2.78 3.13 3.66 4.30 4.85 5.48 5.51
Population, 60-64 yrs, % total 2.37 2.64 2.73 3.26 3.87 4.42 5.05
Population, 65-69 yrs, % total 1.74 1.97 2.23 2.36 2.86 3.44 3.98
Population, 70-74 yrs, % total 1.22 1.54 1.58 1.85 1.99 2.44 2.99
Brazil Commercial Banking Report Q3 2015
© Business Monitor International Ltd Page 68
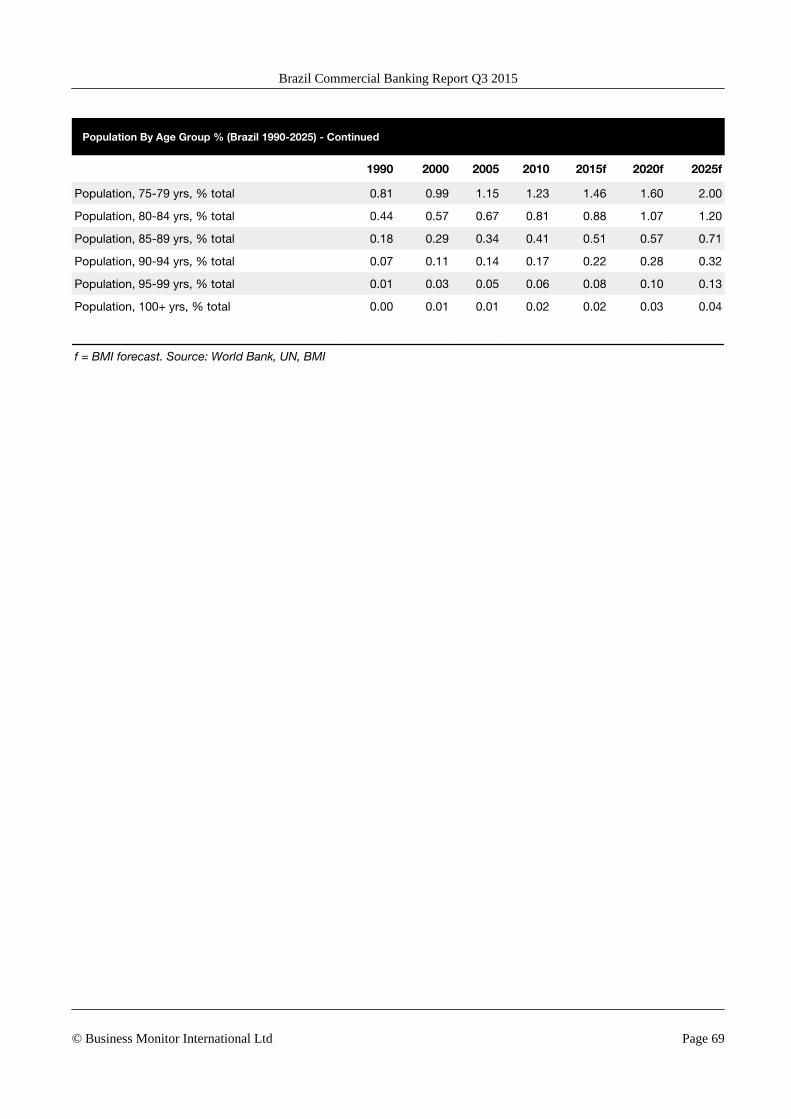
Population By Age Group % (Brazil 1990-2025) - Continued
1990 2000 2005 2010 2015f 2020f 2025f
Population, 75-79 yrs, % total 0.81 0.99 1.15 1.23 1.46 1.60 2.00
Population, 80-84 yrs, % total 0.44 0.57 0.67 0.81 0.88 1.07 1.20
Population, 85-89 yrs, % total 0.18 0.29 0.34 0.41 0.51 0.57 0.71
Population, 90-94 yrs, % total 0.07 0.11 0.14 0.17 0.22 0.28 0.32
Population, 95-99 yrs, % total 0.01 0.03 0.05 0.06 0.08 0.10 0.13
Population, 100+ yrs, % total 0.00 0.01 0.01 0.02 0.02 0.03 0.04
f = BMI forecast. Source: World Bank, UN, BMI
Brazil Commercial Banking Report Q3 2015
© Business Monitor International Ltd Page 69

Methodology
Industry Forecast Methodology
BMI's industry forecasts are generated using the best-practice techniques of time-series modelling and
causal/econometric modelling. The precise form of model we use varies from industry to industry, in each
case being determined, as per standard practice, by the prevailing features of the industry data being
examined.
Common to our analysis of every industry is the use of vector autoregressions, which allow us to forecast a
variable using more than the variable's own history as explanatory information. For example, when
forecasting oil prices, we can include information about oil consumption, supply and capacity.
When forecasting for some of our industry sub-component variables, however, using a variable's own
history is often the most desirable method of analysis. Such single-variable analysis is called univariate
modelling. We use the most common and versatile form of univariate models: the autoregressive moving
average model (ARMA).
In some cases, ARMA techniques are inappropriate because there is insufficient historic data or data quality
is poor. In such cases, we use either traditional decomposition methods or smoothing methods as a basis for
analysis and forecasting.
We mainly use OLS estimators, and in order to avoid relying on subjective views and encourage the use of
objective views, we use a 'general-to-specific' method. BMI mainly uses a linear model, but simple non-
linear models, such as the log-linear model, are used when necessary. During periods of 'industry shock', for
example poor weather conditions impeding agricultural output, dummy variables are used to determine the
level of impact.
Effective forecasting depends on appropriately selected regression models, BMI selects the best model
according to various different criteria and tests, including but not exclusive to:
■ R2 tests explanatory power; adjusted R2 takes degree of freedom into account;
■ Testing the directional movement and magnitude of coefficients;
■ Hypothesis testing to ensure coefficients are significant (normally t-test and/or P-value); and
■ All results are assessed to alleviate issues related to auto-correlation and multi-collinearity.
Brazil Commercial Banking Report Q3 2015
© Business Monitor International Ltd Page 70

Human intervention plays a necessary and desirable role in all of our industry forecasting. Experience,
expertise and knowledge of industry data and trends ensure analysts spot structural breaks, anomalous data,
turning points and seasonal features where a purely mechanical forecasting process would not.
Sector-Specific Methodology
BMI's Commercial Banking Report series is closely integrated with our analysis of country risk,
macroeconomic trends and financial markets. The reports draw heavily on our extensive economic dataset,
which includes up to 550 indicators per country, as well as our in depth view of each local market. We
collate our commercial banking databank from official sources (including central banks and regulators)
wherever possible, and only fall back on secondary sources where all attempts to secure primary data have
failed. Company data is sourced, in the first instance, from company reports, with central bank, regulator or
trade association data only used as a backup.
■ The reports focus on total assets, client loans and client deposits.
■ Total assets are analogous to the combined balance sheet assets of all commercial banks in a particularcountry. They do not incorporate the balance sheet of the central bank of the country in question.
■ Client loans are loans to non-bank clients. They include loans to public sector and state-ownedenterprises. However, they generally do not include loans to governments, government (or non-government) bonds held or loans to central banks.
■ Client deposits are deposits from the non-bank public. They generally include deposits from public sectorand state-owned enterprises. However, they only include government deposits if these are significant.
■ We take into account capital items and bond portfolios. The former include shareholders funds, andsubordinated debt that may be counted as capital. The latter includes government and non-governmentbonds.
In quantifying the collective balance sheets of a particular country, we assume that three equations hold
true:
■ Total assets = total liabilities and capital;
■ Total assets = client loans + bond portfolio + other assets;
■ Total liabilities and capital = capital items + client deposits + other liabilities.
In terms of the equations, other assets and other liabilities are balancing items that ensure equations two and
three can be reconciled with equation one. In practice, other assets and other liabilities are analogous to
inter-bank transactions. In some cases, such transactions are generally with foreign banks.
In most countries for which we have compiled figures, building societies/thrifts are an insignificant part of
the banking landscape, and we do not include them in our figures. The US is the main exception to this.
Brazil Commercial Banking Report Q3 2015
© Business Monitor International Ltd Page 71
In some cases, total assets and client loans include significant amounts that are owned or that have been lent
to customers in another country. In some cases, client deposits include significant amounts that have been
deposited by residents of another country. Such cross-border business is particularly important in major
financial centres such as Singapore and Hong Kong, the richer OECD countries and certain countries in
Central and Eastern Europe.
Risk/Reward Ratings Methodology
BMI's Risk/Reward Ratings (RRR) provide a comparative regional ranking system evaluating the ease of
doing business and the industry-specific opportunities and limitations for potential investors in a given
market. The RRR system divides into two distinct areas:
Rewards: Evaluation of sector's size and growth potential in each state, and also broader industry/state
characteristics that may inhibit its development. This is further broken down into two sub categories:
■ Industry Rewards. This is an industry-specific category that takes into account current industry size andgrowth forecasts, the openness of market to new entrants and foreign investors, to provide an overallscore for potential returns for investors.
■ Country Rewards. This is a country-specific category, and the score factors in favourable political andeconomic conditions for the industry.
Risks: Evaluation of industry-specific dangers and those emanating from the state's political/economic
profile that call into question the likelihood of anticipated returns being realised over the assessed time
period. This is further broken down into two sub categories:
■ Industry Risks. This is an industry-specific category whose score covers potential operational risks toinvestors, regulatory issues inhibiting the industry, and the relative maturity of a market.
■ Industry Risks. This is a country-specific category in which political and economic instability, legislationand overall business environment are evaluated to provide an overall score.
We take a weighted average, combining industry and country risks, or industry and country rewards. These
two results in turn provide an overall Risk/Reward Rating, which is used to create our regional ranking
system for the risks and rewards of involvement in a specific industry in a particular country.
For each category and sub-category, each state is scored out of 100 (100 being the best), with the overall
risk/reward rating a weighted average of the total score. Importantly, as most of the countries and territories
evaluated are considered by BMI to be 'emerging markets', our rating is revised on a quarterly basis. This
ensures that the rating draws on the latest information and data across our broad range of sources, and the
expertise of our analysts.
Brazil Commercial Banking Report Q3 2015
© Business Monitor International Ltd Page 72
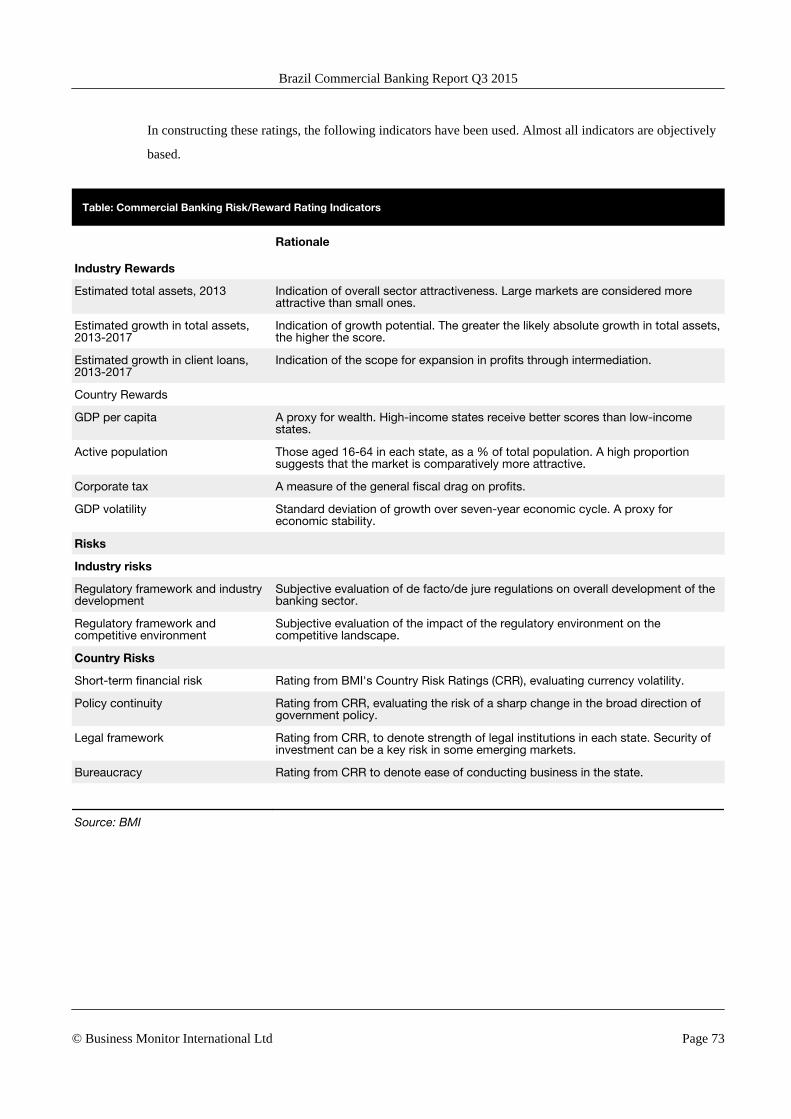
In constructing these ratings, the following indicators have been used. Almost all indicators are objectively
based.
Table: Commercial Banking Risk/Reward Rating Indicators
Rationale
Industry Rewards
Estimated total assets, 2013 Indication of overall sector attractiveness. Large markets are considered moreattractive than small ones.
Estimated growth in total assets,2013-2017
Indication of growth potential. The greater the likely absolute growth in total assets,the higher the score.
Estimated growth in client loans,2013-2017
Indication of the scope for expansion in profits through intermediation.
Country Rewards
GDP per capita A proxy for wealth. High-income states receive better scores than low-incomestates.
Active population Those aged 16-64 in each state, as a % of total population. A high proportionsuggests that the market is comparatively more attractive.
Corporate tax A measure of the general fiscal drag on profits.
GDP volatility Standard deviation of growth over seven-year economic cycle. A proxy foreconomic stability.
Risks
Industry risks
Regulatory framework and industrydevelopment
Subjective evaluation of de facto/de jure regulations on overall development of thebanking sector.
Regulatory framework andcompetitive environment
Subjective evaluation of the impact of the regulatory environment on thecompetitive landscape.
Country Risks
Short-term financial risk Rating from BMI's Country Risk Ratings (CRR), evaluating currency volatility.
Policy continuity Rating from CRR, evaluating the risk of a sharp change in the broad direction ofgovernment policy.
Legal framework Rating from CRR, to denote strength of legal institutions in each state. Security ofinvestment can be a key risk in some emerging markets.
Bureaucracy Rating from CRR to denote ease of conducting business in the state.
Source: BMI
Brazil Commercial Banking Report Q3 2015
© Business Monitor International Ltd Page 73
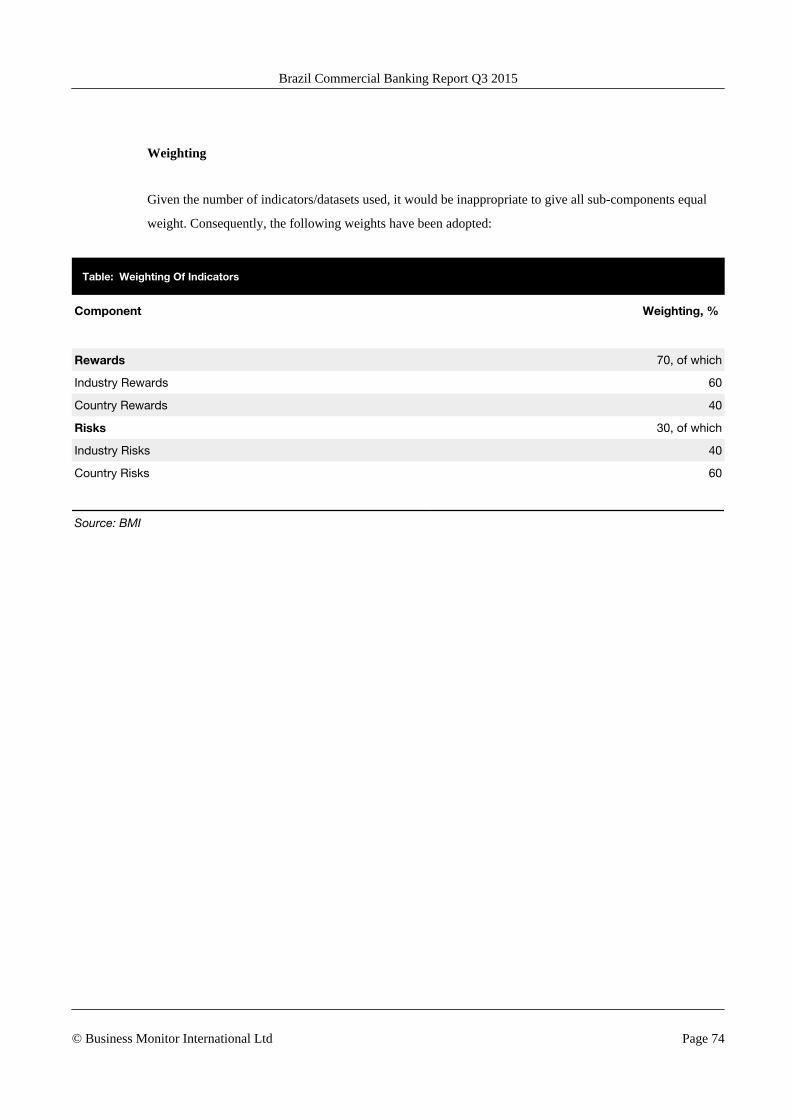
Weighting
Given the number of indicators/datasets used, it would be inappropriate to give all sub-components equal
weight. Consequently, the following weights have been adopted:
Table: Weighting Of Indicators
Component Weighting, %
Rewards 70, of which
Industry Rewards 60
Country Rewards 40
Risks 30, of which
Industry Risks 40
Country Risks 60
Source: BMI
Brazil Commercial Banking Report Q3 2015
© Business Monitor International Ltd Page 74

Copyright of Brazil Commercial Banking Report is the property of Business MonitorInternational and its content may not be copied or emailed to multiple sites or posted to alistserv without the copyright holder's express written permission. However, users may print,download, or email articles for individual use.