Brassica Growers Association Coverage Report · December Waitrose Kitchen Print Yes Brussels...
320
Brassica Growers Association Coverage Report Date Publication Type Campaign message URL/Description Picture Digital: Unique Users Print: Circulation 03/06/2014 FPJ Online Yes EU funding - http://www.fruitnet.com/fpj/article/161693/b rassica-growers-association-in-eu-funding- boost Yes 30,000 03/06/2014 Fresh Plaza Online Yes EU funding - http://www.freshplaza.com/article/121527/Bras sicas-backed-by-European-Union-funding No Not available 01/06/2014 The Grocer Online and in magazine Yes EU funding - http://www.thegrocer.co.uk/fmcg/fresh/brassica- campaign-wins-eu-support/357918.article No 237,269 30,563 03/06/2014 Farmer's Weekly Online Yes EU funding - http://www.fwi.co.uk/articles/03/06/2014/14484 4/brassica-campaign-wins-share-of-16323m-eu- funds.htm No 324,524 03/06/2014 Horticulture Week Online Yes EU funding - http://www.hortweek.com/Edibles/article/12971 84/brassica-growers-sole-uk-winner-eu- marketing-millions/ No TBC 06/06/2014 Red Fox Executive (sector recruitment) Online Yes EU funding - http://www.redfoxexecutive.com/3/industry- news-and-commentary/post/5562/brassicas- backed-by-european-union-funding No Not available 10/06/2014 Shropshire Review Print and Online No Summer salads - http://issuu.com/reviewmedia/docs/shropshire_ review_june_2014 Yes 11,000 18/06/2014 So Darling Online No Summer salads - http://sodarling.co.uk/2014/06/17/its-all-good/ Yes TBC 20/06/2014 Woman's World Online No Summer salads - http://womans- world.co.uk/index.php/recipes/1653-summer- salad-recipe-4098324 Yes 6,000 1
Transcript of Brassica Growers Association Coverage Report · December Waitrose Kitchen Print Yes Brussels...

Brassica Growers Association Coverage Report
Date Publication Type Campaign message URL/Description Picture Digital: Unique Users Print: Circulation
03/06/2014 FPJ Online Yes
EU funding -
http://www.fruitnet.com/fpj/article/161693/b
rassica-growers-association-in-eu-funding-
boost
Yes 30,000
03/06/2014 Fresh Plaza Online Yes
EU funding -
http://www.freshplaza.com/article/121527/Bras
sicas-backed-by-European-Union-funding
No Not available
01/06/2014 The GrocerOnline and in
magazineYes
EU funding -
http://www.thegrocer.co.uk/fmcg/fresh/brassica-
campaign-wins-eu-support/357918.article
No 237,269 30,563
03/06/2014 Farmer's Weekly Online Yes
EU funding -
http://www.fwi.co.uk/articles/03/06/2014/14484
4/brassica-campaign-wins-share-of-16323m-eu-
funds.htm
No 324,524
03/06/2014 Horticulture Week Online Yes
EU funding -
http://www.hortweek.com/Edibles/article/12971
84/brassica-growers-sole-uk-winner-eu-
marketing-millions/
No TBC
06/06/2014Red Fox Executive
(sector recruitment)Online Yes
EU funding -
http://www.redfoxexecutive.com/3/industry-
news-and-commentary/post/5562/brassicas-
backed-by-european-union-funding
No Not available
10/06/2014 Shropshire Review Print and Online No
Summer salads -
http://issuu.com/reviewmedia/docs/shropshire_
review_june_2014
Yes 11,000
18/06/2014 So Darling Online NoSummer salads -
http://sodarling.co.uk/2014/06/17/its-all-good/Yes TBC
20/06/2014 Woman's World Online No
Summer salads - http://womans-
world.co.uk/index.php/recipes/1653-summer-
salad-recipe-4098324
Yes 6,000
1

Brassica Growers Association Coverage Report
31/07/2014 Kitchen Goddess Online No
Swede cake recipe -
http://www.kitchengoddess.co.uk/recipe/swede-
cake/#.U_WpZ1a6jHg
Yes 75,000
20/08/2014 Foodepedia Online No
New recipes -
http://www.foodepedia.co.uk/recipes/2014/aug/
Love_your_greens_great_recipes.htm
Yes TBC
21/08/2014 Kitchen Goddess Online No
Cabbage 'slaw -
http://www.kitchengoddess.co.uk/recipe/cabba
ge-fennel-slaw/#.U_Xl_Va6jHg
Yes 75,000
21/08/2014 Kitchen Goddess Online No
Kale tabouli -
http://www.kitchengoddess.co.uk/recipe/kale-
tabouli-salad/#.U_Xoq1a6jHg
Yes 75,000
21/08/2014 Kitchen Goddess Online No
Roasted vegetables -
http://www.kitchengoddess.co.uk/recipe/roaste
d-broccoli-cauliflower-lemon-
garlic/#.U_XowVa6jHg
Yes 75,000
25/08/2014 Fresh Plaza Online No
Feastival -
http://www.freshplaza.com/print.asp?id=12586
4
No Not available
26/08/2014 FPJ Online Yes
Feastival -
http://www.fruitnet.com/fpj/article/162498/only-
the-top-brass-for-jamies-feastival
Yes 30,000
11/09/2014 Women Talking Online Yes
New recipes -
http://www.womentalking.co.uk/topics/food-
focus/love-your-greens
Yes35,000 subscribers, 8,000
DAILY visitors
11/09/2014 Woman's World Online Yes
Roasted vegetables - http://womans-
world.co.uk/index.php/recipes/1709-roasted-
broccoli-and-cauliflower-recipe-3409723
Yes 6,000
02/10/2014 Woman's World Online Yes
Kale Tabouli Salad - http://womans-
world.co.uk/index.php/recipes/1739-kale-
tabouli-salad-recipe-340982
Yes 6,000
07/10/2014GoodToKnowRecip
esPrint Yes Swede Wedges recipe Yes 21,946
2

Brassica Growers Association Coverage Report
20/10/2014Countryside
magazinePrint Yes Sprout crush and pumpkin roast recipes Yes 36,383
07/11/2014 The Guardian Digital No
Sprouts and kale make a comeback as
green renaissance sees sales soar
http://www.theguardian.com/lifeandstyle/2014/n
ov/07/sprouts-curly-kale-sales-green-veg
Yes 113,946,305
07/11/2014 The Guardian Digital No
Time has arrived for reacquainting yourself
with brussels sprouts
http://www.theguardian.com/lifeandstyle/2014/n
ov/07/brussels-sprouts-roast-cooking-felicity-
cloake
Yes 113,946,305
21/11/2014Food Lover
MagazineDigital No Sprout image and feature Yes TBC
18/11/2014Fresh Produce
ConsortiumDigital Yes
Redarling Sprouts
http://freshproduce.org.uk/newsdesk/fpc-
newsdesk/2014/november/coloured-brussels-
sprouts-ready-for-christmas/
Yes TBC
19/11/2014 Fresh Plaza Digital Yes
Redarling sprouts
http://www.freshplaza.com/article/131210/UK-
New-sprout-variety-set-to-be-darling-of-
Christmas-dinner
Yes Not available
27/11/2014 Scarborough News Print Yes Finishing Touches Yes 9,914
27/11/2014 The Times Print Yes Cauli? It's the new kale Yes 389,135
28/11/2014 FPJ Print NoRedarling sprouts - 'Purple patch for
leading retailers'Yes 15,000
28/11/2014 Coventry Telegraph Print Yes Cracking way to use up leftover sprouts Yes 22,537
28/11/2014Nuneaton
TelegraphPrint Yes Cracking way to use up leftover sprouts Yes 1,597
December Waitrose Kitchen Print Yes Brussels sprouts feature Yes 680,925
01/12/2014 Cook Vegetarian Print Yes Brussels sprouts feature with recipes Yes 50,000
03/12/2014 The Times Print Yes More sprouts please - it's a bumper crop No 389,135
3

Brassica Growers Association Coverage Report
05/12/2014 The Daily Mail Print No
More sprouts for everyone - bumper crop of
sprouts this year, comment from Matt
Rawson
No 1,692,610
05/12/2014 Scottish Daily Mail Print Yes More Sprouts for everyone! No 90,121
09/12/2014 BBC Radio 2 Broadcast: radio NoBrassica vegetables for Christmas, dietician
discussing nutritional benefits No TBC
09/12/2014West Country Food
LoverPrint Yes
Swede Rosti recipe (Page 12) and Creamed
Brussels Sprouts with Nutmeg (Page 34/35)
http://content.yudu.com/Library/A37ucs/FOODL
OVERIssue25/resources/index.htm?referrerUrl
=http%3A%2F%2Ffree.yudu.com%2Fitem%2F
details%2F2483514%2FFOODLOVER-Issue-
25
Yes TBC
08/12/2014 The Telegraph Digital No
Hate Brussels Sprouts? Try these lovely
recipes!
http://www.telegraph.co.uk/foodanddrink/recipe
s/11274184/Hate-Brussels-sprouts-Try-these-
lovely-Christmas-recipes.html 71,077,047
11/12/2014Food Lover
MagazineDigital No
Creamed Sprouts with Nutmeg recipe
http://www.foodlovermagazine.com/recipes/cre
amed-sprouts/8639
Yes
10/12/2014 BBC Radio 4 Broadcast - radio Yes
Sprouts - John Mason, Lincolnshire Field
Products
http://www.bbc.co.uk/programmes/b04tlfrm
N/A10,621,000 listeners per
week
11/12/2014 BBC Radio 4 Broadcast - radio YesBrassicas as feed for livestock
http://www.bbc.co.uk/programmes/b04tlggtN/A
10,621,000 listeners per
week
4

Brassica Growers Association Coverage Report
17/12/2014 FPJ Digital Yes
Sprouts set to rub shoulders with Dr Who
on Xmas TV
http://www.fruitnet.com/fpj/article/163681/sprout
s-rub-shoulders-with-dr-who-on-xmas-tv-
schedule
Yes 30,000
18/12/2014 FPC Digital Yes
Brussels sprouts become TV stars
http://www.freshproduce.org.uk/newsdesk/fpc-
newsdesk/2014/december/brussels-sprouts-
become-tv-stars/
Yes TBC
18/12/2014 Fresh Plaza Digital Yes Sprouts to star on Christmas TV Yes Not available
19/12/2014 LoveFood Digital Yes
Taste test: The best variety of Brussels
sprouts
http://www.lovefood.com/journal/opinions/4578
7/taste-test-the-best-variety-of-brussels-sprouts
Yes
19/12/2014 BBC Radio 2 Broadcast Yes Sprouts - Richard Mowbray N/A TBC
19/12/2014 Independent Digital Yes
Christmas food: how to make Brussels
sprouts taste good
http://www.independent.co.uk/life-style/food-
and-drink/features/christmas-food-how-to-make-
brussels-sprouts-taste-good-9925158.html
Yes 53,371,326
21/12/2014 Independent Digital Yes
Bumper Brussels: Sprouts set to be biggest
in10 years after near-perfect growing
conditions http://www.independent.co.uk/life-
style/food-and-drink/news/bumper-brussels-
sprouts-set-to-be-biggest-in-10-years-after-
nearperfect-growing-conditions-
9937807.html?origin=internalSearch
Yes 53,371,326
21/12/2014 Independent Print Yes Brussels with muscle Yes 60,754
5

Brassica Growers Association Coverage Report
21/12/2014 Countryfile Broadcast - TV Yes
Countryfile Christmas special - looking at the
importance of migrant workers to Brassica
growers, enjoying an alternative Polish
Christmas dinner with one of Martin Haines'
workers
N/A7.14 million viewers (week
of 9th Nov)
22/12/2014 Daily Mail Digital No
2014, the year of the monster sprout: sunny
autumn has made festive veg a third larger
http://www.dailymail.co.uk/sciencetech/article-
2883367/2014-year-MONSTER-SPROUT-
Sunny-autumn-festive-veg-larger.html
Yes 192,629,464
24/12/2014 The Sun Print Yes Brussels buys Brit sprouts Yes 1,931,640
24/12/2014 Scottish Sun Print Yes Brussels buys Brit sprouts Yes 257,909
24/12/2014 Daily Star Print Yes Best Xmas for a decade Yes 438,307
24/12/2014 Daily Star Digital Yes
Economic boom means Brits get biggest
Christmas blowout in a decade
http://www.dailystar.co.uk/news/latest-
news/416905/Brits-get-set-for-biggest-
Christmas-blowout-in-a-decade
Yes 11,567,787
24/12/2014 Reveal Digital Yes
Chilli Sprout Stir Fry
http://www.reveal.co.uk/lifestyle/recipes/a61774
0/christmas-leftovers-make-this-tasty-chilli-
sprout-stir-fry.html
Yes 389,031
28/12/2014 Reveal Digital Yes
The Ultimate Cauliflower Cheese
http://www.reveal.co.uk/lifestyle/recipes/a61672
7/the-ultimate-recipe-for-cauliflower-cheese-
ideal-with-festive-roasts.html
Yes 389,031
09/01/2015 Horticulture Week Print Yes
Adapting to changes in the marketplace -
Love Your Greens is succeeding in raising
demand for brassicas.
Yes 6,295
10/01/2015 The Grocer Print YesFestive Flops - has price war taken its toll
on festive faves?Yes 30,356
16/01/2015 First News Print Yes Tuck In recipe competition Yes 70,686
6

Brassica Growers Association Coverage Report
16/01/2015 First News Digital Yes
Tuck In recipe competition
http://www.firstnews.co.uk/featuredpartners?id=
32 Yes 50,000
19/01/2015 FPJ Digital Yes
CBBC star unveiled as new face of
Brassicas
http://www.fruitnet.com/fpj/article/163954/cbbc-
star-unveiled-as-new-face-of-brassicas
Yes 30,000
19/01/2015 FPJ Digital Yes
Truss gets taste of hands-free tractor on
veg grower visit
http://www.fruitnet.com/fpj/article/163957/truss-
gets-taste-of-hands-free-tractor-on-veg-grower-
visit
Yes 30,000
19/01/2015 Fresh Plaza Digital Yes
Cauliflower growers demonstrate 'hands-
free' tractors
http://www.freshplaza.com/article/133943/UK-
Cauliflower-growers-demonstrate-hands-free-
tractors
Yes TBC
21/01/2015 FACE newsletter Digital Yes Tuck In competition Yes
02/02/2015 Independent Digital No
Move over kale - cabbage is the new rising
star http://www.independent.co.uk/life-
style/food-and-drink/features/move-over-kale--
cabbage-is-the-new-rising-star-
10012121.html?origin=internalSearch
Yes 53,371,326
02/02/2015 Primary Times Digital Yes
Aaron Craze Launches Love Your Greens
Recipe Competition -
http://www.primarytimes.net/news/2015/02/aaro
n-craze-launches-love-your-greens-cookery-
competition-
Yes TBC
04/02/2015 Emerald Street Digital Yes Newsletter mention for cauliflowers Yes Over 100,000 subscribers
05/02/2015 Cook Vegetarian Print Yes
Broccoli - 'If someone needed swaying on
this ingredient, I’d make an enthusiastic
advocate' and recipes
Yes 50,000
7

Brassica Growers Association Coverage Report
06/02/2015 Your Home Print YesSwede cake and cabbage and fennel 'slaw
recipes Yes 123,693
06/02/2015 Horticulture Week Print YesBrassicas and salads influenced by current
trends Yes 6,295
09/02/2015 Grow Your Own Print YesAnne Swithinbank - The Vegetable
Gardener Yes 65,000
09/02/2015 Honest Mum Digital Yes
Honest Mum - Tuck In competition
http://honestmum.com/broccoli-and-stilton-
soup-recipe/
80,000
12/02/2015 Molly's Guide Digital Yes
Tuck In competition
http://mollysguide.co.uk/2015/02/12/aaron-
craze-love-your-greens-cookery-competition/
Yes TBC
13/02/2015 First News Print Yes Tuck In recipe competition Yes 70,686
17/02/2015 A Mummy Too Digital Yes
Tuck In recipe competition
http://www.amummytoo.co.uk/2015/02/calling-
young-chefs-see-work-print-love-greens-
cookery-competition/
Yes 53,000
01/02/2015 Waitrose Weekend Print Yes Flower Sprout sales bloom Yes
21/02/2015 Argus (Brighton) Digital Yes Classic Brassicas - the benefits of broccoli No 14,370
23/02/2015 Mail Online Digital Yes
Red cabbage is the new health craze
http://www.dailymail.co.uk/health/article-
2965797/Red-cabbage-new-health-craze-Sales-
soar-50-consumers-seek-benefit-ten-times-
vitamin-green-counterpart.html
Yes 199,414,263
25/02/2015 Nottingham Post Print Yes Love Your Greens Tuck In competition Yes 23,533
26/02/2015 Horticulture Week Digital Yes
Record 27 trophies awarded to industry's
stars at UK Grower Awards
http://www.hortweek.com/record-27-trophies-
awarded-industrys-stars-uk-grower-awards-
2015/edibles/article/1335797
Yes 6,295
26/02/2015 FPJ Digital YesBerry Gardens sweeps board at grower
award bashYes 30,000
8

Brassica Growers Association Coverage Report
26/02/2015 Fresh Plaza Digital Yes
UK Grower of the Year Awards: The
Winners
http://www.freshplaza.com/article/135869/UK-
Grower-of-the-Year-Awards-The-Winners
Yes Not available
27/02/2015 Leicester Mercury Print Yes Preparing beds for Brassicas Yes 35,006
27/02/2015Isle of Thanet
GazettePrint Yes
Aaron's mouthwatering, original recipes
could start a Craze for healthy eating - full
Aaron story and recipes
Yes 10,698
01/03/2015 Welsh Border Life Print YesGalloping Gourmet - Penne with purple
sprouting broccoli and pine nuts recipeYes 10,000
01/03/2015 Vegetable Farmer Print Yes
Brassica and Leafy Salad awards - LYG
cake bar photo published, and a photo of
chairman Matt Rawson
Yes 2,700
02/03/2015 NFU Digital YesNFU members scoop prizes at the Grower
Awards - mention of BGA's awardYes
TBC
04/03/2015The Portsmouth
NewsPrint Yes
Good enough to eat - preparing beds for
BrassicasNo 34,960
04/03/2015Corwen Bala Free
PressPrint Yes
Good enough to eat - preparing beds for
BrassicasYes 5,891
17/03/2015 Primary Times Digital Yes
Cooking with kids - sprout croquettes
recipe and Tuck In competition information
http://www.primarytimes.net/recipes/cooking-
with-kids-brussels-sprout-and-potato-
croquettes
Yes
17/03/2015 Primary Times Digital Yes
Cooking with kids - roast swede wedges
recipe and Tuck In competition information
http://www.primarytimes.net/recipes/cooking-
with-kids-roast-swede-wedges-with-parmesan
Yes
9

Brassica Growers Association Coverage Report
20/03/2015Cake and Bake
ShowDigital Yes
Aaron Craze working with the Love Your
Greens campaign to promote BrassicasYes TBC
23/03/2015Lancashire
Evening PostPrint Yes PR agency wins campaign award Yes 17,212
23/03/2015Produce Business
UKDigital Yes
Meat Free Week presents marketing
potential for produce
http://www.producebusinessuk.com/marketing-
pr/marketing-pr-stories/2015/03/23/meat-free-
week-holds-marketing-potential-for-produce
Yes TBC
24/03/2015 BBC Radio Jersey Broadcast - radio N/A
Love Your Greens campaign discussing
consumer perception poll results and
highlighting Tuck In competition (7 mins 6
secs)
N/A 31,000 listeners
24/03/2015 Bolton FM Broadcast - radio N/A
Love Your Greens campaign discussing
consumer perception poll results and
highlighting Tuck In competition (11 mins
39 secs)
N/A 50,000 listeners
24/03/2015 Sunrise radio Broadcast - radio N/A
Love Your Greens campaign discussing
consumer perception poll results and
highlighting Tuck In competition (5 mins 13
secs)
N/A 259,000 listeners
24/03/2015BBC Radio
CumbriaBroadcast - radio N/A
Love Your Greens campaign discussing
consumer perception poll results and
highlighting Tuck In competition (6 mins 9
secs)
N/A 106,000 listeners
24/03/2015 Downtown radioBroadcast - radio
podcastN/A
Love Your Greens campaign discussing
consumer perception poll results and
highlighting Tuck In competition (5 mins 3
secs)
N/A 72,000 listeners
10

Brassica Growers Association Coverage Report
24/03/2015 Severn FMBroadcast - radio
podcastN/A
Love Your Greens campaign discussing
consumer perception poll results and
highlighting Tuck In competition (5 mins 3
secs)
N/A 75,000 listeners
24/03/2015 Fun KidsBroadcast - radio
podcastN/A
Love Your Greens campaign discussing
consumer perception poll results and
highlighting Tuck In competition 5 mins 3
secs)
N/A TBC
24/03/2015 CityBeat Broadcast - radio N/A
Love Your Greens campaign discussing
consumer perception poll results and
highlighting Tuck In competition - copy
mention in news bulletins
N/A 127,000 listeners
25/03/2015 Inspire FM Broadcast - radio N/A
Love Your Greens campaign discussing
consumer perception poll results and
highlighting Tuck In competition (7 mins 38
secs)
N/A 40,000 listeners
25/03/2015 Yorkshire Coast Broadcast - radio N/A
Love Your Greens campaign discussing
consumer perception poll results and
highlighting Tuck In competition (9 mins 8
secs)
N/A 52,000 listeners
25/03/2015 Faversham Times Print YesGive the green light to super vegetables -
Aaron Craze partnership and recipesYes 1,589
25/03/2015 Canterbury Times Print YesGive the green light to super vegetables -
Aaron Craze partnership and recipesYes 48,661
25/03/2015 Herne Bay Times Print YesGive the green light to super vegetables -
Aaron Craze partnership and recipesYes 26,298
11

Brassica Growers Association Coverage Report
25/03/2015 Whitstable Times Print YesGive the green light to super vegetables -
Aaron Craze partnership and recipesYes 37,086
26/03/2015 Express FM Broadcast - radio N/A
Love Your Greens campaign discussing
consumer perception poll results and
highlighting Tuck In competition (5 mins 39
secs)
N/A 30,000 listeners
26/03/2015 Contest Cook Digital Yes
Love Your Greens Tuck In competition
http://www.contestcook.com/kidcontests.htm#L
ove-Your-Greens
No TBC
27/03/2015 Cook Vegetarian Digital NoPurple Sprouting Broccoli and butterbean
recipe included in email newsletterYes TBC
29/03/2015 Waves FM Broadcast - radio N/A
Love Your Greens campaign discussing
consumer perception poll results and
highlighting Tuck In competition (4 mins
30secs)
N/A 75,000 listeners
01/04/2015British Farmer and
GrowerPrint Yes South East growers in the medals Yes 7,018
01/04/2015 Yorkshire Post Print YesNow eat up your greens - Aaron's recipes
and campaignYes 35,940
08/04/2015 Waitrose Weekend Print Yes You can't beat a Cornish cauliflower' Yes TBC
16/04/2015Money Saving
ExpertDigital Yes
Free seeds featured on Martin's weekly
newsletter email and also on the website
forum
http://forums.moneysavingexpert.com/showthre
ad.php?t=5211904&utm_source=MSE_Newsle
tter&utm_medium=freebies&utm_term=15-Apr-
15-
lt&utm_campaign=forum&utm_content=8&_ga
=1.82249686.1120126178.1388744948
No 15 million users a month
12

Brassica Growers Association Coverage Report
21/04/2015 Hello! Print Yes
Aaron's recipes - sprout kebabs, chinese
cabbage soup, broccoli frittata, swede ice
cream, cauliflower crème brulee
Yes 273,353
21/04/2014 Live Ribble Valley Print Yes Aaron's recipes - broccoli frittata Yes 18,000
22/04/2015 Cook Vegetarian Print YesCabbage and fennel slaw recipe featured in
'veggie summer' recipe supplementYes 50,000
23/04/2015 Primary Times Digital Yes
Aaron's kohlrabi crostini recipe
http://www.primarytimes.net/recipes/cooking-
with-kids-roasted-kohlrabi-crostini-
Yes TBC
24/04/2015 RHS Newsletter Digital Yes Tuck in competition included on newsletter Yes TBC
24/04/2015 BT.com Digital Yes
Free seeds giveaway
http://home.bt.com/lifestyle/money/money-
tips/thrifty-mrs-free-ear-plugs-cat-food-pizza-
and-more-11363977274925
No 7,793,000
25/04/2015 MSN Digital Yes
Free Seeds giveaway http://www.msn.com/en-
gb/news/other/friday-freebies-free-milkshakes-
chocolate-takeaways-and-more/ar-AAbCerk
No 15,400,000
30/04/2015RHS School
GardeningDigital Yes
Aaron Craze and Tuck In Competition
https://schoolgardening.rhs.org.uk/News/News-
results/National/2015/April/national-news-item-
april-3
Yes Not available
01/05/2015 Jamie Print Yes Love Your Greens full page advert Yes 52,265
01/05.2015
Jamie - Food
Revolution
supplement
Print YesLove Your Greens full page advert included
in supplement within main magazineYes 52,265
13

Brassica Growers Association Coverage Report
Date Publication Type Campaign message URL/Description Picture Digital: Unique Users Print: Circulation
April/MayDerbyshire Times
Print Yes Recipes - will publish one per week Yes 24,959
PENDING COVERAGE:
14

VegetablesBrussel
PotatoParsnipSweetcornGreen BeansPeasCarrotsSproutsKaleCabbageCauliflowerTurnipSwedeBroccoli
1011101110111011101110111011101110111011101110111011Unweighted base
1011101110111011101110111011101110111011101110111011Weighted base
1006820901918979993863501917939703817943NET: Ever100%81%89%91%97%98%85%50%91%93%70%81%93%
992472677689899938402190671735320471799NET: Monthly or more98%47%67%68%89%93%40%19%66%73%32%47%79%
94420839839573177821957332394120198536NET: Weekly or more93%21%39%39%72%77%22%6%33%39%12%20%53%
13238522332557338Every day13%*1%1%2%3%***1%**1%
6625817217843247278241201623754267A few times a week65%6%17%18%43%47%8%2%12%16%4%5%26%
1501472172122762731392820622579141261Once a week15%15%21%21%27%27%14%3%20%22%8%14%26%
291381471509496845417317291119185Once a fortnight3%14%15%15%9%9%8%5%17%17%9%12%18%
201271331447464998016616911015577Once a month2%13%13%14%7%6%10%8%16%17%11%15%8%
122461621896347307152179169230247114A few times a year1%24%16%19%6%5%30%15%18%17%23%24%11%
-60211354132453410523712Once a year-6%2%1%**13%4%3%1%5%4%1%
24240261242111533241016218Less often than once a*4%4%3%1%*2%11%3%2%10%6%2%year
5191110933218148510947230819468Never*19%11%9%3%2%15%50%9%7%30%19%7%
Page 1
Brassica Vegetables SurveyONLINE Fieldwork: 19th-20th November 2014
Absolutes/col percents
Table 1Q.1 Approximately how often, if ever, do you tend to use each of the following vegetables in your meals?Base: All respondentsSummary
Prepared by Populus

EmploymentSectorRegionSocial GradeAgeGender
York-shire
EastWest&Pri-SouthSouthEast-Mid-Mid-Humb-NorthNorthScot-vatePublicWestEastLondonernWaleslandslandsersideWestEastlandDEC2C1AB65+55-6445-5435-4425-3418-24FemaleMaleTotal
42011896155116121577578881093284262210315224227176198188130924805311011Unweighted base
439127911421311015171919111140912402202802702201501801701701205164951011Weighted base
4071238813412695476681821023982225201261256212141166159152112497446943NET: Ever93%97%97%95%96%94%93%93%90%91%92%97%90%93%91%93%95%96%94%92%93%89%94%96%90%93%
358104741151088543577573802861183179220216179111141133136100434365799NET: Monthly or more81%82%81%82%82%84%85%80%83%80%72%70%67%76%82%79%80%81%74%78%78%80%83%84%74%79%
2496947816466353248485818391191231481461187598879366300236536NET: Weekly or more57%55%51%57%48%66%69%46%53%52%52%45%43%50%56%53%54%54%50%54%51%55%55%58%48%53%
5113-*1-21---*3311-2221448Every day1%1%1%2%-*3%-2%1%---*1%1%1%1%-1%1%1%1%1%1%1%
1223122453135141327223092062676970693644424036156111267A few times a week28%24%24%31%24%35%28%18%30%25%27%22%22%26%30%25%26%31%24%24%24%24%30%30%22%26%
1213824343331191920242991957547675473853435129141120261Once a week28%30%27%24%25%31%38%27%22%27%26%23%21%24%25%27%28%21%26%29%25%30%24%27%24%26%
822224233011520191718613444547494228293531209590185Once a fortnight19%17%26%16%23%11%10%28%21%18%16%16%14%18%20%17%18%19%18%16%21%18%17%19%18%18%
271331115835884492012252119914101214384077Once a month6%10%4%8%11%7%6%7%8%9%4%9%10%8%5%9%8%9%6%8%6%7%11%7%8%8%
36141017169383820712361631312424211915115360114A few times a year8%11%10%12%12%9%6%11%3%9%18%18%14%15%7%11%12%11%16%12%11%9%9%10%12%11%
921-1*-1222-3143422*71-4812Once a year2%1%1%-1%*-1%3%2%1%-3%*2%1%1%1%1%*4%1%-1%2%1%
53321-111-*4642757441-261218Less often than once a1%3%4%1%1%-2%1%1%-*9%6%2%1%3%2%3%3%2%1%-2%1%2%2%year
33437564510991916191914891411188195068Never7%3%3%5%4%6%7%7%10%9%8%3%10%7%9%7%5%4%6%8%7%11%6%4%10%7%
Page 2
Brassica Vegetables SurveyONLINE Fieldwork: 19th-20th November 2014
Absolutes/col percents
Table 2Q.1 Approximately how often, if ever, do you tend to use each of the following vegetables in your meals?Base: All respondentsBroccoli
Prepared by Populus

What is the combined annual income of your household, prior toDo you have any children aged 18 orWhich of the following best describestax being deducted?under? If so, how old are they?where you live?
Nochild-Hamlet
Anyren& Iso-Urban>£55kAnyAnyAnyagedagedlatedTown- Pop.
or>£48k->£41k->£34k->£28k->£21k->£14k->£7k-Up toagedagedagedunderNET:18 orDwel-Vil-NET:andoverNET:more£55k£48k£41k£34k£28k£21k£14k£7k16-1811-155-105YesunderlinglageRuralFringe10kUrbanTotal
10103267190213218170557711912996284723161831994084048121011Unweighted base
181436812002092051435384126135105300709151882033984098081011Weighted base
17143380177197195131498212213010028865313181194365383749943NET: Ever96%100%92%98%89%94%95%91%92%98%97%97%95%96%92%89%96%95%92%94%93%93%
1711287115416715510943731071178625454312158171308320628799NET: Monthly or more96%82%79%87%77%80%76%76%81%88%85%86%82%85%77%83%84%84%77%78%78%79%
14520451011161117620547578631733627122129210197407536NET: Weekly or more76%37%56%56%51%56%54%53%38%64%60%58%60%58%51%51%65%64%53%48%50%53%
--12121-1131243---6288Every day--2%2%*1%1%-1%2%2%*2%1%*---1%1%1%1%
6-6155266604162534362680187675829590185267A few times a week32%-17%18%26%32%29%28%10%29%27%27%24%27%26%42%40%40%24%22%23%26%
8513294849493514283942358917214648109105214261Once a week44%37%38%35%24%23%24%24%26%34%31%31%33%30%24%8%25%23%27%26%26%26%
4422135343623141526331763121428326588153185Once a fortnight21%30%6%26%18%16%17%16%26%18%21%25%16%21%17%26%15%16%16%22%19%18%
-264171791095657186019933356877Once a month-14%17%5%9%8%4%7%17%6%5%4%6%6%8%6%5%5%8%9%8%8%
--4101822311947101313298512021435093114A few times a year--12%12%9%10%15%13%8%9%8%9%12%10%12%6%11%10%11%12%11%11%
----4341-151166-11651112Once a year----2%1%2%1%-2%4%1%1%2%1%-1%1%1%1%1%1%
-31-15422-----18-11981718Less often than once a-18%2%-1%3%2%2%3%-----3%-1%1%2%2%2%2%year
1-312312101342445125628933265968Never4%-8%2%11%6%5%9%8%2%3%3%5%4%8%11%4%5%8%6%7%7%
Page 3
Brassica Vegetables SurveyONLINE Fieldwork: 19th-20th November 2014
Absolutes/col percents
Table 3Q.1 Approximately how often, if ever, do you tend to use each of the following vegetables in your meals?Base: All respondentsBroccoli
Prepared by Populus

Marital StatusWhich of the following ITV regions do you live in?NET:Mar-ried/
NET:CivilWid-part-owed/ner-separ-Civilship/ated/CoPart-coWest-
Div-Separ-Wid-div-Hab-ner-Mar-hab-York-count-WalesTyneScot-Meri-Gran-Gram-Cent-orcedatedowedorceditingshiprieditingSingleshirery& WestTeestishdianLondonadapianralAngliaTotal
98124015014414446604250572754337798186110134101241011Unweighted base
84114213714215452608262543149428382199114137101071011Weighted base
79104012913013433577233512946417477192105125999943NET: Ever94%88%96%94%92%91%96%95%89%95%94%93%97%89%94%97%92%92%94%93%93%
6310321051111236548820246254229526616584110989799NET: Monthly or more75%88%76%77%78%84%81%80%77%85%80%85%69%63%80%83%74%81%86%83%79%
397166260102593291443015341932471036364769536NET: Weekly or more46%65%38%45%42%70%57%54%55%55%47%70%46%38%57%52%55%47%67%64%53%
----1-5621-1--12-2-*8Every day----1%-1%1%1%1%-3%--1%1%-1%-*1%
1759322941271607514814101626523630238267A few times a week20%48%23%23%21%25%28%26%29%25%27%28%24%19%31%26%31%22%25%35%26%
222630297128164671561991620492733431261Once a week26%17%15%22%21%44%28%27%25%29%19%39%23%19%25%25%23%24%42%29%26%
13212283618211937139461213411834113185Once a fortnight16%22%29%20%26%7%18%20%14%24%29%9%14%14%15%21%16%25%9%12%18%
11-415151244021313496213121777Once a month13%-10%11%10%7%5%7%8%5%4%6%9%11%8%10%3%9%9%7%8%
13-8201615270234238129251911110114A few times a year15%-18%15%12%7%12%11%9%7%5%6%20%15%10%13%17%8%8%10%11%
1--11-8931---3-123-*12Once a year1%--**-2%1%1%2%---4%-*1%2%-*1%
3-*33-7105*314621*1--18Less often than once a3%-1%2%2%-2%2%2%1%8%2%9%7%3%**1%--2%year
512811119322822319579111768Never6%12%4%6%8%9%4%5%11%5%6%7%3%11%6%3%8%8%6%7%7%
Page 4
Brassica Vegetables SurveyONLINE Fieldwork: 19th-20th November 2014
Absolutes/col percents
Table 4Q.1 Approximately how often, if ever, do you tend to use each of the following vegetables in your meals?Base: All respondentsBroccoli
Prepared by Populus

Which of the following cities do you live in, or nearest to?None ofPly-South-Brigh-MiltonBirm-Nott-Liver-Manch-Shef-New-Edin-theseCardiffmouthBristolamptonLondonOxfordtonKeynesNorwichinghaminghampoolesterfieldHullLeedscastleburghGlasgowTotal
794336314122114213562764937732813453334401011Unweighted base
703829353223014212755894736743411454238451011Weighted base
61362735322201418265181433566321041413737943NET: Ever87%96%92%99%99%96%100%88%96%94%91%92%97%90%96%90%91%97%98%83%93%
4433233328189111623477336325130937302925799NET: Monthly or more63%87%78%94%88%82%77%79%85%87%82%76%89%69%88%79%82%71%76%57%79%
292617182512141118374621253717427191816536NET: Weekly or more41%70%60%51%78%53%31%53%67%67%52%44%69%50%50%35%59%46%48%36%53%
*11-11-1--2-----1---8Every day1%3%2%-2%1%-4%--2%-----2%---1%
1176915602682225717209216997267A few times a week15%19%21%25%47%26%15%29%30%39%29%16%47%27%28%15%35%21%25%16%26%
1718119959241015191381882101199261Once a week25%47%37%26%29%26%16%21%37%28%22%28%22%24%22%20%22%25%23%20%26%
114314342654619126121335664185Once a fortnight16%9%9%41%10%18%40%24%15%12%22%25%18%16%38%29%11%14%17%10%18%
4331-2611148312-2554577Once a month6%8%9%2%-11%5%3%2%8%9%7%2%3%-14%12%11%11%10%8%
12231329323446313312746114A few times a year17%6%9%3%10%13%23%9%11%7%5%13%8%18%8%11%5%18%12%14%11%
1-1--1----21-2--1--312Once a year1%-3%--1%----3%1%-2%--3%--7%1%
41*1*1----11-*---44218Less often than once a5%2%2%2%1%*----1%2%-1%---9%10%4%2%year
922**10-313841811411868Never13%4%8%1%1%4%-12%4%6%9%8%3%10%4%10%9%3%2%17%7%
Page 5
Brassica Vegetables SurveyONLINE Fieldwork: 19th-20th November 2014
Absolutes/col percents
Table 5Q.1 Approximately how often, if ever, do you tend to use each of the following vegetables in your meals?Base: All respondentsBroccoli
Prepared by Populus

EmploymentSectorRegionSocial GradeAgeGender
York-shire
EastWest&Pri-SouthSouthEast-Mid-Mid-Humb-NorthNorthScot-vatePublicWestEastLondonernWaleslandslandsersideWestEastlandDEC2C1AB65+55-6445-5435-4425-3418-24FemaleMaleTotal
42011896155116121577578881093284262210315224227176198188130924805311011Unweighted base
439127911421311015171919111140912402202802702201501801701701205164951011Weighted base
35010180123978141576472873778193178218228185122145135127102439377817NET: Ever80%80%88%87%74%81%81%80%71%79%78%91%86%80%81%78%84%84%81%81%79%75%85%85%76%81%
2186449665542322934445318501101171231211027090797358251221471NET: Monthly or more50%51%53%47%42%42%63%40%37%48%48%46%55%46%53%44%45%46%47%50%46%43%48%49%45%47%
90351926171814610273212175046495241254132293098100198NET: Weekly or more21%28%21%18%13%18%28%9%11%29%29%30%18%21%21%17%19%19%17%23%19%17%25%19%20%20%
3--21---1----211---1--2-33Every day1%--1%1%---1%----1%**---*--2%-1%*
278411561253655221081413315779302454A few times a week6%7%4%8%4%6%3%3%6%4%5%12%5%9%5%3%5%6%2%9%4%4%8%6%5%5%
60271613111212442326812273640382822252522196972141Once a week14%21%17%9%8%12%25%6%4%26%23%19%13%11%16%14%14%13%15%14%15%13%16%13%15%14%
66101413171191210810412213334302522221517176653119Once a fortnight15%8%15%9%13%11%19%17%10%9%9%9%13%9%15%12%11%11%15%12%9%10%14%13%11%12%
62201627211291114911322393740383623263228108669155Once a month14%16%17%19%16%12%17%15%16%10%10%7%24%16%17%14%14%16%15%15%19%16%9%17%14%15%
932728352432819192027132458467172623841393631131116247A few times a year21%21%30%25%19%31%15%26%21%22%24%31%26%24%21%25%27%28%25%23%23%21%26%25%23%24%
13211093*143311856181132785191837Once a year3%2%1%7%7%3%1%1%4%3%3%3%2%3%2%2%7%5%2%1%4%5%4%4%4%4%
2683129519854531710181711111210108402362Less often than once a6%6%4%8%6%5%2%12%9%6%3%12%3%7%5%6%6%5%7%7%6%6%7%8%5%6%year
89251119352010142719253134742624335283535431876118194Never20%20%12%13%26%19%19%20%29%21%22%9%14%20%19%22%16%16%19%19%21%25%15%15%24%19%
Page 6
Brassica Vegetables SurveyONLINE Fieldwork: 19th-20th November 2014
Absolutes/col percents
Table 6Q.1 Approximately how often, if ever, do you tend to use each of the following vegetables in your meals?Base: All respondentsSwede
Prepared by Populus

What is the combined annual income of your household, prior toDo you have any children aged 18 orWhich of the following best describestax being deducted?under? If so, how old are they?where you live?
Nochild-Hamlet
Anyren& Iso-Urban>£55kAnyAnyAnyagedagedlatedTown- Pop.
or>£48k->£41k->£34k->£28k->£21k->£14k->£7k-Up toagedagedagedunderNET:18 orDwel-Vil-NET:andoverNET:more£55k£48k£41k£34k£28k£21k£14k£7k16-1811-155-105YesunderlinglageRuralFringe10kUrbanTotal
10103267190213218170557711912996284723161831994084048121011Unweighted base
181436812002092051435384126135105300709151882033984098081011Weighted base
1614327515016417011541681011057623857711164175332310642817NET: Ever90%100%90%92%75%78%83%80%77%81%80%78%73%79%81%73%87%86%83%76%80%81%
6827508991965626476159341393315107111184176360471NET: Monthly or more32%60%76%61%45%43%47%39%49%56%48%44%32%46%47%31%57%55%46%43%45%47%
5562032403932112227211663135254557766143198NET: Weekly or more26%35%17%25%16%19%19%22%20%26%21%16%15%21%19%11%29%27%19%16%18%20%
---12-1----1-12---1233Every day---1%1%-*----1%-**---*1%**
-3-4127165374551638*212218153254A few times a week-25%-5%6%3%8%3%6%8%3%4%4%5%5%3%11%11%4%4%4%5%
51616183322277152315114694132335949107141Once a week26%10%17%19%9%16%11%19%14%18%18%11%10%15%13%8%17%16%15%12%13%14%
1-111521292097816164298912324464995119Once a fortnight6%-30%18%10%14%10%6%12%10%12%12%4%10%12%6%12%12%12%12%12%12%
-410153622371591718211447108230326162123155Once a month-25%29%19%18%10%18%10%16%20%15%16%14%16%15%14%16%16%15%15%15%15%
9342043535238814283424631836374311984203247A few times a year52%21%10%24%21%25%25%27%16%17%22%25%23%21%26%42%20%21%30%21%25%24%
---16111161223131620-888202837Once a year---1%3%5%5%4%2%2%2%2%12%5%3%-4%4%2%5%3%4%
13151210111465101052042-121220305062Less often than once a6%18%4%6%6%5%5%10%10%6%8%7%5%7%6%-6%6%5%7%6%6%year
2-4750453529121625302962132425296799166194Never10%-10%8%25%22%17%20%23%19%20%22%27%21%19%27%13%14%17%24%20%19%
Page 7
Brassica Vegetables SurveyONLINE Fieldwork: 19th-20th November 2014
Absolutes/col percents
Table 7Q.1 Approximately how often, if ever, do you tend to use each of the following vegetables in your meals?Base: All respondentsSwede
Prepared by Populus

Marital StatusWhich of the following ITV regions do you live in?NET:Mar-ried/
NET:CivilWid-part-owed/ner-separ-Civilship/ated/CoPart-coWest-
Div-Separ-Wid-div-Hab-ner-Mar-hab-York-count-WalesTyneScot-Meri-Gran-Gram-Cent-orcedatedowedorceditingshiprieditingSingleshirery& WestTeestishdianLondonadapianralAngliaTotal
98124015014414446604250572754337798186110134101241011Unweighted base
84114213714215452608262543149428382199114137101071011Weighted base
731037119115123654922024629403771671598999986817NET: Ever87%93%87%87%81%82%81%81%77%86%92%82%89%86%82%80%77%72%90%81%81%
36516576011228299113341131184638845559642471NET: Monthly or more43%48%38%42%43%72%50%49%43%63%35%65%42%55%46%42%48%43%57%40%47%
182324208951235115314121317253115423198NET: Weekly or more22%21%7%17%14%55%21%20%19%27%10%29%29%15%20%12%27%11%42%22%20%
----2-13-------1-1-23Every day----1%-**-------*-*-1%*
3216932436123115368681854A few times a week4%21%2%5%6%21%5%6%5%6%2%3%11%4%8%4%6%6%12%8%5%
15-217105698439123128101016247313141Once a week18%-5%13%7%34%15%14%15%22%8%25%18%12%13%8%21%5%31%12%14%
715132215882236594128231418-11119Once a fortnight8%7%12%9%15%10%13%13%9%11%16%19%8%14%9%12%12%13%-11%12%
11282118175943913382211336112618155Once a month13%20%18%15%13%7%17%15%15%24%9%17%5%26%16%18%10%19%15%7%15%
28510433211051386511107132119482730333247A few times a year33%45%23%31%22%10%23%23%25%20%31%15%30%25%23%24%24%22%27%31%24%
4-378-15237*2*1161433-237Once a year4%-7%5%5%-3%4%3%1%5%1%2%2%8%7%3%2%-2%4%
5-81315-17321817163513371962Less often than once a6%-18%9%11%-4%5%7%2%22%2%14%4%6%6%3%5%6%8%6%year
111517273871175972951215402638120194Never13%7%13%13%19%18%19%19%23%14%8%18%11%14%18%20%23%28%10%19%19%
Page 8
Brassica Vegetables SurveyONLINE Fieldwork: 19th-20th November 2014
Absolutes/col percents
Table 8Q.1 Approximately how often, if ever, do you tend to use each of the following vegetables in your meals?Base: All respondentsSwede
Prepared by Populus

Which of the following cities do you live in, or nearest to?None ofPly-South-Brigh-MiltonBirm-Nott-Liver-Manch-Shef-New-Edin-theseCardiffmouthBristolamptonLondonOxfordtonKeynesNorwichinghaminghampoolesterfieldHullLeedscastleburghGlasgowTotal
794336314122114213562764937732813453334401011Unweighted base
703829353223014212755894736743411454238451011Weighted base
5329243327185141621446337335726936393635817NET: Ever76%78%81%93%86%80%97%77%77%81%71%79%93%77%78%83%80%92%95%78%81%
3021182217101898203323263110723202321471NET: Monthly or more43%55%63%64%52%44%58%44%31%36%37%48%71%42%29%61%52%47%61%47%47%
61012411311531110101717441314105198NET: Weekly or more9%26%40%13%33%14%7%26%11%21%11%21%47%23%10%31%29%34%27%11%20%
----21----1---------3Every day----5%*----1%---------*
2122111-4*65232-1262254A few times a week3%4%6%5%4%5%-20%1%11%6%4%8%2%-11%3%14%4%5%5%
4810381911364814154211983141Once a week5%22%34%8%24%8%7%6%10%10%5%17%39%21%10%20%25%20%22%7%14%
884632721348738516447119Once a fortnight12%22%14%18%9%12%13%7%10%8%9%14%8%10%15%8%13%8%11%17%12%
163311343523415666135298155Once a month23%8%9%33%10%19%38%11%10%7%17%13%16%9%4%23%10%5%23%19%15%
1875875534101918882011210121111247A few times a year25%19%18%22%20%24%20%21%36%34%21%18%21%27%33%14%21%29%29%25%24%
1*--11623-141-3-1211-37Once a year2%1%--2%7%13%12%-3%4%2%-4%-7%3%2%4%-4%
31-33131-3485-35-16*362Less often than once a5%2%-8%11%5%5%-11%8%9%11%-4%16%-3%13%1%6%6%year
17852546*561026103177293210194Never24%22%19%7%14%20%3%23%23%19%29%21%7%23%22%17%20%8%5%22%19%
Page 9
Brassica Vegetables SurveyONLINE Fieldwork: 19th-20th November 2014
Absolutes/col percents
Table 9Q.1 Approximately how often, if ever, do you tend to use each of the following vegetables in your meals?Base: All respondentsSwede
Prepared by Populus

EmploymentSectorRegionSocial GradeAgeGender
York-shire
EastWest&Pri-SouthSouthEast-Mid-Mid-Humb-NorthNorthScot-vatePublicWestEastLondonernWaleslandslandsersideWestEastlandDEC2C1AB65+55-6445-5435-4425-3418-24FemaleMaleTotal
42011896155116121577578881093284262210315224227176198188130924805311011Unweighted base
439127911421311015171919111140912402202802702201501801701701205164951011Weighted base
308100709390633149556571338315514920619316010312811511483349355703NET: Ever70%79%77%66%68%62%62%70%61%72%64%81%91%64%68%74%72%73%69%71%68%67%69%68%72%70%
14742203347211716223635215368768393704661534645153168320NET: Monthly or more34%33%22%23%35%21%33%23%24%40%31%51%59%28%35%30%34%32%30%34%31%27%37%30%34%32%
512051213987615161216302831312415251615245069120NET: Weekly or more12%16%5%9%10%9%16%10%6%17%15%30%18%12%13%11%12%11%10%14%9%9%20%10%14%12%
31-21--11----3-1---1-12133Every day1%*-1%1%--1%1%----1%-*---1%-*1%*1%*
1541-5254146361376111126667201737A few times a week3%3%1%-4%2%10%5%1%5%5%8%6%5%3%2%4%5%1%3%3%4%6%4%3%4%
34154117733411119101421252013131710916295079Once a week8%12%4%8%5%7%6%4%4%12%10%22%11%6%9%9%7%6%9%10%6%5%13%6%10%8%
471010515755661051613222729241716121011513991Once a fortnight11%8%11%4%12%7%10%7%7%6%9%13%17%5%10%10%11%11%11%9%7%6%9%10%8%9%
49125161954410168322262625332114202420105159110Once a month11%9%6%11%14%5%7%5%11%17%7%8%24%11%12%9%12%10%9%11%14%12%8%10%12%11%
87383333232581917212471957417360563947402821106124230A few times a year20%30%37%23%18%25%15%27%19%23%21%18%21%24%19%26%22%25%26%26%23%16%17%21%25%23%
268579617-28-68141712115712106302252Once a year6%6%6%5%7%6%1%10%-2%7%-6%3%7%6%5%5%4%4%7%6%5%6%4%5%
48111120111077166555211833292313141030116041101Less often than once a11%9%12%14%8%10%13%10%17%7%4%12%5%9%8%12%11%11%9%8%6%18%9%12%8%10%year
131272148423919223626408886717477604752555637167141308Never30%21%23%34%32%38%38%30%39%28%36%19%9%36%32%26%28%27%31%29%32%33%31%32%28%30%
Page 10
Brassica Vegetables SurveyONLINE Fieldwork: 19th-20th November 2014
Absolutes/col percents
Table 10Q.1 Approximately how often, if ever, do you tend to use each of the following vegetables in your meals?Base: All respondentsTurnip
Prepared by Populus

What is the combined annual income of your household, prior toDo you have any children aged 18 orWhich of the following best describestax being deducted?under? If so, how old are they?where you live?
Nochild-Hamlet
Anyren& Iso-Urban>£55kAnyAnyAnyagedagedlatedTown- Pop.
or>£48k->£41k->£34k->£28k->£21k->£14k->£7k-Up toagedagedagedunderNET:18 orDwel-Vil-NET:andoverNET:more£55k£48k£41k£34k£28k£21k£14k£7k16-1811-155-105YesunderlinglageRuralFringe10kUrbanTotal
10103267190213218170557711912996284723161831994084048121011Unweighted base
181436812002092051435384126135105300709151882033984098081011Weighted base
15102550137159147943266100926120749413126139276288565703NET: Ever82%74%69%61%69%76%72%65%60%79%79%68%58%69%70%89%67%68%69%70%70%70%
55182761686043203452532710521426567128125254320NET: Monthly or more26%34%49%33%31%33%29%30%37%41%41%40%25%35%30%13%34%33%32%31%31%32%
51112192621181015201373485*3435444185120NET: Weekly or more26%6%2%15%10%13%10%13%18%18%16%9%6%11%12%3%18%17%11%10%11%12%
---12-1-------3---1333Every day---2%1%-*-------*---*1%**
---23881021462928*13141772437A few times a week---2%1%4%4%7%3%1%3%5%2%3%4%3%7%7%4%2%3%4%
5119151813881516742554-212127315879Once a week26%6%2%11%7%9%6%5%15%18%13%5%4%8%8%-11%10%7%8%7%8%
-11141723151144111532071-181836367291Once a fortnight-9%31%5%9%11%7%8%8%4%9%11%3%7%10%-10%9%9%9%9%9%
-361025192413616202517505811213484896110Once a month-19%17%13%12%9%12%9%10%19%16%19%16%17%8%10%6%7%12%12%12%11%
736154055522882432271767163635419594189230A few times a year40%21%17%19%20%26%25%19%16%28%25%20%16%22%23%44%18%20%24%23%23%23%
2--4121579*28271537*8919244352Once a year11%--5%6%7%4%6%1%3%6%2%7%5%5%3%4%4%5%6%5%5%
1313242027154691011218041822344579101Less often than once a6%18%3%4%12%10%13%10%7%7%7%7%10%7%11%30%10%11%9%11%10%10%year
3411326351585021182643449321426364122121243308Never18%26%31%39%31%24%28%35%40%21%21%32%42%31%30%11%33%32%31%30%30%30%
Page 11
Brassica Vegetables SurveyONLINE Fieldwork: 19th-20th November 2014
Absolutes/col percents
Table 11Q.1 Approximately how often, if ever, do you tend to use each of the following vegetables in your meals?Base: All respondentsTurnip
Prepared by Populus

Marital StatusWhich of the following ITV regions do you live in?NET:Mar-ried/
NET:CivilWid-part-owed/ner-separ-Civilship/ated/CoPart-coWest-
Div-Separ-Wid-div-Hab-ner-Mar-hab-York-count-WalesTyneScot-Meri-Gran-Gram-Cent-orcedatedowedorceditingshiprieditingSingleshirery& WestTeestishdianLondonadapianralAngliaTotal
98124015014414446604250572754337798186110134101241011Unweighted base
84114213714215452608262543149428382199114137101071011Weighted base
619289895832743017240243032744914274831065703NET: Ever73%79%66%72%67%53%72%71%66%75%77%62%77%90%60%72%65%61%100%61%70%
22512394341602077013316204817623732723320NET: Monthly or more27%48%28%29%30%28%35%34%27%25%11%33%47%58%21%31%33%23%65%22%32%
6141116252703731812147161610212120NET: Weekly or more8%13%8%8%11%13%12%12%14%5%3%17%29%17%9%8%14%7%21%11%12%
----2-131------1-1-23Every day----1%-***------*-1%-1%*
1134511622111-534-5522237A few times a week1%6%6%3%3%9%4%4%4%1%-10%8%5%-3%5%1%21%2%4%
511791354526213910710117-879Once a week6%7%2%5%7%4%8%7%10%4%3%7%21%12%9%5%9%5%-8%8%
8-3111015161189155132191472791Once a fortnight9%-8%8%7%5%11%10%7%17%4%10%13%16%3%9%12%5%21%6%9%
8451717157761521322082781525110Once a month10%35%12%12%12%10%13%13%6%3%4%6%6%24%10%14%7%11%22%5%11%
291104031210814249199871721402431226230A few times a year34%12%24%29%22%13%24%23%19%35%28%16%17%21%25%20%21%23%20%24%23%
4-154-222621221-641585-752Once a year5%-2%4%3%-5%4%8%3%6%1%-7%5%7%7%4%-6%5%
6251417236553261065482551529101Less often than once a8%19%13%10%12%12%8%9%12%11%31%12%12%4%9%13%4%11%16%9%10%year
2221439477125178901471910833574054-42308Never27%21%34%28%33%47%28%29%34%25%23%38%23%10%40%28%35%39%-39%30%
Page 12
Brassica Vegetables SurveyONLINE Fieldwork: 19th-20th November 2014
Absolutes/col percents
Table 12Q.1 Approximately how often, if ever, do you tend to use each of the following vegetables in your meals?Base: All respondentsTurnip
Prepared by Populus

Which of the following cities do you live in, or nearest to?None ofPly-South-Brigh-MiltonBirm-Nott-Liver-Manch-Shef-New-Edin-theseCardiffmouthBristolamptonLondonOxfordtonKeynesNorwichinghaminghampoolesterfieldHullLeedscastleburghGlasgowTotal
794336314122114213562764937732813453334401011Unweighted base
703829353223014212755894736743411454238451011Weighted base
392124262216681015335528314428835353440703NET: Ever56%56%81%73%70%72%59%49%56%60%62%60%87%59%82%72%78%83%91%90%70%
13101151071*5411226221616522222424320NET: Monthly or more18%28%37%13%31%31%3%26%15%20%25%12%63%21%47%44%49%52%65%55%32%
5431618*136621556291496120NET: Weekly or more7%10%9%3%19%8%3%3%9%11%6%5%41%6%18%14%21%34%25%13%12%
----21----1---------3Every day----5%*----1%---------*
211--5--*21-8-5-252337A few times a week3%2%2%--2%--1%3%1%-22%-14%-5%13%6%6%4%
2321512*124327512797379Once a week3%9%7%3%15%5%3%3%8%7%4%5%18%6%3%14%16%21%19%7%8%
3472223--12614742456891Once a fortnight4%11%24%6%5%10%--4%4%7%2%11%10%12%14%9%13%17%17%9%
5212230-5*3102446282911110Once a month7%7%4%5%7%13%-24%1%5%11%5%11%5%18%16%18%6%23%24%11%
185715552737151711718938779230A few times a year25%14%24%41%16%23%49%15%26%27%20%24%19%24%27%27%18%17%18%20%23%
3112317--22-5261-1-2352Once a year4%2%5%5%11%8%--9%3%-10%6%8%2%-1%-6%7%5%
65554261225166-42-4614101Less often than once a8%13%16%13%12%11%7%8%6%10%18%13%-6%6%-10%14%2%8%10%year
3117691064611122233194306310734308Never44%44%19%27%30%28%41%51%44%40%38%40%13%41%18%28%22%17%9%10%30%
Page 13
Brassica Vegetables SurveyONLINE Fieldwork: 19th-20th November 2014
Absolutes/col percents
Table 13Q.1 Approximately how often, if ever, do you tend to use each of the following vegetables in your meals?Base: All respondentsTurnip
Prepared by Populus

EmploymentSectorRegionSocial GradeAgeGender
York-shire
EastWest&Pri-SouthSouthEast-Mid-Mid-Humb-NorthNorthScot-vatePublicWestEastLondonernWaleslandslandsersideWestEastlandDEC2C1AB65+55-6445-5435-4425-3418-24FemaleMaleTotal
42011896155116121577578881093284262210315224227176198188130924805311011Unweighted base
439127911421311015171919111140912402202802702201501801701701205164951011Weighted base
4081178813612396426484831033981226203254255213140171158148109488451939NET: Ever93%92%97%96%94%95%84%90%92%91%92%96%89%94%92%91%94%96%93%95%93%87%91%95%91%93%
325937110995803851547288255318317019718417111213413010780378358735NET: Monthly or more74%73%78%77%72%79%74%72%60%79%79%61%58%76%77%70%68%78%74%75%77%63%67%73%72%73%
16748355251512226293851132610410589961065374604656191203394NET: Weekly or more38%38%38%37%39%50%44%37%32%42%45%31%29%43%48%32%35%48%35%41%35%27%46%37%41%39%
4212-*--1111-32211-1122257Every day1%2%1%2%-*--1%1%1%4%-1%1%1%*1%-1%*1%1%*1%1%
64191620232391313822511504727384916322513278775162A few times a week15%15%17%14%17%23%18%19%14%8%20%12%13%21%21%10%14%22%11%18%14%8%23%17%15%16%
992719302927131316292861551566058563741353027101124225Once a week23%22%20%21%22%27%26%19%18%32%25%15%16%21%25%22%21%25%25%23%20%18%22%20%25%22%
8618242717151110131814914423851413330313825158983172Once a fortnight20%14%26%19%13%15%22%14%14%20%13%21%16%18%17%18%15%15%20%17%22%15%12%17%17%17%
722612302614415121623413372857483329293336109871169Once a month16%21%14%21%20%14%9%21%14%18%21%9%14%15%13%20%18%15%19%16%19%21%8%19%14%17%
702112212416411278121024393041593424312038219277169A few times a year16%16%13%15%18%16%8%16%29%8%11%25%27%16%14%15%22%16%16%17%12%22%18%18%16%17%
7-21----211-2*135122*133710Once a year2%-3%1%----3%1%1%-3%*1%1%2%1%1%1%*1%2%1%1%1%
63255111-22424113662471415924Less often than once a1%3%3%4%4%1%2%2%-2%2%10%2%2%1%5%2%3%1%2%4%1%4%3%2%2%year
3110368587788210141726168109122211284472Never7%8%3%4%6%5%16%10%8%9%8%4%11%6%8%9%6%4%7%5%7%13%9%5%9%7%
Page 14
Brassica Vegetables SurveyONLINE Fieldwork: 19th-20th November 2014
Absolutes/col percents
Table 14Q.1 Approximately how often, if ever, do you tend to use each of the following vegetables in your meals?Base: All respondentsCauliflower
Prepared by Populus

What is the combined annual income of your household, prior toDo you have any children aged 18 orWhich of the following best describestax being deducted?under? If so, how old are they?where you live?
Nochild-Hamlet
Anyren& Iso-Urban>£55kAnyAnyAnyagedagedlatedTown- Pop.
or>£48k->£41k->£34k->£28k->£21k->£14k->£7k-Up toagedagedagedunderNET:18 orDwel-Vil-NET:andoverNET:more£55k£48k£41k£34k£28k£21k£14k£7k16-1811-155-105YesunderlinglageRuralFringe10kUrbanTotal
10103267190213218170557711912996284723161831994084048121011Unweighted base
181436812002092051435384126135105300709151882033984098081011Weighted base
1714318118119519013346821231319928765015181196367376743939NET: Ever96%100%87%99%91%93%93%93%86%97%98%97%94%96%92%100%96%96%92%92%92%93%
1411237313815414010437701021127623649712156167288280568735NET: Monthly or more76%82%64%90%69%74%69%72%70%84%81%83%72%79%70%79%83%82%72%68%70%73%
117123368798163144453473611527929294151149300394NET: Weekly or more63%48%34%41%34%38%40%44%26%52%42%35%34%38%39%14%49%46%38%36%37%39%
---1221---11116---3477Every day---2%1%1%*---1%*1%*1%---1%1%1%1%
-3462935373371921181147115146476254115162A few times a week-19%12%8%14%17%18%23%13%22%17%14%10%16%16%8%24%23%15%13%14%16%
1148263742443072531292567158146478791178225Once a week63%28%21%32%18%20%21%21%13%30%25%21%24%22%22%6%25%23%22%22%22%22%
-162034343325101423351563108331347167138172Once a fortnight-9%16%25%17%16%16%17%20%16%19%26%14%21%15%20%17%17%18%16%17%17%
2452036412616131326302458110733396664130169Once a month13%25%14%24%18%20%13%11%24%15%20%22%23%19%16%46%17%19%17%16%16%17%
4-76363743236916132141128324276378142169A few times a year21%-20%7%18%18%21%16%12%11%12%10%20%14%18%21%13%14%16%19%18%17%
--1-4113-*34255---281010Once a year--3%-2%*1%2%-*3%3%2%2%1%---1%2%1%1%
-3-144643232*519-1113102424Less often than once a-18%-2%2%2%3%3%5%2%2%2%*2%3%-**3%3%3%2%year
1-5118141410722461359-7731336572Never4%-13%1%9%7%7%7%14%3%2%3%6%4%8%-4%4%8%8%8%7%
Page 15
Brassica Vegetables SurveyONLINE Fieldwork: 19th-20th November 2014
Absolutes/col percents
Table 15Q.1 Approximately how often, if ever, do you tend to use each of the following vegetables in your meals?Base: All respondentsCauliflower
Prepared by Populus

Marital StatusWhich of the following ITV regions do you live in?NET:Mar-ried/
NET:CivilWid-part-owed/ner-separ-Civilship/ated/CoPart-coWest-
Div-Separ-Wid-div-Hab-ner-Mar-hab-York-count-WalesTyneScot-Meri-Gran-Gram-Cent-orcedatedowedorceditingshiprieditingSingleshirery& WestTeestishdianLondonadapianralAngliaTotal
98124015014414446604250572754337798186110134101241011Unweighted base
84114213714215452608262543149428382199114137101071011Weighted base
76941126129134335762335131414074781901061249101939NET: Ever91%81%97%92%91%91%96%95%89%95%99%83%96%90%95%96%93%91%90%94%93%
566309283123724681724118362547651469293784735NET: Monthly or more67%52%71%67%58%84%82%77%66%77%57%74%60%57%79%74%80%68%73%79%73%
28211414192062579521622132437755346253394NET: Weekly or more33%21%26%30%29%62%46%42%36%39%18%45%30%30%45%38%46%34%21%50%39%
----2-67-1--1-1-11-27Every day----1%-1%1%-1%--3%-1%-1%*-2%1%
825141738610640111951015322618123162A few times a week9%14%11%10%12%21%19%17%15%21%2%19%12%12%18%16%23%13%12%22%16%
20162723611514354951361521432627128225Once a week24%7%15%20%16%41%25%24%21%17%16%27%14%18%25%22%23%20%9%26%22%
18*62423182106411391081311341622215172Once a fortnight21%4%15%18%16%9%18%17%16%25%30%20%19%15%13%17%14%16%17%14%17%
1131326192841053773451018382326317169Once a month13%26%31%19%13%13%19%17%14%13%9%9%12%12%21%19%20%19%34%16%17%
18311323715491456123102310351228216169A few times a year21%29%25%23%26%7%12%15%17%12%39%7%24%28%12%18%10%20%18%15%17%
----2-2552---21-12--10Once a year----2%-1%1%2%4%---3%1%-*2%--1%
2--27-51210111522921-124Less often than once a3%--2%5%-1%2%4%2%2%2%12%2%2%4%2%1%-1%2%year
721111311932293*829488121672Never9%19%3%8%9%9%4%5%11%5%1%17%4%10%5%4%7%9%10%6%7%
Page 16
Brassica Vegetables SurveyONLINE Fieldwork: 19th-20th November 2014
Absolutes/col percents
Table 16Q.1 Approximately how often, if ever, do you tend to use each of the following vegetables in your meals?Base: All respondentsCauliflower
Prepared by Populus

Which of the following cities do you live in, or nearest to?None ofPly-South-Brigh-MiltonBirm-Nott-Liver-Manch-Shef-New-Edin-theseCardiffmouthBristolamptonLondonOxfordtonKeynesNorwichinghaminghampoolesterfieldHullLeedscastleburghGlasgowTotal
794336314122114213562764937732813453334401011Unweighted base
703829353223014212755894736743411454238451011Weighted base
65302734322211419265183403567321039403537939NET: Ever93%81%93%97%100%96%100%89%94%94%93%86%98%90%96%90%86%96%93%84%93%
5426202829170121719445233315632932262620735NET: Monthly or more77%70%70%78%90%74%83%82%70%80%59%70%87%76%94%82%71%63%69%45%73%
2816141019846101328281723261342015812394NET: Weekly or more40%42%47%30%58%36%42%50%46%51%32%37%65%35%40%37%45%35%21%28%39%
*-1-21----1--1--11--7Every day1%-2%-5%*----1%--1%--2%3%--1%
64747351551612314129-4636162A few times a week8%10%25%10%23%15%9%27%19%29%14%7%39%17%26%-10%15%8%14%16%
22126710485571215149135415756225Once a week31%32%19%19%30%21%33%23%27%22%17%30%26%17%14%37%33%17%13%13%22%
10751233933661474121244777172Once a fortnight14%19%16%35%9%17%23%13%21%12%15%15%10%16%35%39%9%17%20%16%17%
16325747241101184186184101169Once a month22%9%8%14%23%21%17%19%3%18%12%18%11%25%19%6%17%10%28%1%17%
10346141227728639*-610914169A few times a year15%9%13%17%2%18%17%7%25%13%32%13%8%12%1%-14%24%25%31%17%
*-2-*1----2-1---1--210Once a year1%-7%-1%*----3%-2%---1%--5%1%
111129---1-111-1-4-224Less often than once a1%2%3%2%7%4%---1%-3%2%2%-7%-10%-3%2%year
5721-9-223671811622772Never7%19%7%3%-4%-11%6%6%7%14%2%10%4%10%14%4%7%16%7%
Page 17
Brassica Vegetables SurveyONLINE Fieldwork: 19th-20th November 2014
Absolutes/col percents
Table 17Q.1 Approximately how often, if ever, do you tend to use each of the following vegetables in your meals?Base: All respondentsCauliflower
Prepared by Populus

EmploymentSectorRegionSocial GradeAgeGender
York-shire
EastWest&Pri-SouthSouthEast-Mid-Mid-Humb-NorthNorthScot-vatePublicWestEastLondonernWaleslandslandsersideWestEastlandDEC2C1AB65+55-6445-5435-4425-3418-24FemaleMaleTotal
42011896155116121577578881093284262210315224227176198188130924805311011Unweighted base
439127911421311015171919111140912402202802702201501801701701205164951011Weighted base
4031208713211889396382811073781218204249247206136164156150107471446917NET: Ever92%95%96%93%90%88%78%89%90%90%96%93%89%90%93%89%91%93%90%91%92%88%89%91%90%91%
313856210488683142506682285015015818318015410611512010075343328671NET: Monthly or more71%67%68%74%67%67%61%59%55%73%74%68%55%62%72%65%67%70%70%64%71%59%63%67%66%66%
16033314445291427263543162272957490875255523946157174332NET: Weekly or more37%26%34%31%34%29%27%38%29%38%38%39%24%30%43%26%33%40%35%31%31%23%38%31%35%33%
4-122---1----4-1-111--2235Every day1%-1%1%2%---1%----2%-*-*1%1%--1%*1%*
48111218161431012101375303026344311211910166852120A few times a week11%9%13%13%12%13%6%15%13%11%12%18%5%13%14%9%13%20%7%12%11%6%13%13%11%12%
108221925271611171424308173865465643403234292888118206Once a week25%17%21%17%20%16%21%24%15%26%27%20%18%16%30%17%21%19%27%18%20%17%23%17%24%20%
8727183422259572116312413550473227323431168984173Once a fortnight20%21%20%24%17%25%19%7%8%23%15%8%13%17%16%18%17%15%18%18%20%19%13%17%17%17%
652513262113810171123917372859433526283430149770166Once a month15%20%14%19%16%13%16%14%18%12%20%21%19%15%13%21%16%16%17%16%20%18%11%19%14%16%
572719222517618151219817463948464222382832178396179A few times a year13%21%21%15%19%17%13%26%16%13%17%21%19%19%18%17%17%19%15%21%16%19%14%16%19%18%
1851221121522-6628182373109241134Once a year4%4%1%2%2%1%2%2%17%3%2%-6%3%1%3%7%1%2%4%2%6%8%5%2%3%
15344441111328164103854575211233Less often than once a3%2%5%3%3%4%2%2%1%1%3%4%9%7%2%4%1%4%3%2%3%4%4%4%2%3%year
3774101312118910431023163123151416142014454994Never8%5%4%7%10%12%22%11%10%10%4%7%11%10%7%11%9%7%10%9%8%12%11%9%10%9%
Page 18
Brassica Vegetables SurveyONLINE Fieldwork: 19th-20th November 2014
Absolutes/col percents
Table 18Q.1 Approximately how often, if ever, do you tend to use each of the following vegetables in your meals?Base: All respondentsCabbage
Prepared by Populus

What is the combined annual income of your household, prior toDo you have any children aged 18 orWhich of the following best describestax being deducted?under? If so, how old are they?where you live?
Nochild-Hamlet
Anyren& Iso-Urban>£55kAnyAnyAnyagedagedlatedTown- Pop.
or>£48k->£41k->£34k->£28k->£21k->£14k->£7k-Up toagedagedagedunderNET:18 orDwel-Vil-NET:andoverNET:more£55k£48k£41k£34k£28k£21k£14k£7k16-1811-155-105YesunderlinglageRuralFringe10kUrbanTotal
10103267190213218170557711912996284723161831994084048121011Unweighted base
181436812002092051435384126135105300709151882033984098081011Weighted base
1814347817918818812246811211249127464115174188362367729917NET: Ever100%100%94%95%90%90%92%85%87%96%96%92%86%91%90%100%92%93%91%90%90%91%
141123611341421218639679594501984719144153263255518671NET: Monthly or more77%82%63%74%67%68%59%60%72%80%76%70%47%66%66%60%77%75%66%62%64%66%
8413285973624418274646279723528384125122247332NET: Weekly or more45%32%37%35%30%35%30%30%34%32%37%34%25%32%33%13%44%42%31%30%31%33%
---12-111-----5---1455Every day---2%1%-**2%-----1%---*1%1%*
3-532126261868121382892-3434424587120A few times a week19%-14%4%10%12%13%12%11%10%9%9%7%9%13%-18%17%11%11%11%12%
5482437473525111835331968138249518273155206Once a week26%32%23%29%18%22%17%18%21%22%28%25%18%23%19%13%26%25%21%18%19%20%
156174042292052124201150122333366967137173Once a fortnight7%35%17%21%20%20%14%14%9%25%19%15%10%17%17%24%17%18%17%16%17%17%
5231635272922161925281252114429326965134166Once a month25%14%9%19%17%13%14%15%30%23%20%21%11%17%16%24%15%16%17%16%17%16%
2311143038462561018212854125422267479153179A few times a year13%18%31%17%15%18%22%17%11%12%15%16%27%18%18%25%12%13%19%19%19%18%
2--194126122361123-3312193134Once a year10%--1%4%2%6%4%2%2%2%2%6%4%3%-2%2%3%5%4%3%
---36510611567112224612142733Less often than once a---3%3%2%5%4%2%2%4%4%6%4%3%15%2%3%3%3%3%3%year
--242021162173511152667-151537427994Never--6%5%10%10%8%15%13%4%4%8%14%9%10%-8%7%9%10%10%9%
Page 19
Brassica Vegetables SurveyONLINE Fieldwork: 19th-20th November 2014
Absolutes/col percents
Table 19Q.1 Approximately how often, if ever, do you tend to use each of the following vegetables in your meals?Base: All respondentsCabbage
Prepared by Populus

Marital StatusWhich of the following ITV regions do you live in?NET:Mar-ried/
NET:CivilWid-part-owed/ner-separ-Civilship/ated/CoPart-coWest-
Div-Separ-Wid-div-Hab-ner-Mar-hab-York-count-WalesTyneScot-Meri-Gran-Gram-Cent-orcedatedowedorceditingshiprieditingSingleshirery& WestTeestishdianLondonadapianralAngliaTotal
98124015014414446604250572754337798186110134101241011Unweighted base
84114213714215452608262543149428382199114137101071011Weighted base
801042132123134175542285130373973751841101211094917NET: Ever95%91%100%96%87%91%92%91%87%95%97%77%93%88%91%92%96%89%100%88%91%
524318881103204121683618302843631358481969671NET: Monthly or more62%38%75%64%58%70%71%68%64%67%57%61%67%52%77%68%74%59%93%64%66%
19215373891652118418614161829644542434332NET: Weekly or more23%21%37%27%27%58%36%35%32%33%20%28%37%22%35%32%40%31%42%32%33%
2--22-131-1----2-1-25Every day2%--1%1%-***-2%----1%-*-1%*
629171535473307237313231218217120A few times a week7%21%21%13%11%21%12%12%12%12%8%6%18%4%15%11%11%13%21%16%12%
11-718215109135531131181516393323216206Once a week13%-16%13%14%37%24%22%20%21%11%22%20%18%20%20%29%17%21%15%20%
1617242118610841124951220381714-22173Once a fortnight19%11%16%17%15%5%19%18%16%22%13%18%11%14%24%19%15%10%-21%17%
18192723170934368781314332225512166Once a month21%6%22%20%16%7%15%15%16%11%24%15%19%16%17%16%19%18%51%11%16%
2267352628110935116691711392028-19179A few times a year27%54%16%26%19%13%18%18%13%20%20%12%22%20%13%19%17%20%-18%18%
1-1210-71716151-6-4211-134Once a year1%-2%1%7%-1%3%6%2%16%2%-7%-2%2%8%-1%3%
4-3751101693112716321533Less often than once a4%-8%5%4%9%2%3%4%6%3%2%4%9%1%3%3%1%7%4%3%year
41-51913555343111310715416-1394Never5%9%-4%13%9%8%9%13%5%3%23%7%12%9%8%4%11%-12%9%
Page 20
Brassica Vegetables SurveyONLINE Fieldwork: 19th-20th November 2014
Absolutes/col percents
Table 20Q.1 Approximately how often, if ever, do you tend to use each of the following vegetables in your meals?Base: All respondentsCabbage
Prepared by Populus

Which of the following cities do you live in, or nearest to?None ofPly-South-Brigh-MiltonBirm-Nott-Liver-Manch-Shef-New-Edin-theseCardiffmouthBristolamptonLondonOxfordtonKeynesNorwichinghaminghampoolesterfieldHullLeedscastleburghGlasgowTotal
794336314122114213562764937732813453334401011Unweighted base
703829353223014212755894736743411454238451011Weighted base
6432273431214121822508140307132939393637917NET: Ever92%84%93%97%96%93%87%86%81%91%91%85%84%96%95%83%87%93%95%83%91%
422617292316481516364730255124836292321671NET: Monthly or more60%69%57%84%72%71%56%74%60%66%53%64%69%68%72%69%80%69%60%47%66%
201210111579121019221910281242118128332NET: Weekly or more28%33%36%31%47%34%9%9%37%34%25%40%27%37%35%31%46%42%33%17%33%
---122----1---------5Every day---2%5%1%----1%---------*
73436311-3996664271023120A few times a week9%8%15%8%18%14%6%-12%17%10%12%16%8%13%17%15%23%4%6%12%
13967845*279131342272148115206Once a week19%25%21%21%25%19%3%9%25%17%15%28%11%30%21%14%32%20%29%11%20%
10821364759499497947346173Once a fortnight14%20%6%36%18%21%37%41%14%17%10%8%25%10%28%37%15%7%10%14%17%
1364623815281776163-9867166Once a month18%16%15%17%7%17%10%24%9%15%19%16%16%22%9%-19%20%17%16%16%
174737414*511169516513897179A few times a year24%11%25%9%23%18%26%2%18%19%18%20%14%22%16%7%7%20%23%16%18%
111--2-21116--22---4234Once a year1%2%4%--1%-7%3%1%18%--3%7%---11%4%3%
4121-611-31112-1-2*733Less often than once a6%2%7%4%-3%4%2%-5%1%1%2%3%-7%-4%1%16%3%year
66211172355876322632894Never8%16%7%3%4%7%13%14%19%9%9%15%16%4%5%17%13%7%5%17%9%
Page 21
Brassica Vegetables SurveyONLINE Fieldwork: 19th-20th November 2014
Absolutes/col percents
Table 21Q.1 Approximately how often, if ever, do you tend to use each of the following vegetables in your meals?Base: All respondentsCabbage
Prepared by Populus

EmploymentSectorRegionSocial GradeAgeGender
York-shire
EastWest&Pri-SouthSouthEast-Mid-Mid-Humb-NorthNorthScot-vatePublicWestEastLondonernWaleslandslandsersideWestEastlandDEC2C1AB65+55-6445-5435-4425-3418-24FemaleMaleTotal
42011896155116121577578881093284262210315224227176198188130924805311011Unweighted base
439127911421311015171919111140912402202802702201501801701701205164951011Weighted base
22068548770422141384543204291891601611317081728364278223501NET: Ever50%54%60%61%53%42%41%59%41%49%39%48%46%38%40%57%60%59%47%45%42%49%53%54%45%50%
883212393912881019208152731636936193532343310783190NET: Monthly or more20%25%14%28%29%12%16%11%11%21%18%20%17%11%14%23%25%16%13%20%19%20%28%21%17%19%
2771819411349241291422751013417302757NET: Weekly or more6%6%1%5%14%4%3%2%3%4%8%6%4%5%4%5%8%3%3%6%8%3%14%6%5%6%
3-121-1-*----1121--1211135Every day1%-1%1%1%-2%-*----*1%1%*--*1%*1%*1%*
123127311123-49348224629131224A few times a week3%2%1%1%5%3%1%1%1%2%3%-4%4%1%2%3%1%1%2%3%1%8%2%2%2%
124-4111-12162-25813635626161228Once a week3%3%-3%8%1%-1%2%2%5%6%-1%2%3%5%3%2%3%3%1%5%3%2%3%
309310134521931348231893118148272754Once a fortnight7%7%3%7%10%3%10%3%1%10%3%3%3%2%4%8%7%4%2%6%5%8%7%5%5%5%
32168226424668481114262920111411168503080Once a month7%12%9%15%5%4%4%6%6%7%7%11%9%4%6%9%11%9%8%8%6%9%7%10%6%8%
68172416171661017179712242547564923142125209458152A few times a year15%13%26%11%13%16%12%15%19%19%8%18%13%10%11%17%21%22%15%8%12%15%16%18%12%15%
1856754352541410915111497851192645Once a year4%4%7%5%3%4%5%7%2%5%4%2%4%4%4%5%4%6%6%4%5%3%1%4%5%4%
4615122410104199410311312435253219251019105856115Less often than once a10%12%13%17%8%10%8%26%9%4%9%8%12%13%11%12%9%15%12%14%6%11%8%11%11%11%year
220583755615930295346682149149131120109898099988756237272510Never50%46%40%39%47%58%59%41%59%51%61%52%54%62%60%43%40%41%53%55%58%51%47%46%55%50%
Page 22
Brassica Vegetables SurveyONLINE Fieldwork: 19th-20th November 2014
Absolutes/col percents
Table 22Q.1 Approximately how often, if ever, do you tend to use each of the following vegetables in your meals?Base: All respondentsKale
Prepared by Populus

What is the combined annual income of your household, prior toDo you have any children aged 18 orWhich of the following best describestax being deducted?under? If so, how old are they?where you live?
Nochild-Hamlet
Anyren& Iso-Urban>£55kAnyAnyAnyagedagedlatedTown- Pop.
or>£48k->£41k->£34k->£28k->£21k->£14k->£7k-Up toagedagedagedunderNET:18 orDwel-Vil-NET:andoverNET:more£55k£48k£41k£34k£28k£21k£14k£7k16-1811-155-105YesunderlinglageRuralFringe10kUrbanTotal
10103267190213218170557711912996284723161831994084048121011Unweighted base
181436812002092051435384126135105300709151882033984098081011Weighted base
12921379511410952264160563913037010102111181209390501NET: Ever64%67%58%45%47%54%53%36%50%49%48%41%37%43%52%65%54%55%45%51%48%50%
2371336504217101523222157132234366589154190NET: Monthly or more10%23%20%16%18%24%20%12%19%18%18%17%20%19%19%14%18%18%16%22%19%19%
-1131410165387831938*131317264457NET: Weekly or more-5%1%3%7%5%8%4%6%10%6%6%3%6%5%3%7%6%4%6%5%6%
-1---*211112-32---1455Every day-5%---*1%1%1%1%1%1%-1%*---*1%1%*
----727214331915*557111924A few times a week----3%1%3%1%1%5%2%2%1%3%2%3%3%3%2%3%2%2%
--13777323421721-889112028Once a week--1%3%3%3%3%2%3%3%3%2%1%2%3%-4%4%2%3%2%3%
-1541019635211841539-8817304654Once a fortnight-6%14%5%5%9%3%2%9%2%8%6%4%5%5%-4%4%4%7%6%5%
2226132121836571423562141531336480Once a month10%11%4%8%6%10%10%6%5%7%4%5%13%8%8%11%7%8%8%8%8%8%
8-913322734108101617530122324275768125152A few times a year43%-24%17%16%13%17%7%15%11%13%12%5%10%17%22%13%13%14%17%15%15%
-13310967359571530*141516143045Once a year-7%8%4%5%4%3%5%6%6%7%4%7%5%4%3%8%7%4%3%4%4%
25261628281851213116288742933433982115Less often than once a11%38%6%8%8%13%13%13%10%14%10%8%6%9%12%26%16%16%11%9%10%11%year
651545105969592274266796617033958792218200418510Never36%33%42%55%53%46%47%64%50%51%52%59%63%57%48%35%46%45%55%49%52%50%
Page 23
Brassica Vegetables SurveyONLINE Fieldwork: 19th-20th November 2014
Absolutes/col percents
Table 23Q.1 Approximately how often, if ever, do you tend to use each of the following vegetables in your meals?Base: All respondentsKale
Prepared by Populus

Marital StatusWhich of the following ITV regions do you live in?NET:Mar-ried/
NET:CivilWid-part-owed/ner-separ-Civilship/ated/CoPart-coWest-
Div-Separ-Wid-div-Hab-ner-Mar-hab-York-count-WalesTyneScot-Meri-Gran-Gram-Cent-orcedatedowedorceditingshiprieditingSingleshirery& WestTeestishdianLondonadapianralAngliaTotal
98124015014414446604250572754337798186110134101241011Unweighted base
84114213714215452608262543149428382199114137101071011Weighted base
43327737552223021243713202034471154462646501NET: Ever51%27%63%53%53%31%49%50%47%69%43%41%48%42%57%58%39%45%62%43%50%
93618422781224883881320542116118190NET: Monthly or more11%27%14%13%30%13%17%20%18%14%9%17%20%16%25%27%18%12%14%17%19%
--2214117332111122421104-657NET: Weekly or more--5%2%10%9%4%5%8%1%5%3%6%2%5%11%9%3%-6%6%
----1-222-11--12-*--5Every day----1%-**1%-2%2%--1%1%-*--*
--11816148111-21742-424A few times a week--2%1%6%4%1%2%3%1%3%1%-2%1%4%4%1%-4%2%
--1161101610---2-31262-228Once a week--3%1%4%5%2%3%4%---6%-3%6%5%1%-2%3%
3-1511-2637122-51371733-354Once a fortnight4%-3%4%8%-6%6%5%4%-10%3%4%9%8%3%2%-3%5%
6321117134521651248916791980Once a month7%27%5%8%12%4%8%9%6%9%4%4%11%9%11%8%6%7%14%8%8%
21-82818*6785381886891026921314152A few times a year25%-19%21%13%3%15%14%14%34%27%12%19%11%13%13%8%15%31%13%15%
6-5103*232773-3145948-345Once a year7%-11%8%2%2%5%4%3%6%-5%2%5%6%5%3%6%-3%4%
8-8161125467318233911261117212115Less often than once a9%-19%11%8%12%12%11%12%14%7%6%7%11%14%13%9%13%16%11%11%year
41815646710230307137171829224835837075460510Never49%73%37%47%47%69%51%50%53%31%57%59%52%58%43%42%61%55%38%57%50%
Page 24
Brassica Vegetables SurveyONLINE Fieldwork: 19th-20th November 2014
Absolutes/col percents
Table 24Q.1 Approximately how often, if ever, do you tend to use each of the following vegetables in your meals?Base: All respondentsKale
Prepared by Populus

Which of the following cities do you live in, or nearest to?None ofPly-South-Brigh-MiltonBirm-Nott-Liver-Manch-Shef-New-Edin-theseCardiffmouthBristolamptonLondonOxfordtonKeynesNorwichinghaminghampoolesterfieldHullLeedscastleburghGlasgowTotal
794336314122114213562764937732813453334401011Unweighted base
703829353223014212755894736743411454238451011Weighted base
251718232313351010253728202518624192214501NET: Ever36%44%61%66%70%58%34%49%35%46%42%59%55%34%54%51%54%46%59%31%50%
684112623457115911539996190NET: Monthly or more8%22%15%4%39%27%24%19%17%13%12%11%25%15%15%30%21%21%25%12%19%
1111420--324-63--423157NET: Weekly or more1%4%2%2%14%9%--12%4%4%-16%5%--8%6%7%2%6%
-1-111----*---------5Every day-2%-2%4%1%----*---------*
-11-27--112-22--2-3124A few times a week-1%2%-6%3%--5%3%2%-4%2%--5%-7%2%2%
1---112--212-42--12--28Once a week1%---3%5%--6%2%2%-12%2%--3%6%--3%
151-62211*-111241311254Once a fortnight1%13%4%-18%9%4%3%1%-1%3%4%2%12%6%7%3%3%5%5%
42212203315642613356280Once a month6%5%8%2%7%9%20%16%4%8%6%8%5%8%3%24%6%12%15%5%8%
567145321-2101610546110783152A few times a year8%16%25%41%15%14%5%-7%19%17%20%13%6%17%7%23%16%22%6%15%
3122214---1332311411345Once a year4%1%8%5%5%6%---3%3%6%5%4%4%7%8%2%3%6%4%
11246425163691047611343115Less often than once a16%6%13%16%12%11%5%30%11%11%10%22%11%9%18%7%3%7%10%7%11%year
4521111299891118305219164916621221531510Never64%56%39%34%30%42%66%51%65%54%58%41%45%66%46%49%46%54%41%69%50%
Page 25
Brassica Vegetables SurveyONLINE Fieldwork: 19th-20th November 2014
Absolutes/col percents
Table 25Q.1 Approximately how often, if ever, do you tend to use each of the following vegetables in your meals?Base: All respondentsKale
Prepared by Populus
EmploymentSectorRegionSocial GradeAgeGender
York-shire
EastWest&Pri-SouthSouthEast-Mid-Mid-Humb-NorthNorthScot-vatePublicWestEastLondonernWaleslandslandsersideWestEastlandDEC2C1AB65+55-6445-5435-4425-3418-24FemaleMaleTotal
42011896155116121577578881093284262210315224227176198188130924805311011Unweighted base
439127911421311015171919111140912402202802702201501801701701205164951011Weighted base
36010876125114884263797187407720218624423121213716213612094450413863NET: Ever82%85%84%89%87%87%83%89%87%78%78%99%85%84%84%87%85%96%92%90%80%71%78%87%83%85%
169423465574424213135441829109751161031116481544349199203402NET: Monthly or more38%33%37%46%44%43%47%30%35%38%39%46%32%45%34%41%38%51%42%45%32%25%40%39%41%40%
872418432529151117182291365405955683541192432110109219NET: Weekly or more20%19%20%30%19%28%29%15%19%20%20%22%14%27%18%21%20%31%23%23%11%14%27%21%22%22%
2--21--------*2---**-11122Every day1%--1%1%--------*1%---**-*1%***
2696117128457736301220162915136610393978A few times a week6%7%6%8%6%12%15%6%6%8%7%8%7%13%5%7%6%13%10%7%3%3%8%8%8%8%
5914123016167612111567342639393920281318217168139Once a week13%11%14%21%13%16%14%9%13%12%14%14%8%14%12%14%15%18%13%15%8%11%18%14%14%14%
4058121363479777261022261915211469384684Once a fortnight9%4%9%9%10%6%7%5%8%10%6%17%8%11%5%8%10%9%10%12%8%4%8%7%9%8%
4113710209677715381725352124141921128514899Once a month9%10%8%7%15%9%11%10%7%8%13%7%9%7%11%12%8%11%9%11%13%7%6%10%10%10%
12746253840341335292724152959788685815358485016167140307A few times a year29%36%28%27%30%33%26%49%32%29%21%36%32%24%35%31%31%37%36%32%28%30%14%32%28%30%
561715191564619916717303137351617222924247360132Once a year13%13%16%13%11%6%7%8%21%10%15%17%19%12%14%13%13%7%11%12%17%14%20%14%12%13%
93342411--3-35269431436111021Less often than once a2%3%3%3%2%4%3%2%--3%-3%2%1%2%3%2%2%*3%2%5%2%2%2%year
7919151617139812202411338353639813183450266682148Never18%15%16%11%13%13%17%11%13%22%22%1%15%16%16%13%15%4%8%10%20%29%22%13%17%15%
Page 26
Brassica Vegetables SurveyONLINE Fieldwork: 19th-20th November 2014
Absolutes/col percents
Table 26Q.1 Approximately how often, if ever, do you tend to use each of the following vegetables in your meals?Base: All respondentsBrussel Sprouts
Prepared by Populus

What is the combined annual income of your household, prior toDo you have any children aged 18 orWhich of the following best describestax being deducted?under? If so, how old are they?where you live?
Nochild-Hamlet
Anyren& Iso-Urban>£55kAnyAnyAnyagedagedlatedTown- Pop.
or>£48k->£41k->£34k->£28k->£21k->£14k->£7k-Up toagedagedagedunderNET:18 orDwel-Vil-NET:andoverNET:more£55k£48k£41k£34k£28k£21k£14k£7k16-1811-155-105YesunderlinglageRuralFringe10kUrbanTotal
10103267190213218170557711912996284723161831994084048121011Unweighted base
181436812002092051435384126135105300709151882033984098081011Weighted base
1313316316718318212143771171157924861213173186326351677863NET: Ever70%95%85%78%84%88%89%85%81%92%93%85%75%83%86%89%92%92%82%86%84%85%
57172179908062203155563711228858085164153317402NET: Monthly or more26%49%46%25%40%43%39%43%37%37%44%41%35%37%41%32%42%42%41%37%39%40%
539143450424071224282049169251539175166219NET: Weekly or more26%25%26%18%17%24%21%28%13%15%19%21%19%16%24%16%27%26%23%18%21%22%
-----*2*---112*---*222Every day-----*1%*---1%1%1%*---****
-314102015124476511671252631225278A few times a week-19%3%5%5%10%7%8%8%4%5%5%4%4%9%5%13%13%8%5%6%8%
51811243025282917211435102226276051111139Once a week26%5%23%13%12%14%12%19%4%10%13%15%13%12%14%10%14%13%15%13%14%14%
-15417131613991612427571141534356984Once a fortnight-7%14%4%8%6%8%9%17%11%13%9%4%9%8%5%8%7%9%8%9%8%
-22328272384915151337622141639448399Once a month-18%6%3%14%13%11%6%8%11%12%11%12%12%9%11%8%8%10%11%10%10%
758286164664211283035237323376774105128233307A few times a year39%35%22%35%30%31%32%29%21%33%23%26%22%24%33%51%35%36%26%31%29%30%
-25142521321611173123165676125264660106132Once a year-11%15%18%13%10%15%11%21%20%25%17%15%19%11%7%13%13%12%15%13%13%
1-1-294211123615-111192021Less often than once a4%-2%-1%4%2%2%2%1%1%2%3%2%2%-1%1%3%2%2%2%year
5151832262222107920265296216177259131148Never30%5%15%22%16%12%11%15%19%8%7%15%25%17%14%11%8%8%18%14%16%15%
Page 27
Brassica Vegetables SurveyONLINE Fieldwork: 19th-20th November 2014
Absolutes/col percents
Table 27Q.1 Approximately how often, if ever, do you tend to use each of the following vegetables in your meals?Base: All respondentsBrussel Sprouts
Prepared by Populus

Marital StatusWhich of the following ITV regions do you live in?NET:Mar-ried/
NET:CivilWid-part-owed/ner-separ-Civilship/ated/CoPart-coWest-
Div-Separ-Wid-div-Hab-ner-Mar-hab-York-count-WalesTyneScot-Meri-Gran-Gram-Cent-orcedatedowedorceditingshiprieditingSingleshirery& WestTeestishdianLondonadapianralAngliaTotal
98124015014414446604250572754337798186110134101241011Unweighted base
84114213714215452608262543149428382199114137101071011Weighted base
751040125112841052920444274040697217591122992863NET: Ever89%91%95%91%79%53%91%87%78%82%86%82%97%84%87%88%80%89%94%87%85%
30318514562102608920623182345834350748402NET: Monthly or more36%28%42%37%32%38%46%43%34%36%19%47%44%28%55%42%37%36%67%45%40%
111820292113144541251591128402123333219NET: Weekly or more14%6%19%15%21%11%25%24%21%22%15%30%21%13%34%20%19%17%29%31%22%
------22*-----21----2Every day------***-----2%*----*
414991425118518348106931378A few times a week5%6%9%6%6%4%9%8%7%10%4%16%7%5%10%5%5%7%29%12%8%
7-5122016991357376718281514-20139Once a week8%-11%8%14%7%15%15%14%12%11%14%14%8%22%14%13%10%-19%14%
8141451445020513759198132584Once a fortnight10%7%10%10%3%7%10%8%8%8%4%6%16%6%11%10%7%9%21%5%8%
1025171135266153-637925141421099Once a month12%15%12%12%8%19%12%11%6%6%-12%7%9%10%12%12%10%17%9%10%
365165732215018565131112152820622850132307A few times a year43%48%37%41%23%15%33%30%25%24%34%26%36%34%25%31%24%37%7%30%30%
7161530-4677411094715525172028132Once a year9%8%15%11%21%-10%13%16%18%29%8%16%18%6%13%15%15%20%7%13%
21*34-389211-31441-421Less often than once a2%7%1%2%3%-1%1%4%4%4%2%-4%1%2%3%1%-4%2%year
91212307427957104911310242315114148Never11%9%5%9%21%47%9%13%22%18%14%18%3%16%13%12%20%11%6%13%15%
Page 28
Brassica Vegetables SurveyONLINE Fieldwork: 19th-20th November 2014
Absolutes/col percents
Table 28Q.1 Approximately how often, if ever, do you tend to use each of the following vegetables in your meals?Base: All respondentsBrussel Sprouts
Prepared by Populus

Which of the following cities do you live in, or nearest to?None ofPly-South-Brigh-MiltonBirm-Nott-Liver-Manch-Shef-New-Edin-theseCardiffmouthBristolamptonLondonOxfordtonKeynesNorwichinghaminghampoolesterfieldHullLeedscastleburghGlasgowTotal
794336314122114213562764937732813453334401011Unweighted base
703829353223014212755894736743411454238451011Weighted base
5930262432204121524497738335530937413336863NET: Ever84%80%89%67%100%88%87%74%86%90%87%81%91%74%90%83%81%97%87%81%85%
3115146221001111323291421228421201511402NET: Monthly or more44%40%48%18%69%43%7%51%49%42%32%30%58%30%25%39%47%48%40%24%40%
21910313521681615515632141166219NET: Weekly or more30%23%34%8%39%23%4%28%29%30%16%10%41%8%8%14%31%26%16%14%22%
----*2--------------2Every day----1%1%--------------*
4351214-12963833-554278A few times a week6%7%18%2%6%6%-6%7%16%6%6%21%4%8%-10%12%10%5%8%
16652103715679273-29624139Once a week23%16%16%7%32%16%4%23%22%13%10%4%20%5%-14%21%14%5%9%14%
3213419*432831613577*84Once a fortnight5%6%5%10%12%8%3%20%10%4%9%5%3%8%4%25%11%16%18%1%8%
742-628-135675104-223499Once a month10%12%9%-18%12%-3%10%8%7%15%14%14%13%-4%5%7%9%10%
2311777726471931186181941014815307A few times a year33%29%25%21%22%31%46%18%27%34%34%37%16%25%56%37%23%33%21%34%30%
433922841251865123157710132Once a year5%8%10%25%6%12%29%5%6%9%20%12%14%16%9%7%11%16%17%23%13%
1121131-12-112----3-21Less often than once a1%2%7%4%4%1%5%-4%4%-1%3%3%----8%-2%year
118312-272546129320328159148Never16%20%11%33%-12%13%26%14%10%13%19%9%26%10%17%19%3%13%19%15%
Page 29
Brassica Vegetables SurveyONLINE Fieldwork: 19th-20th November 2014
Absolutes/col percents
Table 29Q.1 Approximately how often, if ever, do you tend to use each of the following vegetables in your meals?Base: All respondentsBrussel Sprouts
Prepared by Populus

EmploymentSectorRegionSocial GradeAgeGender
York-shire
EastWest&Pri-SouthSouthEast-Mid-Mid-Humb-NorthNorthScot-vatePublicWestEastLondonernWaleslandslandsersideWestEastlandDEC2C1AB65+55-6445-5435-4425-3418-24FemaleMaleTotal
42011896155116121577578881093284262210315224227176198188130924805311011Unweighted base
439127911421311015171919111140912402202802702201501801701701205164951011Weighted base
4341258814013199497189901064090232219276265219144177167168117508484993NET: Ever99%99%97%99%100%98%97%100%98%99%95%100%99%97%99%98%98%99%96%98%98%99%98%99%98%98%
409118861341269644658485993981215210257256210134171153161108482456938NET: Monthly or more93%93%94%95%96%95%86%91%92%94%89%96%89%89%95%92%95%95%90%95%90%95%90%93%92%93%
341947511198853851687485316218218620520518511114912512980400379778NET: Weekly or more78%74%82%78%74%84%76%72%75%82%76%77%68%76%85%73%76%84%74%83%73%76%67%77%76%77%
1822593*16231-114711396618191433Every day4%1%2%3%7%3%1%2%7%3%3%2%-5%2%2%4%1%6%3%3%*7%4%3%3%
2125350744860192943375024391071151241251166696708242247225472A few times a week48%42%55%52%36%59%37%41%48%41%45%58%43%45%52%44%46%52%44%53%41%48%35%48%45%47%
1113923324122192118353272363677568663647494630134140273Once a week25%31%25%22%31%22%38%30%20%38%29%17%26%26%31%27%25%30%24%26%29%27%25%26%28%27%
431581716847126631018163428181614181416504696Once a fortnight10%12%8%12%12%8%8%10%14%6%6%6%11%7%7%12%10%8%10%8%11%8%13%10%9%9%
2493713316358591671724888101912333164Once a month6%7%4%5%10%3%2%9%4%6%7%13%10%7%3%6%9%3%5%5%6%11%10%6%6%6%
2152532564562616618781051167232447A few times a year5%4%2%4%3%2%11%9%5%5%5%4%6%7%3%7%3%3%7%3%6%4%6%5%5%5%
31*-1-------3-4-*--12-1224Once a year1%1%*-1%-------3%-2%-*--1%1%-1%***
1--1*---1-1-11-111--111134Less often than once a*--1%*---1%-1%-1%1%-*1%*--1%1%1%*1%*year
6231122-216-1814526332371118Never1%1%3%1%*2%3%-2%1%5%-1%3%1%2%2%1%4%2%2%1%2%1%2%2%
Page 30
Brassica Vegetables SurveyONLINE Fieldwork: 19th-20th November 2014
Absolutes/col percents
Table 30Q.1 Approximately how often, if ever, do you tend to use each of the following vegetables in your meals?Base: All respondentsCarrots
Prepared by Populus

What is the combined annual income of your household, prior toDo you have any children aged 18 orWhich of the following best describestax being deducted?under? If so, how old are they?where you live?
Nochild-Hamlet
Anyren& Iso-Urban>£55kAnyAnyAnyagedagedlatedTown- Pop.
or>£48k->£41k->£34k->£28k->£21k->£14k->£7k-Up toagedagedagedunderNET:18 orDwel-Vil-NET:andoverNET:more£55k£48k£41k£34k£28k£21k£14k£7k16-1811-155-105YesunderlinglageRuralFringe10kUrbanTotal
10103267190213218170557711912996284723161831994084048121011Unweighted base
181436812002092051435384126135105300709151882033984098081011Weighted base
18143681197207199140538312613210429669415181195395402797993NET: Ever100%100%100%100%99%99%97%98%99%99%100%98%99%99%98%100%96%96%99%98%99%98%
17143681190194183130497812413110429064614174188377373750938NET: Monthly or more96%100%100%100%95%93%89%90%92%93%99%97%98%97%91%95%92%92%95%91%93%93%
1210307315815914911537691101087724053711153164311302614778NET: Weekly or more64%74%84%90%79%76%73%80%69%83%88%80%73%80%76%78%81%81%78%74%76%77%
-1-35454518821023-5513162833Every day-5%-3%2%2%2%3%9%1%7%6%1%3%3%-2%2%3%4%4%3%
652137991089766164565574714232911107118192162354472A few times a week32%35%58%46%49%51%47%46%29%54%52%42%45%47%47%75%57%58%48%40%44%47%
6593355474845172437432988185*4242107124231273Once a week32%34%26%41%27%22%23%31%31%28%29%32%27%29%26%3%22%21%27%30%29%27%
31561823198768141128682141641387996Once a fortnight15%8%14%7%9%11%9%5%13%8%6%11%10%9%10%17%7%8%10%9%10%9%
331214131575269152241-7725325764Once a month18%18%2%3%7%6%7%5%9%3%5%6%15%7%6%-4%4%6%8%7%6%
1---51115101521164017717233947A few times a year4%---3%5%7%7%3%6%1%1%1%2%6%5%4%4%4%6%5%5%
----11*-1-----4---1344Once a year----*1%*-2%-----1%---*1%1%*
----1-111-----4----444Less often than once a----*-*1%2%-----1%----1%**year
----326311-31415-88381118Never----1%1%3%2%1%1%-2%1%1%2%-4%4%1%2%1%2%
Page 31
Brassica Vegetables SurveyONLINE Fieldwork: 19th-20th November 2014
Absolutes/col percents
Table 31Q.1 Approximately how often, if ever, do you tend to use each of the following vegetables in your meals?Base: All respondentsCarrots
Prepared by Populus

Marital StatusWhich of the following ITV regions do you live in?NET:Mar-ried/
NET:CivilWid-part-owed/ner-separ-Civilship/ated/CoPart-coWest-
Div-Separ-Wid-div-Hab-ner-Mar-hab-York-count-WalesTyneScot-Meri-Gran-Gram-Cent-orcedatedowedorceditingshiprieditingSingleshirery& WestTeestishdianLondonadapianralAngliaTotal
98124015014414446604250572754337798186110134101241011Unweighted base
84114213714215452608262543149428382199114137101071011Weighted base
8311421361401544359725551314742818119710913510105993NET: Ever99%100%100%100%99%100%98%98%98%94%100%97%100%98%99%99%95%98%100%98%98%
7611371241341443258023149314340727619110112610101938NET: Monthly or more90%100%89%91%94%97%96%95%88%91%100%87%96%87%93%96%88%92%100%95%93%
641130104100123714831894324383254671508798990778NET: Weekly or more76%96%71%76%71%79%82%79%72%80%77%78%77%65%81%76%76%72%94%84%77%
3-374-10141211*1-31037-533Every day4%-8%5%3%-2%2%5%1%2%1%2%-4%5%3%5%-4%3%
3471758687234309104301718253443865359659472A few times a week41%67%41%43%48%47%52%51%40%56%54%38%59%41%53%43%46%43%55%56%47%
273939285127160721261972020553131426273Once a week32%29%22%29%20%32%28%26%28%23%21%39%16%24%25%27%27%23%39%24%27%
9*6151314155255343109216211896Once a fortnight10%4%13%11%9%10%9%9%10%10%10%7%7%12%11%11%5%16%6%8%9%
3-252112042161415912087-364Once a month4%-5%4%15%9%4%7%6%1%13%2%12%11%1%10%7%5%-3%6%
6-5115*1015202-5264478-447A few times a year8%-11%8%4%3%2%3%7%3%-10%4%7%5%2%6%6%-3%5%
1--1----3----3*1----4Once a year1%--1%----1%----3%1%*----*
----1-112----11*11--4Less often than once a----*-**1%----1%1%*1%1%--*year
1--12-91163-2-11262-218Never1%--*1%-2%2%2%6%-3%-2%1%1%5%2%-2%2%
Page 32
Brassica Vegetables SurveyONLINE Fieldwork: 19th-20th November 2014
Absolutes/col percents
Table 32Q.1 Approximately how often, if ever, do you tend to use each of the following vegetables in your meals?Base: All respondentsCarrots
Prepared by Populus

Which of the following cities do you live in, or nearest to?None ofPly-South-Brigh-MiltonBirm-Nott-Liver-Manch-Shef-New-Edin-theseCardiffmouthBristolamptonLondonOxfordtonKeynesNorwichinghaminghampoolesterfieldHullLeedscastleburghGlasgowTotal
794336314122114213562764937732813453334401011Unweighted base
703829353223014212755894736743411454238451011Weighted base
65362734322281420275487473673341145423744993NET: Ever93%96%93%97%100%99%100%97%97%99%98%100%100%98%100%93%100%100%99%98%98%
59312534312201419255481443369321143403240938NET: Monthly or more84%83%87%97%97%96%100%93%91%99%91%94%92%93%96%93%95%96%85%89%93%
51282327291751018224965323057271038332529778NET: Weekly or more74%76%80%76%90%76%74%85%81%89%73%69%84%77%79%86%85%79%65%66%77%
2*11410--*261211-21--33Every day3%1%2%2%12%5%--2%3%6%3%6%1%2%-4%2%--3%
33919161610341510354220233213519261319472A few times a week48%25%64%45%49%45%32%73%37%64%47%42%63%43%40%42%42%61%35%43%47%
161941096162111218125251351871110273Once a week23%49%13%29%28%27%43%12%42%22%20%24%15%33%37%44%39%16%30%23%27%
63152264114127*63-325596Once a fortnight8%8%5%14%7%11%26%5%5%7%14%15%1%8%9%-6%6%13%10%9%
2-13-20-122452631253664Once a month3%-2%7%-9%-3%6%3%4%11%6%8%8%7%4%11%7%13%6%
552-16-12-53241-222347A few times a year7%12%6%-2%3%-4%6%-6%6%6%5%4%-5%4%6%8%5%
----*1------------3-4Once a year----1%*------------7%-*
1----*----1-1------14Less often than once a1%----*----1%-2%------1%*year
5221-2-1111--2-1--*118Never7%4%7%3%-1%-3%3%1%2%--2%-7%--1%2%2%
Page 33
Brassica Vegetables SurveyONLINE Fieldwork: 19th-20th November 2014
Absolutes/col percents
Table 33Q.1 Approximately how often, if ever, do you tend to use each of the following vegetables in your meals?Base: All respondentsCarrots
Prepared by Populus

EmploymentSectorRegionSocial GradeAgeGender
York-shire
EastWest&Pri-SouthSouthEast-Mid-Mid-Humb-NorthNorthScot-vatePublicWestEastLondonernWaleslandslandsersideWestEastlandDEC2C1AB65+55-6445-5435-4425-3418-24FemaleMaleTotal
42011896155116121577578881093284262210315224227176198188130924805311011Unweighted base
439127911421311015171919111140912402202802702201501801701701205164951011Weighted base
4221238913612799486786901094089237217268257218149177161164110493486979NET: Ever96%97%98%96%96%98%94%95%95%98%98%100%97%99%99%96%95%99%99%98%95%96%91%96%98%97%
391114841271069447628181103367921820324323520913815914915194458442899NET: Monthly or more89%90%92%90%80%93%93%87%90%89%93%90%87%90%92%87%87%95%92%88%88%89%78%89%89%89%
3051017210274844051686877345918216719918217311813511611871384346731NET: Weekly or more69%80%80%72%56%83%80%72%75%74%70%85%65%76%76%71%67%79%79%75%68%69%59%75%70%72%
104141231311327771448133111222Every day2%3%1%3%1%2%5%2%4%1%1%8%2%3%3%3%*2%3%4%1%1%2%2%2%2%
173584860395020383139512135123961051081167473676833230202432A few times a week39%46%53%42%30%50%40%53%34%43%46%52%38%51%43%38%40%53%49%41%40%40%28%45%41%43%
12339233834321712332825102352658673533954474834143133276Once a week28%31%26%27%26%31%34%17%37%31%22%26%25%22%29%31%27%24%26%30%28%28%29%28%27%27%
5267132056676161914212930181314231610336194Once a fortnight12%5%7%9%15%5%12%8%7%7%14%2%10%6%10%10%11%8%9%8%14%9%8%6%12%9%
336512124*577101112114152318710101613403474Once a month8%5%5%9%9%4%1%7%8%8%9%4%12%9%7%6%9%8%5%5%6%10%11%8%7%7%
23936175135834816111720991481112293563A few times a year5%7%4%4%13%5%2%5%5%9%3%10%8%7%5%6%7%4%6%8%5%6%10%6%7%6%
3-*11--1--1-121111-11-2315Once a year1%-*1%1%--1%--1%-1%1%****-1%1%-1%1%**
512131-1-*1-222711222224812Less often than once a1%1%2%1%2%1%-2%-1%1%-2%1%1%2%**2%1%1%1%2%1%2%1%year
184265233513-2331213213961022932Never4%3%2%4%4%2%6%5%5%2%2%-3%1%1%4%5%1%1%2%5%4%9%4%2%3%
Page 34
Brassica Vegetables SurveyONLINE Fieldwork: 19th-20th November 2014
Absolutes/col percents
Table 34Q.1 Approximately how often, if ever, do you tend to use each of the following vegetables in your meals?Base: All respondentsPeas
Prepared by Populus

What is the combined annual income of your household, prior toDo you have any children aged 18 orWhich of the following best describestax being deducted?under? If so, how old are they?where you live?
Nochild-Hamlet
Anyren& Iso-Urban>£55kAnyAnyAnyagedagedlatedTown- Pop.
or>£48k->£41k->£34k->£28k->£21k->£14k->£7k-Up toagedagedagedunderNET:18 orDwel-Vil-NET:andoverNET:more£55k£48k£41k£34k£28k£21k£14k£7k16-1811-155-105YesunderlinglageRuralFringe10kUrbanTotal
10103267190213218170557711912996284723161831994084048121011Unweighted base
181436812002092051435384126135105300709151882033984098081011Weighted base
1614348119619820113553811241299929068715182197387395782979NET: Ever90%100%93%99%98%95%98%94%99%96%99%96%94%97%97%100%97%97%97%97%97%97%
1212328018018418312347751171259427062715178193362345707899NET: Monthly or more65%89%90%98%90%88%89%86%88%89%93%93%89%90%89%100%94%95%91%84%87%89%
6102965148137155108366792105702175139161170299261560731NET: Weekly or more35%75%82%79%74%65%76%75%67%80%73%78%67%72%72%64%85%84%75%64%69%72%
---4464324222616156981622Every day---5%2%3%2%2%4%4%2%1%2%2%2%6%3%3%2%2%2%2%
5310429379857221364862291203126103109170154323432A few times a week25%23%27%52%47%38%42%50%39%43%38%46%28%40%44%38%55%54%43%37%40%43%
2719185152653313284242399018535356120100220276Once a week10%52%54%22%26%25%32%23%24%33%33%31%37%30%26%19%28%27%30%24%27%27%
52291523157861813830633121533478094Once a fortnight29%14%6%11%8%11%7%5%15%7%15%10%7%10%9%20%6%7%8%11%10%9%
--161724138316716235125730366774Once a month--2%8%9%11%6%6%6%2%5%5%15%8%7%16%3%4%8%9%8%7%
52-111131810357451845-4420395963A few times a year26%11%-1%5%6%9%7%5%6%5%3%5%6%6%-2%2%5%10%7%6%
----1-*11-----5---2355Once a year----1%-*1%1%-----1%---*1%1%*
--1-4112311-1110---381212Less often than once a--3%-2%1%*1%5%1%1%-1%*1%---1%2%1%1%year
2-2131138131661022-6611142532Never10%-7%1%2%5%2%6%1%4%1%4%6%3%3%-3%3%3%3%3%3%
Page 35
Brassica Vegetables SurveyONLINE Fieldwork: 19th-20th November 2014
Absolutes/col percents
Table 35Q.1 Approximately how often, if ever, do you tend to use each of the following vegetables in your meals?Base: All respondentsPeas
Prepared by Populus

Marital StatusWhich of the following ITV regions do you live in?NET:Mar-ried/
NET:CivilWid-part-owed/ner-separ-Civilship/ated/CoPart-coWest-
Div-Separ-Wid-div-Hab-ner-Mar-hab-York-count-WalesTyneScot-Meri-Gran-Gram-Cent-orcedatedowedorceditingshiprieditingSingleshirery& WestTeestishdianLondonadapianralAngliaTotal
98124015014414446604250572754337798186110134101241011Unweighted base
84114213714215452608262543149428382199114137101071011Weighted base
8210421341361544659724453314642808019011212910104979NET: Ever98%93%100%98%96%100%99%98%93%98%100%94%100%97%97%96%98%94%100%98%97%
741039123128154235652074930453871731671061211099899NET: Monthly or more88%93%92%90%90%100%94%93%79%91%96%92%91%85%89%84%92%89%100%93%89%
63834105971334545516943234035525712679101990731NET: Weekly or more75%74%81%77%68%88%76%75%64%80%74%81%84%62%69%64%69%74%90%84%72%
2--23-13155-13321415-422Every day3%--2%2%-3%3%2%-2%5%7%2%1%2%1%3%-3%2%
355226261721528387291620223142644956652432A few times a week42%44%53%46%43%47%48%46%33%54%53%40%52%37%51%32%43%41%61%48%43%
25312403361181577714617102014582840334276Once a week30%30%28%29%24%41%26%26%29%26%19%36%25%24%18%29%25%29%29%32%27%
52181324762224351872617101594Once a fortnight6%19%4%6%10%12%10%10%8%7%9%10%3%10%9%13%14%7%10%5%9%
6-3918-30481724*1119151011-474Once a month7%-8%7%12%-7%8%6%4%12%1%3%13%11%8%9%8%-4%7%
4-388-2128273114841947-563A few times a year5%-8%6%5%-5%5%10%5%2%2%9%9%5%9%3%5%-5%6%
1--11-112----12111--5Once a year2%--1%1%-**1%----1%2%*1%1%--*
2--2--22811--2131--112Less often than once a2%--1%--**3%2%2%--2%1%2%1%--1%1%year
21-35-612171-3-22938-232Never2%7%-2%4%-1%2%7%2%-6%-3%3%4%2%6%-2%3%
Page 36
Brassica Vegetables SurveyONLINE Fieldwork: 19th-20th November 2014
Absolutes/col percents
Table 36Q.1 Approximately how often, if ever, do you tend to use each of the following vegetables in your meals?Base: All respondentsPeas
Prepared by Populus

Which of the following cities do you live in, or nearest to?None ofPly-South-Brigh-MiltonBirm-Nott-Liver-Manch-Shef-New-Edin-theseCardiffmouthBristolamptonLondonOxfordtonKeynesNorwichinghaminghampoolesterfieldHullLeedscastleburghGlasgowTotal
794336314122114213562764937732813453334401011Unweighted base
703829353223014212755894736743411454238451011Weighted base
67352934312191420275486443573331145423743979NET: Ever95%92%99%98%98%95%100%97%100%99%97%93%98%98%98%93%100%100%98%97%97%
63342633291931419245380403270301140383239899NET: Monthly or more90%90%89%94%91%84%100%91%89%96%90%85%90%95%89%93%88%91%84%87%89%
53302227241491014224767322946251033372430731NET: Weekly or more76%79%76%77%75%65%73%66%80%86%75%68%82%62%75%86%74%87%62%67%72%
33-123--1131-1--131-22Every day5%7%-2%7%1%--3%1%3%3%-1%--2%7%2%-2%
34121222147931215303223193215619241714432A few times a week48%31%40%63%45%34%23%57%53%54%36%49%53%43%45%52%43%56%45%31%43%
17151148677261732810131041310616276Once a week24%41%37%12%24%29%49%10%24%30%36%16%29%18%30%34%29%23%16%36%27%
64332272323732153-4-2494Once a fortnight9%10%10%8%5%12%14%12%9%6%7%7%6%20%9%-9%-6%9%9%
3*1331723-37511021216574Once a month5%1%2%9%11%7%13%12%-5%8%11%1%13%5%7%5%3%16%11%7%
3121221-13161223-543463A few times a year5%2%5%2%6%9%-2%11%2%7%3%5%2%8%-12%9%8%10%6%
----*1-1---11-----1-5Once a year----1%1%-4%---2%2%-----1%-*
1-11-4-----111*---2-12Less often than once a1%-4%2%-2%-----3%2%1%1%---5%-1%year
33*1111-1-1331111--1232Never5%8%1%2%2%5%-3%-1%3%7%2%2%2%7%--2%3%3%
Page 37
Brassica Vegetables SurveyONLINE Fieldwork: 19th-20th November 2014
Absolutes/col percents
Table 37Q.1 Approximately how often, if ever, do you tend to use each of the following vegetables in your meals?Base: All respondentsPeas
Prepared by Populus

EmploymentSectorRegionSocial GradeAgeGender
York-shire
EastWest&Pri-SouthSouthEast-Mid-Mid-Humb-NorthNorthScot-vatePublicWestEastLondonernWaleslandslandsersideWestEastlandDEC2C1AB65+55-6445-5435-4425-3418-24FemaleMaleTotal
42011896155116121577578881093284262210315224227176198188130924805311011Unweighted base
439127911421311015171919111140912402202802702201501801701701205164951011Weighted base
403114851271199645698283994072209197256256204139162153153107466452918NET: Ever92%90%94%90%90%95%88%97%91%91%89%99%80%87%90%91%95%92%93%90%90%90%89%90%91%91%
303100681079869384556696427481491621851931629711711710888349341689NET: Monthly or more69%79%75%76%75%69%74%63%61%75%58%67%53%62%74%66%72%73%65%65%69%64%73%68%69%68%
17252327050422130334335172180991051111045068566057202193395NET: Weekly or more39%41%35%50%38%42%42%42%37%47%32%43%23%33%45%37%41%47%33%38%33%35%47%39%39%39%
3112-*-11--1-31111-1112145Every day1%*1%2%-*-1%1%--2%-1%1%***-1%**1%*1%1%
73221236231610152317889374043584621342224309484178A few times a week17%18%13%26%18%16%20%21%25%19%7%20%10%15%18%15%22%21%14%19%13%14%25%18%17%18%
962919322725111510262781141586252562934333625107105212Once a week22%23%21%23%21%25%22%21%11%28%25%20%13%17%26%22%19%26%19%19%20%21%21%21%21%21%
702718182417145101512512372844412729283120156485150Once a fortnight16%21%20%12%18%17%28%8%11%16%11%13%13%15%13%16%15%12%19%15%18%12%12%13%17%15%
612218192410210131117515323536423118213028168262144Once a month14%17%20%14%18%10%5%14%14%12%16%12%17%13%16%13%15%14%12%12%18%17%14%16%12%14%
7712151518214222613309155132515537353930341410387189A few times a year18%10%17%11%14%21%7%31%28%15%27%23%17%21%15%18%20%17%23%22%17%20%12%20%18%19%
81-3-2-1-1*-6116513216-5913Once a year2%1%-2%-2%-1%-1%*-7%1%*2%2%*2%1%1%4%-1%2%1%
1512233411-43372143444555101626Less often than once a3%1%2%1%2%3%7%2%1%-4%8%4%3%1%5%1%2%3%2%3%3%4%2%3%3%year
361261513562981211931232414171118171713504393Never8%10%6%10%10%5%12%3%9%9%11%1%20%13%10%9%5%8%7%10%10%10%11%10%9%9%
Page 38
Brassica Vegetables SurveyONLINE Fieldwork: 19th-20th November 2014
Absolutes/col percents
Table 38Q.1 Approximately how often, if ever, do you tend to use each of the following vegetables in your meals?Base: All respondentsGreen Beans
Prepared by Populus

What is the combined annual income of your household, prior toDo you have any children aged 18 orWhich of the following best describestax being deducted?under? If so, how old are they?where you live?
Nochild-Hamlet
Anyren& Iso-Urban>£55kAnyAnyAnyagedagedlatedTown- Pop.
or>£48k->£41k->£34k->£28k->£21k->£14k->£7k-Up toagedagedagedunderNET:18 orDwel-Vil-NET:andoverNET:more£55k£48k£41k£34k£28k£21k£14k£7k16-1811-155-105YesunderlinglageRuralFringe10kUrbanTotal
10103267190213218170557711912996284723161831994084048121011Unweighted base
181436812002092051435384126135105300709151882033984098081011Weighted base
1614338017619418512547781141229227164512175188365365731918NET: Ever90%100%91%98%88%92%90%88%88%93%91%91%88%90%91%83%93%92%92%89%90%91%
1314256414514313085315892956420448410138148274267541689NET: Monthly or more71%100%70%79%73%68%64%59%58%69%73%71%61%68%68%67%73%73%69%65%67%68%
89153982717858132845493610828769095159141300395NET: Weekly or more43%65%41%48%41%34%38%41%24%34%35%36%34%36%40%38%48%47%40%34%37%39%
---12*2---1--14-111345Every day---1%1%*1%---1%--*1%-***1%1%1%
-14114334372751520201247130541466666132178A few times a week-5%10%14%22%16%18%19%10%18%16%15%12%16%18%32%22%23%17%16%16%18%
8811283637383171324292360152148489272164212Once a week43%60%31%34%18%18%19%21%14%16%19%21%22%20%21%6%25%24%23%18%20%21%
327113232301781421211041108329325563117150Once a fortnight19%16%20%14%16%15%14%12%16%17%16%16%9%14%15%20%16%16%14%15%15%15%
233133140231010152625185490119216063124144Once a month10%18%8%17%16%19%11%7%19%18%21%18%17%18%13%9%10%10%15%16%15%14%
3-71226414336132020232156132229318078158189A few times a year19%-20%14%13%20%21%25%25%24%16%17%20%19%19%16%15%15%20%19%20%19%
---32323--11567-5535913Once a year---3%1%1%1%2%--*1%5%2%1%-2%2%1%1%1%1%
--1236912*332522-447152226Less often than once a--2%2%1%3%4%1%5%*2%2%2%2%3%-2%2%2%4%3%3%year
2-32231620187611131329643131633447793Never10%-9%2%12%8%10%12%12%7%9%9%12%10%9%17%7%8%8%11%10%9%
Page 39
Brassica Vegetables SurveyONLINE Fieldwork: 19th-20th November 2014
Absolutes/col percents
Table 39Q.1 Approximately how often, if ever, do you tend to use each of the following vegetables in your meals?Base: All respondentsGreen Beans
Prepared by Populus

Marital StatusWhich of the following ITV regions do you live in?NET:Mar-ried/
NET:CivilWid-part-owed/ner-separ-Civilship/ated/CoPart-coWest-
Div-Separ-Wid-div-Hab-ner-Mar-hab-York-count-WalesTyneScot-Meri-Gran-Gram-Cent-orcedatedowedorceditingshiprieditingSingleshirery& WestTeestishdianLondonadapianralAngliaTotal
98124015014414446604250572754337798186110134101241011Unweighted base
84114213714215452608262543149428382199114137101071011Weighted base
8110381291261441155123451294341647218110212510103918NET: Ever97%91%90%94%89%97%91%91%89%94%93%88%99%77%88%91%90%92%100%96%91%
587238894143254321664122372941611506885777689NET: Monthly or more70%65%54%64%66%93%72%71%63%77%70%76%68%49%75%76%60%62%73%72%68%
31513484311185239107191221181634874149348395NET: Weekly or more37%46%30%35%30%74%41%39%41%35%40%43%43%19%41%44%36%36%29%45%39%
----2-232---1-11-1-25Every day----1%-*1%1%---2%-1%*-1%-2%1%
114723192841054967108715451329119178A few times a week14%40%18%17%13%16%19%17%19%12%23%21%20%8%19%22%12%21%8%18%18%
19152523910013156125119918412820227212Once a week23%6%12%18%16%58%22%22%21%23%17%23%22%11%22%21%24%14%21%26%21%
141418191799930116136915281217317150Once a fortnight16%8%9%13%13%7%17%16%12%20%20%27%15%11%18%14%10%12%26%16%15%
141621322609428123241512351619212144Once a month17%10%15%16%22%11%13%15%11%21%10%5%10%19%15%18%14%14%18%11%14%
21314382717098548639148272939320189A few times a year25%27%33%27%19%5%16%16%21%15%21%5%23%17%9%14%26%29%27%19%19%
--111-893----631*--213Once a year--2%*1%-2%2%1%----7%3%**--2%1%
2-125-81211114331341-326Less often than once a2%-1%2%3%-2%2%4%2%2%7%8%4%1%2%4%1%-3%3%year
314815*41572832611910171212-493Never3%9%10%6%11%3%9%9%11%6%7%12%1%23%12%9%10%8%-4%9%
Page 40
Brassica Vegetables SurveyONLINE Fieldwork: 19th-20th November 2014
Absolutes/col percents
Table 40Q.1 Approximately how often, if ever, do you tend to use each of the following vegetables in your meals?Base: All respondentsGreen Beans
Prepared by Populus

Which of the following cities do you live in, or nearest to?None ofPly-South-Brigh-MiltonBirm-Nott-Liver-Manch-Shef-New-Edin-theseCardiffmouthBristolamptonLondonOxfordtonKeynesNorwichinghaminghampoolesterfieldHullLeedscastleburghGlasgowTotal
794336314122114213562764937732813453334401011Unweighted base
703829353223014212755894736743411454238451011Weighted base
5938263430211917275381452968321141423234918NET: Ever84%100%90%97%94%92%66%81%100%96%91%96%80%91%96%93%92%100%85%76%91%
443220282717481224355330214523935282320689NET: Monthly or more63%85%69%79%85%76%57%59%87%63%60%63%58%60%69%75%77%68%61%45%68%
24189121797481225322314241552017128395NET: Weekly or more34%47%30%35%53%42%32%39%45%46%36%49%38%32%43%40%45%41%31%18%39%
*---3-----1------1--5Every day1%---9%-----1%------2%--1%
88437492677229631135835178A few times a week12%21%14%8%22%21%13%27%27%14%25%19%17%4%33%27%12%20%9%11%18%
1510510749325189148213115883212Once a week21%26%16%27%22%21%18%12%18%32%10%30%21%28%10%13%33%20%22%7%21%
11124963632678258529556150Once a fortnight15%32%13%26%18%16%22%10%22%14%9%5%13%10%13%14%19%12%13%13%15%
9286441*252134313426676144Once a month13%6%26%18%14%18%3%10%19%4%14%9%7%17%12%21%13%14%17%14%14%
142562331121527137199261069189A few times a year20%5%18%16%6%14%9%7%8%27%30%28%20%26%27%18%14%25%15%19%19%
*----1-3-2-1-*--1-1513Once a year1%----*-12%-4%-1%-1%--1%-4%10%1%
141113-1111114---32126Less often than once a1%9%4%2%4%1%-3%5%2%1%3%2%5%---8%5%2%3%year
11-3121954-28276114-61193Never16%-10%3%6%8%34%19%-4%9%4%20%9%4%7%8%-15%24%9%
Page 41
Brassica Vegetables SurveyONLINE Fieldwork: 19th-20th November 2014
Absolutes/col percents
Table 41Q.1 Approximately how often, if ever, do you tend to use each of the following vegetables in your meals?Base: All respondentsGreen Beans
Prepared by Populus

EmploymentSectorRegionSocial GradeAgeGender
York-shire
EastWest&Pri-SouthSouthEast-Mid-Mid-Humb-NorthNorthScot-vatePublicWestEastLondonernWaleslandslandsersideWestEastlandDEC2C1AB65+55-6445-5435-4425-3418-24FemaleMaleTotal
42011896155116121577578881093284262210315224227176198188130924805311011Unweighted base
439127911421311015171919111140912402202802702201501801701701205164951011Weighted base
403115841291238841627984923981201198255246192133162140161113463438901NET: Ever92%91%92%91%94%87%82%87%87%92%82%95%89%84%90%91%91%87%89%90%82%95%94%90%88%89%
31310355989866324463727028521541521761961259412810713292362315677NET: Monthly or more71%81%60%69%74%66%63%62%69%79%63%69%58%64%69%63%72%57%63%71%63%77%76%70%64%67%
207632960473721264349421825919996112554377718765216181398NET: Weekly or more47%49%32%43%36%36%42%37%48%53%38%46%27%38%45%34%42%25%29%43%42%51%54%42%37%39%
511211*-3--1-2321-22112458Every day1%1%1%1%1%1%1%-3%--2%-1%1%1%*-1%1%1%1%2%1%1%1%
93251626211768261719512423837541920313142289280172A few times a week21%20%17%18%16%17%11%11%29%18%17%13%14%18%17%13%20%9%13%17%18%25%23%18%16%17%
1083612332619151815322312124657575736214339443412097217Once a week25%29%14%23%20%19%30%25%16%35%21%31%13%19%26%20%21%16%14%24%23%26%29%23%20%21%
65191216302069111213415282446483626281531127374147Once a fortnight15%15%14%11%23%19%11%12%12%13%12%9%17%12%11%17%18%16%17%15%9%18%10%14%15%15%
4122132121105991215613362933353425232114157360133Once a month9%17%14%15%16%10%10%13%9%13%13%14%14%15%13%12%13%16%17%13%12%8%12%14%12%13%
67102321151751799131122383059364630282220177885162A few times a year15%8%25%15%12%17%9%24%10%10%11%26%24%16%13%21%13%21%20%15%13%12%14%15%17%16%
12211611-115-4367563-26481421Once a year3%1%1%1%4%1%2%-1%1%5%-4%1%3%3%2%3%2%-1%4%3%2%3%2%
12*595231624-361113101567931162440Less often than once a3%*6%6%3%2%7%1%6%2%4%-3%2%5%5%4%7%4%4%5%2%1%3%5%4%year
361171281399127202103922252429171830975258110Never8%9%8%9%6%13%18%13%13%8%18%5%11%16%10%9%9%13%11%10%18%5%6%10%12%11%
Page 42
Brassica Vegetables SurveyONLINE Fieldwork: 19th-20th November 2014
Absolutes/col percents
Table 42Q.1 Approximately how often, if ever, do you tend to use each of the following vegetables in your meals?Base: All respondentsSweetcorn
Prepared by Populus

What is the combined annual income of your household, prior toDo you have any children aged 18 orWhich of the following best describestax being deducted?under? If so, how old are they?where you live?
Nochild-Hamlet
Anyren& Iso-Urban>£55kAnyAnyAnyagedagedlatedTown- Pop.
or>£48k->£41k->£34k->£28k->£21k->£14k->£7k-Up toagedagedagedunderNET:18 orDwel-Vil-NET:andoverNET:more£55k£48k£41k£34k£28k£21k£14k£7k16-1811-155-105YesunderlinglageRuralFringe10kUrbanTotal
10103267190213218170557711912996284723161831994084048121011Unweighted base
181436812002092051435384126135105300709151882033984098081011Weighted base
1714347418418917712046711141229727362515165180348373721901NET: Ever94%100%96%91%92%90%86%84%87%85%91%90%92%91%88%100%88%89%87%91%89%89%
13112759138146125843756891068722545011126137248292540677NET: Monthly or more73%76%74%73%69%70%61%59%69%67%71%78%83%75%64%76%67%68%62%71%67%67%
98153580917449183461695715024647983133182315398NET: Weekly or more51%54%42%43%40%43%36%34%34%40%48%51%54%50%35%28%42%41%33%44%39%39%
---2213*---2235-332468Every day---2%1%1%1%*---2%2%1%1%-1%1%1%1%1%1%
3141342283820121734311564107326295489143172A few times a week19%5%12%15%21%13%18%14%23%21%27%23%14%21%15%18%14%14%13%22%18%17%
6711213661332861627364082134250517789166217Once a week32%49%29%25%18%29%16%20%12%20%21%27%38%27%19%11%26%25%19%22%21%21%
127132637231910918271640106424285663119147Once a fortnight4%15%21%16%13%18%11%13%18%10%14%20%15%13%15%30%13%14%14%15%15%15%
3141133192817914109143598324265947106133Once a month18%7%12%14%16%9%14%12%16%17%8%7%14%12%14%18%13%13%15%11%13%13%
4361525334023771714936126234366858126162A few times a year21%24%17%18%12%16%19%16%14%9%14%10%8%12%18%14%18%18%17%14%16%16%
----131331112-219-111292021Once a year----7%*2%2%2%1%1%1%-1%3%-1%1%3%2%3%2%
--218891017711103014521143440Less often than once a--4%1%4%4%4%7%2%8%5%*1%3%4%10%2%3%5%3%4%4%year
1-2715212823713121382783-2323513687110Never6%-4%9%8%10%14%16%13%15%9%10%8%9%12%-12%11%13%9%11%11%
Page 43
Brassica Vegetables SurveyONLINE Fieldwork: 19th-20th November 2014
Absolutes/col percents
Table 43Q.1 Approximately how often, if ever, do you tend to use each of the following vegetables in your meals?Base: All respondentsSweetcorn
Prepared by Populus

Marital StatusWhich of the following ITV regions do you live in?NET:Mar-ried/
NET:CivilWid-part-owed/ner-separ-Civilship/ated/CoPart-coWest-
Div-Separ-Wid-div-Hab-ner-Mar-hab-York-count-WalesTyneScot-Meri-Gran-Gram-Cent-orcedatedowedorceditingshiprieditingSingleshirery& WestTeestishdianLondonadapianralAngliaTotal
98124015014414446604250572754337798186110134101241011Unweighted base
84114213714215452608262543149428382199114137101071011Weighted base
7573712013211401544233482840397375187941201092901NET: Ever90%64%89%87%93%77%89%89%89%90%90%82%93%88%92%94%82%88%100%86%89%
4772681102113074191743022312848541487289668677NET: Monthly or more56%64%63%59%72%72%68%69%66%56%72%64%68%58%66%75%63%65%55%64%67%
313942609161230123151621182231784652339398NET: Weekly or more36%23%22%31%42%63%36%38%47%28%52%42%42%27%37%39%40%38%31%36%39%
1--13-25211*1-*1-3-28Every day1%--1%2%-1%1%1%1%2%1%2%-1%*-2%-2%1%
103618284659657811651115332128-17172A few times a week11%23%14%13%20%26%14%16%22%15%36%11%13%13%18%16%18%21%-16%17%
20-32330594129646415121115452522319217Once a week24%-8%17%21%37%21%21%24%12%14%30%28%14%19%22%22%16%31%18%21%
75921191821022365641310371221221147Once a fortnight9%41%22%15%14%7%18%17%9%10%17%11%9%16%12%19%10%15%24%20%15%
9-81722*64862891571314331516-9133Once a month11%-19%13%16%3%14%14%11%18%3%11%16%15%17%17%13%12%-8%13%
22-8302716694381365111913271324319162A few times a year26%-20%22%19%5%15%15%15%24%18%10%25%23%16%13%11%18%31%18%16%
1-121-67131-1-4-651-221Once a year1%-2%1%*-1%1%5%2%-2%-4%-3%5%*-2%2%
5-273-222584-3-287461240Less often than once a6%-4%5%2%-5%4%3%8%-6%-3%9%3%4%5%15%2%4%year
945171035164285393107112016-15110Never10%36%11%13%7%23%11%11%11%10%10%18%7%12%8%6%18%12%-14%11%
Page 44
Brassica Vegetables SurveyONLINE Fieldwork: 19th-20th November 2014
Absolutes/col percents
Table 44Q.1 Approximately how often, if ever, do you tend to use each of the following vegetables in your meals?Base: All respondentsSweetcorn
Prepared by Populus

Which of the following cities do you live in, or nearest to?None ofPly-South-Brigh-MiltonBirm-Nott-Liver-Manch-Shef-New-Edin-theseCardiffmouthBristolamptonLondonOxfordtonKeynesNorwichinghaminghampoolesterfieldHullLeedscastleburghGlasgowTotal
794336314122114213562764937732813453334401011Unweighted base
703829353223014212755894736743411454238451011Weighted base
58342532312141418234778412963281142403141901NET: Ever83%91%87%90%97%93%97%85%84%85%88%88%80%86%84%93%94%96%84%91%89%
3827171925167101715366230234724937292223677NET: Monthly or more55%71%58%53%79%72%71%81%54%66%70%63%64%64%70%83%83%70%58%52%67%
2618108128641110224318152715726191011398NET: Weekly or more37%47%35%24%38%37%28%53%37%41%48%38%41%36%44%61%57%46%26%25%39%
-*1121---13------1--8Every day-1%2%2%5%1%---1%3%------2%--1%
15454634-9212266811617556172A few times a week22%10%16%11%17%15%-43%9%22%29%13%23%14%18%11%16%13%13%13%17%
10145455142810141271696181356217Once a week15%36%17%11%15%22%28%10%29%18%16%25%18%22%26%50%41%32%13%13%21%
75446455121012676118476147Once a fortnight10%13%13%13%18%20%33%6%8%18%13%13%19%8%3%8%18%11%18%13%15%
5436736242476114824656133Once a month8%11%10%17%23%16%11%21%9%7%8%12%4%19%23%14%8%14%14%14%13%
1346104333-7812114841311912162A few times a year18%10%21%28%14%14%21%-27%14%13%23%12%11%12%11%6%25%23%28%16%
111--6--11---61-1--421Once a year1%3%4%--3%--3%1%---8%2%-1%--8%2%
73132911-24112--2-1140Less often than once a10%7%4%9%5%4%5%5%-4%5%2%4%3%--4%-3%3%4%year
12343116*348116711513264110Never17%9%13%10%3%7%3%15%16%15%12%12%20%14%16%7%6%4%16%9%11%
Page 45
Brassica Vegetables SurveyONLINE Fieldwork: 19th-20th November 2014
Absolutes/col percents
Table 45Q.1 Approximately how often, if ever, do you tend to use each of the following vegetables in your meals?Base: All respondentsSweetcorn
Prepared by Populus

EmploymentSectorRegionSocial GradeAgeGender
York-shire
EastWest&Pri-SouthSouthEast-Mid-Mid-Humb-NorthNorthScot-vatePublicWestEastLondonernWaleslandslandsersideWestEastlandDEC2C1AB65+55-6445-5435-4425-3418-24FemaleMaleTotal
42011896155116121577578881093284262210315224227176198188130924805311011Unweighted base
439127911421311015171919111140912402202802702201501801701701205164951011Weighted base
358106771201138736647270813468185176229230188132148121131101428392820NET: Ever81%84%84%85%86%86%70%90%79%77%73%83%75%77%80%82%85%85%88%82%71%77%84%83%79%81%
212664060675930353748471831941171161451156889766757251222472NET: Monthly or more48%52%44%42%51%59%60%49%40%53%42%45%34%39%53%41%54%52%45%49%45%39%48%49%45%47%
953117353121917122223101243475066592738322428107101208NET: Weekly or more22%25%18%25%23%21%19%23%13%24%21%24%13%18%22%18%25%27%18%21%19%14%23%21%20%21%
31111-----1--1--3-1111-223Every day1%1%1%1%1%-----1%--*--1%-1%**1%-***
32641187232564316914181151710510283058A few times a week7%5%4%8%6%7%5%5%3%6%6%11%3%7%4%5%7%5%3%9%6%3%8%5%6%6%
61251223211471310171659263837464821212117187769147Once a week14%20%13%16%16%14%14%19%10%18%14%13%10%11%17%13%17%22%14%12%13%10%15%15%14%15%
621915131927115159969243837392822312423117662138Once a fortnight14%15%17%9%14%27%22%7%16%10%8%14%10%10%17%13%14%13%14%17%14%13%9%15%12%14%
54169111711913101715310263229402820202020196760127Once a month12%13%9%8%13%11%19%19%11%19%14%7%11%11%15%10%15%13%13%11%12%12%16%13%12%13%
103303149281932324132562455498359544041324336126120246A few times a year24%23%34%35%21%19%6%33%27%15%22%15%26%23%22%30%22%24%27%23%19%25%30%24%24%24%
2544611512854782351318111596154312960Once a year6%3%4%4%8%5%2%3%9%5%4%17%9%10%2%5%7%5%10%5%4%9%3%6%6%6%
17615842433436135168889664202142Less often than once a4%5%1%3%6%4%3%5%3%4%4%6%6%5%2%6%3%3%6%5%4%4%3%4%4%4%year
8221142118141571921317235544514033183249392087103191Never19%16%16%15%14%14%30%10%21%23%27%17%25%23%20%18%15%15%12%18%29%23%16%17%21%19%
Page 46
Brassica Vegetables SurveyONLINE Fieldwork: 19th-20th November 2014
Absolutes/col percents
Table 46Q.1 Approximately how often, if ever, do you tend to use each of the following vegetables in your meals?Base: All respondentsParsnip
Prepared by Populus
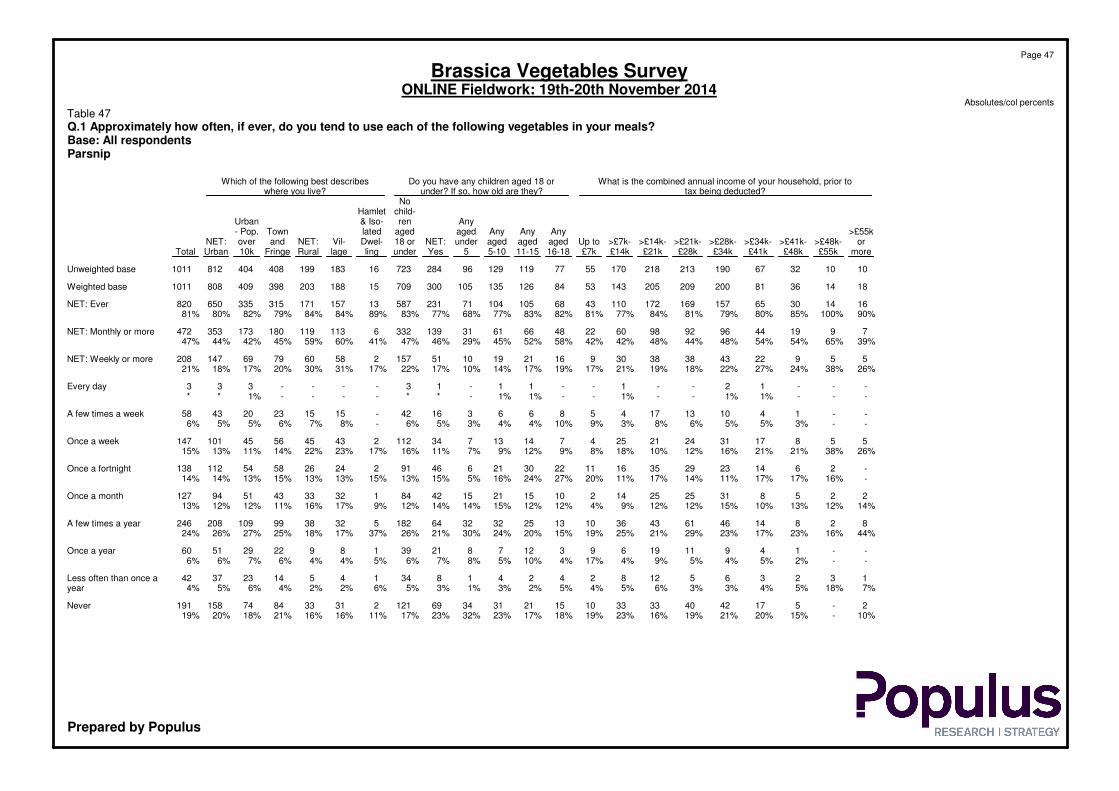
What is the combined annual income of your household, prior toDo you have any children aged 18 orWhich of the following best describestax being deducted?under? If so, how old are they?where you live?
Nochild-Hamlet
Anyren& Iso-Urban>£55kAnyAnyAnyagedagedlatedTown- Pop.
or>£48k->£41k->£34k->£28k->£21k->£14k->£7k-Up toagedagedagedunderNET:18 orDwel-Vil-NET:andoverNET:more£55k£48k£41k£34k£28k£21k£14k£7k16-1811-155-105YesunderlinglageRuralFringe10kUrbanTotal
10103267190213218170557711912996284723161831994084048121011Unweighted base
181436812002092051435384126135105300709151882033984098081011Weighted base
1614306515716917211043681051047123158713157171315335650820NET: Ever90%100%85%80%79%81%84%77%81%82%83%77%68%77%83%89%84%84%79%82%80%81%
7919449692986022486661311393326113119180173353472NET: Monthly or more39%65%54%54%48%44%48%42%42%58%52%45%29%46%47%41%60%59%45%42%44%47%
559224338383091621191051157258607969147208NET: Weekly or more26%38%24%27%22%18%19%21%17%19%17%14%10%17%22%17%31%30%20%17%18%21%
---12--1--11-13----333Every day---1%1%--1%--1%1%-**----1%**
--141013174586631642-151523204358A few times a week--3%5%5%6%8%3%9%10%4%4%3%5%6%-8%7%6%5%5%6%
5581731242125471413734112243455645101147Once a week26%38%21%21%16%12%10%18%8%9%12%9%7%11%16%17%23%22%14%11%13%15%
-2614232935161122302164691224265854112138Once a fortnight-16%17%17%11%14%17%11%20%27%24%16%5%15%13%15%13%13%15%13%14%14%
225831252514210152115428413233435194127Once a month14%12%13%10%15%12%12%9%4%12%12%15%14%14%12%9%17%16%11%12%12%13%
82814466143361013253232641825323899109208246A few times a year44%16%23%17%23%29%21%25%19%15%20%24%30%21%26%37%17%18%25%27%26%24%
--14911196931278213918922295160Once a year--2%5%4%5%9%4%17%4%10%5%8%7%6%5%4%4%6%7%6%6%
1323651282424183414514233742Less often than once a7%18%5%4%3%3%6%5%4%5%2%3%1%3%5%6%2%2%4%6%5%4%year
2-51742403333101521313469121231338474158191Never10%-15%20%21%19%16%23%19%18%17%23%32%23%17%11%16%16%21%18%20%19%
Page 47
Brassica Vegetables SurveyONLINE Fieldwork: 19th-20th November 2014
Absolutes/col percents
Table 47Q.1 Approximately how often, if ever, do you tend to use each of the following vegetables in your meals?Base: All respondentsParsnip
Prepared by Populus

Marital StatusWhich of the following ITV regions do you live in?NET:Mar-ried/
NET:CivilWid-part-owed/ner-separ-Civilship/ated/CoPart-coWest-
Div-Separ-Wid-div-Hab-ner-Mar-hab-York-count-WalesTyneScot-Meri-Gran-Gram-Cent-orcedatedowedorceditingshiprieditingSingleshirery& WestTeestishdianLondonadapianralAngliaTotal
98124015014414446604250572754337798186110134101241011Unweighted base
84114213714215452608262543149428382199114137101071011Weighted base
73937119114837249420441273435616417885112891820NET: Ever87%81%89%87%80%55%82%81%78%76%88%69%84%74%78%89%75%82%83%86%81%
44616666062312971062311301826331005360458472NET: Monthly or more53%53%39%48%42%40%51%49%41%43%35%61%43%31%41%50%46%44%36%55%47%
14382522310112756104910720442525325208NET: Weekly or more17%27%19%18%16%21%22%21%21%18%12%19%23%9%24%22%22%18%29%24%21%
------33-1----111---3Every day------1%1%-2%----1%*1%---*
11-2623038173-24161285-1058A few times a week2%6%-2%4%16%7%6%7%6%-5%10%1%8%6%7%4%-9%6%
1328231716885385475613321620315147Once a week15%21%19%17%12%5%15%14%15%10%12%15%13%7%15%16%14%14%29%14%15%
173222151728827961168826917125138Once a fortnight21%27%5%16%11%9%16%15%10%16%20%23%13%10%10%13%8%13%7%23%14%
13-6192215882245193105302018-8127Once a month15%-15%14%16%10%13%13%9%9%3%18%7%12%7%15%17%14%-7%13%
2231034392103144681515262222562438323246A few times a year26%27%23%25%27%13%23%24%26%28%48%5%15%26%27%28%21%28%29%22%24%
6-7137*25331421-78513491560Once a year7%-17%10%5%3%5%5%5%4%4%-17%10%6%6%3%6%12%5%6%
1-568-122015*124638441542Less often than once a1%-11%4%6%-3%3%6%1%2%3%9%7%4%4%4%3%6%4%4%year
11251828780114581341572218212925215191Never13%19%11%13%20%45%18%19%22%24%12%31%16%26%22%11%25%18%17%14%19%
Page 48
Brassica Vegetables SurveyONLINE Fieldwork: 19th-20th November 2014
Absolutes/col percents
Table 48Q.1 Approximately how often, if ever, do you tend to use each of the following vegetables in your meals?Base: All respondentsParsnip
Prepared by Populus

Which of the following cities do you live in, or nearest to?None ofPly-South-Brigh-MiltonBirm-Nott-Liver-Manch-Shef-New-Edin-theseCardiffmouthBristolamptonLondonOxfordtonKeynesNorwichinghaminghampoolesterfieldHullLeedscastleburghGlasgowTotal
794336314122114213562764937732813453334401011Unweighted base
703829353223014212755894736743411454238451011Weighted base
4928252629202111522507039265630738362833820NET: Ever70%76%85%75%90%88%80%71%80%91%79%82%73%75%88%64%85%85%74%75%81%
21251318151176811343623173220527181611472NET: Monthly or more30%66%44%51%48%51%40%41%40%61%40%49%49%44%59%45%59%43%41%26%47%
79861150*7417101061782151083208NET: Weekly or more9%25%26%16%34%22%3%32%15%30%12%22%18%23%22%21%33%23%22%6%21%
--1--2-------1------3Every day--3%--1%-------1%------*
-23-313*41722242-342158A few times a week-6%11%-9%6%3%20%5%12%3%5%7%6%6%-8%10%4%2%6%
7746836-3310884126211562147Once a week9%19%12%16%25%16%-13%10%18%9%17%11%16%17%21%25%13%17%3%15%
993122332151315437124654138Once a fortnight12%23%9%33%7%14%12%5%18%24%17%9%8%9%4%17%10%13%12%8%14%
67312343124109881118335127Once a month9%18%9%2%6%15%24%4%7%7%11%18%23%11%33%7%17%7%7%11%13%
21210710635381224127189*76912246A few times a year31%5%34%19%31%28%35%15%28%22%27%26%19%25%27%4%15%15%25%27%24%
3-21213-322811311382660Once a year4%-8%3%5%6%-15%6%3%9%2%2%3%3%7%6%20%6%13%6%
42-1291-123312-1331442Less often than once a5%4%-2%5%4%5%-5%4%3%5%4%3%-7%6%8%2%9%4%year
219493283665188101944761011191Never30%24%15%25%10%12%20%29%20%9%21%18%27%25%12%36%15%15%26%25%19%
Page 49
Brassica Vegetables SurveyONLINE Fieldwork: 19th-20th November 2014
Absolutes/col percents
Table 49Q.1 Approximately how often, if ever, do you tend to use each of the following vegetables in your meals?Base: All respondentsParsnip
Prepared by Populus

EmploymentSectorRegionSocial GradeAgeGender
York-shire
EastWest&Pri-SouthSouthEast-Mid-Mid-Humb-NorthNorthScot-vatePublicWestEastLondonernWaleslandslandsersideWestEastlandDEC2C1AB65+55-6445-5435-4425-3418-24FemaleMaleTotal
42011896155116121577578881093284262210315224227176198188130924805311011Unweighted base
439127911421311015171919111140912402202802702201501801701701205164951011Weighted base
437127911411311015169909011140912392202782702191501801701681195124941006NET: Ever100%100%100%100%100%100%100%98%99%99%100%100%100%99%100%99%100%99%100%100%100%99%99%99%100%100%
43212590139128100516990871094089235219271268218150177164164119505487992NET: Monthly or more98%99%99%98%98%99%100%97%99%96%98%98%98%98%99%97%99%99%100%98%97%97%99%98%98%98%
4051208813311996486389851043881219213256256213145167154159105478465944NET: Weekly or more92%95%96%94%91%95%96%89%97%93%94%95%89%91%97%91%95%97%97%93%91%93%88%93%94%93%
581114261620845111071022483725491921209146468132Every day13%9%16%19%12%20%16%5%6%13%9%16%11%9%22%13%9%22%13%12%12%5%11%12%14%13%
27293629173624052665484314816613217818514210612112111754339323662A few times a week62%74%68%65%55%61%78%73%72%59%75%77%53%69%60%63%69%65%71%67%71%69%45%66%65%65%
751611153014*8182010123313341452220261432377575150Once a week17%12%12%11%23%14%1%11%20%22%9%2%25%13%15%15%17%10%13%14%8%19%31%14%15%15%
184225413-151483109137838111829Once a fortnight4%3%2%1%3%4%3%5%-1%4%3%5%3%1%3%3%1%2%4%4%2%7%2%4%3%
81-55-1212--4836333323616420Once a month2%1%-3%4%-2%3%1%2%--4%3%1%2%1%1%2%1%1%2%5%3%1%2%
41-22--1-321131522-344-7512A few times a year1%1%-1%2%--1%-3%2%2%2%1%1%2%1%1%-1%2%2%-1%1%1%
--------------------------Once a year--------------------------
1-1--1------*1-1*--11---22Less often than once a*-1%--1%------**-**--*1%---**year
2--11*-111---2-311-*121415Never*--***-2%1%1%---1%-1%*1%-**1%1%1%**
Page 50
Brassica Vegetables SurveyONLINE Fieldwork: 19th-20th November 2014
Absolutes/col percents
Table 50Q.1 Approximately how often, if ever, do you tend to use each of the following vegetables in your meals?Base: All respondentsPotato
Prepared by Populus

What is the combined annual income of your household, prior toDo you have any children aged 18 orWhich of the following best describestax being deducted?under? If so, how old are they?where you live?
Nochild-Hamlet
Anyren& Iso-Urban>£55kAnyAnyAnyagedagedlatedTown- Pop.
or>£48k->£41k->£34k->£28k->£21k->£14k->£7k-Up toagedagedagedunderNET:18 orDwel-Vil-NET:andoverNET:more£55k£48k£41k£34k£28k£21k£14k£7k16-1811-155-105YesunderlinglageRuralFringe10kUrbanTotal
10103267190213218170557711912996284723161831994084048121011Unweighted base
181436812002092051435384126135105300709151882033984098081011Weighted base
181436811982092031435384126134105299704151882033984068031006NET: Ever100%100%100%100%99%100%99%99%99%100%100%99%100%100%99%100%100%100%100%99%99%100%
18143681197204200139538212613210329569515185200392400792992NET: Monthly or more100%100%100%100%99%97%98%97%99%98%100%98%97%98%98%100%98%98%98%98%98%98%
1714338018919718813244801171249727866315179193377373750944NET: Weekly or more96%100%93%98%95%94%92%92%83%96%93%92%92%93%94%100%95%95%95%91%93%93%
--1132625322061117146339943135484997132Every day--2%16%13%12%15%14%11%13%13%11%6%11%14%27%17%17%12%12%12%13%
910305712715312792286090957620945310126136275251526662A few times a week50%73%84%70%64%73%62%65%53%72%72%70%72%70%64%70%67%67%69%61%65%65%
8431036192919101010151536112*21225474128150Once a week47%27%7%12%18%9%14%13%20%12%8%11%14%12%16%3%11%11%14%18%16%15%
--317454417721019-777152229Once a fortnight--7%1%4%2%2%3%7%1%6%5%2%3%3%-3%3%2%4%3%3%
1--1137351213613---8122020Once a month4%--1%*1%3%2%9%1%1%1%3%2%2%---2%3%2%2%
----1623-2-2357-3363912A few times a year----*3%1%2%-2%-1%3%2%1%-1%1%1%1%1%1%
----------------------Once a year----------------------
------11------2----222Less often than once a------1%*------*----1%**year
----1-211--1-14-111445Never----1%-1%1%1%--1%-*1%-***1%1%*
Page 51
Brassica Vegetables SurveyONLINE Fieldwork: 19th-20th November 2014
Absolutes/col percents
Table 51Q.1 Approximately how often, if ever, do you tend to use each of the following vegetables in your meals?Base: All respondentsPotato
Prepared by Populus

Marital StatusWhich of the following ITV regions do you live in?NET:Mar-ried/
NET:CivilWid-part-owed/ner-separ-Civilship/ated/CoPart-coWest-
Div-Separ-Wid-div-Hab-ner-Mar-hab-York-count-WalesTyneScot-Meri-Gran-Gram-Cent-orcedatedowedorceditingshiprieditingSingleshirery& WestTeestishdianLondonadapianralAngliaTotal
98124015014414446604250572754337798186110134101241011Unweighted base
84114213714215452608262543149428382199114137101071011Weighted base
83114213614215449606260543149428382198114134101061006NET: Ever99%100%100%100%100%100%99%100%99%100%100%100%100%100%99%100%100%98%100%100%100%
8211411341411544760225254304941818019611213410105992NET: Monthly or more98%100%98%98%99%100%99%99%96%100%98%100%98%98%98%99%98%98%100%98%98%
751141126133134325792365328474072771831081301099944NET: Weekly or more89%100%97%92%94%91%96%95%90%99%91%95%95%88%94%92%94%95%100%93%93%
81312162789624111878932118122132Every day10%7%7%9%11%13%17%16%9%19%4%17%16%10%11%16%10%6%15%21%13%
5210329492631341215433193833425611886104863662A few times a week63%89%75%69%65%43%69%68%59%61%60%78%80%51%68%59%75%76%76%59%65%
14*620255417158108--2212321117114150Once a week17%4%15%15%17%34%9%12%22%19%27%--27%14%16%9%13%10%13%15%
2--23112179121141553-429Once a fortnight2%--1%2%9%3%3%4%1%5%3%3%5%1%3%4%2%-4%3%
5-*64-267-*1-428-2-120Once a month6%-1%4%3%-*1%3%-1%2%-5%2%4%-1%-1%2%
1-121-346---11122--112A few times a year1%-2%1%1%-1%1%2%---2%2%1%1%2%--1%1%
---------------------Once a year---------------------
--------2-1--**----12Less often than once a--------1%-2%--1%1%----1%*year
1--1--332-----11-3-*5Never1%--*--1%*1%-----1%*-2%-**
Page 52
Brassica Vegetables SurveyONLINE Fieldwork: 19th-20th November 2014
Absolutes/col percents
Table 52Q.1 Approximately how often, if ever, do you tend to use each of the following vegetables in your meals?Base: All respondentsPotato
Prepared by Populus

Which of the following cities do you live in, or nearest to?None ofPly-South-Brigh-MiltonBirm-Nott-Liver-Manch-Shef-New-Edin-theseCardiffmouthBristolamptonLondonOxfordtonKeynesNorwichinghaminghampoolesterfieldHullLeedscastleburghGlasgowTotal
794336314122114213562764937732813453334401011Unweighted base
703829353223014212755894736743411454238451011Weighted base
693829353222914212755884636743411454238451006NET: Ever99%100%100%100%100%100%100%100%100%100%99%97%100%100%100%93%100%100%100%100%100%
67382935322261421265588453573321145413645992NET: Monthly or more96%100%100%98%99%98%100%100%97%100%99%96%98%98%95%93%100%98%95%100%98%
65352934302131320255287423469311143403240944NET: Weekly or more92%94%98%96%94%92%91%94%93%94%98%89%96%93%93%93%96%95%84%90%93%
116487351*4136165535652132Every day16%16%14%22%21%15%8%2%14%23%6%2%17%7%14%27%11%14%13%4%13%
4629202022136111815336234245724725341926662A few times a week65%78%67%58%69%59%79%89%57%60%70%71%67%77%71%59%56%81%50%58%65%
8-561411166208462113-813150Once a week11%-16%17%5%18%4%3%23%11%22%16%12%9%7%7%29%-22%28%15%
1111151113-214--11-429Once a fortnight2%4%2%2%2%2%9%3%3%6%-4%2%5%--2%3%-10%3%
11--18-1*-11--1-1-4-20Once a month1%2%--2%4%-2%1%-1%2%--2%-3%-11%-2%
2----2--1--1112--11-12A few times a year3%----1%--3%--1%2%2%5%--2%4%-1%
---------------------Once a year---------------------
---1*1------------*-2Less often than once a---2%1%*------------1%-*year
1----1----11---1----5Never1%----*----1%3%---7%----*
Page 53
Brassica Vegetables SurveyONLINE Fieldwork: 19th-20th November 2014
Absolutes/col percents
Table 53Q.1 Approximately how often, if ever, do you tend to use each of the following vegetables in your meals?Base: All respondentsPotato
Prepared by Populus

Brassica VegetablesBrussel SproutsKaleCabbageCauliflowerTurnipSwedeBroccoli
866491909932692807929Unweighted base
863501917939703817943Weighted base
66401331343955132It is quick and easy to8%8%15%14%6%7%14%cook
22274208261113202318I/my family love the26%15%23%28%16%25%34%taste
443876138717757It is versatile and I5%8%8%15%10%9%6%can cook it several
different ways
383610869849650It is cheap4%7%12%7%12%12%5%
206239283225170176317It is healthy and24%48%31%24%24%22%34%nutritious
2383252551049020It is traditional28%6%6%6%15%11%2%
4843565812212049It complements the6%8%6%6%17%15%5%other ingredients in
the meal
Page 54
Brassica Vegetables SurveyONLINE Fieldwork: 19th-20th November 2014
Absolutes/col percents
Table 54Q.2 Brassica is a family of plants that includes many common vegetables such as broccoli, swede, turnip, cauliflower, cabbage, kaleand brussel sprouts. Thinking about each of the Brassica vegetables you use in your meals, which of the following reasons bestdescribes why you use each one?Base: All respondents who ever use eachSummary
Prepared by Populus

EmploymentSectorRegionSocial GradeAgeGender
York-shire
EastWest&Pri-SouthSouthEast-Mid-Mid-Humb-NorthNorthScot-vatePublicWestEastLondonernWaleslandslandsersideWestEastlandDEC2C1AB65+55-6445-5435-4425-3418-24FemaleMaleTotal
3851119214211011151696779104307424019128920921416517817311683456473929Unweighted base
4071238813412695476681821023982225201261256212141166159152112497446943Weighted base
64111220152147116121014342647262418281624226963132It is quick and easy to16%9%14%15%12%23%9%10%14%8%12%25%17%15%13%18%10%11%12%17%10%16%20%14%14%14%cook
1493528493928202135373162381658290654557585637186132318I/my family love the37%28%32%37%31%30%43%32%43%45%30%16%29%36%33%31%35%31%32%34%37%37%33%37%30%34%taste
221171010232939-21051923761312911302757It is versatile and I5%9%7%7%8%3%6%3%11%3%9%-2%4%3%7%9%3%4%8%7%6%9%6%6%6%can cook it several
different ways
2144678113116131112121411746912272250It is cheap5%3%5%4%5%8%1%2%3%13%5%3%4%5%6%5%6%5%5%2%4%6%10%5%5%5%
12947314349321129212237123267877984875351574228155162317It is healthy and32%38%35%32%39%34%23%44%26%26%36%31%39%30%43%30%33%41%37%31%36%27%24%31%36%34%nutritious
69-41-1131432617644343281220It is traditional2%7%-3%1%-2%2%3%1%4%7%2%3%*3%2%2%3%2%2%2%2%2%3%2%
156745374-247616615131499591212849It complements the4%5%7%3%4%3%15%6%-3%4%19%7%7%3%6%5%7%7%6%3%6%1%4%6%5%other ingredients in
the meal
Page 55
Brassica Vegetables SurveyONLINE Fieldwork: 19th-20th November 2014
Absolutes/col percents
Table 55Q.2 Brassica is a family of plants that includes many common vegetables such as broccoli, swede, turnip, cauliflower, cabbage, kaleand brussel sprouts. Thinking about each of the Brassica vegetables you use in your meals, which of the following reasons bestdescribes why you use each one?Base: All respondents who ever use eachBroccoli
Prepared by Populus

What is the combined annual income of your household, prior toDo you have any children aged 18 orWhich of the following best describestax being deducted?under? If so, how old are they?where you live?
Nochild-Hamlet
Anyren& Iso-Urban>£55kAnyAnyAnyagedagedlatedTown- Pop.
or>£48k->£41k->£34k->£28k->£21k->£14k->£7k-Up toagedagedagedunderNET:18 orDwel-Vil-NET:andoverNET:more£55k£48k£41k£34k£28k£21k£14k£7k16-1811-155-105YesunderlinglageRuralFringe10kUrbanTotal
910296617119720415248741141229126965715171186369374743929Unweighted base
17143380177197195131498212213010028865313181194365383749943Weighted base
6361023252620981517133993124265453106132It is quick and easy to35%19%18%13%13%13%13%15%18%10%12%13%13%14%14%10%13%13%15%14%14%14%cook
9172158667245223644553211020826769117132249318I/my family love the52%6%22%26%33%33%37%34%44%44%36%42%32%38%32%18%37%36%32%34%33%34%taste
-2-291712103991592630-101022264757It is versatile and I-14%-3%5%8%6%7%5%11%8%12%9%9%5%-5%5%6%7%6%6%can cook it several
different ways
1-35781346-8971336*151611233450It is cheap6%-10%6%4%4%7%3%12%-6%7%7%5%6%3%9%8%3%6%5%5%
-61439706359418273829318323485664132122253317It is healthy and-42%43%48%40%32%30%32%17%33%31%22%30%29%36%63%31%33%36%32%34%34%nutritious
-3224431*1131317-446111620It is traditional-18%7%3%2%2%2%1%1%1%1%2%1%1%3%-2%2%2%3%2%2%
1--271410101-728143515624184349It complements the6%--2%4%7%5%8%3%-6%2%8%5%5%7%3%3%7%5%6%5%other ingredients in
the meal
Page 56
Brassica Vegetables SurveyONLINE Fieldwork: 19th-20th November 2014
Absolutes/col percents
Table 56Q.2 Brassica is a family of plants that includes many common vegetables such as broccoli, swede, turnip, cauliflower, cabbage, kaleand brussel sprouts. Thinking about each of the Brassica vegetables you use in your meals, which of the following reasons bestdescribes why you use each one?Base: All respondents who ever use eachBroccoli
Prepared by Populus

Marital StatusWhich of the following ITV regions do you live in?NET:Mar-ried/
NET:CivilWid-part-owed/ner-separ-Civilship/ated/CoPart-coWest-
Div-Separ-Wid-div-Hab-ner-Mar-hab-York-count-WalesTyneScot-Meri-Gran-Gram-Cent-orcedatedowedorceditingshiprieditingSingleshirery& WestTeestishdianLondonadapianralAngliaTotal
901037137130134235662195425493167891771051199113929Unweighted base
79104012913013433577233512946417477192105125999943Weighted base
5261419*56764364491312251219119132It is quick and easy to7%24%15%11%14%3%13%13%18%12%13%8%23%18%16%13%12%15%10%19%14%cook
3241855403137180832292082026653539429318I/my family love the41%47%44%42%31%23%32%31%36%42%31%43%20%27%34%34%33%31%42%29%34%taste
5-3891213117253-2115911-657It is versatile and I6%-7%6%7%8%5%5%7%5%17%7%-3%1%8%8%9%-6%6%can cook it several
different ways
3-146*2733121211349541850It is cheap4%-1%3%5%3%6%6%5%2%5%1%3%4%6%5%4%3%10%8%5%
303124544815620863151011122828693745433317It is healthy and39%29%29%35%33%63%36%36%27%29%34%23%30%38%37%36%35%36%38%33%34%nutritious
1--16-9154--1321146-120It is traditional1%--1%5%-2%3%2%--3%6%3%2%1%4%4%-1%2%
2-137-2734115-7763842-449It complements the2%-3%2%5%-6%6%5%9%-15%18%8%4%4%4%2%-4%5%other ingredients in
the meal
Page 57
Brassica Vegetables SurveyONLINE Fieldwork: 19th-20th November 2014
Absolutes/col percents
Table 57Q.2 Brassica is a family of plants that includes many common vegetables such as broccoli, swede, turnip, cauliflower, cabbage, kaleand brussel sprouts. Thinking about each of the Brassica vegetables you use in your meals, which of the following reasons bestdescribes why you use each one?Base: All respondents who ever use eachBroccoli
Prepared by Populus

Which of the following cities do you live in, or nearest to?None ofPly-South-Brigh-MiltonBirm-Nott-Liver-Manch-Shef-New-Edin-theseCardiffmouthBristolamptonLondonOxfordtonKeynesNorwichinghaminghampoolesterfieldHullLeedscastleburghGlasgowTotal
68403330402071416335866453570261141313332929Unweighted base
61362735322201418265181433566321041413737943Weighted base
64373335257114310411958132It is quick and easy to11%10%12%20%10%15%38%12%18%14%14%10%8%14%14%7%4%23%12%22%14%cook
23188161275185163310818136227118318I/my family love the38%49%30%47%38%34%4%46%18%30%41%24%22%27%42%56%53%18%30%21%34%taste
4321116--1392451-2-1157It is versatile and I6%7%9%4%3%7%--3%6%11%5%12%8%3%-5%-3%3%6%can cook it several
different ways
51-219-31621-272321250It is cheap8%1%-6%5%4%-19%5%11%3%2%-3%20%16%7%5%3%6%5%
2181081176441219232313256211121613317It is healthy and34%22%39%22%35%34%30%23%46%38%28%52%39%38%18%21%27%30%43%36%34%nutritious
11---12-1-31-4--131*20It is traditional2%3%---*17%-3%-3%1%-6%--3%6%4%1%2%
*3213102-2--2621-172449It complements the1%8%9%2%9%5%11%-7%--5%18%3%3%-2%18%5%11%5%other ingredients in
the meal
Page 58
Brassica Vegetables SurveyONLINE Fieldwork: 19th-20th November 2014
Absolutes/col percents
Table 58Q.2 Brassica is a family of plants that includes many common vegetables such as broccoli, swede, turnip, cauliflower, cabbage, kaleand brussel sprouts. Thinking about each of the Brassica vegetables you use in your meals, which of the following reasons bestdescribes why you use each one?Base: All respondents who ever use eachBroccoli
Prepared by Populus

EmploymentSectorRegionSocial GradeAgeGender
York-shire
EastWest&Pri-SouthSouthEast-Mid-Mid-Humb-NorthNorthScot-vatePublicWestEastLondonernWaleslandslandsersideWestEastlandDEC2C1AB65+55-6445-5435-4425-3418-24FemaleMaleTotal
32791811288695486153688929692091732431821891461551449974404403807Unweighted base
35010180123978141576472873778193178218228185122145135127102439377817Weighted base
315246541689641513131485118148173755It is quick and easy to9%5%2%3%6%6%11%2%10%11%11%15%5%8%7%6%6%4%4%8%6%11%8%4%10%7%cook
952526332518971222176275040437040443631223010696202I/my family love the27%24%32%27%26%22%21%12%19%31%20%17%34%26%22%20%31%21%36%25%23%17%29%24%25%25%taste
30106911132917114416212713161315111310403777It is versatile and I9%10%7%8%11%16%5%16%2%9%13%10%5%8%12%12%6%8%11%10%8%10%10%9%10%9%can cook it several
different ways
43128914144413126291522273134812121811514596It is cheap12%11%10%8%14%17%9%7%20%17%7%5%12%8%12%13%14%19%7%8%9%14%11%12%12%12%
6930132818177191016218204138494832223333322410076176It is healthy and20%29%16%23%19%20%18%34%16%22%24%20%26%21%21%23%21%18%18%23%24%25%24%23%20%22%nutritious
3710822575101337472120202921121715169543690It is traditional11%10%10%18%5%9%12%17%20%5%8%10%9%11%11%9%13%11%10%12%11%12%9%12%9%11%
4410181717810784158734243923341822251297149120It complements the13%10%22%14%18%10%24%12%13%6%17%23%9%18%14%18%10%18%15%15%18%10%9%16%13%15%other ingredients in
the meal
Page 59
Brassica Vegetables SurveyONLINE Fieldwork: 19th-20th November 2014
Absolutes/col percents
Table 59Q.2 Brassica is a family of plants that includes many common vegetables such as broccoli, swede, turnip, cauliflower, cabbage, kaleand brussel sprouts. Thinking about each of the Brassica vegetables you use in your meals, which of the following reasons bestdescribes why you use each one?Base: All respondents who ever use eachSwede
Prepared by Populus

What is the combined annual income of your household, prior toDo you have any children aged 18 orWhich of the following best describestax being deducted?under? If so, how old are they?where you live?
Nochild-Hamlet
Anyren& Iso-Urban>£55kAnyAnyAnyagedagedlatedTown- Pop.
or>£48k->£41k->£34k->£28k->£21k->£14k->£7k-Up toagedagedagedunderNET:18 orDwel-Vil-NET:andoverNET:more£55k£48k£41k£34k£28k£21k£14k£7k16-1811-155-105YesunderlinglageRuralFringe10kUrbanTotal
81028591501661731394161931006821958513151164334309643807Unweighted base
1614327515016417011541681011057623857711164175332310642817Weighted base
3-2813104103294102035-121220224255It is quick and easy to21%-6%11%9%6%2%8%8%3%9%3%13%8%6%-8%7%6%7%7%7%cook
5142230365134112220191855147439438872160202I/my family love the29%11%11%30%20%22%30%29%26%33%20%19%24%23%26%36%24%24%26%23%25%25%taste
218713151610291016930471171731296077It is versatile and I11%8%24%10%9%9%9%8%5%14%10%15%12%13%8%6%10%10%9%9%9%9%can cook it several
different ways
32371911251446141382669-191931467796It is cheap20%16%10%10%13%7%15%13%9%9%14%13%10%11%12%-12%11%9%15%12%12%
1471227533018141928221454122234377664140176It is healthy and7%28%21%16%18%32%17%16%35%28%28%21%18%23%21%22%21%21%23%21%22%22%nutritious
233720171810567141125651222336316790It is traditional12%18%8%10%14%10%11%9%13%8%6%13%14%10%11%9%13%13%11%10%10%11%
-3611272226201314166289232023504797120It complements the-19%20%14%18%13%16%17%3%5%14%15%8%12%16%27%13%13%15%15%15%15%other ingredients in
the meal
Page 60
Brassica Vegetables SurveyONLINE Fieldwork: 19th-20th November 2014
Absolutes/col percents
Table 60Q.2 Brassica is a family of plants that includes many common vegetables such as broccoli, swede, turnip, cauliflower, cabbage, kaleand brussel sprouts. Thinking about each of the Brassica vegetables you use in your meals, which of the following reasons bestdescribes why you use each one?Base: All respondents who ever use eachSwede
Prepared by Populus

Marital StatusWhich of the following ITV regions do you live in?NET:Mar-ried/
NET:CivilWid-part-owed/ner-separ-Civilship/ated/CoPart-coWest-
Div-Separ-Wid-div-Hab-ner-Mar-hab-York-count-WalesTyneScot-Meri-Gran-Gram-Cent-orcedatedowedorceditingshiprieditingSingleshirery& WestTeestishdianLondonadapianralAngliaTotal
821134127114123624881874624462963791468897998807Unweighted base
731037119115123654922024629403771671598999986817Weighted base
3-1434243120-24643797-555It is quick and easy to4%-3%3%2%36%7%6%10%-6%11%15%6%5%4%10%7%-5%7%cook
1838293049312646167862520391617421202I/my family love the25%33%21%24%26%29%25%26%23%35%24%21%17%35%29%25%19%17%39%25%25%taste
921129238491616244319107-1177It is versatile and I12%16%4%10%8%14%10%10%8%1%20%5%10%6%5%12%11%7%-13%9%can cook it several
different ways
10-112121-3960143932931979-1696It is cheap13%-31%18%19%-11%12%7%7%31%8%5%13%5%12%8%9%-18%12%
11*717202791005863781715372521316176It is healthy and15%4%18%15%17%14%22%20%29%12%11%18%21%24%23%24%28%21%32%18%22%nutritious
8-4121313852266154516117223790It is traditional11%-11%10%12%7%10%11%13%14%2%12%10%7%24%7%7%22%29%8%11%
15552418-54732314110876261516-11120It complements the20%47%13%20%16%-15%15%11%31%5%25%23%10%9%17%17%16%-13%15%other ingredients in
the meal
Page 61
Brassica Vegetables SurveyONLINE Fieldwork: 19th-20th November 2014
Absolutes/col percents
Table 61Q.2 Brassica is a family of plants that includes many common vegetables such as broccoli, swede, turnip, cauliflower, cabbage, kaleand brussel sprouts. Thinking about each of the Brassica vegetables you use in your meals, which of the following reasons bestdescribes why you use each one?Base: All respondents who ever use eachSwede
Prepared by Populus

Which of the following cities do you live in, or nearest to?None ofPly-South-Brigh-MiltonBirm-Nott-Liver-Manch-Shef-New-Edin-theseCardiffmouthBristolamptonLondonOxfordtonKeynesNorwichinghaminghampoolesterfieldHullLeedscastleburghGlasgowTotal
62362828351741316274952403358211035303129807Unweighted base
5329243327185141621446337335726936393635817Weighted base
34-1-8*1136527--46-455It is quick and easy to6%14%-3%-4%3%3%4%8%10%12%7%13%--10%15%-10%7%cook
158812945273119531154148176202I/my family love the28%26%33%37%34%25%14%47%15%24%15%14%9%19%17%38%39%22%48%16%25%taste
10212323--2623654-24-277It is versatile and I19%7%3%7%9%12%--11%13%3%9%17%9%16%-6%10%-7%9%can cook it several
different ways
10132222-121012-1543713696It is cheap19%4%14%6%7%12%-6%8%22%20%-4%10%16%36%19%3%10%16%12%
5644940338610971712177118176It is healthy and9%19%15%13%34%22%24%18%37%13%16%25%20%29%46%9%18%18%31%24%22%nutritious
7432117421315103411142490It is traditional13%14%11%7%5%9%30%15%6%7%23%26%9%6%5%8%3%11%5%13%11%
3569329424686118-12825120It complements the5%16%25%26%11%16%29%10%18%13%13%15%34%14%-9%4%22%7%13%15%other ingredients in
the meal
Page 62
Brassica Vegetables SurveyONLINE Fieldwork: 19th-20th November 2014
Absolutes/col percents
Table 62Q.2 Brassica is a family of plants that includes many common vegetables such as broccoli, swede, turnip, cauliflower, cabbage, kaleand brussel sprouts. Thinking about each of the Brassica vegetables you use in your meals, which of the following reasons bestdescribes why you use each one?Base: All respondents who ever use eachSwede
Prepared by Populus

EmploymentSectorRegionSocial GradeAgeGender
York-shire
EastWest&Pri-SouthSouthEast-Mid-Mid-Humb-NorthNorthScot-vatePublicWestEastLondonernWaleslandslandsersideWestEastlandDEC2C1AB65+55-6445-5435-4425-3418-24FemaleMaleTotal
2879172957677315542637927751681492231521641221371238660319373692Unweighted base
308100709390633149556571338315514920619316010312811511483349355703Weighted base
25623572*72136106131055114114122739It is quick and easy to8%6%3%3%5%12%6%1%13%3%1%8%8%7%4%6%5%3%5%8%3%10%5%4%8%6%cook
53167715104641313825292728302526161910174568113I/my family love the17%16%10%8%17%17%13%13%8%20%19%23%30%18%18%13%15%16%25%13%16%9%20%13%19%16%taste
289710136173782621111921141011111114254771It is versatile and I9%9%11%10%15%9%4%15%5%11%12%5%8%13%7%9%11%9%9%8%10%10%17%7%13%10%can cook it several
different ways
4288696351412132611173026241015141110463884It is cheap14%8%11%6%10%9%9%11%26%18%18%7%8%7%11%14%14%15%10%11%12%10%12%13%11%12%
753015301915913111618717334154423216373430229278170It is healthy and24%31%21%32%21%24%29%27%20%25%25%20%21%22%27%26%22%20%15%28%30%27%26%26%22%24%nutritious
372015208957511115822253126251418221784856104It is traditional12%20%22%21%9%14%15%14%9%17%15%14%10%14%17%15%14%16%14%14%19%15%9%14%16%15%
49111618201089104771329243237352122122398141122It complements the16%11%22%19%22%16%25%19%18%7%10%22%16%19%16%16%19%22%21%17%10%20%11%23%12%17%other ingredients in
the meal
Page 63
Brassica Vegetables SurveyONLINE Fieldwork: 19th-20th November 2014
Absolutes/col percents
Table 63Q.2 Brassica is a family of plants that includes many common vegetables such as broccoli, swede, turnip, cauliflower, cabbage, kaleand brussel sprouts. Thinking about each of the Brassica vegetables you use in your meals, which of the following reasons bestdescribes why you use each one?Base: All respondents who ever use eachTurnip
Prepared by Populus

What is the combined annual income of your household, prior toDo you have any children aged 18 orWhich of the following best describestax being deducted?under? If so, how old are they?where you live?
Nochild-Hamlet
Anyren& Iso-Urban>£55kAnyAnyAnyagedagedlatedTown- Pop.
or>£48k->£41k->£34k->£28k->£21k->£14k->£7k-Up toagedagedagedunderNET:18 orDwel-Vil-NET:andoverNET:more£55k£48k£41k£34k£28k£21k£14k£7k16-1811-155-105YesunderlinglageRuralFringe10kUrbanTotal
782246132155152107325991916019849115122137276279555692Unweighted base
15102550137159147943266100926120749413126139276288565703Weighted base
5-338663427771425-5514213539It is quick and easy to36%-13%7%6%4%4%3%12%3%7%8%11%7%5%-4%3%5%7%6%6%cook
--311142627168812118288522426523587113I/my family love the--11%23%10%16%18%17%26%12%12%11%14%13%17%12%19%19%19%12%15%16%taste
5238129141421399423481171818365471It is versatile and I31%16%11%16%9%6%9%15%7%20%9%10%7%11%10%8%13%13%6%12%9%10%can cook it several
different ways
-2261915211448161562856-141427437084It is cheap-21%6%12%14%10%14%15%12%12%16%16%9%14%11%-11%10%10%15%12%12%
14593454321652631262163107233347561136170It is healthy and8%38%19%19%25%34%21%17%15%39%31%28%35%30%22%12%26%25%27%21%24%24%nutritious
234725291376711189327141216493888104It is traditional13%25%15%15%19%18%9%7%19%11%11%20%14%16%14%33%9%12%18%13%16%15%
2-64252036243213762010252126425597122It complements the12%-26%8%18%12%24%25%10%2%13%7%10%9%21%35%17%18%15%19%17%17%other ingredients in
the meal
Page 64
Brassica Vegetables SurveyONLINE Fieldwork: 19th-20th November 2014
Absolutes/col percents
Table 64Q.2 Brassica is a family of plants that includes many common vegetables such as broccoli, swede, turnip, cauliflower, cabbage, kaleand brussel sprouts. Thinking about each of the Brassica vegetables you use in your meals, which of the following reasons bestdescribes why you use each one?Base: All respondents who ever use eachTurnip
Prepared by Populus

Marital StatusWhich of the following ITV regions do you live in?NET:Mar-ried/
NET:CivilWid-part-owed/ner-separ-Civilship/ated/CoPart-coWest-
Div-Separ-Wid-div-Hab-ner-Mar-hab-York-count-WalesTyneScot-Meri-Gran-Gram-Cent-orcedatedowedorceditingshiprieditingSingleshirery& WestTeestishdianLondonadapianralAngliaTotal
69928106941032542915143192926685412879821077692Unweighted base
619289895832743017240243032744914274831065703Weighted base
2--24-25298-2236*818-739It is quick and easy to3%--2%5%-8%7%5%-8%6%8%9%1%5%1%9%-11%6%cook
103317173527223414823620129410113I/my family love the16%39%12%17%17%41%16%17%13%9%5%13%24%30%11%14%16%11%35%15%16%taste
82415712635224312661787-571It is versatile and I14%19%16%15%8%18%8%8%13%10%14%4%6%9%12%12%11%8%-8%10%can cook it several
different ways
6-61212-4356164722531313121784It is cheap9%-23%12%13%-13%13%9%11%30%7%7%7%7%9%18%14%10%11%12%
172322182791004776971612401822114170It is healthy and27%19%12%22%19%30%24%23%28%17%24%30%21%22%24%28%24%26%14%22%24%nutritious
8-4112014667251024461516121029104It is traditional13%-13%12%21%11%14%16%15%24%7%13%12%9%30%11%16%12%20%14%15%
11272017-55713112387118291116212122It complements the18%24%24%20%17%-17%17%18%29%11%27%23%14%15%20%14%19%21%19%17%other ingredients in
the meal
Page 65
Brassica Vegetables SurveyONLINE Fieldwork: 19th-20th November 2014
Absolutes/col percents
Table 65Q.2 Brassica is a family of plants that includes many common vegetables such as broccoli, swede, turnip, cauliflower, cabbage, kaleand brussel sprouts. Thinking about each of the Brassica vegetables you use in your meals, which of the following reasons bestdescribes why you use each one?Base: All respondents who ever use eachTurnip
Prepared by Populus

Which of the following cities do you live in, or nearest to?None ofPly-South-Brigh-MiltonBirm-Nott-Liver-Manch-Shef-New-Edin-theseCardiffmouthBristolamptonLondonOxfordtonKeynesNorwichinghaminghampoolesterfieldHullLeedscastleburghGlasgowTotal
45212825251559720394335305121934293036692Unweighted base
392124262216681015335528314428835353440703Weighted base
11-2-11*--47**21-131539It is quick and easy to1%6%-7%-7%5%--12%12%2%2%4%2%-4%8%2%13%6%cook
844142211142347527101310113I/my family love the21%19%15%5%16%13%11%12%6%13%4%11%12%15%19%29%20%28%37%24%16%taste
7114420--13322632521471It is versatile and I18%6%3%16%18%12%--10%9%6%8%7%14%10%23%13%5%2%10%10%can cook it several
different ways
7132312--331437732723284It is cheap17%5%15%8%14%7%--21%9%26%11%21%15%10%19%19%6%9%6%12%
774714627551277129-8797170It is healthy and17%35%17%28%6%28%27%66%30%16%21%25%22%27%34%-23%21%27%17%24%nutritious
636362321357647325425104It is traditional16%15%24%12%28%14%21%15%22%15%12%23%12%16%12%19%15%11%5%12%15%
4366431312910684312767122It complements the10%14%27%24%18%19%37%8%12%26%18%21%24%8%13%10%6%21%17%17%17%other ingredients in
the meal
Page 66
Brassica Vegetables SurveyONLINE Fieldwork: 19th-20th November 2014
Absolutes/col percents
Table 66Q.2 Brassica is a family of plants that includes many common vegetables such as broccoli, swede, turnip, cauliflower, cabbage, kaleand brussel sprouts. Thinking about each of the Brassica vegetables you use in your meals, which of the following reasons bestdescribes why you use each one?Base: All respondents who ever use eachTurnip
Prepared by Populus

EmploymentSectorRegionSocial GradeAgeGender
York-shire
EastWest&Pri-SouthSouthEast-Mid-Mid-Humb-NorthNorthScot-vatePublicWestEastLondonernWaleslandslandsersideWestEastlandDEC2C1AB65+55-6445-5435-4425-3418-24FemaleMaleTotal
3891069214510811450686780104307424219628720721716418517311380448484932Unweighted base
4081178813612396426484831033981226203254255213140171158148109488451939Weighted base
661015221619571881058392731373214321719206668134It is quick and easy to16%8%18%17%13%20%12%11%22%9%10%14%10%17%13%12%15%15%10%19%11%13%18%13%15%14%cook
1182921402824151926262762863547370544245544521139122261I/my family love the29%25%24%30%23%25%36%30%31%31%26%15%35%28%27%29%28%25%30%26%34%30%20%28%27%28%taste
54201715131841281414617293241354121262613118058138It is versatile and I13%17%19%11%11%19%9%19%9%17%14%14%21%13%16%16%14%19%15%15%16%9%10%16%13%15%can cook it several
different ways
34553136-2913105420131917978111319333669It is cheap8%4%5%2%10%6%-3%10%15%10%12%4%9%6%8%7%4%5%5%7%9%17%7%8%7%
89312234352291620172381850624963513539373132111114225It is healthy and22%27%25%25%28%23%21%26%24%21%23%21%22%22%31%19%25%24%25%22%24%21%29%23%25%24%nutritious
231931313454*254177202188104222322355It is traditional6%16%3%10%11%5%11%6%1%2%5%11%1%3%3%8%8%4%6%6%3%15%2%7%5%6%
2435753443413561882110171212855283158It complements the6%2%6%5%4%4%10%6%3%5%12%13%7%8%4%8%4%8%8%7%5%3%4%6%7%6%other ingredients in
the meal
Page 67
Brassica Vegetables SurveyONLINE Fieldwork: 19th-20th November 2014
Absolutes/col percents
Table 67Q.2 Brassica is a family of plants that includes many common vegetables such as broccoli, swede, turnip, cauliflower, cabbage, kaleand brussel sprouts. Thinking about each of the Brassica vegetables you use in your meals, which of the following reasons bestdescribes why you use each one?Base: All respondents who ever use eachCauliflower
Prepared by Populus

What is the combined annual income of your household, prior toDo you have any children aged 18 orWhich of the following best describestax being deducted?under? If so, how old are they?where you live?
Nochild-Hamlet
Anyren& Iso-Urban>£55kAnyAnyAnyagedagedlatedTown- Pop.
or>£48k->£41k->£34k->£28k->£21k->£14k->£7k-Up toagedagedagedunderNET:18 orDwel-Vil-NET:andoverNET:more£55k£48k£41k£34k£28k£21k£14k£7k16-1811-155-105YesunderlinglageRuralFringe10kUrbanTotal
910276617620020015745741161239026966016172188376368744932Unweighted base
1714318118119519013346821231319928765015181196367376743939Weighted base
6--1132232329481719123995128294065104134It is quick and easy to35%--14%18%12%12%22%10%10%14%14%12%13%15%9%15%15%11%17%14%14%cook
116135362663414364236268817364853101107208261I/my family love the8%10%20%16%29%32%35%25%31%45%34%28%26%30%27%38%26%27%27%28%28%28%taste
-2822172423224121623134591630365249101138It is versatile and I-14%24%27%9%13%12%17%9%14%13%18%13%16%14%42%17%19%14%13%14%15%can cook it several
different ways
6-43118187831113112544-131320355669It is cheap33%-14%4%6%4%9%5%18%3%9%10%11%9%7%-7%7%5%9%7%7%
35112346444429920263127661581424210281182225It is healthy and18%38%36%28%25%22%23%22%19%24%21%24%28%23%24%5%23%22%28%22%25%24%nutritious
-315102343433361144-101017274455It is traditional-18%4%6%6%12%2%2%10%4%3%3%6%4%7%-6%5%5%7%6%6%
131313111392-85414441101135124758It complements the6%19%2%4%7%6%7%7%4%-6%4%4%5%7%6%6%6%10%3%6%6%other ingredients in
the meal
Page 68
Brassica Vegetables SurveyONLINE Fieldwork: 19th-20th November 2014
Absolutes/col percents
Table 68Q.2 Brassica is a family of plants that includes many common vegetables such as broccoli, swede, turnip, cauliflower, cabbage, kaleand brussel sprouts. Thinking about each of the Brassica vegetables you use in your meals, which of the following reasons bestdescribes why you use each one?Base: All respondents who ever use eachCauliflower
Prepared by Populus

Marital StatusWhich of the following ITV regions do you live in?NET:Mar-ried/
NET:CivilWid-part-owed/ner-separ-Civilship/ated/CoPart-coWest-
Div-Separ-Wid-div-Hab-ner-Mar-hab-York-count-WalesTyneScot-Meri-Gran-Gram-Cent-orcedatedowedorceditingshiprieditingSingleshirery& WestTeestishdianLondonadapianralAngliaTotal
91938138129134265682205426473168911771051189115932Unweighted base
76941126129134335762335131414074781901061249101939Weighted base
8-6141816181399955810331017-15134It is quick and easy to10%-16%11%14%8%14%14%17%17%31%13%13%11%13%17%9%14%-14%14%cook
2451241323120154651361452527433135527261I/my family love the32%56%29%32%25%19%28%27%28%26%20%33%13%34%35%23%29%28%51%27%28%taste
162133115166812410646167201418121138It is versatile and I21%23%31%25%11%8%15%14%10%20%18%10%14%21%8%11%13%15%11%20%15%can cook it several
different ways
2--215*31472021-543131011-669It is cheap3%--2%12%3%7%8%8%5%3%-11%5%4%7%10%9%-6%7%
16-82425811214555889101521512435323225It is healthy and21%-19%19%20%57%26%25%24%15%26%22%25%21%27%27%23%28%31%23%24%nutritious
321615-1430193-541819541455It is traditional5%20%2%5%12%-3%5%8%6%-12%11%1%10%10%4%3%7%4%6%
6-188129381261456210134-458It complements the8%-4%6%7%6%7%7%5%11%2%11%12%8%2%5%12%3%-4%6%other ingredients in
the meal
Page 69
Brassica Vegetables SurveyONLINE Fieldwork: 19th-20th November 2014
Absolutes/col percents
Table 69Q.2 Brassica is a family of plants that includes many common vegetables such as broccoli, swede, turnip, cauliflower, cabbage, kaleand brussel sprouts. Thinking about each of the Brassica vegetables you use in your meals, which of the following reasons bestdescribes why you use each one?Base: All respondents who ever use eachCauliflower
Prepared by Populus

Which of the following cities do you live in, or nearest to?None ofPly-South-Brigh-MiltonBirm-Nott-Liver-Manch-Shef-New-Edin-theseCardiffmouthBristolamptonLondonOxfordtonKeynesNorwichinghaminghampoolesterfieldHullLeedscastleburghGlasgowTotal
72373429412111417335767433669261140313133932Unweighted base
65302734322211419265183403567321039403537939Weighted base
10539438415716128712525134It is quick and easy to16%17%11%27%12%17%28%5%18%14%20%3%6%12%21%7%4%13%5%12%14%cook
20128812521841226127151071171611261I/my family love the31%40%30%23%37%24%4%42%15%24%31%30%21%23%30%64%30%18%47%30%28%taste
13247527122108987518658138It is versatile and I20%7%16%20%15%12%9%11%7%20%9%23%22%10%16%12%20%14%15%20%15%can cook it several
different ways
5-21113-316622641841369It is cheap8%-8%4%2%6%-18%4%11%8%4%4%9%13%8%20%10%2%8%7%
146568586411923137183-98106225It is healthy and21%20%18%18%26%26%43%24%43%18%28%31%21%27%10%-23%20%27%17%24%nutritious
2512224--13*2-52--5-155It is traditional3%16%5%4%8%11%--2%7%1%5%-7%6%--13%-2%6%
*-31-102-33329811152458It complements the1%-12%4%-5%16%-10%5%3%4%25%12%3%8%4%12%5%11%6%other ingredients in
the meal
Page 70
Brassica Vegetables SurveyONLINE Fieldwork: 19th-20th November 2014
Absolutes/col percents
Table 70Q.2 Brassica is a family of plants that includes many common vegetables such as broccoli, swede, turnip, cauliflower, cabbage, kaleand brussel sprouts. Thinking about each of the Brassica vegetables you use in your meals, which of the following reasons bestdescribes why you use each one?Base: All respondents who ever use eachCauliflower
Prepared by Populus
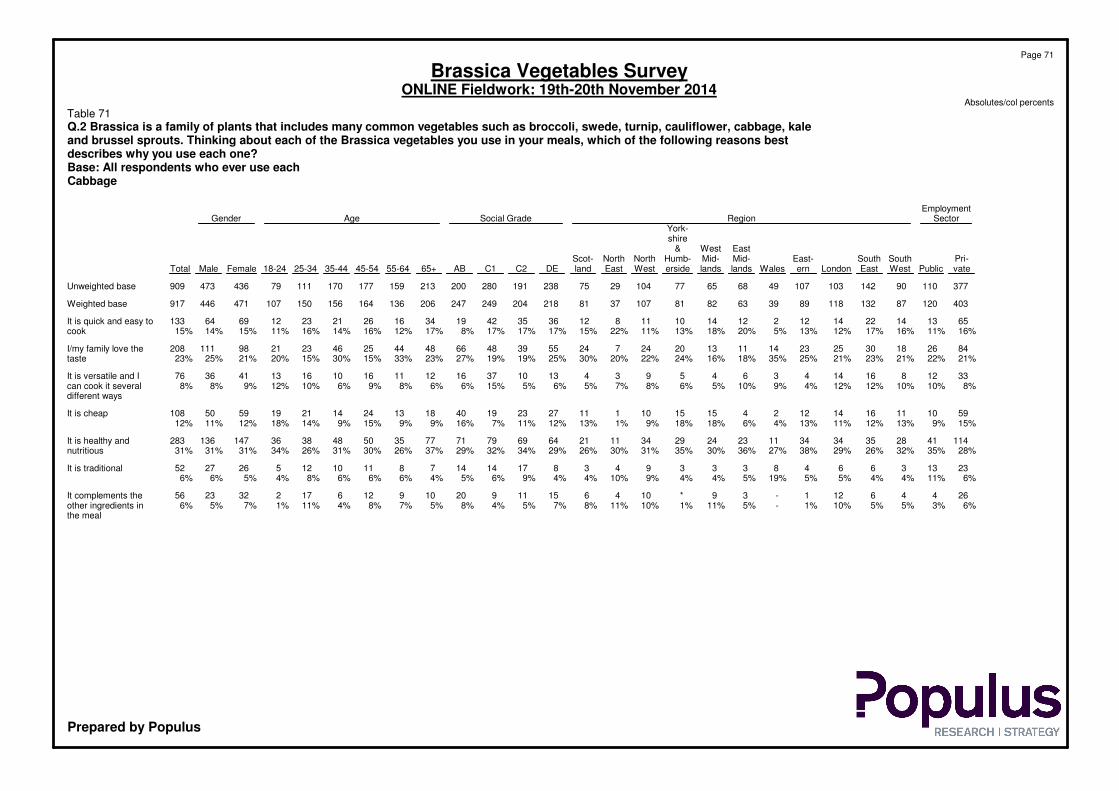
EmploymentSectorRegionSocial GradeAgeGender
York-shire
EastWest&Pri-SouthSouthEast-Mid-Mid-Humb-NorthNorthScot-vatePublicWestEastLondonernWaleslandslandsersideWestEastlandDEC2C1AB65+55-6445-5435-4425-3418-24FemaleMaleTotal
3771109014210310749686577104297523819128020021315917717011179436473909Unweighted base
4031208713211889396382811073781218204249247206136164156150107471446917Weighted base
651314221412212141011812363542193416262123126964133It is quick and easy to16%11%16%17%12%13%5%20%18%13%11%22%15%17%17%17%8%17%12%16%14%16%11%15%14%15%cook
84261830252314111320247245539486648442546232198111208I/my family love the21%22%21%23%21%25%35%18%16%24%22%20%30%25%19%19%27%23%33%15%30%15%20%21%25%23%taste
3312816144364593413103716121116101613413676It is versatile and I8%10%10%12%12%4%9%10%5%6%8%7%5%6%5%15%6%6%8%9%6%10%12%9%8%8%can cook it several
different ways
59101116141224151510111272319401813241421195950108It is cheap15%9%13%12%11%13%4%6%18%18%9%1%13%12%11%7%16%9%9%15%9%14%18%12%11%12%
11441283534341123242934112164697971773550483836147136283It is healthy and28%35%32%26%29%38%27%36%30%35%31%30%26%29%34%32%29%37%26%30%31%26%34%31%31%31%nutritious
2313366483339438171414781110125262752It is traditional6%11%4%4%5%5%19%5%4%4%9%10%4%4%9%6%5%4%6%6%6%8%4%5%6%6%
26446121-39*10461511920109126172322356It complements the6%3%5%5%10%1%-5%11%1%10%11%8%7%5%4%8%5%7%8%4%11%1%7%5%6%other ingredients in
the meal
Page 71
Brassica Vegetables SurveyONLINE Fieldwork: 19th-20th November 2014
Absolutes/col percents
Table 71Q.2 Brassica is a family of plants that includes many common vegetables such as broccoli, swede, turnip, cauliflower, cabbage, kaleand brussel sprouts. Thinking about each of the Brassica vegetables you use in your meals, which of the following reasons bestdescribes why you use each one?Base: All respondents who ever use eachCabbage
Prepared by Populus
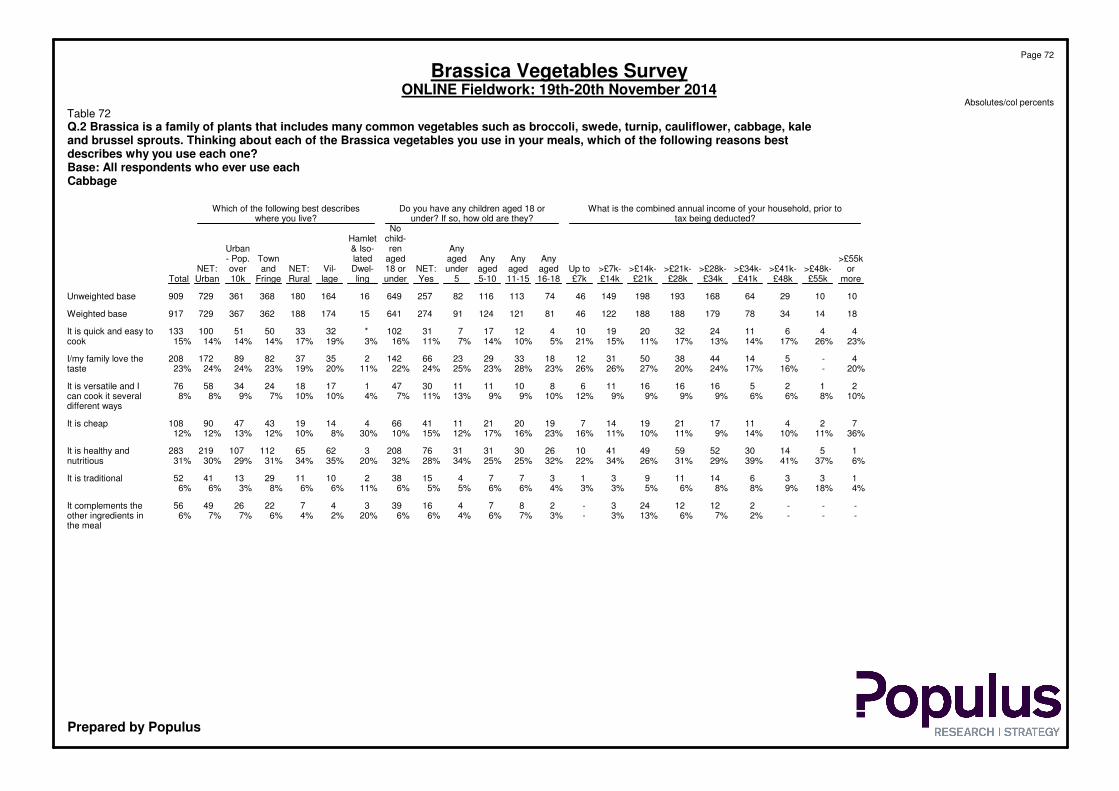
What is the combined annual income of your household, prior toDo you have any children aged 18 orWhich of the following best describestax being deducted?under? If so, how old are they?where you live?
Nochild-Hamlet
Anyren& Iso-Urban>£55kAnyAnyAnyagedagedlatedTown- Pop.
or>£48k->£41k->£34k->£28k->£21k->£14k->£7k-Up toagedagedagedunderNET:18 orDwel-Vil-NET:andoverNET:more£55k£48k£41k£34k£28k£21k£14k£7k16-1811-155-105YesunderlinglageRuralFringe10kUrbanTotal
1010296416819319814946741131168225764916164180368361729909Unweighted base
1814347817918818812246811211249127464115174188362367729917Weighted base
44611243220191041217731102*32335051100133It is quick and easy to23%26%17%14%13%17%11%15%21%5%10%14%7%11%16%3%19%17%14%14%14%15%cook
4-51444385031121833292366142235378289172208I/my family love the20%-16%17%24%20%27%26%26%23%28%23%25%24%22%11%20%19%23%24%24%23%taste
2125161616116810111130471171824345876It is versatile and I10%8%6%6%9%9%9%9%12%10%9%9%13%11%7%4%10%10%7%9%8%8%can cook it several
different ways
7241117211914719202111416641419434790108It is cheap36%11%10%14%9%11%10%11%16%23%16%17%12%15%10%30%8%10%12%13%12%12%
1514305259494110263031317620836265112107219283It is healthy and6%37%41%39%29%31%26%34%22%32%25%25%34%28%32%20%35%34%31%29%30%31%nutritious
13361411931377415382101129134152It is traditional4%18%9%8%8%6%5%3%3%4%6%6%5%5%6%11%6%6%8%3%6%6%
---21212243-2874163934722264956It complements the---2%7%6%13%3%-3%7%6%4%6%6%20%2%4%6%7%7%6%other ingredients in
the meal
Page 72
Brassica Vegetables SurveyONLINE Fieldwork: 19th-20th November 2014
Absolutes/col percents
Table 72Q.2 Brassica is a family of plants that includes many common vegetables such as broccoli, swede, turnip, cauliflower, cabbage, kaleand brussel sprouts. Thinking about each of the Brassica vegetables you use in your meals, which of the following reasons bestdescribes why you use each one?Base: All respondents who ever use eachCabbage
Prepared by Populus

Marital StatusWhich of the following ITV regions do you live in?NET:Mar-ried/
NET:CivilWid-part-owed/ner-separ-Civilship/ated/CoPart-coWest-
Div-Separ-Wid-div-Hab-ner-Mar-hab-York-count-WalesTyneScot-Meri-Gran-Gram-Cent-orcedatedowedorceditingshiprieditingSingleshirery& WestTeestishdianLondonadapianralAngliaTotal
9211401431211341454821154254630688916910511510109909Unweighted base
801042132123134175542285130373973751841101211094917Weighted base
9-10199*606944112281113241522112133It is quick and easy to11%-25%15%7%3%14%13%19%22%6%5%19%15%18%13%14%18%10%13%15%cook
2041439241100125441041292317412519223208I/my family love the25%42%34%29%20%10%24%23%19%19%13%32%22%31%23%23%23%15%19%25%23%taste
517131442744194633432489-676It is versatile and I7%7%16%10%11%26%6%8%8%7%19%9%7%6%4%13%7%7%-7%8%can cook it several
different ways
5-2721*5172288821101122101319108It is cheap6%-5%5%17%3%12%13%12%15%26%5%1%13%14%12%9%11%10%10%12%
31173931814118063121111121723493243537283It is healthy and39%13%16%30%25%58%34%32%28%24%35%29%31%24%30%27%29%35%51%40%31%nutritious
4--412-1931172-84266951552It is traditional6%--3%10%-5%6%7%5%-20%9%3%8%4%8%4%9%6%6%
5421012-2032134--462161011-156It complements the6%38%4%8%10%-5%6%6%8%--10%8%3%9%9%9%-1%6%other ingredients in
the meal
Page 73
Brassica Vegetables SurveyONLINE Fieldwork: 19th-20th November 2014
Absolutes/col percents
Table 73Q.2 Brassica is a family of plants that includes many common vegetables such as broccoli, swede, turnip, cauliflower, cabbage, kaleand brussel sprouts. Thinking about each of the Brassica vegetables you use in your meals, which of the following reasons bestdescribes why you use each one?Base: All respondents who ever use eachCabbage
Prepared by Populus

Which of the following cities do you live in, or nearest to?None ofPly-South-Brigh-MiltonBirm-Nott-Liver-Manch-Shef-New-Edin-theseCardiffmouthBristolamptonLondonOxfordtonKeynesNorwichinghaminghampoolesterfieldHullLeedscastleburghGlasgowTotal
70373429392031317295665433470261039303233909Unweighted base
6432273431214121822508140307132939393637917Weighted base
92481352225144191222818133It is quick and easy to14%6%13%24%5%17%13%13%11%11%17%11%5%13%37%17%6%19%4%22%15%cook
13124885311511128516741081410208I/my family love the21%38%15%24%26%25%4%7%21%21%14%19%16%22%23%44%25%22%39%26%23%taste
533332411*44645--532176It is versatile and I7%9%10%10%10%11%6%6%2%8%5%14%15%6%--12%7%7%3%8%can cook it several
different ways
14164225-71313233228-55108It is cheap22%4%21%12%8%12%-38%3%6%16%6%11%5%8%22%22%-14%13%12%
197108105276132226161025921213126283It is healthy and29%22%36%22%34%24%60%31%57%45%33%39%32%36%28%17%31%33%34%16%31%nutritious
27-237112442361-24-352It is traditional3%21%-4%11%3%5%5%7%7%4%5%10%9%5%-5%9%-8%6%
2-112162--19237---41456It complements the3%-5%4%7%8%13%--2%11%6%12%9%---10%3%11%6%other ingredients in
the meal
Page 74
Brassica Vegetables SurveyONLINE Fieldwork: 19th-20th November 2014
Absolutes/col percents
Table 74Q.2 Brassica is a family of plants that includes many common vegetables such as broccoli, swede, turnip, cauliflower, cabbage, kaleand brussel sprouts. Thinking about each of the Brassica vegetables you use in your meals, which of the following reasons bestdescribes why you use each one?Base: All respondents who ever use eachCabbage
Prepared by Populus

EmploymentSectorRegionSocial GradeAgeGender
York-shire
EastWest&Pri-SouthSouthEast-Mid-Mid-Humb-NorthNorthScot-vatePublicWestEastLondonernWaleslandslandsersideWestEastlandDEC2C1AB65+55-6445-5435-4425-3418-24FemaleMaleTotal
203595687595124432839491639106931631291318588805849255236491Unweighted base
22068548770422141384543204291891601611317081728364278223501Weighted base
2275735*23351465151364104116172340It is quick and easy to10%11%9%8%4%12%2%6%9%6%11%7%10%7%6%9%8%4%5%12%5%13%10%6%10%8%cook
34841517931584181192826181211101113393674I/my family love the15%12%6%18%24%21%16%2%13%17%9%6%20%12%10%18%16%14%17%14%13%13%21%14%16%15%taste
154276132*74-511413115536415191938It is versatile and I7%7%4%8%8%3%15%6%1%16%9%-11%12%4%8%7%4%7%3%8%5%24%7%9%8%can cook it several
different ways
131454314-65-45512131822626181836It is cheap6%2%8%6%6%7%4%9%-14%12%-10%6%6%8%8%14%3%2%8%3%9%6%8%7%
1053032323218112723152114144051668267324039431814990239It is healthy and48%44%59%37%46%42%53%65%62%33%49%70%33%44%57%41%51%51%45%50%54%52%28%53%40%48%nutritious
121329211243234671185553104161732It is traditional5%19%3%10%3%2%4%5%11%6%5%13%9%7%7%7%5%4%7%7%5%12%6%6%7%6%
184512651314213128158121110522222043It complements the8%6%9%13%8%12%7%8%4%8%5%4%6%13%9%9%5%9%16%13%6%3%3%8%9%8%other ingredients in
the meal
Page 75
Brassica Vegetables SurveyONLINE Fieldwork: 19th-20th November 2014
Absolutes/col percents
Table 75Q.2 Brassica is a family of plants that includes many common vegetables such as broccoli, swede, turnip, cauliflower, cabbage, kaleand brussel sprouts. Thinking about each of the Brassica vegetables you use in your meals, which of the following reasons bestdescribes why you use each one?Base: All respondents who ever use eachKale
Prepared by Populus

What is the combined annual income of your household, prior toDo you have any children aged 18 orWhich of the following best describestax being deducted?under? If so, how old are they?where you live?
Nochild-Hamlet
Anyren& Iso-Urban>£55kAnyAnyAnyagedagedlatedTown- Pop.
or>£48k->£41k->£34k->£28k->£21k->£14k->£7k-Up toagedagedagedunderNET:18 orDwel-Vil-NET:andoverNET:more£55k£48k£41k£34k£28k£21k£14k£7k16-1811-155-105YesunderlinglageRuralFringe10kUrbanTotal
661832941071116626386155371263631394107187197384491Unweighted base
12921379511410952264160563913037010102111181209390501Weighted base
2-51116852-764112815614203340It is quick and easy to17%-23%3%11%5%7%10%9%-11%11%11%9%8%13%5%6%7%9%9%8%cook
3-4313162072767618571101126376374I/my family love the26%-20%9%14%14%19%14%9%17%10%12%16%14%15%7%10%10%14%18%16%15%taste
5-116666824451028*12139172538It is versatile and I40%-3%3%6%5%5%11%30%5%7%7%13%8%7%4%12%12%5%8%6%8%can cook it several
different ways
1-2*59863-752927391112132536It is cheap7%-9%1%6%8%8%11%10%-12%9%5%7%7%28%8%10%6%6%6%7%
131025505644241124272417611764454990100190239It is healthy and10%34%46%69%53%49%40%47%41%59%45%44%45%47%48%39%44%44%50%48%49%48%nutritious
-5-331272*-763824113141081832It is traditional-56%-7%3%10%6%3%2%-11%11%7%6%6%9%13%13%5%4%5%6%
-1-378172-83311230-7722143543It complements the-9%-8%8%7%15%4%-18%5%6%3%9%8%-7%6%12%7%9%8%other ingredients in
the meal
Page 76
Brassica Vegetables SurveyONLINE Fieldwork: 19th-20th November 2014
Absolutes/col percents
Table 76Q.2 Brassica is a family of plants that includes many common vegetables such as broccoli, swede, turnip, cauliflower, cabbage, kaleand brussel sprouts. Thinking about each of the Brassica vegetables you use in your meals, which of the following reasons bestdescribes why you use each one?Base: All respondents who ever use eachKale
Prepared by Populus

Marital StatusWhich of the following ITV regions do you live in?NET:Mar-ried/
NET:CivilWid-part-owed/ner-separ-Civilship/ated/CoPart-coWest-
Div-Separ-Wid-div-Hab-ner-Mar-hab-York-count-WalesTyneScot-Meri-Gran-Gram-Cent-orcedatedowedorceditingshiprieditingSingleshirery& WestTeestishdianLondonadapianralAngliaTotal
48324756762232961163710231633531025060652491Unweighted base
43327737552223021243713202034471154462646501Weighted base
--2210-1828932*1427461740It is quick and easy to--9%3%14%-8%9%8%7%14%2%7%10%4%6%9%9%23%15%8%cook
4-610161284619313267246511074I/my family love the8%-22%13%22%30%13%15%15%7%4%16%11%16%14%21%13%8%15%21%15%taste
61*81*7921123-54933-138It is versatile and I15%45%2%11%2%8%3%3%17%4%11%15%-14%9%8%7%4%-3%8%can cook it several
different ways
3-485-182353---337611336It is cheap8%-17%11%7%-8%8%4%7%---9%7%6%14%1%16%6%7%
25212393131131475124911131120482140321239It is healthy and59%55%45%54%42%62%51%49%41%64%70%55%65%32%41%41%47%65%45%44%48%nutritious
2--25-131712--13431026-132It is traditional5%--3%7%-6%6%10%--4%13%11%6%8%5%9%-2%6%
2-246-263174-11391122-443It complements the5%-6%5%8%-12%10%6%11%-8%4%8%18%9%4%3%-9%8%other ingredients in
the meal
Page 77
Brassica Vegetables SurveyONLINE Fieldwork: 19th-20th November 2014
Absolutes/col percents
Table 77Q.2 Brassica is a family of plants that includes many common vegetables such as broccoli, swede, turnip, cauliflower, cabbage, kaleand brussel sprouts. Thinking about each of the Brassica vegetables you use in your meals, which of the following reasons bestdescribes why you use each one?Base: All respondents who ever use eachKale
Prepared by Populus

Which of the following cities do you live in, or nearest to?None ofPly-South-Brigh-MiltonBirm-Nott-Liver-Manch-Shef-New-Edin-theseCardiffmouthBristolamptonLondonOxfordtonKeynesNorwichinghaminghampoolesterfieldHullLeedscastleburghGlasgowTotal
31182119281196713302929203214621161814491Unweighted base
251718232313351010253728202518624192214501Weighted base
2*32211-1-231223-122140It is quick and easy to6%3%16%8%9%8%-8%-8%9%4%10%9%15%-4%11%9%6%8%cook
23223271-175113*2616274I/my family love the8%19%9%7%15%20%11%-13%29%13%2%6%11%3%26%23%6%28%15%15%taste
2311112--*1*2211-5-3238It is versatile and I6%18%3%5%5%9%--4%4%1%6%13%6%7%-22%-14%11%8%can cook it several
different ways
2-2-48--111-32711-2236It is cheap7%-10%-16%6%--9%6%1%-15%9%38%14%5%-9%15%7%
1481017854247923209145291365239It is healthy and57%49%55%75%36%40%33%41%74%35%63%71%44%54%29%32%37%67%26%39%48%nutritious
11--39-1-*44-2--132132It is traditional4%5%--15%7%-5%-2%11%14%-8%--4%13%11%6%6%
311111235-41*2112111143It complements the12%6%7%5%5%9%56%46%-16%2%2%13%3%8%29%5%4%4%8%8%other ingredients in
the meal
Page 78
Brassica Vegetables SurveyONLINE Fieldwork: 19th-20th November 2014
Absolutes/col percents
Table 78Q.2 Brassica is a family of plants that includes many common vegetables such as broccoli, swede, turnip, cauliflower, cabbage, kaleand brussel sprouts. Thinking about each of the Brassica vegetables you use in your meals, which of the following reasons bestdescribes why you use each one?Base: All respondents who ever use eachKale
Prepared by Populus

EmploymentSectorRegionSocial GradeAgeGender
York-shire
EastWest&Pri-SouthSouthEast-Mid-Mid-Humb-NorthNorthScot-vatePublicWestEastLondonernWaleslandslandsersideWestEastlandDEC2C1AB65+55-6445-5435-4425-3418-24FemaleMaleTotal
347988513999103486564709031722191842711922171601711549371417449866Unweighted base
36010876125114884263797187407720218624423121213716213612094450413863Weighted base
323391110*466247261316112012184102293666It is quick and easy to9%3%4%7%10%12%1%7%8%9%3%11%9%13%7%7%5%9%8%11%3%8%3%6%9%8%cook
873020392130101321192381947467356653944322617111112222I/my family love the24%28%26%31%19%34%24%20%26%27%27%20%25%23%25%30%24%31%28%27%24%21%18%25%27%26%taste
17633131266252210711167487414212444It is versatile and I5%5%4%2%11%1%6%9%7%3%6%5%2%5%4%5%7%4%3%5%5%3%15%5%6%5%can cook it several
different ways
2443-621-89721817223445815172138It is cheap7%4%4%-5%2%4%-10%12%7%5%1%4%1%3%9%1%3%3%3%6%16%4%5%4%
83271826282612181415215224552565253343641231910799206It is healthy and23%25%24%21%25%30%29%29%18%21%24%13%28%22%28%23%23%25%25%22%30%19%20%24%24%24%nutritious
102332739261811192419229234956676647393941492314197238It is traditional28%31%35%31%22%21%27%30%31%27%25%23%30%24%30%28%29%22%28%24%30%41%24%31%23%28%
175398143-*793171113817613614252348It complements the5%4%4%7%7%1%10%4%-1%8%24%4%8%6%5%3%8%4%8%4%1%4%5%6%6%other ingredients in
the meal
Page 79
Brassica Vegetables SurveyONLINE Fieldwork: 19th-20th November 2014
Absolutes/col percents
Table 79Q.2 Brassica is a family of plants that includes many common vegetables such as broccoli, swede, turnip, cauliflower, cabbage, kaleand brussel sprouts. Thinking about each of the Brassica vegetables you use in your meals, which of the following reasons bestdescribes why you use each one?Base: All respondents who ever use eachBrussel Sprouts
Prepared by Populus

What is the combined annual income of your household, prior toDo you have any children aged 18 orWhich of the following best describestax being deducted?under? If so, how old are they?where you live?
Nochild-Hamlet
Anyren& Iso-Urban>£55kAnyAnyAnyagedagedlatedTown- Pop.
or>£48k->£41k->£34k->£28k->£21k->£14k->£7k-Up toagedagedagedunderNET:18 orDwel-Vil-NET:andoverNET:more£55k£48k£41k£34k£28k£21k£14k£7k16-1811-155-105YesunderlinglageRuralFringe10kUrbanTotal
69275716318319314444701091127824162215169184339343682866Unweighted base
1313316316718318212143771171157924861213173186326351677863Weighted base
3--41671213538951452*121224295366It is quick and easy to27%--6%9%4%6%11%11%4%7%8%7%6%8%4%7%7%7%8%8%8%cook
3291542554630111925251655167641489085175222I/my family love the20%14%30%23%25%30%25%25%25%25%22%22%20%22%27%49%24%26%28%24%26%26%taste
-1-687126356971826-9912243544It is versatile and I-8%-9%5%4%7%5%8%7%6%7%8%7%4%-5%5%4%7%5%5%can cook it several
different ways
522-8573327931226-7710223138It is cheap37%11%5%-5%3%4%2%7%3%6%7%3%5%4%-4%4%3%6%5%4%
-411124345433172033261862144246487583158206It is healthy and-27%36%19%26%24%24%25%16%26%29%23%23%25%24%17%27%26%23%24%23%24%nutritious
2592343594824142728363078160450549293184238It is traditional15%40%29%37%26%32%26%19%32%34%24%31%38%31%26%30%29%29%28%26%27%28%
---4851416*19311136-8824164048It complements the---6%5%3%7%13%1%1%7%2%1%4%6%-5%4%7%4%6%6%other ingredients in
the meal
Page 80
Brassica Vegetables SurveyONLINE Fieldwork: 19th-20th November 2014
Absolutes/col percents
Table 80Q.2 Brassica is a family of plants that includes many common vegetables such as broccoli, swede, turnip, cauliflower, cabbage, kaleand brussel sprouts. Thinking about each of the Brassica vegetables you use in your meals, which of the following reasons bestdescribes why you use each one?Base: All respondents who ever use eachBrussel Sprouts
Prepared by Populus

Marital StatusWhich of the following ITV regions do you live in?NET:Mar-ried/
NET:CivilWid-part-owed/ner-separ-Civilship/ated/CoPart-coWest-
Div-Separ-Wid-div-Hab-ner-Mar-hab-York-count-WalesTyneScot-Meri-Gran-Gram-Cent-orcedatedowedorceditingshiprieditingSingleshirery& WestTeestishdianLondonadapianralAngliaTotal
85113713311710407534192522245316588162921159105866Unweighted base
751040125112841052920444274040697217591122992863Weighted base
4-593137411621*47319211-966It is quick and easy to5%-13%7%3%8%9%8%8%5%2%1%11%11%5%11%2%9%-9%8%cook
172153432110513849105891728392425432222I/my family love the23%18%39%27%29%9%26%26%24%23%18%20%23%24%39%22%26%21%39%34%26%taste
5-3843192610-3222115411-144It is versatile and I6%-8%6%4%37%5%5%5%-13%6%5%2%1%9%5%9%-1%5%can cook it several
different ways
1-1110-15241216121-673-238It is cheap1%-1%1%9%-4%5%6%3%22%4%5%1%-3%7%2%-3%4%
16352420310813150881251713402127530206It is healthy and22%26%12%19%18%35%26%25%24%18%31%30%13%24%19%23%23%23%50%33%24%nutritious
306944371102140542041182223442641116238It is traditional40%56%22%35%33%11%25%26%26%45%14%28%21%32%32%25%29%33%11%17%28%
3-255-2429133-49331373-348It complements the3%-6%4%5%-6%5%7%6%-11%23%4%4%7%8%2%-3%6%other ingredients in
the meal
Page 81
Brassica Vegetables SurveyONLINE Fieldwork: 19th-20th November 2014
Absolutes/col percents
Table 81Q.2 Brassica is a family of plants that includes many common vegetables such as broccoli, swede, turnip, cauliflower, cabbage, kaleand brussel sprouts. Thinking about each of the Brassica vegetables you use in your meals, which of the following reasons bestdescribes why you use each one?Base: All respondents who ever use eachBrussel Sprouts
Prepared by Populus

Which of the following cities do you live in, or nearest to?None ofPly-South-Brigh-MiltonBirm-Nott-Liver-Manch-Shef-New-Edin-theseCardiffmouthBristolamptonLondonOxfordtonKeynesNorwichinghaminghampoolesterfieldHullLeedscastleburghGlasgowTotal
66353224411931316315462423360241037313032866Unweighted base
5930262432204121524497738335530937413336863Weighted base
3*21120113564-321243466It is quick and easy to5%2%6%3%2%10%9%9%12%10%7%10%-5%8%9%7%11%8%11%8%cook
19773194814516205713751010107222I/my family love the32%25%28%14%59%24%4%26%23%32%26%12%21%23%24%57%28%25%30%18%26%taste
32--*16--*-65232--2-244It is versatile and I5%8%--1%8%--2%-8%13%8%5%8%--5%-4%5%can cook it several
different ways
7111-7--1-6-221171-138It is cheap12%3%5%4%-3%--2%-8%-5%3%4%9%18%3%-3%4%
111066447131018161171641105136206It is healthy and19%33%25%26%14%23%10%17%41%36%21%29%22%29%13%9%27%13%39%17%24%nutritious
1699127517858221171513278715238It is traditional27%30%35%50%22%25%58%49%20%16%29%28%22%28%43%16%20%21%20%40%28%
*-*11142--3-374---91248It complements the1%-2%3%2%7%19%--6%-7%22%8%---23%3%6%6%other ingredients in
the meal
Page 82
Brassica Vegetables SurveyONLINE Fieldwork: 19th-20th November 2014
Absolutes/col percents
Table 82Q.2 Brassica is a family of plants that includes many common vegetables such as broccoli, swede, turnip, cauliflower, cabbage, kaleand brussel sprouts. Thinking about each of the Brassica vegetables you use in your meals, which of the following reasons bestdescribes why you use each one?Base: All respondents who ever use eachBrussel Sprouts
Prepared by Populus

Brassica VegetablesBrussel SproutsKaleCabbageCauliflowerTurnipSwedeBroccoli
284284284284284284284Unweighted base
300300300300300300300Weighted base
172100222243151180259NET: Yes57%33%74%81%50%60%87%
704712113579102148Yes, as often as in my23%16%40%45%26%34%49%diet
35183249192946Yes, more often than12%6%11%16%6%10%15%in my diet
67366860535065Yes, but less often22%12%23%20%18%17%22%than in my diet
127200785714912040NET: No43%67%26%19%50%40%13%
100495542766831No, because they do33%16%18%14%25%23%10%not like it
271502415735210No, they have never9%50%8%5%24%17%3%tried it
Page 83
Brassica Vegetables SurveyONLINE Fieldwork: 19th-20th November 2014
Absolutes/col percents
Table 83Q.3 Do the following Brassica vegetables form part of your children's diet?Base: All respondents with childrenSummary
Prepared by Populus

EmploymentSectorRegionSocial GradeAgeGender
York-shire
EastWest&Pri-SouthSouthEast-Mid-Mid-Humb-NorthNorthScot-vatePublicWestEastLondonernWaleslandslandsersideWestEastlandDEC2C1AB65+55-6445-5435-4425-3418-24FemaleMaleTotal
15748284136171918262938122068826965110721195725143141284Unweighted base
17341304239131515323540152275915974*10751136932159141300Weighted base
15136253836121514262638131663815164*1067965729139121259NET: Yes87%89%85%90%93%94%97%93%80%74%94%88%71%84%89%87%86%100%100%90%84%83%90%87%86%87%
852013212061210141418101040522630*8345734159157148Yes, as often as in my49%48%43%49%52%50%76%65%45%40%44%67%44%53%57%44%41%100%87%45%50%49%47%57%40%49%diet
2494672233663311141210-1131689192746Yes, more often than14%21%12%15%18%19%14%17%10%18%15%21%16%15%15%20%13%-6%17%14%12%27%12%19%15%in my diet
42891193128614-312161424-12123165283765Yes, but less often24%19%30%26%22%26%7%11%26%16%35%-12%16%17%23%32%-7%28%20%23%15%18%26%22%than in my diet
2255431*1693261210810--718123202040NET: No13%11%15%10%7%6%3%7%20%26%6%12%29%16%11%13%14%--10%16%17%10%13%14%13%
1751231*1653268868--71463191231No, because they do10%11%4%5%7%6%3%7%20%15%6%12%29%11%9%10%11%--9%13%9%10%12%9%10%not like it
5-42-----4---4222--*46-2810No, they have never3%-12%5%-----11%---5%2%3%2%--1%3%8%-1%6%3%tried it
Page 84
Brassica Vegetables SurveyONLINE Fieldwork: 19th-20th November 2014
Absolutes/col percents
Table 84Q.3 Do the following Brassica vegetables form part of your children's diet?Base: All respondents with childrenBroccoli
Prepared by Populus

What is the combined annual income of your household, prior toDo you have any children aged 18 orWhich of the following best describestax being deducted?under? If so, how old are they?where you live?
Nochild-Hamlet
Anyren& Iso-Urban>£55kAnyAnyAnyagedagedlatedTown- Pop.
or>£48k->£41k->£34k->£28k->£21k->£14k->£7k-Up toagedagedagedunderNET:18 orDwel-Vil-NET:andoverNET:more£55k£48k£41k£34k£28k£21k£14k£7k16-1811-155-105YesunderlinglageRuralFringe10kUrbanTotal
1110287067662877711912996284-24244127113240284Unweighted base
11937696867301284126135105300-34547137116253300Weighted base
1173660565725117511312287259--3737123100223259NET: Yes100%100%74%97%87%82%86%83%92%89%90%90%83%87%--82%78%90%86%88%87%
1122730263615642576851148--22228343126148Yes, as often as in my100%100%25%74%44%38%54%50%53%50%45%51%48%49%--50%47%61%37%50%49%diet
--239119541422211346--6617244046Yes, more often than--26%9%13%17%14%15%33%17%18%16%12%15%--13%12%12%20%16%15%in my diet
--25201812511834322465--9923345665Yes, but less often--22%14%29%27%18%18%6%22%27%24%22%22%--19%18%17%29%22%22%than in my diet
--21912951913131840-381014163040NET: No--26%3%13%18%14%17%8%11%10%10%17%13%-100%18%22%10%14%12%13%
--219972169111231-36911122231No, because they do--26%3%13%13%10%6%8%7%8%8%11%10%-100%14%18%8%10%9%10%not like it
-----433-342610--2244810No, they have never-----6%4%10%-4%3%2%6%3%--4%4%3%4%3%3%tried it
Page 85
Brassica Vegetables SurveyONLINE Fieldwork: 19th-20th November 2014
Absolutes/col percents
Table 85Q.3 Do the following Brassica vegetables form part of your children's diet?Base: All respondents with childrenBroccoli
Prepared by Populus

Marital StatusWhich of the following ITV regions do you live in?NET:Mar-ried/
NET:CivilWid-part-owed/ner-separ-Civilship/ated/CoPart-coWest-
Div-Separ-Wid-div-Hab-ner-Mar-hab-York-count-WalesTyneScot-Meri-Gran-Gram-Cent-orcedatedowedorceditingshiprieditingSingleshirery& WestTeestishdianLondonadapianralAngliaTotal
1643236151512174318918121927513941118284Unweighted base
1345215461722324620915152123594144114300Weighted base
1345214461441944317814131621543838-13259NET: Yes100%100%100%100%81%100%84%84%94%82%88%97%88%75%89%92%94%86%-95%87%
63514235891171710311101011281822-9148Yes, as often as in my48%82%100%66%42%84%52%50%37%49%37%75%67%46%46%48%45%50%-62%49%diet
21-39*283763123341166-146Yes, more often than15%18%-13%17%6%16%16%13%14%13%14%21%16%19%18%15%13%-7%15%in my diet
5--5121274020431-36151410-465Yes, but less often36%--21%22%11%16%17%45%20%38%8%-12%24%26%34%22%-26%22%than in my diet
----10-2738341*2535361140NET: No----19%-16%16%6%18%12%3%12%25%11%8%6%14%100%5%13%
----7-22283-1*2523361131No, because they do----12%-13%12%6%-12%3%12%25%9%5%6%14%100%5%10%not like it
----4-610-4----*2----10No, they have never----7%-3%4%-18%----2%3%----3%tried it
Page 86
Brassica Vegetables SurveyONLINE Fieldwork: 19th-20th November 2014
Absolutes/col percents
Table 86Q.3 Do the following Brassica vegetables form part of your children's diet?Base: All respondents with childrenBroccoli
Prepared by Populus

Which of the following cities do you live in, or nearest to?None ofPly-South-Brigh-MiltonBirm-Nott-Liver-Manch-Shef-New-Edin-theseCardiffmouthBristolamptonLondonOxfordtonKeynesNorwichinghaminghampoolesterfieldHullLeedscastleburghGlasgowTotal
171581410624677251411279-1812414284Unweighted base
1713717668410463115112812-1715516300Weighted base
1312613663210362515102611-1113510259NET: Yes79%97%93%75%100%92%43%100%82%100%80%100%94%93%86%-65%88%100%66%87%
51029135251414124156-31036148Yes, as often as in my27%75%34%55%24%51%43%57%17%77%46%82%37%53%50%-20%67%65%38%49%diet
5212211-21-21134-332246Yes, more often than28%13%17%14%36%17%-17%24%-8%7%13%9%30%-16%21%35%11%15%in my diet
4131217-32182591-5--365Yes, but less often24%9%42%7%40%25%-27%41%23%26%11%44%31%7%-29%--16%22%than in my diet
4**4-52-1-6-122-62-540NET: No21%3%7%25%-8%57%-18%-20%-6%7%14%-35%12%-34%13%
4*-1-32-1-6-12--42-531No, because they do21%3%-6%-4%57%-18%-20%-6%7%--22%12%-34%10%not like it
--*3-2--------2-2---10No, they have never--7%18%-3%--------14%-12%---3%tried it
Page 87
Brassica Vegetables SurveyONLINE Fieldwork: 19th-20th November 2014
Absolutes/col percents
Table 87Q.3 Do the following Brassica vegetables form part of your children's diet?Base: All respondents with childrenBroccoli
Prepared by Populus

EmploymentSectorRegionSocial GradeAgeGender
York-shire
EastWest&Pri-SouthSouthEast-Mid-Mid-Humb-NorthNorthScot-vatePublicWestEastLondonernWaleslandslandsersideWestEastlandDEC2C1AB65+55-6445-5435-4425-3418-24FemaleMaleTotal
15748284136171918262938122068826965110721195725143141284Unweighted base
17341304239131515323540152275915974*10751136932159141300Weighted base
115222031206119131627111740573647*34474362210080180NET: Yes66%54%66%72%52%43%74%60%40%45%67%73%76%53%62%61%63%100%35%59%65%52%68%63%57%60%
641213161147755178927311925-3224521116735102Yes, as often as in my37%30%45%39%28%30%46%47%14%13%43%55%40%36%33%33%34%-35%30%39%30%33%42%25%34%diet
214247-121622157126--7966121729Yes, more often than12%10%8%10%17%-7%13%3%17%5%13%5%6%7%20%8%--9%8%9%19%8%12%10%in my diet
306410323-75817820516*-152095212950Yes, but less often17%14%13%23%7%13%22%-23%15%19%4%31%11%22%9%22%100%-20%18%13%15%13%20%17%than in my diet
59191012197461920134535342327-6303933115961120NET: No34%46%34%28%48%57%26%40%60%55%33%27%24%47%38%39%37%-65%41%35%48%32%37%43%40%
341174155439991321211511-61920176373168No, because they do20%26%22%9%38%41%26%21%29%25%22%3%12%28%23%25%15%-58%25%18%25%19%23%22%23%not like it
2484842-310114431413816-11219164222952No, they have never14%19%12%19%10%16%-19%30%30%11%24%12%19%14%14%22%-7%16%17%23%13%14%21%17%tried it
Page 88
Brassica Vegetables SurveyONLINE Fieldwork: 19th-20th November 2014
Absolutes/col percents
Table 88Q.3 Do the following Brassica vegetables form part of your children's diet?Base: All respondents with childrenSwede
Prepared by Populus

What is the combined annual income of your household, prior toDo you have any children aged 18 orWhich of the following best describestax being deducted?under? If so, how old are they?where you live?
Nochild-Hamlet
Anyren& Iso-Urban>£55kAnyAnyAnyagedagedlatedTown- Pop.
or>£48k->£41k->£34k->£28k->£21k->£14k->£7k-Up toagedagedagedunderNET:18 orDwel-Vil-NET:andoverNET:more£55k£48k£41k£34k£28k£21k£14k£7k16-1811-155-105YesunderlinglageRuralFringe10kUrbanTotal
1110287067662877711912996284-24244127113240284Unweighted base
11937696867301284126135105300-34547137116253300Weighted base
-132841384217551758254180-127288963152180NET: Yes-100%37%75%60%56%63%58%45%61%60%61%51%60%-38%61%60%65%55%60%60%
-112221162612127384832102-11415582987102Yes, as often as in my-100%10%59%31%24%39%39%5%32%30%36%30%34%-38%32%33%42%25%34%34%diet
----5792471514629--667162329Yes, more often than----8%10%13%8%33%8%12%10%6%10%--13%12%5%14%9%10%in my diet
--2614167311822201650--7724184250Yes, but less often--27%16%20%23%11%11%6%21%17%15%15%17%--16%15%18%16%17%17%than in my diet
1-6928302512733515351120-217194852101120NET: No100%-63%25%40%44%37%42%55%39%40%39%49%40%-62%39%40%35%45%40%40%
--58131514571929302468--111126315768No, because they do--54%22%19%22%21%15%55%22%23%22%23%23%--24%22%19%27%23%23%not like it
1-111515108-1422232752-27822214352No, they have never100%-8%3%22%22%16%27%-17%17%17%26%17%-62%15%18%16%18%17%17%tried it
Page 89
Brassica Vegetables SurveyONLINE Fieldwork: 19th-20th November 2014
Absolutes/col percents
Table 89Q.3 Do the following Brassica vegetables form part of your children's diet?Base: All respondents with childrenSwede
Prepared by Populus

Marital StatusWhich of the following ITV regions do you live in?NET:Mar-ried/
NET:CivilWid-part-owed/ner-separ-Civilship/ated/CoPart-coWest-
Div-Separ-Wid-div-Hab-ner-Mar-hab-York-count-WalesTyneScot-Meri-Gran-Gram-Cent-orcedatedowedorceditingshiprieditingSingleshirery& WestTeestishdianLondonadapianralAngliaTotal
1643236151512174318918121927513941118284Unweighted base
1345215461722324620915152123594144114300Weighted base
831122921081402814511111718312820-8180NET: Yes61%82%25%57%54%37%63%60%61%69%57%74%73%79%78%53%68%47%-60%60%
32161726685111047897191712-4102Yes, as often as in my25%43%13%26%32%31%39%37%25%48%44%47%55%42%31%33%42%26%-32%34%diet
22144-15195211213731-229Yes, more often than15%39%12%19%7%-9%8%11%9%13%4%13%6%11%11%7%3%-12%10%in my diet
3--38*2735122-3178687-250Yes, but less often21%--12%15%6%16%15%25%12%-22%4%32%36%9%19%17%-16%17%than in my diet
513925464931864444527132316120NET: No39%18%75%43%46%63%37%40%39%31%43%26%27%21%22%47%32%53%100%40%40%
4-37104334714344123189121468No, because they do31%-75%34%19%63%19%20%30%14%43%26%3%8%12%30%22%27%100%25%23%not like it
11-215-314644--43210412-252No, they have never8%18%-8%28%-18%20%9%18%--24%13%10%17%10%26%-15%17%tried it
Page 90
Brassica Vegetables SurveyONLINE Fieldwork: 19th-20th November 2014
Absolutes/col percents
Table 90Q.3 Do the following Brassica vegetables form part of your children's diet?Base: All respondents with childrenSwede
Prepared by Populus

Which of the following cities do you live in, or nearest to?None ofPly-South-Brigh-MiltonBirm-Nott-Liver-Manch-Shef-New-Edin-theseCardiffmouthBristolamptonLondonOxfordtonKeynesNorwichinghaminghampoolesterfieldHullLeedscastleburghGlasgowTotal
171581410624677251411279-1812414284Unweighted base
1713717668410463115112812-1715516300Weighted base
99611538110331369198-811412180NET: Yes51%70%84%63%82%56%27%100%68%46%41%40%81%67%63%-45%73%74%74%60%
5629*221612554132-1835102Yes, as often as in my32%47%32%54%6%33%27%67%17%39%17%36%32%47%18%-3%55%55%33%34%diet
112129-----12*3-42-129Yes, more often than5%4%27%4%36%13%-----4%21%2%27%-24%13%-8%10%in my diet
222127-32*7-352-311550Yes, but less often14%18%25%5%40%10%-33%51%7%24%-29%18%18%-18%4%19%33%17%than in my diet
84161303-13189295-9414120NET: No49%30%16%37%18%44%73%-32%54%59%60%19%33%37%-55%27%26%26%40%
34131181-129727--51-368No, because they do18%30%10%19%18%27%22%-32%40%30%47%19%25%--28%3%-17%23%not like it
5-*3-122--192-25-541152No, they have never31%-7%18%-17%51%--14%29%13%-8%37%-26%24%26%9%17%tried it
Page 91
Brassica Vegetables SurveyONLINE Fieldwork: 19th-20th November 2014
Absolutes/col percents
Table 91Q.3 Do the following Brassica vegetables form part of your children's diet?Base: All respondents with childrenSwede
Prepared by Populus

EmploymentSectorRegionSocial GradeAgeGender
York-shire
EastWest&Pri-SouthSouthEast-Mid-Mid-Humb-NorthNorthScot-vatePublicWestEastLondonernWaleslandslandsersideWestEastlandDEC2C1AB65+55-6445-5435-4425-3418-24FemaleMaleTotal
15748284136171918262938122068826965110721195725143141284Unweighted base
17341304239131515323540152275915974*10751136932159141300Weighted base
922111242368761622111739452739*6405728198071151NET: Yes53%51%37%56%59%43%54%47%19%44%55%73%76%52%50%45%53%100%67%54%50%40%57%50%50%50%
4692151235534138928211119-620251711522879Yes, as often as in my27%21%8%35%30%22%31%35%10%12%31%55%42%37%23%19%26%-67%27%22%25%32%33%20%26%diet
114316-1--41211774--76*571119Yes, more often than7%9%9%3%15%-4%--10%3%13%5%1%7%12%5%--9%6%1%16%5%8%6%in my diet
348686332388161018816*-1326103213253Yes, but less often20%20%21%18%14%21%19%12%9%22%21%4%28%14%19%14%22%100%-17%23%15%9%13%23%18%than in my diet
82201919167782620184536463235-3355641147970149NET: No47%49%63%44%41%57%46%53%81%56%45%27%24%48%50%55%47%-33%46%50%60%43%50%50%50%
50101466553121092417241817-21336187373976No, because they do29%25%47%13%17%39%31%20%36%28%23%15%18%23%27%31%22%-22%18%31%25%23%23%28%25%not like it
32105139225141092119221418-12121246423173No, they have never18%24%15%30%24%19%15%33%45%28%22%12%6%25%24%24%25%-11%28%18%34%20%26%22%24%tried it
Page 92
Brassica Vegetables SurveyONLINE Fieldwork: 19th-20th November 2014
Absolutes/col percents
Table 92Q.3 Do the following Brassica vegetables form part of your children's diet?Base: All respondents with childrenTurnip
Prepared by Populus

What is the combined annual income of your household, prior toDo you have any children aged 18 orWhich of the following best describestax being deducted?under? If so, how old are they?where you live?
Nochild-Hamlet
Anyren& Iso-Urban>£55kAnyAnyAnyagedagedlatedTown- Pop.
or>£48k->£41k->£34k->£28k->£21k->£14k->£7k-Up toagedagedagedunderNET:18 orDwel-Vil-NET:andoverNET:more£55k£48k£41k£34k£28k£21k£14k£7k16-1811-155-105YesunderlinglageRuralFringe10kUrbanTotal
1110287067662877711912996284-24244127113240284Unweighted base
11937696867301284126135105300-34547137116253300Weighted base
-112033363314939706649151-122236662128151NET: Yes-100%15%54%49%53%50%46%74%46%55%49%46%50%-38%50%49%48%53%50%50%
-1111161420942030352779-1111242256779Yes, as often as in my-100%10%31%24%21%30%30%35%24%24%26%26%26%-38%25%26%31%22%27%26%diet
----263257129119--222151619Yes, more often than----3%9%5%8%39%8%9%7%1%6%--6%5%1%13%6%6%in my diet
--*91515102-1228222053--8822224453Yes, but less often--5%23%22%23%15%8%-14%22%16%19%18%--19%18%16%19%17%18%than in my diet
1-81735323316345566956149-223247154125149NET: No100%-85%46%51%47%50%54%26%54%45%51%54%50%-62%50%51%52%47%50%50%
--410241613532431422476--101039276676No, because they do--39%27%34%23%19%15%26%29%25%31%23%25%--23%22%28%24%26%25%not like it
1-4712172112-2125273373-2121433265973No, they have never100%-46%18%17%25%31%39%-25%20%20%31%24%-62%28%29%24%23%23%24%tried it
Page 93
Brassica Vegetables SurveyONLINE Fieldwork: 19th-20th November 2014
Absolutes/col percents
Table 93Q.3 Do the following Brassica vegetables form part of your children's diet?Base: All respondents with childrenTurnip
Prepared by Populus

Marital StatusWhich of the following ITV regions do you live in?NET:Mar-ried/
NET:CivilWid-part-owed/ner-separ-Civilship/ated/CoPart-coWest-
Div-Separ-Wid-div-Hab-ner-Mar-hab-York-count-WalesTyneScot-Meri-Gran-Gram-Cent-orcedatedowedorceditingshiprieditingSingleshirery& WestTeestishdianLondonadapianralAngliaTotal
1643236151512174318918121927513941118284Unweighted base
1345215461722324620915152123594144114300Weighted base
815142329211719648111714332311-7151NET: Yes67%16%100%64%42%37%53%50%43%28%50%52%73%79%61%57%55%25%-48%50%
31481415066612589719137-379Yes, as often as in my25%16%88%37%26%20%29%28%12%4%18%32%55%44%29%33%31%16%-25%26%diet
1-112-1215321-21162---19Yes, more often than6%-12%6%4%-7%6%6%10%8%-13%6%6%10%5%---6%in my diet
5--561293611323166884-353Yes, but less often36%--21%12%16%17%16%24%15%24%20%4%30%26%14%20%9%-23%18%than in my diet
44-83148011526144744925183317149NET: No33%84%-36%58%63%47%50%57%72%50%48%27%21%39%43%45%75%100%52%50%
34-71144055141045231119151576No, because they do26%84%-32%21%63%23%24%31%49%50%32%15%14%4%19%23%34%100%37%25%not like it
1--120-4060125-221814918-273No, they have never7%--4%37%-23%26%26%23%-16%12%7%35%25%22%41%-15%24%tried it
Page 94
Brassica Vegetables SurveyONLINE Fieldwork: 19th-20th November 2014
Absolutes/col percents
Table 94Q.3 Do the following Brassica vegetables form part of your children's diet?Base: All respondents with childrenTurnip
Prepared by Populus

Which of the following cities do you live in, or nearest to?None ofPly-South-Brigh-MiltonBirm-Nott-Liver-Manch-Shef-New-Edin-theseCardiffmouthBristolamptonLondonOxfordtonKeynesNorwichinghaminghampoolesterfieldHullLeedscastleburghGlasgowTotal
171581410624677251411279-1812414284Unweighted base
1713717668410463115112812-1715516300Weighted base
56362381823747169-811412151NET: Yes29%45%46%33%42%56%27%83%51%46%21%29%66%57%70%-49%73%74%74%50%
2512-22-5-243494-283679Yes, as often as in my10%37%12%9%-32%-57%-39%12%17%32%32%29%-12%55%55%36%26%diet
--12*7------114--2-119Yes, more often than--9%12%8%10%------5%5%30%--13%-8%6%in my diet
312229132*32361-611553Yes, but less often19%9%25%12%34%14%27%27%51%7%9%12%29%20%11%-37%4%19%30%18%than in my diet
127412330322324114124-9414149NET: No71%55%54%67%58%44%73%17%49%54%79%71%34%43%30%-51%27%26%26%50%
3538112--1212945--421376No, because they do18%37%48%49%23%18%--32%40%38%59%34%20%--24%15%26%17%25%not like it
92*32183211132-64-52-173No, they have never53%18%7%18%35%27%73%17%17%14%41%12%-23%30%-27%12%-9%24%tried it
Page 95
Brassica Vegetables SurveyONLINE Fieldwork: 19th-20th November 2014
Absolutes/col percents
Table 95Q.3 Do the following Brassica vegetables form part of your children's diet?Base: All respondents with childrenTurnip
Prepared by Populus

EmploymentSectorRegionSocial GradeAgeGender
York-shire
EastWest&Pri-SouthSouthEast-Mid-Mid-Humb-NorthNorthScot-vatePublicWestEastLondonernWaleslandslandsersideWestEastlandDEC2C1AB65+55-6445-5435-4425-3418-24FemaleMaleTotal
15748284136171918262938122068826965110721195725143141284Unweighted base
17341304239131515323540152275915974*10751136932159141300Weighted base
14331233531101515233034101761774857*1062915228131112243NET: Yes83%77%78%83%81%74%97%97%72%86%84%64%75%81%84%82%77%100%100%83%80%75%86%82%80%81%
841712211759129171481234482428*5285432167757135Yes, as often as in my48%43%40%49%43%35%61%77%29%47%35%51%53%46%53%41%37%100%51%37%48%46%49%49%41%45%diet
2383693425682213131013-41115108242449Yes, more often than14%19%8%13%24%26%23%15%15%18%19%13%8%18%14%16%18%-42%14%13%15%26%15%17%16%in my diet
3669952219712-313161416-12422104293060Yes, but less often21%15%30%22%13%13%13%5%28%20%31%-15%18%17%24%22%-7%32%19%14%12%18%22%20%than in my diet
30107783**9565614151117--1323175282957NET: No17%23%22%17%19%26%3%3%28%14%16%36%25%19%16%18%23%--17%20%25%14%18%20%19%
2593383**81654812814--1219102231942No, because they do14%22%10%6%19%23%3%3%25%4%16%36%17%11%13%14%18%--15%16%14%7%15%13%14%not like it
5144-*--14--26333--147251015No, they have never3%2%12%10%-2%--2%11%--8%8%3%4%5%--1%3%11%7%3%7%5%tried it
Page 96
Brassica Vegetables SurveyONLINE Fieldwork: 19th-20th November 2014
Absolutes/col percents
Table 96Q.3 Do the following Brassica vegetables form part of your children's diet?Base: All respondents with childrenCauliflower
Prepared by Populus

What is the combined annual income of your household, prior toDo you have any children aged 18 orWhich of the following best describestax being deducted?under? If so, how old are they?where you live?
Nochild-Hamlet
Anyren& Iso-Urban>£55kAnyAnyAnyagedagedlatedTown- Pop.
or>£48k->£41k->£34k->£28k->£21k->£14k->£7k-Up toagedagedagedunderNET:18 orDwel-Vil-NET:andoverNET:more£55k£48k£41k£34k£28k£21k£14k£7k16-1811-155-105YesunderlinglageRuralFringe10kUrbanTotal
1110287067662877711912996284-24244127113240284Unweighted base
11937696867301284126135105300-34547137116253300Weighted base
1153454525624106910711180243-2373811194205243NET: Yes100%100%50%93%78%76%83%82%87%82%85%82%76%81%-62%82%81%81%81%81%81%
1112634203115236485948135--24246942111135Yes, as often as in my100%100%13%71%49%30%46%51%18%43%38%44%46%45%--54%51%50%36%44%45%diet
--139149471426291549--4418274549Yes, more often than--12%7%13%20%14%12%62%17%21%21%15%16%--9%9%13%23%18%16%in my diet
--26101815611933241760-281025255060Yes, but less often--25%15%15%26%23%19%6%22%26%17%16%20%-62%19%21%18%21%20%20%than in my diet
--52151611521519242557-18926224857NET: No--50%7%22%24%17%18%13%18%15%18%24%19%-38%18%19%19%19%19%19%
--5215126211215201542-14519183742No, because they do--50%7%21%18%9%6%5%14%12%15%15%14%-38%10%11%14%15%15%14%not like it
----145313431015--44641115No, they have never----1%6%8%11%8%4%3%3%9%5%--8%8%5%4%4%5%tried it
Page 97
Brassica Vegetables SurveyONLINE Fieldwork: 19th-20th November 2014
Absolutes/col percents
Table 97Q.3 Do the following Brassica vegetables form part of your children's diet?Base: All respondents with childrenCauliflower
Prepared by Populus

Marital StatusWhich of the following ITV regions do you live in?NET:Mar-ried/
NET:CivilWid-part-owed/ner-separ-Civilship/ated/CoPart-coWest-
Div-Separ-Wid-div-Hab-ner-Mar-hab-York-count-WalesTyneScot-Meri-Gran-Gram-Cent-orcedatedowedorceditingshiprieditingSingleshirery& WestTeestishdianLondonadapianralAngliaTotal
1643236151512174318918121927513941118284Unweighted base
1345215461722324620915152123594144114300Weighted base
1235193661411834017714101719473435-11243NET: Yes92%73%100%90%67%100%82%79%88%82%77%97%64%79%84%79%84%79%-78%81%
53191858510917111981210251418-7135Yes, as often as in my43%73%13%42%34%84%49%47%37%53%15%63%51%56%44%43%34%41%-49%45%diet
2-3591293951242231387-249Yes, more often than13%-75%24%17%11%17%17%10%6%21%24%13%8%13%22%18%16%-14%16%in my diet
5-159*273618541-3681310-260Yes, but less often36%-12%24%17%6%16%15%40%23%41%10%-15%26%14%32%22%-16%20%than in my diet
11-218-3149642*55412691357NET: No8%27%-10%33%-18%21%12%18%23%3%36%21%16%21%16%21%100%22%19%
11-210-24346-2*5339691342No, because they do8%27%-10%19%-14%15%12%-23%3%36%13%12%15%16%20%100%22%14%not like it
----7-715-4---214-1--15No, they have never----14%-4%6%-18%---8%4%6%-2%--5%tried it
Page 98
Brassica Vegetables SurveyONLINE Fieldwork: 19th-20th November 2014
Absolutes/col percents
Table 98Q.3 Do the following Brassica vegetables form part of your children's diet?Base: All respondents with childrenCauliflower
Prepared by Populus

Which of the following cities do you live in, or nearest to?None ofPly-South-Brigh-MiltonBirm-Nott-Liver-Manch-Shef-New-Edin-theseCardiffmouthBristolamptonLondonOxfordtonKeynesNorwichinghaminghampoolesterfieldHullLeedscastleburghGlasgowTotal
171581410624677251411279-1812414284Unweighted base
1713717668410463115112812-1715516300Weighted base
141261235439352315102311-1410511243NET: Yes86%97%93%70%59%79%93%92%82%84%74%97%94%82%86%-80%64%100%71%81%
6839*29261310123116-6848135Yes, as often as in my34%61%42%54%6%42%66%58%17%60%32%77%32%40%50%-36%51%81%50%45%diet
3411116--1-42144-321149Yes, more often than17%27%17%8%24%23%--24%-13%15%13%15%30%-16%13%19%5%16%in my diet
612129132191581-5--360Yes, but less often35%9%34%8%28%14%27%33%41%23%29%5%49%27%7%-28%--17%20%than in my diet
2**5214*1118*152-35-557NET: No14%3%7%30%41%21%7%8%18%16%26%3%6%18%14%-20%36%-29%19%
2*-229*1118*15--15-342No, because they do10%3%-12%41%14%7%8%18%16%26%3%6%18%--7%36%-18%14%not like it
1-*3-5--------2-2--215No, they have never4%-7%18%-7%--------14%-12%--11%5%tried it
Page 99
Brassica Vegetables SurveyONLINE Fieldwork: 19th-20th November 2014
Absolutes/col percents
Table 99Q.3 Do the following Brassica vegetables form part of your children's diet?Base: All respondents with childrenCauliflower
Prepared by Populus

EmploymentSectorRegionSocial GradeAgeGender
York-shire
EastWest&Pri-SouthSouthEast-Mid-Mid-Humb-NorthNorthScot-vatePublicWestEastLondonernWaleslandslandsersideWestEastlandDEC2C1AB65+55-6445-5435-4425-3418-24FemaleMaleTotal
15748284136171918262938122068826965110721195725143141284Unweighted base
17341304239131515323540152275915974*10751136932159141300Weighted base
12835213132101312202632101557714152*852865025121101222NET: Yes74%85%70%72%82%75%84%77%64%74%79%69%67%75%78%70%71%100%85%69%76%72%78%76%71%74%
671912171758115141481140381923*7244925177645121Yes, as often as in my39%47%39%39%44%40%49%73%17%39%35%51%49%54%42%33%31%100%73%32%43%36%51%48%32%40%diet
17613714-1563178107-181355151832Yes, more often than10%14%5%7%18%8%26%-4%14%14%17%5%9%9%16%10%-6%11%11%8%16%9%13%11%in my diet
4410811831114712-39251222-11925204313768Yes, but less often25%24%26%27%20%27%9%4%43%20%30%-12%13%27%20%30%-6%26%22%29%11%19%27%23%than in my diet
456912732311985719201822-12327197384078NET: No26%15%30%28%18%25%16%23%36%26%21%31%33%25%22%30%29%-15%31%24%28%22%24%29%26%
3646763219482610131516-11720125292655No, because they do21%9%18%17%16%25%16%7%28%12%19%15%25%14%14%25%22%-8%22%18%18%14%18%18%18%not like it
92451--2251228735-1777291424No, they have never5%6%12%11%2%--16%8%14%1%16%9%11%8%5%7%-7%9%6%10%8%6%10%8%tried it
Page 100
Brassica Vegetables SurveyONLINE Fieldwork: 19th-20th November 2014
Absolutes/col percents
Table 100Q.3 Do the following Brassica vegetables form part of your children's diet?Base: All respondents with childrenCabbage
Prepared by Populus

What is the combined annual income of your household, prior toDo you have any children aged 18 orWhich of the following best describestax being deducted?under? If so, how old are they?where you live?
Nochild-Hamlet
Anyren& Iso-Urban>£55kAnyAnyAnyagedagedlatedTown- Pop.
or>£48k->£41k->£34k->£28k->£21k->£14k->£7k-Up toagedagedagedunderNET:18 orDwel-Vil-NET:andoverNET:more£55k£48k£41k£34k£28k£21k£14k£7k16-1811-155-105YesunderlinglageRuralFringe10kUrbanTotal
1110287067662877711912996284-24244127113240284Unweighted base
11937696867301284126135105300-34547137116253300Weighted base
-16315543522010609910073222-1343510285187222NET: Yes-100%64%85%79%63%78%68%87%72%79%74%69%74%-38%77%74%74%73%74%74%
-122226202814628445742121-12324593897121Yes, as often as in my-100%19%59%37%29%42%48%48%34%35%43%40%40%-38%52%52%43%33%38%40%diet
---348845112212532--2212183132Yes, more often than---7%6%12%12%13%39%14%17%9%5%11%--4%4%9%16%12%11%in my diet
--472515152-2033312668--9930295968Yes, but less often--45%18%36%22%23%7%-24%26%23%25%23%--20%19%22%25%23%23%than in my diet
1-36142515922427353278-2101235316678NET: No100%-36%15%21%37%22%32%13%28%21%26%31%26%-62%23%26%26%27%26%26%
--34121711411822271955-27825214755No, because they do--36%12%17%25%17%13%8%21%17%20%18%18%-62%15%17%18%18%18%18%not like it
1--1384616581324--4410102024No, they have never100%--4%4%12%6%19%5%7%4%6%12%8%--9%8%7%8%8%8%tried it
Page 101
Brassica Vegetables SurveyONLINE Fieldwork: 19th-20th November 2014
Absolutes/col percents
Table 101Q.3 Do the following Brassica vegetables form part of your children's diet?Base: All respondents with childrenCabbage
Prepared by Populus

Marital StatusWhich of the following ITV regions do you live in?NET:Mar-ried/
NET:CivilWid-part-owed/ner-separ-Civilship/ated/CoPart-coWest-
Div-Separ-Wid-div-Hab-ner-Mar-hab-York-count-WalesTyneScot-Meri-Gran-Gram-Cent-orcedatedowedorceditingshiprieditingSingleshirery& WestTeestishdianLondonadapianralAngliaTotal
1643236151512174318918121927513941118284Unweighted base
1345215461722324620915152123594144114300Weighted base
1035183361311703414712101517463330-11222NET: Yes78%73%100%82%61%94%76%73%75%69%80%84%69%70%72%78%80%68%-76%74%
514102056893189388118251415-6121Yes, as often as in my36%34%88%47%36%84%40%40%40%45%29%51%51%51%36%42%35%34%-42%40%diet
2-125121273-23312861-132Yes, more often than13%-12%10%9%11%12%11%7%-21%24%17%6%9%13%15%3%-7%11%in my diet
42-59-415013531-36131214-468Yes, but less often29%39%-25%16%-24%21%28%23%30%9%-12%26%22%30%31%-28%23%than in my diet
31-421*416311622577138141378NET: No22%27%-18%39%6%24%27%25%31%20%16%31%30%28%22%20%32%100%24%26%
31-413*274110322252128101355No, because they do22%27%-18%25%6%16%18%22%14%20%16%15%21%10%21%19%23%100%24%18%not like it
----8-142224--224114--24No, they have never----14%-8%9%3%18%--16%9%18%2%1%9%--8%tried it
Page 102
Brassica Vegetables SurveyONLINE Fieldwork: 19th-20th November 2014
Absolutes/col percents
Table 102Q.3 Do the following Brassica vegetables form part of your children's diet?Base: All respondents with childrenCabbage
Prepared by Populus

Which of the following cities do you live in, or nearest to?None ofPly-South-Brigh-MiltonBirm-Nott-Liver-Manch-Shef-New-Edin-theseCardiffmouthBristolamptonLondonOxfordtonKeynesNorwichinghaminghampoolesterfieldHullLeedscastleburghGlasgowTotal
171581410624677251411279-1812414284Unweighted base
1713717668410463115112812-1715516300Weighted base
911512354183520149229-1310310222NET: Yes55%81%68%69%61%80%27%83%72%86%65%93%81%80%70%-76%69%70%66%74%
372812815146132124-6837121Yes, as often as in my20%51%34%49%12%41%27%57%31%62%19%89%18%44%29%-34%51%70%41%40%diet
33-129----*-314-13-132Yes, more often than17%27%-8%30%14%----2%-27%5%30%-9%17%-8%11%in my diet
3*22117-321141491-6--368Yes, but less often18%3%34%12%19%25%-27%41%23%45%4%36%32%11%-33%--17%23%than in my diet
82252143211111264-451578NET: No45%19%32%31%39%20%73%17%28%14%35%7%19%20%30%-24%31%30%34%26%
4222212111191251-221455No, because they do26%19%25%12%30%17%22%10%28%14%29%7%19%18%7%-11%15%19%25%18%not like it
3-*31221--2--13-22*124No, they have never19%-7%18%9%3%51%7%--5%--2%23%-12%16%10%9%8%tried it
Page 103
Brassica Vegetables SurveyONLINE Fieldwork: 19th-20th November 2014
Absolutes/col percents
Table 103Q.3 Do the following Brassica vegetables form part of your children's diet?Base: All respondents with childrenCabbage
Prepared by Populus

EmploymentSectorRegionSocial GradeAgeGender
York-shire
EastWest&Pri-SouthSouthEast-Mid-Mid-Humb-NorthNorthScot-vatePublicWestEastLondonernWaleslandslandsersideWestEastlandDEC2C1AB65+55-6445-5435-4425-3418-24FemaleMaleTotal
15748284136171918262938122068826965110721195725143141284Unweighted base
17341304239131515323540152275915974*10751136932159141300Weighted base
65129202255629115623292423*6254116106338100NET: Yes38%30%31%48%56%36%35%39%5%25%27%36%26%31%32%41%31%100%67%34%37%24%32%39%27%33%
29611112324-2424171497-6111982321447Yes, as often as in my17%16%4%27%31%26%14%29%-6%11%11%16%22%16%15%9%-67%15%17%11%7%20%10%16%diet
114215-2--2141*585--85-581018Yes, more often than6%11%6%2%13%-16%--6%3%24%3%*5%13%7%--11%5%-15%5%7%6%in my diet
252685111245-1710811*-61793221336Yes, but less often15%4%21%19%12%10%6%10%5%12%13%-7%9%11%13%15%100%-9%15%12%10%14%10%12%than in my diet
108282122178109302729101652623551-34972532296103200NET: No62%70%69%52%44%64%65%61%95%75%73%64%74%69%68%59%69%-33%66%63%76%68%61%73%67%
306564252774171117139-110181011252549No, because they do17%14%17%15%10%13%34%11%20%20%11%3%30%14%18%22%12%-6%13%16%15%34%16%17%16%not like it
782215161375824192591041452242-3405443117279150No, they have never45%55%51%37%34%51%31%50%74%55%62%61%44%55%50%37%56%-27%53%47%62%35%45%56%50%tried it
Page 104
Brassica Vegetables SurveyONLINE Fieldwork: 19th-20th November 2014
Absolutes/col percents
Table 104Q.3 Do the following Brassica vegetables form part of your children's diet?Base: All respondents with childrenKale
Prepared by Populus

What is the combined annual income of your household, prior toDo you have any children aged 18 orWhich of the following best describestax being deducted?under? If so, how old are they?where you live?
Nochild-Hamlet
Anyren& Iso-Urban>£55kAnyAnyAnyagedagedlatedTown- Pop.
or>£48k->£41k->£34k->£28k->£21k->£14k->£7k-Up toagedagedagedunderNET:18 orDwel-Vil-NET:andoverNET:more£55k£48k£41k£34k£28k£21k£14k£7k16-1811-155-105YesunderlinglageRuralFringe10kUrbanTotal
1110287067662877711912996284-24244127113240284Unweighted base
11937696867301284126135105300-34547137116253300Weighted base
-13162322179830444030100--1515384785100NET: Yes-100%35%44%33%33%25%31%69%36%35%30%28%33%--34%32%28%41%34%33%
-1-616610431614201347--9918193747Yes, as often as in my-100%-17%23%8%15%14%29%19%11%15%12%16%--21%20%13%16%15%16%diet
---1182248137118--224121618Yes, more often than---3%1%11%3%8%33%9%11%5%1%6%--4%4%3%11%6%6%in my diet
--3969531716131636--4416163236Yes, but less often--35%24%9%13%8%9%6%8%13%10%15%12%--9%8%12%14%13%12%than in my diet
1-62146465021453829576200-330329969167200NET: No100%-65%56%67%67%75%69%31%64%65%70%72%67%-100%66%68%72%59%66%67%
--151212143-1415191949-1141518163449No, because they do--16%14%17%18%20%11%-17%12%14%18%16%-38%32%32%13%14%14%16%not like it
1-41534343617439677656150-215178152133150No, they have never100%-49%41%49%50%54%58%31%47%53%56%54%50%-62%34%36%59%45%53%50%tried it
Page 105
Brassica Vegetables SurveyONLINE Fieldwork: 19th-20th November 2014
Absolutes/col percents
Table 105Q.3 Do the following Brassica vegetables form part of your children's diet?Base: All respondents with childrenKale
Prepared by Populus

Marital StatusWhich of the following ITV regions do you live in?NET:Mar-ried/
NET:CivilWid-part-owed/ner-separ-Civilship/ated/CoPart-coWest-
Div-Separ-Wid-div-Hab-ner-Mar-hab-York-count-WalesTyneScot-Meri-Gran-Gram-Cent-orcedatedowedorceditingshiprieditingSingleshirery& WestTeestishdianLondonadapianralAngliaTotal
1643236151512174318918121927513941118284Unweighted base
1345215461722324620915152123594144114300Weighted base
62311112637514825561328117-6100NET: Yes44%55%75%53%20%26%37%32%30%39%18%37%36%28%56%47%26%16%-45%33%
213671273551-22471644-347Yes, as often as in my15%16%75%28%13%20%16%15%12%6%-14%11%17%32%27%11%10%-24%16%diet
1--1**1415211241151---18Yes, more often than6%--3%1%6%8%7%4%5%8%16%24%4%3%9%3%---6%in my diet
32-53-21256611-15753-336Yes, but less often23%39%-21%6%-12%11%14%27%10%7%-7%20%11%13%6%-21%12%than in my diet
7211043510915732127910151031303718200NET: No56%45%25%47%80%74%63%68%70%61%82%63%64%72%44%53%74%84%100%55%67%
----114254093151711048-249No, because they do----21%63%14%17%21%15%12%35%3%31%4%16%11%19%-17%16%not like it
72110321841172296499921252915150No, they have never56%45%25%47%59%11%49%50%49%46%69%28%61%41%39%36%63%66%100%38%50%tried it
Page 106
Brassica Vegetables SurveyONLINE Fieldwork: 19th-20th November 2014
Absolutes/col percents
Table 106Q.3 Do the following Brassica vegetables form part of your children's diet?Base: All respondents with childrenKale
Prepared by Populus

Which of the following cities do you live in, or nearest to?None ofPly-South-Brigh-MiltonBirm-Nott-Liver-Manch-Shef-New-Edin-theseCardiffmouthBristolamptonLondonOxfordtonKeynesNorwichinghaminghampoolesterfieldHullLeedscastleburghGlasgowTotal
171581410624677251411279-1812414284Unweighted base
1713717668410463115112812-1715516300Weighted base
1519133-81425564-4514100NET: Yes4%38%9%51%25%48%-83%18%72%8%31%47%22%36%-25%36%30%28%33%
12-1118-5-313131-12*347Yes, as often as in my4%16%-8%12%27%-57%-48%2%21%12%11%6%-9%11%10%20%16%diet
-21115-------12-*4-118Yes, more often than-18%9%6%14%7%-------5%14%-3%24%-5%6%in my diet
-*-6-10-31121422-2-1136Yes, but less often-3%-38%-14%-27%18%23%6%10%36%7%15%-14%-19%3%12%than in my diet
16868435423229106228-1310311200NET: No96%62%91%49%75%52%100%17%82%28%92%69%53%78%64%-75%64%70%72%67%
252219-11*7714--113349No, because they do13%37%30%13%18%13%-10%32%7%21%50%6%14%--8%3%55%19%16%not like it
1434632641212235188-11918150No, they have never83%26%61%36%56%39%100%7%50%21%71%20%47%64%64%-67%61%16%53%50%tried it
Page 107
Brassica Vegetables SurveyONLINE Fieldwork: 19th-20th November 2014
Absolutes/col percents
Table 107Q.3 Do the following Brassica vegetables form part of your children's diet?Base: All respondents with childrenKale
Prepared by Populus

EmploymentSectorRegionSocial GradeAgeGender
York-shire
EastWest&Pri-SouthSouthEast-Mid-Mid-Humb-NorthNorthScot-vatePublicWestEastLondonernWaleslandslandsersideWestEastlandDEC2C1AB65+55-6445-5435-4425-3418-24FemaleMaleTotal
15748284136171918262938122068826965110721195725143141284Unweighted base
17341304239131515323540152275915974*10751136932159141300Weighted base
952415262581010161326101445512848*7466236219082172NET: Yes55%58%48%60%64%61%65%67%51%35%66%69%62%60%55%48%65%100%72%62%55%52%66%57%58%57%
38124106346351081019161124*314231810412970Yes, as often as in my22%29%13%24%16%26%26%40%10%14%25%52%46%25%17%19%32%100%36%19%20%26%32%26%21%23%diet
193259*21-382298711--91466181735Yes, more often than11%9%7%12%24%3%10%10%-10%19%13%10%12%9%11%15%--11%12%9%19%12%12%12%in my diet
398810944313491117261113-32324115313667Yes, but less often22%20%28%24%24%32%29%17%40%12%21%4%7%22%29%18%18%-36%31%22%16%15%19%26%22%than in my diet
78171617145551623145830413126-3295233116959127NET: No45%42%52%40%36%39%35%33%49%65%34%31%38%40%45%52%35%-28%38%45%48%34%43%42%43%
6413713115531519132823332619-227392495347100No, because they do37%33%22%32%28%36%32%22%47%54%31%12%36%31%36%43%25%-21%35%34%35%27%33%34%33%not like it
144933*121413*7857-121392161127No, they have never8%9%29%8%8%2%4%11%2%11%3%19%2%9%9%9%10%-7%3%11%14%7%10%8%9%tried it
Page 108
Brassica Vegetables SurveyONLINE Fieldwork: 19th-20th November 2014
Absolutes/col percents
Table 108Q.3 Do the following Brassica vegetables form part of your children's diet?Base: All respondents with childrenBrussel Sprouts
Prepared by Populus

What is the combined annual income of your household, prior toDo you have any children aged 18 orWhich of the following best describestax being deducted?under? If so, how old are they?where you live?
Nochild-Hamlet
Anyren& Iso-Urban>£55kAnyAnyAnyagedagedlatedTown- Pop.
or>£48k->£41k->£34k->£28k->£21k->£14k->£7k-Up toagedagedagedunderNET:18 orDwel-Vil-NET:andoverNET:more£55k£48k£41k£34k£28k£21k£14k£7k16-1811-155-105YesunderlinglageRuralFringe10kUrbanTotal
1110287067662877711912996284-24244127113240284Unweighted base
11937696867301284126135105300-34547137116253300Weighted base
11417394238171049807558172-124257770147172NET: Yes100%100%41%45%56%61%57%57%87%59%64%56%56%57%-38%54%53%56%61%58%57%
11-818131611-1429272970-1151633215470Yes, as often as in my100%100%-21%26%19%23%37%-16%23%20%28%23%-38%33%33%24%18%21%23%diet
--12511726132219935--2217173335Yes, more often than--10%5%7%16%10%7%51%16%17%14%8%12%--4%4%12%15%13%12%in my diet
--37161815442230292067--8827326067Yes, but less often--31%20%23%27%23%12%36%27%24%21%19%22%--17%16%20%28%24%22%than in my diet
--52030262913235456047127-220226045105127NET: No--59%55%44%39%43%43%13%41%36%44%44%43%-62%46%47%44%39%42%43%
--41327192410229405033100-21920463480100No, because they do--44%36%38%28%36%32%13%35%32%37%31%33%-62%42%43%33%30%32%33%not like it
--173753-65101427--2214112527No, they have never--15%18%5%11%7%11%-7%4%7%13%9%--4%4%11%9%10%9%tried it
Page 109
Brassica Vegetables SurveyONLINE Fieldwork: 19th-20th November 2014
Absolutes/col percents
Table 109Q.3 Do the following Brassica vegetables form part of your children's diet?Base: All respondents with childrenBrussel Sprouts
Prepared by Populus

Marital StatusWhich of the following ITV regions do you live in?NET:Mar-ried/
NET:CivilWid-part-owed/ner-separ-Civilship/ated/CoPart-coWest-
Div-Separ-Wid-div-Hab-ner-Mar-hab-York-count-WalesTyneScot-Meri-Gran-Gram-Cent-orcedatedowedorceditingshiprieditingSingleshirery& WestTeestishdianLondonadapianralAngliaTotal
1643236151512174318918121927513941118284Unweighted base
1345215461722324620915152123594144114300Weighted base
7251423210613127105910131237272519172NET: Yes58%39%100%63%42%37%62%57%59%48%54%63%69%60%53%63%66%57%100%67%57%
2-13131455984-4810413109-370Yes, as often as in my15%-13%12%23%20%26%25%18%20%-27%52%48%17%21%24%21%-24%23%diet
1--15-212681122231181-135Yes, more often than7%--4%9%-12%11%18%6%16%10%13%10%11%19%19%3%-7%12%in my diet
4241051404611534116139141567Yes, but less often35%39%87%47%10%16%23%20%23%23%38%26%4%3%25%23%23%32%100%35%22%than in my diet
53-8314661011910455811221419-5127NET: No42%61%-37%58%63%38%43%41%52%46%37%31%40%47%37%34%43%-33%43%
53-8214507616235289161318-5100No, because they do42%61%-37%40%63%29%33%36%11%39%33%12%37%40%27%31%40%-33%33%not like it
----10-152528113*1611--27No, they have never----19%-9%11%5%41%7%4%19%2%6%9%3%3%--9%tried it
Page 110
Brassica Vegetables SurveyONLINE Fieldwork: 19th-20th November 2014
Absolutes/col percents
Table 110Q.3 Do the following Brassica vegetables form part of your children's diet?Base: All respondents with childrenBrussel Sprouts
Prepared by Populus

Which of the following cities do you live in, or nearest to?None ofPly-South-Brigh-MiltonBirm-Nott-Liver-Manch-Shef-New-Edin-theseCardiffmouthBristolamptonLondonOxfordtonKeynesNorwichinghaminghampoolesterfieldHullLeedscastleburghGlasgowTotal
171581410624677251411279-1812414284Unweighted base
1713717668410463115112812-1715516300Weighted base
10874246-5331768187-71049172NET: Yes58%61%100%23%36%69%-47%72%46%54%39%73%63%56%-41%69%74%58%57%
3331*15-11245192-383770Yes, as often as in my15%24%42%3%6%23%-14%31%39%12%31%6%33%15%-18%52%55%41%23%diet
4211212-1-*--332-221135Yes, more often than22%12%17%5%30%17%-7%-7%--29%10%14%-10%13%19%8%12%in my diet
4333-19-32-131463-21-167Yes, but less often21%26%41%15%-28%-27%41%-42%8%37%20%27%-14%4%-9%22%than in my diet
75-1342145131493105-10517127NET: No42%39%-77%64%31%100%53%28%54%46%61%27%37%44%-59%31%26%42%43%
54-43154513148394-8217100No, because they do31%34%-25%55%22%100%53%28%54%46%56%27%32%30%-46%12%16%42%33%not like it
21-916-----1-12-23*-27No, they have never10%4%-52%9%10%-----5%-5%14%-12%19%10%-9%tried it
Page 111
Brassica Vegetables SurveyONLINE Fieldwork: 19th-20th November 2014
Absolutes/col percents
Table 111Q.3 Do the following Brassica vegetables form part of your children's diet?Base: All respondents with childrenBrussel Sprouts
Prepared by Populus

StatementsThere is enough
informationavailable for
Children shouldIn general,I would usepeople to learnbe taught morepeople inBrassicamore about
in schoolsBritain todayvegetables moreBrassicaabout Brassicaeat enoughoften if I knewvegetables andvegetables andBrassicamore about howhow best to use
how to use themvegetablesto cook themthem in meals
1011101110111011Unweighted base
1011101110111011Weighted base
766169254391NET: Agree76%17%25%39%
3803262130Strongly agree (+2)38%3%6%13%
386137193261Agree a little (+1)38%14%19%26%
170247371305Neither agree nor (0)17%24%37%30%disagree
23297157173Disagree a little (-1)2%29%15%17%
717117562Strongly disagree (-2)1%17%17%6%
30468332235NET: Disagree3%46%33%23%
451285480Don't know4%13%5%8%
1.15-0.50-0.200.24Mean
0.841.081.151.11Standard deviation0.030.040.040.04Standard error
Page 112
Brassica Vegetables SurveyONLINE Fieldwork: 19th-20th November 2014
Absolutes/col percents
Table 112Q.5 To what extent do you agree or disagree with each of the following statements about Brassica vegetables?Base: All respondentsSummary
Prepared by Populus

EmploymentSectorRegionSocial GradeAgeGender
York-shire
EastWest&Pri-SouthSouthEast-Mid-Mid-Humb-NorthNorthScot-vatePublicWestEastLondonernWaleslandslandsersideWestEastlandDEC2C1AB65+55-6445-5435-4425-3418-24FemaleMaleTotal
42011896155116121577578881093284262210315224227176198188130924805311011Unweighted base
439127911421311015171919111140912402202802702201501801701701205164951011Weighted base
172444044434220253439482036969498103996468616237199192391NET: Agree39%35%44%31%32%41%39%36%38%43%43%50%40%40%43%35%38%45%43%38%36%36%31%39%39%39%
6714111791359217151211273038363816251525106863130Strongly agree (+2)15%11%12%12%7%13%10%12%23%8%13%30%12%11%13%13%13%17%10%14%9%15%8%13%13%13%
1053029273328151713323382569656166614842463727131129261Agree a little (+1)24%24%32%19%25%28%29%24%15%35%29%20%28%29%29%22%25%28%32%23%27%22%22%25%26%26%
1214924524137122731252562573599381554358555144156149305Neither agree nor (0)27%39%26%37%31%37%24%38%34%27%23%14%28%30%27%33%30%25%28%32%32%30%37%30%30%30%disagree
822113252918812101321716333051583828313131139479173Disagree a little (-1)19%17%15%18%22%18%16%17%11%14%19%16%18%14%14%18%22%17%19%17%18%18%11%18%16%17%
2575106125106537151813151210147911323062Strongly disagree (-2)6%5%6%7%5%1%3%7%11%7%5%8%8%6%8%5%6%5%6%8%4%5%9%6%6%6%
10828183535191017201927102349486473503845384024125109235NET: Disagree24%22%20%25%27%19%20%24%22%20%24%24%26%20%22%23%27%23%25%25%22%23%20%24%22%23%
395910123925912562319241416610161715354580Don't know9%4%10%7%9%3%17%2%6%9%10%11%7%10%9%9%5%7%4%6%9%10%13%7%9%8%
0.260.190.340.110.090.350.320.170.290.260.310.550.190.270.290.230.200.370.220.200.210.250.120.230.260.24Mean
1.151.041.101.101.020.981.061.091.291.061.131.371.151.091.161.091.121.161.091.151.021.131.091.121.111.11Standard deviation0.060.100.120.090.100.090.150.130.150.120.110.250.130.070.080.060.080.080.080.080.080.100.120.050.050.04Standard error
Page 113
Brassica Vegetables SurveyONLINE Fieldwork: 19th-20th November 2014
Absolutes/col percents
Table 113Q.5 To what extent do you agree or disagree with each of the following statements about Brassica vegetables?Base: All respondentsThere is enough information available for people to learn more about Brassica vegetables and how best to use them in meals
Prepared by Populus

What is the combined annual income of your household, prior toDo you have any children aged 18 orWhich of the following best describestax being deducted?under? If so, how old are they?where you live?
Nochild-Hamlet
Anyren& Iso-Urban>£55kAnyAnyAnyagedagedlatedTown- Pop.
or>£48k->£41k->£34k->£28k->£21k->£14k->£7k-Up toagedagedagedunderNET:18 orDwel-Vil-NET:andoverNET:more£55k£48k£41k£34k£28k£21k£14k£7k16-1811-155-105YesunderlinglageRuralFringe10kUrbanTotal
10103267190213218170557711912996284723161831994084048121011Unweighted base
181436812002092051435384126135105300709151882033984098081011Weighted base
166113174789451183967523012326867681151159310391NET: Agree90%40%29%39%37%37%46%36%33%46%54%38%28%41%38%40%40%40%38%39%38%39%
8-482334271938231193793320235453107130Strongly agree (+2)43%-12%10%11%16%13%13%6%10%18%8%9%12%13%22%11%11%14%13%13%13%
96623514566321530444121861753555896106203261Agree a little (+1)47%40%17%28%26%21%32%22%27%36%35%30%20%29%25%18%29%29%24%26%25%26%
-515255666544421202640398821735860120125245305Neither agree nor (0)-35%43%30%28%32%26%31%40%23%21%30%37%29%31%18%31%30%30%31%30%30%disagree
144143046362181819271347126233356375137173Disagree a little (-1)7%25%11%17%15%22%18%14%14%22%15%20%12%16%18%17%17%17%16%18%17%17%
--53179911348771843491327224962Strongly disagree (-2)--13%3%9%4%5%8%6%4%7%5%7%6%6%25%5%6%7%5%6%6%
1491747554632112227342166168642489097187235NET: Disagree7%25%24%20%24%26%22%22%21%26%21%25%20%22%24%42%22%24%22%24%23%23%
1-192210111734510162456-141439286780Don't know4%-4%11%11%5%6%12%6%4%4%7%16%8%8%-7%7%10%7%8%8%
1.300.150.050.280.180.240.340.220.130.270.460.170.120.270.23-0.040.260.230.250.240.240.24Mean
0.820.821.181.031.151.121.091.150.981.071.171.041.061.101.111.541.051.101.131.101.121.11Standard deviation0.270.260.210.130.090.080.080.090.140.120.110.090.110.070.040.390.080.080.060.060.040.04Standard error
Page 114
Brassica Vegetables SurveyONLINE Fieldwork: 19th-20th November 2014
Absolutes/col percents
Table 114Q.5 To what extent do you agree or disagree with each of the following statements about Brassica vegetables?Base: All respondentsThere is enough information available for people to learn more about Brassica vegetables and how best to use them in meals
Prepared by Populus

Marital StatusWhich of the following ITV regions do you live in?NET:Mar-ried/
NET:CivilWid-part-owed/ner-separ-Civilship/ated/CoPart-coWest-
Div-Separ-Wid-div-Hab-ner-Mar-hab-York-count-WalesTyneScot-Meri-Gran-Gram-Cent-orcedatedowedorceditingshiprieditingSingleshirery& WestTeestishdianLondonadapianralAngliaTotal
98124015014414446604250572754337798186110134101241011Unweighted base
84114213714215452608262543149428382199114137101071011Weighted base
354206051618524289241420203228594649548391NET: Agree42%38%49%44%36%38%41%40%34%44%44%41%49%39%34%30%40%36%54%45%39%
8241518262823362512109181427217130Strongly agree (+2)10%21%10%11%13%12%14%14%13%12%6%11%29%12%11%9%12%20%16%16%13%
27216453341221605617121582319413222430261Agree a little (+1)32%17%39%33%23%26%27%26%21%32%38%30%19%27%23%20%28%16%38%29%26%
16215334531401878315111172233653141239305Neither agree nor (0)19%19%35%24%32%17%31%31%32%28%35%22%16%26%40%33%27%30%24%37%30%disagree
181624241751004873871511492122115173Disagree a little (-1)21%7%14%18%17%9%17%17%18%13%10%17%17%18%14%25%19%16%10%14%17%
731118-25331831137411618-262Strongly disagree (-2)8%27%3%8%5%-6%5%7%5%3%3%7%9%5%5%5%13%-2%6%
2447353211001336610410102215602739117235NET: Disagree29%34%17%26%22%9%22%22%25%18%13%20%24%27%19%30%24%29%10%16%23%
81-9145274623629566161081380Don't know10%9%-7%10%36%6%8%9%11%8%18%11%7%7%8%9%6%12%3%8%
0.16-0.020.390.220.240.640.290.280.160.370.370.350.520.160.230.040.260.150.680.440.24Mean
1.171.620.951.141.100.991.101.101.131.060.911.061.361.181.021.061.111.310.951.001.11Standard deviation0.120.490.150.100.100.290.050.050.070.150.190.150.240.140.110.080.110.120.320.090.04Standard error
Page 115
Brassica Vegetables SurveyONLINE Fieldwork: 19th-20th November 2014
Absolutes/col percents
Table 115Q.5 To what extent do you agree or disagree with each of the following statements about Brassica vegetables?Base: All respondentsThere is enough information available for people to learn more about Brassica vegetables and how best to use them in meals
Prepared by Populus

Which of the following cities do you live in, or nearest to?None ofPly-South-Brigh-MiltonBirm-Nott-Liver-Manch-Shef-New-Edin-theseCardiffmouthBristolamptonLondonOxfordtonKeynesNorwichinghaminghampoolesterfieldHullLeedscastleburghGlasgowTotal
794336314122114213562764937732813453334401011Unweighted base
703829353223014212755894736743411454238451011Weighted base
2612131512714813243215193317518221221391NET: Agree37%32%43%41%36%31%30%36%47%45%36%33%53%45%50%44%40%52%33%48%39%
5442821114102135104151318130Strongly agree (+2)7%12%15%7%26%9%5%3%13%18%23%6%13%14%11%6%10%31%3%19%13%
21881235047915111214231341391113261Agree a little (+1)30%20%29%35%10%22%25%33%33%27%13%26%39%31%39%38%30%22%29%29%26%
25971013794991930137161521251113305Neither agree nor (0)35%24%23%27%40%34%28%41%33%35%34%27%18%21%44%21%27%12%29%28%30%disagree
986345412391196141112696173Disagree a little (-1)13%20%22%8%14%23%9%11%12%16%13%19%16%18%2%6%26%14%23%12%17%
413-211211110523-2233462Strongly disagree (-2)6%3%9%-8%5%17%6%3%2%11%11%7%4%-18%4%7%9%9%6%
13993765444102214817131491210235NET: Disagree19%24%31%8%22%28%26%17%15%18%24%29%23%23%2%24%30%21%32%22%23%
78181162121552811163180Don't know9%20%3%23%2%7%16%5%6%2%6%11%6%11%4%10%3%14%7%2%8%
0.220.210.190.520.340.07-0.100.170.450.440.25-0.010.380.350.610.090.170.63-0.050.360.24Mean
1.001.131.220.811.251.041.250.931.001.031.301.141.161.130.731.321.081.361.051.211.11Standard deviation0.120.180.210.160.200.070.360.210.180.130.160.170.200.140.140.400.170.250.180.190.04Standard error
Page 116
Brassica Vegetables SurveyONLINE Fieldwork: 19th-20th November 2014
Absolutes/col percents
Table 116Q.5 To what extent do you agree or disagree with each of the following statements about Brassica vegetables?Base: All respondentsThere is enough information available for people to learn more about Brassica vegetables and how best to use them in meals
Prepared by Populus

EmploymentSectorRegionSocial GradeAgeGender
York-shire
EastWest&Pri-SouthSouthEast-Mid-Mid-Humb-NorthNorthScot-vatePublicWestEastLondonernWaleslandslandsersideWestEastlandDEC2C1AB65+55-6445-5435-4425-3418-24FemaleMaleTotal
42011896155116121577578881093284262210315224227176198188130924805311011Unweighted base
439127911421311015171919111140912402202802702201501801701701205164951011Weighted base
1404027373814151219293392254577074201840596651140115254NET: Agree32%32%30%26%29%14%30%17%21%32%30%21%25%22%26%25%27%9%12%22%35%39%42%27%23%25%
41841113*129210461912102121818258352762Strongly agree (+2)9%6%5%8%10%*1%2%9%3%9%9%6%8%5%4%8%1%1%4%10%15%6%7%5%6%
98322225251315101027235173545605318173342414310588193Agree a little (+1)22%25%25%18%19%13%29%15%11%30%20%12%18%14%20%22%20%8%11%18%24%24%36%20%18%19%
154482352434422273734401632938689102846071585939167204371Neither agree nor (0)35%38%26%37%33%44%44%38%41%37%36%39%36%39%39%32%38%38%40%39%34%35%32%32%41%37%disagree
67238171625516171019220314147383928292321168175157Disagree a little (-1)15%18%9%12%12%25%11%23%19%11%17%6%22%13%19%17%14%18%19%16%13%12%13%16%15%15%
581427282615510161512119383259466441322110610372175Strongly disagree (-2)13%11%30%20%20%15%10%15%18%16%11%27%10%16%15%21%17%29%27%18%12%6%5%20%15%17%
1253836454240112633253113296873106841036962443122185147332NET: Disagree28%30%39%32%32%40%21%37%37%27%28%33%32%28%33%38%31%47%46%34%26%19%19%36%30%33%
21158832513838264141013289139243054Don't know5%1%5%5%6%3%5%8%2%3%7%7%8%11%2%5%4%6%1%4%6%8%7%5%6%5%
-0.01-0.03-0.37-0.20-0.14-0.42*-0.35-0.25-0.09*-0.32-0.11-0.16-0.17-0.32-0.13-0.70-0.61-0.270.080.320.27-0.23-0.17-0.20Mean
1.161.081.311.211.260.930.961.011.171.091.131.301.071.161.091.161.171.031.041.101.171.100.991.211.081.15Standard deviation0.060.100.140.100.120.090.130.120.140.120.110.230.120.070.080.070.080.070.080.080.090.100.110.060.050.04Standard error
Page 117
Brassica Vegetables SurveyONLINE Fieldwork: 19th-20th November 2014
Absolutes/col percents
Table 117Q.5 To what extent do you agree or disagree with each of the following statements about Brassica vegetables?Base: All respondentsI would use Brassica vegetables more often if I knew more about how to cook them
Prepared by Populus

What is the combined annual income of your household, prior toDo you have any children aged 18 orWhich of the following best describestax being deducted?under? If so, how old are they?where you live?
Nochild-Hamlet
Anyren& Iso-Urban>£55kAnyAnyAnyagedagedlatedTown- Pop.
or>£48k->£41k->£34k->£28k->£21k->£14k->£7k-Up toagedagedagedunderNET:18 orDwel-Vil-NET:andoverNET:more£55k£48k£41k£34k£28k£21k£14k£7k16-1811-155-105YesunderlinglageRuralFringe10kUrbanTotal
10103267190213218170557711912996284723161831994084048121011Unweighted base
181436812002092051435384126135105300709151882033984098081011Weighted base
531025556246281318414232861683444892114207254NET: Agree26%19%27%31%28%30%22%20%24%21%32%31%30%29%24%24%24%24%23%28%26%25%
--191211167649692141-5522355762Strongly agree (+2)--1%11%6%5%8%5%11%5%7%5%8%7%6%-2%2%6%9%7%6%
539164352302171432352365126340437079149193Agree a little (+1)26%19%26%19%22%25%14%15%13%16%25%26%22%22%18%24%21%21%18%19%18%19%
88142872716857263350564711625357681154136290371Neither agree nor (0)42%54%40%34%36%34%33%40%49%39%39%41%45%39%36%33%40%40%39%33%36%37%disagree
-1720243441174142015640116433375664120157Disagree a little (-1)-5%19%25%12%16%20%12%7%16%16%11%5%13%16%27%17%18%14%16%15%15%
6338373440298151015838137229307372145175Strongly disagree (-2)32%22%10%9%18%16%19%20%14%18%8%11%7%13%19%11%15%15%18%18%18%17%
6410286069814511293030137925366267129136265332NET: Disagree32%27%28%34%30%33%40%32%21%34%24%22%13%26%36%38%33%33%32%33%33%33%
--211271013346713193517723234754Don't know--4%1%6%4%5%9%5%5%5%5%12%6%5%6%4%4%6%6%6%5%
-0.39-0.31-0.10-0.02-0.16-0.15-0.30-0.300.01-0.270.080.020.21-0.04-0.27-0.26-0.23-0.23-0.23-0.15-0.19-0.20Mean
1.221.050.981.141.171.141.191.141.151.121.041.040.991.101.161.001.041.041.141.211.181.15Standard deviation0.380.330.180.140.090.080.080.090.160.130.100.090.110.070.040.260.080.080.060.060.040.04Standard error
Page 118
Brassica Vegetables SurveyONLINE Fieldwork: 19th-20th November 2014
Absolutes/col percents
Table 118Q.5 To what extent do you agree or disagree with each of the following statements about Brassica vegetables?Base: All respondentsI would use Brassica vegetables more often if I knew more about how to cook them
Prepared by Populus

Marital StatusWhich of the following ITV regions do you live in?NET:Mar-ried/
NET:CivilWid-part-owed/ner-separ-Civilship/ated/CoPart-coWest-
Div-Separ-Wid-div-Hab-ner-Mar-hab-York-count-WalesTyneScot-Meri-Gran-Gram-Cent-orcedatedowedorceditingshiprieditingSingleshirery& WestTeestishdianLondonadapianralAngliaTotal
98124015014414446604250572754337798186110134101241011Unweighted base
84114213714215452608262543149428382199114137101071011Weighted base
13542237394135971841581917553230421254NET: Agree16%46%9%16%26%20%21%22%37%34%13%32%19%23%21%27%28%22%35%20%25%
-2121112537222314631710101462Strongly agree (+2)-15%2%2%8%9%5%6%8%3%10%1%9%7%4%9%8%7%6%4%6%
1333202626998751711541414372320317193Agree a little (+1)16%31%7%14%19%11%15%16%29%31%3%30%10%17%17%19%20%14%29%16%19%
3012051491017723682121022162926714057245371Neither agree nor (0)35%13%49%38%35%66%39%39%31%22%33%44%37%35%32%36%35%42%22%42%37%disagree
112102421-74953757521812272220321157Disagree a little (-1)14%17%24%17%15%-16%16%14%9%23%11%6%22%14%14%19%14%31%19%15%
2628352528211030168413923351325-16175Strongly disagree (-2)31%15%18%26%18%14%18%18%12%29%25%8%31%11%28%18%12%18%-15%17%
37418594621562056821159152734623544337332NET: Disagree45%33%43%43%33%14%35%34%26%38%48%19%37%32%42%31%31%32%31%34%33%
41-59-24331532238411751454Don't know4%9%-3%6%-5%5%6%6%6%5%7%9%5%5%6%4%12%3%5%
-0.620.14-0.51-0.53-0.17*-0.28-0.250.09-0.33-0.520.05-0.44-0.14-0.47-0.14-0.06-0.220.13-0.27-0.20Mean
1.111.430.931.091.191.051.121.141.141.311.250.921.321.091.211.211.131.151.031.041.15Standard deviation0.110.430.150.090.100.280.050.050.070.180.250.130.230.130.130.090.110.100.340.100.04Standard error
Page 119
Brassica Vegetables SurveyONLINE Fieldwork: 19th-20th November 2014
Absolutes/col percents
Table 119Q.5 To what extent do you agree or disagree with each of the following statements about Brassica vegetables?Base: All respondentsI would use Brassica vegetables more often if I knew more about how to cook them
Prepared by Populus

Which of the following cities do you live in, or nearest to?None ofPly-South-Brigh-MiltonBirm-Nott-Liver-Manch-Shef-New-Edin-theseCardiffmouthBristolamptonLondonOxfordtonKeynesNorwichinghaminghampoolesterfieldHullLeedscastleburghGlasgowTotal
794336314122114213562764937732813453334401011Unweighted base
703829353223014212755894736743411454238451011Weighted base
815714961818720592374178814254NET: Agree11%41%26%38%27%27%55%6%28%12%23%12%26%31%22%31%39%20%21%32%25%
1112322----9127--241562Strongly agree (+2)1%1%3%7%9%9%----10%2%7%10%--5%10%2%12%6%
71571163981871147167415479193Agree a little (+1)10%40%22%31%18%17%55%6%28%12%13%9%19%21%22%31%33%10%19%21%19%
2912899822912243223152916314151513371Neither agree nor (0)41%33%27%25%29%35%13%45%43%44%36%48%41%39%49%27%32%36%39%29%37%disagree
1741273121214188695243118157Disagree a little (-1)24%12%5%5%23%13%18%5%9%25%20%17%18%12%15%14%10%8%28%19%15%
1331267452748168394371126175Strongly disagree (-2)18%8%42%17%21%19%14%35%16%14%18%16%7%13%12%24%15%26%4%14%17%
30714814754872134169199411141215332NET: Disagree43%20%47%22%44%33%32%40%25%39%38%33%25%25%27%38%25%34%33%33%33%
42-5-12-21334341*243254Don't know5%6%-14%-5%-9%4%5%3%8%8%5%2%4%5%10%7%5%5%
-0.510.16-0.600.07-0.29-0.170.08-0.75-0.14-0.43-0.24-0.38*0.03-0.18-0.330.05-0.33-0.15-0.03-0.20Mean
0.980.981.331.271.261.231.181.071.040.901.220.981.021.150.931.231.151.320.871.241.15Standard deviation0.110.150.220.240.200.080.310.250.180.120.140.150.180.140.180.350.180.240.150.200.04Standard error
Page 120
Brassica Vegetables SurveyONLINE Fieldwork: 19th-20th November 2014
Absolutes/col percents
Table 120Q.5 To what extent do you agree or disagree with each of the following statements about Brassica vegetables?Base: All respondentsI would use Brassica vegetables more often if I knew more about how to cook them
Prepared by Populus

EmploymentSectorRegionSocial GradeAgeGender
York-shire
EastWest&Pri-SouthSouthEast-Mid-Mid-Humb-NorthNorthScot-vatePublicWestEastLondonernWaleslandslandsersideWestEastlandDEC2C1AB65+55-6445-5435-4425-3418-24FemaleMaleTotal
42011896155116121577578881093284262210315224227176198188130924805311011Unweighted base
439127911421311015171919111140912402202802702201501801701701205164951011Weighted base
892212211819109192320711333452492123292937299178169NET: Agree20%17%13%15%13%19%19%13%21%25%18%17%12%14%16%18%18%10%16%16%17%22%24%18%16%17%
2131532221653389106368582141832Strongly agree (+2)5%3%1%4%2%2%4%3%1%6%5%6%3%3%4%4%2%1%4%4%3%5%1%3%4%3%
6818121615178719171548262642431817212429277660137Agree a little (+1)16%15%13%11%11%17%15%10%21%19%13%11%9%11%12%15%16%8%12%11%14%17%23%15%12%14%
1142919444023121228242571563516370443443503838129118247Neither agree nor (0)26%23%20%31%31%22%23%17%31%26%22%17%17%26%23%22%26%20%23%24%29%22%31%25%24%24%disagree
12141313931301532212030103963778870805447553922154143297Disagree a little (-1)28%32%34%28%24%30%30%45%23%22%27%24%42%26%35%31%26%36%36%26%32%23%19%30%29%29%
5426122618218111712211014413249484529351631158487171Strongly disagree (-2)12%20%13%18%13%21%16%16%19%13%19%25%16%17%15%18%18%20%20%19%9%18%13%16%17%17%
1756643654951234338325120531041091371181258482706937238230468NET: Disagree40%52%47%46%37%50%46%61%41%35%46%49%58%43%49%49%44%57%56%46%41%41%31%46%46%46%
61101812259666131571240262932309262026165870128Don't know14%8%19%8%19%8%11%9%7%14%14%18%13%17%12%10%12%14%6%15%12%15%14%11%14%13%
-0.31-0.57-0.56-0.50-0.44-0.55-0.44-0.67-0.41-0.20-0.50-0.62-0.67-0.52-0.50-0.49-0.47-0.76-0.59-0.52-0.34-0.38-0.21-0.47-0.52-0.50Mean
1.101.090.971.071.011.111.120.991.071.161.161.271.021.081.061.101.080.971.081.140.991.191.041.071.091.08Standard deviation0.060.100.110.090.100.110.160.120.130.130.120.240.120.070.080.070.080.070.090.090.080.110.120.050.050.04Standard error
Page 121
Brassica Vegetables SurveyONLINE Fieldwork: 19th-20th November 2014
Absolutes/col percents
Table 121Q.5 To what extent do you agree or disagree with each of the following statements about Brassica vegetables?Base: All respondentsIn general, people in Britain today eat enough Brassica vegetables
Prepared by Populus

What is the combined annual income of your household, prior toDo you have any children aged 18 orWhich of the following best describestax being deducted?under? If so, how old are they?where you live?
Nochild-Hamlet
Anyren& Iso-Urban>£55kAnyAnyAnyagedagedlatedTown- Pop.
or>£48k->£41k->£34k->£28k->£21k->£14k->£7k-Up toagedagedagedunderNET:18 orDwel-Vil-NET:andoverNET:more£55k£48k£41k£34k£28k£21k£14k£7k16-1811-155-105YesunderlinglageRuralFringe10kUrbanTotal
10103267190213218170557711912996284723161831994084048121011Unweighted base
181436812002092051435384126135105300709151882033984098081011Weighted base
6381833293818*2029281760107232346966135169NET: Agree36%25%24%22%17%14%18%12%1%24%23%21%16%20%15%13%17%16%17%16%17%17%
-1268572-48371715-559182732Strongly agree (+2)-5%5%7%4%2%3%2%-4%6%3%7%6%2%-3%2%2%4%3%3%
6371225243115*172125104392227296048108137Agree a little (+1)36%19%19%14%12%12%15%11%1%20%17%19%10%14%13%13%14%14%15%12%13%14%
531118454151421923313529811663394298107205247Neither agree nor (0)26%20%32%22%23%19%25%29%36%28%25%26%28%27%23%18%21%21%25%26%25%24%disagree
3512254682643614213432197821846064112121233297Disagree a little (-1)14%37%33%31%23%39%31%25%25%25%27%24%18%26%31%25%32%31%28%30%29%29%
1-31039363423151220261845126342466362125171Strongly disagree (-2)7%-10%13%20%17%17%16%28%15%16%19%17%15%18%23%22%23%16%15%15%17%
45153585119985929345458361233447102109175184358468NET: Disagree21%37%43%43%43%57%48%41%54%40%43%43%35%41%49%48%54%54%44%45%44%46%
3311036211824571214223592315185753110128Don't know17%18%2%13%18%10%9%17%10%8%10%10%21%12%13%21%8%9%14%13%14%13%
0.09-0.08-0.25-0.31-0.51-0.64-0.47-0.52-0.90-0.28-0.33-0.42-0.36-0.34-0.56-0.72-0.63-0.63-0.47-0.45-0.46-0.50Mean
1.011.021.041.161.161.011.081.010.861.121.171.121.201.131.051.101.101.101.061.081.071.08Standard deviation0.360.340.190.150.090.070.080.080.130.130.110.100.140.070.040.310.090.080.060.060.040.04Standard error
Page 122
Brassica Vegetables SurveyONLINE Fieldwork: 19th-20th November 2014
Absolutes/col percents
Table 122Q.5 To what extent do you agree or disagree with each of the following statements about Brassica vegetables?Base: All respondentsIn general, people in Britain today eat enough Brassica vegetables
Prepared by Populus
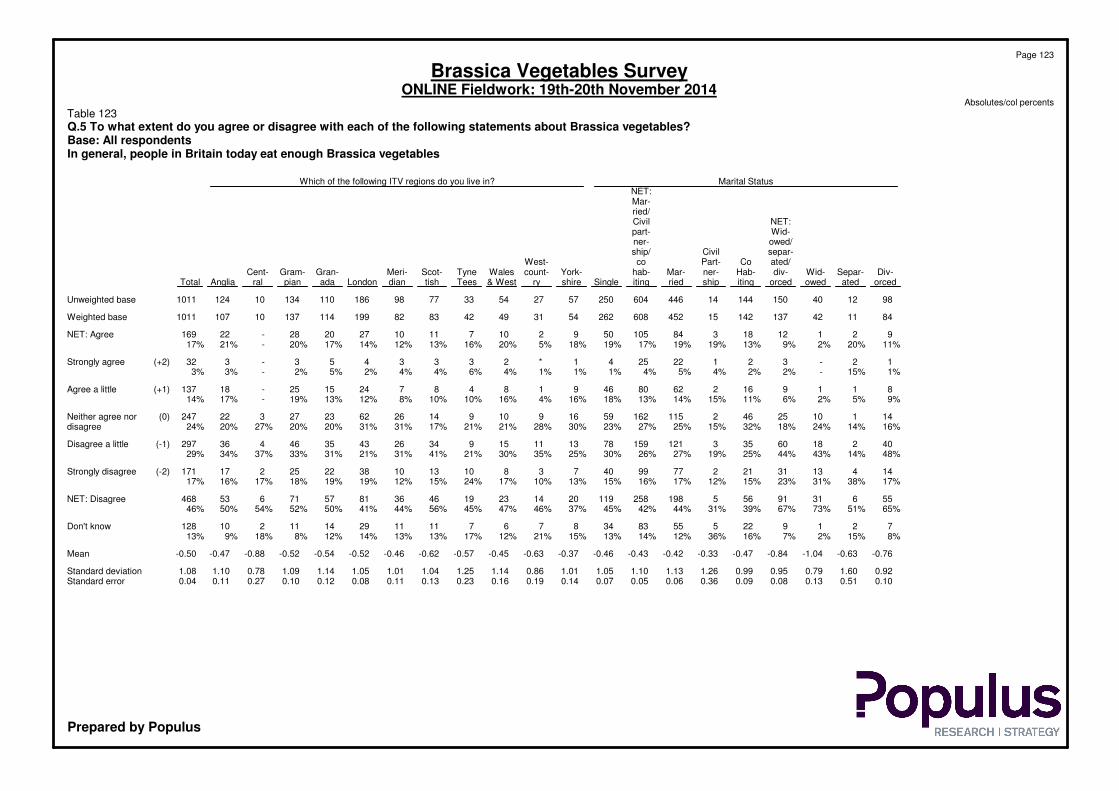
Marital StatusWhich of the following ITV regions do you live in?NET:Mar-ried/
NET:CivilWid-part-owed/ner-separ-Civilship/ated/CoPart-coWest-
Div-Separ-Wid-div-Hab-ner-Mar-hab-York-count-WalesTyneScot-Meri-Gran-Gram-Cent-orcedatedowedorceditingshiprieditingSingleshirery& WestTeestishdianLondonadapianralAngliaTotal
98124015014414446604250572754337798186110134101241011Unweighted base
84114213714215452608262543149428382199114137101071011Weighted base
921121838410550921071110272028-22169NET: Agree11%20%2%9%13%19%19%17%19%18%5%20%16%13%12%14%17%20%-21%17%
12-321222541*2333453-332Strongly agree (+2)1%15%-2%2%4%5%4%1%1%1%4%6%4%4%2%5%2%-3%3%
8119162628046918487241525-18137Agree a little (+1)9%5%2%6%11%15%14%13%18%16%4%16%10%10%8%12%13%19%-17%14%
1411025462115162591691091426622327322247Neither agree nor (0)16%14%24%18%32%15%25%27%23%30%28%21%21%17%31%31%20%20%27%20%24%disagree
40218603531211597813111593426433546436297Disagree a little (-1)48%14%43%44%25%19%27%26%30%25%35%30%21%41%31%21%31%33%37%34%29%
1441331212779940738101310382225217171Strongly disagree (-2)17%38%31%23%15%12%17%16%15%13%10%17%24%15%12%19%19%18%17%16%17%
5563191565198258119201423194636815771653468NET: Disagree65%51%73%67%39%31%44%42%45%37%46%47%45%56%44%41%50%52%54%50%46%
721922555833487671111291411210128Don't know8%15%2%7%16%36%12%14%13%15%21%12%17%13%13%14%12%8%18%9%13%
-0.76-0.63-1.04-0.84-0.47-0.33-0.42-0.43-0.46-0.37-0.63-0.45-0.57-0.62-0.46-0.52-0.54-0.52-0.88-0.47-0.50Mean
0.921.600.790.950.991.261.131.101.051.010.861.141.251.041.011.051.141.090.781.101.08Standard deviation0.100.510.130.080.090.360.060.050.070.140.190.160.230.130.110.080.120.100.270.110.04Standard error
Page 123
Brassica Vegetables SurveyONLINE Fieldwork: 19th-20th November 2014
Absolutes/col percents
Table 123Q.5 To what extent do you agree or disagree with each of the following statements about Brassica vegetables?Base: All respondentsIn general, people in Britain today eat enough Brassica vegetables
Prepared by Populus

Which of the following cities do you live in, or nearest to?None ofPly-South-Brigh-MiltonBirm-Nott-Liver-Manch-Shef-New-Edin-theseCardiffmouthBristolamptonLondonOxfordtonKeynesNorwichinghaminghampoolesterfieldHullLeedscastleburghGlasgowTotal
794336314122114213562764937732813453334401011Unweighted base
703829353223014212755894736743411454238451011Weighted base
963753821561981189-13719169NET: Agree13%15%12%20%16%17%17%4%20%10%22%16%30%11%27%-29%16%4%21%17%
*21-171-111123--63-332Strongly agree (+2)1%5%2%-2%3%8%-3%1%1%3%6%4%--12%6%-7%3%
93374311155186959-8416137Agree a little (+1)13%9%10%20%13%14%9%4%17%9%20%14%24%7%27%-17%10%4%14%14%
1786946941361225581613310786247Neither agree nor (0)24%21%20%26%12%30%27%62%22%22%28%10%21%22%38%28%23%17%21%13%24%disagree
23131181349639232317823651292016297Disagree a little (-1)33%34%38%22%41%21%41%16%32%42%26%37%22%31%17%42%26%23%53%37%29%
77545411141116106173181059171Strongly disagree (-2)10%18%16%13%16%18%8%6%16%20%18%21%15%23%8%13%17%24%12%20%17%
302016121890751334402713408619202525468NET: Disagree43%52%54%35%57%39%49%22%48%62%45%57%38%53%25%55%43%47%65%56%46%
14547533133358410322845128Don't know20%12%14%19%16%14%7%12%9%6%5%16%11%14%10%18%5%20%11%11%13%
-0.49-0.58-0.66-0.33-0.65-0.44-0.35-0.27-0.46-0.75-0.42-0.70-0.19-0.70-0.07-0.82-0.19-0.61-0.82-0.54-0.50Mean
0.941.131.011.041.071.091.090.671.100.951.081.121.221.090.930.721.301.260.721.221.08Standard deviation0.120.180.180.200.180.080.300.160.200.130.130.170.220.140.190.230.200.230.130.210.04Standard error
Page 124
Brassica Vegetables SurveyONLINE Fieldwork: 19th-20th November 2014
Absolutes/col percents
Table 124Q.5 To what extent do you agree or disagree with each of the following statements about Brassica vegetables?Base: All respondentsIn general, people in Britain today eat enough Brassica vegetables
Prepared by Populus

EmploymentSectorRegionSocial GradeAgeGender
York-shire
EastWest&Pri-SouthSouthEast-Mid-Mid-Humb-NorthNorthScot-vatePublicWestEastLondonernWaleslandslandsersideWestEastlandDEC2C1AB65+55-6445-5435-4425-3418-24FemaleMaleTotal
42011896155116121577578881093284262210315224227176198188130924805311011Unweighted base
439127911421311015171919111140912402202802702201501801701701205164951011Weighted base
3271026310192824161736284387017718221219517812514812512368396370766NET: Agree74%81%70%72%70%81%81%86%80%68%75%93%77%74%83%76%72%81%83%82%73%72%57%77%75%76%
159562157473626303921403034978910490946577597016196184380Strongly agree (+2)36%45%23%40%35%36%51%42%43%23%36%74%37%40%40%37%33%42%43%43%34%41%13%38%37%38%
168464345454615313441448368093108105846071665352200187386Agree a little (+1)38%36%47%32%34%45%30%44%37%45%39%19%40%33%42%39%39%38%40%40%39%31%44%39%38%38%
77181830281556161918211402945562818233233368585170Neither agree nor (0)18%15%20%21%22%15%11%9%18%21%16%5%13%17%13%16%21%13%12%13%19%19%30%17%17%17%disagree
15233211--63153669331339101323Disagree a little (-1)3%2%3%2%1%1%2%--7%2%2%5%1%3%2%3%1%2%1%2%2%8%2%3%2%
-111-----22-13-22311-1-427Strongly disagree (-2)-1%2%1%-----2%2%-1%1%-1%1%2%1%1%-*-1%*1%
15344211--851566810743349141630NET: Disagree3%2%4%3%1%1%2%--9%4%2%6%2%3%3%4%3%3%2%2%2%8%3%3%3%
203579334225-418414883611117202545Don't know5%2%5%5%7%3%7%5%2%2%5%-5%8%2%5%3%4%2%3%6%6%6%4%5%4%
1.121.260.921.141.121.201.401.351.250.831.101.661.121.191.231.151.041.231.251.271.131.180.661.161.141.15Mean
0.830.810.860.880.820.730.770.640.750.950.900.660.900.860.780.840.870.850.820.780.800.850.820.840.840.84Standard deviation0.040.080.090.070.080.070.100.080.090.100.090.120.100.060.050.050.060.060.060.060.060.080.090.040.040.03Standard error
Page 125
Brassica Vegetables SurveyONLINE Fieldwork: 19th-20th November 2014
Absolutes/col percents
Table 125Q.5 To what extent do you agree or disagree with each of the following statements about Brassica vegetables?Base: All respondentsChildren should be taught more in schools about Brassica vegetables and how to use them
Prepared by Populus

What is the combined annual income of your household, prior toDo you have any children aged 18 orWhich of the following best describestax being deducted?under? If so, how old are they?where you live?
Nochild-Hamlet
Anyren& Iso-Urban>£55kAnyAnyAnyagedagedlatedTown- Pop.
or>£48k->£41k->£34k->£28k->£21k->£14k->£7k-Up toagedagedagedunderNET:18 orDwel-Vil-NET:andoverNET:more£55k£48k£41k£34k£28k£21k£14k£7k16-1811-155-105YesunderlinglageRuralFringe10kUrbanTotal
10103267190213218170557711912996284723161831994084048121011Unweighted base
181436812002092051435384126135105300709151882033984098081011Weighted base
1014266215016815810737661001046221654812146158308300608766NET: Agree58%100%71%77%75%80%77%75%69%78%80%77%58%72%77%83%77%78%77%73%75%76%
5473372857861232651463310827276875154151305380Strongly agree (+2)26%31%19%41%36%41%38%43%43%31%41%34%32%36%38%47%36%37%39%37%38%38%
610192978838046143949572810827657883154149303386Agree a little (+1)32%69%52%36%39%40%39%32%26%47%39%43%27%36%39%36%41%41%39%36%38%38%
5-61131313721141320212657113229316376139170Neither agree nor (0)29%-17%14%15%15%18%15%27%15%16%15%24%19%16%11%16%15%16%19%17%17%disagree
2-254512-2125914-771161623Disagree a little (-1)10%-6%7%2%2%*2%-2%1%2%5%3%2%-4%3%3%1%2%2%
1-112*-1------7-112357Strongly disagree (-2)4%-4%2%1%*-1%------1%-1%1%*1%1%1%
2-476514-2125921-881392230NET: Disagree14%-10%8%3%3%*3%-2%1%2%5%3%3%-4%4%3%2%3%3%
--11135911245813172715614253945Don't know--2%1%6%3%4%8%5%4%4%6%12%6%4%6%3%3%3%6%5%4%
0.661.310.781.091.151.211.201.231.171.121.251.170.961.111.161.381.121.131.161.141.151.15Mean
1.110.480.980.990.840.800.750.870.850.760.750.760.940.840.840.710.860.850.840.840.840.84Standard deviation0.350.150.180.120.060.060.050.070.120.090.070.070.100.050.030.180.060.060.040.040.030.03Standard error
Page 126
Brassica Vegetables SurveyONLINE Fieldwork: 19th-20th November 2014
Absolutes/col percents
Table 126Q.5 To what extent do you agree or disagree with each of the following statements about Brassica vegetables?Base: All respondentsChildren should be taught more in schools about Brassica vegetables and how to use them
Prepared by Populus

Marital StatusWhich of the following ITV regions do you live in?NET:Mar-ried/
NET:CivilWid-part-owed/ner-separ-Civilship/ated/CoPart-coWest-
Div-Separ-Wid-div-Hab-ner-Mar-hab-York-count-WalesTyneScot-Meri-Gran-Gram-Cent-orcedatedowedorceditingshiprieditingSingleshirery& WestTeestishdianLondonadapianralAngliaTotal
98124015014414446604250572754337798186110134101241011Unweighted base
84114213714215452608262543149428382199114137101071011Weighted base
73936118941034745119539174038645114489117687766NET: Agree88%80%86%86%66%68%77%74%74%72%54%81%91%77%63%72%78%85%59%82%76%
35719604651722229711725313124814057340380Strongly agree (+2)41%65%44%44%32%34%38%37%37%20%24%52%73%38%29%41%35%42%30%37%38%
3921758485175228982891483327624960347386Agree a little (+1)46%16%42%42%34%34%39%38%37%52%31%29%18%39%34%31%42%44%29%44%38%
8151436*7311046912531125391614115170Neither agree nor (0)9%11%11%10%26%3%16%18%18%16%39%11%7%14%30%20%14%10%8%14%17%disagree
--**34815721*12143-2123Disagree a little (-1)--1%*2%30%2%3%3%4%2%1%1%3%1%2%3%-21%1%2%
2-12--3311---1112---7Strongly disagree (-2)2%-2%2%--1%1%*1%---1%1%*2%---1%
2-13341119931*13245-2130NET: Disagree2%-3%2%2%30%3%3%3%5%2%1%1%4%3%2%4%-21%1%3%
11-29-202912413-4412461345Don't know1%9%-1%6%-4%5%5%7%4%7%-5%5%6%3%4%12%3%4%
1.261.591.251.281.030.721.171.131.130.940.801.421.631.160.931.181.111.330.771.221.15Mean
0.790.730.840.800.841.250.830.850.850.810.860.740.690.860.890.860.880.661.230.730.84Standard deviation0.080.220.130.070.070.340.040.040.060.110.170.100.120.100.090.060.090.060.410.070.03Standard error
Page 127
Brassica Vegetables SurveyONLINE Fieldwork: 19th-20th November 2014
Absolutes/col percents
Table 127Q.5 To what extent do you agree or disagree with each of the following statements about Brassica vegetables?Base: All respondentsChildren should be taught more in schools about Brassica vegetables and how to use them
Prepared by Populus

Which of the following cities do you live in, or nearest to?None ofPly-South-Brigh-MiltonBirm-Nott-Liver-Manch-Shef-New-Edin-theseCardiffmouthBristolamptonLondonOxfordtonKeynesNorwichinghaminghampoolesterfieldHullLeedscastleburghGlasgowTotal
794336314122114213562764937732813453334401011Unweighted base
703829353223014212755894736743411454238451011Weighted base
5131242322168101122447137295924636392636766NET: Agree73%81%81%65%69%73%73%52%79%80%80%78%81%79%71%55%81%92%70%80%76%
241910312933310213616162710214301317380Strongly agree (+2)34%51%33%9%37%40%23%16%36%37%41%34%46%37%30%20%30%72%36%37%38%
271114191075771223352112311442391319386Agree a little (+1)38%30%48%55%32%32%49%36%43%42%39%43%35%42%41%36%51%20%35%43%38%
164369454921016349737265170Neither agree nor (0)23%11%11%18%27%20%27%42%6%18%18%7%12%12%21%23%16%4%15%12%17%disagree
**21-4--2--4*31-112223Disagree a little (-1)*1%5%3%-2%--7%--8%1%4%4%-2%1%6%6%2%
--1-11-------211--1-7Strongly disagree (-2)--2%-3%*-------3%2%11%--2%-1%
**2114--2--4*521113230NET: Disagree*1%7%3%3%2%--7%--8%1%6%6%11%2%1%8%6%3%
32-5113-121232211113145Don't know4%6%-14%2%5%-5%8%2%2%7%6%2%2%10%2%3%7%2%4%
1.111.401.050.831.021.180.960.721.181.201.231.111.341.100.950.591.121.671.031.151.15Mean
0.780.750.930.670.970.840.740.760.870.730.740.900.760.940.931.250.730.631.010.850.84Standard deviation0.090.120.150.130.150.060.200.170.150.090.090.130.130.110.180.380.110.110.180.140.03Standard error
Page 128
Brassica Vegetables SurveyONLINE Fieldwork: 19th-20th November 2014
Absolutes/col percents
Table 128Q.5 To what extent do you agree or disagree with each of the following statements about Brassica vegetables?Base: All respondentsChildren should be taught more in schools about Brassica vegetables and how to use them
Prepared by Populus

FactorsWhether
vegetables arefrom a BritishWhether the
WhetherAppearance ofWhetherfarm (notWhethervegetables arevegetables arevegetables invegetable is innecessarilyvegetables areon special
organicthe shopseasonPersonal tastelocal)locally sourcedofferPrice
10071007100710071007100710071007Unweighted base
10091009100910091009100910091009Weighted base
182766596914498428564835NET: Important18%76%59%91%49%42%56%83%
53360194564135106181381Very important (+2)5%36%19%56%13%11%18%38%
129407402350363322383453Quite important (+1)13%40%40%35%36%32%38%45%
39116230472344374339121Neither important (0)39%16%30%7%34%37%34%12%nor unimportant
22040525931236030Quite unimportant (-1)22%4%5%1%9%12%6%3%
2012539559683210Very unimportant (-2)20%3%4%*6%7%3%1%
4206691101521919240NET: Unimportant42%7%9%1%15%19%9%4%
1515171215151313Don't know2%1%2%1%1%1%1%1%
-0.391.040.671.470.420.280.621.17Mean
1.110.960.980.701.031.040.960.83Standard deviation0.040.030.030.020.030.030.030.03Standard error
Page 129
Brassica Vegetables SurveyONLINE Fieldwork: 19th-20th November 2014
Absolutes/col percents
Table 129Q.6 How important or unimportant is each of the following factors when considering purchasing vegetables?Base: All respondents who eat vegetablesSummary
Prepared by Populus

EmploymentSectorRegionSocial GradeAgeGender
York-shire
EastWest&Pri-SouthSouthEast-Mid-Mid-Humb-NorthNorthScot-vatePublicWestEastLondonernWaleslandslandsersideWestEastlandDEC2C1AB65+55-6445-5435-4425-3418-24FemaleMaleTotal
41811896155116120577576871093284259210314224226176197188129914775301007Unweighted base
438127911421311015171909011140912392202792702201501801701691195144951009Weighted base
3741108212188883964807387377619819322322017712116415013291438397835NET: Important85%87%90%86%67%87%76%91%89%81%78%92%83%83%88%80%81%80%81%91%88%78%76%85%80%83%
198444041513122285431292233919493103544783856645203178381Very important (+2)45%35%44%29%39%31%44%39%60%35%26%53%36%38%43%33%38%25%32%46%50%39%38%40%36%38%
175654280375717372641581643108991301161227481656546234219453Quite important (+1)40%52%47%57%28%56%33%52%29%46%52%39%47%45%45%47%43%56%49%45%38%39%38%46%44%45%
46137182810749161237271540393316131325204972121Neither important (0)11%10%7%13%21%10%15%6%10%18%11%8%8%11%7%14%14%15%11%7%8%15%17%10%14%12%nor unimportant
93129212127-5661367112344161430Quite unimportant (-1)2%2%1%1%7%2%3%2%1%2%6%-5%2%3%5%2%3%7%1%2%3%3%3%3%3%
21*14-11--2-1153132121*6410Very unimportant (-2)1%1%1%1%3%-2%1%--2%-1%1%2%1%*2%2%*1%**1%1%1%
1242213223129-671116610132554221840NET: Unimportant3%3%2%2%10%2%4%4%1%2%8%-6%3%5%6%2%5%9%1%3%3%4%4%4%4%
6-1-212-*-3-361151--2745813Don't know1%-1%-2%1%5%-*-3%-3%3%**2%*--1%4%3%1%2%1%
1.291.171.331.130.951.181.201.251.491.140.981.451.151.211.241.071.190.991.021.361.361.181.141.211.141.17Mean
0.790.780.710.711.080.680.920.780.710.770.890.640.870.780.870.860.780.810.920.700.790.830.850.830.830.83Standard deviation0.040.070.070.060.100.060.120.090.080.080.090.110.100.050.060.050.050.050.070.050.060.070.090.040.040.03Standard error
Page 130
Brassica Vegetables SurveyONLINE Fieldwork: 19th-20th November 2014
Absolutes/col percents
Table 130Q.6 How important or unimportant is each of the following factors when considering purchasing vegetables?Base: All respondents who eat vegetablesPrice
Prepared by Populus

What is the combined annual income of your household, prior toDo you have any children aged 18 orWhich of the following best describestax being deducted?under? If so, how old are they?where you live?
Nochild-Hamlet
Anyren& Iso-Urban>£55kAnyAnyAnyagedagedlatedTown- Pop.
or>£48k->£41k->£34k->£28k->£21k->£14k->£7k-Up toagedagedagedunderNET:18 orDwel-Vil-NET:andoverNET:more£55k£48k£41k£34k£28k£21k£14k£7k16-1811-155-105YesunderlinglageRuralFringe10kUrbanTotal
10103267189213218169547711912896283720161821984084018091007Unweighted base
181436811992092051435384126134105299707151882033984088061009Weighted base
1611326716817417311738761051088024558912156168329338667835NET: Important88%77%90%82%84%83%84%82%71%91%84%80%76%82%83%80%83%83%83%83%83%83%
5172672779354244963523313124955560154168322381Very important (+2)25%6%20%31%36%37%46%38%45%58%50%39%31%44%35%34%29%29%39%41%40%38%
111025419696796314274256471133407101108175170345453Quite important (+1)63%70%70%51%48%46%39%44%26%32%33%42%45%38%48%45%54%53%44%42%43%45%
1321014292418116171516378322527504494121Neither important (0)4%19%7%12%7%14%12%13%21%7%14%11%15%12%12%14%13%13%12%11%12%12%nor unimportant
-1-2106433234272316710142330Quite unimportant (-1)-5%-3%5%3%2%2%7%2%3%3%2%2%3%6%3%3%2%3%3%3%
1-112111*-----9-1145910Very unimportant (-2)7%-3%1%1%*1%1%1%-----1%-**1%1%1%1%
1113126544234273217813193240NET: Unimportant7%5%3%4%6%3%2%3%8%2%3%3%2%2%4%6%4%4%3%5%4%4%
---24-33---77103-11671313Don't know---2%2%-2%2%---5%7%3%*-**2%2%2%1%
0.980.781.041.111.161.171.291.191.081.471.311.231.131.281.131.081.081.081.191.201.191.17Mean
1.010.650.760.800.850.790.790.801.010.720.810.780.760.780.830.890.760.770.820.860.840.83Standard deviation0.320.210.130.100.060.050.050.060.140.080.070.070.080.050.030.220.060.050.040.040.030.03Standard error
Page 131
Brassica Vegetables SurveyONLINE Fieldwork: 19th-20th November 2014
Absolutes/col percents
Table 131Q.6 How important or unimportant is each of the following factors when considering purchasing vegetables?Base: All respondents who eat vegetablesPrice
Prepared by Populus

Marital StatusWhich of the following ITV regions do you live in?NET:Mar-ried/
NET:CivilWid-part-owed/ner-separ-Civilship/ated/CoPart-coWest-
Div-Separ-Wid-div-Hab-ner-Mar-hab-York-count-WalesTyneScot-Meri-Gran-Gram-Cent-orcedatedowedorceditingshiprieditingSingleshirery& WestTeestishdianLondonadapianralAngliaTotal
97124014914414445603248572754337798186110132101231007Unweighted base
83114213614215451608261543149428382199114136101061009Weighted base
7110341151181037650421450283739686814891121991835NET: Important86%91%80%85%83%66%83%83%82%92%92%75%93%82%83%74%79%89%84%85%83%
3841355554162222103271422222825703170334381Very important (+2)46%41%31%41%39%29%36%37%40%51%46%44%52%34%30%35%27%52%33%32%38%
3362160635214282111221415174043786051556453Quite important (+1)40%51%49%44%44%36%47%46%43%41%46%31%41%48%53%39%53%37%52%53%45%
1013141455372343173613351111212121Neither important (0)12%9%7%10%10%34%12%12%13%6%3%15%7%8%16%18%10%8%16%12%12%nor unimportant
*-565-12168*11-5*1072-230Quite unimportant (-1)*-13%4%3%-3%3%3%1%2%3%-5%*5%6%2%-2%3%
1--11-561*-1-11421--10Very unimportant (-2)2%--1%1%-1%1%1%1%-2%-1%1%2%1%1%--1%
2-576-16229112-611493-240NET: Unimportant2%-13%5%4%-4%4%3%2%2%5%-7%1%7%8%2%-2%4%
----3-694-12-3-23*-113Don't know----2%-1%1%1%-3%5%-3%-1%3%*-1%1%
1.271.320.991.191.200.951.161.171.191.411.401.191.441.121.111.021.001.381.171.171.17Mean
0.830.660.950.860.830.820.810.810.820.720.670.940.640.880.740.960.880.770.710.700.83Standard deviation0.080.190.150.070.070.220.040.030.050.100.130.130.110.100.080.070.090.070.220.060.03Standard error
Page 132
Brassica Vegetables SurveyONLINE Fieldwork: 19th-20th November 2014
Absolutes/col percents
Table 132Q.6 How important or unimportant is each of the following factors when considering purchasing vegetables?Base: All respondents who eat vegetablesPrice
Prepared by Populus

Which of the following cities do you live in, or nearest to?None ofPly-South-Brigh-MiltonBirm-Nott-Liver-Manch-Shef-New-Edin-theseCardiffmouthBristolamptonLondonOxfordtonKeynesNorwichinghaminghampoolesterfieldHullLeedscastleburghGlasgowTotal
774336314122114213562754937732812453334401007Unweighted base
693829353223014212755884736743411454238451009Weighted base
6132253426178917224779392755281038393138835NET: Important88%84%86%96%80%77%65%82%81%86%90%82%76%74%83%92%85%94%83%85%83%
31191415118228519521811169417211017381Very important (+2)45%51%48%44%35%36%11%37%18%35%59%38%31%22%27%37%38%51%28%38%38%
3012111814968917282721163919621182121453Quite important (+1)43%33%38%52%44%42%54%45%63%51%31%44%45%52%56%56%47%43%55%48%45%
433-636544696510615324121Neither important (0)6%8%11%-19%16%35%18%13%10%10%13%14%13%17%8%12%6%6%9%12%nor unimportant
4**1*10--11-2*7--2-1230Quite unimportant (-1)5%1%1%2%1%4%--4%1%-3%1%9%--4%-4%4%3%
1-*--4--*--12------110Very unimportant (-2)1%-2%--2%--1%--1%7%------2%1%
4*11*14--11-237--2-1340NET: Unimportant6%1%3%2%1%6%--5%1%-5%8%9%--4%-4%6%4%
-2-1-2---1*-13----3-13Don't know-6%-3%-1%---2%*-2%3%----7%-1%
1.251.441.291.411.141.070.751.180.931.221.501.140.940.901.091.291.191.451.151.141.17Mean
0.870.710.850.600.760.920.660.740.780.690.670.871.080.850.670.630.790.620.720.910.83Standard deviation0.100.110.140.110.120.060.180.160.130.090.080.120.180.100.130.180.120.110.120.140.03Standard error
Page 133
Brassica Vegetables SurveyONLINE Fieldwork: 19th-20th November 2014
Absolutes/col percents
Table 133Q.6 How important or unimportant is each of the following factors when considering purchasing vegetables?Base: All respondents who eat vegetablesPrice
Prepared by Populus

EmploymentSectorRegionSocial GradeAgeGender
York-shire
EastWest&Pri-SouthSouthEast-Mid-Mid-Humb-NorthNorthScot-vatePublicWestEastLondonernWaleslandslandsersideWestEastlandDEC2C1AB65+55-6445-5435-4425-3418-24FemaleMaleTotal
41811896155116120577576871093284259210314224226176197188129914775301007Unweighted base
438127911421311015171909011140912392202792702201501801701691195144951009Weighted base
2628150716558275255525622561311241561531127011510310164319245564NET: Important60%64%54%50%49%58%54%74%61%57%50%54%61%55%56%56%57%51%47%64%60%59%53%62%49%56%
94281121268131535141111154246435033204343231911665181Very important (+2)21%22%12%15%20%8%26%22%39%16%10%27%17%18%21%15%18%15%13%24%25%13%16%23%13%18%
1685339503950143720374611408978113104805072607844203180383Quite important (+1)38%42%43%35%30%50%28%52%23%41%41%26%44%37%35%40%38%36%33%40%35%46%37%40%36%38%
136333457513417152332381128827010186815654534847150189339Neither important (0)31%26%37%41%39%34%33%21%26%36%34%27%30%34%32%36%32%37%37%30%31%28%39%29%38%34%nor unimportant
24107996315513-3131910171516510121204060Quite unimportant (-1)6%8%7%6%7%6%6%2%6%5%11%-3%6%9%4%6%7%11%3%6%7%1%4%8%6%
103-4521262182761281086214191332Very unimportant (-2)2%2%-3%4%2%3%3%7%2%1%19%2%3%3%4%3%5%5%3%1%1%3%4%3%3%
34137131474311614852025222526241113135395392NET: Unimportant8%10%7%9%10%7%8%5%13%7%13%19%5%9%11%8%9%12%16%6%8%8%4%8%11%9%
6-1-212-*-3-361151--2745813Don't know1%-1%-2%1%5%-*-3%-3%3%**2%*--1%4%3%1%2%1%
0.720.730.600.530.560.580.730.880.810.640.470.430.730.630.630.590.640.490.380.790.770.670.640.740.500.62Mean
0.940.970.800.921.010.791.030.871.220.880.881.400.860.941.000.940.960.991.030.950.950.840.890.980.920.96Standard deviation0.050.090.080.070.090.070.140.100.140.090.090.250.090.060.070.050.060.070.080.070.070.080.100.040.040.03Standard error
Page 134
Brassica Vegetables SurveyONLINE Fieldwork: 19th-20th November 2014
Absolutes/col percents
Table 134Q.6 How important or unimportant is each of the following factors when considering purchasing vegetables?Base: All respondents who eat vegetablesWhether the vegetables are on special offer
Prepared by Populus

What is the combined annual income of your household, prior toDo you have any children aged 18 orWhich of the following best describestax being deducted?under? If so, how old are they?where you live?
Nochild-Hamlet
Anyren& Iso-Urban>£55kAnyAnyAnyagedagedlatedTown- Pop.
or>£48k->£41k->£34k->£28k->£21k->£14k->£7k-Up toagedagedagedunderNET:18 orDwel-Vil-NET:andoverNET:more£55k£48k£41k£34k£28k£21k£14k£7k16-1811-155-105YesunderlinglageRuralFringe10kUrbanTotal
10103267189213218169547711912896283720161821984084018091007Unweighted base
181436811992092051435384126134105299707151882033984088061009Weighted base
10102346118117122702461766957177385895103220241461564NET: Important54%70%63%56%59%56%59%49%45%73%60%52%54%59%54%55%50%51%55%59%57%56%
--21244344524102937221563117421246789156181Very important (+2)--4%15%22%16%22%17%20%35%29%17%14%21%17%25%11%12%17%22%19%18%
1010213473837746133139474211526747478153152305383Quite important (+1)54%70%59%41%37%39%38%32%25%37%31%35%40%38%38%30%39%39%38%37%38%38%
7412265872625725214152339224747781133125258339Neither important (0)39%30%35%32%29%34%30%40%47%25%33%39%31%31%35%28%41%40%33%31%32%34%nor unimportant
---614141164274716431111223254860Quite unimportant (-1)---8%7%7%6%4%8%3%6%3%7%5%6%6%6%6%6%6%6%6%
1-115676--2113292561792632Very unimportant (-2)7%-2%2%3%3%3%5%--2%1%1%1%4%11%3%3%4%2%3%3%
1-18192018124295819723161840357492NET: Unimportant7%-2%9%10%10%9%8%8%3%7%4%8%6%10%17%8%9%10%8%9%9%
---24-33---77103-11671313Don't know---2%2%-2%2%---5%7%3%*-**2%2%2%1%
0.390.700.640.620.710.600.700.540.561.050.810.670.650.750.570.520.510.510.590.710.650.62Mean
0.850.480.670.900.990.940.980.980.910.850.970.840.850.900.981.270.860.890.980.960.970.96Standard deviation0.270.150.120.110.070.060.070.080.120.100.090.080.090.050.040.320.060.060.050.050.030.03Standard error
Page 135
Brassica Vegetables SurveyONLINE Fieldwork: 19th-20th November 2014
Absolutes/col percents
Table 135Q.6 How important or unimportant is each of the following factors when considering purchasing vegetables?Base: All respondents who eat vegetablesWhether the vegetables are on special offer
Prepared by Populus

Marital StatusWhich of the following ITV regions do you live in?NET:Mar-ried/
NET:CivilWid-part-owed/ner-separ-Civilship/ated/CoPart-coWest-
Div-Separ-Wid-div-Hab-ner-Mar-hab-York-count-WalesTyneScot-Meri-Gran-Gram-Cent-orcedatedowedorceditingshiprieditingSingleshirery& WestTeestishdianLondonadapianralAngliaTotal
97124014914414445603248572754337798186110132101231007Unweighted base
83114213614215451608261543149428382199114136101061009Weighted base
4762679848254346136252026245047926188662564NET: Important57%56%62%58%59%51%56%57%52%47%64%54%57%61%58%46%54%65%56%58%56%
16212302418010544671311141436124217181Very important (+2)19%22%28%22%17%4%18%17%17%11%23%26%26%17%17%18%11%31%6%7%18%
314144960717424192191314133734564946554383Quite important (+1)37%33%34%36%42%47%39%40%35%36%41%28%31%44%41%28%43%34%50%51%38%
24313404371582089225917102525853532437339Neither important (0)28%26%31%29%30%49%35%34%35%46%28%34%25%30%31%43%31%24%44%35%34%nor unimportant
823138-202917412-3713136-560Quite unimportant (-1)10%19%7%10%6%-5%5%6%7%5%5%-4%9%6%11%5%-5%6%
4--43-131712--1822618-232Very unimportant (-2)5%--3%2%-3%3%5%--3%18%2%3%3%1%6%-1%3%
12231711-3445294148510191415-792NET: Unimportant15%19%7%13%8%-7%7%11%7%5%8%18%6%12%10%13%11%-6%9%
----3-694-12-3-23*-113Don't know----2%-1%1%1%-3%5%-3%-1%3%*-1%1%
0.560.590.840.650.680.550.640.650.550.520.840.720.470.720.600.520.520.790.630.580.62Mean
1.071.080.921.030.910.590.930.921.000.790.851.021.380.880.970.970.891.120.630.750.96Standard deviation0.110.310.150.080.080.160.040.040.060.100.170.140.240.100.100.070.090.100.200.070.03Standard error
Page 136
Brassica Vegetables SurveyONLINE Fieldwork: 19th-20th November 2014
Absolutes/col percents
Table 136Q.6 How important or unimportant is each of the following factors when considering purchasing vegetables?Base: All respondents who eat vegetablesWhether the vegetables are on special offer
Prepared by Populus

Which of the following cities do you live in, or nearest to?None ofPly-South-Brigh-MiltonBirm-Nott-Liver-Manch-Shef-New-Edin-theseCardiffmouthBristolamptonLondonOxfordtonKeynesNorwichinghaminghampoolesterfieldHullLeedscastleburghGlasgowTotal
774336314122114213562754937732812453334401007Unweighted base
693829353223014212755884736743411454238451009Weighted base
372318162111491116315528173819632242228564NET: Important53%61%62%46%65%49%64%51%58%57%63%59%47%51%56%59%71%56%58%64%56%
1312445401623348743391259181Very important (+2)18%32%15%10%16%18%4%31%6%5%38%16%19%5%9%24%19%28%12%20%18%
2411141316738414292120103416423121720383Quite important (+1)35%29%46%36%49%32%61%21%52%52%24%43%27%45%47%34%51%28%46%44%38%
25109157924910192216142313410111114339Neither important (0)36%28%31%42%23%40%31%42%36%34%25%35%38%31%40%41%22%26%30%32%34%nor unimportant
5123317--13413112-3-1160Quite unimportant (-1)7%4%7%9%11%7%--3%5%5%1%8%14%5%-7%-3%2%6%
21--*61111622*---81132Very unimportant (-2)3%2%--1%3%5%6%3%1%7%5%5%1%---18%2%2%3%
722342211231035112-382292NET: Unimportant10%5%7%9%12%10%5%6%6%6%12%6%13%15%5%-7%18%5%5%9%
-2-1-2---1*-13----3-13Don't know-6%-3%-1%---2%*-2%3%----7%-1%
0.580.920.700.490.690.550.580.700.540.560.830.650.500.420.600.830.820.480.680.770.62Mean
0.980.970.830.810.920.950.811.120.790.731.200.931.070.840.720.830.831.390.830.880.96Standard deviation0.110.150.140.150.140.060.220.240.130.090.140.130.180.100.140.240.120.240.140.140.03Standard error
Page 137
Brassica Vegetables SurveyONLINE Fieldwork: 19th-20th November 2014
Absolutes/col percents
Table 137Q.6 How important or unimportant is each of the following factors when considering purchasing vegetables?Base: All respondents who eat vegetablesWhether the vegetables are on special offer
Prepared by Populus

EmploymentSectorRegionSocial GradeAgeGender
York-shire
EastWest&Pri-SouthSouthEast-Mid-Mid-Humb-NorthNorthScot-vatePublicWestEastLondonernWaleslandslandsersideWestEastlandDEC2C1AB65+55-6445-5435-4425-3418-24FemaleMaleTotal
41811896155116120577576871093284259210314224226176197188129914775301007Unweighted base
438127911421311015171909011140912392202792702201501801701691195144951009Weighted base
182614655455222283134441852100901201201036483815642223205428NET: Important42%48%51%39%34%52%44%40%34%38%40%45%57%42%41%43%44%47%43%46%47%33%36%43%41%42%
372011151485611111161028212928261625191386838106Very important (+2)8%16%12%10%11%8%10%8%12%12%10%14%11%12%10%10%10%12%11%14%11%7%6%13%8%11%
14541364131451722202333134271689192774858614335155167322Quite important (+1)33%33%39%29%24%44%34%31%22%26%30%31%46%30%31%32%34%35%32%32%36%26%29%30%34%32%
1604427576133223235343410297787109101855462626151207167374Neither important (0)36%35%29%40%47%33%43%45%39%38%30%25%32%32%40%39%37%38%36%35%37%36%43%40%34%37%nor unimportant
551991811103913181877283337252317161736135865123Quite unimportant (-1)13%15%10%12%8%10%6%12%15%20%16%18%7%12%15%13%9%11%11%9%10%21%11%11%13%12%
3438121031210412512610131991619889214868Very unimportant (-2)8%2%9%8%8%3%3%3%11%5%11%11%1%11%5%5%7%4%10%10%5%5%8%4%10%7%
8922173021144112322301285543504432333526442278113191NET: Unimportant20%17%19%21%16%14%8%15%26%25%27%29%8%23%19%18%16%15%22%19%15%26%19%15%23%19%
7-1-412-*-3-371151--29451015Don't know2%-1%-3%1%5%-*-3%-3%3%**2%*--1%5%3%1%2%1%
0.220.450.350.200.220.430.450.310.090.200.130.190.600.200.270.310.320.400.210.300.390.110.160.380.170.28Mean
1.041.001.101.061.030.900.880.891.141.041.151.230.831.160.980.991.020.971.111.140.991.000.990.991.081.04Standard deviation0.050.090.110.090.100.080.120.100.130.110.110.220.090.070.070.060.070.060.080.080.070.090.110.050.050.03Standard error
Page 138
Brassica Vegetables SurveyONLINE Fieldwork: 19th-20th November 2014
Absolutes/col percents
Table 138Q.6 How important or unimportant is each of the following factors when considering purchasing vegetables?Base: All respondents who eat vegetablesWhether vegetables are locally sourced
Prepared by Populus

What is the combined annual income of your household, prior toDo you have any children aged 18 orWhich of the following best describestax being deducted?under? If so, how old are they?where you live?
Nochild-Hamlet
Anyren& Iso-Urban>£55kAnyAnyAnyagedagedlatedTown- Pop.
or>£48k->£41k->£34k->£28k->£21k->£14k->£7k-Up toagedagedagedunderNET:18 orDwel-Vil-NET:andoverNET:more£55k£48k£41k£34k£28k£21k£14k£7k16-1811-155-105YesunderlinglageRuralFringe10kUrbanTotal
10103267189213218169547711912896283720161821984084018091007Unweighted base
181436811992092051435384126134105299707151882033984088061009Weighted base
1161933721008657244253433611431377379175174349428NET: Important58%46%53%41%36%48%42%40%46%50%42%32%34%38%44%45%39%39%44%43%43%42%
-167242819134132096317522426433780106Very important (+2)-4%16%9%12%13%9%9%7%16%16%7%6%10%11%13%13%13%11%9%10%11%
11613264872674421293234298323854953132137269322Quite important (+1)58%42%37%32%24%35%33%31%39%34%26%25%28%28%34%32%26%26%33%34%33%32%
23102882797760183742614111525868186151137288374Neither important (0)12%19%29%34%41%38%38%42%33%45%33%46%39%38%37%38%43%43%38%34%36%37%nor unimportant
1241624211819831413143290-21214260102123Quite unimportant (-1)7%16%12%20%12%10%9%13%15%3%11%10%13%11%13%-11%10%10%15%13%12%
432316820432179828412131525285368Very unimportant (-2)23%19%7%3%8%4%10%3%6%2%14%7%7%9%6%17%7%8%6%7%7%7%
557193930392311531222160131234366788155191NET: Unimportant29%36%18%24%20%14%19%16%21%6%25%17%20%20%19%17%18%18%17%22%19%19%
---26-33---77105-11681415Don't know---2%3%-2%2%---5%7%3%1%-**2%2%2%1%
0.07-0.050.430.230.210.430.230.310.250.570.200.170.130.200.310.250.270.260.320.240.280.28Mean
1.281.271.110.991.070.981.080.921.000.881.240.961.001.081.021.251.051.061.021.051.031.04Standard deviation0.400.400.200.120.080.070.070.070.140.100.110.090.100.070.040.310.080.080.050.050.040.03Standard error
Page 139
Brassica Vegetables SurveyONLINE Fieldwork: 19th-20th November 2014
Absolutes/col percents
Table 139Q.6 How important or unimportant is each of the following factors when considering purchasing vegetables?Base: All respondents who eat vegetablesWhether vegetables are locally sourced
Prepared by Populus

Marital StatusWhich of the following ITV regions do you live in?NET:Mar-ried/
NET:CivilWid-part-owed/ner-separ-Civilship/ated/CoPart-coWest-
Div-Separ-Wid-div-Hab-ner-Mar-hab-York-count-WalesTyneScot-Meri-Gran-Gram-Cent-orcedatedowedorceditingshiprieditingSingleshirery& WestTeestishdianLondonadapianralAngliaTotal
97124014914414445603248572754337798186110132101231007Unweighted base
83114213614215451608261543149428382199114136101061009Weighted base
455166669719727487331022194732664351557428NET: Important55%43%37%48%49%49%44%45%34%61%32%46%44%57%38%33%38%38%52%54%42%
93719101566720715699191117110106Very important (+2)11%31%15%14%7%4%12%11%8%12%5%10%14%11%11%9%10%13%7%10%11%
3619475971412076726917133823473234547322Quite important (+1)44%12%22%34%42%45%31%34%26%49%28%35%31%46%28%24%28%25%45%44%32%
284164747217822799121321102635913750435374Neither important (0)33%33%38%35%33%17%39%37%38%23%43%43%25%32%43%46%32%37%39%33%37%nor unimportant
631019145304954632861219192119123Quite unimportant (-1)7%24%25%14%10%34%7%8%21%10%9%4%20%7%14%9%17%15%10%9%12%
4--48-414915341513191213-368Very unimportant (-2)5%--3%6%-9%8%6%5%12%3%11%1%4%9%10%10%-3%7%
103102322571986987313715383134112191NET: Unimportant12%24%25%17%16%34%16%16%27%16%22%7%31%8%18%19%27%25%10%12%19%
----3-695-12-3-43*-115Don't know----2%-1%1%2%-3%5%-3%-2%3%*-1%1%
0.490.500.280.420.360.190.320.320.090.530.030.490.160.600.270.150.110.160.490.490.28Mean
0.961.211.021.000.970.991.071.051.011.021.050.871.230.840.971.051.141.130.800.901.04Standard deviation0.100.350.160.080.080.270.050.040.060.140.210.120.210.100.100.080.110.100.250.080.03Standard error
Page 140
Brassica Vegetables SurveyONLINE Fieldwork: 19th-20th November 2014
Absolutes/col percents
Table 140Q.6 How important or unimportant is each of the following factors when considering purchasing vegetables?Base: All respondents who eat vegetablesWhether vegetables are locally sourced
Prepared by Populus

Which of the following cities do you live in, or nearest to?None ofPly-South-Brigh-MiltonBirm-Nott-Liver-Manch-Shef-New-Edin-theseCardiffmouthBristolamptonLondonOxfordtonKeynesNorwichinghaminghampoolesterfieldHullLeedscastleburghGlasgowTotal
774336314122114213562754937732812453334401007Unweighted base
693829353223014212755884736743411454238451009Weighted base
36182018108467832311512317622182025428NET: Important52%49%69%50%32%37%47%36%30%59%35%32%34%41%22%54%48%44%52%57%42%
1244242141178355237625106Very important (+2)18%11%15%7%12%9%26%4%4%13%9%7%14%7%6%24%15%14%5%11%11%
231416157633772523127265315131821322Quite important (+1)34%37%54%43%21%27%21%32%27%47%26%25%20%35%16%30%33%30%48%46%32%
18145111510131112153420171922314121116374Neither important (0)26%38%16%31%46%44%24%54%45%27%39%42%49%25%66%30%31%28%29%37%37%nor unimportant
512452331641311316319733123Quite unimportant (-1)8%3%6%11%16%10%25%4%23%7%15%23%8%22%8%12%19%17%8%6%12%
1012221911*291261*151-68Very unimportant (-2)14%4%9%5%6%8%4%7%1%4%10%3%6%8%4%4%2%11%3%-7%
153467414276231252242101243191NET: Unimportant22%7%14%16%22%18%29%11%24%11%26%26%15%30%12%16%21%28%11%6%19%
-2-1-4---1*-13----3-15Don't know-6%-3%-2%---2%*-2%3%----7%-1%
0.330.520.620.360.170.200.390.220.080.580.080.110.280.100.130.580.400.180.460.610.28Mean
1.270.911.100.981.041.021.270.870.850.961.100.941.041.110.801.161.041.210.860.771.04Standard deviation0.140.140.180.180.160.070.340.190.140.120.130.130.170.130.150.330.150.210.150.120.03Standard error
Page 141
Brassica Vegetables SurveyONLINE Fieldwork: 19th-20th November 2014
Absolutes/col percents
Table 141Q.6 How important or unimportant is each of the following factors when considering purchasing vegetables?Base: All respondents who eat vegetablesWhether vegetables are locally sourced
Prepared by Populus

EmploymentSectorRegionSocial GradeAgeGender
York-shire
EastWest&Pri-SouthSouthEast-Mid-Mid-Humb-NorthNorthScot-vatePublicWestEastLondonernWaleslandslandsersideWestEastlandDEC2C1AB65+55-6445-5435-4425-3418-24FemaleMaleTotal
41811896155116120577576871093284259210314224226176197188129914775301007Unweighted base
438127911421311015171909011140912392202792702201501801701691195144951009Weighted base
2057454695257284439404617521211101401271227793887146266232498NET: Important47%59%59%49%40%57%55%63%43%44%41%42%57%51%50%50%47%56%51%52%52%42%39%52%47%49%
4819171616108914131371436333334332131271498451135Very important (+2)11%15%19%11%12%9%16%12%15%14%12%18%15%15%15%12%12%15%14%17%16%8%8%16%10%13%
158563754374820362527331038867710793895762625737182181363Quite important (+1)36%44%41%38%28%47%39%50%28%30%29%23%42%36%35%38%34%41%38%34%36%34%31%35%37%36%
15831235057291619333441172472799895784457575850184160344Neither important (0)36%24%26%35%43%28%32%27%37%38%37%43%27%30%36%35%35%35%29%32%34%35%42%36%32%34%nor unimportant
391881011103511111021118232627121415171915385593Quite unimportant (-1)9%14%9%7%8%10%6%7%12%12%9%4%12%7%10%9%10%5%9%8%10%11%13%7%11%9%
28341273126511512071516815156124203959Very unimportant (-2)6%3%5%9%6%3%3%3%7%6%9%11%1%9%3%5%6%3%10%8%3%7%3%4%8%6%
67221322191448171621612383041432029302331195894152NET: Unimportant15%17%14%16%14%13%9%11%19%18%19%16%13%16%13%15%16%9%19%17%13%18%16%11%19%15%
7-1-412-*-3-371151--29451015Don't know2%-1%-3%1%5%-*-3%-3%3%**2%*--1%5%3%1%2%1%
0.370.540.600.350.330.500.630.610.330.340.260.330.590.420.490.420.380.580.360.440.520.260.280.540.310.42Mean
1.011.001.041.061.000.930.940.921.101.061.111.170.941.110.971.001.030.931.141.120.991.030.920.981.061.03Standard deviation0.050.090.110.080.090.090.130.110.130.110.110.210.100.070.070.060.070.060.090.080.070.090.100.050.050.03Standard error
Page 142
Brassica Vegetables SurveyONLINE Fieldwork: 19th-20th November 2014
Absolutes/col percents
Table 142Q.6 How important or unimportant is each of the following factors when considering purchasing vegetables?Base: All respondents who eat vegetablesWhether vegetables are from a British farm (not necessarily local)
Prepared by Populus

What is the combined annual income of your household, prior toDo you have any children aged 18 orWhich of the following best describestax being deducted?under? If so, how old are they?where you live?
Nochild-Hamlet
Anyren& Iso-Urban>£55kAnyAnyAnyagedagedlatedTown- Pop.
or>£48k->£41k->£34k->£28k->£21k->£14k->£7k-Up toagedagedagedunderNET:18 orDwel-Vil-NET:andoverNET:more£55k£48k£41k£34k£28k£21k£14k£7k16-1811-155-105YesunderlinglageRuralFringe10kUrbanTotal
10103267189213218169547711912896283720161821984084018091007Unweighted base
181436811992092051435384126134105299707151882033984088061009Weighted base
104203788124946924486151441343649100109195194389498NET: Important54%27%55%46%44%59%46%48%46%58%49%38%42%45%52%64%53%54%49%48%48%49%
1-6624372328519241584392328315846104135Very important (+2)4%-17%7%12%18%11%20%9%23%19%11%7%14%13%19%15%15%14%11%13%13%
9414316486714120293737369127277178137147285363Quite important (+1)50%27%38%38%32%41%35%29%38%35%30%27%35%30%38%45%38%39%34%36%35%36%
38103476617354152932543910523846771142131273344Neither important (0)16%56%29%41%38%29%36%38%29%35%26%41%37%35%34%26%36%35%36%32%34%34%nor unimportant
124616142112114181593063-111133498293Quite unimportant (-1)7%16%11%7%8%7%10%8%21%5%14%11%8%10%9%-6%5%8%12%10%9%
4-23131114422146621372101122264859Very unimportant (-2)23%-5%4%7%5%7%3%4%2%11%5%6%7%5%11%5%5%6%6%6%6%
52692925351613632211551100220225575130152NET: Unimportant29%16%16%11%15%12%17%11%25%7%26%16%14%17%14%11%11%11%14%18%16%15%
---26-33---77105-11681415Don't know---2%3%-2%2%---5%7%3%1%-**2%2%2%1%
0.070.110.520.390.360.600.330.550.260.710.300.300.320.360.450.610.530.530.450.350.400.42Mean
1.320.681.070.891.031.021.041.001.030.961.250.990.971.081.011.160.991.001.031.051.041.03Standard deviation0.420.210.190.110.080.070.070.080.140.110.110.090.100.060.040.290.070.070.050.050.040.03Standard error
Page 143
Brassica Vegetables SurveyONLINE Fieldwork: 19th-20th November 2014
Absolutes/col percents
Table 143Q.6 How important or unimportant is each of the following factors when considering purchasing vegetables?Base: All respondents who eat vegetablesWhether vegetables are from a British farm (not necessarily local)
Prepared by Populus

Marital StatusWhich of the following ITV regions do you live in?NET:Mar-ried/
NET:CivilWid-part-owed/ner-separ-Civilship/ated/CoPart-coWest-
Div-Separ-Wid-div-Hab-ner-Mar-hab-York-count-WalesTyneScot-Meri-Gran-Gram-Cent-orcedatedowedorceditingshiprieditingSingleshirery& WestTeestishdianLondonadapianralAngliaTotal
97124014914414445603248572754337798186110132101231007Unweighted base
83114213614215451608261543149428382199114136101061009Weighted base
518197872622730511436928184644774870766498NET: Important61%74%46%57%51%39%50%50%44%67%29%57%42%56%54%39%42%52%65%62%49%
131722172698924113871210221321110135Very important (+2)16%12%17%16%12%16%15%15%9%21%10%17%17%15%12%11%12%16%15%9%13%
37712565531582169025620103434553549556363Quite important (+1)45%62%29%41%39%23%35%36%34%46%19%40%25%41%42%28%31%36%50%52%36%
251144147815721390141415172330824141228344Neither important (0)31%9%34%30%34%56%35%35%34%26%46%31%41%27%36%41%36%30%19%27%34%nor unimportant
4281412127403825221032111172893Quite unimportant (-1)5%17%19%10%9%5%6%7%15%3%16%4%5%12%3%11%9%13%16%8%9%
3--37-35411422151515117-359Very unimportant (-2)4%--2%5%-8%7%5%4%6%3%11%1%6%8%9%5%-3%6%
728171916281524737118362125211152NET: Unimportant9%17%19%13%13%5%14%13%20%7%22%7%16%14%10%18%18%18%16%10%15%
----3-695-12-3-43*-115Don't know----2%-1%1%2%-3%5%-3%-2%3%*-1%1%
0.650.680.440.590.460.510.450.450.280.760.130.670.330.570.500.250.270.440.630.590.42Mean
0.940.941.000.960.980.851.071.051.010.971.020.931.170.950.981.051.101.070.970.871.03Standard deviation0.100.270.160.080.080.230.050.040.060.130.200.130.200.110.100.080.110.090.310.080.03Standard error
Page 144
Brassica Vegetables SurveyONLINE Fieldwork: 19th-20th November 2014
Absolutes/col percents
Table 144Q.6 How important or unimportant is each of the following factors when considering purchasing vegetables?Base: All respondents who eat vegetablesWhether vegetables are from a British farm (not necessarily local)
Prepared by Populus

Which of the following cities do you live in, or nearest to?None ofPly-South-Brigh-MiltonBirm-Nott-Liver-Manch-Shef-New-Edin-theseCardiffmouthBristolamptonLondonOxfordtonKeynesNorwichinghaminghampoolesterfieldHullLeedscastleburghGlasgowTotal
774336314122114213562754937732812453334401007Unweighted base
693829353223014212755884736743411454238451009Weighted base
4123231717979910383825133214623181629498NET: Important60%61%77%50%53%42%64%44%35%70%44%53%35%44%42%54%52%42%43%65%49%
18766424422411666337737135Very important (+2)26%20%20%18%13%10%28%8%7%7%12%13%16%9%8%29%16%17%7%15%13%
23161711137357834281972612316101322363Quite important (+1)33%41%57%31%41%32%36%36%29%63%32%40%19%35%34%25%35%25%36%50%36%
1410412129231011103317172617213181310344Neither important (0)20%25%14%35%37%40%23%50%42%18%38%36%48%36%49%23%29%43%34%21%34%nor unimportant
61*322211541144721825693Quite unimportant (-1)9%4%1%9%5%9%9%4%18%7%12%8%11%9%5%7%17%4%14%13%9%
81212161112621612151-59Very unimportant (-2)11%4%7%3%5%7%4%3%5%3%6%4%3%8%4%16%2%11%3%-6%
143243382165166513329666152NET: Unimportant20%7%8%13%10%16%13%7%23%10%19%12%14%17%9%23%19%15%17%13%15%
-2-1-4---1*-13----3-15Don't know-6%-3%-2%---2%*-2%3%----7%-1%
0.540.740.820.540.510.290.750.420.150.640.310.500.350.270.370.440.470.340.320.670.42Mean
1.280.981.021.020.961.021.130.830.960.851.050.961.001.050.861.461.031.160.940.901.03Standard deviation0.150.150.170.190.150.070.300.180.160.110.120.140.170.120.160.420.150.200.160.140.03Standard error
Page 145
Brassica Vegetables SurveyONLINE Fieldwork: 19th-20th November 2014
Absolutes/col percents
Table 145Q.6 How important or unimportant is each of the following factors when considering purchasing vegetables?Base: All respondents who eat vegetablesWhether vegetables are from a British farm (not necessarily local)
Prepared by Populus

EmploymentSectorRegionSocial GradeAgeGender
York-shire
EastWest&Pri-SouthSouthEast-Mid-Mid-Humb-NorthNorthScot-vatePublicWestEastLondonernWaleslandslandsersideWestEastlandDEC2C1AB65+55-6445-5435-4425-3418-24FemaleMaleTotal
41811896155116120577576871093284259210314224226176197188129914775301007Unweighted base
438127911421311015171909011140912392202792702201501801701691195144951009Weighted base
39211585131108944666848497398021221124924221014617015714190472442914NET: Important89%91%93%92%82%93%92%93%94%93%87%97%88%89%96%89%90%96%98%94%92%83%76%92%89%91%
24280518170542639605351245512113915914512089109959753327237564Very important (+2)55%63%56%57%54%53%52%55%66%59%46%58%60%50%63%57%54%55%60%60%56%57%44%64%48%56%
15036344938402027253045162591729097905761614437145205350Quite important (+1)34%28%37%35%29%40%40%39%27%33%41%39%28%38%33%32%36%41%38%34%36%26%31%28%41%35%
36114102062455917215252174992024324172Neither important (0)8%9%4%7%15%6%4%6%6%5%8%1%8%9%2%9%8%3%2%5%5%12%20%6%8%7%nor unimportant
4-111--*-1-11*221---222245Quite unimportant (-1)1%-1%1%1%--1%-1%-2%1%*1%1%*---1%1%1%*1%1%
2-*-*----13--11213-*1--325Very unimportant (-2)*-*-*----1%2%--**1%*1%-*1%--1%**
5-111--*-231113423-*3225510NET: Unimportant1%-1%1%1%--1%-2%2%2%1%1%1%1%1%1%-*2%1%1%1%1%1%
5-1-212-*-2-35115---2645712Don't know1%-1%-2%1%5%-*-2%-3%2%**2%---1%4%3%1%1%1%
1.451.541.491.491.371.481.501.481.611.481.311.541.511.411.581.441.451.481.571.541.471.451.221.561.381.47Mean
0.720.660.670.670.790.610.580.640.600.750.820.610.700.690.630.740.700.690.540.620.720.760.820.680.700.70Standard deviation0.040.060.070.050.070.060.080.070.070.080.080.110.080.040.040.040.050.050.040.040.050.070.090.030.030.02Standard error
Page 146
Brassica Vegetables SurveyONLINE Fieldwork: 19th-20th November 2014
Absolutes/col percents
Table 146Q.6 How important or unimportant is each of the following factors when considering purchasing vegetables?Base: All respondents who eat vegetablesPersonal taste
Prepared by Populus

What is the combined annual income of your household, prior toDo you have any children aged 18 orWhich of the following best describestax being deducted?under? If so, how old are they?where you live?
Nochild-Hamlet
Anyren& Iso-Urban>£55kAnyAnyAnyagedagedlatedTown- Pop.
or>£48k->£41k->£34k->£28k->£21k->£14k->£7k-Up toagedagedagedunderNET:18 orDwel-Vil-NET:andoverNET:more£55k£48k£41k£34k£28k£21k£14k£7k16-1811-155-105YesunderlinglageRuralFringe10kUrbanTotal
10103267189213218169547711912896283720161821984084018091007Unweighted base
181436811992092051435384126134105299707151882033984088061009Weighted base
1811347518119718612843791131117925765614170184361369730914NET: Important100%81%93%92%91%94%91%90%82%95%90%83%76%86%93%97%90%91%91%90%91%91%
7714501171241177826596965471614021397109218236455564Very important (+2)39%47%39%61%59%59%57%55%49%70%55%49%44%54%57%85%51%54%55%58%56%56%
11520256472695017204546339625427375143132276350Quite important (+1)61%35%55%31%32%35%34%35%32%24%35%34%31%32%36%12%39%37%36%32%34%35%
-32411121510841016183141*161727295672Neither important (0)-19%7%5%5%6%7%7%16%5%8%12%17%10%6%3%9%8%7%7%7%7%nor unimportant
----1112111--13---4155Quite unimportant (-1)----***1%1%1%1%--**---1%*1%1%
---13-*-*-1*-13-22*335Very unimportant (-2)---2%1%-*-1%-1%*-**-1%1%*1%**
---13112113*-37-2244910NET: Unimportant---2%2%*1%1%2%1%2%*-1%1%-1%1%1%1%1%1%
---23-33---6793---661212Don't know---2%2%-1%2%---5%7%3%*---2%1%1%1%
1.391.281.321.531.501.531.491.471.281.641.421.371.291.421.491.831.401.431.461.491.481.47Mean
0.500.790.600.740.740.620.670.670.850.610.770.730.770.740.670.460.720.710.680.710.690.70Standard deviation0.160.250.110.090.050.040.050.050.120.070.070.070.080.040.030.110.050.050.030.040.020.02Standard error
Page 147
Brassica Vegetables SurveyONLINE Fieldwork: 19th-20th November 2014
Absolutes/col percents
Table 147Q.6 How important or unimportant is each of the following factors when considering purchasing vegetables?Base: All respondents who eat vegetablesPersonal taste
Prepared by Populus

Marital StatusWhich of the following ITV regions do you live in?NET:Mar-ried/
NET:CivilWid-part-owed/ner-separ-Civilship/ated/CoPart-coWest-
Div-Separ-Wid-div-Hab-ner-Mar-hab-York-count-WalesTyneScot-Meri-Gran-Gram-Cent-orcedatedowedorceditingshiprieditingSingleshirery& WestTeestishdianLondonadapianralAngliaTotal
97124014914414445603248572754337798186110132101231007Unweighted base
83114213614215451608261543149428382199114136101061009Weighted base
81104213312811412552228522845417374172101125899914NET: Important97%94%100%98%90%77%91%91%87%97%89%91%97%88%90%86%89%92%83%93%91%
561022878272473361403119252650481095281557564Very important (+2)67%89%52%64%58%48%55%55%54%57%62%51%61%61%59%55%45%60%52%54%56%
25120464641652168821920152226635044342350Quite important (+1)30%5%48%34%32%29%37%36%34%40%28%40%36%27%31%32%43%32%31%39%35%
31-383314227122167238102772Neither important (0)3%6%-2%5%23%7%7%10%2%6%4%1%7%9%11%7%7%17%6%7%nor unimportant
----3-131-1-1111-*--5Quite unimportant (-1)----2%-*1%*-2%-1%1%1%1%-*--1%
------331*-----*3---5Very unimportant (-2)------1%1%1%1%-----*2%---*
----3-462*1-11123*--10NET: Unimportant----2%-1%1%1%1%2%-1%1%1%1%2%*--1%
----3-474-12-3-22*-112Don't know----2%-1%1%1%-3%5%-3%-1%2%*-1%1%
1.641.831.521.621.501.251.461.461.411.521.541.501.571.531.481.421.331.521.351.481.47Mean
0.550.540.510.540.690.830.700.700.740.630.710.580.610.700.700.740.800.640.800.620.70Standard deviation0.060.160.080.040.060.220.030.030.050.080.140.080.110.080.070.050.080.060.250.060.02Standard error
Page 148
Brassica Vegetables SurveyONLINE Fieldwork: 19th-20th November 2014
Absolutes/col percents
Table 148Q.6 How important or unimportant is each of the following factors when considering purchasing vegetables?Base: All respondents who eat vegetablesPersonal taste
Prepared by Populus

Which of the following cities do you live in, or nearest to?None ofPly-South-Brigh-MiltonBirm-Nott-Liver-Manch-Shef-New-Edin-theseCardiffmouthBristolamptonLondonOxfordtonKeynesNorwichinghaminghampoolesterfieldHullLeedscastleburghGlasgowTotal
774336314122114213562754937732812453334401007Unweighted base
693829353223014212755884736743411454238451009Weighted base
6433283228202131825508145316530944413539914NET: Important92%89%97%92%88%88%92%87%94%91%92%95%88%88%89%88%97%99%92%88%91%
432015222112791212295630172916526262128564Very important (+2)63%54%50%64%64%55%63%59%44%52%63%64%48%39%47%44%57%63%56%64%56%
201314108744614212515143614518151411350Quite important (+1)29%35%46%28%24%32%28%28%50%39%29%31%40%49%42%44%40%36%36%24%35%
52*1424*31472454-1--572Neither important (0)7%5%2%4%12%11%3%13%5%8%7%5%10%7%11%-2%--12%7%nor unimportant
1--1-11-*-------11*-5Quite unimportant (-1)1%--2%-1%5%-1%-------1%1%1%-1%
--*--*-------3-1----5Very unimportant (-2)--2%--*-------3%-12%----*
1-*1-21-*----3-111*-10NET: Unimportant1%-2%2%-1%5%-1%----3%-12%1%1%1%-1%
-2-1-2---1*-12----3-12Don't know-6%-3%-1%---1%*-2%2%----7%-1%
1.541.521.441.581.531.431.501.461.361.451.561.591.391.221.361.081.531.601.571.521.47Mean
0.670.610.690.670.710.730.820.730.660.640.630.590.670.870.681.290.600.580.570.710.70Standard deviation0.080.090.120.120.110.050.220.160.110.080.070.080.110.100.130.370.090.100.100.110.02Standard error
Page 149
Brassica Vegetables SurveyONLINE Fieldwork: 19th-20th November 2014
Absolutes/col percents
Table 149Q.6 How important or unimportant is each of the following factors when considering purchasing vegetables?Base: All respondents who eat vegetablesPersonal taste
Prepared by Populus

EmploymentSectorRegionSocial GradeAgeGender
York-shire
EastWest&Pri-SouthSouthEast-Mid-Mid-Humb-NorthNorthScot-vatePublicWestEastLondonernWaleslandslandsersideWestEastlandDEC2C1AB65+55-6445-5435-4425-3418-24FemaleMaleTotal
41811896155116120577576871093284259210314224226176197188129914775301007Unweighted base
438127911421311015171909011140912392202792702201501801701691195144951009Weighted base
2618659937859274656495225531341381651601341061231028446331265596NET: Important60%68%65%66%59%58%53%65%62%54%47%63%58%56%62%59%59%61%71%69%60%50%39%64%54%59%
9632112943137112881312194242466338344736221511380194Very important (+2)22%26%12%20%33%13%13%16%31%9%12%31%20%18%19%16%23%17%23%26%21%13%13%22%16%19%
165544864354520352841391334919511997977276666131218185402Quite important (+1)38%43%53%45%27%45%40%49%31%45%35%32%38%38%43%42%36%44%48%42%39%36%26%42%37%40%
13630203543331917313638132072598687693139555554145160304Neither important (0)31%24%21%25%33%32%37%25%34%40%34%32%22%30%27%31%32%31%21%22%33%32%45%28%32%30%nor unimportant
16777362433511113101812117961010223052Quite unimportant (-1)4%5%7%5%2%6%4%6%3%4%4%2%12%6%4%6%4%5%5%5%3%6%8%4%6%5%
174473212-213-5131386558512493039Very unimportant (-2)4%3%5%5%3%2%1%3%-2%11%-5%5%6%3%2%2%4%5%3%7%3%2%6%4%
331011147837351711626222617161217112114316091NET: Unimportant8%8%12%10%5%8%5%10%3%6%16%2%17%11%10%9%6%7%8%10%7%12%11%6%12%9%
8-1-4121*-32371361--29671117Don't know2%-2%-3%1%5%1%*-3%4%3%3%*1%2%*--1%6%5%1%2%2%
0.710.830.610.710.870.620.620.680.900.550.330.960.580.600.660.640.760.690.820.810.730.460.390.800.530.67Mean
0.980.970.961.001.000.870.830.930.890.801.130.861.121.021.020.930.940.890.961.030.951.040.940.901.040.98Standard deviation0.050.090.100.080.090.080.110.110.100.090.110.150.120.060.070.050.060.060.070.070.070.090.100.040.050.03Standard error
Page 150
Brassica Vegetables SurveyONLINE Fieldwork: 19th-20th November 2014
Absolutes/col percents
Table 150Q.6 How important or unimportant is each of the following factors when considering purchasing vegetables?Base: All respondents who eat vegetablesWhether vegetable is in season
Prepared by Populus

What is the combined annual income of your household, prior toDo you have any children aged 18 orWhich of the following best describestax being deducted?under? If so, how old are they?where you live?
Nochild-Hamlet
Anyren& Iso-Urban>£55kAnyAnyAnyagedagedlatedTown- Pop.
or>£48k->£41k->£34k->£28k->£21k->£14k->£7k-Up toagedagedagedunderNET:18 orDwel-Vil-NET:andoverNET:more£55k£48k£41k£34k£28k£21k£14k£7k16-1811-155-105YesunderlinglageRuralFringe10kUrbanTotal
10103267189213218169547711912896283720161821984084018091007Unweighted base
181436811992092051435384126134105299707151882033984088061009Weighted base
136205011614011083275976754917741910112122229245474596NET: Important73%41%55%61%58%67%54%58%51%70%61%56%46%59%59%69%59%60%58%60%59%59%
225144442353573030271465129229317093163194Very important (+2)10%16%13%17%22%20%17%24%13%36%24%20%13%22%18%15%15%15%17%23%20%19%
113153672987548202946483511229088391160152312402Quite important (+1)63%25%42%44%36%47%37%34%38%34%37%36%33%37%41%54%44%45%40%37%39%40%
4814265255684520213940388621646265119120239304Neither important (0)24%59%39%32%26%26%33%31%37%26%31%30%36%29%31%25%33%32%30%29%30%30%nor unimportant
--131310117326461240-6623234652Quite unimportant (-1)--3%4%7%5%5%5%6%3%5%3%6%4%6%-3%3%6%6%6%5%
1-1112411431475132517820113139Very unimportant (-2)4%-2%1%6%2%5%3%6%1%3%5%5%5%4%6%4%4%5%3%4%4%
1-24251421116311111125661131443347791NET: Unimportant4%-5%5%13%7%10%8%12%4%9%8%11%8%9%6%7%7%11%8%10%9%
---26-64---87117-11881617Don't know---2%3%-3%3%---6%7%4%1%-1%1%2%2%2%2%
0.760.570.620.730.640.790.570.730.461.010.730.660.470.700.650.720.640.650.600.740.670.67Mean
0.800.780.840.821.100.881.011.000.990.921.001.030.991.010.960.960.920.921.010.970.990.98Standard deviation0.250.250.150.100.080.060.070.080.130.100.090.090.100.060.040.240.070.070.050.050.040.03Standard error
Page 151
Brassica Vegetables SurveyONLINE Fieldwork: 19th-20th November 2014
Absolutes/col percents
Table 151Q.6 How important or unimportant is each of the following factors when considering purchasing vegetables?Base: All respondents who eat vegetablesWhether vegetable is in season
Prepared by Populus

Marital StatusWhich of the following ITV regions do you live in?NET:Mar-ried/
NET:CivilWid-part-owed/ner-separ-Civilship/ated/CoPart-coWest-
Div-Separ-Wid-div-Hab-ner-Mar-hab-York-count-WalesTyneScot-Meri-Gran-Gram-Cent-orcedatedowedorceditingshiprieditingSingleshirery& WestTeestishdianLondonadapianralAngliaTotal
97124014914414445603248572754337798186110132101231007Unweighted base
83114213614215451608261543149428382199114136101061009Weighted base
56728917452943731313913262645501235687863596NET: Important68%61%66%67%52%35%65%61%50%72%41%52%63%55%61%62%49%64%83%59%59%
14462430110113237917121614551634116194Very important (+2)17%37%14%18%21%7%22%22%14%16%5%14%30%20%17%28%14%25%7%15%19%
423226744419324193301119142936684153847402Quite important (+1)51%24%52%49%31%28%43%40%36%56%36%39%33%35%44%34%36%39%76%44%40%
21383151712418290131018142026573740133304Neither important (0)25%23%19%23%36%49%28%30%34%24%33%37%33%24%31%29%33%29%8%31%30%nor unimportant
3251042172418242-115655-752Quite unimportant (-1)4%16%11%7%3%16%4%4%7%4%11%4%-14%5%3%4%4%-7%5%
3-247-111816*41-4291321239Very unimportant (-2)3%-4%3%5%-2%3%6%1%12%1%-4%2%4%11%2%10%2%4%
62614122284235373-156151771991NET: Unimportant7%16%15%10%8%16%6%7%13%5%24%6%-18%7%7%15%5%10%9%9%
----6-6115-1223*431-117Don't know----4%-1%2%2%-3%5%4%3%1%2%3%1%-1%2%
0.740.830.600.710.620.260.800.750.460.820.100.620.960.540.680.800.380.830.700.650.67Mean
0.901.151.020.951.030.830.920.951.030.781.100.840.821.100.891.031.140.911.010.890.98Standard deviation0.090.330.160.080.090.220.040.040.070.100.220.120.140.130.090.080.110.080.320.080.03Standard error
Page 152
Brassica Vegetables SurveyONLINE Fieldwork: 19th-20th November 2014
Absolutes/col percents
Table 152Q.6 How important or unimportant is each of the following factors when considering purchasing vegetables?Base: All respondents who eat vegetablesWhether vegetable is in season
Prepared by Populus

Which of the following cities do you live in, or nearest to?None ofPly-South-Brigh-MiltonBirm-Nott-Liver-Manch-Shef-New-Edin-theseCardiffmouthBristolamptonLondonOxfordtonKeynesNorwichinghaminghampoolesterfieldHullLeedscastleburghGlasgowTotal
774336314122114213562754937732812453334401007Unweighted base
693829353223014212755884736743411454238451009Weighted base
34191927191467159355525173620629282227596NET: Important49%51%66%78%60%63%49%73%33%65%62%52%48%49%59%58%65%67%58%60%59%
10662565262102544102171278194Very important (+2)14%15%21%5%14%28%13%28%6%18%29%9%11%14%6%7%16%30%20%18%19%
241313261581597263020132618522161419402Quite important (+1)34%36%45%74%46%35%36%45%27%47%34%43%37%35%53%51%49%37%38%42%40%
2113931064651317301714251151412610304Neither important (0)30%35%30%8%33%28%42%23%46%30%34%36%40%33%32%42%32%29%16%23%30%nor unimportant
7213281-4133132-2-5652Quite unimportant (-1)11%6%3%8%5%3%5%-13%3%4%7%4%4%5%-3%-12%13%5%
71*1*9111--2281---3239Very unimportant (-2)10%2%2%3%1%4%4%4%5%--5%5%10%4%---7%4%4%
143142161151353113-2-7791NET: Unimportant21%7%4%11%6%7%9%4%18%3%4%11%9%15%9%-3%-19%17%9%
-2-1*4--11*-13---23-17Don't know-6%-3%1%2%--3%2%*-2%3%---4%7%-2%
0.320.620.820.710.680.820.490.950.160.820.880.450.460.390.510.650.781.010.550.570.67Mean
1.160.900.860.820.831.010.960.930.940.760.870.940.951.130.860.640.760.791.201.060.98Standard deviation0.130.140.140.150.130.070.260.200.160.100.100.130.160.130.160.180.110.140.210.170.03Standard error
Page 153
Brassica Vegetables SurveyONLINE Fieldwork: 19th-20th November 2014
Absolutes/col percents
Table 153Q.6 How important or unimportant is each of the following factors when considering purchasing vegetables?Base: All respondents who eat vegetablesWhether vegetable is in season
Prepared by Populus

EmploymentSectorRegionSocial GradeAgeGender
York-shire
EastWest&Pri-SouthSouthEast-Mid-Mid-Humb-NorthNorthScot-vatePublicWestEastLondonernWaleslandslandsersideWestEastlandDEC2C1AB65+55-6445-5435-4425-3418-24FemaleMaleTotal
41811896155116120577576871093284259210314224226176197188129914775301007Unweighted base
438127911421311015171909011140912392202792702201501801701691195144951009Weighted base
341907011392764153717770327118117520021018011714113311481403364766NET: Important78%71%76%80%70%76%81%74%80%86%63%80%78%76%80%72%78%82%78%78%78%67%68%78%73%76%
16252305949241623413527183784909096795876546033205154360Very important (+2)37%41%33%42%37%23%32%33%46%39%24%44%41%35%41%32%35%36%39%42%32%36%27%40%31%36%
17938395444532529304243153497851101151015965795448198209407Quite important (+1)41%30%43%38%33%52%49%41%33%46%39%37%37%40%39%39%42%46%40%36%46%32%40%38%42%40%
612513222515411141130612352463403122291836277290162Neither important (0)14%19%14%15%19%15%7%16%16%12%27%16%13%15%11%23%15%14%14%16%11%21%23%14%18%16%nor unimportant
158458435222148101012487785231840Quite unimportant (-1)3%6%4%3%6%4%7%7%2%2%2%3%5%3%5%4%5%2%5%4%4%5%5%4%4%4%
1443234*23-6111010424331022101525Very unimportant (-2)3%3%4%2%3%4%1%3%3%-5%1%1%4%5%1%1%2%2%2%6%1%2%2%3%3%
2912771184742825172014149111018118333366NET: Unimportant7%9%8%5%9%8%7%10%5%2%8%4%6%7%9%5%5%4%7%5%10%6%7%6%7%7%
712-212-*13-361251--2946915Don't know2%1%2%-2%1%5%-*1%3%-3%3%*1%2%*--1%5%3%1%2%1%
1.071.001.001.150.980.881.090.941.191.240.761.191.151.021.070.981.091.121.071.130.941.010.891.110.971.04Mean
0.971.061.000.921.030.950.881.020.960.731.040.890.921.011.050.910.870.860.960.931.070.970.940.950.960.96Standard deviation0.050.100.100.070.100.090.120.120.110.080.100.160.100.060.070.050.060.060.070.070.080.090.100.040.040.03Standard error
Page 154
Brassica Vegetables SurveyONLINE Fieldwork: 19th-20th November 2014
Absolutes/col percents
Table 154Q.6 How important or unimportant is each of the following factors when considering purchasing vegetables?Base: All respondents who eat vegetablesAppearance of vegetables in the shop
Prepared by Populus

What is the combined annual income of your household, prior toDo you have any children aged 18 orWhich of the following best describestax being deducted?under? If so, how old are they?where you live?
Nochild-Hamlet
Anyren& Iso-Urban>£55kAnyAnyAnyagedagedlatedTown- Pop.
or>£48k->£41k->£34k->£28k->£21k->£14k->£7k-Up toagedagedagedunderNET:18 orDwel-Vil-NET:andoverNET:more£55k£48k£41k£34k£28k£21k£14k£7k16-1811-155-105YesunderlinglageRuralFringe10kUrbanTotal
10103267189213218169547711912896283720161821984084018091007Unweighted base
181436811992092051435384126134105299707151882033984088061009Weighted base
168256315117215710235741001007623253213148160301305606766NET: Important86%58%68%78%76%82%76%72%66%88%80%74%72%77%75%85%79%79%75%75%75%76%
22153276847348203543452710525376572150138288360Very important (+2)11%17%43%39%38%40%35%34%37%42%34%33%26%35%36%46%34%35%38%34%36%36%
14693275898454153958554912727968389150168318407Quite important (+1)75%42%25%39%38%42%41%38%28%46%46%41%47%42%39%39%44%44%38%41%39%40%
-3892927333211618201739123130316666131162Neither important (0)-19%22%11%15%13%16%23%21%7%14%15%16%13%17%5%16%15%16%16%16%16%nor unimportant
23368283332439311789233240Quite unimportant (-1)10%23%8%8%4%1%4%2%6%4%1%3%3%3%4%6%4%4%2%6%4%4%
--1167414*632916*331572225Very unimportant (-2)--1%2%3%3%2%1%7%*4%3%2%3%2%3%1%1%4%2%3%3%
23381491257477518471101125305466NET: Unimportant10%23%9%9%7%4%6%3%14%5%6%6%4%6%7%10%5%6%6%7%7%7%
1--24133---77105-11771415Don't know4%--2%2%*2%2%---5%7%3%1%-**2%2%2%1%
0.910.521.011.081.071.151.061.030.821.261.031.050.991.071.031.181.071.081.051.011.031.04Mean
0.751.061.060.990.990.920.930.881.220.800.970.940.860.950.961.050.880.891.000.940.970.96Standard deviation0.250.340.190.120.070.060.060.070.170.090.090.080.090.060.040.260.070.060.050.050.030.03Standard error
Page 155
Brassica Vegetables SurveyONLINE Fieldwork: 19th-20th November 2014
Absolutes/col percents
Table 155Q.6 How important or unimportant is each of the following factors when considering purchasing vegetables?Base: All respondents who eat vegetablesAppearance of vegetables in the shop
Prepared by Populus

Marital StatusWhich of the following ITV regions do you live in?NET:Mar-ried/
NET:CivilWid-part-owed/ner-separ-Civilship/ated/CoPart-coWest-
Div-Separ-Wid-div-Hab-ner-Mar-hab-York-count-WalesTyneScot-Meri-Gran-Gram-Cent-orcedatedowedorceditingshiprieditingSingleshirery& WestTeestishdianLondonadapianralAngliaTotal
97124014914414445603248572754337798186110132101231007Unweighted base
83114213614215451608261543149428382199114136101061009Weighted base
659351101011136347418040193933646514975111977766NET: Important78%85%84%81%71%76%80%78%69%74%60%80%79%77%80%75%65%82%84%72%76%
28811464291712229018915193632763255128360Very important (+2)33%70%26%34%30%59%38%37%34%33%29%31%45%43%39%38%28%41%12%26%36%
372246358219125290221024142833734356749407Quite important (+1)45%14%58%47%41%16%42%41%35%41%31%49%34%34%40%37%37%41%73%46%40%
11151725362915499471115302816219162Neither important (0)14%8%11%12%18%20%14%15%21%16%30%7%17%13%18%15%24%12%16%18%16%nor unimportant
41-41011424123131411224-540Quite unimportant (-1)4%7%-3%7%4%3%4%4%5%3%7%2%5%1%6%2%3%-5%4%
3-252-79112**111565-425Very unimportant (-2)4%-4%4%1%-2%1%4%4%1%1%1%1%1%3%5%3%-3%3%
71291212133235142521789-966NET: Unimportant8%7%4%7%8%4%5%5%9%10%5%8%4%6%3%9%7%6%-9%7%
----4-6104-22-3-23*-115Don't know----3%-1%2%2%-5%5%-3%-1%3%*-1%1%
1.001.481.021.040.941.311.131.090.920.930.871.081.191.161.151.040.831.130.960.871.04Mean
1.000.960.890.960.950.970.880.901.061.050.950.880.910.950.861.011.050.970.550.980.96Standard deviation0.100.280.140.080.080.260.040.040.070.140.190.120.160.110.090.070.100.080.170.090.03Standard error
Page 156
Brassica Vegetables SurveyONLINE Fieldwork: 19th-20th November 2014
Absolutes/col percents
Table 156Q.6 How important or unimportant is each of the following factors when considering purchasing vegetables?Base: All respondents who eat vegetablesAppearance of vegetables in the shop
Prepared by Populus

Which of the following cities do you live in, or nearest to?None ofPly-South-Brigh-MiltonBirm-Nott-Liver-Manch-Shef-New-Edin-theseCardiffmouthBristolamptonLondonOxfordtonKeynesNorwichinghaminghampoolesterfieldHullLeedscastleburghGlasgowTotal
774336314122114213562754937732812453334401007Unweighted base
693829353223014212755884736743411454238451009Weighted base
49292028251761215203871353042241042352639766NET: Important70%77%69%79%80%76%89%73%72%70%81%74%85%57%71%92%93%82%69%87%76%
18141191589687163915121511319191520360Very important (+2)26%36%37%25%46%39%46%39%24%29%44%31%33%21%34%28%41%45%39%45%36%
311591911876713233220192712723161119407Quite important (+1)45%41%32%53%33%38%43%34%48%41%36%43%52%37%37%64%52%37%29%43%40%
1345353625312138323812674162Neither important (0)18%10%17%10%17%16%11%23%11%22%14%17%8%31%25%8%6%14%19%9%16%nor unimportant
6222-11-13122121-112240Quite unimportant (-1)8%6%6%6%-5%-4%12%2%2%5%2%2%3%-2%2%5%4%4%
2*2*15--123215---1--25Very unimportant (-2)3%1%8%1%4%2%--5%3%3%4%3%7%---1%--3%
8343116-15344271-122266NET: Unimportant11%7%14%7%4%7%-4%17%5%5%9%5%9%3%-2%4%5%4%7%
-2-2-2---1*-131---3-15Don't know-6%-4%-1%---2%*-2%3%2%---7%-1%
0.821.120.841.001.181.071.351.090.750.931.180.931.130.641.041.211.321.221.111.281.04Mean
1.010.931.230.870.990.970.700.891.120.950.951.020.871.070.850.590.660.880.930.780.96Standard deviation0.110.140.210.160.150.070.190.200.190.120.110.150.150.130.160.170.100.150.160.120.03Standard error
Page 157
Brassica Vegetables SurveyONLINE Fieldwork: 19th-20th November 2014
Absolutes/col percents
Table 157Q.6 How important or unimportant is each of the following factors when considering purchasing vegetables?Base: All respondents who eat vegetablesAppearance of vegetables in the shop
Prepared by Populus

EmploymentSectorRegionSocial GradeAgeGender
York-shire
EastWest&Pri-SouthSouthEast-Mid-Mid-Humb-NorthNorthScot-vatePublicWestEastLondonernWaleslandslandsersideWestEastlandDEC2C1AB65+55-6445-5435-4425-3418-24FemaleMaleTotal
41811896155116120577576871093284259210314224226176197188129914775301007Unweighted base
438127911421311015171909011140912392202792702201501801701691195144951009Weighted base
992211293115691716228164039485622203339393010972182NET: Important23%18%12%21%24%15%13%12%19%18%20%20%18%17%18%17%21%10%13%18%23%23%25%21%15%18%
35829111427443698112442891811351853Very important (+2)8%6%3%6%8%1%8%3%7%5%3%7%6%4%4%4%9%2%1%5%5%11%9%7%4%5%
6514820201427111218511313136321818252921197554129Quite important (+1)15%11%9%14%15%14%5%10%12%13%17%13%12%13%14%13%12%8%12%14%17%12%16%15%11%13%
1645338585836223429373513318279128101975563646448202188391Neither important (0)37%42%41%41%44%36%44%48%32%41%32%32%34%34%36%46%38%44%37%35%38%38%40%39%38%39%nor unimportant
8932182519291216212127102252554865572941353127113107220Quite unimportant (-1)20%25%20%18%14%29%23%23%23%23%24%25%24%22%25%17%24%26%19%23%21%18%23%22%22%22%
7920232920188122216249205747554243454330271183118201Very unimportant (-2)18%15%25%21%15%18%15%17%25%18%21%23%22%24%21%20%16%20%30%24%18%16%9%16%24%20%
1685242553847192843375019411091021031071017484655838196224420NET: Unimportant38%41%46%39%29%47%39%40%48%41%45%48%45%46%46%37%40%46%49%47%38%34%32%38%45%42%
7-1-422-*-3-3711611-29461015Don't know2%-1%-3%2%5%-*-3%-3%3%**2%**-1%5%3%1%2%2%
-0.26-0.32-0.57-0.33-0.12-0.49-0.35-0.41-0.47-0.36-0.44-0.45-0.44-0.50-0.46-0.35-0.27-0.54-0.65-0.48-0.28-0.18-0.08-0.27-0.52-0.39Mean
1.161.071.061.141.121.001.080.971.201.071.121.191.151.121.091.061.140.961.081.131.121.201.081.111.091.11Standard deviation0.060.100.110.090.110.090.140.110.140.110.110.210.130.070.080.060.080.060.080.080.080.110.120.050.050.04Standard error
Page 158
Brassica Vegetables SurveyONLINE Fieldwork: 19th-20th November 2014
Absolutes/col percents
Table 158Q.6 How important or unimportant is each of the following factors when considering purchasing vegetables?Base: All respondents who eat vegetablesWhether vegetables are organic
Prepared by Populus

What is the combined annual income of your household, prior toDo you have any children aged 18 orWhich of the following best describestax being deducted?under? If so, how old are they?where you live?
Nochild-Hamlet
Anyren& Iso-Urban>£55kAnyAnyAnyagedagedlatedTown- Pop.
or>£48k->£41k->£34k->£28k->£21k->£14k->£7k-Up toagedagedagedunderNET:18 orDwel-Vil-NET:andoverNET:more£55k£48k£41k£34k£28k£21k£14k£7k16-1811-155-105YesunderlinglageRuralFringe10kUrbanTotal
10103267189213218169547711912896283720161821984084018091007Unweighted base
181436811992092051435384126134105299707151882033984088061009Weighted base
6141229444622102125242364117225277084155182NET: Important32%6%12%15%15%21%22%16%18%25%20%18%22%21%17%16%13%13%18%21%19%18%
-1251017117-356101636-9915294453Very important (+2)-6%4%7%5%8%5%5%-3%4%4%10%5%5%-5%4%4%7%5%5%
6-371927351510182018134880216195555111129Quite important (+1)32%-7%8%10%13%17%11%18%22%16%13%12%16%11%16%9%9%14%14%14%13%
36192673837666223342483610628548387145158304391Neither important (0)16%40%53%31%37%40%37%46%41%40%33%36%34%35%40%30%44%43%37%39%38%39%nor unimportant
2572442444624131926301864155249528781168220Quite unimportant (-1)11%35%19%30%21%21%23%17%24%23%21%23%17%21%22%17%26%26%22%20%21%22%
736184938322891033252156145630368976165201Very unimportant (-2)41%19%17%22%25%18%16%20%16%12%26%19%20%19%20%38%16%18%22%19%20%20%
98134291827852213059553912030088088176156333420NET: Unimportant52%54%36%52%46%39%38%36%41%35%47%41%37%40%42%54%42%43%44%38%41%42%
---26-43---77105-11691515Don't know---2%3%-2%2%---5%7%3%1%-**2%2%2%2%
-0.61-0.61-0.37-0.53-0.52-0.29-0.27-0.36-0.39-0.20-0.49-0.40-0.27-0.33-0.42-0.76-0.41-0.43-0.46-0.30-0.38-0.39Mean
1.341.041.011.141.131.151.091.080.971.021.161.091.231.131.091.161.011.021.111.141.131.11Standard deviation0.420.330.180.140.080.080.070.080.130.120.110.100.130.070.040.290.080.070.060.060.040.04Standard error
Page 159
Brassica Vegetables SurveyONLINE Fieldwork: 19th-20th November 2014
Absolutes/col percents
Table 159Q.6 How important or unimportant is each of the following factors when considering purchasing vegetables?Base: All respondents who eat vegetablesWhether vegetables are organic
Prepared by Populus

Marital StatusWhich of the following ITV regions do you live in?NET:Mar-ried/
NET:CivilWid-part-owed/ner-separ-Civilship/ated/CoPart-coWest-
Div-Separ-Wid-div-Hab-ner-Mar-hab-York-count-WalesTyneScot-Meri-Gran-Gram-Cent-orcedatedowedorceditingshiprieditingSingleshirery& WestTeestishdianLondonadapianralAngliaTotal
97124014914414445603248572754337798186110132101231007Unweighted base
83114213614215451608261543149428382199114136101061009Weighted base
123520271821105263671421412423117182NET: Important14%24%13%15%19%4%18%18%20%12%8%13%18%17%25%21%21%17%13%16%18%
11241511733161*43441569-353Very important (+2)1%6%5%3%11%4%4%5%6%2%1%8%7%5%5%7%5%6%-3%5%
11241612-65773652251017271815114129Quite important (+1)13%19%8%12%8%-14%13%14%10%7%5%11%12%20%13%16%11%13%13%13%
3531754526174232105301222132732833547541391Neither important (0)42%24%40%40%37%39%38%38%40%56%39%44%31%32%38%42%30%35%46%39%39%nor unimportant
181133125694125628811112212332932229220Quite unimportant (-1)21%7%30%23%18%42%21%21%24%15%25%23%26%26%14%17%25%24%21%28%22%
1957323329613138987111818382433217201Very unimportant (-2)23%45%17%23%23%15%21%22%15%17%26%15%25%21%22%19%21%24%20%16%20%
376206259819025799171618223930715365446420NET: Unimportant44%52%47%46%41%57%42%42%38%32%50%38%51%47%36%36%46%48%40%43%42%
----4-6105-12-3-43*-215Don't know----3%-1%2%2%-3%5%-3%-2%3%*-2%2%
-0.53-0.66-0.46-0.52-0.36-0.65-0.42-0.41-0.27-0.35-0.68-0.33-0.53-0.49-0.27-0.27-0.42-0.49-0.47-0.40-0.39Mean
1.031.431.031.061.240.911.101.131.070.961.001.091.181.121.171.151.161.161.001.011.11Standard deviation0.100.410.160.090.100.240.050.050.070.130.200.150.210.130.120.080.110.100.320.090.04Standard error
Page 160
Brassica Vegetables SurveyONLINE Fieldwork: 19th-20th November 2014
Absolutes/col percents
Table 160Q.6 How important or unimportant is each of the following factors when considering purchasing vegetables?Base: All respondents who eat vegetablesWhether vegetables are organic
Prepared by Populus

Which of the following cities do you live in, or nearest to?None ofPly-South-Brigh-MiltonBirm-Nott-Liver-Manch-Shef-New-Edin-theseCardiffmouthBristolamptonLondonOxfordtonKeynesNorwichinghaminghampoolesterfieldHullLeedscastleburghGlasgowTotal
774336314122114213562754937732812453334401007Unweighted base
693829353223014212755884736743411454238451009Weighted base
9635553154101835154-128313182NET: Important13%15%11%15%15%23%9%25%16%18%20%7%15%20%12%-27%19%8%29%18%
331-3171-**7-23--332453Very important (+2)5%9%4%-9%8%4%-2%1%8%-5%4%--8%7%4%9%5%
622523515491133124-8519129Quite important (+1)8%6%7%15%6%15%5%25%14%17%12%7%10%17%12%-19%13%4%20%13%
19151517129241112192921152416820121316391Neither important (0)27%41%52%48%38%40%27%54%43%36%33%45%43%32%46%74%43%30%35%36%39%nor unimportant
2286653841716191591792612108220Quite unimportant (-1)32%20%21%17%16%17%29%7%26%29%22%31%24%23%27%14%13%29%26%17%22%
1975610445349228615517998201Very unimportant (-2)28%18%16%18%30%19%35%15%13%16%25%17%15%20%15%12%16%23%23%19%20%
4114111215829411244123143314313221916420NET: Unimportant60%38%37%35%47%35%64%22%39%44%47%48%40%44%42%26%30%51%50%36%42%
-2-1-4--11*-13----3-15Don't know-6%-3%-2%--2%2%*-2%3%----7%-2%
-0.69-0.34-0.38-0.38-0.54-0.24-0.87-0.12-0.36-0.42-0.44-0.58-0.35-0.42-0.46-0.38-0.12-0.48-0.65-0.17-0.39Mean
1.111.150.990.971.241.161.110.970.960.991.220.861.051.120.900.731.141.171.061.211.11Standard deviation0.130.180.160.180.190.080.300.210.160.130.140.120.180.130.170.210.170.200.180.190.04Standard error
Page 161
Brassica Vegetables SurveyONLINE Fieldwork: 19th-20th November 2014
Absolutes/col percents
Table 161Q.6 How important or unimportant is each of the following factors when considering purchasing vegetables?Base: All respondents who eat vegetablesWhether vegetables are organic
Prepared by Populus

EmploymentSectorRegionSocial GradeAgeGender
York-shire
EastWest&Pri-SouthSouthEast-Mid-Mid-Humb-NorthNorthScot-vatePublicWestEastLondonernWaleslandslandsersideWestEastlandDEC2C1AB65+55-6445-5435-4425-3418-24FemaleMaleTotal
15748284136171918262938122068826965110721195725143141284Unweighted base
17341304239131515323540152275915974*10751136932159141300Weighted base
16439304034121515293539132272895570*10721106528153133285Yes95%95%100%95%86%94%100%100%92%98%98%88%100%96%97%92%94%100%100%97%97%95%86%96%94%95%
92-251--3112-3354--34456814No5%5%-5%14%6%--8%2%2%12%-4%3%8%6%--3%3%5%14%4%6%5%
Page 162
Brassica Vegetables SurveyONLINE Fieldwork: 19th-20th November 2014
Absolutes/col percents
Table 162Q6a. Do you feed your children vegetables at home as part of their diet?Base: All respondents with children aged 18 or under
Prepared by Populus

What is the combined annual income of your household, prior toDo you have any children aged 18 orWhich of the following best describestax being deducted?under? If so, how old are they?where you live?
Nochild-Hamlet
Anyren& Iso-Urban>£55kAnyAnyAnyagedagedlatedTown- Pop.
or>£48k->£41k->£34k->£28k->£21k->£14k->£7k-Up toagedagedagedunderNET:18 orDwel-Vil-NET:andoverNET:more£55k£48k£41k£34k£28k£21k£14k£7k16-1811-155-105YesunderlinglageRuralFringe10kUrbanTotal
1110287067662877711912996284-24244127113240284Unweighted base
11937696867301284126135105300-34547137116253300Weighted base
119376464663078111912499285-34346134106240285Yes100%100%100%100%93%94%98%100%61%97%94%92%94%95%-100%97%97%98%91%95%95%
----541-52711614--223101314No----7%6%2%-39%3%6%8%6%5%--3%3%2%9%5%5%
Page 163
Brassica Vegetables SurveyONLINE Fieldwork: 19th-20th November 2014
Absolutes/col percents
Table 163Q6a. Do you feed your children vegetables at home as part of their diet?Base: All respondents with children aged 18 or under
Prepared by Populus

Marital StatusWhich of the following ITV regions do you live in?NET:Mar-ried/
NET:CivilWid-part-owed/ner-separ-Civilship/ated/CoPart-coWest-
Div-Separ-Wid-div-Hab-ner-Mar-hab-York-count-WalesTyneScot-Meri-Gran-Gram-Cent-orcedatedowedorceditingshiprieditingSingleshirery& WestTeestishdianLondonadapianralAngliaTotal
1643236151512174318918121927513941118284Unweighted base
1345215461722324620915152123594144114300Weighted base
1345215261612194420915132123524041113285Yes100%100%100%100%97%100%94%94%97%100%100%100%88%100%98%88%98%94%100%95%95%
----2-11131---2-*713-114No----3%-6%6%3%---12%-2%12%2%6%-5%5%
Page 164
Brassica Vegetables SurveyONLINE Fieldwork: 19th-20th November 2014
Absolutes/col percents
Table 164Q6a. Do you feed your children vegetables at home as part of their diet?Base: All respondents with children aged 18 or under
Prepared by Populus

Which of the following cities do you live in, or nearest to?None ofPly-South-Brigh-MiltonBirm-Nott-Liver-Manch-Shef-New-Edin-theseCardiffmouthBristolamptonLondonOxfordtonKeynesNorwichinghaminghampoolesterfieldHullLeedscastleburghGlasgowTotal
171581410624677251411279-1812414284Unweighted base
1713717668410463115112812-1715516300Weighted base
1713717660410362815112712-1613516285Yes100%100%100%100%100%89%100%100%82%100%92%100%100%97%100%-95%88%100%100%95%
-----8--1-3--1--12--14No-----11%--18%-8%--3%--5%12%--5%
Page 165
Brassica Vegetables SurveyONLINE Fieldwork: 19th-20th November 2014
Absolutes/col percents
Table 165Q6a. Do you feed your children vegetables at home as part of their diet?Base: All respondents with children aged 18 or under
Prepared by Populus
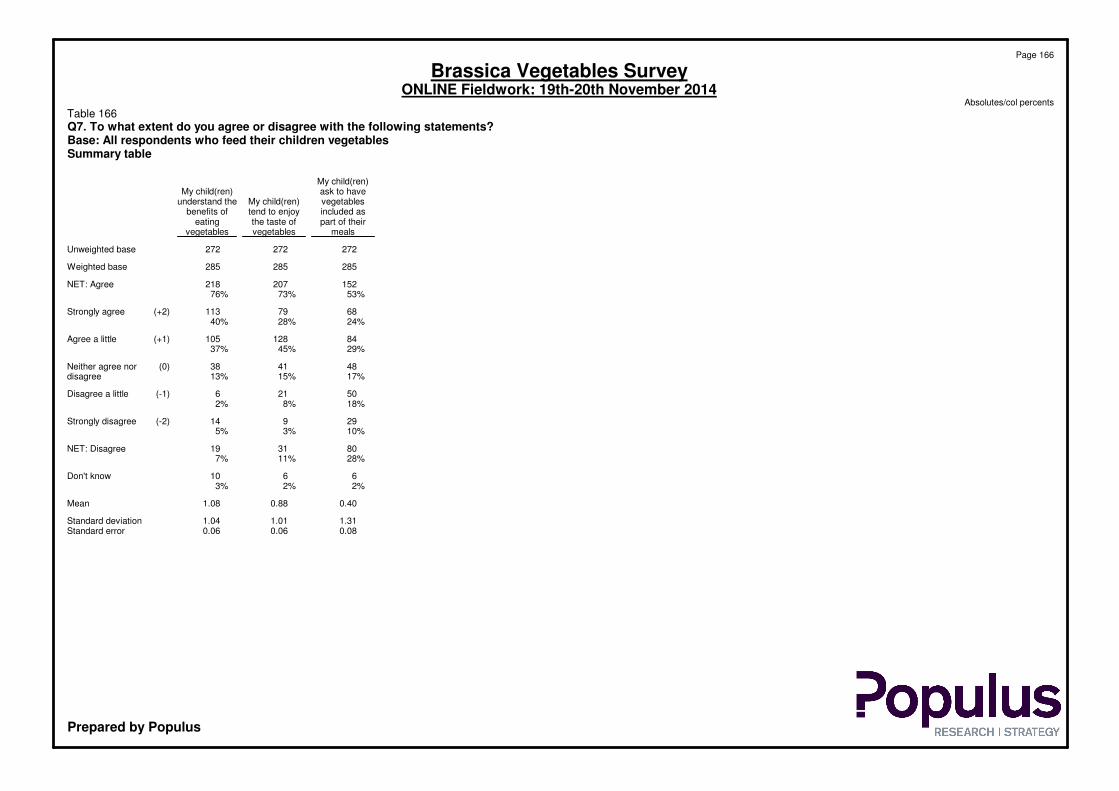
My child(ren)ask to haveMy child(ren)vegetablesMy child(ren)understand theincluded astend to enjoybenefits ofpart of theirthe taste ofeating
mealsvegetablesvegetables
272272272Unweighted base
285285285Weighted base
152207218NET: Agree53%73%76%
6879113Strongly agree (+2)24%28%40%
84128105Agree a little (+1)29%45%37%
484138Neither agree nor (0)17%15%13%disagree
50216Disagree a little (-1)18%8%2%
29914Strongly disagree (-2)10%3%5%
803119NET: Disagree28%11%7%
6610Don't know2%2%3%
0.400.881.08Mean
1.311.011.04Standard deviation0.080.060.06Standard error
Page 166
Brassica Vegetables SurveyONLINE Fieldwork: 19th-20th November 2014
Absolutes/col percents
Table 166Q7. To what extent do you agree or disagree with the following statements?Base: All respondents who feed their children vegetablesSummary table
Prepared by Populus

EmploymentSectorRegionSocial GradeAgeGender
York-shire
EastWest&Pri-SouthSouthEast-Mid-Mid-Humb-NorthNorthScot-vatePublicWestEastLondonernWaleslandslandsersideWestEastlandDEC2C1AB65+55-6445-5435-4425-3418-24FemaleMaleTotal
15047283932161918242837112064806662110701155422138134272Unweighted base
16439304034121515293539132272895570*10721106528153133285Weighted base
12532242524111014252335121457664253*96794331513088218NET: Agree76%82%81%62%72%92%64%93%85%66%88%92%65%78%74%76%77%100%89%93%86%50%53%85%67%76%
64224181464911132010428401431*836501546845113Strongly agree (+2)39%56%14%44%41%46%29%63%39%38%50%76%17%39%46%25%44%100%83%50%46%22%14%44%34%40%
61102081065513101521129262823-1314418116243105Agree a little (+1)37%25%67%19%31%46%35%30%46%28%39%17%48%40%29%51%33%-6%43%40%28%40%40%32%37%
2245941312421691379-*412156152338Neither agree nor (0)14%12%16%23%12%8%18%7%8%11%6%8%26%12%15%13%13%-4%6%11%24%21%10%18%13%disagree
31121-*--11--*131--*14-326Disagree a little (-1)2%3%3%4%2%-3%--2%3%--1%2%6%1%--1%1%7%-2%2%2%
72-22---251-24532-111475914Strongly disagree (-2)4%4%-6%6%---6%13%2%-10%5%6%5%3%-7%1%1%6%26%3%7%5%
103143-*-252-24663-1128781119NET: Disagree6%7%3%10%9%-3%-6%15%5%-10%6%7%11%4%-7%1%2%13%26%5%8%7%
7--22-2-*3---23-4---19--1010Don't know5%--5%7%-15%-1%8%---3%4%-6%---1%13%--7%3%
1.101.270.920.951.071.381.061.561.120.821.311.680.621.091.110.861.212.001.591.401.300.620.161.200.931.08Mean
1.011.050.661.201.150.650.860.651.031.390.890.641.101.031.111.020.96-1.120.710.791.171.420.941.131.04Standard deviation0.080.150.130.190.210.160.200.150.210.270.150.190.250.130.130.130.12-0.350.080.070.170.300.080.100.06Standard error
Page 167
Brassica Vegetables SurveyONLINE Fieldwork: 19th-20th November 2014
Absolutes/col percents
Table 167Q7. To what extent do you agree or disagree with the following statements?Base: All respondents who feed their children vegetablesMy child(ren) understand the benefits of eating vegetables
Prepared by Populus

What is the combined annual income of your household, prior toDo you have any children aged 18 orWhich of the following best describestax being deducted?under? If so, how old are they?where you live?
Nochild-Hamlet
Anyren& Iso-Urban>£55kAnyAnyAnyagedagedlatedTown- Pop.
or>£48k->£41k->£34k->£28k->£21k->£14k->£7k-Up toagedagedagedunderNET:18 orDwel-Vil-NET:andoverNET:more£55k£48k£41k£34k£28k£21k£14k£7k16-1811-155-105YesunderlinglageRuralFringe10kUrbanTotal
1110286664642847511412190272-24042125105230272Unweighted base
119376464663078111912499285-34346134106240285Weighted base
116265048551867310410647218-3262811277189218NET: Agree100%100%64%71%77%75%84%60%87%90%88%85%48%76%-100%60%62%84%73%79%76%
11*928262911442605117113--13135644100113Strongly agree (+2)100%100%5%24%43%41%44%37%57%52%51%41%17%40%--31%29%42%41%42%40%
--5172222267231445530105-31315563490105Agree a little (+1)--60%47%34%35%40%23%30%38%37%45%31%37%-100%29%33%42%32%37%37%
--368859-713102638--9913172938Neither agree nor (0)--27%15%12%12%8%30%-9%11%8%26%13%--21%20%9%16%12%13%disagree
----321---*146----3366Disagree a little (-1)----5%3%1%---*1%4%2%----2%3%2%2%
---5142*11111214--6662814Strongly disagree (-2)---14%2%5%4%2%13%1%1%1%12%5%--13%12%5%2%3%5%
---5453*11131719--66951419NET: Disagree---14%7%8%5%2%13%1%1%2%17%7%--13%12%7%4%6%7%
--1-2322---6910--33-7710Don't know--8%-4%4%3%8%---4%9%3%--6%6%-7%3%3%
2.002.000.750.681.161.061.231.021.181.411.371.280.401.08-1.000.690.711.141.161.151.08Mean
--0.571.250.981.100.940.961.410.720.740.771.251.04-0.001.321.281.010.930.971.04Standard deviation--0.190.240.120.140.120.180.700.080.070.070.140.06-0.000.210.200.090.090.060.06Standard error
Page 168
Brassica Vegetables SurveyONLINE Fieldwork: 19th-20th November 2014
Absolutes/col percents
Table 168Q7. To what extent do you agree or disagree with the following statements?Base: All respondents who feed their children vegetablesMy child(ren) understand the benefits of eating vegetables
Prepared by Populus

Marital StatusWhich of the following ITV regions do you live in?NET:Mar-ried/
NET:CivilWid-part-owed/ner-separ-Civilship/ated/CoPart-coWest-
Div-Separ-Wid-div-Hab-ner-Mar-hab-York-count-WalesTyneScot-Meri-Gran-Gram-Cent-orcedatedowedorceditingshiprieditingSingleshirery& WestTeestishdianLondonadapianralAngliaTotal
1643236051422074118918111926463839117272Unweighted base
1345215261612194420915132123524041113285Weighted base
1234183021341673215910121317353536110218NET: Agree93%61%88%86%58%37%83%76%73%75%100%66%92%63%75%67%87%86%100%76%76%
7141112169831932410411212019-5113Strongly agree (+2)53%16%88%53%24%20%43%38%43%13%19%30%76%18%49%41%49%45%-36%40%
52-71816584131275210613151715105Agree a little (+1)40%45%-32%35%17%40%38%30%61%81%37%17%45%26%26%38%41%100%40%37%
1-117-212894-2165833-238Neither agree nor (0)7%-12%7%14%-13%13%20%21%-15%8%27%22%16%8%8%-11%13%disagree
-2-23-14*1-*---11--26Disagree a little (-1)-39%-8%5%-1%2%1%5%-3%---1%3%--12%2%
----74314-----21412--14Strongly disagree (-2)----13%63%2%6%-----10%3%7%2%4%--5%
-2-294417*1-*-21522-219NET: Disagree-39%-8%18%63%2%8%1%5%-3%-10%3%9%5%4%-12%7%
----5-272--2---4-*--10Don't know----10%-1%3%5%--16%---8%-1%--3%
1.460.381.761.310.56-0.701.241.031.220.831.191.111.680.611.191.001.291.241.001.001.08Mean
0.651.320.740.921.331.890.841.090.820.730.410.840.641.120.991.190.900.95-1.031.04Standard deviation0.160.660.420.190.180.850.070.080.130.170.140.200.190.260.190.180.150.15-0.250.06Standard error
Page 169
Brassica Vegetables SurveyONLINE Fieldwork: 19th-20th November 2014
Absolutes/col percents
Table 169Q7. To what extent do you agree or disagree with the following statements?Base: All respondents who feed their children vegetablesMy child(ren) understand the benefits of eating vegetables
Prepared by Populus

Which of the following cities do you live in, or nearest to?None ofPly-South-Brigh-MiltonBirm-Nott-Liver-Manch-Shef-New-Edin-theseCardiffmouthBristolamptonLondonOxfordtonKeynesNorwichinghaminghampoolesterfieldHullLeedscastleburghGlasgowTotal
171581410564667231411269-1711414272Unweighted base
1713717660410362815112712-1613516285Weighted base
16861334049162410102211-101258218NET: Agree96%62%85%76%55%66%100%93%32%100%87%66%95%83%86%-62%92%100%51%76%
742212428121157119-510-3113Strongly agree (+2)43%31%24%10%18%40%43%83%32%30%39%31%60%41%75%-32%76%-20%40%
9441121621-41354111-5255105Agree a little (+1)52%31%61%66%37%26%57%10%-70%48%35%35%42%11%-30%17%100%30%37%
-2-4310--2-21122-21-638Neither agree nor (0)-17%-24%45%17%--68%-8%7%5%9%14%-13%8%-36%13%disagree
-*1--2-------1--1---6Disagree a little (-1)-3%15%--4%-------5%--3%---2%
1----4-1--14-1--1--214Strongly disagree (-2)4%----6%-7%--4%27%-3%--4%--14%5%
1*1--6-1--14-2--1--219NET: Disagree4%3%15%--10%-7%--4%27%-8%--7%--14%7%
-2---4----*-----3---10Don't know-18%---7%----1%-----18%---3%
1.311.090.950.860.730.971.431.630.641.301.200.441.551.141.60-1.011.681.000.441.08Mean
0.880.900.990.590.821.190.581.081.120.510.901.620.620.980.75-1.110.640.001.251.04Standard deviation0.210.240.350.160.260.160.290.440.460.190.190.430.190.190.25-0.290.190.000.340.06Standard error
Page 170
Brassica Vegetables SurveyONLINE Fieldwork: 19th-20th November 2014
Absolutes/col percents
Table 170Q7. To what extent do you agree or disagree with the following statements?Base: All respondents who feed their children vegetablesMy child(ren) understand the benefits of eating vegetables
Prepared by Populus

EmploymentSectorRegionSocial GradeAgeGender
York-shire
EastWest&Pri-SouthSouthEast-Mid-Mid-Humb-NorthNorthScot-vatePublicWestEastLondonernWaleslandslandsersideWestEastlandDEC2C1AB65+55-6445-5435-4425-3418-24FemaleMaleTotal
15047283932161918242837112064806662110701155422138134272Unweighted base
16439304034121515293539132272895570*10721106528153133285Weighted base
120322030228914212331121843753851*65380442411493207NET: Agree73%84%66%75%64%64%56%96%72%67%79%90%79%60%84%69%74%100%60%74%73%67%87%75%70%73%
4615215112447121010115281025*425211711463379Strongly agree (+2)28%39%6%38%32%19%26%28%23%35%24%78%6%21%32%18%36%100%41%34%19%26%40%30%25%28%
7417181511551014112121628462826-2295827136960128Agree a little (+1)45%45%60%36%32%44%30%68%49%32%55%12%74%38%52%52%38%-19%39%53%41%47%45%45%45%
21175634116612187610-41014113222041Neither agree nor (0)13%2%22%12%17%21%26%4%3%17%16%10%11%25%7%12%14%-40%14%13%16%11%14%15%15%disagree
1263221*-632-27492--7131112921Disagree a little (-1)7%14%8%6%6%11%3%-21%8%5%-10%10%4%16%3%--10%12%2%2%8%7%8%
7-1151--1*---1224--244-459Strongly disagree (-2)4%-3%3%14%5%--4%1%---2%2%3%6%--2%3%6%-3%4%3%
1964472*-732-296106--91651161431NET: Disagree12%14%12%9%19%15%3%-25%10%5%-10%12%6%19%9%--12%15%7%2%11%11%11%
4--2--2--2---22-2----6--66Don't know2%--5%--15%--6%---3%2%-3%----10%--5%2%
0.871.080.571.060.630.640.931.230.650.970.991.680.750.691.100.660.972.001.010.940.740.881.250.910.840.88Mean
1.051.000.881.051.361.100.900.531.191.030.780.670.720.990.881.051.11-0.951.051.011.060.741.011.021.01Standard deviation0.090.150.170.170.240.270.210.130.240.200.130.200.160.120.100.130.14-0.300.130.090.150.160.090.090.06Standard error
Page 171
Brassica Vegetables SurveyONLINE Fieldwork: 19th-20th November 2014
Absolutes/col percents
Table 171Q7. To what extent do you agree or disagree with the following statements?Base: All respondents who feed their children vegetablesMy child(ren) tend to enjoy the taste of vegetables
Prepared by Populus

What is the combined annual income of your household, prior toDo you have any children aged 18 orWhich of the following best describestax being deducted?under? If so, how old are they?where you live?
Nochild-Hamlet
Anyren& Iso-Urban>£55kAnyAnyAnyagedagedlatedTown- Pop.
or>£48k->£41k->£34k->£28k->£21k->£14k->£7k-Up toagedagedagedunderNET:18 orDwel-Vil-NET:andoverNET:more£55k£48k£41k£34k£28k£21k£14k£7k16-1811-155-105YesunderlinglageRuralFringe10kUrbanTotal
1110286664642847511412190272-24042125105230272Unweighted base
119376464663078111912499285-34346134106240285Weighted base
1143348484719160789270207-1282910673178207NET: Agree100%100%38%91%75%74%72%62%9%74%66%74%70%73%-38%64%62%79%69%74%73%
11113121923512427262979--9935356979Strongly agree (+2)100%100%12%34%19%29%36%17%9%29%23%21%29%28%--21%20%26%33%29%28%
--22136292413-36516641128-118197138109128Agree a little (+1)--26%57%56%45%37%45%-45%43%53%41%45%-38%43%42%53%36%46%45%
--335910571325131441-2121416112741Neither agree nor (0)--30%8%8%14%15%18%91%16%21%11%14%15%-62%29%31%12%11%11%15%disagree
--2*8354-61112421--119122121Disagree a little (-1)--16%1%12%5%7%12%-7%10%10%4%8%--2%2%7%11%9%8%
--1-322--34459--113699Strongly disagree (-2)--15%-5%3%3%--4%3%3%5%3%--1%1%2%5%4%3%
--3*11574-81516931--1112182931NET: Disagree--32%1%18%8%10%12%-10%13%13%9%11%--3%3%9%17%12%11%
-----222---266--22-446Don't know-----3%3%8%---2%6%2%--4%4%-4%2%2%
2.002.000.031.240.700.950.970.740.170.890.730.810.910.88-0.380.840.820.940.830.890.88Mean
--1.310.651.080.991.050.930.611.021.031.001.061.01-0.620.840.830.921.191.041.01Standard deviation--0.410.120.130.120.130.180.300.120.100.090.110.06-0.440.140.130.080.120.070.06Standard error
Page 172
Brassica Vegetables SurveyONLINE Fieldwork: 19th-20th November 2014
Absolutes/col percents
Table 172Q7. To what extent do you agree or disagree with the following statements?Base: All respondents who feed their children vegetablesMy child(ren) tend to enjoy the taste of vegetables
Prepared by Populus

Marital StatusWhich of the following ITV regions do you live in?NET:Mar-ried/
NET:CivilWid-part-owed/ner-separ-Civilship/ated/CoPart-coWest-
Div-Separ-Wid-div-Hab-ner-Mar-hab-York-count-WalesTyneScot-Meri-Gran-Gram-Cent-orcedatedowedorceditingshiprieditingSingleshirery& WestTeestishdianLondonadapianralAngliaTotal
1643236051422074118918111926463839117272Unweighted base
1345215261612194420915132123524041113285Weighted base
83112386120164301379121817333133-9207NET: Agree65%82%13%57%73%94%75%75%69%63%75%58%90%83%76%65%78%80%-69%73%
41-4105516692-410110161011-279Strongly agree (+2)29%16%-20%20%72%32%30%19%9%-27%78%6%45%31%24%26%-18%28%
431828169992211752167172122-7128Agree a little (+1)36%66%13%37%53%22%43%45%50%54%75%31%12%77%31%33%54%54%-51%45%
4-485*24304613123871-241Neither agree nor (0)31%-87%37%10%6%15%14%8%30%8%23%10%11%14%15%17%2%-17%15%disagree
11-14-913711*-114261121Disagree a little (-1)4%18%-6%8%-6%6%16%7%12%3%-6%3%7%5%15%100%10%8%
----1-881-*---25-1-19Strongly disagree (-2)----1%-5%4%1%-5%---7%10%-3%-4%3%
11-15-1621812*-129271231NET: Disagree4%18%-6%9%-10%10%18%7%18%3%-6%10%17%5%18%100%14%11%
----4--42--2---2----6Don't know----8%--2%5%--16%---4%----2%
0.900.790.130.710.891.670.920.930.730.650.520.981.680.831.030.710.970.85-1.000.690.88Mean
0.911.050.380.880.880.631.051.011.030.760.960.900.670.631.191.290.791.08-1.051.01Standard deviation0.230.530.220.180.120.280.090.070.160.180.320.220.200.140.230.190.130.17-0.250.06Standard error
Page 173
Brassica Vegetables SurveyONLINE Fieldwork: 19th-20th November 2014
Absolutes/col percents
Table 173Q7. To what extent do you agree or disagree with the following statements?Base: All respondents who feed their children vegetablesMy child(ren) tend to enjoy the taste of vegetables
Prepared by Populus

Which of the following cities do you live in, or nearest to?None ofPly-South-Brigh-MiltonBirm-Nott-Liver-Manch-Shef-New-Edin-theseCardiffmouthBristolamptonLondonOxfordtonKeynesNorwichinghaminghampoolesterfieldHullLeedscastleburghGlasgowTotal
171581410564667231411269-1711414272Unweighted base
1713717660410362815112712-1613516285Weighted base
1275102433823211482211-812413207NET: Agree72%55%79%61%27%71%93%85%50%53%74%96%74%80%86%-50%90%74%79%73%
4311-1818-177355-310-179Strongly agree (+2)26%24%21%3%-30%16%85%-13%26%46%26%18%39%-20%78%-8%28%
844102243-221475176-52411128Agree a little (+1)46%31%58%58%27%40%78%-50%39%48%50%48%63%47%-30%12%74%71%45%
431528-11211332-31-241Neither agree nor (0)23%23%21%27%30%13%-8%22%31%3%4%26%13%14%-17%10%-15%15%disagree
1*-214*-*15--2--3-1121Disagree a little (-1)5%3%-13%12%6%7%-11%16%18%--7%--17%-26%6%8%
----25-11-1-----*---9Strongly disagree (-2)----30%8%-7%17%-5%-----3%---3%
1*-228*1116--2--3-1131NET: Disagree5%3%-13%42%14%7%7%28%16%23%--7%--20%-26%6%11%
-2---2----------2---6Don't know-18%---3%----------13%---2%
0.930.931.000.51-0.450.821.021.570.050.490.721.420.990.911.25-0.531.680.480.810.88Mean
0.860.910.700.771.301.180.761.171.361.011.190.590.760.770.71-1.180.670.980.681.01Standard deviation0.210.240.250.210.410.160.380.480.550.380.250.160.230.150.24-0.300.200.490.180.06Standard error
Page 174
Brassica Vegetables SurveyONLINE Fieldwork: 19th-20th November 2014
Absolutes/col percents
Table 174Q7. To what extent do you agree or disagree with the following statements?Base: All respondents who feed their children vegetablesMy child(ren) tend to enjoy the taste of vegetables
Prepared by Populus

EmploymentSectorRegionSocial GradeAgeGender
York-shire
EastWest&Pri-SouthSouthEast-Mid-Mid-Humb-NorthNorthScot-vatePublicWestEastLondonernWaleslandslandsersideWestEastlandDEC2C1AB65+55-6445-5435-4425-3418-24FemaleMaleTotal
15047283932161918242837112064806662110701155422138134272Unweighted base
16439304034121515293539132272895570*10721106528153133285Weighted base
9025102314889162222101035492939*5395531208369152NET: Agree55%64%33%57%42%66%55%61%56%63%55%74%43%48%55%54%56%100%53%55%50%48%72%54%52%53%
371711272169109821523921-322211310373168Strongly agree (+2)22%44%4%31%21%19%8%40%31%29%23%57%7%20%26%16%30%-31%30%19%19%36%24%24%24%
5389117673712132820262118*218351910463884Agree a little (+1)32%21%29%26%21%47%47%21%24%33%32%17%35%28%29%38%25%100%22%25%32%29%36%30%28%29%
263646-31759249151112-*1520111252248Neither agree nor (0)16%7%21%11%17%-19%9%25%14%24%12%16%13%17%20%18%-4%21%18%17%4%17%17%17%disagree
276117821425524191679-3142093302050Disagree a little (-1)17%15%37%17%23%15%8%26%5%15%12%13%19%26%17%12%13%-36%20%18%14%11%20%15%18%
1853462*1413-57788-131574151529Strongly disagree (-2)11%13%10%10%18%19%3%4%14%3%8%-21%10%8%14%11%-7%5%13%11%13%10%11%10%
45111411144256682926221417-41735177443580NET: Disagree27%28%46%27%40%34%11%30%19%17%21%13%41%36%25%26%24%-43%24%32%25%24%29%26%28%
4--2--2--2---22-2----6--66Don't know2%--5%--15%--6%---3%2%-3%----10%--5%2%
0.400.67-0.200.530.050.340.590.670.540.760.491.18-0.120.230.500.290.531.000.350.560.240.340.720.400.400.40Mean
1.311.501.091.401.431.490.951.391.371.161.221.141.331.341.281.281.36-1.481.241.321.311.421.301.331.31Standard deviation0.110.220.210.230.250.370.220.330.280.220.200.340.300.170.140.160.17-0.470.150.120.180.300.110.120.08Standard error
Page 175
Brassica Vegetables SurveyONLINE Fieldwork: 19th-20th November 2014
Absolutes/col percents
Table 175Q7. To what extent do you agree or disagree with the following statements?Base: All respondents who feed their children vegetablesMy child(ren) ask to have vegetables included as part of their meals
Prepared by Populus

What is the combined annual income of your household, prior toDo you have any children aged 18 orWhich of the following best describestax being deducted?under? If so, how old are they?where you live?
Nochild-Hamlet
Anyren& Iso-Urban>£55kAnyAnyAnyagedagedlatedTown- Pop.
or>£48k->£41k->£34k->£28k->£21k->£14k->£7k-Up toagedagedagedunderNET:18 orDwel-Vil-NET:andoverNET:more£55k£48k£41k£34k£28k£21k£14k£7k16-1811-155-105YesunderlinglageRuralFringe10kUrbanTotal
1110286664642847511412190272-24042125105230272Unweighted base
119376464663078111912499285-34346134106240285Weighted base
1-42031423414148576453152-322257454127152NET: Agree100%-38%55%49%66%52%46%9%59%48%52%54%53%-100%51%54%55%51%53%53%
---81414217-2024232468--121226305668Strongly agree (+2)---23%21%22%32%22%-25%20%19%25%24%--27%26%19%29%23%24%
1-412182814712833412984-3101348237184Agree a little (+1)100%-38%32%28%43%21%24%9%35%28%33%29%29%-100%24%28%36%22%30%29%
-1169791021524181348--101023153848Neither agree nor (0)-100%11%17%14%12%14%34%30%19%20%15%13%17%--23%21%17%14%16%17%disagree
--3912713331324281250--7723204350Disagree a little (-1)--31%25%18%10%20%9%49%16%20%23%13%18%--15%14%17%19%18%18%
--21126611514111429--3314122729Strongly disagree (-2)--20%3%18%9%10%4%13%6%12%9%14%10%--6%6%11%12%11%10%
--510241220441838392680--9937337080NET: Disagree--51%28%37%19%30%13%61%22%32%32%27%28%--22%21%28%31%29%28%
-----222---266--22-446Don't know-----3%3%8%---2%6%2%--4%4%-4%2%2%
1.000.00-0.320.470.150.610.450.56-0.660.550.250.300.400.40-1.000.520.550.360.380.370.40Mean
--1.251.191.431.231.401.090.871.201.311.271.401.31-0.001.261.221.271.411.331.31Standard deviation--0.390.230.180.150.180.210.440.140.120.120.150.08-0.000.200.190.110.140.090.08Standard error
Page 176
Brassica Vegetables SurveyONLINE Fieldwork: 19th-20th November 2014
Absolutes/col percents
Table 176Q7. To what extent do you agree or disagree with the following statements?Base: All respondents who feed their children vegetablesMy child(ren) ask to have vegetables included as part of their meals
Prepared by Populus

Marital StatusWhich of the following ITV regions do you live in?NET:Mar-ried/
NET:CivilWid-part-owed/ner-separ-Civilship/ated/CoPart-coWest-
Div-Separ-Wid-div-Hab-ner-Mar-hab-York-count-WalesTyneScot-Meri-Gran-Gram-Cent-orcedatedowedorceditingshiprieditingSingleshirery& WestTeestishdianLondonadapianralAngliaTotal
1643236051422074118918111926463839117272Unweighted base
1345215261612194420915132123524041113285Weighted base
62182259111826738101014252225-6152NET: Agree46%43%13%38%42%84%56%54%58%36%30%57%74%45%60%49%54%62%-48%53%
411565465671-182910915-268Strongly agree (+2)29%16%13%23%11%72%28%26%16%6%-9%57%8%41%20%22%37%-18%24%
21-3161456219637284151310-484Agree a little (+1)16%27%-15%31%11%28%28%42%30%30%48%17%37%19%29%32%25%-30%29%
4-159-263585122446109-148Neither agree nor (0)31%-12%21%17%-16%16%19%25%7%15%12%17%16%11%25%21%-9%17%disagree
223811125375651244953-350Disagree a little (-1)19%57%75%38%20%16%16%17%11%29%58%8%13%20%18%17%12%7%-26%18%
1--17-192632**-4110341229Strongly disagree (-2)4%--3%13%-12%12%7%10%5%3%-18%6%19%8%10%100%17%10%
32391714462886228519871680NET: Disagree23%57%75%41%33%16%27%28%18%39%63%11%13%38%23%36%20%17%100%43%28%
----4--42--2---2----6Don't know----8%--2%5%--16%---4%----2%
0.480.01-0.490.180.081.400.460.400.53-0.07-0.390.611.18-0.040.730.140.480.72-2.000.050.40Mean
1.261.391.141.271.271.211.361.351.131.121.020.971.141.301.341.451.211.31-1.451.31Standard deviation0.320.690.660.260.170.540.110.090.180.260.340.230.340.300.260.220.200.21-0.350.08Standard error
Page 177
Brassica Vegetables SurveyONLINE Fieldwork: 19th-20th November 2014
Absolutes/col percents
Table 177Q7. To what extent do you agree or disagree with the following statements?Base: All respondents who feed their children vegetablesMy child(ren) ask to have vegetables included as part of their meals
Prepared by Populus

Which of the following cities do you live in, or nearest to?None ofPly-South-Brigh-MiltonBirm-Nott-Liver-Manch-Shef-New-Edin-theseCardiffmouthBristolamptonLondonOxfordtonKeynesNorwichinghaminghampoolesterfieldHullLeedscastleburghGlasgowTotal
171581410564667231411269-1711414272Unweighted base
1713717660410362815112712-1613516285Weighted base
1076313228*317127138-61035152NET: Agree59%51%85%18%12%53%43%85%12%53%60%82%61%48%68%-36%74%55%34%53%
4*1-*1317-1109344-28-168Strongly agree (+2)24%3%17%-6%22%16%75%-13%35%59%26%16%36%-10%57%-7%24%
6653*1911*273494-423484Agree a little (+1)35%48%68%18%6%31%27%10%12%39%25%23%35%33%32%-26%17%55%27%29%
12-537-11-71463-22-448Neither agree nor (0)6%18%-30%46%11%-8%38%-26%4%33%24%21%-14%12%-23%17%disagree
61*8*112111-1-51-522250Disagree a little (-1)35%10%7%46%6%18%51%7%22%23%-10%-18%11%-31%13%45%13%18%
-*1129*-114113--1--529Strongly disagree (-2)-3%8%6%36%15%7%-28%24%14%4%6%10%--6%--30%10%
6219220212342171-622780NET: Disagree35%13%15%52%42%33%57%7%50%47%14%14%6%28%11%-37%13%45%44%28%
-2---2----------2---6Don't know-18%---3%----------13%---2%
0.490.460.80-0.40-0.610.27-0.061.53-0.66-0.050.661.220.750.260.93-0.041.180.09-0.330.40Mean
1.230.951.140.881.321.411.510.961.211.601.351.211.081.231.05-1.231.141.121.381.31Standard deviation0.300.250.400.240.420.190.760.390.490.610.280.320.320.240.35-0.310.340.560.370.08Standard error
Page 178
Brassica Vegetables SurveyONLINE Fieldwork: 19th-20th November 2014
Absolutes/col percents
Table 178Q7. To what extent do you agree or disagree with the following statements?Base: All respondents who feed their children vegetablesMy child(ren) ask to have vegetables included as part of their meals
Prepared by Populus

EmploymentSectorRegionSocial GradeAgeGender
York-shire
EastWest&Pri-SouthSouthEast-Mid-Mid-Humb-NorthNorthScot-vatePublicWestEastLondonernWaleslandslandsersideWestEastlandDEC2C1AB65+55-6445-5435-4425-3418-24FemaleMaleTotal
15047283932161918242837112064806662110701155422138134272Unweighted base
16439304034121515293539132272895570*10721106528153133285Weighted base
191-47--13731-6892-43972131125By disguising them11%3%-10%20%--4%12%20%6%5%-8%9%16%3%-43%4%8%11%7%9%9%9%
331029813210812-49141421--1716214332558By making them look20%27%6%22%23%8%18%15%33%23%31%-19%12%16%26%30%--24%14%32%15%22%19%20%more appealing
11227282719111312162025131857673246*65285372210696203I don't do anything68%70%94%68%57%92%82%81%55%57%63%95%81%79%76%58%67%100%57%73%77%57%78%69%73%71%special I just give
them to my child
Page 179
Brassica Vegetables SurveyONLINE Fieldwork: 19th-20th November 2014
Absolutes/col percents
Table 179Q8. Which of the following statements best describes how you incorporate Brassicas into your child's diet?Base: All respondents who feed their children vegetables
Prepared by Populus
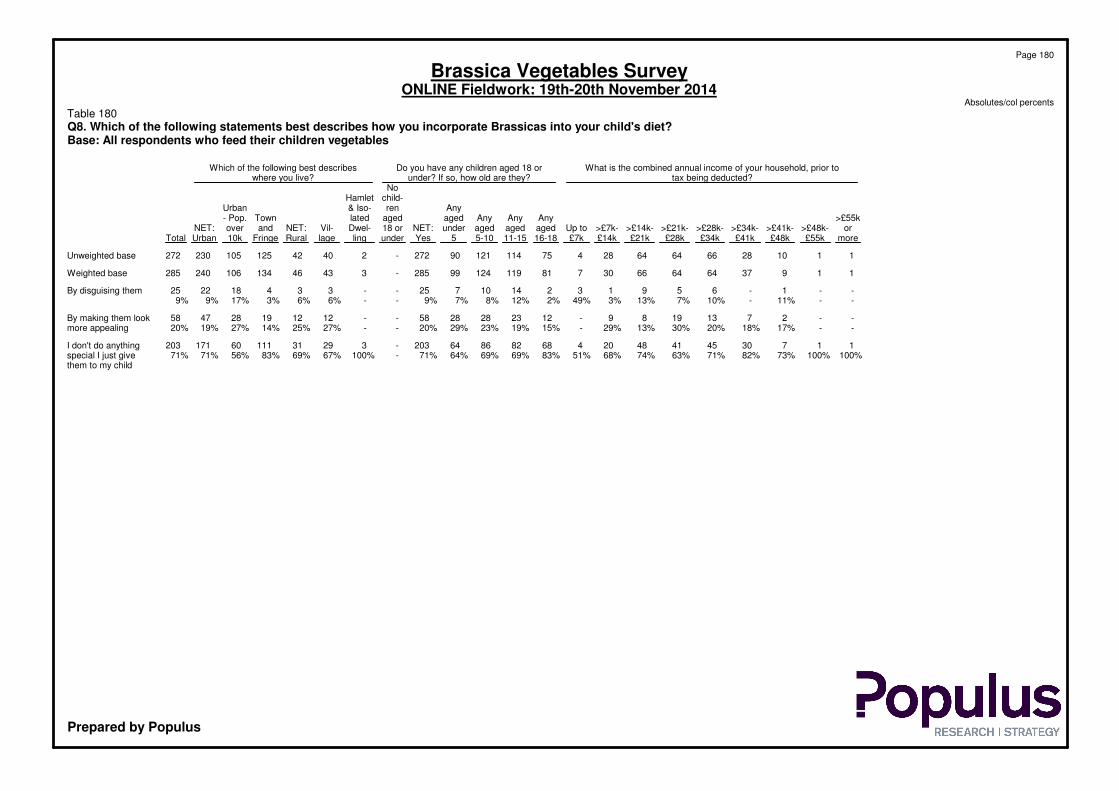
What is the combined annual income of your household, prior toDo you have any children aged 18 orWhich of the following best describestax being deducted?under? If so, how old are they?where you live?
Nochild-Hamlet
Anyren& Iso-Urban>£55kAnyAnyAnyagedagedlatedTown- Pop.
or>£48k->£41k->£34k->£28k->£21k->£14k->£7k-Up toagedagedagedunderNET:18 orDwel-Vil-NET:andoverNET:more£55k£48k£41k£34k£28k£21k£14k£7k16-1811-155-105YesunderlinglageRuralFringe10kUrbanTotal
1110286664642847511412190272-24042125105230272Unweighted base
119376464663078111912499285-34346134106240285Weighted base
--1-6591321410725--334182225By disguising them--11%-10%7%13%3%49%2%12%8%7%9%--6%6%3%17%9%9%
--27131989-1223282858--121219284758By making them look--17%18%20%30%13%29%-15%19%23%29%20%--27%25%14%27%19%20%more appealing
1173045414820468828664203-3293111160171203I don't do anything100%100%73%82%71%63%74%68%51%83%69%69%64%71%-100%67%69%83%56%71%71%special I just give
them to my child
Page 180
Brassica Vegetables SurveyONLINE Fieldwork: 19th-20th November 2014
Absolutes/col percents
Table 180Q8. Which of the following statements best describes how you incorporate Brassicas into your child's diet?Base: All respondents who feed their children vegetables
Prepared by Populus

Marital StatusWhich of the following ITV regions do you live in?NET:Mar-ried/
NET:CivilWid-part-owed/ner-separ-Civilship/ated/CoPart-coWest-
Div-Separ-Wid-div-Hab-ner-Mar-hab-York-count-WalesTyneScot-Meri-Gran-Gram-Cent-orcedatedowedorceditingshiprieditingSingleshirery& WestTeestishdianLondonadapianralAngliaTotal
1643236051422074118918111926463839117272Unweighted base
1345215261612194420915132123524041113285Weighted base
-2354-11155---1-2734-225By disguising them-39%75%24%8%-7%7%11%---5%-7%14%6%10%-12%9%
1-128*384692*2-46101312-158By making them look8%-25%10%16%6%23%21%21%9%5%15%-19%28%20%32%29%-7%20%more appealing
123-144061121583018813131715342525111203I don't do anything92%61%-66%76%94%70%72%68%91%95%85%95%81%65%66%62%62%100%80%71%special I just give
them to my child
Page 181
Brassica Vegetables SurveyONLINE Fieldwork: 19th-20th November 2014
Absolutes/col percents
Table 181Q8. Which of the following statements best describes how you incorporate Brassicas into your child's diet?Base: All respondents who feed their children vegetables
Prepared by Populus

Which of the following cities do you live in, or nearest to?None ofPly-South-Brigh-MiltonBirm-Nott-Liver-Manch-Shef-New-Edin-theseCardiffmouthBristolamptonLondonOxfordtonKeynesNorwichinghaminghampoolesterfieldHullLeedscastleburghGlasgowTotal
171581410564667231411269-1711414272Unweighted base
1713717660410362815112712-1613516285Weighted base
----19*---31122-51--25By disguising them----25%15%7%---12%4%6%7%15%-31%5%--9%
121**11231*1013103-5--458By making them look9%13%22%2%6%18%51%36%17%7%34%5%26%39%21%-32%--26%20%more appealing
1511517440263515147158-613512203I don't do anything91%87%78%98%69%67%43%64%83%93%54%91%69%55%64%-36%95%100%74%71%special I just give
them to my child
Page 182
Brassica Vegetables SurveyONLINE Fieldwork: 19th-20th November 2014
Absolutes/col percents
Table 182Q8. Which of the following statements best describes how you incorporate Brassicas into your child's diet?Base: All respondents who feed their children vegetables
Prepared by Populus

EmploymentSectorRegionSocial GradeAgeGender
York-shire
EastWest&Pri-SouthSouthEast-Mid-Mid-Humb-NorthNorthScot-vatePublicWestEastLondonernWaleslandslandsersideWestEastlandDEC2C1AB65+55-6445-5435-4425-3418-24FemaleMaleTotal
42011896155116121577578881093284262210315224227176198188130924805311011Unweighted base
439127911421311015171919111140912402202802702201501801701701205164951011Weighted base
30090439483573348656375336514914017919114410211110311880336322659NET: more healthily68%71%47%67%63%56%65%68%71%69%67%82%72%62%64%64%71%65%68%61%61%69%67%65%65%65%
8522432191791324131978323047573418392229237492166A lot more (+2)19%17%5%23%14%16%18%18%27%15%17%18%9%13%13%17%21%16%12%22%13%17%20%14%19%16%healthily
2146938626440243640505526571171101321341108472818957262231493A little more (+1)49%54%42%44%49%40%47%50%44%55%50%64%62%49%50%47%49%50%56%40%48%52%47%51%47%49%healthily
1242947414240151920273572484679173724360594339162154316About the same (0)28%23%52%29%32%40%29%27%22%29%31%17%27%35%31%33%27%33%29%33%35%25%33%31%31%31%
97165231322--597524487-131326A little less (-1)2%6%1%4%4%2%6%2%4%2%2%--2%4%2%2%1%3%2%4%4%-3%3%3%healthily
6--*12-23--112431215-214610A lot less (-2)1%--*1%2%-3%3%--1%2%1%2%1%*1%*3%-1%1%1%1%1%healthily
157167433622117131064510891171936NET: Less healthily4%6%1%4%5%4%6%5%7%2%2%1%2%3%6%4%2%2%3%5%4%5%1%3%4%4%
0.830.830.510.850.710.670.760.790.880.820.820.970.780.720.690.760.890.780.770.750.690.800.850.750.790.77Mean
0.810.780.610.830.800.840.820.860.970.690.730.690.670.750.820.800.760.750.710.920.750.810.750.760.820.79Standard deviation0.040.070.060.070.070.080.110.100.110.070.070.120.070.050.060.040.050.050.050.070.050.070.080.030.040.02Standard error
Page 183
Brassica Vegetables SurveyONLINE Fieldwork: 19th-20th November 2014
Absolutes/col percents
Table 183Q9. To what extent do you think children will be eating more or less healthily in general as a result of the government introducing compulsory schoolmeals for children up to the age of 7?Base: All respondents
Prepared by Populus

What is the combined annual income of your household, prior toDo you have any children aged 18 orWhich of the following best describestax being deducted?under? If so, how old are they?where you live?
Nochild-Hamlet
Anyren& Iso-Urban>£55kAnyAnyAnyagedagedlatedTown- Pop.
or>£48k->£41k->£34k->£28k->£21k->£14k->£7k-Up toagedagedagedunderNET:18 orDwel-Vil-NET:andoverNET:more£55k£48k£41k£34k£28k£21k£14k£7k16-1811-155-105YesunderlinglageRuralFringe10kUrbanTotal
10103267190213218170557711912996284723161831994084048121011Unweighted base
181436812002092051435384126135105300709151882033984098081011Weighted base
1311235112514313496325574707118047812114126248284532659NET: more healthily71%78%63%63%63%68%65%67%61%66%59%52%67%60%68%83%61%62%62%69%66%65%
5-7162840292362121172051115432366367130166A lot more (+2)26%-18%20%14%19%14%16%12%25%17%13%19%17%16%27%17%18%16%16%16%16%healthily
81116359710410474263453535112936388290185217403493A little more (+1)46%78%45%43%49%50%51%51%49%41%42%39%48%43%51%56%43%44%47%53%50%49%healthily
4392966556844182745593211020426669136111247316About the same (0)21%22%26%36%33%26%33%31%33%32%36%44%30%37%29%17%35%34%34%27%31%31%
1-41692112642719-661192026A little less (-1)7%-11%1%3%4%1%1%2%2%5%3%2%2%3%-3%3%3%2%3%3%healthily
----22122-12-28-2235810A lot less (-2)----1%1%1%1%3%-1%2%-1%1%-1%1%1%1%1%1%healthily
1-4181133327621027-8814142836NET: Less healthily7%-11%1%4%5%2%2%6%2%6%4%2%3%4%-4%4%4%3%4%4%
0.900.780.710.810.710.810.770.790.640.880.690.580.850.730.791.100.720.750.740.810.780.77Mean
0.890.430.900.760.790.830.720.760.850.810.840.810.750.800.780.680.830.820.780.770.780.79Standard deviation0.280.140.160.090.060.060.050.060.110.090.080.070.080.050.030.170.060.060.040.040.030.02Standard error
Page 184
Brassica Vegetables SurveyONLINE Fieldwork: 19th-20th November 2014
Absolutes/col percents
Table 184Q9. To what extent do you think children will be eating more or less healthily in general as a result of the government introducing compulsory schoolmeals for children up to the age of 7?Base: All respondents
Prepared by Populus

Marital StatusWhich of the following ITV regions do you live in?NET:Mar-ried/
NET:CivilWid-part-owed/ner-separ-Civilship/ated/CoPart-coWest-
Div-Separ-Wid-div-Hab-ner-Mar-hab-York-count-WalesTyneScot-Meri-Gran-Gram-Cent-orcedatedowedorceditingshiprieditingSingleshirery& WestTeestishdianLondonadapianralAngliaTotal
98124015014414446604250572754337798186110134101241011Unweighted base
84114213714215452608262543149428382199114137101071011Weighted base
56927919562863871782812313558571257995761659NET: more healthily67%83%63%67%67%42%63%64%68%52%40%64%83%70%70%63%69%69%74%57%65%
13251918481103441198720341834219166A lot more (+2)15%15%11%14%13%28%18%17%17%2%4%18%20%9%24%17%16%25%19%18%16%healthily
4372273762205284134271122265037916160642493A little more (+1)52%68%52%53%54%15%45%47%51%51%35%46%63%61%45%46%53%44%54%40%49%healthily
27115434081511997225191472419663333342316About the same (0)32%11%36%31%28%55%33%33%27%46%60%29%16%29%24%33%29%24%26%39%31%
*1-16*111781-3--5624-226A little less (-1)1%6%-1%4%3%2%3%3%2%-6%--6%3%2%3%-2%3%healthily
1-111-554---11*1-5-210A lot less (-2)1%-1%1%1%-1%1%1%---1%2%*1%-4%-2%1%healthily
11137*1522111-3115829-436NET: Less healthily2%6%1%2%5%3%3%4%4%2%-6%1%2%7%4%2%7%-4%4%
0.790.920.720.780.740.670.770.760.790.520.440.771.000.750.870.750.830.840.930.700.77Mean
0.740.740.710.730.760.940.800.790.800.570.590.830.700.690.870.800.710.960.710.840.79Standard deviation0.080.210.110.060.060.250.040.030.050.080.110.110.120.080.090.060.070.080.220.080.02Standard error
Page 185
Brassica Vegetables SurveyONLINE Fieldwork: 19th-20th November 2014
Absolutes/col percents
Table 185Q9. To what extent do you think children will be eating more or less healthily in general as a result of the government introducing compulsory schoolmeals for children up to the age of 7?Base: All respondents
Prepared by Populus

Which of the following cities do you live in, or nearest to?None ofPly-South-Brigh-MiltonBirm-Nott-Liver-Manch-Shef-New-Edin-theseCardiffmouthBristolamptonLondonOxfordtonKeynesNorwichinghaminghampoolesterfieldHullLeedscastleburghGlasgowTotal
794336314122114213562764937732813453334401011Unweighted base
703829353223014212755894736743411454238451011Weighted base
3623201223144111318306227275222834342634659NET: more healthily52%62%68%34%72%63%78%63%68%55%70%57%75%70%66%69%77%81%69%77%65%
7811104128582267131110826166A lot more (+2)10%20%3%3%30%18%17%38%19%15%25%13%19%17%4%8%22%19%5%13%16%healthily
29161911131038513224021203921724262429493A little more (+1)42%42%65%31%42%45%61%26%49%40%46%44%55%53%63%62%54%62%64%64%49%healthily
321192397536921201792011498129316About the same (0)46%30%30%65%28%33%19%29%32%39%23%36%25%27%34%31%20%19%31%19%31%
1311-9*1-131-2--2---26A little less (-1)2%8%2%1%-4%3%6%-2%4%3%-3%--3%---3%healthily
1----1-*-232-------110A lot less (-2)1%----1%-2%-3%3%4%-------3%1%healthily
2311-11*2-363-2--2--136NET: Less healthily3%8%2%1%-5%3%8%-6%7%7%-3%--3%--3%4%
0.580.740.680.351.020.750.920.910.870.620.840.600.940.850.700.770.961.000.730.840.77Mean
0.730.880.570.560.780.810.721.060.720.890.960.900.680.730.540.600.750.630.540.770.79Standard deviation0.080.130.100.100.120.050.190.230.120.110.110.130.110.090.100.170.110.110.090.120.02Standard error
Page 186
Brassica Vegetables SurveyONLINE Fieldwork: 19th-20th November 2014
Absolutes/col percents
Table 186Q9. To what extent do you think children will be eating more or less healthily in general as a result of the government introducing compulsory schoolmeals for children up to the age of 7?Base: All respondents
Prepared by Populus

EmploymentSectorRegionSocial GradeAgeGender
York-shire
EastWest&Pri-SouthSouthEast-Mid-Mid-Humb-NorthNorthScot-vatePublicWestEastLondonernWaleslandslandsersideWestEastlandDEC2C1AB65+55-6445-5435-4425-3418-24FemaleMaleTotal
42011896155116121577578881093284262210315224227176198188130924805311011Unweighted base
439127911421311015171919111140912402202802702201501801701701205164951011Weighted base
328917111295833457626889307217218721519919312613213511077394379773Traditional fresh75%72%78%79%72%82%68%80%68%74%80%75%79%71%85%77%74%88%84%73%79%65%64%76%77%76%vegetables e.g.
potatoes, carrots,cabbage
963319252818141327212081660315363252444295134107101207Frozen vegetables22%26%21%18%21%17%27%19%29%23%18%19%18%25%14%19%23%11%16%25%17%30%28%21%20%20%
62*14---131-2*1551-23236612Less traditional fresh1%2%*1%3%---1%3%1%-2%**2%2%1%-1%2%1%3%1%1%1%vegetables e.g. yam,
pak choi, plantain
9-*451211-22281631-2367101019None of these2%-*3%4%1%5%1%1%-1%5%2%3%*2%1%1%-1%2%3%6%2%2%2%
Page 187
Brassica Vegetables SurveyONLINE Fieldwork: 19th-20th November 2014
Absolutes/col percents
Table 187Q10. There are a large variety of vegetables available on the shelf at supermarkets and local grocery shops. Which of the below do you tend to buy most often?Base: All respondents
Prepared by Populus
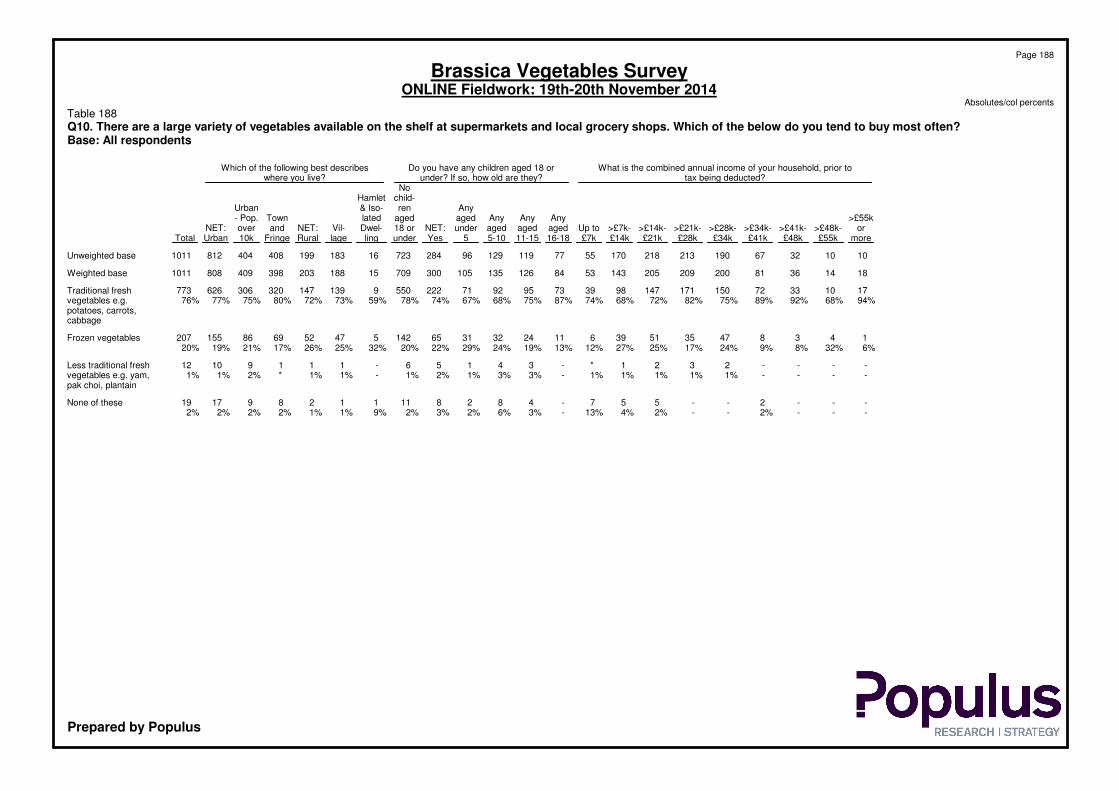
What is the combined annual income of your household, prior toDo you have any children aged 18 orWhich of the following best describestax being deducted?under? If so, how old are they?where you live?
Nochild-Hamlet
Anyren& Iso-Urban>£55kAnyAnyAnyagedagedlatedTown- Pop.
or>£48k->£41k->£34k->£28k->£21k->£14k->£7k-Up toagedagedagedunderNET:18 orDwel-Vil-NET:andoverNET:more£55k£48k£41k£34k£28k£21k£14k£7k16-1811-155-105YesunderlinglageRuralFringe10kUrbanTotal
10103267190213218170557711912996284723161831994084048121011Unweighted base
181436812002092051435384126135105300709151882033984098081011Weighted base
171033721501711479839739592712225509139147320306626773Traditional fresh94%68%92%89%75%82%72%68%74%87%75%68%67%74%78%59%73%72%80%75%77%76%vegetables e.g.
potatoes, carrots,cabbage
14384735513961124323165142547526986155207Frozen vegetables6%32%8%9%24%17%25%27%12%13%19%24%29%22%20%32%25%26%17%21%19%20%
----2321*-34156-11191012Less traditional fresh----1%1%1%1%1%-3%3%1%2%1%-1%1%*2%1%1%vegetables e.g. yam,
pak choi, plantain
---2--557-482811112891719None of these---2%--2%4%13%-3%6%2%3%2%9%1%1%2%2%2%2%
Page 188
Brassica Vegetables SurveyONLINE Fieldwork: 19th-20th November 2014
Absolutes/col percents
Table 188Q10. There are a large variety of vegetables available on the shelf at supermarkets and local grocery shops. Which of the below do you tend to buy most often?Base: All respondents
Prepared by Populus

Marital StatusWhich of the following ITV regions do you live in?NET:Mar-ried/
NET:CivilWid-part-owed/ner-separ-Civilship/ated/CoPart-coWest-
Div-Separ-Wid-div-Hab-ner-Mar-hab-York-count-WalesTyneScot-Meri-Gran-Gram-Cent-orcedatedowedorceditingshiprieditingSingleshirery& WestTeestishdianLondonadapianralAngliaTotal
98124015014414446604250572754337798186110134101241011Unweighted base
84114213714215452608262543149428382199114137101071011Weighted base
699351121031337048617145163332656715092106981773Traditional fresh82%79%83%82%72%90%82%80%66%84%51%68%76%78%82%75%80%77%90%76%76%vegetables e.g.
potatoes, carrots,cabbage
14272436173110738151381510402028124207Frozen vegetables17%21%17%17%25%7%16%18%28%15%49%27%19%18%12%20%17%21%10%23%20%
-----*338*---21411--12Less traditional fresh-----2%1%1%3%1%---2%1%2%1%1%--1%vegetables e.g. yam,
pak choi, plantain
1--13-699--2224522-119None of these1%--*2%-1%1%3%--5%5%2%5%3%1%1%-1%2%
Page 189
Brassica Vegetables SurveyONLINE Fieldwork: 19th-20th November 2014
Absolutes/col percents
Table 189Q10. There are a large variety of vegetables available on the shelf at supermarkets and local grocery shops. Which of the below do you tend to buy most often?Base: All respondents
Prepared by Populus

Which of the following cities do you live in, or nearest to?None ofPly-South-Brigh-MiltonBirm-Nott-Liver-Manch-Shef-New-Edin-theseCardiffmouthBristolamptonLondonOxfordtonKeynesNorwichinghaminghampoolesterfieldHullLeedscastleburghGlasgowTotal
794336314122114213562764937732813453334401011Unweighted base
703829353223014212755894736743411454238451011Weighted base
43232330261761318194461413261231134323133773Traditional fresh61%62%80%84%81%76%96%87%68%80%69%87%91%82%68%93%76%77%82%75%76%vegetables e.g.
potatoes, carrots,cabbage
2512656441-8112653111019878207Frozen vegetables36%32%20%15%18%19%4%-31%20%30%12%9%15%29%7%21%19%18%18%20%
---*-5----1--11-1--212Less traditional fresh---1%-2%----1%--1%4%-3%--4%1%vegetables e.g. yam,
pak choi, plantain
22--*5-3*-*1-2---2-219None of these3%6%--1%2%-13%1%-*2%-2%---4%-3%2%
Page 190
Brassica Vegetables SurveyONLINE Fieldwork: 19th-20th November 2014
Absolutes/col percents
Table 190Q10. There are a large variety of vegetables available on the shelf at supermarkets and local grocery shops. Which of the below do you tend to buy most often?Base: All respondents
Prepared by Populus

EmploymentSectorRegionSocial GradeAgeGender
York-shire
EastWest&Pri-SouthSouthEast-Mid-Mid-Humb-NorthNorthScot-vatePublicWestEastLondonernWaleslandslandsersideWestEastlandDEC2C1AB65+55-6445-5435-4425-3418-24FemaleMaleTotal
42011896155116121577578881093284262210315224227176198188130924805311011Unweighted base
439127911421311015171919111140912402202802702201501801701701205164951011Weighted base
42212488135125100487187861103789229213267266214148175163163112499477976NET: Any96%98%97%95%95%99%95%100%96%94%99%93%98%95%97%95%98%97%98%97%96%96%93%97%96%96%
377118841301049645687880101368421721024523420113916715315494466441906Potatoes86%93%92%92%79%95%89%96%86%88%91%88%93%90%95%87%87%91%92%93%90%90%78%90%89%90%
3441107911288884360737991326418917421722816811415214114291413396809Carrots78%87%87%79%67%87%85%85%81%86%82%79%70%79%79%78%85%76%76%85%83%83%76%80%80%80%
3061027211387834052766175326517817620619719113214311910963400356757Brussels sprouts70%80%80%80%67%82%80%74%83%67%68%78%71%74%80%73%73%87%88%79%70%64%53%78%72%75%
23782659266642947495053204113513215814914492105868761315260575Parsnips54%65%71%65%50%63%57%67%53%55%47%50%45%56%60%56%55%65%61%58%51%51%51%61%52%57%
21669496156563541584647224013810913712610378101719263264245509Peas49%54%54%43%43%55%69%58%64%50%42%53%44%57%50%49%46%47%52%56%42%54%53%51%50%50%
18254355765373328363843192110195114103743867837576221192413Broccoli41%43%39%41%49%37%66%40%40%42%38%48%23%42%43%41%38%34%25%37%49%44%63%43%39%41%
15144354333362720353938191697787988614067764651169172341Cauliflower34%34%39%30%25%35%54%28%38%43%34%47%17%41%35%28%32%28%27%37%45%27%42%33%35%34%
1142525272320111220263413654555752222332505930108110218Cabbage26%19%28%19%18%19%22%17%22%29%31%32%7%22%25%20%19%10%16%18%30%35%25%21%22%22%
91302842161719792027101151445159412230433733101105206Swede21%24%30%29%12%17%37%10%10%22%24%25%13%21%20%18%22%19%15%17%25%22%28%20%21%20%
4215381091399161714331628221119271414153861100Turnip10%12%3%5%8%9%2%5%10%9%15%42%16%14%7%10%8%5%12%15%8%8%12%7%12%10%
4324152417761096745232039292116181823146248110Another vegetable10%19%16%17%13%6%12%14%10%6%6%10%6%10%9%14%11%10%10%10%11%13%12%12%10%11%
2*--1---11--*1*11-*-11*123No vegetables at all**--*---1%1%--*****-*-1%*****
Page 191
Brassica Vegetables SurveyONLINE Fieldwork: 19th-20th November 2014
Absolutes/col percents
Table 191Q11. We'd now like you to think ahead to Christmas day. Which of the below vegetables, if any, do you think you'll be eating as part of your main Christmas meal?Base: All respondents
Prepared by Populus

EmploymentSectorRegionSocial GradeAgeGender
York-shire
EastWest&Pri-SouthSouthEast-Mid-Mid-Humb-NorthNorthScot-vatePublicWestEastLondonernWaleslandslandsersideWestEastlandDEC2C1AB65+55-6445-5435-4425-3418-24FemaleMaleTotal
439127911421311015171919111140912402202802702201501801701701205164951011Weighted base
15237613-34131106134625668161733Not applicable - I3%2%3%5%4%1%5%-3%5%1%7%2%4%3%4%1%3%1%3%4%4%6%3%3%3%won't be eating a
Christmas meal
Page 192
Brassica Vegetables SurveyONLINE Fieldwork: 19th-20th November 2014
Absolutes/col percents
Table 191Q11. We'd now like you to think ahead to Christmas day. Which of the below vegetables, if any, do you think you'll be eating as part of your main Christmas meal?Base: All respondents
Prepared by Populus

What is the combined annual income of your household, prior toDo you have any children aged 18 orWhich of the following best describestax being deducted?under? If so, how old are they?where you live?
Nochild-Hamlet
Anyren& Iso-Urban>£55kAnyAnyAnyagedagedlatedTown- Pop.
or>£48k->£41k->£34k->£28k->£21k->£14k->£7k-Up toagedagedagedunderNET:18 orDwel-Vil-NET:andoverNET:more£55k£48k£41k£34k£28k£21k£14k£7k16-1811-155-105YesunderlinglageRuralFringe10kUrbanTotal
10103267190213218170557711912996284723161831994084048121011Unweighted base
181436812002092051435384126135105300709151882033984098081011Weighted base
18143580194202202136448411812610328968415182197385393778976NET: Any100%100%98%99%97%97%99%95%83%100%94%94%97%96%97%100%97%97%97%96%96%96%
1514337717419318612644821121189627363314170184367355722906Potatoes81%100%92%95%87%92%91%88%82%98%89%87%91%91%89%97%90%91%92%87%89%90%
1713306714518017011038811031058725255611148160331318649809Carrots93%93%85%82%72%86%83%77%71%97%82%78%83%84%78%78%79%79%83%78%80%80%
8122951150167157107367096956821354213151163287306593757Brussels sprouts45%84%82%63%75%80%77%75%68%84%76%71%65%71%76%87%80%80%72%75%73%75%
411214211211613285275060654814842612115127216232448575Parsnips24%82%58%51%56%55%65%60%50%60%48%48%45%49%60%83%61%63%54%57%55%57%
-71738109941157820495464571573511195106211192404509Peas-53%47%47%54%45%56%54%38%59%43%48%54%52%50%71%50%52%53%47%50%50%
117153274878157224965655215325949699157156313413Broccoli61%50%41%40%37%42%40%40%41%58%51%48%49%51%37%26%51%49%39%38%39%41%
118122160697749155059504313720367379141121262341Cauliflower58%56%32%26%30%33%38%34%29%60%47%37%41%46%29%41%39%39%35%30%32%34%
6462046454126102532383691127346488189170218Cabbage35%28%16%25%23%21%20%18%19%30%26%28%35%30%18%17%24%24%20%22%21%22%
8171335464136102122343173131643498473157206Swede45%10%18%16%18%22%20%25%19%25%18%25%30%24%18%38%23%24%21%18%19%20%
51-1214212291311181311346511314374986100Turnip26%10%-15%7%10%11%6%24%13%14%10%10%11%9%6%7%7%9%12%11%10%
155221321915720121313397221921464490110Another vegetable6%32%13%2%11%15%9%10%13%24%9%10%12%13%10%11%10%10%12%11%11%11%
-----1-1----112-***223No vegetables at all-----1%-1%----1%**-******
Page 193
Brassica Vegetables SurveyONLINE Fieldwork: 19th-20th November 2014
Absolutes/col percents
Table 192Q11. We'd now like you to think ahead to Christmas day. Which of the below vegetables, if any, do you think you'll be eating as part of your main Christmas meal?Base: All respondents
Prepared by Populus

What is the combined annual income of your household, prior toDo you have any children aged 18 orWhich of the following best describestax being deducted?under? If so, how old are they?where you live?
Nochild-Hamlet
Anyren& Iso-Urban>£55kAnyAnyAnyagedagedlatedTown- Pop.
or>£48k->£41k->£34k->£28k->£21k->£14k->£7k-Up toagedagedagedunderNET:18 orDwel-Vil-NET:andoverNET:more£55k£48k£41k£34k£28k£21k£14k£7k16-1811-155-105YesunderlinglageRuralFringe10kUrbanTotal
181436812002092051435384126135105300709151882033984098081011Weighted base
--1166379-8921122-6613142733Not applicable - I--2%1%3%3%1%5%17%-6%6%2%4%3%-3%3%3%4%3%3%won't be eating a
Christmas meal
Page 194
Brassica Vegetables SurveyONLINE Fieldwork: 19th-20th November 2014
Absolutes/col percents
Table 192Q11. We'd now like you to think ahead to Christmas day. Which of the below vegetables, if any, do you think you'll be eating as part of your main Christmas meal?Base: All respondents
Prepared by Populus

Marital StatusWhich of the following ITV regions do you live in?NET:Mar-ried/
NET:CivilWid-part-owed/ner-separ-Civilship/ated/CoPart-coWest-
Div-Separ-Wid-div-Hab-ner-Mar-hab-York-count-WalesTyneScot-Meri-Gran-Gram-Cent-orcedatedowedorceditingshiprieditingSingleshirery& WestTeestishdianLondonadapianralAngliaTotal
98124015014414446604250572754337798186110134101241011Unweighted base
84114213714215452608262543149428382199114137101071011Weighted base
8111411331381544059324752314639817619111313310104976NET: Any97%100%97%97%98%100%97%97%94%97%100%94%93%98%93%96%99%97%100%97%96%
77113812612515415554224512443377874169104127898906Potatoes92%96%91%92%88%100%92%91%86%94%76%89%88%95%91%85%91%93%79%92%90%
7382610711115368494206462442345662146931151089809Carrots87%73%62%78%79%100%81%81%79%86%78%86%80%67%76%73%82%84%100%84%80%
66103611297736947317145243932576414280107985757Brussels sprouts78%91%85%82%69%50%82%78%65%83%79%79%77%69%78%72%70%78%94%80%75%
58823908672583501334022282034481165480767575Parsnips70%77%55%66%61%45%57%58%51%74%71%57%47%41%58%58%47%59%65%63%57%
3672365719239318124292034223636854882660509Peas42%63%54%48%50%61%53%52%48%53%65%70%51%44%44%43%42%60%55%56%50%
35414536510166241118172132191631954849240413Broccoli41%37%34%39%46%70%37%40%45%31%68%65%46%20%38%48%42%35%24%38%41%
25393748816121786231627181325544441237341Cauliflower30%25%21%27%34%52%36%36%33%42%52%55%44%16%30%27%38%30%22%35%34%
10121439887134701861112314363429323218Cabbage12%13%6%10%28%54%19%22%27%33%20%22%29%4%17%18%30%21%33%22%22%
10241628490123651871910921392815217206Swede12%21%8%12%20%28%20%20%25%34%23%38%23%11%25%20%25%11%16%16%20%
4161015144602821118134151710110100Turnip5%7%13%8%11%9%10%10%11%4%3%2%43%15%5%8%15%8%8%9%10%
715121444866321236551032818-6110Another vegetable8%6%12%9%10%25%11%11%12%22%10%13%12%6%13%16%7%14%-5%11%
Page 195
Brassica Vegetables SurveyONLINE Fieldwork: 19th-20th November 2014
Absolutes/col percents
Table 193Q11. We'd now like you to think ahead to Christmas day. Which of the below vegetables, if any, do you think you'll be eating as part of your main Christmas meal?Base: All respondents
Prepared by Populus

Marital StatusWhich of the following ITV regions do you live in?NET:Mar-ried/
NET:CivilWid-part-owed/ner-separ-Civilship/ated/CoPart-coWest-
Div-Separ-Wid-div-Hab-ner-Mar-hab-York-count-WalesTyneScot-Meri-Gran-Gram-Cent-orcedatedowedorceditingshiprieditingSingleshirery& WestTeestishdianLondonadapianralAngliaTotal
84114213714215452608262543149428382199114137101071011Weighted base
------111----*-1-1--3No vegetables at all------***----1%-*-1%--*
2-144-1114141-3316713-333Not applicable - I3%-3%3%2%-2%2%5%3%-6%7%2%7%4%1%2%-3%3%won't be eating a
Christmas meal
Page 196
Brassica Vegetables SurveyONLINE Fieldwork: 19th-20th November 2014
Absolutes/col percents
Table 193Q11. We'd now like you to think ahead to Christmas day. Which of the below vegetables, if any, do you think you'll be eating as part of your main Christmas meal?Base: All respondents
Prepared by Populus

Which of the following cities do you live in, or nearest to?None ofPly-South-Brigh-MiltonBirm-Nott-Liver-Manch-Shef-New-Edin-theseCardiffmouthBristolamptonLondonOxfordtonKeynesNorwichinghaminghampoolesterfieldHullLeedscastleburghGlasgowTotal
794336314122114213562764937732813453334401011Unweighted base
703829353223014212755894736743411454238451011Weighted base
68352835302221318265486473574341141393744976NET: Any97%93%97%100%94%97%95%87%95%98%96%100%98%99%100%93%90%93%99%98%96%
65322635281991317245377453367341036383541906Potatoes92%86%91%98%87%86%95%83%90%96%86%94%93%90%100%86%80%90%93%92%90%
5632243225174121520477138306233935343026809Carrots80%84%84%92%79%76%84%72%75%87%80%81%84%84%99%82%78%81%80%59%80%
5029252524170111523467331294730926323029757Brussels sprouts72%76%87%72%76%74%79%74%85%84%82%66%80%63%90%83%58%77%80%65%75%
3824232319133121116394632183618624212115575Parsnips55%64%78%66%58%58%88%53%59%70%52%68%49%48%55%56%53%49%57%34%57%
41271223179841111305626172719722241819509Peas59%72%41%65%54%42%29%53%40%55%63%55%47%36%57%63%49%58%47%42%50%
252512141310966121835201928162181989413Broccoli35%67%40%40%41%47%43%27%44%32%40%42%54%38%46%21%40%46%21%20%41%
3120111686341181834131820142221955341Cauliflower44%53%38%45%25%28%32%51%28%32%38%27%51%26%41%21%49%46%14%10%34%
1811517539*58101813424101101432218Cabbage25%28%18%49%17%17%2%25%29%18%20%28%12%33%31%7%23%33%7%5%22%
1113121010464221098131832141072206Swede16%35%42%30%32%20%25%12%8%19%10%16%36%24%8%13%31%25%19%3%20%
6121316-145711071151766100Turnip9%1%7%2%9%7%-4%15%9%8%2%27%9%4%7%10%40%17%15%10%
45491333914107*72-3423110Another vegetable6%14%14%24%2%14%18%41%3%7%11%16%1%10%7%-6%10%6%7%11%
-----1----1----1--*-3No vegetables at all-----*----1%----7%--1%-*
231-2713112-1*--43-133Not applicable - I3%7%3%-6%3%5%13%5%2%3%-2%1%--10%7%-2%3%won't be eating a
Christmas meal
Page 197
Brassica Vegetables SurveyONLINE Fieldwork: 19th-20th November 2014
Absolutes/col percents
Table 194Q11. We'd now like you to think ahead to Christmas day. Which of the below vegetables, if any, do you think you'll be eating as part of your main Christmas meal?Base: All respondents
Prepared by Populus

EmploymentSectorRegionSocial GradeAgeGender
York-shire
EastWest&Pri-SouthSouthEast-Mid-Mid-Humb-NorthNorthScot-vatePublicWestEastLondonernWaleslandslandsersideWestEastlandDEC2C1AB65+55-6445-5435-4425-3418-24FemaleMaleTotal
42011896155116121577578881093284262210315224227176198188130924805311011Unweighted base
439127911421311015171919111140912402202802702201501801701701205164951011Weighted base
2425647646340253142545423511051231191481067884859051-495495Male55%44%52%45%48%40%50%44%46%60%49%56%56%44%56%42%55%48%52%47%50%53%43%-100%49%
198714477686125404937571840135971611221147296858069516-516Female45%56%48%55%52%60%50%56%54%40%51%44%44%56%44%58%45%52%48%53%50%47%57%100%-51%
Page 198
Brassica Vegetables SurveyONLINE Fieldwork: 19th-20th November 2014
Absolutes/col percents
Table 195GenderBase: All respondents
Prepared by Populus

What is the combined annual income of your household, prior toDo you have any children aged 18 orWhich of the following best describestax being deducted?under? If so, how old are they?where you live?
Nochild-Hamlet
Anyren& Iso-Urban>£55kAnyAnyAnyagedagedlatedTown- Pop.
or>£48k->£41k->£34k->£28k->£21k->£14k->£7k-Up toagedagedagedunderNET:18 orDwel-Vil-NET:andoverNET:more£55k£48k£41k£34k£28k£21k£14k£7k16-1811-155-105YesunderlinglageRuralFringe10kUrbanTotal
10103267190213218170557711912996284723161831994084048121011Unweighted base
181436812002092051435384126135105300709151882033984098081011Weighted base
135194410510898621632656455141352496100175220395495Male72%39%53%54%53%51%48%43%31%38%52%48%52%47%50%27%51%49%44%54%49%49%
591737951021078137526070501593561192103223190413516Female28%61%47%46%47%49%52%57%69%62%48%52%48%53%50%73%49%51%56%46%51%51%
Page 199
Brassica Vegetables SurveyONLINE Fieldwork: 19th-20th November 2014
Absolutes/col percents
Table 196GenderBase: All respondents
Prepared by Populus

Marital StatusWhich of the following ITV regions do you live in?NET:Mar-ried/
NET:CivilWid-part-owed/ner-separ-Civilship/ated/CoPart-coWest-
Div-Separ-Wid-div-Hab-ner-Mar-hab-York-count-WalesTyneScot-Meri-Gran-Gram-Cent-orcedatedowedorceditingshiprieditingSingleshirery& WestTeestishdianLondonadapianralAngliaTotal
98124015014414446604250572754337798186110134101241011Unweighted base
84114213714215452608262543149428382199114137101071011Weighted base
24415435511239305145251524234738975766339495Male29%35%37%32%39%76%53%50%55%47%47%48%55%56%46%49%50%48%35%36%49%
60727948732133031172916251936451025871768516Female71%65%63%68%61%24%47%50%45%53%53%52%45%44%54%51%50%52%65%64%51%
Page 200
Brassica Vegetables SurveyONLINE Fieldwork: 19th-20th November 2014
Absolutes/col percents
Table 197GenderBase: All respondents
Prepared by Populus

Which of the following cities do you live in, or nearest to?None ofPly-South-Brigh-MiltonBirm-Nott-Liver-Manch-Shef-New-Edin-theseCardiffmouthBristolamptonLondonOxfordtonKeynesNorwichinghaminghampoolesterfieldHullLeedscastleburghGlasgowTotal
794336314122114213562764937732813453334401011Unweighted base
703829353223014212755894736743411454238451011Weighted base
33201716181096511214321114117629212028495Male47%52%58%46%57%47%46%26%41%38%49%45%32%56%52%55%65%51%52%62%49%
371812191412181516344526243316516211817516Female53%48%42%54%43%53%54%74%59%62%51%55%68%44%48%45%35%49%48%38%51%
Page 201
Brassica Vegetables SurveyONLINE Fieldwork: 19th-20th November 2014
Absolutes/col percents
Table 198GenderBase: All respondents
Prepared by Populus

EmploymentSectorRegionSocial GradeAgeGender
York-shire
EastWest&Pri-SouthSouthEast-Mid-Mid-Humb-NorthNorthScot-vatePublicWestEastLondonernWaleslandslandsersideWestEastlandDEC2C1AB65+55-6445-5435-4425-3418-24FemaleMaleTotal
42011896155116121577578881093284262210315224227176198188130924805311011Unweighted base
439127911421311015171919111140912402202802702201501801701701205164951011Weighted base
65118182634101413731527183541-----120695112018-2415%9%8%13%20%3%7%14%15%14%7%7%17%11%8%12%15%-----100%13%10%12%
11424103521121291823213633274861----170-809017025-3426%19%11%24%16%12%24%13%20%25%19%8%7%14%12%17%23%----100%-16%18%17%
108292017207121018113531635563544---170--858517035-4425%23%22%12%15%7%23%15%19%12%32%8%17%15%25%12%16%---100%--16%17%17%
803817191526714191515191454485029--180---968418045-5418%30%18%13%12%26%14%20%21%16%14%46%16%22%22%18%11%--100%---19%17%18%
482216132421712914932238314536-150----727815055-6411%17%18%9%18%21%14%17%10%15%8%7%24%16%14%16%13%-100%----14%16%15%
25220402631815141624101753406760220-----11410622065+6%1%21%29%20%30%17%22%15%18%21%24%19%22%18%24%22%100%-----22%21%22%
40.2142.8348.8647.2145.0253.9545.5948.8043.2844.3545.8750.1948.3148.5347.5447.7845.2869.5959.8049.0940.3129.9722.0247.2547.2347.24Average age
Page 202
Brassica Vegetables SurveyONLINE Fieldwork: 19th-20th November 2014
Absolutes/col percents
Table 199AgeBase: All respondents
Prepared by Populus

What is the combined annual income of your household, prior toDo you have any children aged 18 orWhich of the following best describestax being deducted?under? If so, how old are they?where you live?
Nochild-Hamlet
Anyren& Iso-Urban>£55kAnyAnyAnyagedagedlatedTown- Pop.
or>£48k->£41k->£34k->£28k->£21k->£14k->£7k-Up toagedagedagedunderNET:18 orDwel-Vil-NET:andoverNET:more£55k£48k£41k£34k£28k£21k£14k£7k16-1811-155-105YesunderlinglageRuralFringe10kUrbanTotal
10103267190213218170557711912996284723161831994084048121011Unweighted base
181436812002092051435384126135105300709151882033984098081011Weighted base
6346201417191715132532882293130609012018-2432%19%12%7%10%6%8%13%33%2%4%10%24%11%12%11%15%15%7%15%11%12%
6761331522618511535546999-2323648314717025-3431%47%18%16%16%25%13%12%9%1%12%26%51%23%14%-12%12%16%20%18%17%
118224240351373466592111356*2020896115017035-447%5%21%27%21%19%17%9%12%40%52%44%20%38%8%3%10%10%22%15%19%17%
-4101338373925643342457510573137796314318045-54-29%28%16%19%18%19%18%12%51%27%18%5%25%15%45%16%18%20%15%18%18%
5-513282235211156411014013536506411415055-6430%-14%16%14%11%17%15%20%6%5%3%1%3%20%4%19%18%12%16%14%15%
--314414553478**--*22065056867816422065+--8%17%20%21%26%33%14%1%*--*31%37%27%28%22%19%20%22%
37.4234.3442.4146.8347.0546.6649.9150.6842.4645.8041.8638.5431.5739.0550.7654.0549.5649.8947.9545.2346.5747.24Average age
Page 203
Brassica Vegetables SurveyONLINE Fieldwork: 19th-20th November 2014
Absolutes/col percents
Table 200AgeBase: All respondents
Prepared by Populus

Marital StatusWhich of the following ITV regions do you live in?NET:Mar-ried/
NET:CivilWid-part-owed/ner-separ-Civilship/ated/CoPart-coWest-
Div-Separ-Wid-div-Hab-ner-Mar-hab-York-count-WalesTyneScot-Meri-Gran-Gram-Cent-orcedatedowedorceditingshiprieditingSingleshirery& WestTeestishdianLondonadapianralAngliaTotal
98124015014414446604250572754337798186110134101241011Unweighted base
84114213714215452608262543149428382199114137101071011Weighted base
----2869437666421373410183412018-24----20%42%2%7%29%11%19%7%5%16%8%17%9%13%26%4%12%
-4-443151947155123620342124-1717025-34-32%-3%30%7%11%15%27%9%17%25%8%7%25%17%18%17%-16%17%
121-1333473111451481241392837251917035-4415%11%-10%23%30%16%18%17%26%26%24%10%16%11%14%32%18%9%9%17%
1341191521001174486719141323152922618045-5416%39%3%14%10%12%22%19%17%14%20%14%45%17%16%12%13%21%16%24%18%
23193313-869918122742073091922215055-6427%10%22%24%9%-19%16%7%23%6%15%10%24%8%15%8%14%21%21%15%
3613268101133144894710172650232332922065+42%8%75%50%7%9%29%24%3%17%13%15%23%20%32%25%20%17%27%27%22%
59.2445.7669.0561.1737.9035.3653.4149.3635.2047.9141.8245.0850.8748.7849.1846.5745.1045.6148.5852.1747.24Average age
Page 204
Brassica Vegetables SurveyONLINE Fieldwork: 19th-20th November 2014
Absolutes/col percents
Table 201AgeBase: All respondents
Prepared by Populus

Which of the following cities do you live in, or nearest to?None ofPly-South-Brigh-MiltonBirm-Nott-Liver-Manch-Shef-New-Edin-theseCardiffmouthBristolamptonLondonOxfordtonKeynesNorwichinghaminghampoolesterfieldHullLeedscastleburghGlasgowTotal
794336314122114213562764937732813453334401011Unweighted base
703829353223014212755894736743411454238451011Weighted base
143443541131595252738712018-241%9%9%12%11%15%31%4%4%5%17%18%14%2%14%14%15%7%21%17%12%
71136743256518731872113-617025-3410%28%9%18%22%19%14%25%23%9%20%14%9%24%20%21%25%8%-14%17%
101041433213531698256-536917035-4415%28%12%39%10%14%9%12%18%5%18%19%23%34%17%-10%8%15%20%17%
2165333118514206786*6194718045-5430%17%17%8%10%13%11%37%17%25%23%14%18%11%18%4%14%46%9%16%18%
12477332225139743629314815055-6418%10%25%20%9%14%11%8%20%24%10%15%12%4%16%13%20%7%36%19%15%
19381125833518129918567117722065+27%8%28%4%38%25%25%14%19%33%13%19%24%25%15%48%16%26%18%15%22%
52.8041.9751.8042.4449.4346.9143.2145.8747.4554.9242.2646.7847.4646.2345.4551.9844.5550.9349.0046.0047.24Average age
Page 205
Brassica Vegetables SurveyONLINE Fieldwork: 19th-20th November 2014
Absolutes/col percents
Table 202AgeBase: All respondents
Prepared by Populus

EmploymentSectorRegionSocial GradeAgeGender
York-shire
EastWest&Pri-SouthSouthEast-Mid-Mid-Humb-NorthNorthScot-vatePublicWestEastLondonernWaleslandslandsersideWestEastlandDEC2C1AB65+55-6445-5435-4425-3418-24FemaleMaleTotal
42011896155116121577578881093284262210315224227176198188130924805311011Unweighted base
439127911421311015171919111140912402202802702201501801701701205164951011Weighted base
1403523404516793825291523---270603629446141122148270AB32%27%25%28%34%16%13%13%42%28%26%36%25%---100%27%24%16%26%36%34%24%30%27%
11545264041321922152728921--280-674550354835161119280C126%35%29%28%31%32%38%32%17%30%25%22%23%--100%-31%30%28%20%28%29%31%24%28%
1193016212424919262725426-220--40314856271897123220C227%24%18%15%18%24%18%27%28%29%23%9%29%-100%--18%21%26%33%16%15%19%25%22%
65172541223016201212291321240---533854353327135105240DE15%13%28%29%16%29%31%28%13%13%26%33%23%100%---24%25%30%21%20%23%26%21%24%
255804980864826325352572344--28027012781797910976283267550NET: ABC158%63%54%56%66%47%51%45%59%57%51%58%48%--100%100%58%54%44%46%64%63%55%54%54%
184474262455325393839551747240220--9369101916145233228461NET: C2DE42%37%46%44%34%53%49%55%41%43%49%42%52%100%100%--42%46%56%54%36%37%45%46%46%
Page 206
Brassica Vegetables SurveyONLINE Fieldwork: 19th-20th November 2014
Absolutes/col percents
Table 203Social GradeBase: All respondents
Prepared by Populus

What is the combined annual income of your household, prior toDo you have any children aged 18 orWhich of the following best describestax being deducted?under? If so, how old are they?where you live?
Nochild-Hamlet
Anyren& Iso-Urban>£55kAnyAnyAnyagedagedlatedTown- Pop.
or>£48k->£41k->£34k->£28k->£21k->£14k->£7k-Up toagedagedagedunderNET:18 orDwel-Vil-NET:andoverNET:more£55k£48k£41k£34k£28k£21k£14k£7k16-1811-155-105YesunderlinglageRuralFringe10kUrbanTotal
10103267190213218170557711912996284723161831994084048121011Unweighted base
181436812002092051435384126135105300709151882033984098081011Weighted base
157162858614621116264040741953485083137220270AB82%49%43%35%29%29%22%15%1%20%21%29%38%25%27%18%25%25%21%34%27%27%
2110196077592614163029195922155460110110221280C110%9%28%24%30%37%29%18%26%19%24%21%18%20%31%34%29%29%28%27%27%28%
135295746472043240321991128542479380173220C27%23%14%36%29%22%23%14%8%39%32%23%18%31%18%31%23%23%23%19%21%22%
-355252553763419303527751652444611282194240DE-19%14%6%13%12%26%53%64%23%24%26%26%25%23%17%23%23%28%20%24%24%
17826471171391054815325668591334168102110193248441550NET: ABC193%58%72%58%59%66%51%33%27%38%44%51%56%44%59%52%54%54%48%60%55%54%
161034827110096395270674716729378693205162367461NET: C2DE7%42%28%42%41%34%49%67%73%62%56%49%44%56%41%48%46%46%52%40%45%46%
Page 207
Brassica Vegetables SurveyONLINE Fieldwork: 19th-20th November 2014
Absolutes/col percents
Table 204Social GradeBase: All respondents
Prepared by Populus

Marital StatusWhich of the following ITV regions do you live in?NET:Mar-ried/
NET:CivilWid-part-owed/ner-separ-Civilship/ated/CoPart-coWest-
Div-Separ-Wid-div-Hab-ner-Mar-hab-York-count-WalesTyneScot-Meri-Gran-Gram-Cent-orcedatedowedorceditingshiprieditingSingleshirery& WestTeestishdianLondonadapianralAngliaTotal
98124015014414446604250572754337798186110134101241011Unweighted base
84114213714215452608262543149428382199114137101071011Weighted base
1629265621231816215147151718703037414270AB19%17%21%19%40%12%27%30%24%28%44%14%35%21%22%35%27%27%39%13%27%
3231246353109146871651892023622831234280C138%25%28%34%25%19%24%24%33%29%16%37%22%24%29%31%25%23%16%32%28%
8421523812315451103842611362836124220C210%39%5%11%16%52%27%25%20%19%9%17%9%31%14%18%25%27%15%23%22%
29219502829812762131016142030312732334240DE34%19%45%36%19%16%22%21%24%23%31%32%34%24%36%15%24%24%30%32%24%
47521729152313271483119252437411325968648550NET: ABC156%42%49%53%64%31%51%54%57%57%61%51%57%45%50%66%51%50%55%45%54%
37621645110221281113231224184541675669558461NET: C2DE44%58%51%47%36%69%49%46%43%43%39%49%43%55%50%34%49%50%45%55%46%
Page 208
Brassica Vegetables SurveyONLINE Fieldwork: 19th-20th November 2014
Absolutes/col percents
Table 205Social GradeBase: All respondents
Prepared by Populus

Which of the following cities do you live in, or nearest to?None ofPly-South-Brigh-MiltonBirm-Nott-Liver-Manch-Shef-New-Edin-theseCardiffmouthBristolamptonLondonOxfordtonKeynesNorwichinghaminghampoolesterfieldHullLeedscastleburghGlasgowTotal
794336314122114213562764937732813453334401011Unweighted base
703829353223014212755894736743411454238451011Weighted base
9612877736263741118951415167270AB13%16%40%22%22%33%23%29%7%11%41%8%32%24%25%41%31%35%42%16%27%
1415881470338201716101994158514280C121%41%28%21%43%30%25%17%29%36%19%34%27%25%26%37%34%20%13%31%28%
156311241239122511619141114915220C222%17%10%31%6%18%11%14%34%23%29%24%16%26%42%8%25%9%23%34%22%
3210699426881710169182241589240DE45%25%22%25%29%18%41%41%30%30%12%33%26%25%6%14%10%37%22%19%24%
23222015211477910265320213717929232121550NET: ABC133%57%68%43%65%64%48%46%36%47%60%42%58%49%52%79%65%54%55%47%54%
4716920118371118293627153816216191724461NET: C2DE67%43%32%57%35%36%52%54%64%53%40%58%42%51%48%21%35%46%45%53%46%
Page 209
Brassica Vegetables SurveyONLINE Fieldwork: 19th-20th November 2014
Absolutes/col percents
Table 206Social GradeBase: All respondents
Prepared by Populus

EmploymentSectorRegionSocial GradeAgeGender
York-shire
EastWest&Pri-SouthSouthEast-Mid-Mid-Humb-NorthNorthScot-vatePublicWestEastLondonernWaleslandslandsersideWestEastlandDEC2C1AB65+55-6445-5435-4425-3418-24FemaleMaleTotal
42011896155116121577578881093284262210315224227176198188130924805311011Unweighted base
439127911421311015171919111140912402202802702201501801701701205164951011Weighted base
3613----------912126212317221416615405191Scotland8%10%----------100%9%12%8%8%8%15%8%9%4%13%8%10%9%
89---------40-13491510319333182340North East2%7%---------100%-6%2%3%5%4%2%10%2%2%2%3%5%4%
5011--------111--2925282924915352175754111North West11%9%--------100%--12%11%10%11%11%6%9%21%12%6%11%11%11%
4910-------91---12272725161415112313375491Yorkshire & Humberside11%8%-------100%---5%12%10%9%7%9%8%7%13%11%7%11%9%
5214------91----1226153814919181814494291West Midlands12%11%------100%----5%12%5%14%6%6%10%10%10%12%10%8%9%
326-----71-----201922915121410910403171East Midlands7%5%-----100%-----8%9%8%3%7%8%8%6%5%8%8%6%7%
244----51------16919787712124252551Wales6%3%----100%------7%4%7%2%4%5%4%7%7%3%5%5%5%
3015---101-------3024321631212671236140101Eastern7%12%---100%-------12%11%11%6%14%14%14%4%7%3%12%8%10%
6515--131--------222441452624152021266863131London15%12%--100%--------9%11%15%17%12%16%9%12%12%21%13%13%13%
5123-142---------412140404013191735187764142South East12%18%-100%---------17%10%14%15%18%8%11%10%20%15%15%13%14%
41791----------2516262320161720108444791South West9%6%100%----------11%7%9%9%9%11%9%12%6%6%8%10%9%
Page 210
Brassica Vegetables SurveyONLINE Fieldwork: 19th-20th November 2014
Absolutes/col percents
Table 207GO RegionBase: All respondents
Prepared by Populus

What is the combined annual income of your household, prior toDo you have any children aged 18 orWhich of the following best describestax being deducted?under? If so, how old are they?where you live?
Nochild-Hamlet
Anyren& Iso-Urban>£55kAnyAnyAnyagedagedlatedTown- Pop.
or>£48k->£41k->£34k->£28k->£21k->£14k->£7k-Up toagedagedagedunderNET:18 orDwel-Vil-NET:andoverNET:more£55k£48k£41k£34k£28k£21k£14k£7k16-1811-155-105YesunderlinglageRuralFringe10kUrbanTotal
10103267190213218170557711912996284723161831994084048121011Unweighted base
181436812002092051435384126135105300709151882033984098081011Weighted base
--611201521774671022696131841327391Scotland--16%14%10%7%10%5%14%5%5%5%10%7%10%37%7%9%10%8%9%9%
-3113812102511141525-8820123240North East-18%4%1%2%4%6%7%4%6%9%1%3%5%4%-4%4%5%3%4%4%
-12152632196362618114071-1818593594111North West-7%5%18%13%15%9%4%6%7%20%14%10%13%10%-9%9%15%8%12%11%
823913221993416161435552192027447191Yorkshire & Humberside42%11%10%11%7%10%9%6%5%5%13%12%13%12%8%11%10%10%7%11%9%9%
343527111512414102063259-5538478691West Midlands19%27%7%6%14%5%7%8%7%17%8%15%6%11%8%-3%3%10%12%11%9%
--25111319144546415561252616294571East Midlands--5%6%5%6%9%10%8%6%3%4%4%5%8%6%13%13%4%7%6%7%
---28188121657615352131422143651Wales---2%4%8%4%9%2%8%4%5%6%5%5%11%7%7%6%3%4%5%
-2741519281836785138843236461965101Eastern-16%18%5%7%9%14%13%6%7%6%6%5%4%12%27%17%18%12%5%8%10%
22463127221514131919133992-772699125131London13%15%10%7%16%13%11%11%27%15%15%14%12%13%13%-4%3%6%24%15%13%
3169263124271011913274298-33336049109142South East15%5%17%11%13%15%12%19%18%13%7%10%25%14%14%-17%16%15%12%13%14%
2-31419161813291119630611171943307291South West11%-7%18%9%7%9%9%4%10%8%14%6%10%9%9%9%9%11%7%9%9%
Page 211
Brassica Vegetables SurveyONLINE Fieldwork: 19th-20th November 2014
Absolutes/col percents
Table 208GO RegionBase: All respondents
Prepared by Populus

Marital StatusWhich of the following ITV regions do you live in?NET:Mar-ried/
NET:CivilWid-part-owed/ner-separ-Civilship/ated/CoPart-coWest-
Div-Separ-Wid-div-Hab-ner-Mar-hab-York-count-WalesTyneScot-Meri-Gran-Gram-Cent-orcedatedowedorceditingshiprieditingSingleshirery& WestTeestishdianLondonadapianralAngliaTotal
98124015014414446604250572754337798186110134101241011Unweighted base
84114213714215452608262543149428382199114137101071011Weighted base
54716162375520----83--2-7-91Scotland6%35%16%11%12%13%8%9%8%----100%--1%-65%-9%
2--29-21309---40-------40North East2%--1%6%-5%5%3%---95%-------4%
91415122546827-1-----107-4-111North West11%10%10%11%9%10%12%11%10%-3%-----94%-35%-11%
8141294395326-*-2------191Yorkshire & Humberside9%9%9%9%7%27%9%9%10%-1%-5%------1%9%
7-310152395625-7------84--91West Midlands8%-7%7%11%16%9%9%10%-21%------62%--9%
4191493294116-------347-571East Midlands5%6%20%10%6%19%7%7%6%-------3%34%-5%7%
61294-263012--49----2---51Wales7%6%4%6%3%-6%5%5%--100%----2%---5%
10111115*516723------9---91101Eastern11%7%2%8%11%3%11%11%9%------5%---86%10%
81817171527044------131----131London10%8%18%12%12%5%11%11%17%------66%----13%
14252022-5577431----7157*3-9142South East16%19%11%15%16%-12%13%17%1%----87%29%*2%-8%14%
11-1121114962175323---111-3-191South West14%-2%9%8%7%11%10%7%99%75%---13%*-2%-1%9%
Page 212
Brassica Vegetables SurveyONLINE Fieldwork: 19th-20th November 2014
Absolutes/col percents
Table 209GO RegionBase: All respondents
Prepared by Populus
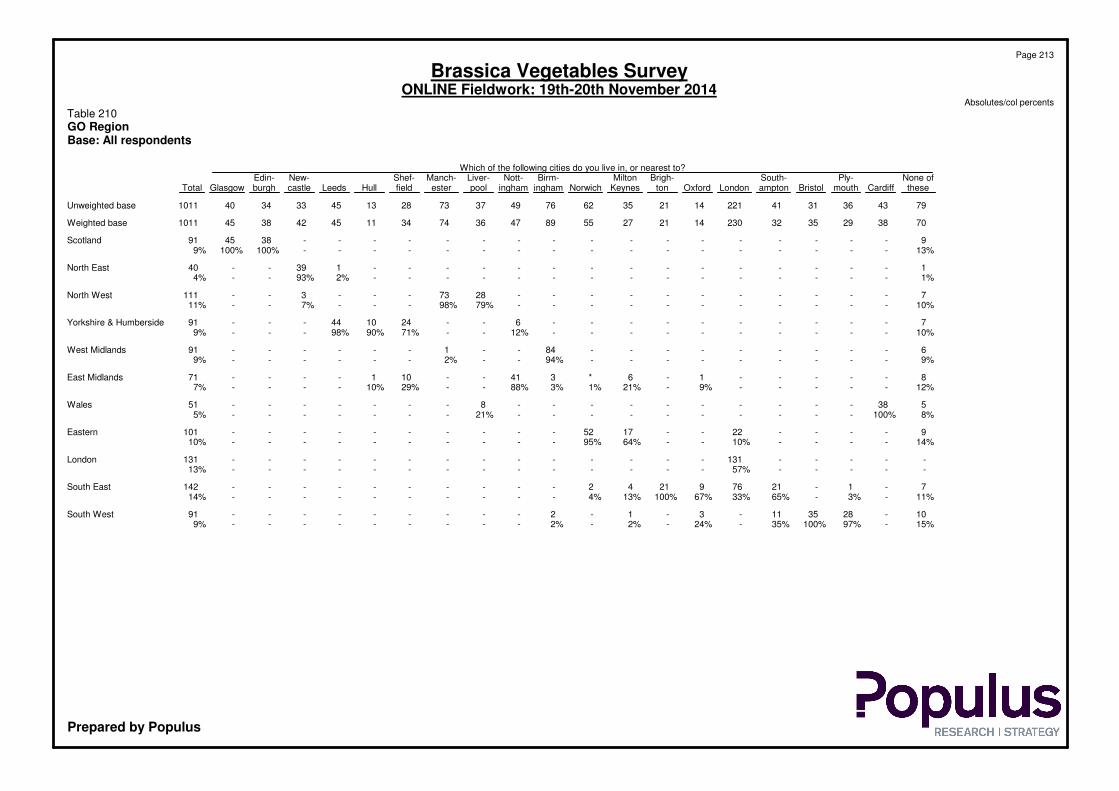
Which of the following cities do you live in, or nearest to?None ofPly-South-Brigh-MiltonBirm-Nott-Liver-Manch-Shef-New-Edin-theseCardiffmouthBristolamptonLondonOxfordtonKeynesNorwichinghaminghampoolesterfieldHullLeedscastleburghGlasgowTotal
794336314122114213562764937732813453334401011Unweighted base
703829353223014212755894736743411454238451011Weighted base
9-----------------384591Scotland13%-----------------100%100%9%
1---------------139--40North East1%---------------2%93%--4%
7-----------2873---3--111North West10%-----------79%98%---7%--11%
7----------6--241044---91Yorkshire & Humberside10%----------12%--71%90%98%---9%
6---------84--1------91West Midlands9%---------94%--2%------9%
8-----1-6*341--101----71East Midlands12%-----9%-21%1%3%88%--29%10%----7%
538----------8-------51Wales8%100%----------21%-------5%
9----22--1752----------101Eastern14%----10%--64%95%----------10%
-----131--------------131London-----57%--------------13%
7-1-217692142----------142South East11%-3%-65%33%67%100%13%4%----------14%
10-283511-3-1-2---------91South West15%-97%100%35%-24%-2%-2%---------9%
Page 213
Brassica Vegetables SurveyONLINE Fieldwork: 19th-20th November 2014
Absolutes/col percents
Table 210GO RegionBase: All respondents
Prepared by Populus

EmploymentSectorRegionSocial GradeAgeGender
York-shire
EastWest&Pri-SouthSouthEast-Mid-Mid-Humb-NorthNorthScot-vatePublicWestEastLondonernWaleslandslandsersideWestEastlandDEC2C1AB65+55-6445-5435-4425-3418-24FemaleMaleTotal
42011896155116121577578881093284262210315224227176198188130924805311011Unweighted base
439127911421311015171919111140912402202802702201501801701701205164951011Weighted base
283815887884727425658791955105139180192141969010411274317300617Yes64%64%64%61%67%47%53%60%62%64%71%48%60%44%63%64%71%64%64%50%61%66%62%61%61%61%
1574533554454242935333221361358110078795490665846199195394No36%36%36%39%33%53%47%40%38%36%29%52%40%56%37%36%29%36%36%50%39%34%38%39%39%39%
Page 214
Brassica Vegetables SurveyONLINE Fieldwork: 19th-20th November 2014
Absolutes/col percents
Table 211Have you taken a foreign holiday in the last 3 years?Base: All respondents
Prepared by Populus

What is the combined annual income of your household, prior toDo you have any children aged 18 orWhich of the following best describestax being deducted?under? If so, how old are they?where you live?
Nochild-Hamlet
Anyren& Iso-Urban>£55kAnyAnyAnyagedagedlatedTown- Pop.
or>£48k->£41k->£34k->£28k->£21k->£14k->£7k-Up toagedagedagedunderNET:18 orDwel-Vil-NET:andoverNET:more£55k£48k£41k£34k£28k£21k£14k£7k16-1811-155-105YesunderlinglageRuralFringe10kUrbanTotal
10103267190213218170557711912996284723161831994084048121011Unweighted base
181436812002092051435384126135105300709151882033984098081011Weighted base
14112266140130116612344727661170446897105243269512617Yes77%77%62%81%70%62%57%43%44%53%57%56%58%57%63%53%52%52%61%66%63%61%
43141660798882304054594413026379198156141296394No23%23%38%19%30%38%43%57%56%47%43%44%42%43%37%47%48%48%39%34%37%39%
Page 215
Brassica Vegetables SurveyONLINE Fieldwork: 19th-20th November 2014
Absolutes/col percents
Table 212Have you taken a foreign holiday in the last 3 years?Base: All respondents
Prepared by Populus

Marital StatusWhich of the following ITV regions do you live in?NET:Mar-ried/
NET:CivilWid-part-owed/ner-separ-Civilship/ated/CoPart-coWest-
Div-Separ-Wid-div-Hab-ner-Mar-hab-York-count-WalesTyneScot-Meri-Gran-Gram-Cent-orcedatedowedorceditingshiprieditingSingleshirery& WestTeestishdianLondonadapianralAngliaTotal
98124015014414446604250572754337798186110134101241011Unweighted base
84114213714215452608262543149428382199114137101071011Weighted base
56527899192823831433521262149491348082550617Yes67%49%65%65%65%62%62%63%55%64%67%54%50%59%60%67%70%60%49%47%61%
2861548506170225119191022213433653455557394No33%51%35%35%35%38%38%37%45%36%33%46%50%41%40%33%30%40%51%53%39%
Page 216
Brassica Vegetables SurveyONLINE Fieldwork: 19th-20th November 2014
Absolutes/col percents
Table 213Have you taken a foreign holiday in the last 3 years?Base: All respondents
Prepared by Populus

Which of the following cities do you live in, or nearest to?None ofPly-South-Brigh-MiltonBirm-Nott-Liver-Manch-Shef-New-Edin-theseCardiffmouthBristolamptonLondonOxfordtonKeynesNorwichinghaminghampoolesterfieldHullLeedscastleburghGlasgowTotal
794336314122114213562764937732813453334401011Unweighted base
703829353223014212755894736743411454238451011Weighted base
362015261715071316255531285319630192627617Yes51%52%50%74%53%65%51%62%58%45%63%66%77%72%55%50%66%44%69%61%61%
34181591581781130331682115615231217394No49%48%50%26%47%35%49%38%42%55%37%34%23%28%45%50%34%56%31%39%39%
Page 217
Brassica Vegetables SurveyONLINE Fieldwork: 19th-20th November 2014
Absolutes/col percents
Table 214Have you taken a foreign holiday in the last 3 years?Base: All respondents
Prepared by Populus

EmploymentSectorRegionSocial GradeAgeGender
York-shire
EastWest&Pri-SouthSouthEast-Mid-Mid-Humb-NorthNorthScot-vatePublicWestEastLondonernWaleslandslandsersideWestEastlandDEC2C1AB65+55-6445-5435-4425-3418-24FemaleMaleTotal
42011896155116121577578881093284262210315224227176198188130924805311011Unweighted base
439127911421311015171919111140912402202802702201501801701701205164951011Weighted base
2537666866982374760617127531411551931691861261441007327346312657NET: Homeowners58%60%73%61%52%81%72%66%66%67%63%66%58%59%71%69%62%85%84%80%59%43%23%67%63%65%
90252750395319242130307347964110801438756211512171163334Owned outright -20%19%30%35%30%53%37%34%23%34%27%18%37%33%29%39%30%65%58%31%12%9%10%33%33%33%without mortgage
16352393630291822403041191961918388433988795815175149323Owned with a mortgage37%41%43%25%23%29%36%32%44%33%37%48%21%26%41%29%33%20%26%49%47%34%13%34%30%32%or loan
17144255058181424262339143898658185342335689078159169328NET: Renters39%35%27%35%44%18%28%34%28%25%35%34%42%41%29%29%31%15%15%19%40%53%65%31%34%32%
601911302927126910718552834242017173223326973142Rented from the council14%15%13%21%22%2%13%17%6%10%9%17%20%23%13%12%9%9%11%9%19%14%27%13%15%14%
1762566113272517101041039954172341Rented from a housing4%5%2%4%5%6%2%1%3%2%6%4%6%7%4%4%2%4%2%5%5%3%4%3%5%4%association
931911152210611171222515262736574392661427373146Rented from someone21%15%12%10%17%10%12%16%19%13%20%13%16%11%12%13%21%2%2%5%15%36%35%14%15%14%else
166-651--582--2-717-112714111426Rent free4%5%-4%4%1%--5%8%2%--1%-2%6%-*1%1%4%12%2%3%3%
Page 218
Brassica Vegetables SurveyONLINE Fieldwork: 19th-20th November 2014
Absolutes/col percents
Table 215TenureBase: All respondents
Prepared by Populus

What is the combined annual income of your household, prior toDo you have any children aged 18 orWhich of the following best describestax being deducted?under? If so, how old are they?where you live?
Nochild-Hamlet
Anyren& Iso-Urban>£55kAnyAnyAnyagedagedlatedTown- Pop.
or>£48k->£41k->£34k->£28k->£21k->£14k->£7k-Up toagedagedagedunderNET:18 orDwel-Vil-NET:andoverNET:more£55k£48k£41k£34k£28k£21k£14k£7k16-1811-155-105YesunderlinglageRuralFringe10kUrbanTotal
10103267190213218170557711912996284723161831994084048121011Unweighted base
181436812002092051435384126135105300709151882033984098081011Weighted base
612295913913714386165681895218747012131143287227514657NET: Homeowners34%88%80%73%70%65%70%60%30%67%64%66%50%62%66%80%70%70%72%56%64%65%
16132364638453916141683729658691125118243334Owned outright -7%41%36%28%32%30%41%37%17%19%11%12%7%12%42%34%46%45%31%29%30%33%without mortgage
5716367574603374067734515017474552162109271323Owned with a mortgage27%48%45%45%38%36%29%23%13%48%53%54%42%50%25%46%24%26%41%27%34%32%or loan
6272258676156352645465211121534851103174277328NET: Renters34%12%20%27%29%32%30%39%66%31%36%34%49%37%30%20%25%25%26%42%34%32%
---112525242919203028276576-30304567112142Rented from the council---14%12%12%12%20%35%24%24%21%26%22%11%-16%15%11%16%14%14%
-1113101011326741129-6614213541Rented from a housing-5%2%1%2%5%5%7%6%2%5%5%4%4%4%-3%3%3%5%4%4%association
61610303327161349112135110312154586131146Rented from someone34%6%18%12%15%16%13%11%24%5%7%8%20%12%15%20%7%8%11%21%16%14%else
6---25-221--1223-99881726Rent free32%---1%2%-1%4%1%--1%1%3%-5%4%2%2%2%3%
Page 219
Brassica Vegetables SurveyONLINE Fieldwork: 19th-20th November 2014
Absolutes/col percents
Table 216TenureBase: All respondents
Prepared by Populus
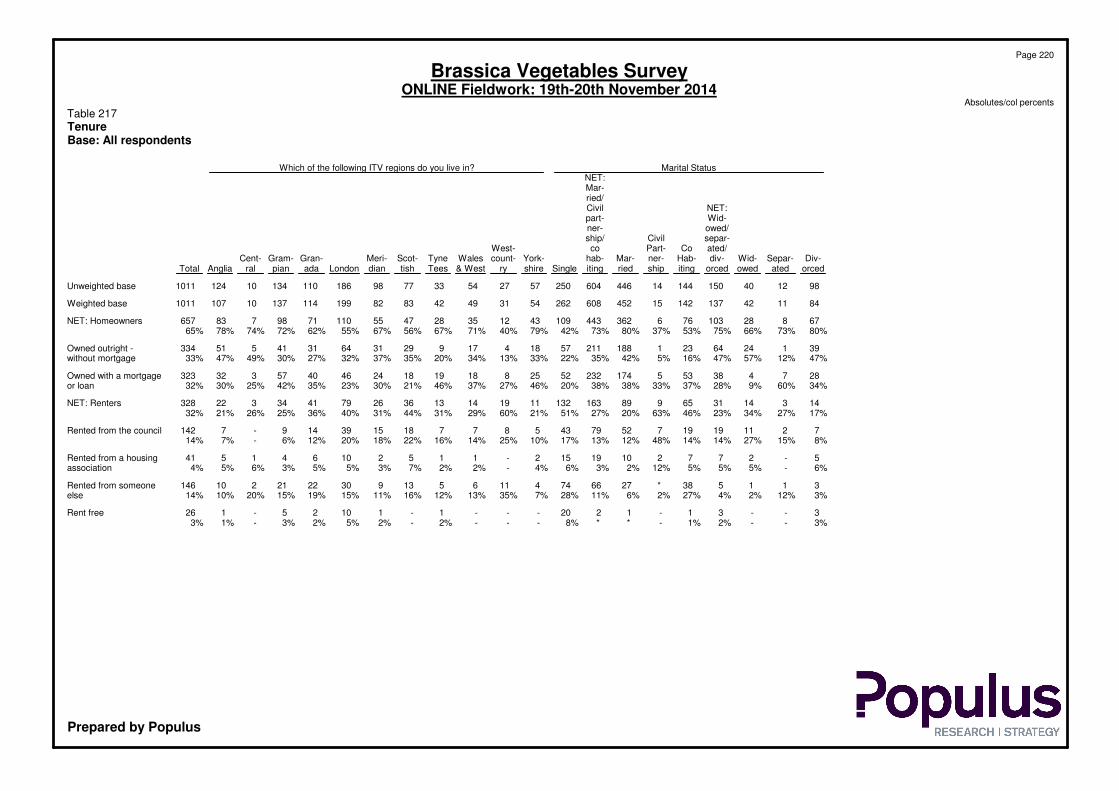
Marital StatusWhich of the following ITV regions do you live in?NET:Mar-ried/
NET:CivilWid-part-owed/ner-separ-Civilship/ated/CoPart-coWest-
Div-Separ-Wid-div-Hab-ner-Mar-hab-York-count-WalesTyneScot-Meri-Gran-Gram-Cent-orcedatedowedorceditingshiprieditingSingleshirery& WestTeestishdianLondonadapianralAngliaTotal
98124015014414446604250572754337798186110134101241011Unweighted base
84114213714215452608262543149428382199114137101071011Weighted base
678281037663624431094312352847551107198783657NET: Homeowners80%73%66%75%53%37%80%73%42%79%40%71%67%56%67%55%62%72%74%78%65%
3912464231188211571841792931643141551334Owned outright -47%12%57%47%16%5%42%35%22%33%13%34%20%35%37%32%27%30%49%47%33%without mortgage
2874385351742325225818191824464057332323Owned with a mortgage34%60%9%28%37%33%38%38%20%46%27%37%46%21%30%23%35%42%25%30%32%or loan
143143165989163132111914133626794134322328NET: Renters17%27%34%23%46%63%20%27%51%21%60%29%31%44%31%40%36%25%26%21%32%
7211191975279435877181539149-7142Rented from the council8%15%27%14%14%48%12%13%17%10%25%14%16%22%18%20%12%6%-7%14%
5-27721019152-115210641541Rented from a housing6%-5%5%5%12%2%3%6%4%-2%2%7%3%5%5%3%6%5%4%association
311538*27667441165139302221210146Rented from someone3%12%2%4%27%2%6%11%28%7%35%13%12%16%11%15%19%15%20%10%14%else
3--31-1220---1-11025-126Rent free3%--2%1%-**8%---2%-2%5%2%3%-1%3%
Page 220
Brassica Vegetables SurveyONLINE Fieldwork: 19th-20th November 2014
Absolutes/col percents
Table 217TenureBase: All respondents
Prepared by Populus

Which of the following cities do you live in, or nearest to?None ofPly-South-Brigh-MiltonBirm-Nott-Liver-Manch-Shef-New-Edin-theseCardiffmouthBristolamptonLondonOxfordtonKeynesNorwichinghaminghampoolesterfieldHullLeedscastleburghGlasgowTotal
794336314122114213562764937732813453334401011Unweighted base
703829353223014212755894736743411454238451011Weighted base
5028272022130101422435830234919929282225657NET: Homeowners71%74%92%57%68%56%73%66%79%79%65%64%64%66%57%79%65%68%58%56%65%
261315515684813302015921681781714334Owned outright -38%34%51%13%48%30%32%39%47%54%23%31%26%28%18%72%38%19%45%32%33%without mortgage
2415121666266913371613281311220510323Owned with a mortgage34%40%41%45%20%27%41%27%33%24%42%33%37%37%39%7%28%49%13%23%32%or loan
19102151090476112617122513211141620328NET: Renters27%26%8%43%31%39%27%34%21%20%30%36%32%34%39%14%24%32%42%44%32%
102-744525-4696311-27810142Rented from the council14%6%-19%14%20%13%25%-8%6%18%17%4%32%-5%16%21%22%14%
41*12111-223-14-1121341Rented from a housing5%3%1%4%8%5%5%-6%3%4%-4%5%-7%3%4%4%7%4%association
66273331245178418218577146Rented from someone8%16%7%19%9%15%9%9%15%9%19%17%11%24%7%7%17%12%17%15%14%else
1---*11---15-1*115---26Rent free1%---1%5%---1%5%-4%1%3%7%10%---3%
Page 221
Brassica Vegetables SurveyONLINE Fieldwork: 19th-20th November 2014
Absolutes/col percents
Table 218TenureBase: All respondents
Prepared by Populus

EmploymentSectorRegionSocial GradeAgeGender
York-shire
EastWest&Pri-SouthSouthEast-Mid-Mid-Humb-NorthNorthScot-vatePublicWestEastLondonernWaleslandslandsersideWestEastlandDEC2C1AB65+55-6445-5435-4425-3418-24FemaleMaleTotal
42011896155116121577578881093284262210315224227176198188130924805311011Unweighted base
439127911421311015171919111140912402202802702201501801701701205164951011Weighted base
61214*--*113-51421141247512No formal education1%1%2%1%3%*--*1%1%7%-2%*1%1%1%*2%*1%3%1%1%1%
1--3-1---121-221231-111257Primary*--2%-1%---1%2%2%-1%1%*1%1%1%-*1%1%*1%1%
3481058311888924760667594317420819722619620012816914912654420407827Secondary school, high79%83%91%83%67%91%93%85%72%83%85%76%81%87%90%81%72%91%86%94%88%74%45%81%82%82%school, NVQ levels 1 to
3, etc.
53143122252915109491714284113187161331564399University degree or12%11%3%8%17%5%4%13%16%11%8%9%10%7%6%10%15%6%12%4%10%8%26%11%9%10%equivalent professional
qualification, NVQlevel 4, etc.
2462310---103212342241--2247181533Higher university6%5%3%2%7%---11%3%2%4%2%1%2%1%9%*--1%14%5%3%3%3%degree, doctorate, MBA,
NVQ level 5, etc.
2-24612---3154*181--*-122101524Still in full time*-2%3%5%1%4%---3%3%6%2%*7%1%--*-1%19%2%3%2%education
2--1---1----1*-2111-*-1123Don't know*--1%---2%----1%*-1%**1%-*-1%***
4---13---2--**2*311-12-336Prefer not to answer1%---1%3%---2%--**1%*1%1%*-1%1%-1%1%1%
Page 222
Brassica Vegetables SurveyONLINE Fieldwork: 19th-20th November 2014
Absolutes/col percents
Table 219What is the highest educational level that you have achieved to date?Base: All respondents
Prepared by Populus

What is the combined annual income of your household, prior toDo you have any children aged 18 orWhich of the following best describestax being deducted?under? If so, how old are they?where you live?
Nochild-Hamlet
Anyren& Iso-Urban>£55kAnyAnyAnyagedagedlatedTown- Pop.
or>£48k->£41k->£34k->£28k->£21k->£14k->£7k-Up toagedagedagedunderNET:18 orDwel-Vil-NET:andoverNET:more£55k£48k£41k£34k£28k£21k£14k£7k16-1811-155-105YesunderlinglageRuralFringe10kUrbanTotal
10103267190213218170557711912996284723161831994084048121011Unweighted base
181436812002092051435384126135105300709151882033984098081011Weighted base
-----2254-56266-**571212No formal education-----1%1%3%7%-4%5%2%2%1%-**1%2%1%1%
----11221-11-16-333147Primary----1%1%1%1%1%-*1%-*1%-2%1%1%**1%
710317116817317712134761051139126156614168182339306645827Secondary school, high39%70%86%87%84%83%87%85%64%91%84%84%87%87%80%93%89%90%85%75%80%82%school, NVQ levels 1 to
3, etc.
8138191991298141372672-9937549199University degree or43%10%8%10%9%9%5%9%18%9%11%10%7%9%10%-5%4%9%13%11%10%equivalent professional
qualification, NVQlevel 4, etc.
332-41281--115528-334263033Higher university18%19%5%-2%6%4%1%--1%*4%2%4%-2%2%1%6%4%3%degree, doctorate, MBA,
NVQ level 5, etc.
---172516--***241555131924Still in full time---1%4%1%3%1%10%--***3%4%3%3%1%3%2%2%education
----11*1------3---2*33Don't know----***1%------*---1%***
---1------**-*4*-*3256Prefer not to answer---2%------**-*1%3%-*1%1%1%1%
Page 223
Brassica Vegetables SurveyONLINE Fieldwork: 19th-20th November 2014
Absolutes/col percents
Table 220What is the highest educational level that you have achieved to date?Base: All respondents
Prepared by Populus

Marital StatusWhich of the following ITV regions do you live in?NET:Mar-ried/
NET:CivilWid-part-owed/ner-separ-Civilship/ated/CoPart-coWest-
Div-Separ-Wid-div-Hab-ner-Mar-hab-York-count-WalesTyneScot-Meri-Gran-Gram-Cent-orcedatedowedorceditingshiprieditingSingleshirery& WestTeestishdianLondonadapianralAngliaTotal
98124015014414446604250572754337798186110134101241011Unweighted base
84114213714215452608262543149428382199114137101071011Weighted base
--11--8832--3-141*-112No formal education--2%*--2%1%1%3%--7%-1%2%1%*-1%1%
----1-461---1-3-2--17Primary----1%-1%1%1%---1%-4%-2%--1%1%
789321191071440152218548234532666814998110992827Secondary school, high93%85%75%87%75%95%89%86%71%90%74%93%75%80%83%75%86%80%90%87%82%school, NVQ levels 1 to
3, etc.
5-91418131503616259827816-699University degree or5%-22%10%13%5%7%8%14%3%19%4%12%11%10%14%7%12%-5%10%equivalent professional
qualification, NVQlevel 4, etc.
-21212-51713-2-12110210-233Higher university-15%2%2%8%-1%3%5%-6%-3%2%1%5%2%7%-2%3%degree, doctorate, MBA,
NVQ level 5, etc.
*--*3-*3202-2*4173-1224Still in full time1%--*2%-**8%5%-4%1%5%2%4%3%-10%1%2%education
----1-22*----1-1-1--3Don't know----1%-***----1%-*-1%--*
1--1--112-*--*-1---36Prefer not to answer1%--*--**1%-1%--1%-*---2%1%
Page 224
Brassica Vegetables SurveyONLINE Fieldwork: 19th-20th November 2014
Absolutes/col percents
Table 221What is the highest educational level that you have achieved to date?Base: All respondents
Prepared by Populus

Which of the following cities do you live in, or nearest to?None ofPly-South-Brigh-MiltonBirm-Nott-Liver-Manch-Shef-New-Edin-theseCardiffmouthBristolamptonLondonOxfordtonKeynesNorwichinghaminghampoolesterfieldHullLeedscastleburghGlasgowTotal
794336314122114213562764937732813453334401011Unweighted base
703829353223014212755894736743411454238451011Weighted base
1-2--5---**--1--13--12No formal education1%-6%--2%---1%*--1%--1%7%--1%
----*3--1---2---11--7Primary----1%1%--4%---5%---1%1%--1%
66342632211751319225164432568321030333035827Secondary school, high94%90%88%90%67%76%91%90%82%93%72%91%69%92%94%89%66%78%81%79%82%school, NVQ levels 1 to
3, etc.
321-8281113153632-1046399University degree or5%5%3%-24%12%9%6%5%5%17%7%16%4%6%-22%9%16%6%10%equivalent professional
qualification, NVQlevel 4, etc.
---2111--1-10-12--31-233Higher university---5%3%5%--3%-11%-2%2%--6%3%-4%3%degree, doctorate, MBA,
NVQ level 5, etc.
121228-1----3*--1*1424Still in full time1%5%3%5%5%3%-4%----8%1%--2%1%3%9%2%education
-----1-----1-------13Don't know-----*-----3%-------2%*
-----1--21-----1*-*-6Prefer not to answer-----*--7%1%-----11%1%-1%-1%
Page 225
Brassica Vegetables SurveyONLINE Fieldwork: 19th-20th November 2014
Absolutes/col percents
Table 222What is the highest educational level that you have achieved to date?Base: All respondents
Prepared by Populus

EmploymentSectorRegionSocial GradeAgeGender
York-shire
EastWest&Pri-SouthSouthEast-Mid-Mid-Humb-NorthNorthScot-vatePublicWestEastLondonernWaleslandslandsersideWestEastlandDEC2C1AB65+55-6445-5435-4425-3418-24FemaleMaleTotal
42011896155116121577578881093284262210315224227176198188130924805311011Unweighted base
439127911421311015171919111140912402202802702201501801701701205164951011Weighted base
38812179131119963964808891408422619425024020013617115715294496414910Yes - responsible for88%95%86%93%91%95%77%90%88%96%82%98%92%94%88%89%89%91%91%95%92%89%78%96%84%90%half or more of the
items bought
5161210125127113201714263130211491318261982101No - not responsible12%5%14%7%9%5%23%10%12%4%18%2%8%6%12%11%11%9%9%5%8%11%22%4%16%10%for most of the items
bought
Page 226
Brassica Vegetables SurveyONLINE Fieldwork: 19th-20th November 2014
Absolutes/col percents
Table 223Thinking about your household's food and grocery shopping, are you personally responsible for selecting half or more of the items to be boughtfrom supermarkets and food shops?Base: All respondents
Prepared by Populus

What is the combined annual income of your household, prior toDo you have any children aged 18 orWhich of the following best describestax being deducted?under? If so, how old are they?where you live?
Nochild-Hamlet
Anyren& Iso-Urban>£55kAnyAnyAnyagedagedlatedTown- Pop.
or>£48k->£41k->£34k->£28k->£21k->£14k->£7k-Up toagedagedagedunderNET:18 orDwel-Vil-NET:andoverNET:more£55k£48k£41k£34k£28k£21k£14k£7k16-1811-155-105YesunderlinglageRuralFringe10kUrbanTotal
10103267190213218170557711912996284723161831994084048121011Unweighted base
181436812002092051435384126135105300709151882033984098081011Weighted base
1311296917219519312852831211249928662213169182359369728910Yes - responsible for70%81%82%85%86%93%94%89%98%99%96%92%94%95%88%90%90%90%90%90%90%90%half or more of the
items bought
53712271511161*5116148712021394080101No - not responsible30%19%18%15%14%7%6%11%2%1%4%8%6%5%12%10%10%10%10%10%10%10%for most of the items
bought
Page 227
Brassica Vegetables SurveyONLINE Fieldwork: 19th-20th November 2014
Absolutes/col percents
Table 224Thinking about your household's food and grocery shopping, are you personally responsible for selecting half or more of the items to be boughtfrom supermarkets and food shops?Base: All respondents
Prepared by Populus

Marital StatusWhich of the following ITV regions do you live in?NET:Mar-ried/
NET:CivilWid-part-owed/ner-separ-Civilship/ated/CoPart-coWest-
Div-Separ-Wid-div-Hab-ner-Mar-hab-York-count-WalesTyneScot-Meri-Gran-Gram-Cent-orcedatedowedorceditingshiprieditingSingleshirery& WestTeestishdianLondonadapianralAngliaTotal
98124015014414446604250572754337798186110134101241011Unweighted base
84114213714215452608262543149428382199114137101071011Weighted base
80114213313614406557217482737417777182961198102910Yes - responsible for95%100%100%97%96%98%90%92%83%89%86%76%98%93%94%92%84%87%78%96%90%half or more of the
items bought
4--45*465144641216516181824101No - not responsible5%--3%4%2%10%8%17%11%14%24%2%7%6%8%16%13%22%4%10%for most of the items
bought
Page 228
Brassica Vegetables SurveyONLINE Fieldwork: 19th-20th November 2014
Absolutes/col percents
Table 225Thinking about your household's food and grocery shopping, are you personally responsible for selecting half or more of the items to be boughtfrom supermarkets and food shops?Base: All respondents
Prepared by Populus

Which of the following cities do you live in, or nearest to?None ofPly-South-Brigh-MiltonBirm-Nott-Liver-Manch-Shef-New-Edin-theseCardiffmouthBristolamptonLondonOxfordtonKeynesNorwichinghaminghampoolesterfieldHullLeedscastleburghGlasgowTotal
794336314122114213562764937732813453334401011Unweighted base
703829353223014212755894736743411454238451011Weighted base
65272429312141019255376453259331142403639910Yes - responsible for92%71%83%82%97%93%72%90%93%96%86%95%91%80%97%100%92%96%97%88%90%half or more of the
items bought
5115611742221333151-3115101No - not responsible8%29%17%18%3%7%28%10%7%4%14%5%9%20%3%-8%4%3%12%10%for most of the items
bought
Page 229
Brassica Vegetables SurveyONLINE Fieldwork: 19th-20th November 2014
Absolutes/col percents
Table 226Thinking about your household's food and grocery shopping, are you personally responsible for selecting half or more of the items to be boughtfrom supermarkets and food shops?Base: All respondents
Prepared by Populus

EmploymentSectorRegionSocial GradeAgeGender
York-shire
EastWest&Pri-SouthSouthEast-Mid-Mid-Humb-NorthNorthScot-vatePublicWestEastLondonernWaleslandslandsersideWestEastlandDEC2C1AB65+55-6445-5435-4425-3418-24FemaleMaleTotal
42011896155116121577578881093284262210315224227176198188130924805311011Unweighted base
439127911421311015171919111140912402202802702201501801701701205164951011Weighted base
84289395517613718229187822694437222944384112587212No cars in the19%22%10%27%42%17%12%18%8%19%20%21%20%32%10%25%16%17%15%16%26%22%34%24%18%21%household
355998210377844558847389327316319821122718312815112613279390408799NET: Any81%78%90%73%58%83%88%82%92%81%80%79%80%68%90%75%84%83%85%84%74%78%66%76%82%79%
17145485244441939253841235396951161181168174616924211214425139%36%52%36%34%43%37%55%28%42%37%56%58%40%43%41%44%53%54%41%36%40%20%41%43%42%
1194129402530191930313452051777877624457484328134149283227%32%32%28%19%30%38%27%33%34%31%13%22%21%35%28%29%28%29%32%28%25%24%26%30%28%
66135117107-285134-1627173153201720264546913+15%10%6%8%6%10%13%-31%5%12%10%-7%12%6%12%2%2%11%10%12%22%9%9%9%
Page 230
Brassica Vegetables SurveyONLINE Fieldwork: 19th-20th November 2014
Absolutes/col percents
Table 227How many cars are there in your household?Base: All respondents
Prepared by Populus

What is the combined annual income of your household, prior toDo you have any children aged 18 orWhich of the following best describestax being deducted?under? If so, how old are they?where you live?
Nochild-Hamlet
Anyren& Iso-Urban>£55kAnyAnyAnyagedagedlatedTown- Pop.
or>£48k->£41k->£34k->£28k->£21k->£14k->£7k-Up toagedagedagedunderNET:18 orDwel-Vil-NET:andoverNET:more£55k£48k£41k£34k£28k£21k£14k£7k16-1811-155-105YesunderlinglageRuralFringe10kUrbanTotal
10103267190213218170557711912996284723161831994084048121011Unweighted base
181436812002092051435384126135105300709151882033984098081011Weighted base
1-3922374649371126311956156-151566132198212No cars in the6%-9%11%11%18%23%35%70%13%21%23%19%19%22%-8%7%17%32%24%21%household
171433721781721599416731001038624455215174188332278610799NET: Any94%100%91%89%89%82%77%65%30%87%79%77%81%81%78%100%92%93%83%68%76%79%
36113082899872132945465011930367481176168344425114%46%31%37%41%43%48%50%25%34%36%34%47%40%43%43%39%40%44%41%43%42%
651634826737153374449361011828798811580195283235%35%44%42%41%32%18%11%6%44%35%37%34%34%26%57%42%43%29%20%24%28%
83691316237-8118-2368-2020412971913+45%19%16%11%7%7%11%5%-9%8%6%-8%10%-11%10%10%7%9%9%
Page 231
Brassica Vegetables SurveyONLINE Fieldwork: 19th-20th November 2014
Absolutes/col percents
Table 228How many cars are there in your household?Base: All respondents
Prepared by Populus

Marital StatusWhich of the following ITV regions do you live in?NET:Mar-ried/
NET:CivilWid-part-owed/ner-separ-Civilship/ated/CoPart-coWest-
Div-Separ-Wid-div-Hab-ner-Mar-hab-York-count-WalesTyneScot-Meri-Gran-Gram-Cent-orcedatedowedorceditingshiprieditingSingleshirery& WestTeestishdianLondonadapianralAngliaTotal
98124015014414446604250572754337798186110134101241011Unweighted base
84114213714215452608262543149428382199114137101071011Weighted base
1721634282518098366101719692117226212No cars in the20%15%38%25%19%10%11%13%37%6%21%12%23%21%23%35%19%13%16%24%21%household
679261021141340152816451254332666313093119981799NET: Any80%85%62%75%81%90%89%87%63%94%79%88%77%79%77%65%81%87%84%76%79%
487217663820027173271618225038644150347425157%66%50%56%44%54%44%45%28%51%50%36%52%60%47%32%36%37%32%44%42%
162522465166218421841961521543843523283219%19%11%16%33%36%37%36%16%34%13%38%16%19%26%27%33%32%52%22%28%
4--45-3439485574-4121326-10913+5%--3%4%-8%6%18%9%16%14%9%-5%6%12%19%-10%9%
Page 232
Brassica Vegetables SurveyONLINE Fieldwork: 19th-20th November 2014
Absolutes/col percents
Table 229How many cars are there in your household?Base: All respondents
Prepared by Populus

Which of the following cities do you live in, or nearest to?None ofPly-South-Brigh-MiltonBirm-Nott-Liver-Manch-Shef-New-Edin-theseCardiffmouthBristolamptonLondonOxfordtonKeynesNorwichinghaminghampoolesterfieldHullLeedscastleburghGlasgowTotal
794336314122114213562764937732813453334401011Unweighted base
703829353223014212755894736743411454238451011Weighted base
1652487525811510416646988212No cars in the24%15%8%11%24%32%13%26%30%20%6%21%12%21%18%32%14%22%20%17%21%household
5432273124155121519448337315928839333037799NET: Any76%85%92%89%76%68%87%74%70%80%94%79%88%79%82%68%86%78%80%83%79%
2914161615796912232623172715621212425425142%38%55%45%47%34%41%46%42%42%29%49%47%36%45%52%46%51%64%57%42%
241111109614281429141519132147612283234%30%37%30%29%26%29%8%28%25%33%30%41%25%37%16%30%18%15%26%28%
-7-5-1524-728--13--54--913+-18%-14%-7%17%20%-13%32%--18%--10%9%--9%
Page 233
Brassica Vegetables SurveyONLINE Fieldwork: 19th-20th November 2014
Absolutes/col percents
Table 230How many cars are there in your household?Base: All respondents
Prepared by Populus

EmploymentSectorRegionSocial GradeAgeGender
York-shire
EastWest&Pri-SouthSouthEast-Mid-Mid-Humb-NorthNorthScot-vatePublicWestEastLondonernWaleslandslandsersideWestEastlandDEC2C1AB65+55-6445-5435-4425-3418-24FemaleMaleTotal
42011896155116121577578881093284262210315224227176198188130924805311011Unweighted base
439127911421311015171919111140912402202802702201501801701701205164951011Weighted base
4041139013110299516979841074091222209264248219146166158153102475468944White92%89%99%93%77%98%100%97%87%93%96%100%100%92%95%94%92%99%97%92%93%90%85%92%95%93%
321419282-21064--1791521131491718382563NET: Non-white7%11%1%7%21%2%-3%12%7%4%--7%4%5%8%1%2%8%5%10%15%7%5%6%
82-72---511--5137--315613316Mixed2%2%-5%2%---6%1%1%--2%*1%3%--2%1%3%5%2%1%2%
1581213--1542--76412--57107121729Asian4%6%1%2%10%--2%6%5%2%--3%3%1%4%--3%4%6%6%2%3%3%
73--121-1*11--528-13311411516Black2%2%--9%1%-1%*1%1%--2%1%3%-1%2%2%1%1%4%2%1%2%
1---1-----------1--1---1-1Chinese*---1%-----------*--1%---*-*
-1---1----------1--1---1-1Other ethnic group-1%---1%----------*--1%---*-*
4--11*--1*--*12*1-1-31-325Prefer not to answer1%--*1%*--1%1%--**1%*1%-*-2%*-1%**
Page 234
Brassica Vegetables SurveyONLINE Fieldwork: 19th-20th November 2014
Absolutes/col percents
Table 231To which of the following ethnic groups do you consider you belong?Base: All respondents
Prepared by Populus

What is the combined annual income of your household, prior toDo you have any children aged 18 orWhich of the following best describestax being deducted?under? If so, how old are they?where you live?
Nochild-Hamlet
Anyren& Iso-Urban>£55kAnyAnyAnyagedagedlatedTown- Pop.
or>£48k->£41k->£34k->£28k->£21k->£14k->£7k-Up toagedagedagedunderNET:18 orDwel-Vil-NET:andoverNET:more£55k£48k£41k£34k£28k£21k£14k£7k16-1811-155-105YesunderlinglageRuralFringe10kUrbanTotal
10103267190213218170557711912996284723161831994084048121011Unweighted base
181436812002092051435384126135105300709151882033984098081011Weighted base
1714368118219519513341741071099026368014188202383359742944White94%100%100%100%91%93%95%93%77%88%85%81%86%88%96%97%100%99%96%88%92%93%
1---17148101281725153528-1114486263NET: Non-white6%---9%7%4%7%23%10%14%19%14%12%4%-**4%12%8%6%
1---51143-112313---5111616Mixed6%---3%1%*3%6%-1%1%2%1%2%---1%3%2%2%
----1185516514101811-116232829Asian----6%4%2%4%1%7%4%10%10%6%2%-**1%6%4%3%
----14218210101123---2131616Black----1%2%1%*15%2%8%7%1%4%*---1%3%2%2%
-----1----1-11-----111Chinese-----*----1%-1%*-----***
------1--1---1----1-11Other ethnic group------*--1%---*----*-**
-----111-12*121*-*2345Prefer not to answer-----*1%*-2%1%*1%1%*3%-**1%1%*
Page 235
Brassica Vegetables SurveyONLINE Fieldwork: 19th-20th November 2014
Absolutes/col percents
Table 232To which of the following ethnic groups do you consider you belong?Base: All respondents
Prepared by Populus

Marital StatusWhich of the following ITV regions do you live in?NET:Mar-ried/
NET:CivilWid-part-owed/ner-separ-Civilship/ated/CoPart-coWest-
Div-Separ-Wid-div-Hab-ner-Mar-hab-York-count-WalesTyneScot-Meri-Gran-Gram-Cent-orcedatedowedorceditingshiprieditingSingleshirery& WestTeestishdianLondonadapianralAngliaTotal
98124015014414446604250572754337798186110134101241011Unweighted base
84114213714215452608262543149428382199114137101071011Weighted base
8211391321371542057223854254942827716611012810103944White98%100%92%96%96%100%93%94%91%100%79%100%100%99%94%84%96%94%100%96%93%
2-355-293423-6---53147-363NET: Non-white2%-8%4%4%-6%6%9%-19%---6%16%4%5%-3%6%
----5-289-5---431--216Mixed----4%-1%1%3%-16%---5%1%1%--2%2%
2--2--19199-1---*1526--29Asian2%--1%--4%3%3%-3%---1%8%2%5%--3%
--33--775------1211--16Black--8%3%--1%1%2%------6%1%1%--2%
--------1------1----1Chinese--------*------1%----*
------11-----------11Other ethnic group------**-----------1%*
------33--*--*11-1-*5Prefer not to answer------1%*--1%--1%1%1%-1%-**
Page 236
Brassica Vegetables SurveyONLINE Fieldwork: 19th-20th November 2014
Absolutes/col percents
Table 233To which of the following ethnic groups do you consider you belong?Base: All respondents
Prepared by Populus

Which of the following cities do you live in, or nearest to?None ofPly-South-Brigh-MiltonBirm-Nott-Liver-Manch-Shef-New-Edin-theseCardiffmouthBristolamptonLondonOxfordtonKeynesNorwichinghaminghampoolesterfieldHullLeedscastleburghGlasgowTotal
794336314122114213562764937732813453334401011Unweighted base
703829353223014212755894736743411454238451011Weighted base
68382935321951418275276473571311141423745944White98%100%100%100%100%85%100%87%99%96%85%99%98%96%91%100%92%100%99%100%93%
1----34-3-2121133-3---63NET: Non-white1%----15%-13%-4%13%1%2%4%9%-7%---6%
-----4-3-25-1-1-----16Mixed-----2%-13%-4%6%-2%-3%-----2%
1----16----6--22-2---29Asian1%----7%----7%--2%5%-5%---3%
-----12----*1-1--1---16Black-----5%----*1%-2%--2%---2%
-----1--------------1Chinese-----*--------------*
-----1--------------1Other ethnic group-----*--------------*
1----1--*-1-----*-*-5Prefer not to answer1%----1%--1%-1%-----1%-1%-*
Page 237
Brassica Vegetables SurveyONLINE Fieldwork: 19th-20th November 2014
Absolutes/col percents
Table 234To which of the following ethnic groups do you consider you belong?Base: All respondents
Prepared by Populus

EmploymentSectorRegionSocial GradeAgeGender
York-shire
EastWest&Pri-SouthSouthEast-Mid-Mid-Humb-NorthNorthScot-vatePublicWestEastLondonernWaleslandslandsersideWestEastlandDEC2C1AB65+55-6445-5435-4425-3418-24FemaleMaleTotal
42011896155116121577578881093284262210315224227176198188130924805311011Unweighted base
439127911421311015171919111140912402202802702201501801701701205164951011Weighted base
228645576715530453955772757146135162144172107102976642316270587Christian52%51%60%54%54%55%59%64%42%60%69%67%62%61%61%58%53%78%72%57%57%39%35%61%55%58%
2416112216-25421-1671218531291510312354NET: Other5%12%1%8%16%6%-3%6%5%2%1%-7%3%4%7%2%2%7%5%9%8%6%5%5%
87-37--1522--522111-457381321Muslim2%6%-2%6%--2%6%2%2%--2%1%1%4%*-2%3%4%3%1%3%2%
4---4---------4-------44-4Hindu1%---3%---------2%-------3%1%-*
3---51----*1-3-21411---526Jewish1%---4%1%----*1%-1%-1%*2%1%1%---1%*1%
-1--1----*---1*-----1---11Sikh-1%--1%----1%---**-----1%---**
2---2----1---1-121-21--134Buddhist1%---2%----1%---*-*1%*-1%*--*1%*
671925-1-*---7164-2427313418Other1%6%1%6%1%5%-1%-1%---3%1%2%1%-1%2%1%4%2%3%1%2%
1794735533340202346323213347676102106414065608964163197360None41%37%39%37%25%39%40%32%51%35%29%31%37%32%34%36%39%19%26%36%36%52%53%32%40%36%
9*-*6**11*--*22522--4146511Prefer not to say2%*-*5%*1%1%1%1%--*1%1%2%1%1%--2%*4%1%1%1%
Page 238
Brassica Vegetables SurveyONLINE Fieldwork: 19th-20th November 2014
Absolutes/col percents
Table 235To which of the following religious groups do you consider yourself to be a member of?Base: All respondents
Prepared by Populus
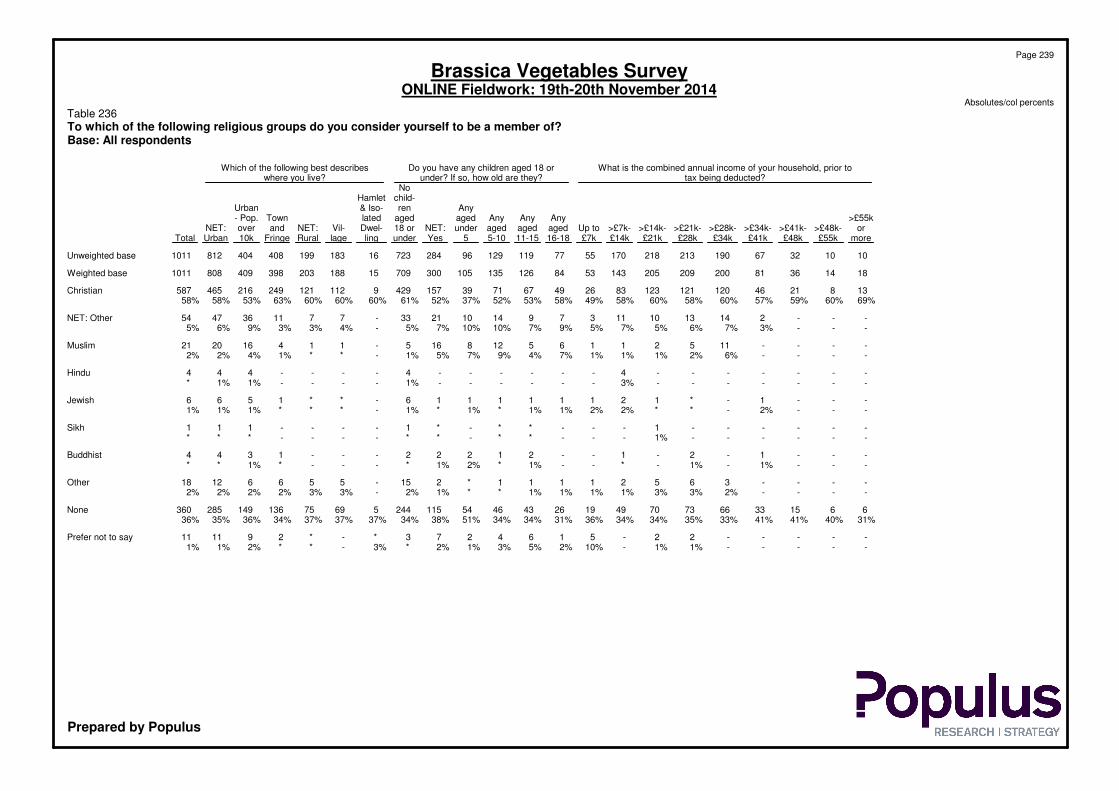
What is the combined annual income of your household, prior toDo you have any children aged 18 orWhich of the following best describestax being deducted?under? If so, how old are they?where you live?
Nochild-Hamlet
Anyren& Iso-Urban>£55kAnyAnyAnyagedagedlatedTown- Pop.
or>£48k->£41k->£34k->£28k->£21k->£14k->£7k-Up toagedagedagedunderNET:18 orDwel-Vil-NET:andoverNET:more£55k£48k£41k£34k£28k£21k£14k£7k16-1811-155-105YesunderlinglageRuralFringe10kUrbanTotal
10103267190213218170557711912996284723161831994084048121011Unweighted base
181436812002092051435384126135105300709151882033984098081011Weighted base
13821461201211238326496771391574299112121249216465587Christian69%60%59%57%60%58%60%58%49%58%53%52%37%52%61%60%60%60%63%53%58%58%
---21413101137914102133-7711364754NET: Other---3%7%6%5%7%5%9%7%10%10%7%5%-4%3%3%9%6%5%
----11521165128165-114162021Muslim----6%2%1%1%1%7%4%9%7%5%1%-**1%4%2%2%
-------4------4----444Hindu-------3%------1%----1%1%*
---1-*121111116-**1566Jewish---2%-**2%2%1%1%*1%*1%-***1%1%1%
------1---**-*1----111Sikh------1%---**-**----***
---1-2-1--21222---1344Buddhist---1%-1%-*--1%*2%1%*---*1%**
----36521111*215-55661218Other----2%3%3%1%1%1%1%**1%2%-3%3%2%2%2%2%
66153366737049192643465411524456975136149285360None31%40%41%41%33%35%34%34%36%31%34%34%51%38%34%37%37%37%34%36%35%36%
-----22-5164273*-*291111Prefer not to say-----1%1%-10%2%5%3%1%2%*3%-**2%1%1%
Page 239
Brassica Vegetables SurveyONLINE Fieldwork: 19th-20th November 2014
Absolutes/col percents
Table 236To which of the following religious groups do you consider yourself to be a member of?Base: All respondents
Prepared by Populus

Marital StatusWhich of the following ITV regions do you live in?NET:Mar-ried/
NET:CivilWid-part-owed/ner-separ-Civilship/ated/CoPart-coWest-
Div-Separ-Wid-div-Hab-ner-Mar-hab-York-count-WalesTyneScot-Meri-Gran-Gram-Cent-orcedatedowedorceditingshiprieditingSingleshirery& WestTeestishdianLondonadapianralAngliaTotal
98124015014414446604250572754337798186110134101241011Unweighted base
84114213714215452608262543149428382199114137101071011Weighted base
5453191703304377118359292650521058070853587Christian65%49%74%66%49%23%67%62%45%65%28%59%63%61%63%53%70%51%76%50%58%
4116212326211--1-32827-754NET: Other5%7%3%5%2%7%5%4%8%2%--1%-4%14%2%5%-7%5%
2--2--15153-----1926--21Muslim3%--2%--3%2%1%-----1%5%2%5%--2%
--------4------4----4Hindu--------2%------2%----*
2-13--33----1--5*--16Jewish2%-3%2%--1%*----1%--2%*--1%1%
------11-------1----1Sikh------**-------*----*
-----1122------2----4Buddhist-----5%**1%------1%----*
-1-12*25121----27-1-718Other-7%-1%2%2%*1%5%2%----2%4%-*-6%2%
2559396910119199121182220153227593258246360None30%44%20%28%49%70%26%33%46%33%70%40%35%39%33%30%28%42%24%43%36%
--11*-671-**-**6-2-*11Prefer not to say--2%1%*-1%1%*-1%1%-1%1%3%-2%-*1%
Page 240
Brassica Vegetables SurveyONLINE Fieldwork: 19th-20th November 2014
Absolutes/col percents
Table 237To which of the following religious groups do you consider yourself to be a member of?Base: All respondents
Prepared by Populus

Which of the following cities do you live in, or nearest to?None ofPly-South-Brigh-MiltonBirm-Nott-Liver-Manch-Shef-New-Edin-theseCardiffmouthBristolamptonLondonOxfordtonKeynesNorwichinghaminghampoolesterfieldHullLeedscastleburghGlasgowTotal
794336314122114213562764937732813453334401011Unweighted base
703829353223014212755894736743411454238451011Weighted base
302018221812681710303525265527728292825587Christian43%53%62%63%55%55%59%84%37%55%40%54%74%75%80%64%62%68%74%57%58%
1--1330-12261-2*-41--54NET: Other1%--2%10%13%-4%7%4%7%1%-3%1%-8%1%--5%
----110----6--2--2---21Muslim----2%4%----7%--2%--4%---2%
-----4--------------4Hindu-----2%--------------*
-----5---1---*---1--6Jewish-----2%---1%---1%---1%--1%
-----1----------*---1Sikh-----*----------1%---*
-----2----------1---4Buddhist-----1%----------3%---*
1--138-121-1--*-----18Other1%--2%8%4%-4%7%3%-1%--1%-----2%
3917111211686315224620917641313919360None56%45%38%34%33%29%41%12%55%41%52%43%26%22%19%36%28%31%25%43%36%
-*--*6--*-11----*-*-11Prefer not to say-1%--1%3%--1%-1%2%----1%-1%-1%
Page 241
Brassica Vegetables SurveyONLINE Fieldwork: 19th-20th November 2014
Absolutes/col percents
Table 238To which of the following religious groups do you consider yourself to be a member of?Base: All respondents
Prepared by Populus

EmploymentSectorRegionSocial GradeAgeGender
York-shire
EastWest&Pri-SouthSouthEast-Mid-Mid-Humb-NorthNorthScot-vatePublicWestEastLondonernWaleslandslandsersideWestEastlandDEC2C1AB65+55-6445-5435-4425-3418-24FemaleMaleTotal
42011896155116121577578881093284262210315224227176198188130924805311011Unweighted base
439127911421311015171919111140912402202802702201501801701701205164951011Weighted base
35510772109125653645867194327319417322122016411414315014790413395808NET: Urban81%84%80%77%95%65%72%63%94%78%84%80%80%81%79%79%81%75%76%79%88%86%75%80%80%80%
1975630499919142947443512328280110137786463618360190220409Urban - Population over45%44%33%34%75%19%28%41%52%48%31%30%35%34%36%39%51%36%43%35%36%49%50%37%44%40%10,000
1585043602646221638275920411129311083865079896430223175398Town and Fringe36%40%47%43%20%46%44%23%42%30%53%50%45%47%42%39%31%39%33%44%53%38%25%43%35%39%
8420193373614265201881846476050563637202331103100203NET: Rural19%16%20%23%5%35%28%37%6%22%16%20%20%19%21%21%19%25%24%21%12%14%25%20%20%20%
77201733732132551918813444254485035312023299296188Village17%16%19%23%5%31%25%35%6%20%16%20%14%18%19%19%18%23%24%17%12%14%24%18%19%19%
7-1--421-2--62553617*-211415Hamlet & Isolated2%-1%--4%3%1%-2%--6%1%2%2%1%3%*4%*-1%2%1%1%Dwelling
Page 242
Brassica Vegetables SurveyONLINE Fieldwork: 19th-20th November 2014
Absolutes/col percents
Table 239Which of the following best describes where you live?Base: All respondents
Prepared by Populus

What is the combined annual income of your household, prior toDo you have any children aged 18 orWhich of the following best describestax being deducted?under? If so, how old are they?where you live?
Nochild-Hamlet
Anyren& Iso-Urban>£55kAnyAnyAnyagedagedlatedTown- Pop.
or>£48k->£41k->£34k->£28k->£21k->£14k->£7k-Up toagedagedagedunderNET:18 orDwel-Vil-NET:andoverNET:more£55k£48k£41k£34k£28k£21k£14k£7k16-1811-155-105YesunderlinglageRuralFringe10kUrbanTotal
10103267190213218170557711912996284723161831994084048121011Unweighted base
181436812002092051435384126135105300709151882033984098081011Weighted base
18102963168167159114457711011779253553---398409808808NET: Urban100%69%81%77%84%80%78%80%85%92%88%87%75%84%78%---100%100%100%80%
1511031858383592831465844116292----409409409Urban - Population over86%9%29%38%43%40%41%41%53%37%37%43%42%39%41%----100%51%40%10,000
381932838476551746646035137261---398-398398Town and Fringe14%60%53%39%42%40%37%38%32%55%51%44%33%46%37%---100%-49%39%
-471931424629871618264715615188203---203NET: Rural-31%19%23%16%20%22%20%15%8%12%13%25%16%22%100%100%100%---20%
-4718273941288614182645144-188188---188Village-31%19%22%14%19%20%20%15%7%11%13%25%15%20%-100%93%---19%
---14351-12--31215-15---15Hamlet & Isolated---1%2%1%2%1%-1%1%--1%2%100%-7%---1%Dwelling
Page 243
Brassica Vegetables SurveyONLINE Fieldwork: 19th-20th November 2014
Absolutes/col percents
Table 240Which of the following best describes where you live?Base: All respondents
Prepared by Populus

Marital StatusWhich of the following ITV regions do you live in?NET:Mar-ried/
NET:CivilWid-part-owed/ner-separ-Civilship/ated/CoPart-coWest-
Div-Separ-Wid-div-Hab-ner-Mar-hab-York-count-WalesTyneScot-Meri-Gran-Gram-Cent-orcedatedowedorceditingshiprieditingSingleshirery& WestTeestishdianLondonadapianralAngliaTotal
98124015014414446604250572754337798186110134101241011Unweighted base
84114213714215452608262543149428382199114137101071011Weighted base
68832108120935748521040293634696617491114773808NET: Urban81%75%76%79%85%58%79%80%80%74%95%73%81%83%80%88%80%83%66%69%80%
31517536231602251291518141331291183465125409Urban - Population over37%44%39%39%44%20%35%37%49%28%59%29%30%37%35%59%30%47%10%24%40%10,000
363165558619726081241122213837575749648398Town and Fringe43%31%37%40%41%38%44%43%31%45%36%44%51%45%45%29%50%36%57%45%39%
163102922695123511421381416242323333203NET: Rural19%25%24%21%15%42%21%20%20%26%5%27%19%17%20%12%20%17%34%31%20%
15192520688115491321281116242222130188Village18%6%22%18%14%42%20%19%19%24%5%25%19%13%20%12%20%16%9%28%19%
12142-7831-1-3--112315Hamlet & Isolated1%19%2%3%1%-1%1%1%2%-2%-4%--1%1%25%3%1%Dwelling
Page 244
Brassica Vegetables SurveyONLINE Fieldwork: 19th-20th November 2014
Absolutes/col percents
Table 241Which of the following best describes where you live?Base: All respondents
Prepared by Populus

Which of the following cities do you live in, or nearest to?None ofPly-South-Brigh-MiltonBirm-Nott-Liver-Manch-Shef-New-Edin-theseCardiffmouthBristolamptonLondonOxfordtonKeynesNorwichinghaminghampoolesterfieldHullLeedscastleburghGlasgowTotal
794336314122114213562764937732813453334401011Unweighted base
703829353223014212755894736743411454238451011Weighted base
4927222926201819222883303065231035343137808NET: Urban70%71%75%82%83%87%56%91%79%52%93%64%85%87%69%87%78%80%82%83%80%
191212121512926774819112312922111517409Urban - Population over28%32%40%34%47%56%14%29%27%13%55%40%31%31%36%76%49%27%41%37%40%10,000
30151017127261314213411194211113221520398Town and Fringe42%39%35%47%36%31%42%62%52%38%39%23%54%57%33%11%29%53%41%46%39%
211176629626266175910210878203NET: Rural30%29%25%18%17%13%44%9%21%48%7%36%15%13%31%13%22%20%18%17%20%
161066629625246165910210856188Village23%27%21%18%17%13%44%9%20%43%7%35%15%13%31%13%22%20%13%13%19%
511-----*3-1------2215Hamlet & Isolated7%2%5%-----1%5%-2%------5%5%1%Dwelling
Page 245
Brassica Vegetables SurveyONLINE Fieldwork: 19th-20th November 2014
Absolutes/col percents
Table 242Which of the following best describes where you live?Base: All respondents
Prepared by Populus

EmploymentSectorRegionSocial GradeAgeGender
York-shire
EastWest&Pri-SouthSouthEast-Mid-Mid-Humb-NorthNorthScot-vatePublicWestEastLondonernWaleslandslandsersideWestEastlandDEC2C1AB65+55-6445-5435-4425-3418-24FemaleMaleTotal
42011896155116121577578881093284262210315224227176198188130924805311011Unweighted base
439127911421311015171919111140912402202802702201501801701701205164951011Weighted base
439127487480452838665862174982150160175266911913713876269297566NET: Working100%100%53%52%61%45%55%54%73%64%55%42%54%34%68%57%65%12%46%66%81%81%63%52%60%56%
333112326257322032584552163857112125151124510310612060187258445Working full time -76%88%35%44%44%32%39%46%64%49%47%41%42%24%51%45%56%6%30%57%62%70%50%36%52%44%working 30 hours per
week or more
1071517122313868149110253735241424163219178239121Working part time -24%12%18%9%18%13%16%8%9%15%8%1%11%10%17%12%9%6%16%9%19%11%14%16%8%12%working between 8 and
29 hours per week
--436851562333253250234215971121951948161333244247198445NET: Not working--47%48%39%55%45%46%27%36%45%58%46%66%32%43%35%88%54%34%19%19%37%48%40%44%
--6108351333533747--10147134232648Not working but seeking--6%7%6%3%10%2%3%3%2%12%3%16%2%3%--7%8%4%8%3%4%5%5%work or temporarily
unemployed or sick
--6414434118711291265-8133632293362Not working and not--6%2%11%4%6%6%1%1%7%17%12%12%1%9%2%-5%7%2%3%27%6%7%6%seeking work/ student
--71411565419364510116649*---561773Retired on a state--8%10%1%15%12%8%4%2%8%8%6%19%4%4%2%29%6%*---11%3%7%pension only
--16292219512917188121329606512641-1--62106168Retired with a private--17%21%17%19%10%17%10%18%16%20%14%5%13%21%24%57%27%-*--12%21%17%pension
--81151441081112111352715184133423138781795House person,--9%8%4%13%8%14%9%12%11%2%12%14%12%5%7%2%9%19%13%8%6%15%3%9%housewife,
househusband, etc.
Page 246
Brassica Vegetables SurveyONLINE Fieldwork: 19th-20th November 2014
Absolutes/col percents
Table 243Which of the following best describes your current working status?Base: All respondents
Prepared by Populus

What is the combined annual income of your household, prior toDo you have any children aged 18 orWhich of the following best describestax being deducted?under? If so, how old are they?where you live?
Nochild-Hamlet
Anyren& Iso-Urban>£55kAnyAnyAnyagedagedlatedTown- Pop.
or>£48k->£41k->£34k->£28k->£21k->£14k->£7k-Up toagedagedagedunderNET:18 orDwel-Vil-NET:andoverNET:more£55k£48k£41k£34k£28k£21k£14k£7k16-1811-155-105YesunderlinglageRuralFringe10kUrbanTotal
10103267190213218170557711912996284723161831994084048121011Unweighted base
181436812002092051435384126135105300709151882033984098081011Weighted base
1712296413113497421353899676214350797104208254462566NET: Working96%89%80%79%65%64%47%29%24%64%71%71%72%71%49%50%51%51%52%62%57%56%
16122349106113772334667666216427847780161204364445Working full time -89%89%65%60%53%54%38%16%5%55%53%49%59%55%39%25%41%40%40%50%45%44%working 30 hours per
week or more
1-61625201919107223114507142024485097121Working part time -6%-16%19%13%10%9%13%19%9%18%23%14%17%10%25%11%12%12%12%12%12%working between 8 and
29 hours per week
12717697610810241303739298635979199190156346445NET: Not working4%11%20%21%35%36%53%71%76%36%29%29%28%29%51%50%49%49%48%38%43%44%
--1-2211171423661236-5525184348Not working but seeking--2%-1%1%6%12%26%3%3%4%5%4%5%-3%3%6%4%5%5%work or temporarily
unemployed or sick
-2-111216917310551646191021315262Not working and not-11%-1%5%1%8%6%32%3%8%4%4%5%6%4%5%5%5%8%6%6%seeking work/ student
----91016268*---*72-191935185373Retired on a state----5%5%8%18%14%*---*10%-10%9%9%4%7%7%pension only
1-493140443111*1-1166337416265127168Retired with a private4%-11%11%15%19%21%22%1%1%**-*23%21%20%20%16%16%16%17%pension
--271623211822423271956394202447237195House person,--6%9%8%11%10%13%3%29%18%20%18%19%5%25%11%12%12%6%9%9%housewife,
househusband, etc.
Page 247
Brassica Vegetables SurveyONLINE Fieldwork: 19th-20th November 2014
Absolutes/col percents
Table 244Which of the following best describes your current working status?Base: All respondents
Prepared by Populus

Marital StatusWhich of the following ITV regions do you live in?NET:Mar-ried/
NET:CivilWid-part-owed/ner-separ-Civilship/ated/CoPart-coWest-
Div-Separ-Wid-div-Hab-ner-Mar-hab-York-count-WalesTyneScot-Meri-Gran-Gram-Cent-orcedatedowedorceditingshiprieditingSingleshirery& WestTeestishdianLondonadapianralAngliaTotal
98124015014414446604250572754337798186110134101241011Unweighted base
84114213714215452608262543149428382199114137101071011Weighted base
34584898122233331823217271842371146889653566NET: Working41%50%18%35%69%84%49%55%70%59%56%54%43%51%46%57%59%65%57%49%56%
2555368611157254153181520183531855876239445Working full time -30%50%12%26%60%77%35%42%59%34%49%40%42%42%37%43%51%55%20%36%44%working 30 hours per
week or more
9-312121667929142717729914414121Working part time -11%-6%9%9%7%15%13%11%25%7%14%1%9%8%15%8%10%37%13%12%working between 8 and
29 hours per week
496348944222927579221422244145854747454445NET: Not working59%50%82%65%31%16%51%45%30%41%44%46%57%49%54%43%41%35%43%51%44%
61184-1115252456351134-448Not working but seeking7%10%2%6%3%-2%2%10%4%12%10%14%3%6%6%2%3%-4%5%work or temporarily
unemployed or sick
5-3810*92033523610315642462Not working and not5%-8%6%7%3%2%3%12%9%7%6%14%12%3%8%5%3%16%3%6%seeking work/ student
16-72211485012263611108811373Retired on a state19%-16%16%*9%11%8%*4%5%12%8%7%14%5%7%6%12%13%7%pension only
231204410-961061793581217391715219168Retired with a private27%12%48%33%7%-21%17%6%17%11%9%19%14%21%20%15%11%16%17%17%pension
133719164844434111891216-1495House person,1%27%8%5%13%5%14%14%2%8%10%8%1%13%10%5%11%11%-13%9%housewife,
househusband, etc.
Page 248
Brassica Vegetables SurveyONLINE Fieldwork: 19th-20th November 2014
Absolutes/col percents
Table 245Which of the following best describes your current working status?Base: All respondents
Prepared by Populus

Which of the following cities do you live in, or nearest to?None ofPly-South-Brigh-MiltonBirm-Nott-Liver-Manch-Shef-New-Edin-theseCardiffmouthBristolamptonLondonOxfordtonKeynesNorwichinghaminghampoolesterfieldHullLeedscastleburghGlasgowTotal
794336314122114213562764937732813453334401011Unweighted base
703829353223014212755894736743411454238451011Weighted base
242515231513371214246825164520335172520566NET: Working34%66%52%65%46%58%53%56%52%44%76%53%46%61%60%30%77%41%67%46%56%
18191014129971011165921143815227161719445Working full time -26%50%35%40%38%43%49%49%42%30%66%45%40%51%44%17%60%38%44%43%44%working 30 hours per
week or more
665933411379427518191121Working part time -8%16%17%25%8%15%4%7%9%14%10%8%5%10%16%13%17%3%23%2%12%working between 8 and
29 hours per week
4613141217987913312122192914810251324445NET: Not working66%34%48%35%54%42%47%44%48%56%24%47%54%39%40%70%23%59%33%54%44%
8321*13-3223-111--51248Not working but seeking11%9%5%4%1%6%-15%8%3%4%-4%2%2%--11%1%5%5%work or temporarily
unemployed or sick
5223115-1-31451-1174662Not working and not7%6%8%9%3%7%-4%-6%1%8%15%2%-7%2%16%12%13%6%seeking work/ student
9212614*12834571-14-373Retired on a state13%4%4%4%17%6%3%2%9%14%4%8%14%10%2%-2%11%-7%7%pension only
133828433341277610767865168Retired with a private18%9%28%6%25%19%22%14%14%22%8%14%16%14%20%55%15%19%15%12%17%pension
112143133257682961212895House person,16%6%2%12%8%6%22%9%18%12%7%17%6%12%17%7%5%1%5%17%9%housewife,
househusband, etc.
Page 249
Brassica Vegetables SurveyONLINE Fieldwork: 19th-20th November 2014
Absolutes/col percents
Table 246Which of the following best describes your current working status?Base: All respondents
Prepared by Populus

EmploymentSectorRegionSocial GradeAgeGender
York-shire
EastWest&Pri-SouthSouthEast-Mid-Mid-Humb-NorthNorthScot-vatePublicWestEastLondonernWaleslandslandsersideWestEastlandDEC2C1AB65+55-6445-5435-4425-3418-24FemaleMaleTotal
420118517268553141515356154595140173130257913714510151239299538Unweighted base
439127487480452838665862174982150160175266911913713876269297566Weighted base
-12772315154614101191317304535222382924117156127NET: Public Sector-100%15%31%19%33%13%16%21%17%19%53%26%21%20%28%20%6%31%32%21%18%15%26%19%22%
-7*-111---131--261*33--257Central government-6%1%-1%2%2%---1%17%2%--1%3%3%1%2%3%--1%2%1%including all
administrativedepartments and centralgovernment agenciessuch as the Bank ofEngland
-2-11-*------11-----*2-2*2HM Forces-2%-1%1%-1%------1%1%-----*1%-1%**
-341716216-5-42917616988230434National Health Service-27%2%9%2%14%8%2%9%-7%-9%3%6%11%3%3%8%8%6%6%3%11%1%6%
-8-23---12----323--4221538Universities and-7%-3%4%---2%3%----2%2%2%--3%1%1%2%2%1%2%Academies funded by
government
--------------------------Courts service--------------------------
-253434-23223--2149-7766-151025Local government-20%5%5%3%8%-5%5%4%4%15%--2%9%5%-9%6%4%4%-6%3%4%administration
-3-*1*---2-----3*--1*12123Police service-3%-1%1%1%---3%-----2%*--***2%1%1%1%
-5-1----*12-212-3-2211-325Public sector housing-4%-1%----1%1%3%-3%1%1%-1%-2%2%1%*-1%1%1%
-10*321---2-2-2134-151-24610Teaching employed by-8%1%4%2%1%---4%-12%-3%1%2%2%-1%5%1%-3%2%2%2%local education
authority includingvoluntary aided schoolsand foundation schools
Page 250
Brassica Vegetables SurveyONLINE Fieldwork: 19th-20th November 2014
Absolutes/col percents
Table 247Do you work in any of the following occupations?Base: All respondents who work
Prepared by Populus

EmploymentSectorRegionSocial GradeAgeGender
York-shire
EastWest&Pri-SouthSouthEast-Mid-Mid-Humb-NorthNorthScot-vatePublicWestEastLondonernWaleslandslandsersideWestEastlandDEC2C1AB65+55-6445-5435-4425-3418-24FemaleMaleTotal
439127487480452838665862174982150160175266911913713876269297566Weighted base
-8---3*13*1--33-2--413--88Public corporations-6%---6%1%2%4%1%1%--4%2%-1%--3%1%2%--3%1%such as the Royal Mail
or British Nuclearfuels or DrivingStandards agency
--------------------------Bradford and Bingley or--------------------------Northern Rock Building
societies
-23354--3--1167943-6563471623Other public sector-18%6%7%5%--7%--2%8%12%9%6%2%2%-9%4%4%2%5%3%5%4%occupation (please
specify as much detailas possible)
439-4151653024325249508366511911514025488010811465198242439None of the above100%-85%69%81%67%87%84%79%83%81%47%74%79%80%72%80%94%69%68%79%82%85%74%81%78%(Private Sector)
Page 251
Brassica Vegetables SurveyONLINE Fieldwork: 19th-20th November 2014
Absolutes/col percents
Table 247Do you work in any of the following occupations?Base: All respondents who work
Prepared by Populus

What is the combined annual income of your household, prior toDo you have any children aged 18 orWhich of the following best describestax being deducted?under? If so, how old are they?where you live?
Nochild-Hamlet
Anyren& Iso-Urban>£55kAnyAnyAnyagedagedlatedTown- Pop.
or>£48k->£41k->£34k->£28k->£21k->£14k->£7k-Up toagedagedagedunderNET:18 orDwel-Vil-NET:andoverNET:more£55k£48k£41k£34k£28k£21k£14k£7k16-1811-155-105YesunderlinglageRuralFringe10kUrbanTotal
992647120128113511249869171205329108999202237439538Unweighted base
1712296413113497421353899676214350797104208254462566Weighted base
28101133341851181314124185-20205056107127NET: Public Sector11%61%34%17%25%25%19%13%11%34%14%15%15%19%24%-21%19%24%22%23%22%
--1-232--21-353-112477Central government--3%-1%3%2%--4%1%-3%2%1%-1%1%1%2%1%1%including all
administrativedepartments and centralgovernment agenciessuch as the Bank ofEngland
----1-1---11111-**1122HM Forces----1%-1%---1%1%1%1%*-******
1-419122113431826-8810152534National Health Service8%-14%1%7%9%3%4%11%5%4%3%2%4%7%-9%8%5%6%6%6%
--2-31-2-2---27---6288Universities and--7%-2%1%-6%-3%---1%2%---3%1%2%2%Academies funded by
government
----------------------Courts service----------------------
-6-7823--4131719-2213102325Local government-45%-11%6%2%3%--8%1%3%2%3%5%-2%2%6%4%5%4%administration
1---*2-----1*12---1333Police service4%---*2%-----1%1%*1%---*1%1%1%
-1--*-21--11-13-222135Public sector housing-8%--*-2%2%--1%1%-1%1%-2%2%1%1%1%1%
--2-241--531-64-33*7710Teaching employed by--8%-2%3%1%--9%4%1%-3%1%-3%3%*3%2%2%local education
authority includingvoluntary aided schoolsand foundation schools
Page 252
Brassica Vegetables SurveyONLINE Fieldwork: 19th-20th November 2014
Absolutes/col percents
Table 248Do you work in any of the following occupations?Base: All respondents who work
Prepared by Populus

What is the combined annual income of your household, prior toDo you have any children aged 18 orWhich of the following best describestax being deducted?under? If so, how old are they?where you live?
Nochild-Hamlet
Anyren& Iso-Urban>£55kAnyAnyAnyagedagedlatedTown- Pop.
or>£48k->£41k->£34k->£28k->£21k->£14k->£7k-Up toagedagedagedunderNET:18 orDwel-Vil-NET:andoverNET:more£55k£48k£41k£34k£28k£21k£14k£7k16-1811-155-105YesunderlinglageRuralFringe10kUrbanTotal
1712296413113497421353899676214350797104208254462566Weighted base
-1-2311--*11244-441348Public corporations-9%-3%2%*1%--1%1%1%2%2%1%-4%4%1%1%1%1%such as the Royal Mail
or British Nuclearfuels or DrivingStandards agency
----------------------Bradford and Bingley or----------------------Northern Rock Building
societies
--115761-2133716---1492323Other public sector--2%2%4%6%6%2%-4%1%3%4%3%5%---7%4%5%4%occupation (please
specify as much detailas possible)
1551954971007836113676826417326477784158197355439None of the above89%39%66%83%75%75%81%87%89%66%86%85%85%81%76%100%79%81%76%78%77%78%(Private Sector)
Page 253
Brassica Vegetables SurveyONLINE Fieldwork: 19th-20th November 2014
Absolutes/col percents
Table 248Do you work in any of the following occupations?Base: All respondents who work
Prepared by Populus

Marital StatusWhich of the following ITV regions do you live in?NET:Mar-ried/
NET:CivilWid-part-owed/ner-separ-Civilship/ated/CoPart-coWest-
Div-Separ-Wid-div-Hab-ner-Mar-hab-York-count-WalesTyneScot-Meri-Gran-Gram-Cent-orcedatedowedorceditingshiprieditingSingleshirery& WestTeestishdianLondonadapianralAngliaTotal
4069559311207311166321529164044986083559538Unweighted base
34584898122233331823217271842371146889653566Weighted base
723132324771426*49137271120-19127NET: Public Sector21%38%44%27%23%14%21%21%23%20%2%14%49%30%18%24%17%22%-36%22%
*1-23-251-*131-11--17Central government1%26%-4%3%-1%1%*-2%2%16%2%-1%1%--2%1%including all
administrativedepartments and centralgovernment agenciessuch as the Bank ofEngland
------111--*--11----2HM Forces------**1%--1%--3%1%----*
3--3711018121-2-41856-734National Health Service10%--7%7%6%5%5%7%4%-8%-10%3%7%7%7%-13%6%
----2-354------3-1-28Universities and----2%-1%1%2%------3%-1%-5%2%Academies funded by
government
---------------------Courts service---------------------
2--26-813103--3-4325-425Local government6%--4%6%-3%4%5%8%--14%-11%2%4%5%-7%4%administration
----*--*3-----*1---*3Police service----*--*2%-----1%*---1%1%
----2-141----2-12*--5Public sector housing----3%-1%1%*----4%-1%3%*--1%
Page 254
Brassica Vegetables SurveyONLINE Fieldwork: 19th-20th November 2014
Absolutes/col percents
Table 249Do you work in any of the following occupations?Base: All respondents who work
Prepared by Populus
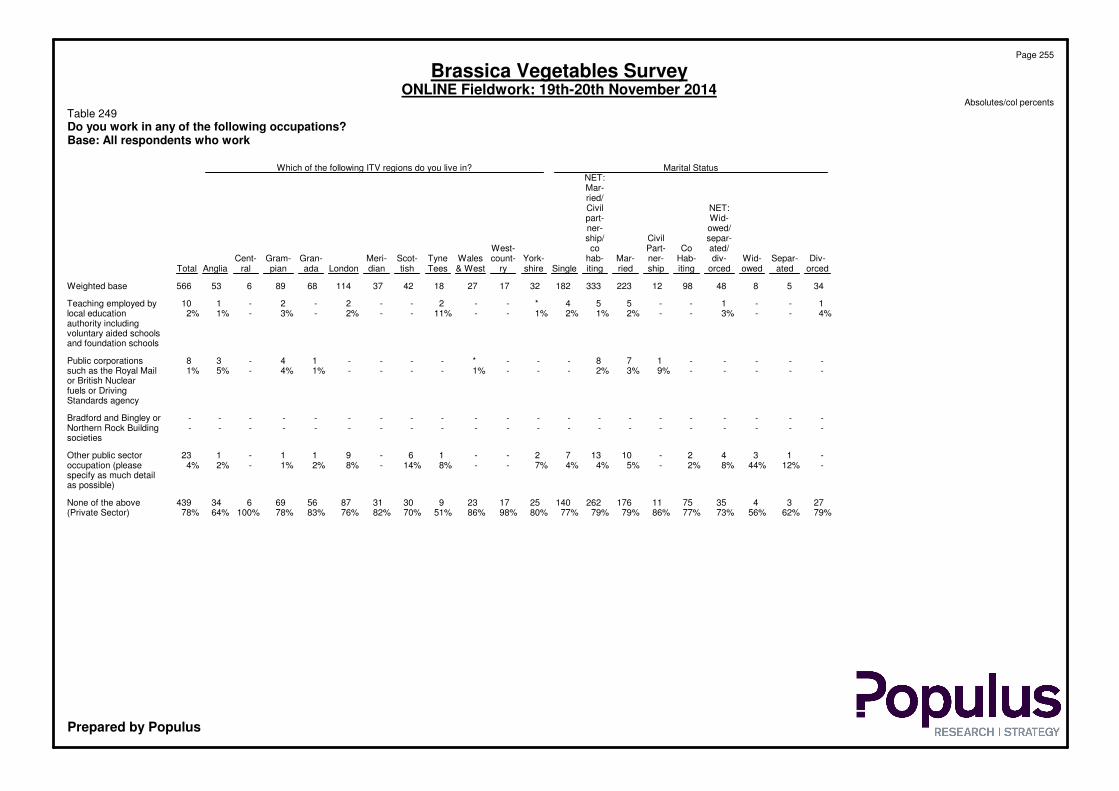
Marital StatusWhich of the following ITV regions do you live in?NET:Mar-ried/
NET:CivilWid-part-owed/ner-separ-Civilship/ated/CoPart-coWest-
Div-Separ-Wid-div-Hab-ner-Mar-hab-York-count-WalesTyneScot-Meri-Gran-Gram-Cent-orcedatedowedorceditingshiprieditingSingleshirery& WestTeestishdianLondonadapianralAngliaTotal
34584898122233331823217271842371146889653566Weighted base
1--1--554*--2--2-2-110Teaching employed by4%--3%--2%1%2%1%--11%--2%-3%-1%2%local education
authority includingvoluntary aided schoolsand foundation schools
-----178---*----14-38Public corporations-----9%3%2%---1%----1%4%-5%1%such as the Royal Mail
or British Nuclearfuels or DrivingStandards agency
---------------------Bradford and Bingley or---------------------Northern Rock Building
societies
-1342-101372--16-911-123Other public sector-12%44%8%2%-5%4%4%7%--8%14%-8%2%1%-2%4%occupation (please
specify as much detailas possible)
273435751117626214025172393031875669634439None of the above79%62%56%73%77%86%79%79%77%80%98%86%51%70%82%76%83%78%100%64%78%(Private Sector)
Page 255
Brassica Vegetables SurveyONLINE Fieldwork: 19th-20th November 2014
Absolutes/col percents
Table 249Do you work in any of the following occupations?Base: All respondents who work
Prepared by Populus

Which of the following cities do you live in, or nearest to?None ofPly-South-Brigh-MiltonBirm-Nott-Liver-Manch-Shef-New-Edin-theseCardiffmouthBristolamptonLondonOxfordtonKeynesNorwichinghaminghampoolesterfieldHullLeedscastleburghGlasgowTotal
30261919181197917295425174015533152219538Unweighted base
242515231513371214246825164520335172520566Weighted base
33245334158141296-5994127NET: Public Sector11%13%11%16%34%25%53%13%32%34%21%5%13%21%28%-15%51%34%20%22%
-1-*-2-------1---31-7Central government-3%-2%-1%-------2%---17%3%-1%including all
administrativedepartments and centralgovernment agenciessuch as the Bank ofEngland
-*--11--------------2HM Forces-2%--7%1%--------------*
-211111-1126-23----4-34National Health Service-9%4%2%4%9%-5%6%8%9%-13%6%----17%-6%
-----3---21-----2---8Universities and-----2%---10%2%-----6%---2%Academies funded by
government
---------------------Courts service---------------------
--11342-3131-23-13--25Local government--4%2%20%3%21%-19%5%4%2%-5%14%-2%15%--4%administration
----*1--*-----2-----3Police service----3%*--3%-----10%-----1%
-----1----*--21---2-5Public sector housing-----*----1%--4%4%---6%-1%
--*--32---------22--10Teaching employed by--3%--2%32%---------6%12%--2%local education
authority includingvoluntary aided schoolsand foundation schools
*--------331-1--*---8Public corporations2%--------11%4%3%-1%--1%---1%such as the Royal Mail
or British Nuclearfuels or DrivingStandards agency
Page 256
Brassica Vegetables SurveyONLINE Fieldwork: 19th-20th November 2014
Absolutes/col percents
Table 250Do you work in any of the following occupations?Base: All respondents who work
Prepared by Populus

Which of the following cities do you live in, or nearest to?None ofPly-South-Brigh-MiltonBirm-Nott-Liver-Manch-Shef-New-Edin-theseCardiffmouthBristolamptonLondonOxfordtonKeynesNorwichinghaminghampoolesterfieldHullLeedscastleburghGlasgowTotal
242515231513371214246825164520335172520566Weighted base
---------------------Bradford and Bingley or---------------------Northern Rock Building
societies
2--2-8-11-1--1---12423Other public sector9%--9%-6%-8%4%-1%--2%---8%8%20%4%occupation (please
specify as much detailas possible)
21221419101003101016532414361432981716439None of the above89%87%89%84%66%75%47%87%68%66%79%95%87%79%72%100%85%49%66%80%78%(Private Sector)
Page 257
Brassica Vegetables SurveyONLINE Fieldwork: 19th-20th November 2014
Absolutes/col percents
Table 250Do you work in any of the following occupations?Base: All respondents who work
Prepared by Populus

EmploymentSectorRegionSocial GradeAgeGender
York-shire
EastWest&Pri-SouthSouthEast-Mid-Mid-Humb-NorthNorthScot-vatePublicWestEastLondonernWaleslandslandsersideWestEastlandDEC2C1AB65+55-6445-5435-4425-3418-24FemaleMaleTotal
42011896155116121577578881093284262210315224227176198188130924805311011Unweighted base
439127911421311015171919111140912402202802702201501801701701205164951011Weighted base
264856198928835565955712569165128221195220140105569988356352709No children aged 18 or60%67%67%70%70%87%70%79%65%60%64%62%75%68%58%79%72%100%94%58%33%58%73%69%71%70%under
17341304239131515323540152275915974*10751136932159141300NET: Yes39%32%33%30%30%13%30%21%35%39%36%38%25%31%42%21%27%*6%42%67%41%27%31%28%30%
6412627135646141141027191940-152154255055105Yes - children aged15%9%6%19%10%5%12%6%6%15%10%9%11%11%9%7%15%-*3%12%32%21%10%11%10%under 5 years old
82141913198762016181735322940-4245935137064135Yes - children aged 519%11%21%9%14%8%14%8%22%17%17%3%8%15%14%10%15%-3%13%35%21%11%14%13%13%to 10 years old
76131191975410162611630403026*634661556065126Yes - children aged 1117%10%12%7%15%7%11%6%11%18%23%28%7%12%18%11%10%*4%19%39%9%4%12%13%12%to 15 years old
36189111366514465419321616*5433411523284Yes - children aged 168%14%9%8%10%6%13%7%16%4%6%13%5%8%15%6%6%*3%24%20%1%1%10%7%8%to 18 years old
21-11*---1---1*-2---*2-*23Refused**-*1%*---1%---**-1%---*1%-***
Page 258
Brassica Vegetables SurveyONLINE Fieldwork: 19th-20th November 2014
Absolutes/col percents
Table 251Do you have any children aged 18 or under? If so, how old are they?Base: All respondents
Prepared by Populus

What is the combined annual income of your household, prior toDo you have any children aged 18 orWhich of the following best describestax being deducted?under? If so, how old are they?where you live?
Nochild-Hamlet
Anyren& Iso-Urban>£55kAnyAnyAnyagedagedlatedTown- Pop.
or>£48k->£41k->£34k->£28k->£21k->£14k->£7k-Up toagedagedagedunderNET:18 orDwel-Vil-NET:andoverNET:more£55k£48k£41k£34k£28k£21k£14k£7k16-1811-155-105YesunderlinglageRuralFringe10kUrbanTotal
10103267190213218170557711912996284723161831994084048121011Unweighted base
181436812002092051435384126135105300709151882033984098081011Weighted base
1713274513114113711341-----70912144156261292553709No children aged 18 or94%96%74%55%65%67%67%79%78%-----100%80%76%77%65%71%68%70%under
11937696867301284126135105300-34547137116253300NET: Yes6%4%26%45%35%33%33%21%22%100%100%100%100%100%-17%24%23%34%28%31%30%
1-51322331514121841105105--2626354479105Yes - children aged6%-14%16%11%16%7%10%2%3%14%30%100%35%--14%13%9%11%10%10%under 5 years old
--516352726138205413541135--18186058117135Yes - children aged 5--15%20%18%13%12%9%15%24%43%100%39%45%--9%9%15%14%15%13%to 10 years old
--2143226271210391265418126-214166446110126Yes - children aged 11--5%17%16%12%13%8%19%47%100%40%17%42%-11%7%8%16%11%14%12%to 15 years old
-13919172473843920284-16746317784Yes - children aged 16-4%8%11%9%8%12%5%5%100%31%15%2%28%-6%3%3%12%8%10%8%to 18 years old
------1--------*-*1123Refused------*--------3%-*****
Page 259
Brassica Vegetables SurveyONLINE Fieldwork: 19th-20th November 2014
Absolutes/col percents
Table 252Do you have any children aged 18 or under? If so, how old are they?Base: All respondents
Prepared by Populus

Marital StatusWhich of the following ITV regions do you live in?NET:Mar-ried/
NET:CivilWid-part-owed/ner-separ-Civilship/ated/CoPart-coWest-
Div-Separ-Wid-div-Hab-ner-Mar-hab-York-count-WalesTyneScot-Meri-Gran-Gram-Cent-orcedatedowedorceditingshiprieditingSingleshirery& WestTeestishdianLondonadapianralAngliaTotal
98124015014414446604250572754337798186110134101241011Unweighted base
84114213714215452608262543149428382199114137101071011Weighted base
717371158882803762153422342761591387393992709No children aged 18 or85%62%89%84%62%57%62%62%82%63%71%70%64%74%72%70%64%68%91%86%70%under
1345215461722324620915152123594144114300NET: Yes15%38%11%16%38%43%38%38%17%37%29%30%36%26%28%30%36%32%9%13%30%
14-429452851651641011271110-7105Yes - children aged1%32%-3%20%30%11%14%6%9%3%13%9%12%13%13%9%7%-6%10%under 5 years old
31382318410720136716528182617135Yes - children aged 54%10%8%6%16%5%18%18%7%24%21%14%3%8%7%14%16%19%9%7%13%to 10 years old
615121317892217351165262614-6126Yes - children aged 118%10%11%9%9%9%17%15%8%13%9%10%27%8%6%13%23%10%-6%12%to 15 years old
711812154661053654917717-584Yes - children aged 168%6%1%6%8%4%12%11%4%9%9%12%12%5%11%9%6%12%-4%8%to 18 years old
--------1------1---*3Refused--------*------1%---**
Page 260
Brassica Vegetables SurveyONLINE Fieldwork: 19th-20th November 2014
Absolutes/col percents
Table 253Do you have any children aged 18 or under? If so, how old are they?Base: All respondents
Prepared by Populus

Which of the following cities do you live in, or nearest to?None ofPly-South-Brigh-MiltonBirm-Nott-Liver-Manch-Shef-New-Edin-theseCardiffmouthBristolamptonLondonOxfordtonKeynesNorwichinghaminghampoolesterfieldHullLeedscastleburghGlasgowTotal
794336314122114213562764937732813453334401011Unweighted base
703829353223014212755894736743411454238451011Weighted base
53252318261611011234958322546211127273329709No children aged 18 or76%66%77%51%82%70%73%54%84%90%65%68%70%63%63%100%61%64%87%64%70%under
1713717668410463115112812-1715516300NET: Yes24%34%23%49%18%29%27%46%15%10%35%32%30%37%37%-38%36%13%36%30%
2532135232268293-7436105Yes - children aged3%13%10%7%3%15%13%12%9%4%7%17%6%12%9%-16%9%9%14%10%under 5 years old
10669*3411331976105-8115135Yes - children aged 514%16%20%25%1%15%9%3%12%5%21%15%17%13%16%-19%3%4%12%13%to 10 years old
633742611131067185-811-6126Yes - children aged 119%9%9%19%12%11%4%4%3%6%11%12%20%24%15%-18%27%-14%12%to 15 years old
851521926-215-413-25-384Yes - children aged 1611%13%3%16%5%8%11%30%-5%17%-12%1%9%-5%12%-8%8%to 18 years old
-----1--*-------1---3Refused-----1%--1%-------2%---*
Page 261
Brassica Vegetables SurveyONLINE Fieldwork: 19th-20th November 2014
Absolutes/col percents
Table 254Do you have any children aged 18 or under? If so, how old are they?Base: All respondents
Prepared by Populus

EmploymentSectorRegionSocial GradeAgeGender
York-shire
EastWest&Pri-SouthSouthEast-Mid-Mid-Humb-NorthNorthScot-vatePublicWestEastLondonernWaleslandslandsersideWestEastlandDEC2C1AB65+55-6445-5435-4425-3418-24FemaleMaleTotal
42011896155116121577578881093284262210315224227176198188130924805311011Unweighted base
439127911421311015171919111140912402202802702201501801701701205164951011Weighted base
341919-91-5-1---3424341429222691746839107Anglia8%15%1%6%-90%-7%-1%---14%11%12%5%13%15%14%5%10%3%13%8%11%
6---------4-731243221-37310Border1%---------3%-7%1%1%1%1%1%1%1%1%-2%1%1%1%
692033---4784----323631372319292524187166137Central16%16%3%2%---66%93%----13%17%11%14%10%13%16%15%14%15%14%13%14%
5611-*--23--107-227282830239153721105857114Granada13%9%-*--3%5%--96%-2%11%13%10%11%10%6%8%22%12%8%11%11%11%
87271571319-------3136627050302328343410297199London20%21%1%41%100%9%-------13%16%22%26%23%20%13%16%20%28%20%20%20%
3171171---------30112318267139207453882Meridian7%5%12%50%---------12%5%8%7%12%5%7%5%12%6%9%8%8%
3013----------832026201717201413613364783STV7%10%----------91%8%12%7%6%8%13%8%8%4%11%7%9%8%
99-------2-40-14491510419432192342Tyne Tees2%7%-------2%-98%-6%2%3%5%4%3%10%2%2%2%4%5%4%
234----49------16818777712124252449Wales5%3%----97%------7%4%6%2%3%5%4%7%7%3%5%5%5%
17*23-----7*1--103514426856161531West4%*26%-----7%1%1%--4%1%2%5%2%1%3%5%3%5%3%3%3%
256531---------1310161591281456292554Westcountry6%5%58%1%---------5%5%6%6%4%8%4%8%3%5%6%5%5%
5211---1-15-88-1-123132292016201024144163104Yorkshire12%9%---1%-22%-96%-2%-5%14%11%11%9%11%11%6%14%12%8%13%10%
Page 262
Brassica Vegetables SurveyONLINE Fieldwork: 19th-20th November 2014
Absolutes/col percents
Table 255Which of the following ITV regions do you live in?Base: All respondents
Prepared by Populus

What is the combined annual income of your household, prior toDo you have any children aged 18 orWhich of the following best describestax being deducted?under? If so, how old are they?where you live?
Nochild-Hamlet
Anyren& Iso-Urban>£55kAnyAnyAnyagedagedlatedTown- Pop.
or>£48k->£41k->£34k->£28k->£21k->£14k->£7k-Up toagedagedagedunderNET:18 orDwel-Vil-NET:andoverNET:more£55k£48k£41k£34k£28k£21k£14k£7k16-1811-155-105YesunderlinglageRuralFringe10kUrbanTotal
10103267190213218170557711912996284723161831994084048121011Unweighted base
181436812002092051435384126135105300709151882033984098081011Weighted base
-2741519272345677149233033482573107Anglia-16%18%5%8%9%13%16%7%6%5%5%7%5%13%22%16%16%12%6%9%11%
--2--4111--1-1921361710Border--6%--2%*1%2%--1%-*1%17%*2%1%*1%1%
3469301629208171426104493122234965114137Central19%27%17%12%15%8%14%14%15%20%11%19%9%15%13%6%12%11%12%16%14%14%
-1215273421527261811417312223573491114Granada-7%5%18%13%16%10%3%5%8%21%14%10%14%10%5%12%11%14%8%11%11%
525848433227161726282759138-242457118174199London28%15%15%10%24%20%16%19%30%20%21%21%25%20%20%-13%12%14%29%22%20%
-126112116167955112359-161637296682Meridian-5%6%8%6%10%8%11%13%11%4%4%10%8%8%-9%8%9%7%8%8%
--311201319764661021613111438316983STV--10%14%10%6%9%5%12%5%5%5%10%7%9%20%6%7%9%8%8%8%
13113812102511141527-8821133442Tyne Tees7%18%4%1%2%4%6%7%5%6%9%1%3%5%4%-4%4%5%3%4%4%
---27178121657615341121322143649Wales---2%4%8%4%8%2%7%4%5%6%5%5%5%7%6%5%3%4%5%
2-15945413361922-2211182931West11%-3%6%4%2%3%3%1%3%2%5%1%3%3%-1%1%3%4%4%3%
--2813710625713520341131424154054Westcountry--5%10%6%4%5%4%4%6%6%10%5%7%5%9%7%7%6%4%5%5%
624111524231226171514386522629284776104Yorkshire36%11%11%14%8%11%11%9%4%8%13%11%13%13%9%15%14%14%7%12%9%10%
Page 263
Brassica Vegetables SurveyONLINE Fieldwork: 19th-20th November 2014
Absolutes/col percents
Table 256Which of the following ITV regions do you live in?Base: All respondents
Prepared by Populus

Marital StatusWhich of the following ITV regions do you live in?NET:Mar-ried/
NET:CivilWid-part-owed/ner-separ-Civilship/ated/CoPart-coWest-
Div-Separ-Wid-div-Hab-ner-Mar-hab-York-count-WalesTyneScot-Meri-Gran-Gram-Cent-orcedatedowedorceditingshiprieditingSingleshirery& WestTeestishdianLondonadapianralAngliaTotal
98124015014414446604250572754337798186110134101241011Unweighted base
84114213714215452608262543149428382199114137101071011Weighted base
11221618*476426----------107107Anglia13%22%5%12%12%3%10%11%10%----------100%11%
----1-773---------10-10Border----1%-1%1%1%---------100%-1%
91918165608138--------137--137Central11%6%21%13%11%35%13%13%15%--------100%--14%
91617142516630-------114---114Granada11%10%15%12%10%10%11%11%11%-------100%---11%
11111222818111065------199----199London13%8%26%16%20%5%18%18%25%------100%----20%
13*11412-364820-----82-----82Meridian15%4%2%10%9%-8%8%8%-----100%-----8%
54716142334918----83------83STV6%35%16%11%10%13%7%8%7%----100%------8%
3--39-22318---42-------42Tyne Tees3%--2%6%-5%5%3%---100%-------4%
61-74-263012--49--------49Wales7%6%-5%3%-6%5%5%--100%--------5%
5--51019215-31---------31West6%--4%7%5%2%3%2%-100%---------3%
4--46*33401154----------54Westcountry5%--3%4%2%7%7%4%100%----------5%
81615104476128-----------104Yorkshire9%9%15%11%7%27%10%10%11%-----------10%
Page 264
Brassica Vegetables SurveyONLINE Fieldwork: 19th-20th November 2014
Absolutes/col percents
Table 257Which of the following ITV regions do you live in?Base: All respondents
Prepared by Populus

Which of the following cities do you live in, or nearest to?None ofPly-South-Brigh-MiltonBirm-Nott-Liver-Manch-Shef-New-Edin-theseCardiffmouthBristolamptonLondonOxfordtonKeynesNorwichinghaminghampoolesterfieldHullLeedscastleburghGlasgowTotal
794336314122114213562764937732813453334401011Unweighted base
703829353223014212755894736743411454238451011Weighted base
10---216--2454-----1----107Anglia14%---5%7%--88%99%-----7%----11%
1----------------34210Border2%----------------7%11%4%1%
8--1--4-2*8237-11*----137Central12%--4%--29%-6%1%92%78%-2%4%4%----14%
7----*------28733---2-114Granada10%----*------79%98%10%---4%-11%
1-1-1192-3------------199London1%-2%-5%84%-16%------------20%
6---28217172-----------82Meridian9%---87%9%53%84%6%-----------8%
8-----------------324383STV12%-----------------85%96%8%
1---------------139--42Tyne Tees2%---------------3%93%--4%
538----------7-------49Wales7%100%----------18%-------5%
7--14--1---7-1---*---31West10%--41%--7%---8%-2%---1%---3%
3-29191-2-------------54Westcountry5%-98%55%4%-11%-------------5%
11----------10--291043---104Yorkshire16%----------22%--86%89%96%---10%
Page 265
Brassica Vegetables SurveyONLINE Fieldwork: 19th-20th November 2014
Absolutes/col percents
Table 258Which of the following ITV regions do you live in?Base: All respondents
Prepared by Populus

EmploymentSectorRegionSocial GradeAgeGender
York-shire
EastWest&Pri-SouthSouthEast-Mid-Mid-Humb-NorthNorthScot-vatePublicWestEastLondonernWaleslandslandsersideWestEastlandDEC2C1AB65+55-6445-5435-4425-3418-24FemaleMaleTotal
42011896155116121577578881093284262210315224227176198188130924805311011Unweighted base
439127911421311015171919111140912402202802702201501801701701205164951011Weighted base
140421743442312162526279206251876281844457176117145262Single32%33%19%31%33%22%24%23%27%28%24%22%22%26%23%31%23%4%12%24%26%42%64%23%29%26%
262716277706730415653683055127154146181144991171119443303305608NET: Married/ Civil60%56%68%55%53%66%59%58%62%58%61%74%61%53%70%52%67%65%66%65%65%55%36%59%62%60%partnership/ co
habiting
176474955525126293939542137981231091231338610073519213239452Married40%37%54%39%39%51%50%42%43%43%48%52%41%41%56%39%45%60%57%56%43%30%7%41%48%45%
1121-1*-3242-228321-241631115Civil Partnership2%1%1%-1%*-4%3%4%1%-2%1%3%1%1%1%-1%3%1%5%1%2%1%
7523112217154915912916282335561013153343288755142Co Habiting17%18%13%16%13%15%9%13%17%10%11%22%18%11%11%12%21%4%9%8%19%25%23%17%11%14%
35131220171191410121521650154626683319134-9443137NET: Widowed/8%10%13%14%13%11%17%19%11%13%13%4%17%21%7%16%10%31%22%10%8%2%-18%9%14%separated/ divorced
43158129344-71921293291---271542Widowed1%3%1%3%6%1%3%12%3%4%4%-8%8%1%4%3%14%6%1%---5%3%4%
32-21111-11-4243211414-7411Separated1%2%-1%1%1%1%1%-1%1%-4%1%2%1%1%*1%2%1%2%-1%1%1%
27711148106478925298321636231312--602484Divorced6%6%12%10%6%10%12%6%7%8%9%4%5%12%4%11%6%16%15%7%7%--12%5%8%
31-11*---*2-*1*12--1111224Prefer not to answer1%*-*1%*---1%1%-****1%--*1%1%1%***
Page 266
Brassica Vegetables SurveyONLINE Fieldwork: 19th-20th November 2014
Absolutes/col percents
Table 259Marital StatusBase: All respondents
Prepared by Populus

What is the combined annual income of your household, prior toDo you have any children aged 18 orWhich of the following best describestax being deducted?under? If so, how old are they?where you live?
Nochild-Hamlet
Anyren& Iso-Urban>£55kAnyAnyAnyagedagedlatedTown- Pop.
or>£48k->£41k->£34k->£28k->£21k->£14k->£7k-Up toagedagedagedunderNET:18 orDwel-Vil-NET:andoverNET:more£55k£48k£41k£34k£28k£21k£14k£7k16-1811-155-105YesunderlinglageRuralFringe10kUrbanTotal
10103267190213218170557711912996284723161831994084048121011Unweighted base
181436812002092051435384126135105300709151882033984098081011Weighted base
6656335254592210212016462153495181129210262Single35%42%13%7%17%25%26%42%41%11%17%15%15%15%30%17%26%25%20%32%26%26%
128317114913612148146692107852323768115123260225485608NET: Married/ Civil65%58%85%88%75%65%59%34%25%79%73%79%81%77%53%55%61%61%65%55%60%60%partnership/ co
habiting
612054113101933795478845217228078895197160357452Married32%9%56%66%57%48%45%26%17%64%62%62%49%57%40%45%47%47%49%39%44%45%
-1-62*122111468-6663915Civil Partnership-8%-8%1%*1%1%3%1%1%1%4%2%1%-3%3%1%1%1%1%
66101234352793121323295488220225862120142Co Habiting33%42%29%14%17%17%13%6%5%14%10%17%28%18%12%11%11%11%15%15%15%14%
--1417213036188128421115425295553108137NET: Widowed/--2%5%9%10%15%25%34%10%10%6%4%7%16%25%13%14%14%13%13%14%separated/ divorced
---14811106153-537191016173242Widowed---1%2%4%5%7%11%1%4%3%-2%5%5%5%5%4%4%4%4%
--1-5113111144721335811Separated--2%-2%**2%2%1%1%1%3%1%1%14%*1%1%1%1%1%
---3812182311763113711151636316884Divorced---4%4%6%9%16%21%8%5%2%1%4%10%5%8%8%9%8%8%8%
----------**-*2*-*2244Prefer not to answer----------**-**3%-**1%**
Page 267
Brassica Vegetables SurveyONLINE Fieldwork: 19th-20th November 2014
Absolutes/col percents
Table 260Marital StatusBase: All respondents
Prepared by Populus

Marital StatusWhich of the following ITV regions do you live in?NET:Mar-ried/
NET:CivilWid-part-owed/ner-separ-Civilship/ated/CoPart-coWest-
Div-Separ-Wid-div-Hab-ner-Mar-hab-York-count-WalesTyneScot-Meri-Gran-Gram-Cent-orcedatedowedorceditingshiprieditingSingleshirery& WestTeestishdianLondonadapianralAngliaTotal
98124015014414446604250572754337798186110134101241011Unweighted base
84114213714215452608262543149428382199114137101071011Weighted base
--------2621151281820653038326262Single--------100%20%15%25%19%21%24%33%26%28%26%24%26%
----14215452608-4021303149481106681764608NET: Married/ Civil----100%100%100%100%-73%66%61%75%59%59%55%58%59%74%60%60%partnership/ co
habiting
------452452-33926223336815160747452Married------100%74%-61%31%52%53%40%44%41%44%44%65%44%45%
-----15-15-*1--2-125-*15Civil Partnership-----100%-2%-1%2%--2%-*1%4%-*1%
----142--142-610491412281416118142Co Habiting----100%--23%-12%33%9%21%17%15%14%12%12%9%16%14%
841142137-----45731614221718-16137NET: Widowed/100%100%100%100%-----7%17%14%6%19%17%11%15%13%-15%14%separated/ divorced
--4242---------711169-242Widowed--100%31%---------8%1%6%5%6%-2%4%
-11-11-------1-4*111-211Separated-100%-8%-------1%-5%**1%*-2%1%
84--84-----45635131199-1184Divorced100%--61%-----7%17%13%6%6%16%5%8%6%-11%8%
----------*--*-12--*4Prefer not to answer----------1%--1%-1%1%--**
Page 268
Brassica Vegetables SurveyONLINE Fieldwork: 19th-20th November 2014
Absolutes/col percents
Table 261Marital StatusBase: All respondents
Prepared by Populus

Which of the following cities do you live in, or nearest to?None ofPly-South-Brigh-MiltonBirm-Nott-Liver-Manch-Shef-New-Edin-theseCardiffmouthBristolamptonLondonOxfordtonKeynesNorwichinghaminghampoolesterfieldHullLeedscastleburghGlasgowTotal
794336314122114213562764937732813453334401011Unweighted base
703829353223014212755894736743411454238451011Weighted base
10115896827111228108191141291010262Single14%30%16%22%28%30%17%33%39%22%31%21%22%25%32%34%27%21%26%22%26%
4319222416131111114395428214520624322327608NET: Married/ Civil62%51%74%68%51%57%79%51%50%71%61%60%58%61%58%52%53%75%61%60%60%partnership/ co
habiting
3316181811994108283919163620417231618452Married47%42%62%51%35%43%31%48%30%51%44%40%44%49%58%34%37%54%41%41%45%
*--1-1---*3611----1115Civil Partnership1%--3%-*---1%3%12%2%1%----2%3%1%
103355317161112448-27977142Co Habiting14%9%12%14%16%14%48%3%20%20%14%8%12%10%-18%16%21%18%17%14%
17734729133479710329248137NET: Widowed/24%18%10%10%21%13%4%16%10%7%8%20%18%13%9%14%19%4%12%18%14%separated/ divorced
2---111-*113614312-2542Widowed3%---2%5%-2%3%1%3%12%3%6%8%6%5%-4%11%4%
11---3-*-----1*-1-1311Separated2%2%---1%-2%-----2%1%-1%-2%7%1%
1463461512234364-1622-84Divorced19%16%10%10%19%7%4%11%7%6%5%7%16%6%-7%13%4%6%-8%
-----1--*---11--*-*-4Prefer not to answer-----1%--1%---2%1%--1%-1%-*
Page 269
Brassica Vegetables SurveyONLINE Fieldwork: 19th-20th November 2014
Absolutes/col percents
Table 262Marital StatusBase: All respondents
Prepared by Populus

EmploymentSectorRegionSocial GradeAgeGender
York-shire
EastWest&Pri-SouthSouthEast-Mid-Mid-Humb-NorthNorthScot-vatePublicWestEastLondonernWaleslandslandsersideWestEastlandDEC2C1AB65+55-6445-5435-4425-3418-24FemaleMaleTotal
42011896155116121577578881093284262210315224227176198188130924805311011Unweighted base
439127911421311015171919111140912402202802702201501801701701205164951011Weighted base
164----------45915147787967172845Glasgow4%3%----------49%4%7%5%3%3%6%4%5%4%6%3%6%4%
179----------388951671446-8182038Edinburgh4%7%----------41%3%4%2%6%3%9%2%3%-7%4%4%4%
89--------339-15481511319333212142Newcastle2%7%--------2%97%-6%2%3%5%5%2%11%2%2%2%4%4%4%
295-------44-1-41115147965117162945Leeds7%4%-------49%-2%-2%5%5%5%3%6%4%3%7%5%3%6%4%
3------1-10---214562*-225611Hull1%------2%-11%---1%*2%2%3%1%*-1%1%1%1%1%
146-----10-24---21499566675161734Sheffield3%4%-----14%-26%---1%6%3%3%2%4%3%3%4%4%3%4%3%
369------1-73--18191918183825182334174Manchester8%7%------1%-66%--8%9%7%7%8%2%5%15%10%1%6%8%7%
142----8---28--961011947835241136Liverpool3%2%----15%---25%--4%3%3%4%4%3%4%5%2%4%5%2%4%
241-----41-6---1611164976979262147Nottingham5%1%-----59%-6%---7%5%6%1%4%5%4%5%4%7%5%4%5%
53142----384----1025173712920161815454389Birmingham12%11%2%----4%92%----4%12%6%14%5%6%11%9%10%13%9%9%9%
168-2-52-*-----1712206181314353342155Norwich4%7%-2%-51%-1%-----7%6%7%2%8%9%8%2%3%2%7%4%5%
10514-17-6-----8982555561161127Milton Keynes2%4%1%3%-17%-8%-----3%4%3%1%2%4%2%3%4%1%3%2%3%
101-21---------833632835115521Brighton2%1%-15%---------4%1%1%2%1%1%4%2%3%1%3%1%2%
Page 270
Brassica Vegetables SurveyONLINE Fieldwork: 19th-20th November 2014
Absolutes/col percents
Table 263Which of the following cities do you live in, or nearest to?Base: All respondents
Prepared by Populus

EmploymentSectorRegionSocial GradeAgeGender
York-shire
EastWest&Pri-SouthSouthEast-Mid-Mid-Humb-NorthNorthScot-vatePublicWestEastLondonernWaleslandslandsersideWestEastlandDEC2C1AB65+55-6445-5435-4425-3418-24FemaleMaleTotal
439127911421311015171919111140912402202802702201501801701701205164951011Weighted base
3439---1-----62333211248614Oxford1%3%4%7%---2%-----2%1%1%1%2%1%1%1%1%4%1%1%1%
10033-7613122-------42417077583231324335121109230London23%26%-54%100%22%-------18%19%25%28%26%21%17%19%25%29%23%22%23%
1051121---------921471233374141832Southampton2%4%12%15%---------4%1%5%3%5%2%2%2%4%3%3%4%3%
19435----------911881731464191635Bristol4%3%39%----------4%5%3%3%1%5%2%8%4%4%4%3%3%
142281---------63812875433121729Plymouth3%1%31%1%---------3%1%3%4%4%5%3%2%2%2%2%3%3%
223----38------10615634610114182038Cardiff5%3%----75%------4%3%6%2%1%3%4%6%6%3%3%4%4%
213107-9586771932151491912211071373370None of these5%2%12%5%-9%11%11%7%7%7%1%10%13%7%5%3%8%8%11%6%4%1%7%7%7%
Page 271
Brassica Vegetables SurveyONLINE Fieldwork: 19th-20th November 2014
Absolutes/col percents
Table 263Which of the following cities do you live in, or nearest to?Base: All respondents
Prepared by Populus

What is the combined annual income of your household, prior toDo you have any children aged 18 orWhich of the following best describestax being deducted?under? If so, how old are they?where you live?
Nochild-Hamlet
Anyren& Iso-Urban>£55kAnyAnyAnyagedagedlatedTown- Pop.
or>£48k->£41k->£34k->£28k->£21k->£14k->£7k-Up toagedagedagedunderNET:18 orDwel-Vil-NET:andoverNET:more£55k£48k£41k£34k£28k£21k£14k£7k16-1811-155-105YesunderlinglageRuralFringe10kUrbanTotal
10103267190213218170557711912996284723161831994084048121011Unweighted base
181436812002092051435384126135105300709151882033984098081011Weighted base
---61559643656162926820173745Glasgow---7%8%2%5%4%7%4%5%4%6%5%4%14%3%4%5%4%5%4%
--65381023--1353325715153138Edinburgh--16%6%2%4%5%1%5%--1%3%2%5%12%3%3%4%4%4%4%
-31131012102511141527-8822113442Newcastle-18%4%1%2%5%6%7%3%6%9%1%3%5%4%-4%4%6%3%4%4%
613169141228871727-101013223545Leeds33%5%7%1%3%4%7%1%3%3%6%6%7%6%4%-5%5%3%5%4%4%
--1122131-----11-22191011Hull--2%2%1%1%*2%2%-----2%-1%1%*2%1%1%
2--361165-35531221-101011122334Sheffield10%--4%3%5%3%4%-4%4%4%3%4%3%-6%5%3%3%3%3%
-1210202411321181092846-9942236574Manchester-7%5%13%10%11%5%2%3%1%14%7%9%9%7%-5%5%11%6%8%7%
---56775247621125-5519113036Liverpool---6%3%4%3%4%4%5%6%5%2%4%4%-3%3%5%3%4%4%
--16871184-67815321161711193047Nottingham--2%7%4%3%5%6%7%-4%5%8%5%5%6%9%8%3%5%4%5%
34162812169215101963158-6634488389Birmingham19%27%3%7%14%6%8%7%5%18%8%14%6%10%8%-3%3%9%12%10%9%
--31910171132332649324262172855Norwich--9%1%4%5%8%8%5%3%3%2%2%2%7%20%13%13%5%2%4%5%
-2-245751-132423*561472227Milton Keynes-16%-2%2%2%3%4%1%-1%2%2%1%3%3%3%3%4%2%3%3%
--111562361131011-221361921Brighton--2%1%1%3%3%2%6%7%1%*2%3%2%-1%1%3%1%2%2%
Page 272
Brassica Vegetables SurveyONLINE Fieldwork: 19th-20th November 2014
Absolutes/col percents
Table 264Which of the following cities do you live in, or nearest to?Base: All respondents
Prepared by Populus

What is the combined annual income of your household, prior toDo you have any children aged 18 orWhich of the following best describestax being deducted?under? If so, how old are they?where you live?
Nochild-Hamlet
Anyren& Iso-Urban>£55kAnyAnyAnyagedagedlatedTown- Pop.
or>£48k->£41k->£34k->£28k->£21k->£14k->£7k-Up toagedagedagedunderNET:18 orDwel-Vil-NET:andoverNET:more£55k£48k£41k£34k£28k£21k£14k£7k16-1811-155-105YesunderlinglageRuralFringe10kUrbanTotal
181436812002092051435384126135105300709151882033984098081011Weighted base
--431222-2112410-6662814Oxford--10%4%1%1%1%1%-2%*1%2%1%1%-3%3%1%*1%1%
5210854483833191926343568161-292972129201230London28%15%28%9%27%23%18%23%36%23%21%25%33%23%23%-15%14%18%32%25%23%
-1-531166124*1626-6612152632Southampton-5%-6%2%5%3%4%1%2%3%*1%2%4%-3%3%3%4%3%3%
2-1115265-57921718-6617122935Bristol11%-3%14%2%1%3%4%-7%5%6%2%6%3%-3%3%4%3%4%3%
--21104632136372316710122229Plymouth--5%1%5%2%3%2%4%1%2%4%3%2%3%9%3%4%3%3%3%3%
---1516771536513251101115122738Cardiff---1%3%8%3%5%2%6%3%4%5%4%3%5%5%5%4%3%3%4%
-1261011151548610217535162130194970None of these-6%4%7%5%5%7%11%7%10%5%7%2%6%8%31%9%10%7%5%6%7%
Page 273
Brassica Vegetables SurveyONLINE Fieldwork: 19th-20th November 2014
Absolutes/col percents
Table 264Which of the following cities do you live in, or nearest to?Base: All respondents
Prepared by Populus

Marital StatusWhich of the following ITV regions do you live in?NET:Mar-ried/
NET:CivilWid-part-owed/ner-separ-Civilship/ated/CoPart-coWest-
Div-Separ-Wid-div-Hab-ner-Mar-hab-York-count-WalesTyneScot-Meri-Gran-Gram-Cent-orcedatedowedorceditingshiprieditingSingleshirery& WestTeestishdianLondonadapianralAngliaTotal
98124015014414446604250572754337798186110134101241011Unweighted base
84114213714215452608262543149428382199114137101071011Weighted base
-35871182710----43----2-45Glasgow-27%11%6%5%9%4%4%4%----52%----19%-4%
212471162310----32--2-4-38Edinburgh3%7%4%3%5%4%3%4%4%----39%--1%-39%-4%
2--29-23329---39-----3-42Newcastle2%--1%6%-5%5%3%---94%-----27%-4%
61297-172412-*-1-------45Leeds7%5%5%6%5%-4%4%5%-1%-3%-------4%
1-122-464--------*-111Hull1%-2%1%1%-1%1%1%--------*-1%1%
-*33--202011-------31--34Sheffield-4%6%2%--4%3%4%-------3%1%--3%
4141081364519-------731--74Manchester5%10%10%7%5%6%8%7%7%-------64%1%--7%
6-174116218-17----28---36Liverpool7%-2%5%3%5%3%3%3%-3%13%----25%---4%
3-6946192810--------37--47Nottingham4%-14%7%3%39%4%5%4%--------27%--5%
4-37123395428-7------82--89Birmingham5%-7%5%9%20%9%9%11%-23%------60%--9%
3-1411*283912--------*-5455Norwich4%-2%3%8%3%6%6%5%--------*-51%5%
2-136-81411-----2--2-2427Milton Keynes2%-2%2%4%-2%2%4%-----2%--1%-23%3%
Page 274
Brassica Vegetables SurveyONLINE Fieldwork: 19th-20th November 2014
Absolutes/col percents
Table 265Which of the following cities do you live in, or nearest to?Base: All respondents
Prepared by Populus

Marital StatusWhich of the following ITV regions do you live in?NET:Mar-ried/
NET:CivilWid-part-owed/ner-separ-Civilship/ated/CoPart-coWest-
Div-Separ-Wid-div-Hab-ner-Mar-hab-York-count-WalesTyneScot-Meri-Gran-Gram-Cent-orcedatedowedorceditingshiprieditingSingleshirery& WestTeestishdianLondonadapianralAngliaTotal
84114213714215452608262543149428382199114137101071011Weighted base
2**31-10117-----173----21Brighton3%4%1%2%*-2%2%3%-----21%2%----2%
1--17-411221---7--4--14Oxford1%--*5%-1%2%1%3%3%---9%--3%--1%
15311293119913168-----21192*--16230London18%23%26%21%22%5%22%22%26%-----26%97%*--15%23%
6-175-111691----281---232Southampton7%-2%5%4%-2%3%3%2%----34%1%---1%3%
4--451182481914------1--35Bristol4%--3%3%7%4%4%3%36%46%------1%--3%
3--33-1822529-----1----29Plymouth3%--2%2%-4%4%2%53%-----*----3%
61-73-161911--38--------38Cardiff7%6%-5%2%-4%3%4%--77%--------4%
14121710*33431037518617811070None of these16%13%5%12%7%3%7%7%4%6%23%9%4%10%8%*6%6%15%9%7%
Page 275
Brassica Vegetables SurveyONLINE Fieldwork: 19th-20th November 2014
Absolutes/col percents
Table 265Which of the following cities do you live in, or nearest to?Base: All respondents
Prepared by Populus

Which of the following cities do you live in, or nearest to?None ofPly-South-Brigh-MiltonBirm-Nott-Liver-Manch-Shef-New-Edin-theseCardiffmouthBristolamptonLondonOxfordtonKeynesNorwichinghaminghampoolesterfieldHullLeedscastleburghGlasgowTotal
794336314122114213562764937732813453334401011Unweighted base
703829353223014212755894736743411454238451011Weighted base
-------------------4545Glasgow-------------------100%4%
------------------38-38Edinburgh------------------100%-4%
-----------------42--42Newcastle-----------------100%--4%
----------------45---45Leeds----------------100%---4%
---------------11----11Hull---------------100%----1%
--------------34-----34Sheffield--------------100%-----3%
-------------74------74Manchester-------------100%------7%
------------36-------36Liverpool------------100%-------4%
-----------47--------47Nottingham-----------100%--------5%
----------89---------89Birmingham----------100%---------9%
---------55----------55Norwich---------100%----------5%
--------27-----------27Milton Keynes--------100%-----------3%
-------21------------21Brighton-------100%------------2%
------14-------------14Oxford------100%-------------1%
-----230--------------230London-----100%--------------23%
Page 276
Brassica Vegetables SurveyONLINE Fieldwork: 19th-20th November 2014
Absolutes/col percents
Table 266Which of the following cities do you live in, or nearest to?Base: All respondents
Prepared by Populus

Which of the following cities do you live in, or nearest to?None ofPly-South-Brigh-MiltonBirm-Nott-Liver-Manch-Shef-New-Edin-theseCardiffmouthBristolamptonLondonOxfordtonKeynesNorwichinghaminghampoolesterfieldHullLeedscastleburghGlasgowTotal
703829353223014212755894736743411454238451011Weighted base
----32---------------32Southampton----100%---------------3%
---35----------------35Bristol---100%----------------3%
--29-----------------29Plymouth--100%-----------------3%
-38------------------38Cardiff-100%------------------4%
70-------------------70None of these100%-------------------7%
Page 277
Brassica Vegetables SurveyONLINE Fieldwork: 19th-20th November 2014
Absolutes/col percents
Table 266Which of the following cities do you live in, or nearest to?Base: All respondents
Prepared by Populus

EmploymentSectorRegionSocial GradeAgeGender
York-shire
EastWest&Pri-SouthSouthEast-Mid-Mid-Humb-NorthNorthScot-vatePublicWestEastLondonernWaleslandslandsersideWestEastlandDEC2C1AB65+55-6445-5435-4425-3418-24FemaleMaleTotal
42011896155116121577578881093284262210315224227176198188130924805311011Unweighted base
439127911421311015171919111140912402202802702201501801701701205164951011Weighted base
111210143144332734414181167517371653Up to £7,000 (3.5)3%1%2%7%11%3%2%6%4%3%3%6%8%14%2%5%*3%7%4%4%3%14%7%3%5%
3651327151812141296107762026214721251318198162143£7,001 to (10.5)8%4%14%19%12%18%25%20%13%10%5%24%8%31%9%9%8%21%14%14%8%10%15%16%13%14%£14,000
78181824222881915191912215347594653353935261710798205£14,001 to (17.5)18%15%20%17%17%27%16%26%17%20%17%31%23%22%21%21%17%24%23%22%21%15%14%21%20%20%£21,000
1003416312719181311223281525467761452237405214102108209£21,001 to (24.5)23%27%17%22%20%19%35%18%12%24%29%19%16%10%21%28%23%20%15%21%23%31%11%20%22%21%£28,000
9733192631158112713263202557605841283842312095105200£28,001 to (31)22%26%20%18%24%15%16%15%30%14%23%8%22%10%26%21%21%19%18%21%25%18%16%18%21%20%£34,000
541114964255915111529192814131322136374481£34,001 to (37.5)12%9%16%6%5%4%4%7%6%10%13%3%12%2%13%7%10%6%9%7%13%8%5%7%9%8%£41,000
19103647-2332165510163510864171936£41,001 to (44.5)4%8%3%4%3%6%-3%3%4%2%3%6%2%2%4%6%1%3%6%4%4%4%3%4%4%£48,000
58-122--4213-3317--41739514£48,001 to (51.5)1%6%-1%2%2%--4%2%1%6%-1%1%*3%--2%*4%2%2%1%1%£55,000
-1-------1-----1-----1--11£55,001 to (58.5)-1%-------1%-----*-----*--**£62,000
5-------31-----13-5-----55£62,001 to (65.5)1%-------4%1%-----*1%-3%-----1%*£69,000
3-21-----1------4-1--3-224£69,001 to (72.5)1%-2%1%-----1%------1%-1%--2%-***£76,000
--------------------------£76,001 to (79.5)--------------------------£83,000
81-22----5----1-8---126369£83,001 or more (86)2%1%-1%2%----5%----1%-3%---1%1%5%1%1%1%
Page 278
Brassica Vegetables SurveyONLINE Fieldwork: 19th-20th November 2014
Absolutes/col percents
Table 267What is the combined annual income of your household, prior to tax being deducted?Base: All respondents
Prepared by Populus

EmploymentSectorRegionSocial GradeAgeGender
York-shire
EastWest&Pri-SouthSouthEast-Mid-Mid-Humb-NorthNorthScot-vatePublicWestEastLondonernWaleslandslandsersideWestEastlandDEC2C1AB65+55-6445-5435-4425-3418-24FemaleMaleTotal
439127911421311015171919111140912402202802702201501801701701205164951011Weighted base
244567524748-31571118111072615272451Prefer not to answer5%3%6%4%6%5%3%5%8%5%7%-4%6%3%4%7%5%7%4%1%4%13%5%5%5%
27.7629.6225.7223.2723.6322.6920.9820.7926.8529.3025.8821.1224.3416.7325.9824.0430.0421.2123.8924.2925.9327.1424.2723.0625.6524.33Average income (£000's)
Page 279
Brassica Vegetables SurveyONLINE Fieldwork: 19th-20th November 2014
Absolutes/col percents
Table 267What is the combined annual income of your household, prior to tax being deducted?Base: All respondents
Prepared by Populus

What is the combined annual income of your household, prior toDo you have any children aged 18 orWhich of the following best describestax being deducted?under? If so, how old are they?where you live?
Nochild-Hamlet
Anyren& Iso-Urban>£55kAnyAnyAnyagedagedlatedTown- Pop.
or>£48k->£41k->£34k->£28k->£21k->£14k->£7k-Up toagedagedagedunderNET:18 orDwel-Vil-NET:andoverNET:more£55k£48k£41k£34k£28k£21k£14k£7k16-1811-155-105YesunderlinglageRuralFringe10kUrbanTotal
10103267190213218170557711912996284723161831994084048121011Unweighted base
181436812002092051435384126135105300709151882033984098081011Weighted base
--------53310811241-8817284553Up to £7,000 (3.5)--------100%3%8%6%1%4%6%-4%4%4%7%6%5%
-------143-712131430113128295559114143£7,001 to (10.5)-------100%-9%9%10%14%10%16%5%15%14%14%14%14%14%£14,000
------205--2427261567137541467683159205£14,001 to (17.5)------100%--28%22%19%14%22%19%31%22%22%19%20%20%20%£21,000
-----209---1726273368141339428483167209£21,001 to (24.5)-----100%---20%21%20%32%23%20%20%21%21%21%20%21%21%£28,000
----200----1932352269131427318385168200£28,001 to (31)----100%----22%26%26%21%23%18%27%15%15%21%21%21%20%£34,000
---81-----914161337451181932316381£34,001 to (37.5)---100%-----11%11%12%12%12%6%6%9%9%8%8%8%8%£41,000
--36------3255927-7719102936£41,001 to (44.5)--100%------3%1%4%5%3%4%-4%3%5%3%4%4%£48,000
-14-------1---113-44811014£48,001 to (51.5)-100%-------1%---*2%-2%2%2%*1%1%£55,000
1-------------1---1-11£55,001 to (58.5)4%-------------*---*-**£62,000
5-------------5----555£62,001 to (65.5)26%-------------1%----1%1%*£69,000
4-----------113---2244£69,001 to (72.5)21%-----------1%**---****£76,000
----------------------£76,001 to (79.5)----------------------£83,000
9-------------9----999£83,001 or more (86)49%-------------1%----2%1%1%
Page 280
Brassica Vegetables SurveyONLINE Fieldwork: 19th-20th November 2014
Absolutes/col percents
Table 268What is the combined annual income of your household, prior to tax being deducted?Base: All respondents
Prepared by Populus

What is the combined annual income of your household, prior toDo you have any children aged 18 orWhich of the following best describestax being deducted?under? If so, how old are they?where you live?
Nochild-Hamlet
Anyren& Iso-Urban>£55kAnyAnyAnyagedagedlatedTown- Pop.
or>£48k->£41k->£34k->£28k->£21k->£14k->£7k-Up toagedagedagedunderNET:18 orDwel-Vil-NET:andoverNET:more£55k£48k£41k£34k£28k£21k£14k£7k16-1811-155-105YesunderlinglageRuralFringe10kUrbanTotal
181436812002092051435384126135105300709151882033984098081011Weighted base
---------22517431161721133451Prefer not to answer---------2%2%4%1%2%6%10%8%9%5%3%4%5%
76.8751.5044.5037.5031.0024.5017.5010.503.5024.2723.3024.5925.8724.6624.2024.1123.3623.4124.5524.5624.5524.33Average income (£000's)
Page 281
Brassica Vegetables SurveyONLINE Fieldwork: 19th-20th November 2014
Absolutes/col percents
Table 268What is the combined annual income of your household, prior to tax being deducted?Base: All respondents
Prepared by Populus

Marital StatusWhich of the following ITV regions do you live in?NET:Mar-ried/
NET:CivilWid-part-owed/ner-separ-Civilship/ated/CoPart-coWest-
Div-Separ-Wid-div-Hab-ner-Mar-hab-York-count-WalesTyneScot-Meri-Gran-Gram-Cent-orcedatedowedorceditingshiprieditingSingleshirery& WestTeestishdianLondonadapianralAngliaTotal
98124015014414446604250572754337798186110134101241011Unweighted base
84114213714215452608262543149428382199114137101071011Weighted base
111618329142221126716281453Up to £7,000 (3.5)13%10%14%13%2%12%2%2%8%4%3%2%6%8%9%8%2%6%10%4%5%
23310369237485964121071627520123143£7,001 to (10.5)28%27%23%26%6%13%8%8%23%11%12%24%23%9%19%14%4%15%14%22%14%£14,000
181113027193121541058121916322129127205£14,001 to (17.5)22%5%26%22%19%8%21%20%21%19%17%16%29%23%20%16%19%21%8%26%20%£21,000
12182135*10113652741781321433416419209£21,001 to (24.5)15%6%19%15%25%3%22%22%20%14%14%35%19%16%25%21%29%12%37%18%21%£28,000
8541734211314933139732011482730-15200£28,001 to (31)9%44%10%12%24%14%25%25%13%24%28%15%8%24%14%24%24%22%-14%20%£34,000
3-141265471685211168159-481£34,001 to (37.5)4%-2%3%8%42%12%12%2%15%15%4%2%14%8%4%13%7%-4%8%£41,000
-1-110-2031521-1325262736£41,001 to (44.5)-7%-1%7%-4%5%2%3%3%-3%4%3%3%2%5%21%6%4%£48,000
----61186---3-1214-214£48,001 to (51.5)----4%7%*1%2%---6%-1%1%1%3%-2%1%£55,000
--------1-----------1£55,001 to (58.5)--------*-----------*£62,000
------55----1----3--5£62,001 to (65.5)------1%1%----3%----3%--*£69,000
----3-14--2----1----4£69,001 to (72.5)----2%-*1%--6%----*----*£76,000
---------------------£76,001 to (79.5)---------------------£83,000
Page 282
Brassica Vegetables SurveyONLINE Fieldwork: 19th-20th November 2014
Absolutes/col percents
Table 269What is the combined annual income of your household, prior to tax being deducted?Base: All respondents
Prepared by Populus

Marital StatusWhich of the following ITV regions do you live in?NET:Mar-ried/
NET:CivilWid-part-owed/ner-separ-Civilship/ated/CoPart-coWest-
Div-Separ-Wid-div-Hab-ner-Mar-hab-York-count-WalesTyneScot-Meri-Gran-Gram-Cent-orcedatedowedorceditingshiprieditingSingleshirery& WestTeestishdianLondonadapianralAngliaTotal
84114213714215452608262543149428382199114137101071011Weighted base
----3--36------4----9£83,001 or more (86)----2%--1%2%------2%----1%
8-310--1919185*2-21128111551Prefer not to answer9%-7%8%--4%3%7%10%1%4%-3%2%6%7%8%10%5%5%
16.7822.4016.9717.3329.3727.8326.2427.0321.4225.0028.4920.9122.3224.2521.2024.2026.0224.7924.2022.0524.33Average income (£000's)
Page 283
Brassica Vegetables SurveyONLINE Fieldwork: 19th-20th November 2014
Absolutes/col percents
Table 269What is the combined annual income of your household, prior to tax being deducted?Base: All respondents
Prepared by Populus

Which of the following cities do you live in, or nearest to?None ofPly-South-Brigh-MiltonBirm-Nott-Liver-Manch-Shef-New-Edin-theseCardiffmouthBristolamptonLondonOxfordtonKeynesNorwichinghaminghampoolesterfieldHullLeedscastleburghGlasgowTotal
794336314122114213562764937732813453334401011Unweighted base
703829353223014212755894736743411454238451011Weighted base
412-119-3132422-1223453Up to £7,000 (3.5)5%2%7%-2%8%-15%2%5%3%8%6%2%-11%3%4%7%8%5%
157356332251198535311026143£7,001 to (10.5)22%19%10%15%18%14%13%11%19%20%11%18%15%4%16%28%3%25%5%13%14%£14,000
15766638267171611711611412109205£14,001 to (17.5)22%19%22%17%18%16%13%27%24%32%18%22%18%14%17%7%30%28%27%21%20%£21,000
11164211482551012772411291085209£21,001 to (24.5)15%43%14%7%34%21%15%26%18%18%13%14%21%32%33%20%20%24%21%11%21%£28,000
10510535411492886206263315200£28,001 to (31)14%14%33%13%10%24%11%7%13%16%31%16%18%27%17%16%13%8%8%35%20%£34,000
611115831216651031115681£34,001 to (37.5)8%3%3%32%16%3%21%3%6%2%7%13%14%14%9%11%2%2%12%13%8%£41,000
2-21-1041-311-2-1316-36£41,001 to (44.5)2%-6%3%-4%26%4%-6%1%1%-3%-7%6%3%15%-4%£48,000
1---12--2-4--1--13--14£48,001 to (51.5)1%---2%1%--8%-4%--1%--2%6%--1%£55,000
--------------1-----1£55,001 to (58.5)--------------2%-----*£62,000
----------3-----1---5£62,001 to (65.5)----------4%-----3%---*£69,000
---2-1--------1-----4£69,001 to (72.5)---5%-*--------3%-----*£76,000
---------------------£76,001 to (79.5)---------------------£83,000
-----4----------5---9£83,001 or more (86)-----2%----------10%---1%
8-23-13-13174321-4-1-51Prefer not to answer11%-6%8%-6%-7%9%1%8%8%8%3%2%-8%-4%-5%
21.2621.3823.8229.8123.6023.9330.3819.1023.5320.9227.2321.4822.5127.0625.6721.8432.0321.4725.6023.5324.33Average income (£000's)
Page 284
Brassica Vegetables SurveyONLINE Fieldwork: 19th-20th November 2014
Absolutes/col percents
Table 270What is the combined annual income of your household, prior to tax being deducted?Base: All respondents
Prepared by Populus

EmploymentSectorRegionSocial GradeAgeGender
York-shire
EastWest&Pri-SouthSouthEast-Mid-Mid-Humb-NorthNorthScot-vatePublicWestEastLondonernWaleslandslandsersideWestEastlandDEC2C1AB65+55-6445-5435-4425-3418-24FemaleMaleTotal
42011896155116121577578881093284262210315224227176198188130924805311011Unweighted base
439127911421311015171919111140912402202802702201501801701701205164951011Weighted base
46222429233012181119248179532444459434828309109107216NET: Yes10%17%26%20%17%30%25%25%12%21%22%19%19%40%14%16%16%27%29%26%16%18%7%21%22%21%
2911141918188139121361264232925453330131636873141Yes - physical7%9%16%14%13%18%16%18%9%13%12%14%13%27%11%10%9%20%22%16%8%10%3%13%15%14%condition
123981310352511233761413161816118*343670Yes - disability3%2%10%6%10%10%6%7%3%5%9%6%3%15%3%5%5%7%12%9%7%4%*7%7%7%
17136939452106253151312181511207352662Yes - mental condition4%11%7%7%2%9%7%7%2%11%6%5%5%13%2%5%4%*5%8%6%12%6%7%5%6%
1-11141-*-2-161235141--2912Yes - other*-1%1%1%4%2%-*-2%-1%3%*1%1%2%1%2%1%--*2%1%
385104671111066837507970843372140185233219157105131136136111395381776No88%82%73%79%81%67%72%71%87%77%76%81%79%58%84%83%81%71%70%73%80%80%92%77%77%77%
81122323112-2533752164111819Prefer not to say2%1%1%1%2%3%3%4%1%2%2%-2%2%2%1%3%2%1%1%3%3%1%2%2%2%
Page 285
Brassica Vegetables SurveyONLINE Fieldwork: 19th-20th November 2014
Absolutes/col percents
Table 271Do you have a longstanding physical or mental condition or disability that has lasted or is likely to last 12 monthsand which has a substantial adverse effect on your ability to carry out day-to-day activities?Base: All respondents
Prepared by Populus

What is the combined annual income of your household, prior toDo you have any children aged 18 orWhich of the following best describestax being deducted?under? If so, how old are they?where you live?
Nochild-Hamlet
Anyren& Iso-Urban>£55kAnyAnyAnyagedagedlatedTown- Pop.
or>£48k->£41k->£34k->£28k->£21k->£14k->£7k-Up toagedagedagedunderNET:18 orDwel-Vil-NET:andoverNET:more£55k£48k£41k£34k£28k£21k£14k£7k16-1811-155-105YesunderlinglageRuralFringe10kUrbanTotal
10103267190213218170557711912996284723161831994084048121011Unweighted base
181436812002092051435384126135105300709151882033984098081011Weighted base
25892532574521142025742173251547785162216NET: Yes11%34%24%11%13%15%28%32%40%17%16%18%7%14%24%14%27%26%19%21%20%21%
2333152043281771416225116235375153104141Yes - physical11%23%9%4%8%9%21%20%32%9%11%12%2%8%16%14%19%18%13%13%13%14%condition
-22679151777121242050-141424325670Yes - disability-11%5%7%4%4%7%12%13%9%10%9%4%7%7%-8%7%6%8%7%7%
--216121815646951547-171720244462Yes - mental condition--5%1%3%6%9%10%11%4%5%7%4%5%7%-9%9%5%6%5%6%
--1-21211-11*110-22371012Yes - other--4%-1%*1%1%3%-*1%**1%-1%1%1%2%1%1%
16827701731771469631671021099825452111131142312322634776No89%58%76%86%87%84%71%67%57%80%81%81%93%85%74%78%69%70%78%79%78%77%
-1-311222241-414167931219Prefer not to say-8%-3%**1%1%3%3%3%1%-1%2%8%3%4%2%1%1%2%
Page 286
Brassica Vegetables SurveyONLINE Fieldwork: 19th-20th November 2014
Absolutes/col percents
Table 272Do you have a longstanding physical or mental condition or disability that has lasted or is likely to last 12 monthsand which has a substantial adverse effect on your ability to carry out day-to-day activities?Base: All respondents
Prepared by Populus

Marital StatusWhich of the following ITV regions do you live in?NET:Mar-ried/
NET:CivilWid-part-owed/ner-separ-Civilship/ated/CoPart-coWest-
Div-Separ-Wid-div-Hab-ner-Mar-hab-York-count-WalesTyneScot-Meri-Gran-Gram-Cent-orcedatedowedorceditingshiprieditingSingleshirery& WestTeestishdianLondonadapianralAngliaTotal
98124015014414446604250572754337798186110134101241011Unweighted base
84114213714215452608262543149428382199114137101071011Weighted base
21517432221021264612121281714402521-30216NET: Yes25%44%41%31%16%12%23%21%18%22%39%25%19%21%17%20%22%15%-28%21%
143163314168832559861211301415-16141Yes - physical16%29%38%24%10%7%15%14%9%10%29%15%14%14%13%15%12%11%-15%14%condition
63514514349772223318116-1070Yes - disability7%25%12%10%4%7%10%8%3%13%6%5%6%3%4%9%10%5%-9%7%
32-591172630154253967-962Yes - mental condition4%19%-4%6%5%4%4%12%2%17%8%5%6%4%4%6%5%-8%6%
1-*2--99111*-1-32*-312Yes - other1%-1%1%--2%2%*1%2%1%-1%-2%2%*-3%1%
596218711912345476212421835336467156871121073776No71%56%51%63%84%81%76%78%81%78%58%72%79%77%82%79%76%82%100%69%77%
3-4711463-12121224-419Prefer not to say4%-8%5%1%7%1%1%1%-4%3%2%2%1%1%2%3%-3%2%
Page 287
Brassica Vegetables SurveyONLINE Fieldwork: 19th-20th November 2014
Absolutes/col percents
Table 273Do you have a longstanding physical or mental condition or disability that has lasted or is likely to last 12 monthsand which has a substantial adverse effect on your ability to carry out day-to-day activities?Base: All respondents
Prepared by Populus

Which of the following cities do you live in, or nearest to?None ofPly-South-Brigh-MiltonBirm-Nott-Liver-Manch-Shef-New-Edin-theseCardiffmouthBristolamptonLondonOxfordtonKeynesNorwichinghaminghampoolesterfieldHullLeedscastleburghGlasgowTotal
794336314122114213562764937732813453334401011Unweighted base
703829353223014212755894736743411454238451011Weighted base
20781134812111591211137510888216NET: Yes28%17%27%31%11%21%5%12%39%27%11%25%30%17%21%42%22%19%20%18%21%
1435533511597787637655141Yes - physical20%7%16%15%9%15%4%5%20%17%8%15%22%9%17%24%16%14%13%12%14%condition
6245121**42254311321270Yes - disability8%5%13%14%4%9%2%2%16%3%3%10%12%5%2%11%6%6%1%4%7%
9313-9*226251311723162Yes - mental condition13%8%4%7%-4%2%9%6%12%2%11%4%4%2%7%16%5%8%2%6%
1*1--4--*2*-*2-----112Yes - other1%1%2%--2%--1%4%1%-1%3%-----2%1%
4930212429178131815397832236127735343035776No71%78%73%69%89%77%95%88%54%71%87%69%63%83%79%58%77%81%80%78%77%
12---4--21232---*--219Prefer not to say1%4%---2%--7%2%2%6%7%---1%--4%2%
Page 288
Brassica Vegetables SurveyONLINE Fieldwork: 19th-20th November 2014
Absolutes/col percents
Table 274Do you have a longstanding physical or mental condition or disability that has lasted or is likely to last 12 monthsand which has a substantial adverse effect on your ability to carry out day-to-day activities?Base: All respondents
Prepared by Populus

BRASSICA VEGETABLES SURVEY
Online fieldwork 19th-‐ 20th November 2014
Q1: Approximately how often, if ever, do you tend to use each of the following vegetables in your meals?
Gender
In the case of the majority of vegetables, females were more likely to eat each variety than males, with the exception of Turnip (M: 72%; F: 68%); Peas (M: 98%; F: 96%); Green Beans (M: 91%; F: 90%); and Potato (M: 100%; F: 99%).
The vegetables which saw the largest disparity between males and females consuming them were:
• Swede (M: 76%; F: 85%, +9%) • Kale (M: 45%; F: 54%, +9%) • Broccoli (M: 90%; F: 96%, +6%)
Women were also 4% more likely to eat Cauliflower, Brussels Sprouts and Parsnip.
All other vegetables were roughly equally eaten by males and females (+/-‐1-‐2%).
Age
Across all age groups except the 45-‐54s, Broccoli was among the most popular of the Brassica vegetables, coming top for the 18-‐24s, 25-‐34s and 55-‐64s. The 35-‐44s and the 65+ age bands ranked Broccoli equal with Cauliflower.
For the 45-‐54s, the top rated Brassica was Cauliflower.
While the percentages across the age bands from 25yrs+ were roughly similar to those reported in the 2013 survey findings, it may be significant to note that the 18-‐24 age band showed a larger than expected increase in percentages of those using Brassica vegetables. Use of Cabbage by the 18-‐24s increased by 16%; Kale by 15%; Turnip by 14%; Swede by 12%; Cauliflower by 10%; Brussels Sprouts by 9% and Broccoli by 7%.
Social Grade
In the 2013 survey, the AB grade was more likely to buy any of the vegetables listed, with the exception of peas, than any other social grade. By comparison, the results this time are a lot more mixed. The ABs are most likely to buy Broccoli, Swede, Kale, Green Beans and

Parsnip. They are jointly with the DEs most likely to buy Cauliflower; most likely to buy Sweetcorn with the C1s; and most likely to buy Potatoes with the C2s.
The C1s were most likely of all social grades to buy Turnip and Brussels Sprout. The C2s were most likely to buy Cabbage and Carrots.
As with the 2013 survey, the ABs were most likely overall to buy Brassica vegetables, followed in decreasing order by the C1s, C2s and, at lowest levels, the DEs.
The ranking order of Brassica vegetables remained the same across the AB and C1 grades (and the same order as all grades last year): Broccoli, Cauliflower, Cabbage, Sprouts, Swede, Turnip, Kale. However, the C2’s top three Brassica runs: Cabbage, Cauliflower, Broccoli. The DEs place Cauliflower first, followed by Broccoli and Cabbage.
Region
Taking all vegetables into account, the highest proportions are bought in the North East, followed by the South West, South East and East Midlands regions. London follows in fifth place, and all these consume above average levels of vegetables.
Taking just Brassica vegetables into account, the top three remain the same (North East, South West and South East), but Scotland is in 4th place, followed by the East Midlands and London. All these regions consume above average levels of Brassica.
Significantly, in the 2013 survey, Wales came top of the table for both all vegetables and Brassica in particular. It is now firmly at the bottom, consuming the least of all vegetables and the fewest Brassica too.
The North West and West Midlands are also in the bottom three for both categories.
Overview
The top three scoring of all vegetables were Potato (100%), Carrots (98%) and Peas (97%). This reflects the finding of the last survey, although the popularity of Carrots and Peas have both increased by 1% (97% and 96% respectively this time).
Broccoli and Cauliflower both retained their overall position as 4th and 5th most popular vegetable. However, again the popularity of these had increased by 1% and 2% respectively (Broccoli: 93% this time compared to 92% last time. Cauliflower: 93% this time compared to 91% last time). Cabbage, which was bought by 89% of people in the last survey has now increased by 2 percentage points to 91%.

Therefore, just over 9 out of every 10 people buy Broccoli, Cauliflower and Cabbage. Of the remaining Brassica vegetables, 85% of people buy Brussels Sprouts (an increase of 1%); 81% of people buy Parsnips (an increase of 3%) and 50% of people buy Kale (an increase of 3%).
Kale remains the least popular of all vegetables surveyed, although still showing that around half of all survey respondents ever buy it. Parsnip and Kale showed the largest increase in sales overall of all vegetables, both 3% up on last time’s survey.
Q2: Thinking about each of the Brassica vegetables you use in your meals, which of the following reasons best describes why you use each one?
Age
In the last survey, younger respondents were more likely to choose Brassica vegetables because of the taste; while older respondents favoured the healthy nature of these vegetables. In the 2014 survey, however, the aggregated percentages for each category showed that all age groups except the 55-‐64s (who loved the taste) favoured Brassica overall because they are healthy.
• 18-‐24s rated Broccoli and Swede highest for taste; Turnip, Cauliflower, Cabbage and Kale for being healthy; and Sprouts highest for being traditional.
• 25-‐34s rated Broccoli and Cauliflower highest for taste; but Swede, Turnip, Cabbage and Kale highest for being healthy. Brussels Sprouts scored most highly for being traditional.
• 35-‐44s again rated Broccoli and Cauliflower highest for taste; but Swede, Turnip, Cabbage, Kale and Brussels Sprouts highest for being healthy. Brussels Sprouts also scored highly for being traditional.
• 45-‐54s rated Broccoli, Swede, Cauliflower and Brussels Sprouts highest because they loved the taste. Turnip, Cabbage and Kale were scored higher for being healthy than for any other reason.
• 55-‐64s were more interested in the taste of Brassica, scoring Swede, Turnip, Cauliflower, Cabbage and Brussels Sprouts (the latter rated equally highly for taste and being considered traditional) highest for this quality. Broccoli and Kale were scored highest for being healthy.
• 65+ age band overall rated Brassica highest for being healthy, with Broccoli, Cabbage and Kale scoring the most for this quality. Swede, Cauliflower and Brussels Sprouts were rated highest for taste in this age group.
Gender

In the 2013 survey, males picked a Brassica vegetable because they perceived it to be healthy in six out of the seven vegetables. The 2014 survey showed more of a variation. Whereas the top reason for selecting Broccoli, Turnip, Cabbage and Kale was because they are healthy, Swede, Cauliflower and Brussels Sprouts were selected as being best for taste.
Likewise, in the 2013 survey, females were most likely to select loving the taste as their top reason for using all Brassica vegetables. However, there was more diversity this year. Broccoli, Swede and Cauliflower were selected as top for their taste. Turnip, Cabbage and Kale were selected as top for being healthy. Brussels Sprouts were selected as top for being traditional.
Social Grade
Looking at the aggregated percentages for each social grade, all four groups were most likely to choose Brassica vegetables generally for their healthy nature. Across all social grades, the second most likely reason for choosing Brassica was loving the taste. Turnip, Cabbage and Kale were particularly singled out as being healthy while Broccoli, Swede and Cauliflower appealed most because of the taste.
Overview
Taking all the responses into account, the most popular answers overall were:
• Brassica vegetables are healthy and nutritious (30%); followed by: • I/my family love the taste (24%).
This is broadly comparable with last year’s survey. The same percentage of people stated that I/my family love the taste. However, the numbers of people who said that they chose Brassica vegetables because they loved the taste had increased by 3% from 27% last year.
All Brassica vegetables with the exception of Brussels Sprouts scored most highly in one of these two categories. Brussels Sprouts, however, were by far and away the highest scoring vegetable for the answer it is traditional, with 28% of respondents stating that this is the reason that best describes why they use them in meals. As the survey was conducted while people were beginning to think about Christmas, this could be one reason for the increase in this percentage. The second most popular answer for choosing Brussels Sprouts was It is healthy and nutritious (24%), which is much more in line with other answers.
Overall, the remaining reasons for choosing Brassica vegetables were as follows:
• It is traditional (11%) • It is quick and easy to cook (10.3%)

• It is versatile and I can cook it several ways (9%) • It complements the other ingredients in the meal (9%)
The least common reason for choosing Brassica vegetables was It is cheap (8%)
Findings by vegetable
Broccoli was equally as likely to be chosen because I/my family love the taste as because It is healthy and nutritious (both 34%). This shows a small increase of 3% and 2% respectively on 2013’s findings.
Swede was most likely to be chosen because I/my family love the taste (25%), closely followed by It is healthy and nutritious (22%). The latter shows a small increase on the 2013 survey, where 20% of people chose it for this reason.
Turnip was most likely to be chosen because It is healthy and nutritious (24%), an increase of 4% on 2013’s findings. The next most common reason was that It complements other ingredients in the meal (17%). This is a slight change from last year, when the second most popular reason was I/my family love the taste (2013: 18%; 2014: 16%).
Cauliflower was most commonly selected for the taste (28%, down two percentage points from last year) followed by it being healthy and nutritious (24%, up one percentage point from last year).
Cabbage was most likely to be selected because it is healthy and nutritious (31%, compared to 28% in 2013). The second most popular reason was because I/my family love the taste (23% compared to 24% in 2013).
Kale was overwhelmingly chosen by 48% of respondents because It is healthy and nutritious. This is up 4% from last year’s findings. There was again a considerable drop to the next most common reason, I/my family love the taste, where percentages were identical both years (15%).
As mentioned, Brussels Sprouts were most likely to be chosen because It is traditional (28%). However, this was followed closely by I/my family love the taste (26%) and It is healthy and nutritious (24%).
Q3. Do the following Brassica vegetables form part of your children’s diet?
Gender

Based on overall aggregated percentages, females were more likely to include Brassica vegetables in their children’s diet than males. This is in contrast to the 2013 survey results, where responses indicated vice versa.
By individual vegetable, in the case of Broccoli, Swede, Cauliflower, Cabbage and Kale, females were more likely than males to include these in their children’s diets. In a couple of cases, the percentage difference was minor (for Broccoli, F: 87% compared to M: 86%. For Cauliflower, F: 82% compared to M: 80%).
However, females were 6% more likely to include Swede than males (F: 63%, M: 57%). For Cabbage, 76% of females would include compared with 71% of males. The largest difference was for Kale, where 39% of females would include this in their children’s diets, compared with 27% of males.
Males were slightly more likely to include Brussels Sprouts in their children’s diet than females (M: 58%; F: 57%).
Males and females were equally as likely to include Turnip in children’s diets (both 50%).
Age
Although 100% of the 65+ age band reported including Brassica vegetables of all types in their children’s diets, it is worth noting that there was only one respondent in this group and the results may not therefore be representative.
The 55-‐64 age band was also based on a small number of responses (10). Taking this into consideration, this group were most likely to include Broccoli (100%), Turnip (67%), Cauliflower (100%), Cabbage (85%), Kale (67%) and Brussels Sprouts (72%) in their children’s diets.
The 18-‐24 age band was most likely to include Swede in their children’s diets (68%).
Of the other age bands, the group that reported including Brassica vegetables at the lowest percentages overall was the 25-‐34s, followed by the 35-‐44s.
Social Grade
Overall, the C2 social grade was most likely to include the largest percentage of Brassica vegetables in their children’s diets. However, when broken down by individual vegetable, the results were mixed across the board.
The AB grade would include the highest levels of Swede (63%), Turnip (53%) and Brussels Sprouts (65%). All other vegetables were given to AB children at lower than average levels.

The C1 grade stated that they include Kale at significantly higher levels than other social grades (41% compared to an average of 33% across the board). They would also include Broccoli, Swede and Cauliflower at higher than average levels.
The C2 grade recorded the highest rates of response for including Broccoli, Cauliflower and Cabbage in their children’s diets (89%, 84% and 78% against averages of 87%, 81% and 74%). They also reported giving Swede and Turnip at higher than average levels to their children.
The DE grade did not top the board in any one particular vegetable and in fact include Broccoli, Swede and Kale at below average levels; however, higher than average percentages reported including Turnip, Cauliflower, Cabbage and Brussels Sprouts in their children’s diets.
Region
As in the 2013 survey, Wales was the region by far the most likely to state that they would include Brassica vegetables in their children’s diets. Respondents from Wales were far more likely than average to include each individual vegetable cited.
London was again (as in 2013) the next highest, with parents more likely to include all of these vegetables except Swede (last year: Broccoli).
Respondents in the South East, East Midlands, North East, North West and Scotland would all include higher than average levels of Brassica vegetables in their children’s diets overall.
The Eastern region, the South West, Yorkshire & Humberside and West Midlands would all include Brassica at lower levels, with the West Midlands being the lowest of all regions. Here, the most significant deviation from the average was for Kale – in the West Midlands, only 5% would include Kale in their children’s diets.
Overview
Generally, as in 2013, children were more likely to have Brassica vegetables included in their diet than not. This was true of all the vegetables surveyed except Kale (which 67% of children do not have, compared to 58% in 2013; and 33% do have in their diets, compared to 42% in 2013).
The top scoring Brassica vegetables to be included in children’s diets are identical to the 2013 survey results, with minor percentage differences:
1. Broccoli – 87% (86% in 2013)

2. Cauliflower – 81% (82% in 2013) 3. Cabbage – 74% (77% in 2013)
Below this, six in every ten children eat Swede (60% down from 69% in 2013). 57% eat Brussels Sprouts (down from 62% in 2013). 50% eat Turnips (down from 61% in 2013).
Of all the Brassica mentioned, children were least likely to like Brussels Sprouts (33%, up from 30% in 2013). They were least likely to have tried Kale (50%).
Q5. To what extent do you agree or disagree with each of the following statements about Brassica vegetables?
By far the highest percentage selected the option Children should be taught more in schools about Brassica vegetables and how to use them. Overall, 76% of people concurred with this statement (an increase of 2% on the 2013 survey results), with 38% agreeing a little and 38% agreeing strongly. As in 2013, only 3% didn’t agree with this statement at all. 4% said they did not know.
39% said There is enough information available for people to learn more about Brassica vegetables and how best to use them in meals. 23% of people disagreed with this statement. 30% neither agreed nor disagreed; while 8% said that they did not know. This is broadly comparable with 2013 findings.
25% of respondents (a drop of 2% on last year’s figures) said that they would use Brassica vegetables more often if I knew more about how to cook them. 37% neither agreed nor disagreed (up 4% on 2013 figures); while 33% disagreed (a little: 15%; strongly disagree: 17%). 5% said that they did not know.
Only 17% agreed that In general, people in Britain today eat enough Brassica vegetables. This is a drop of 4% on last year’s figures, when 21% said Britain ate enough Brassica. Only 3% of people strongly agreed with this statement, while 14% agreed a little. 46% disagreed with the statement (compared to 40% last year), with 29% disagreeing a little and 17% strongly disagreeing.
Despite small overall increases in the amounts of Brassica being consumed, it appears there is still a strong perception that we should eat more.
Q6. How important or unimportant is each of the following factors when considering purchasing vegetables?

Price
83% of respondents overall felt that price was an important factor (compared to 82% in 2013). Females were more likely to consider price important than males (F: 85%; M: 80%).
Price was most important to the 45-‐54 age band (91%), followed by the 35-‐44s (88%). It was of least importance to the 18-‐24 age band (76%), a shift from last year, when the 65+ band had been concerned least about price.
In terms of social grade, it was of above average importance to the C2 band (88%). The DEs (83%), ABs (81%) and C1s (80%) considered it important at average or below average levels.
People in the North East were most likely to consider price important (92%), closely followed by respondents from the East Midlands (91%). Individuals in the South West (90%), West Midlands (89%), the Eastern region (87%) and the South East (86%) were more likely than average to be concerned about price.
Respondents in London were least concerned about price (67%).
Whether they are on special offer
56% of people felt that a special offer was an important consideration, compared with 55% of people last year.
Significantly more females than males considered a special offer was important in their decision to purchase vegetables (F: 62%; M: 49%). As with Price (above), the 45-‐54 and 35-‐44s were the most cost-‐conscious, 64% and 60% respectively taking into account whether vegetables are on special offer before purchase.
There was very little disparity across social grade. Only the DE band fell below average by one percentage point (55%); the C1s and C2s were both average at 56%; while the ABs were most likely to take into account a special offer when purchasing vegetables (57%).
Whether vegetables were on special offer was significantly more important to those in the East Midlands than any other region (East Midlands: 74% compared to an average across the respondent group of 56%). Londoners were least worried about choosing vegetables on special offer (49%), closely followed by those in the North West and South East (both 50%).
Whether vegetables are sourced locally
This was a significantly less important factor in 2014 compared to the findings of the 2013 survey. This year, only 42% would take this into consideration, compared to 56% in 2013.

Females were slightly more likely to take this into account than males (43% F compared to 41% M).
While the 18-‐24s and 25-‐34s were significantly less likely than average to be concerned about vegetables being sourced locally (36% and 33% respectively), those older age bands showed more concern, with the 35-‐44s and 65+ age bands being most likely to factor this into their purchasing decisions (both 47%).
There was little disparity across the social grades. The ABs were slightly more concerned about sourcing vegetables locally (44%), followed by the C1s (43%), the DEs (42%) and least concerned were the C2s (41%).
Regionally, the issue of sourcing vegetables locally was of greatest concern in Scotland (57% against an average of 42%). The next highest regions were the Eastern (52%) and South West (51%). Those respondents in London and the West Midlands were the least concerned (both 34%).
Whether vegetables are from a British farm (not necessarily local)
This was a significantly less important factor in 2014 than in the 2013 survey. Whereas 60% of respondents in 2013 would take this into account, only 49% of respondents this year would consider it important.
Females were more likely to take this factor into consideration than males (52% F compared to 47% M). In terms of age, generally the older the respondent, the more likely they were to look for produce from a British farm (39% of the 18-‐24s would consider it, rising to a high of 56% for the 65+ age category).
By social grade, the DEs were most likely to consider it (51%), followed closely by the C1 and C2 grades (both 50%). The ABs were least likely to take this into account (47%).
In terms of region, again it was less likely to be a concern to those in London (40%) and the North West (41%), but it was significantly more of a concern to those in the East Midlands (63%, the highest percentage by region). Those in the South West (59%), Scotland and the Eastern region (both 57%) were also more likely to consider it when purchasing vegetables.
Personal taste
91% of respondents thought personal taste was important – an identical percentage to the survey in 2013.

Females were a little more likely to view personal taste as important than males (F: 92%; M: 89%). The likelihood was also that the older the respondent, the more personal taste became a factor: whereas only 76% of the 18-‐24s took this into account, over 8 in 10 of the 25-‐34s considered it important (83%) and the remaining age bands all registered above 90%, with the 55-‐64s (98%) and the 65+ (96%) age bands being most likely to consider this.
Across the social grades, the C1s and the DEs were least likely to consider personal taste (89%). The ABs were slightly below average in taking this into account (90%), but the C2s were most likely to be swayed by personal taste (96%).
Those in London were again least likely to consider this a factor (82%), followed by the North West (87%) and Scotland (88%). All other regions considered it slightly above averagely important as a factor in decision-‐making when purchasing vegetables, with the highest response coming from the North East (97%).
Seasonality
Overall, 59% of respondents stated that this was an important factor, compared with 57% in 2013. Females were significantly more likely to take this into account than males (64% of females compared to 54% of males).
It was of least importance to the 18-‐24 age band (39%), but then rose in significance incrementally across all the remaining age bands to the 55-‐64s (71% of whom considered seasonality to be important). The 65+ age band, however, took this less into account (61%), but still at slightly above average levels.
By social grade, the C2s were most likely to consider this a factor (62%), with the ABs and C1s considering it important at average levels (both 59%). It was slightly less likely to be of importance to the DEs (56%).
Seasonality was of least importance to those in the North West (47%), followed by Wales (53%) and Yorkshire & Humberside (54%). All other regions took it into account at around average levels, with it being of highest concern to those in the South East (66%), followed by the South West and East Midlands (both 65%).
Appearance in shops
Overall, 76% of people felt this was an important factor (75% in 2013). Again, it was an issue more of concern to females (78%) than males (73%).
The incidence of taking appearance in shops into account when purchasing vegetables rose with age. The 18-‐24s and 25-‐34s were least concerned (68% and 67% respectively), whereas

78% of the 35-‐44s, 45-‐54s and 55-‐64s were likely to factor this in. The 65+ age band showed the most concern with this issue: 82% of them stated that their purchasing decisions were influenced by appearance.
The C2 grade was most likely to take this into account (80%), followed by the ABs (78%). The DEs followed the average, 76% saying they would consider this issue. The C1s showed least concern with appearance (72%).
By region, those in Yorkshire and Humberside were most likely to be influenced by appearance (86%). Wales (81%), the North East, West Midlands and South East (all 80%) also showed higher than average concern for the appearance of vegetables in shops. The area least likely to be affected by this factor was the North West, well below average at 63%, followed by London (70%). All other regions hovered around the average.
Organic
There was a significant drop in respondents considering this an important factor. In 2013, 27% would take this into account, whereas in this year’s findings, only 18% would do so.
As with other factors influencing purchasing decisions, this was something that more females would take into account than males (F: 21%; M: 15%). In terms of age band, the importance of veg being organic decreased with age: 25% of 18-‐24s were concerned, and the 25-‐34s and 35-‐44s both showed above average levels of concern (both 23%). However, the 45-‐54s were in line with the average and the older groups had significantly less interest (55-‐64s: 13%; 65+: 10%).
By social grade, this was a factor the ABs were more likely to take into account (21%). The remaining grades hovered at around average levels.
By region, London respondents were most likely to factor this in (24%). It was also of slightly above average importance to those from the South East (21%), the North East and North West (both 20%) and the West Midlands (19%). All other regions viewed it at average levels or below, with those in the East Midlands and South West (both 12%) least interested in organic vegetables.
Q6a. Do you feed your children vegetables at home as part of their diet?
Overwhelmingly, 95% of respondents state that they feed children vegetables as part of their diet. Only 5% of respondents replied in the negative.

The gender split was fairly equal, with 96% of females and 94% of males confirming that they feed their children vegetables. Although numbers were small, 6% of males said they do not use vegetables in their children’s diet compared to 4% of females.
The older the respondent, the more likely they are to include vegetables in children’s diets. Whereas 86% of the 18-‐24 age group do so, this rises to 95% in the 25-‐34 group; 97% in both the 35-‐44 and 45-‐54 age groups; and 100% of the 55-‐64s and 65+ groups.
The C1 social grade is the group least likely to include vegetables in children’s diets (92%). This is closely followed by the AB grade (94%) and the DE grade (96%). The C2 grade is the group most likely to include vegetables in children’s diets (97%).
The following regions all responded unanimously (100%) that they include vegetables as part of their children’s diet: Scotland, East Midlands, Wales and the South West. The North West (98%), Yorkshire & Humberside (98%), the South East (95%), Eastern region (94%) and the West Midlands (92%) also ranked highly. The two regions where the lowest numbers of people included vegetables in their children’s diets were the North East (88%) and London (86%).
Q7. For all those respondents who feed their children vegetables, to what extent do you agree or disagree with the following statements?
My child(ren) understand the benefits of eating vegetables
76% of respondents stated that their children understand the benefits of eating vegetables. Of these, 40% strongly agreed and 37% agreed a little. 5% strongly disagreed.
My child(ren) tend to enjoy the taste of vegetables
73% of respondents said that their children tended to enjoy the taste of vegetables. 28% strongly agreed; while 45% agreed a little. 3% strongly disagreed.
My child(ren) ask to have vegetables included as part of their meals
Just over half (53%) of respondents stated that their children asked to have vegetables included as part of their meal. Of these, 24% strongly agreed while 29% agreed a little. 10% strongly disagreed.
Q8. Which of the following statements best describes how you incorporate Brassicas into your child’s diet?
The options for this question were:
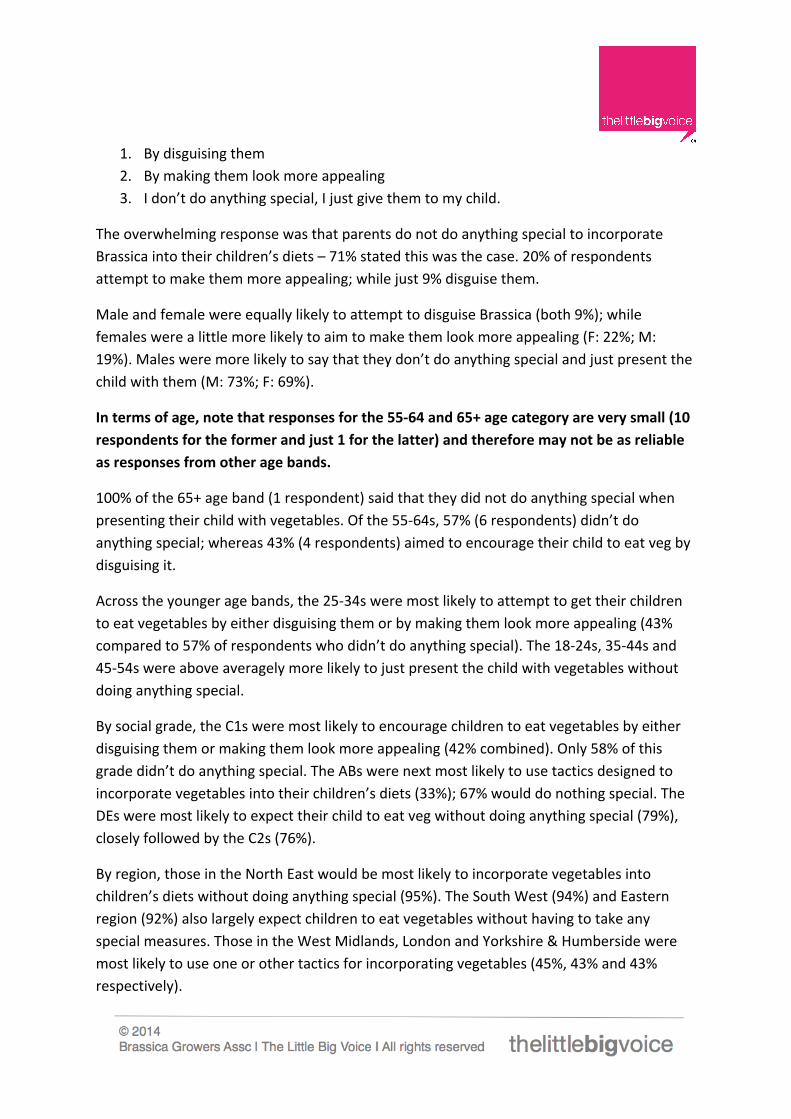
1. By disguising them 2. By making them look more appealing 3. I don’t do anything special, I just give them to my child.
The overwhelming response was that parents do not do anything special to incorporate Brassica into their children’s diets – 71% stated this was the case. 20% of respondents attempt to make them more appealing; while just 9% disguise them.
Male and female were equally likely to attempt to disguise Brassica (both 9%); while females were a little more likely to aim to make them look more appealing (F: 22%; M: 19%). Males were more likely to say that they don’t do anything special and just present the child with them (M: 73%; F: 69%).
In terms of age, note that responses for the 55-‐64 and 65+ age category are very small (10 respondents for the former and just 1 for the latter) and therefore may not be as reliable as responses from other age bands.
100% of the 65+ age band (1 respondent) said that they did not do anything special when presenting their child with vegetables. Of the 55-‐64s, 57% (6 respondents) didn’t do anything special; whereas 43% (4 respondents) aimed to encourage their child to eat veg by disguising it.
Across the younger age bands, the 25-‐34s were most likely to attempt to get their children to eat vegetables by either disguising them or by making them look more appealing (43% compared to 57% of respondents who didn’t do anything special). The 18-‐24s, 35-‐44s and 45-‐54s were above averagely more likely to just present the child with vegetables without doing anything special.
By social grade, the C1s were most likely to encourage children to eat vegetables by either disguising them or making them look more appealing (42% combined). Only 58% of this grade didn’t do anything special. The ABs were next most likely to use tactics designed to incorporate vegetables into their children’s diets (33%); 67% would do nothing special. The DEs were most likely to expect their child to eat veg without doing anything special (79%), closely followed by the C2s (76%).
By region, those in the North East would be most likely to incorporate vegetables into children’s diets without doing anything special (95%). The South West (94%) and Eastern region (92%) also largely expect children to eat vegetables without having to take any special measures. Those in the West Midlands, London and Yorkshire & Humberside were most likely to use one or other tactics for incorporating vegetables (45%, 43% and 43% respectively).

Q9. To what extent do you think children will be eating more or less healthily in general as a result of the government introducing compulsory school meals for children up to the age of 7?
Overall, the feeling from respondents is that children will be eating more healthily as a result of this initiative: 65% responded in the positive. 31% of people felt that the result would be about the same and only 4% stated that they felt children would eat less healthily as a result.
Males and females were equally as likely to think the change would result in healthier eating: 65% of both agreed with the statement. Females, though, were slightly less likely to agree that the change would result in children eating a lot more healthily – 14% opted for a lot more healthily as opposed to 19% of all males. Percentages for other responses were about equal in terms of gender.
Those at either end of the age ranges (the 18-‐24s and 25-‐34s; and the 55-‐64s and 65+s) were most likely to believe that government measures would mean healthier eating – all responded at average or above average levels. The 35-‐44s and 45-‐54s were slightly less convinced, with a below average 61% in both cases believing that the change would result in healthier eating.
In terms of social grade, the ABs were most likely to think the change would result in children eating more healthily (71% compared with 64% of both the C1s and C2s; and 62% of the DEs). The ABs were also a little more likely to think the change would result in children eating a lot more healthily (21%) compared to the other three grades (C1: 17%; C2: 13%; DE: 13%).
By region, respondents in the South West were most cynical about the change – only 47% felt it would result in children eating healthier against the average of 65%. Those in the Eastern region (56%) and London (63%) were also less likely than average to believe it would make a positive difference. Most convinced of the benefits were those in the North East, where 82% felt children would eat more healthily as a result. Those in Scotland and the West Midlands (72% and 71% respectively) were also significantly more positive than average about the changes.
Q10. There are a large variety of vegetables available on the shelf at supermarkets and local grocery shops. Which of the below do you tend to buy most often?
The options for responses here were:

1. Traditional fresh vegetables (eg potatoes, carrots, cabbage) 2. Frozen vegetables 3. Less traditional fresh vegetables (eg yam, pak choi, plantain)
Over 2/3 of respondents stated that they buy traditional fresh vegetables most often (76%). 20% of respondents tend to buy frozen vegetables most often, while just 1% buy the less traditional fresh vegetables most often. 2% overall buy none of these most often.
There was little disparity between males and females – females were 1% less likely to buy traditional fresh veg (76% cf with 77% for males). Females were 1% more likely to buy frozen veg most often (21% compared to 20% of males).
The likelihood of buying fresh vegetables generally rose with age, with a corresponding decrease in the purchase of frozen vegetables across the board. While 64% of the 18-‐24 age group buy fresh most often, for example, 88% of the 65+ age band did so. The chart below illustrates this:
By social grade, the group most likely to buy fresh vegetables was the C2 grade (85%). The DEs were least likely to buy fresh, traditional vegetables (71%). Of the other grades, 71% of the C1 grade buy fresh, traditional vegetables most often; while 74% of the AB grade do. Figures for those buying frozen vegetables corresponded accordingly.
Those in the Eastern region (82%), North West and East Midlands (both 80%), the South East and Scotland (both 79%) and the South West (78%) were all above the average when it comes to buying traditional fresh veg.
0%
10%
20%
30%
40%
50%
60%
70%
80%
90%
100%
18-‐24 25-‐34 35-‐44 45-‐54 55-‐64 65+
Tradihonal fresh veg
Frozen veg
Less tradihonal fresh veg

In terms of buying frozen vegetables most often, those in the West Midlands (29%), Wales (27%), Yorkshire & Humberside (23%) and London (21%) all bought more than the average percentage of these.
Q11. We’d now like you to think ahead to Christmas Day. Which of the below vegetables if any do you think you’ll be eating as part of your main Christmas meal?
• The three top scoring vegetables to be eaten as part of Christmas dinner were stated to be Potatoes (90%), Carrots (80%) and Brussels Sprouts (75%).
• Parsnips (57%) and Peas (50%) would be eaten by half or more of the respondents. • Broccoli (41%) and Cauliflower (34%) were the next highest scoring. • Around one in five would eat Cabbage (22%) and Swede (20%). • Only one in ten would eat Turnip (10%), while 11% would have another vegetable
not named.
While the overall percentages for males and females eating any vegetables were broadly similar (M: 96%; F: 97%), the main disparities worth mentioning were as follows:
• Significantly more females than males would eat Brussels Sprouts (F: 78%; M: 72%). • Significantly more females would eat Parsnips (61% compared to 52% of men). • More women would eat Broccoli than men (F: 43%; M: 39%). • Slightly more males than females anticipated eating Cauliflower (M: 35%; F: 33%). • More males would eat Turnip than females (M: 12%; F: 7%).
In the case of all other vegetables mentioned, males and females would eat them in roughly the same proportions (+/-‐1%).
Looking at the age bands, over 9 in 10 of all respondents would eat some vegetable or other. The age band least likely to incorporate veg into their Christmas meal was the 18-‐24s (93%), whereas 96-‐98% of all other respondents would do so. The 55-‐64s were most likely to do so (98%).
The chart below shows the frequency of inclusion of each Brassica vegetable asked about in this question by age:

Interestingly, the chart shows that the general trend is for the use of Brassica in the Christmas meal to decline with age, with the exception of Brussels Sprouts, which increase with the age group of the respondent.
In terms of social grade, the ABs are most likely to include any veg with the Christmas meal (98%), closely followed by the C2s (97%). The C1s and DEs would include vegetables at slightly less than average levels.
Responses from practically every region were in the high 90s. The highest was the East Midlands, where 100% of respondents stated that they would include vegetables in their Christmas meal. The lowest region was the North East, where inclusion of any vegetables in the Christmas meal dropped to 93%.
0%
20%
40%
60%
80%
100%
18-‐24 25-‐34 35-‐44 45-‐54 55-‐64 65+
Christmas Day Vegetables
Broccoli Swede Turnip
Cauliflower Cabbage Brussels Sprouts