Brannigan Soup Presentation 22 May PPT
33
Brannigan Foods: Strategic Marketing Planning Group Members: Group Members: Kamalanathan Perisamy 820330 Kamalanathan Perisamy 820330 Rajendiraperasad Muniam 820309 Rajendiraperasad Muniam 820309 Shubashini Mathyalingam 820283 Shubashini Mathyalingam 820283 Lilambikha Raja Vikraman Varman 820275 Lilambikha Raja Vikraman Varman 820275 BPMM6013 MARKETING MANAGEMENT
-
Upload
shubashini-mathyalingam -
Category
Documents
-
view
493 -
download
32
description
Brannigan soup Case Study ppt Slide
Transcript of Brannigan Soup Presentation 22 May PPT
Brannigan Foods: Strategic Marketing Planning
Group Members:Group Members:Kamalanathan Perisamy 820330Kamalanathan Perisamy 820330
Rajendiraperasad Muniam 820309Rajendiraperasad Muniam 820309Shubashini Mathyalingam 820283Shubashini Mathyalingam 820283
Lilambikha Raja Vikraman Varman 820275Lilambikha Raja Vikraman Varman 820275
BPMM6013 MARKETING MANAGEMENT

OverviewCharacters:-•Bert Clark (Vice President & General Manager)•Srikant Thipa (Director of Simple Meal Unit)•Claire Mackey, (Director of Finance and Planning)•Anna Chong (Chief Innovation Officer)•Bob Pugh (Director of Sales & Marketing)
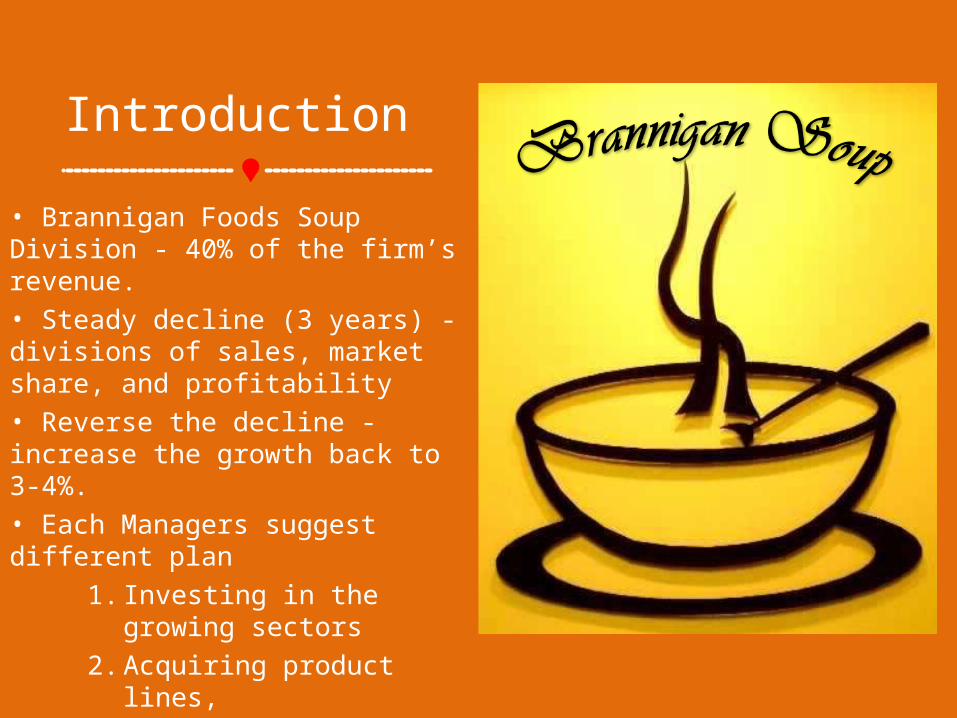
Introduction • Brannigan Foods Soup Division - 40% of the firm’s revenue. • Steady decline (3 years) - divisions of sales, market share, and profitability • Reverse the decline - increase the growth back to 3-4%. • Each Managers suggest different plan
1. Investing in the growing sectors
2. Acquiring product lines, 3. Investing in organic
growth, 4. Invest in the core
Situational Analysis
5 C’s Analysis
COMPANY•100 year legacy•RTE(71%), Dry Soups, Healthy Soups, Fast and simple meals•Cash cow- 40% of total sales•Acquiring & integrating Anabelle’s products into Brannigans product line•Increasing market share by brand awareness
COMPETITOR•Major competitors - General Mills •Small competitors - Roaring Cajun Food
- Red Dragon Food - Brothers Gourmet
•Other competitors - Private labelled soups which increases the sales to 5%•Less shelf space for Brannigan products
CUSTOMER•Current market: Baby boomers•Targeted group: Young generation, young & working mothers•Trends: Innovation of new flavours•Quick meals and healthier product or food
COLLABORATORS•Decrease of 3% in Brannigan’s Shelf Space•Must ensure that retailer goodwill doesn’t fall•Retailers would appreciate price cuts that may boost sales•Supermarkets sold 62.9% of the categoryCONTEXT•Micro: 1) Political and regulations environment 2) Economics environment 3) Social and cultural environment 4) Technological environment•Baby boomers generation is becoming older•Society, trend, fashion: Healthy eating and prevent obesity trends•Technology environment: Food R&D for healthier and active lifestyles
SWOT Analysis
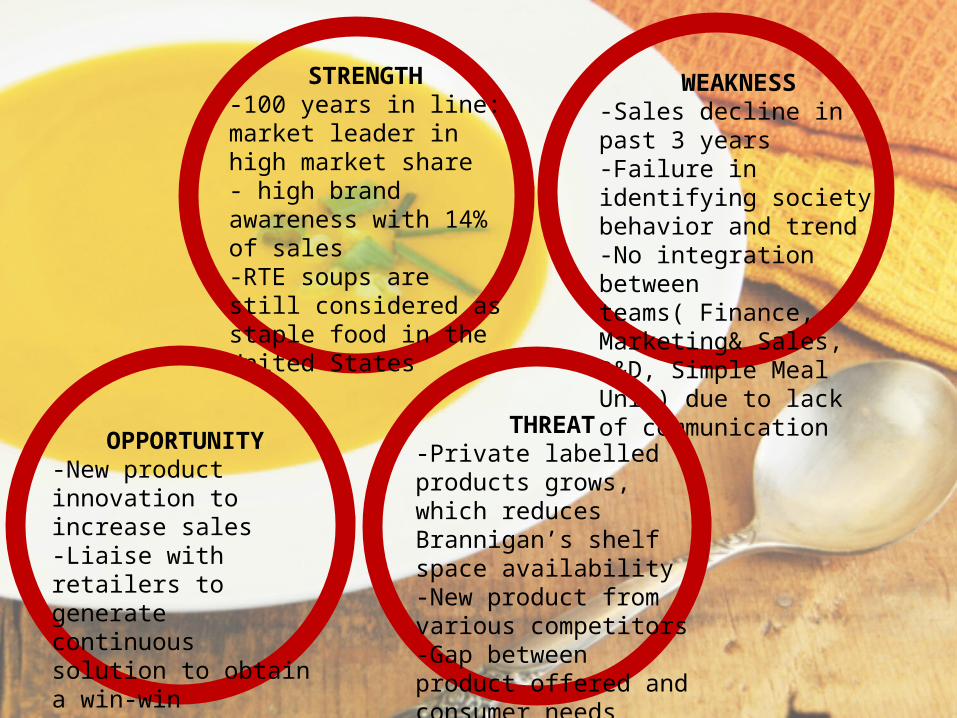
STRENGTH-100 years in line: market leader in high market share- high brand awareness with 14% of sales-RTE soups are still considered as staple food in the United States
WEAKNESS-Sales decline in past 3 years-Failure in identifying society behavior and trend-No integration between teams( Finance, Marketing& Sales, R&D, Simple Meal Unit) due to lack of communicationOPPORTUNITY
-New product innovation to increase sales-Liaise with retailers to generate continuous solution to obtain a win-win situation
THREAT-Private labelled products grows, which reduces Brannigan’s shelf space availability-New product from various competitors-Gap between product offered and consumer needs
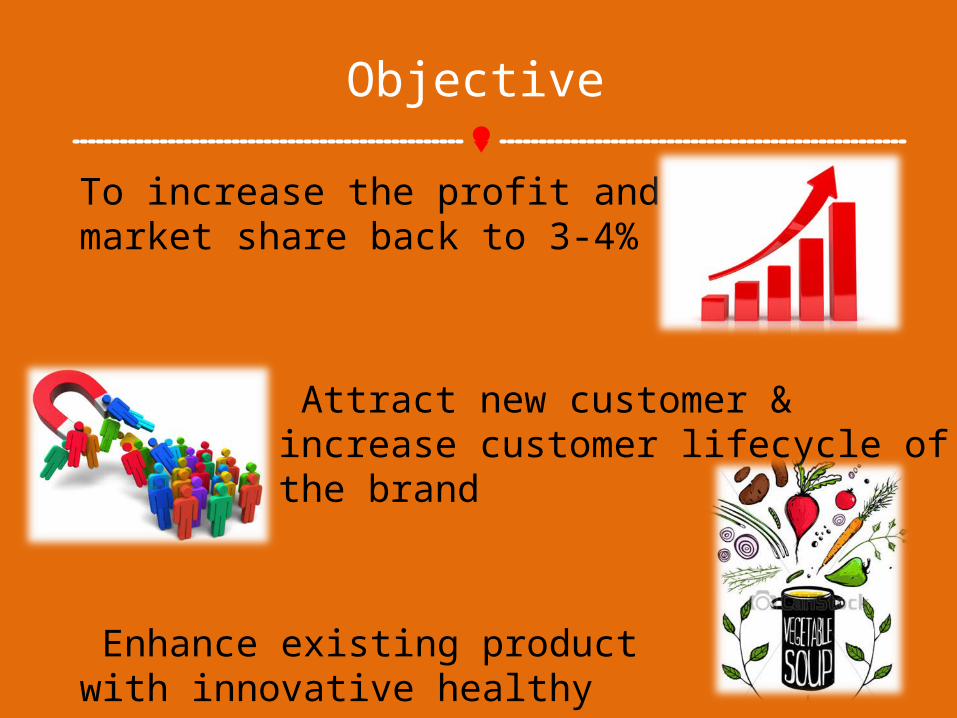
Objective
To increase the profit and market share back to 3-4%
Enhance existing product with innovative healthy concept
Attract new customer & increase customer lifecycle of the brand

Suggestion
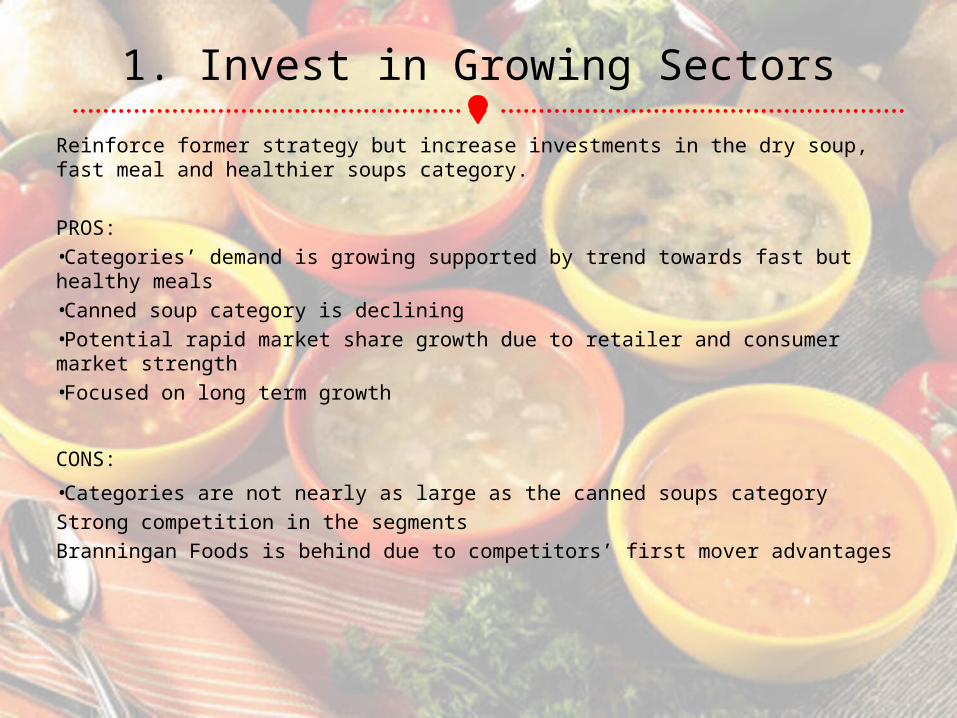
1. Invest in Growing SectorsReinforce former strategy but increase investments in the dry soup, fast meal and healthier soups category. PROS:•Categories’ demand is growing supported by trend towards fast but healthy meals•Canned soup category is declining•Potential rapid market share growth due to retailer and consumer market strength •Focused on long term growth
CONS: •Categories are not nearly as large as the canned soups categoryStrong competition in the segmentsBranningan Foods is behind due to competitors’ first mover advantages
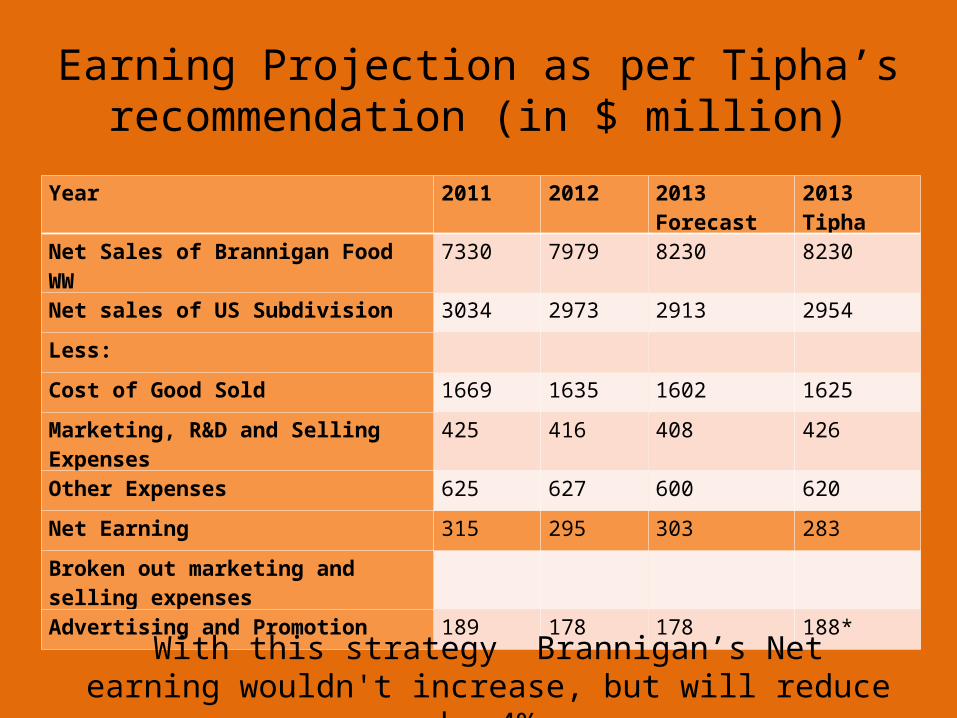
Earning Projection as per Tipha’s recommendation (in $ million)
Year 2011 2012 2013 Forecast 2013 Tipha
Net Sales of Brannigan Food WW 7330 7979 8230 8230
Net sales of US Subdivision 3034 2973 2913 2954
Less:
Cost of Good Sold 1669 1635 1602 1625
Marketing, R&D and Selling Expenses 425 416 408 426
Other Expenses 625 627 600 620
Net Earning 315 295 303 283
Broken out marketing and selling expenses
Advertising and Promotion 189 178 178 188*
With this strategy Brannigan’s Net earning wouldn't increase, but will reduce by 4%
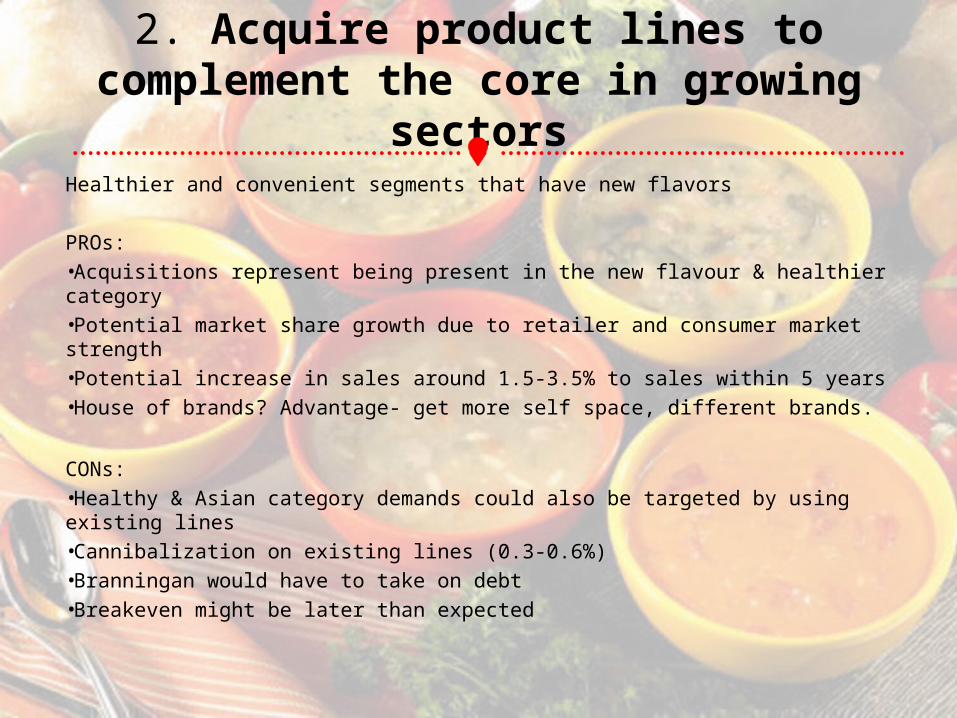
2. Acquire product lines to complement the core in growing
sectorsHealthier and convenient segments that have new flavors
PROs:•Acquisitions represent being present in the new flavour & healthier category•Potential market share growth due to retailer and consumer market strength•Potential increase in sales around 1.5-3.5% to sales within 5 years •House of brands? Advantage- get more self space, different brands.
CONs:•Healthy & Asian category demands could also be targeted by using existing lines•Cannibalization on existing lines (0.3-0.6%) •Branningan would have to take on debt •Breakeven might be later than expected
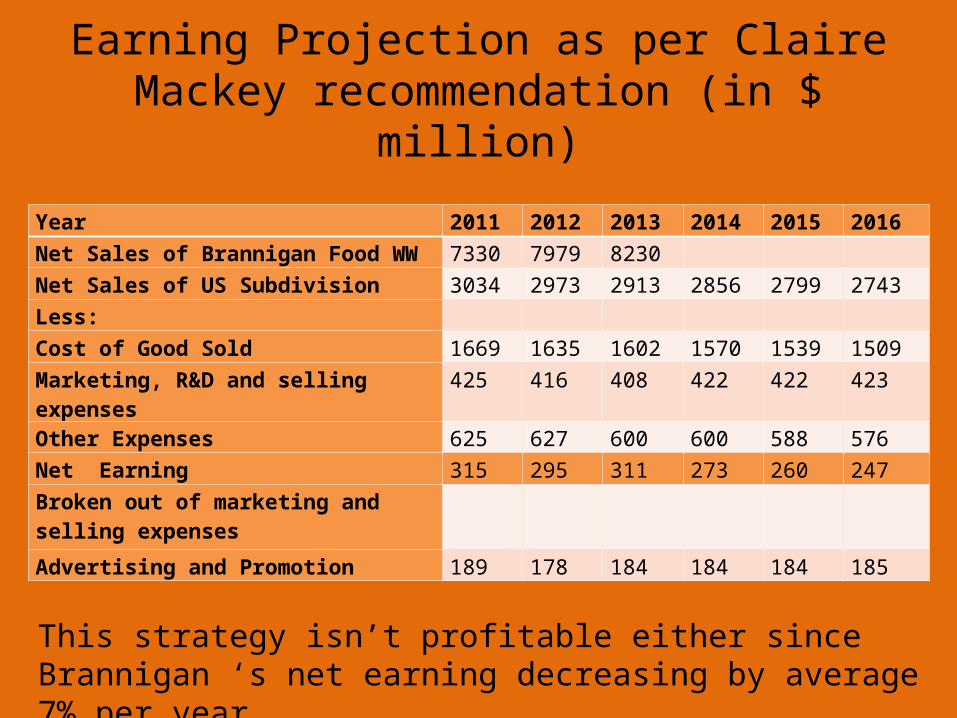
Year 2011 2012 2013 2014 2015 2016Net Sales of Brannigan Food WW 7330 7979 8230 Net Sales of US Subdivision 3034 2973 2913 2856 2799 2743Less: Cost of Good Sold 1669 1635 1602 1570 1539 1509Marketing, R&D and selling expenses 425 416 408 422 422 423Other Expenses 625 627 600 600 588 576Net Earning 315 295 311 273 260 247Broken out of marketing and selling expenses
Advertising and Promotion 189 178 184 184 184 185
Earning Projection as per Claire Mackey recommendation (in $ million)
This strategy isn’t profitable either since Brannigan ‘s net earning decreasing by average 7% per year
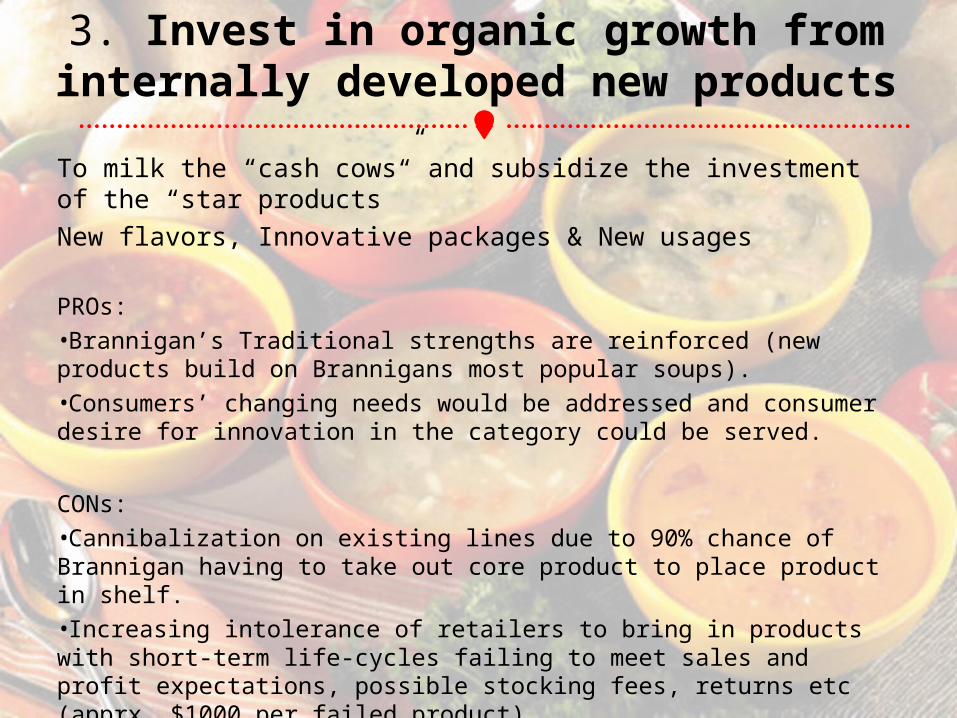
3. Invest in organic growth from internally developed new productsTo milk the “cash cows” and subsidize the investment of the “star products”New flavors, Innovative packages & New usages
PROs:•Brannigan’s Traditional strengths are reinforced (new products build on Brannigans most popular soups).•Consumers’ changing needs would be addressed and consumer desire for innovation in the category could be served.
CONs:•Cannibalization on existing lines due to 90% chance of Brannigan having to take out core product to place product in shelf. •Increasing intolerance of retailers to bring in products with short-term life-cycles failing to meet sales and profit expectations, possible stocking fees, returns etc (apprx. $1000 per failed product)
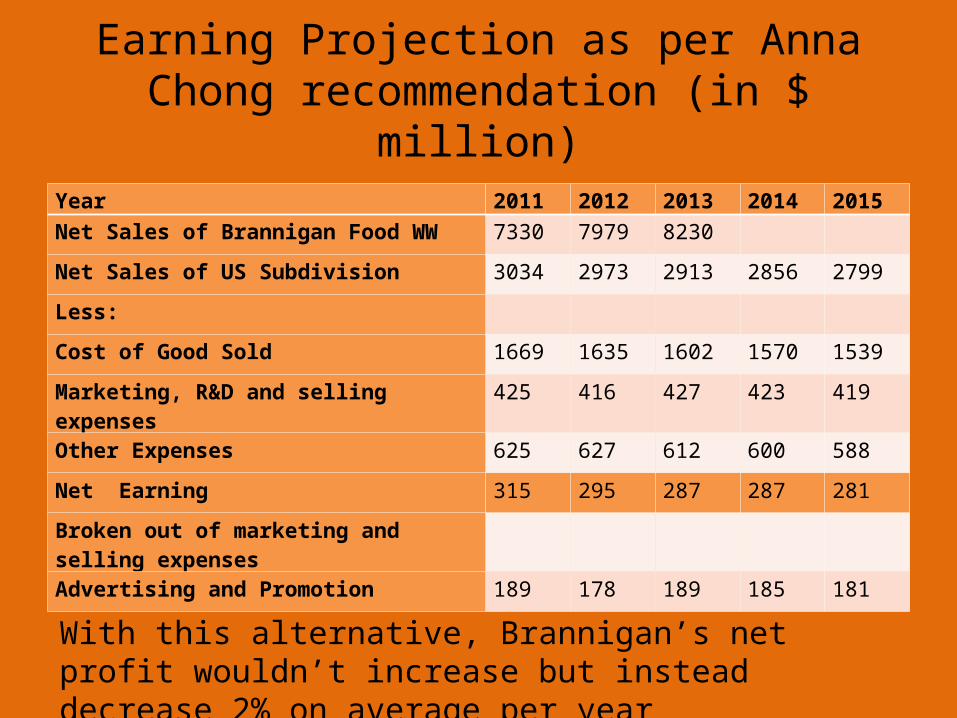
Year 2011 2012 2013 2014 2015Net Sales of Brannigan Food WW 7330 7979 8230
Net Sales of US Subdivision 3034 2973 2913 2856 2799
Less:
Cost of Good Sold 1669 1635 1602 1570 1539
Marketing, R&D and selling expenses 425 416 427 423 419
Other Expenses 625 627 612 600 588
Net Earning 315 295 287 287 281
Broken out of marketing and selling expenses
Advertising and Promotion 189 178 189 185 181
With this alternative, Brannigan’s net profit wouldn’t increase but instead decrease 2% on average per year
Earning Projection as per Anna Chong recommendation (in $ million)
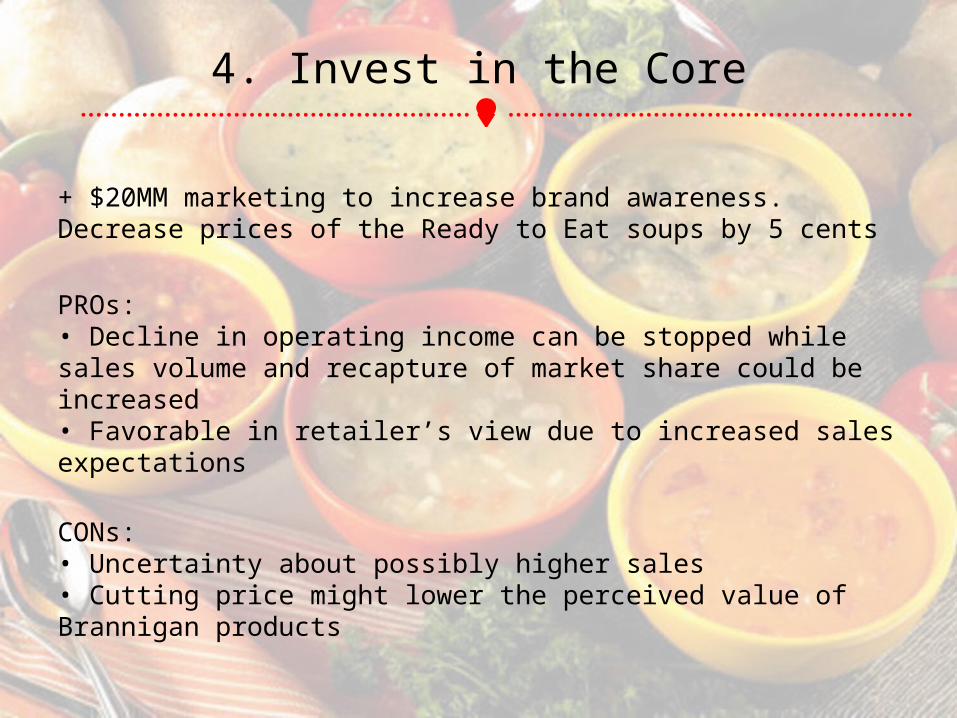
4. Invest in the Core
+ $20MM marketing to increase brand awareness. Decrease prices of the Ready to Eat soups by 5 cents
PROs:• Decline in operating income can be stopped while sales volume and recapture of market share could be increased• Favorable in retailer’s view due to increased sales expectations
CONs:• Uncertainty about possibly higher sales• Cutting price might lower the perceived value of Brannigan products
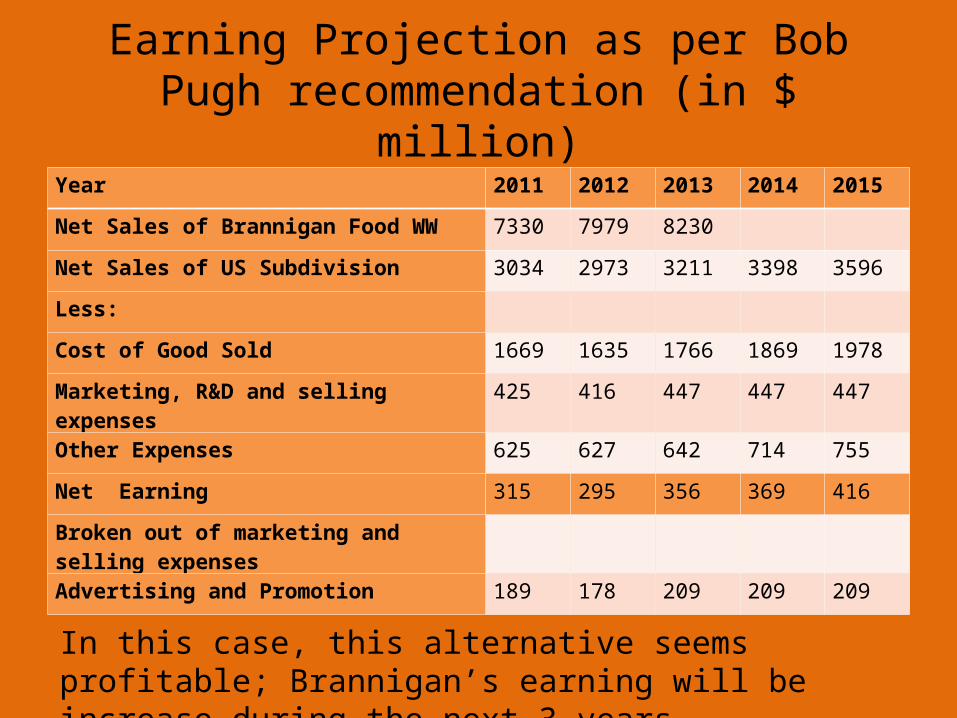
Earning Projection as per Bob Pugh recommendation (in $ million)
Year 2011 2012 2013 2014 2015
Net Sales of Brannigan Food WW 7330 7979 8230
Net Sales of US Subdivision 3034 2973 3211 3398 3596
Less:
Cost of Good Sold 1669 1635 1766 1869 1978
Marketing, R&D and selling expenses 425 416 447 447 447
Other Expenses 625 627 642 714 755
Net Earning 315 295 356 369 416
Broken out of marketing and selling expenses
Advertising and Promotion 189 178 209 209 209
In this case, this alternative seems profitable; Brannigan’s earning will be increase during the next 3 years

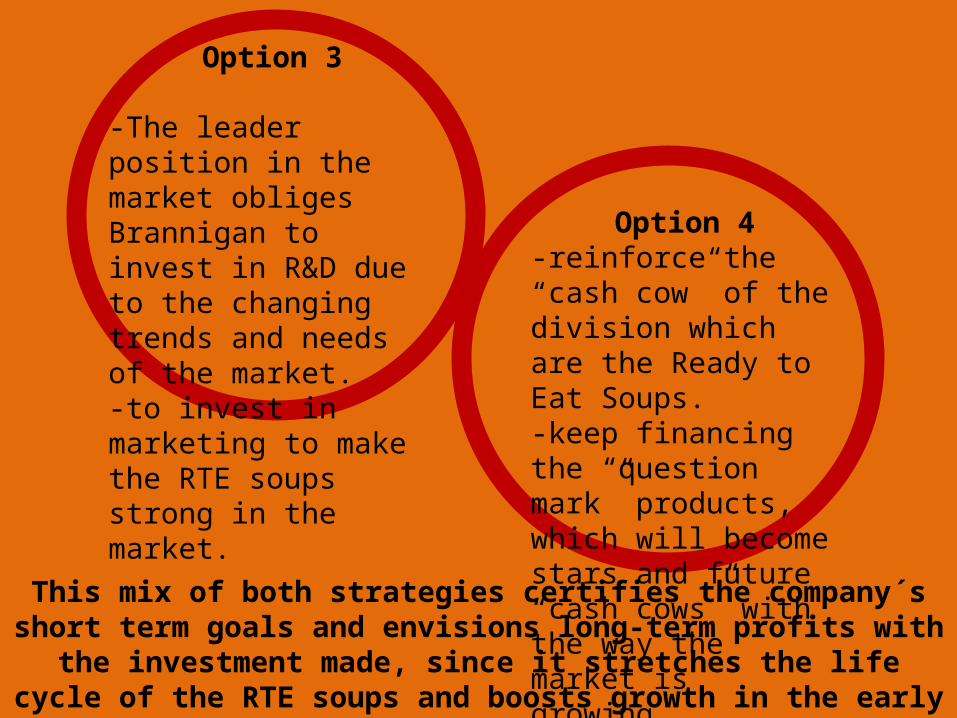
Option 3
-The leader position in the market obliges Brannigan to invest in R&D due to the changing trends and needs of the market.-to invest in marketing to make the RTE soups strong in the market.
Option 4-reinforce the “cash cow” of the division which are the Ready to Eat Soups.-keep financing the “question mark” products, which will become stars and future “cash cows” with the way the market is growing. This mix of both strategies certifies the company´s
short term goals and envisions long-term profits with the investment made, since it stretches the life cycle of the RTE soups and boosts growth in the early stages of
the new products life cycles.
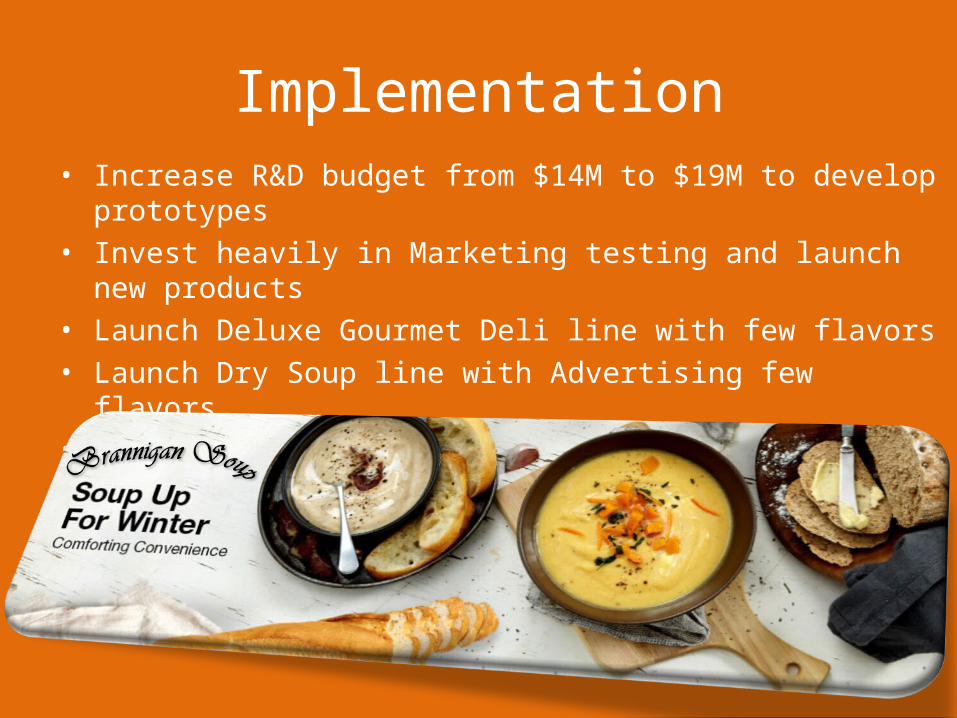
Implementation• Increase R&D budget from $14M to $19M to develop
prototypes• Invest heavily in Marketing testing and launch new
products • Launch Deluxe Gourmet Deli line with few flavors • Launch Dry Soup line with Advertising few flavors • Raise Retailer margin for new lines by 5% to gain shelf
space for new products• Invest in “Heart Healthy” Promotion
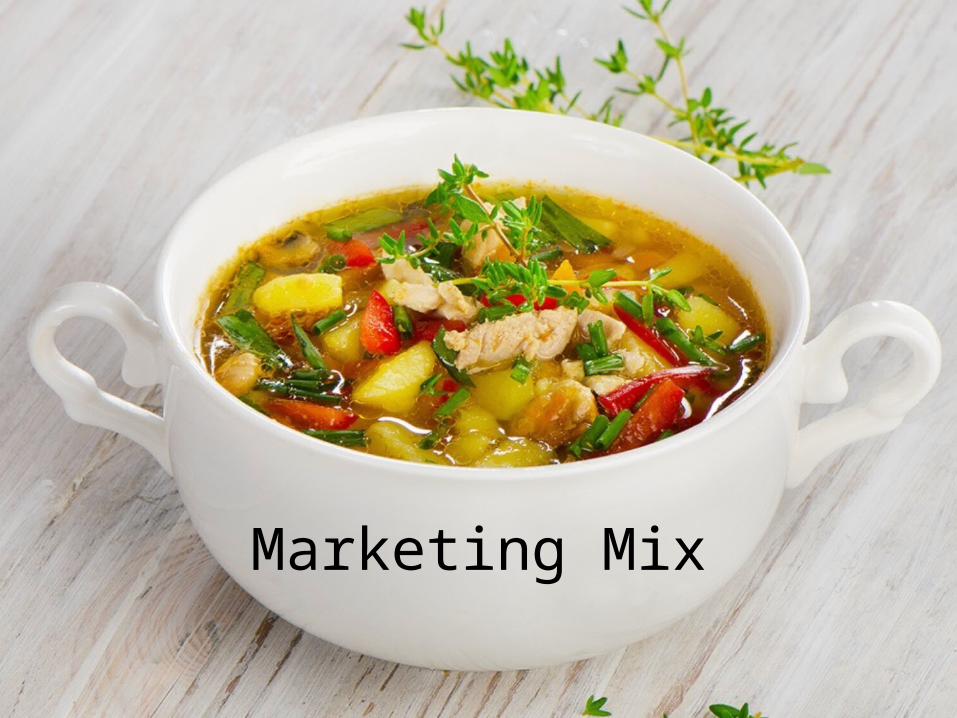
Marketing Mix
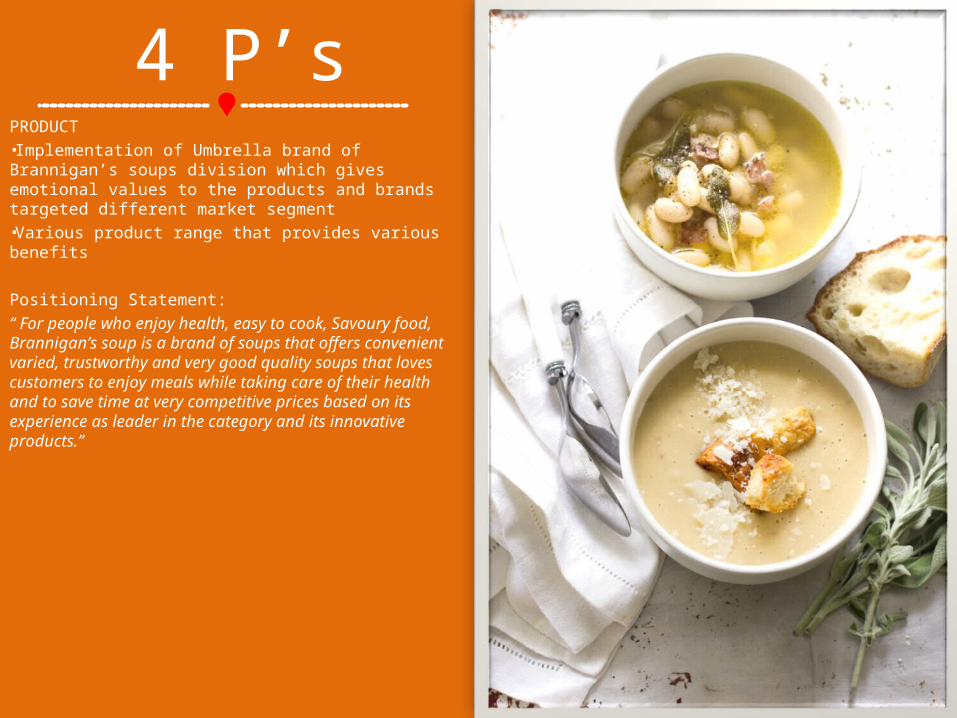
4 P’sPRODUCT•Implementation of Umbrella brand of Brannigan’s soups division which gives emotional values to the products and brands targeted different market segment•Various product range that provides various benefits
Positioning Statement:“ For people who enjoy health, easy to cook, Savoury food, Brannigan’s soup is a brand of soups that offers convenient varied, trustworthy and very good quality soups that loves customers to enjoy meals while taking care of their health and to save time at very competitive prices based on its experience as leader in the category and its innovative products.”
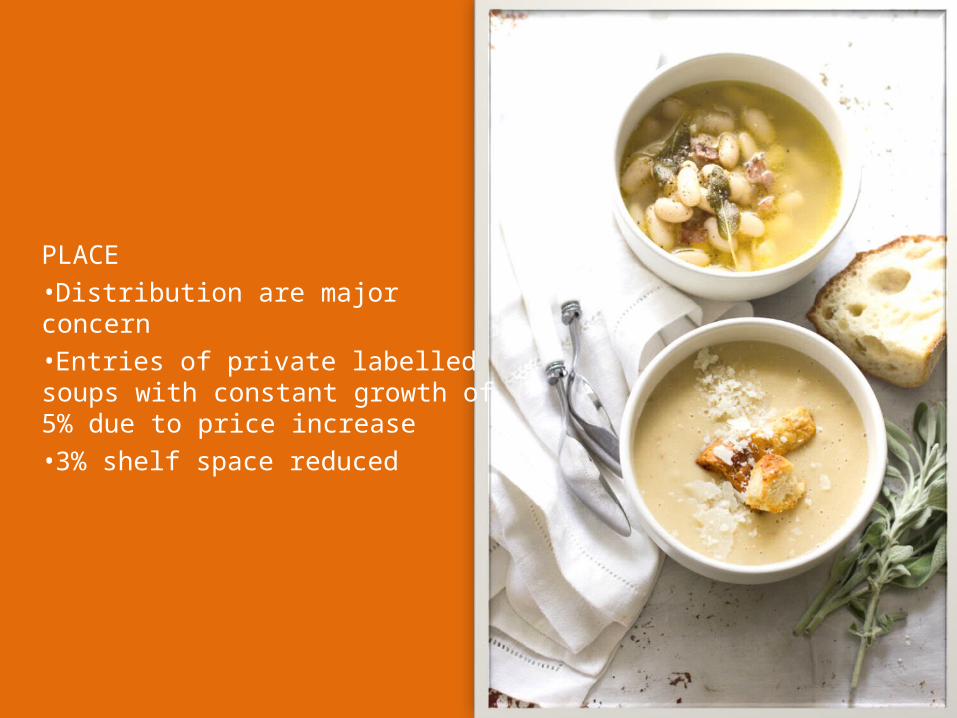
PLACE•Distribution are major concern •Entries of private labelled soups with constant growth of 5% due to price increase•3% shelf space reduced
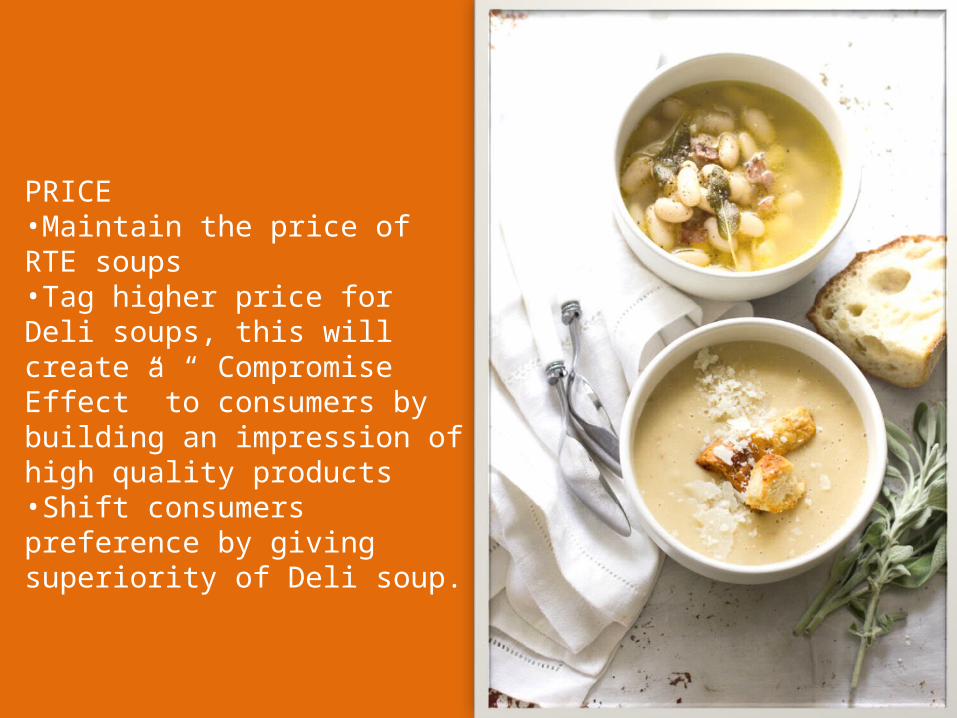
PRICE•Maintain the price of RTE soups•Tag higher price for Deli soups, this will create a “ Compromise Effect” to consumers by building an impression of high quality products•Shift consumers preference by giving superiority of Deli soup.
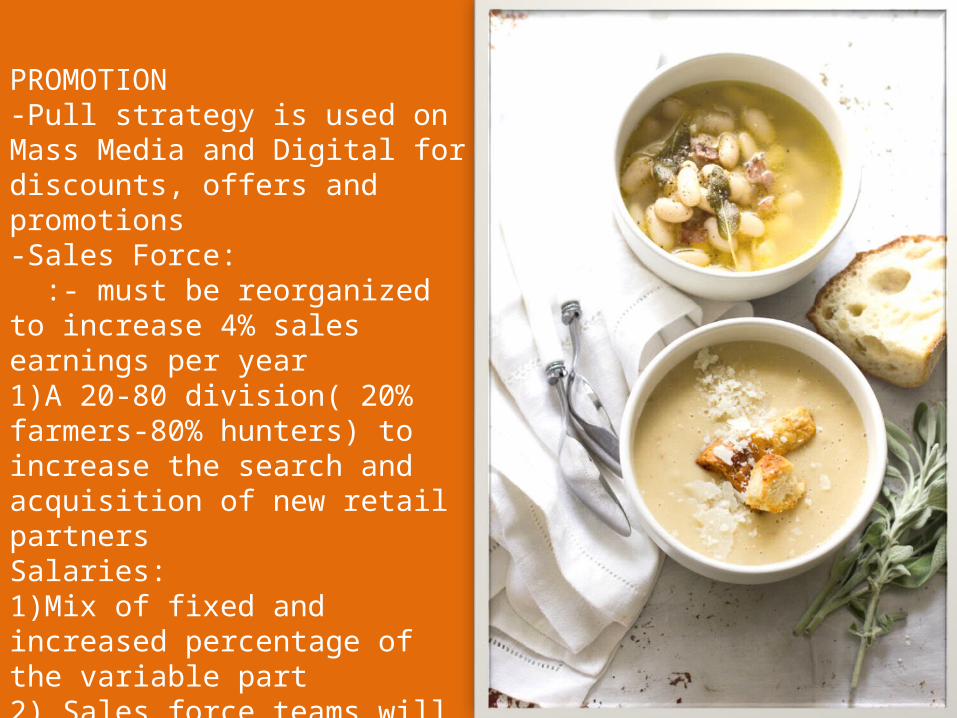
PROMOTION-Pull strategy is used on Mass Media and Digital for discounts, offers and promotions-Sales Force: :- must be reorganized to increase 4% sales earnings per year1)A 20-80 division( 20% farmers-80% hunters) to increase the search and acquisition of new retail partnersSalaries: 1)Mix of fixed and increased percentage of the variable part2) Sales force teams will be given bonuses if they meet and surpass the sales objective of the year
MARKETFragmentation and growing new trends has caused a change in the strategyMISSIONReposition the brand as an innovation company that owns the leadership by increasing the life quality of its consumers.MEASUREMENTDigital marketing impacts
MEDIATV ad and social media
MONEY$170 million budget for marketing expenses of year 2013
MESSAGECreate emotional value


Objective• Increase Sales• Engage Consumers• Offer Value• Improve Brand
Image
Company website Adv & promotion-
digital sites Social network-
Facebook. Twitter, Youtube
Conclusion• If investment is done in core segments of Brannigan Foods as
suggested by Bob Pugh, net earnings increase up to 399 million or 3.05% growth year on year. The sales would increase up to 3186 million by 2014.
• Being market leader in Ready to Eat (RTE) segment Brannigan should look forward to maximize profit on maturing product.
• Clark also has to decide on a long term strategy. Look to cater to customer preferences by developing new products internally.
• Additional expenditure of around 5 million in R & D and also additional promotional costs for the new products, the costs can be met by the increased profits due to the increased investment in the core products.
• This would also reinforce Brannigan’s image as an innovator and help increase its brand equity among customers. As such, Clark would need to adopt both Option 3 and Option 4 to successfully satisfy all of his decision criteria.
Thank You