Branch Performance Blueprint Application Brief
32
Banking and Finance Application Brief Business analytics Branch Performance Blueprint Powered by TM1
Transcript of Branch Performance Blueprint Application Brief
Banking and FinanceApplication BriefBusiness analytics
Branch Performance Blueprint Powered by TM1
IntroductionThis application brief demonstrates a Web-based planning and reporting process for retail bank branch profitability that uses IBM Cognos TM1 and IBM Cognos 8 Business Intelligence.
Best practices at leading banks enable those responsible for branches to validate their forecast plans against corporate set targets and empower management to communicate their expectations clearly. By capturing account and balances information for loan and deposit products, the costs driven by associated volumes can be calculated using transactions and activity information fed from any activity-based costing (ABC) solution.
The Branch Performance Blueprint Powered by TM1 offers branch managers an on-the-ground view, with real-time profitability feedback, of decisions related to branch volume, accounts, rates, spreads, fee income, compensation, staffing, direct expenses and assigned expenses. In the Blueprint, costs are captured at the transaction level and do not appear as a separate expense.
Had the activity-based costing (ABC) source used in the model not allocated expense to each transaction within an activity, then expenses would have been independently trackable. The components of profitability are interrelated and act as drivers. For example, an increase in the number of loan accounts will
create more revenue, increasing the transaction volumes and activities associated with loan accounts, along with associated expenses. Likewise, an increase in the headcount for certain positions in the bank would create an increase in the number of new accounts realized by the additional resource.
By implementing this Blueprint, a bank will benefit from forward-looking visibility into workforce decisions at both the branch level and the company level. The Blueprint and processes described in this application brief are generic for any retail bank, yet can be configured to support the complex and diverse requirements of any financial institution.
Drive better branch performance management with customer segment and product level planning, analysis and reportingBranch performance—the ability of a bank branch to acquire deposits, generate revenue, retain customers, and operate efficiently—is at the core of retail banking success. Branch deposits are the preferred resource for funding the majority of a bank’s money-making lending activities. A failure to generate deposits means the bank must support lending activities with more expensive capital, which can significantly depress profitability.
2 Branch Performance Blueprint Powered by TM1

Banking and Finance 3
With the Branch Performance Blueprint Powered by TM1, branch managers can view and evaluate performance management by looking within the walls of the bank and combining that information with the external factors that will impact the profit and growth potential for any branch location.
The Blueprint addresses the following key performance metrics:
Profitability by branch, customer and product •
(ranking best and worst performers)Sales monitoring by product, customer and •
sales representativeOperational efficiency by branch, staff position, •
transaction and activity cost informationCustomer satisfaction and loyalty•
Profitability comparison of actual versus plan and forecast•
Comparative reporting by branch type•
Local market share analysis for deposits and loans •
Competitive landscape•
Population density•
Median age•
Median income level•
Unemployment statistics•
Number of households•
Market share by product•
The Blueprint also offers:
Performance views of multiple dimensions and at various •
levels (entire network, region, district levels)Detailed analysis that includes drilling down to detailed •
information for any dimensionReporting integrated with planning/forecasting to support •
more timely changes to strategic direction Real-time monitoring of branch activity •
(operational and sales)
The Branch Performance Blueprint Powered by TM1 uses the Web to accelerate and ease the pain of data collection and performance measurement and makes it easier to do what’s most important: plan for a better branch customer experience and enhance profitability. It also provides access to reporting and administration tools developed for finance personnel and for all levels of management in a retail bank and those in operations that support the branch network.
The sections that follow walk you through the tabs and other components of the Blueprint.

4 Branch Performance Blueprint Powered by TM1
Revenue and Balances The Revenue and Balances tab manages branch balances, accounts and net new customers. Those responsible for forecasting runoff, new business and attrition for account balances and new accounts and attrition for the number of accounts can use Revenue and Balances to run their appropriate forecasts. A forecast is run for each product group and for each customer segment in that group. Net new headcount is driven by decisions made on the Staffing tab. The contributor can additionally affect new accounts and average balances with entries to the new accounts marketing program, managers’ discretion or both.
Fields in gray are cannot be edited and are either locked historical data or items calculated based on information entered in the white areas, which can be edited. As changes are made, they are highlighted in blue, along with any cells affected by the change. Balance changes will affect revenue numbers and flow through the model to subsequent tabs. Likewise, changes in the accounts area will affect income (revenue from new accounts) and drive account related activity volumes. Account related activity volumes will affect assigned expenses, that is, expenses specifically related to the number and types of accounts in the model.
!

To facilitate data entry, you may reorient the tab as needed. For example, you can reorient the tab to work on the planned runoff for all product groups in the affluent customer sector.
Or, for all customer segments for a given product.
Banking and Finance 5
!
!

6 Branch Performance Blueprint Powered by TM1
StaffingThe Staffing tab is where a branch manager plans for one of the branch’s largest expenses. A branch manager will be able to control net new headcount by month and by type of position, such as customer service representative (CSR III). Managers also have some latitude in defining the overtime percentage for the position. Based on these few entries, staffing costs for the entire branch will be calculated, You can view them on this tab or as part of the Branch Plan tab.
Because staffing is not planned at the product group or customer segment level, they are not included in the Product Segment Plan by Branch tab. The Staffing tab also includes a few branch staffing productivity guidelines. Besides the guidelines included in the tab, others can be added or existing ones modified to suit an individual bank’s need. By adding or deleting staff on this tab, a contributor will affect the number of new accounts and related balances.
!

Branch Plan The Branch Plan tab is a complete look at a branch at the highest level. It consolidates all the information developed in the previous two tabs, along with direct expenses and overhead expense information for finance, executive and human resources.
A number of key performance indicators (KPIs) have been calculated for convenience and information. These indicators have been linked back to the next tab, Targets by Branch, so that they can be compared to management targets and to analyze trends.
Banking and Finance 7
!

8 Branch Performance Blueprint Powered by TM1
Targets by Branch The Targets by Branch tab contains information from the Branch Plan tab and an upload of targets. The column labeled Act/Fcst contains either the actual data for prior months or the current forecast based upon decisions made within the Blueprint. The Target column is uploaded and represents management’s targets or goals for this particular branch. You can use the gap to evaluate performance versus goals and a trend analysis to report on whether you are closing the gap or diverting away from targets.
There are no selections to be made on this tab because it is for informational purposes only.
!
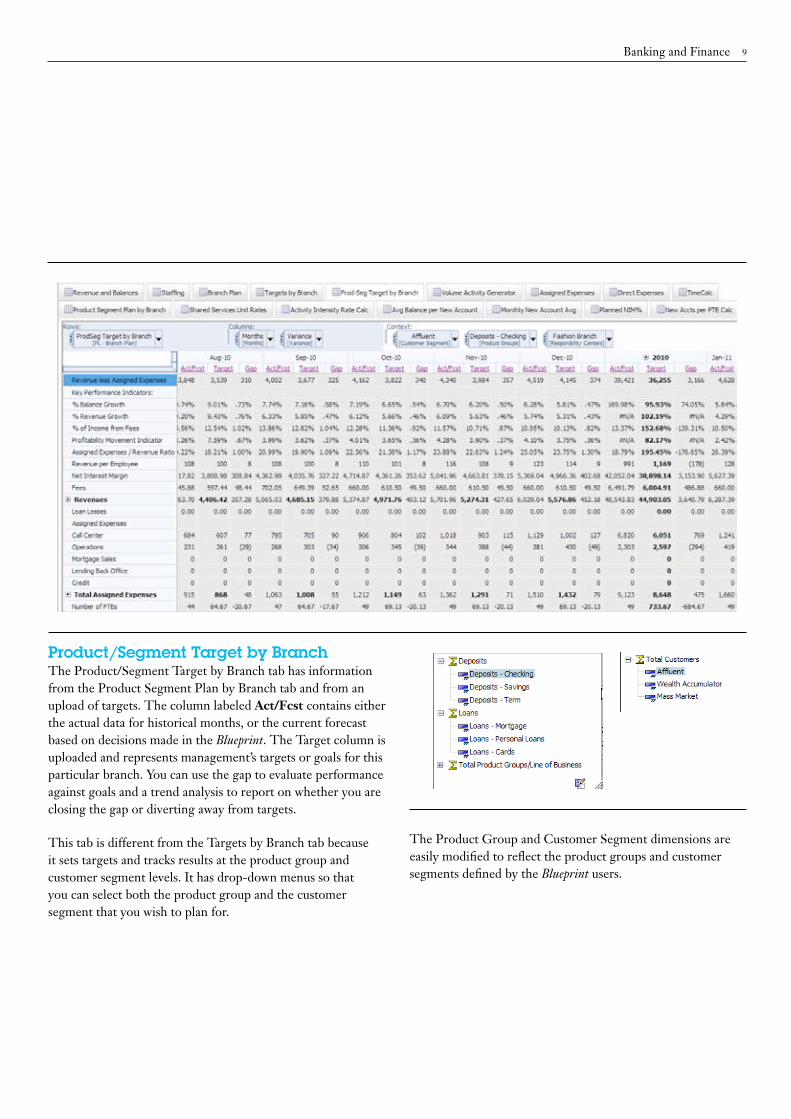
Product/Segment Target by Branch The Product/Segment Target by Branch tab has information from the Product Segment Plan by Branch tab and from an upload of targets. The column labeled Act/Fcst contains either the actual data for historical months, or the current forecast based on decisions made in the Blueprint. The Target column is uploaded and represents management’s targets or goals for this particular branch. You can use the gap to evaluate performance against goals and a trend analysis to report on whether you are closing the gap or diverting away from targets.
This tab is different from the Targets by Branch tab because it sets targets and tracks results at the product group and customer segment levels. It has drop-down menus so that you can select both the product group and the customer segment that you wish to plan for.
The Product Group and Customer Segment dimensions are easily modified to reflect the product groups and customer segments defined by the Blueprint users.
Banking and Finance 9
!

10 Branch Performance Blueprint Powered by TM1
Volume Activity Generator The Volume Activity Generator tab is where you execute the activity-based costing portion of the Blueprint. In all the other tabs in the model that use products as a dimension, you plan at the Product Group level. This tab provides a deeper view of branch performance. While still planning at the Branch and Customer Segment level, you now plan at both a Product and Activity level.
!

Banking and Finance 11
In this section, we’ll take a closer look at each dimension separately. In the view shown here, the Volume Activity Generator, there is a drop down box that currently shows customer inquiry calls.
There are many activities that might be associated with a specific product. When loading data from an activity-based costing engine, many transactions can make up an activity for a specific product and customer segment. For example, activity-customer inquiry calls would be made up of many different types of transactions, such as purchase inquiries, call center balance inquiries, call center inquiries and inbound purchase calls would all be examples of items that are part of activity-customer inquiry calls. The number of times these activities take place for a given product, at a given branch, for a given customer segment during a specific period (in this example, monthly), is defined as the activity intensity rate. In other words, it is not only the transactions that make up the activity, but the number of times an activity might occur during the month (for example, a customer might make a call center balance inquiry twice a month). In the Activity Intensity Rate Calc tab (a subsequent tab), you will see how the Activity Intensity Rate is determined on a historical basis and with linear extrapolation. The activity intensity rate is used in the accounts forecast in the Volume Activity Gen-erator tab to forecast activity volumes that will be used to drive assigned expenses.
Transactions that flow into activities are based on specific products and customer segments. Therefore, you plan at the product level in the Volume Activity Generator.

12 Branch Performance Blueprint Powered by TM1
In the Revenue and Balances tab, you plan at the product group level. In planning volumes in the Volume Activity Generator you plan at the product level.
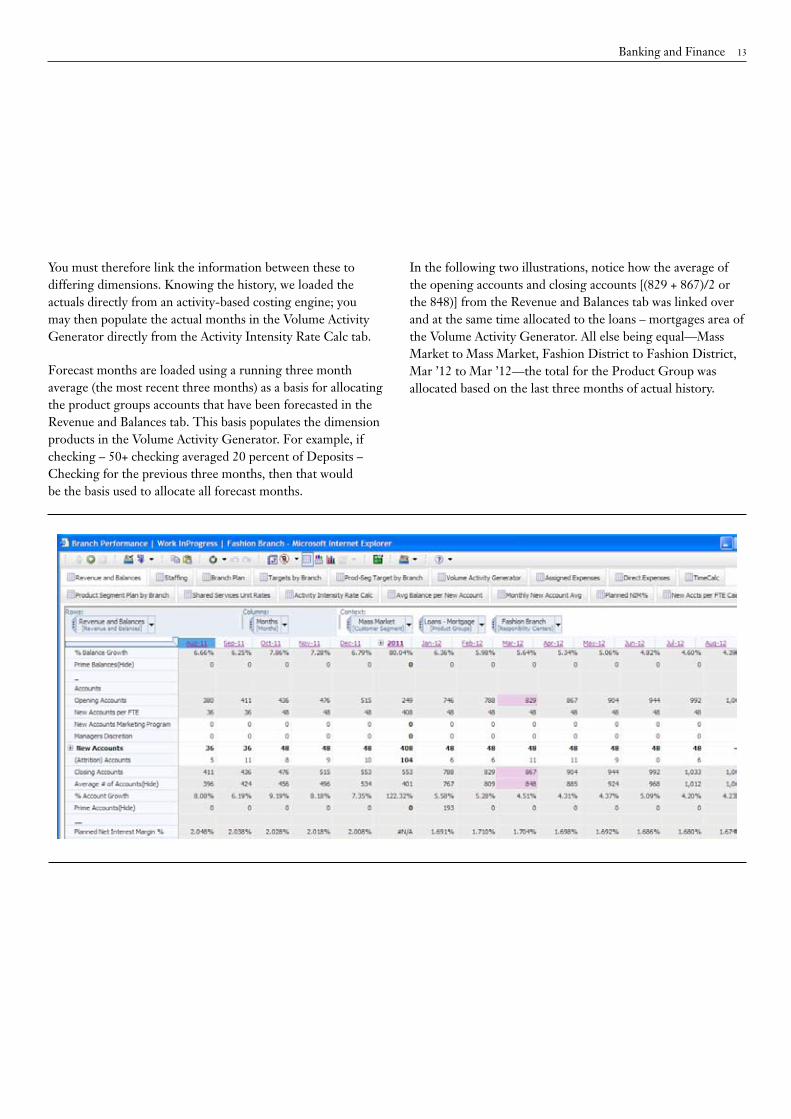
You must therefore link the information between these to differing dimensions. Knowing the history, we loaded the actuals directly from an activity-based costing engine; you may then populate the actual months in the Volume Activity Generator directly from the Activity Intensity Rate Calc tab.
Forecast months are loaded using a running three month average (the most recent three months) as a basis for allocating the product groups accounts that have been forecasted in the Revenue and Balances tab. This basis populates the dimension products in the Volume Activity Generator. For example, if checking – 50+ checking averaged 20 percent of Deposits – Checking for the previous three months, then that would be the basis used to allocate all forecast months.
!
!
You must therefore link the information between these to differing dimensions. Knowing the history, we loaded the actuals directly from an activity-based costing engine; you may then populate the actual months in the Volume Activity Generator directly from the Activity Intensity Rate Calc tab.
Forecast months are loaded using a running three month average (the most recent three months) as a basis for allocating the product groups accounts that have been forecasted in the Revenue and Balances tab. This basis populates the dimension products in the Volume Activity Generator. For example, if checking – 50+ checking averaged 20 percent of Deposits – Checking for the previous three months, then that would be the basis used to allocate all forecast months.
In the following two illustrations, notice how the average of the opening accounts and closing accounts [(829 + 867)/2 or the 848)] from the Revenue and Balances tab was linked over and at the same time allocated to the loans – mortgages area of the Volume Activity Generator. All else being equal—Mass Market to Mass Market, Fashion District to Fashion District, Mar ’12 to Mar ’12—the total for the Product Group was allocated based on the last three months of actual history.
Banking and Finance 13
!
14 Branch Performance Blueprint Powered by TM1
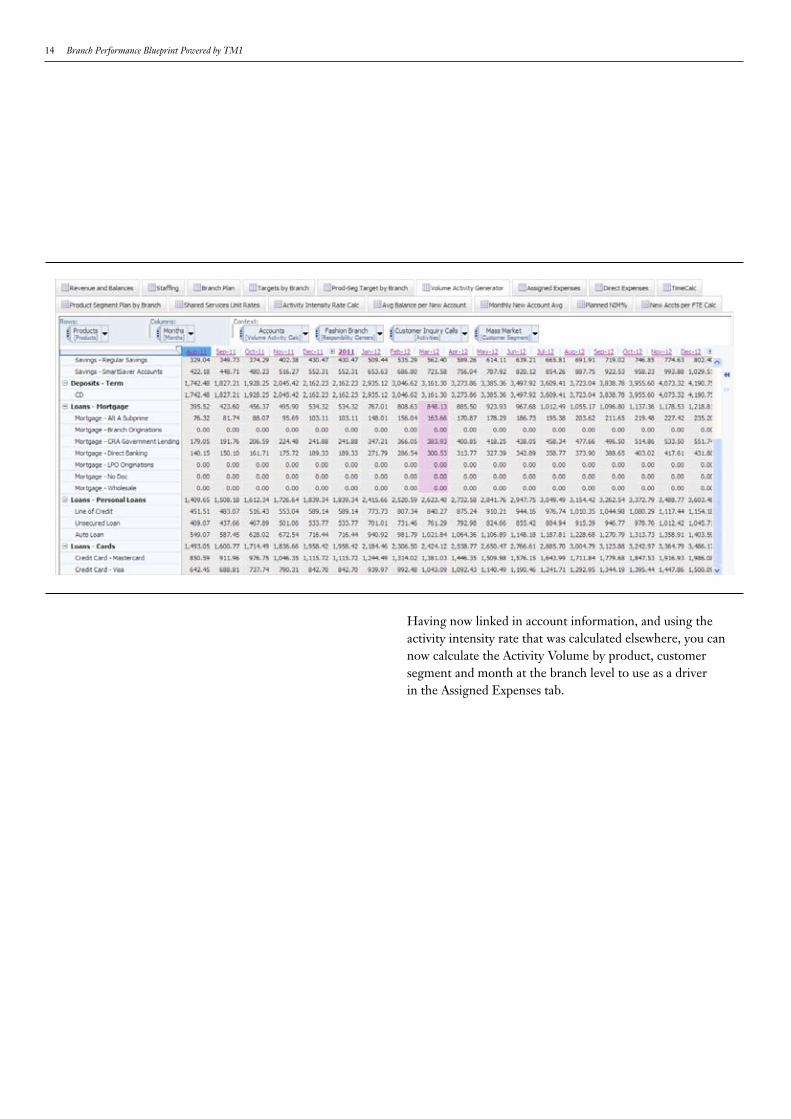
Having now linked in account information, and using the activity intensity rate that was calculated elsewhere, you can now calculate the Activity Volume by product, customer segment and month at the branch level to use as a driver in the Assigned Expenses tab.
!

Assigned Expenses You use the Assigned Expenses tab to calculate expenses driven by account activity. All calculations reflect the choices made in the preceding tabs. We have included this tab as a courtesy to provide information. An administrator of the Cognos TM1 application could decide to hide this tab so that a user only sees the consolidated results in the Product Segment Plan by Branch or the Branch Plan tabs. Volumes are fed from the Volume Activity Generator and the Planned Unit Price from an Assumptions tab. Planned Unit Price is set at a corporate level based upon historical values and recent initiatives.
Banking and Finance 15
!

16 Branch Performance Blueprint Powered by TM1
Direct Expenses A branch manager may enter expenses directly associated with the particular branch but not driven by bank-related volume activity in the Direct Expenses tab. Historical data is loaded for past months. You can then enter or adjust Direct Expense for all forecast periods. The expense categories shown are for illustrative purposes only, and may be expanded and modified to reflect the needs of the particular bank. It should be noted that direct expenses are also planned at the branch level and not broken down by product group or customer segment. For this reason, they are included in the Branch Plan tab, as are Staffing Costs. Because there is no direct method for allocating them to Product Group and Customer Segment, they are not included on the Product Segment Plan by Branch tab.
!
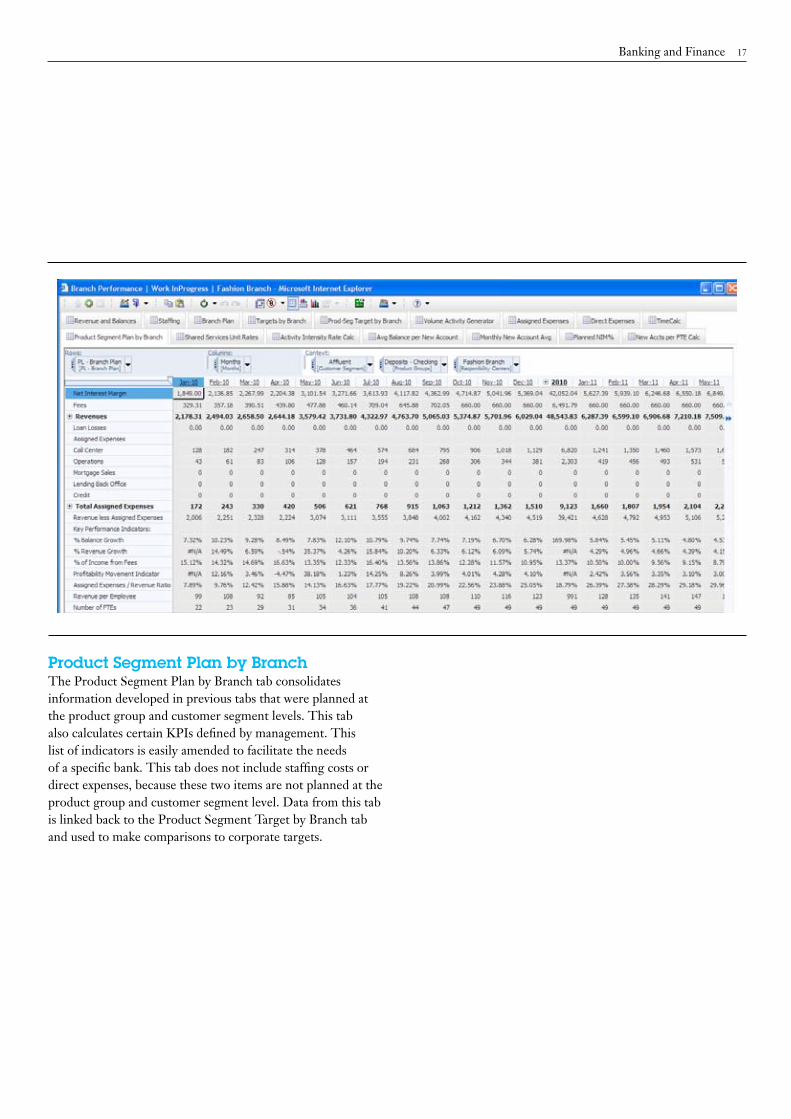
Product Segment Plan by Branch The Product Segment Plan by Branch tab consolidates information developed in previous tabs that were planned at the product group and customer segment levels. This tab also calculates certain KPIs defined by management. This list of indicators is easily amended to facilitate the needs of a specific bank. This tab does not include staffing costs or direct expenses, because these two items are not planned at the product group and customer segment level. Data from this tab is linked back to the Product Segment Target by Branch tab and used to make comparisons to corporate targets.
Banking and Finance 17
!
18 Branch Performance Blueprint Powered by TM1
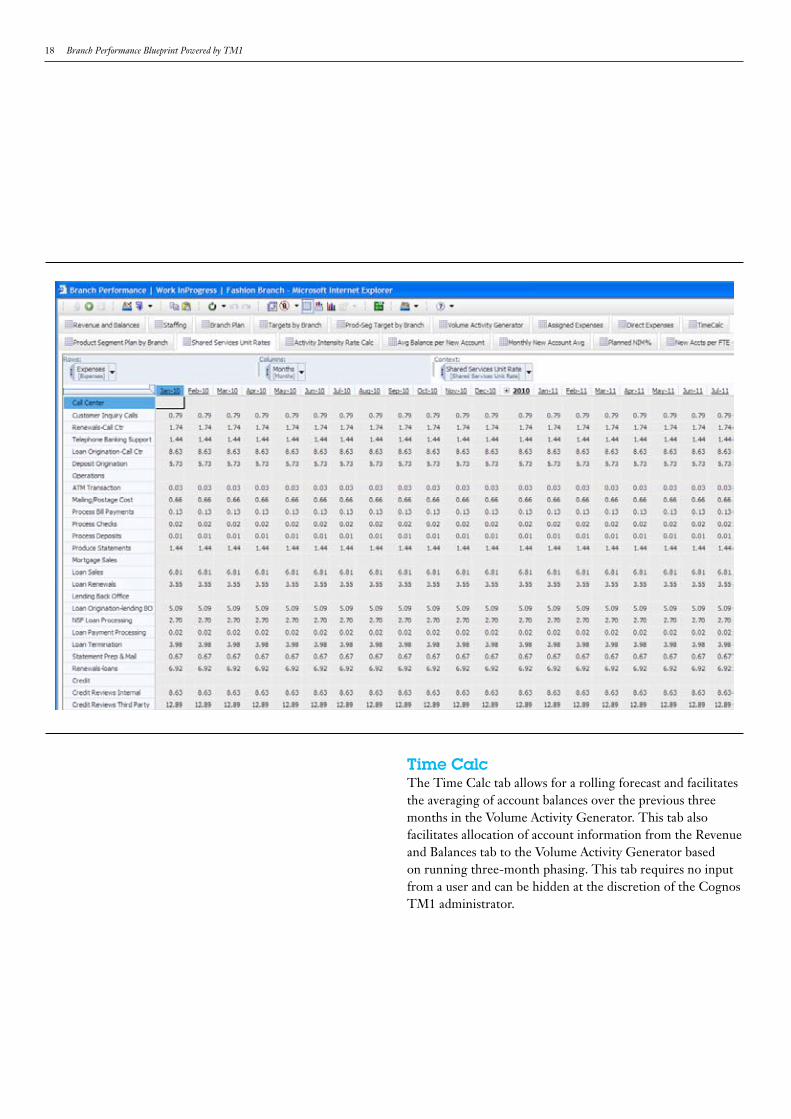
Time Calc The Time Calc tab allows for a rolling forecast and facilitates the averaging of account balances over the previous three months in the Volume Activity Generator. This tab also facilitates allocation of account information from the Revenue and Balances tab to the Volume Activity Generator based on running three-month phasing. This tab requires no input from a user and can be hidden at the discretion of the Cognos TM1 administrator.
!

Product Segment Plan by Branch The Product Segment Plan by Branch tab consolidates information developed in previous tabs that were planned at the product group and customer segment levels. This tab also calculates certain KPIs defined by management. This list of indicators is easily amended to facilitate the needs of a specific bank. This tab does not include staffing costs or direct expenses, because these two items are not planned at the product group and customer segment level. Data from this tab is linked back to the Product Segment Target by Branch tab and used to make comparisons to corporate targets.
Banking and Finance 19
!

20 Branch Performance Blueprint Powered by TM1
Activity Intensity Rate Calc From the activity-based costing source, you load historical accounts and actual activity volume. By dividing volume by the number of accounts, you arrive at the Actual Activity Intensity Rate. Using this information and relying on data in the Time Calc tab, you are able to use the Activity Intensity Rate Calc tab for a linear extrapolation to derive an Activity Intensity Rate. This rate is linked into the Volume Activity Generator to calculate forecast volumes based on current account balances and anticipated activity rates. This tab requires no input from the user and can be hidden at the discretion of the Cognos TM1 administrator.
!

Banking and Finance 21
Avg Balance per New AccountThe Avg Balance per New Account tab stores the data used in the Revenue and Balances tab to calculate the additional balances due to the recognition of New Accounts. This tab requires no input from the user and can be hidden at the discretion of the Cognos TM1 administrator.
Monthly New Account AvgThe Monthly New Account tab is used to bring the Monthly New Account Averages into the Staffing tab to facilitate the planning of future headcount needs. It is also used in the New Accounts per FTE Calc tab in calculating the number of New Accounts per FTE that is then used in the Revenue and Balances tab. This tab requires no input from the user and can be hidden at the discretion of the Cognos TM1 admin.
!
!

22 Branch Performance Blueprint Powered by TM1
Planned NIM %The Planned NIM% tab is used to link the Planned Net Interest Margin percentage into the Revenue and Balances tab. This tab requires no input from the user and can be hidden at the discretion of the IBM Cognos TM1 administrator.
!

Banking and Finance 23
New Accounts per FTE CalcThe final tab in our model is used to calculate the new accounts per fte in our Revenue and Balances tab. It receives the Number of FTEs information from the Staffing tab, the Monthly New Acct Average from the Monthly New Account Avg tab and then calculates the New Accounts per FTE, which is then used in the Revenue and Balances tab. This tab also requires no input from the user and can be hidden at the discretion of the Cognos TM1 administrator.
Analysis and Reporting In addition to the planning functionality provided by Cognos TM1 described to this point, the Branch Performance Blueprint Powered by TM1 includes reporting and analysis using Cognos 8 Business Intelligence. Reports can be created that reflect data from either the Cognos TM1 model or from an activity-based costing model.
!

24 Branch Performance Blueprint Powered by TM1
District Manager DashboardThe Blueprint has a dashboard that district managers can use to see information they need to make critical business decisions.
Welcome The Welcome page provides the District Manager with a quick glance into the collective health of the branches that make up his or her district. It also provides important updates and basic navigation capabilities.
!
Banking and Finance 25
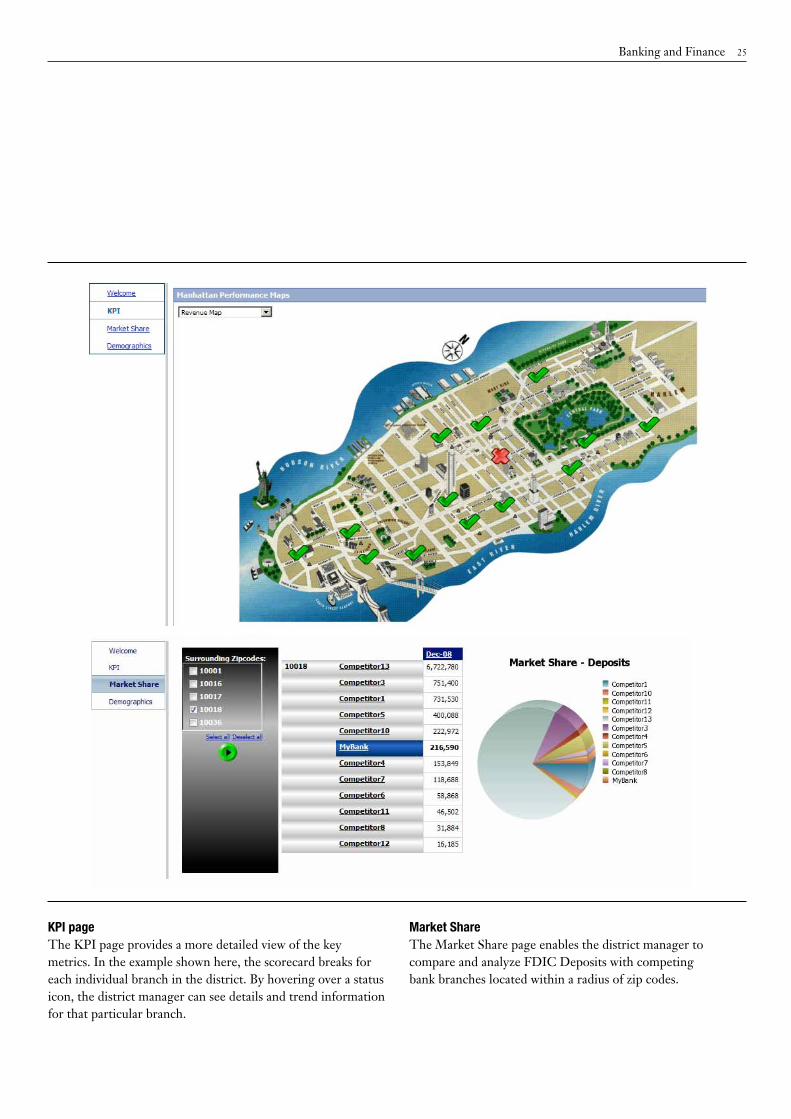
KPI page The KPI page provides a more detailed view of the key metrics. In the example shown here, the scorecard breaks for each individual branch in the district. By hovering over a status icon, the district manager can see details and trend information for that particular branch.
Market Share The Market Share page enables the district manager to compare and analyze FDIC Deposits with competing bank branches located within a radius of zip codes.
!
!
26 Branch Performance Blueprint Powered by TM1
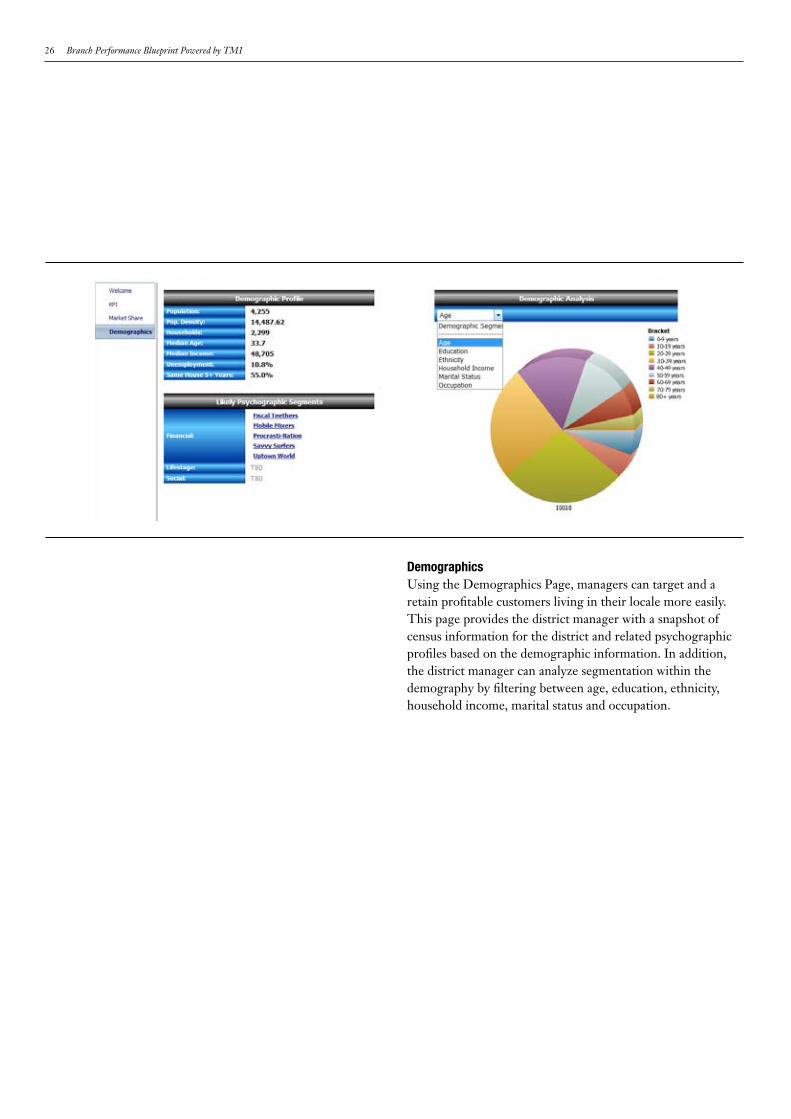
Demographics Using the Demographics Page, managers can target and a retain profitable customers living in their locale more easily. This page provides the district manager with a snapshot of census information for the district and related psychographic profiles based on the demographic information. In addition, the district manager can analyze segmentation within the demography by filtering between age, education, ethnicity, household income, marital status and occupation.
!
Banking and Finance 27
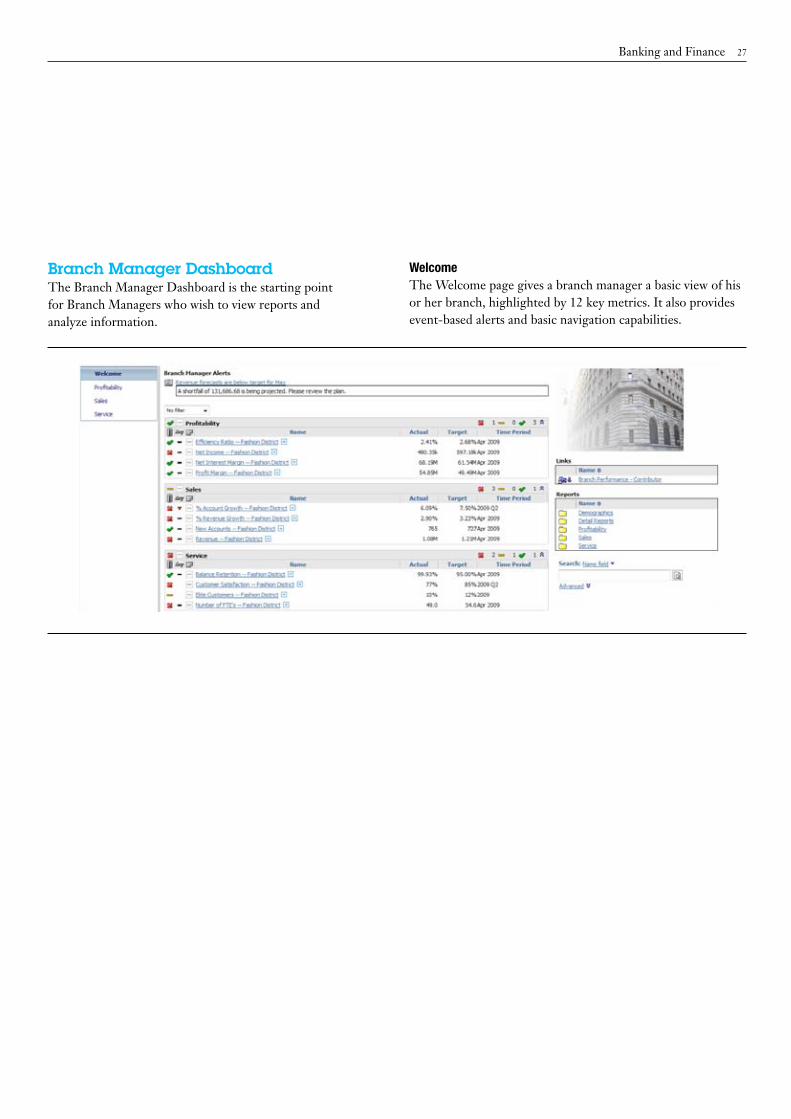
Branch Manager DashboardThe Branch Manager Dashboard is the starting point for Branch Managers who wish to view reports and analyze information.
Welcome The Welcome page gives a branch manager a basic view of his or her branch, highlighted by 12 key metrics. It also provides event-based alerts and basic navigation capabilities.
!

28 Branch Performance Blueprint Powered by TM1
Profitability The Profitability page breaks down rankings for the branch manager’s location versus the bank’s other branches in the district, profitability by product or customer segment and profitability rankings for the branch’s customers.
In addition, the manager can drill through the customer rankings to a detailed customer profile report.
Branch managers can also use the Profitability page to analyze profitability by product and customer segment for the current month, prior month and same month of the prior year.
!
!
Banking and Finance 29
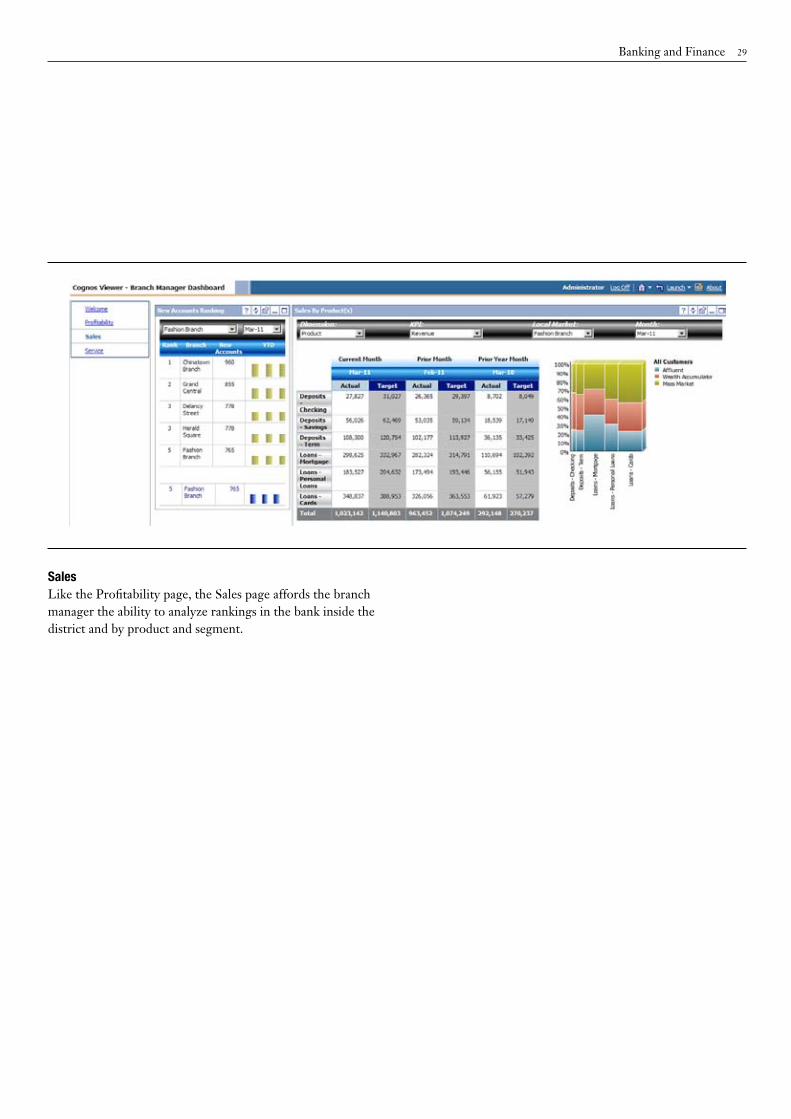
Sales Like the Profitability page, the Sales page affords the branch manager the ability to analyze rankings in the bank inside the district and by product and segment.
!

30 Branch Performance Blueprint Powered by TM1
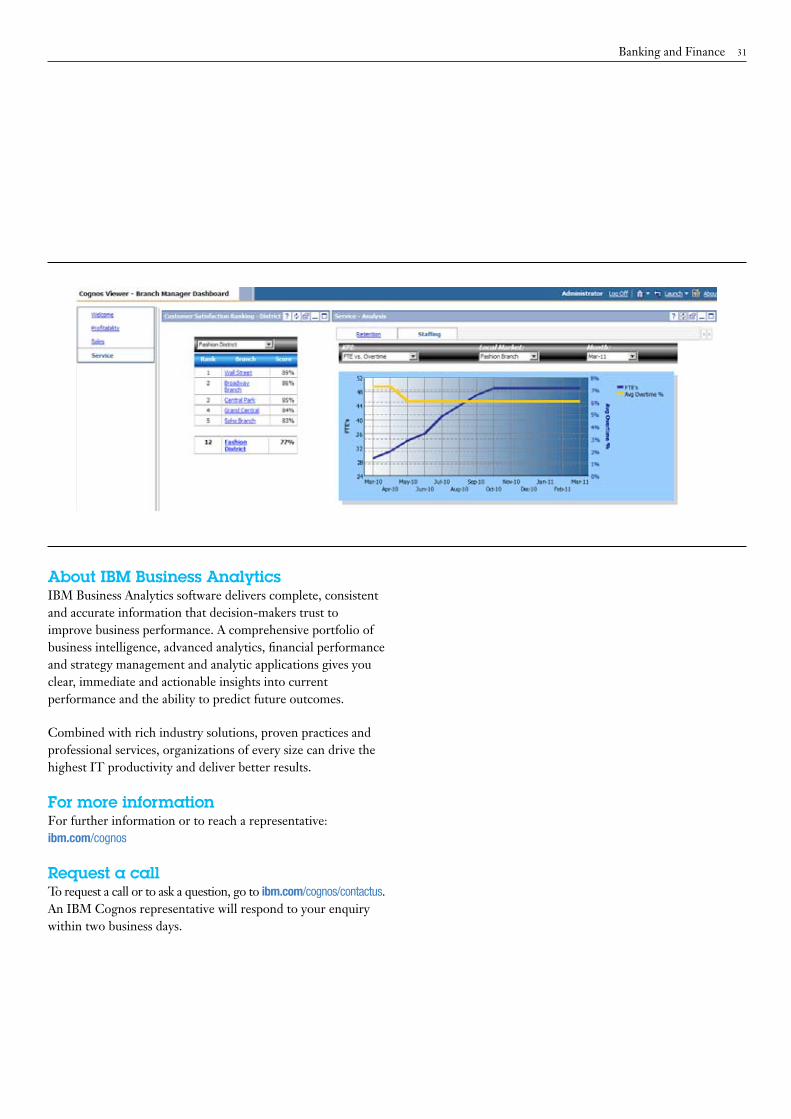
Service The Service page follows the design of Profitability and Sales; however, managers can drill through the rankings report, which launches a detailed breakdown of the customer satisfaction survey results.
Also, the Service page has a staffing graph that attempts to detect any correlations between FTE and Overtime or FTE and Revenue over the past 12 months.
!
Banking and Finance 31
About IBM Business Analytics IBM Business Analytics software delivers complete, consistent and accurate information that decision-makers trust to improve business performance. A comprehensive portfolio of business intelligence, advanced analytics, financial performance and strategy management and analytic applications gives you clear, immediate and actionable insights into current performance and the ability to predict future outcomes.
Combined with rich industry solutions, proven practices and professional services, organizations of every size can drive the highest IT productivity and deliver better results.
For more informationFor further information or to reach a representative: ibm.com/cognos
Request a callTo request a call or to ask a question, go to ibm.com/cognos/contactus. An IBM Cognos representative will respond to your enquiry within two business days.
!
Please Recycle
© Copyright IBM Corporation 2010
IBM Canada Ltd. 3755 Riverside Drive Ottawa ON K1G 4K9 Canada
Produced in Canada April 2010 All Rights Reserved
IBM, the IBM logo and ibm.com are trademarks or registered trademarks of International Business Machines Corporation in the United States, other countries, or both. If these and other IBM trademarked terms are marked on their first occurrence in this information with a trademark symbol (® or ™), these symbols indicate U.S. registered or common law trademarks owned by IBM at the time this information was published. Such trademarks may also be registered or common law trademarks in other countries. A current list of IBM trademarks is available on the Web at “Copyright and trademark information” at ibm.com/legal/copytrade.shtml Other company, product and service names may be trademarks or service marks of others.
References in this publication to IBM products and services do not imply that IBM intends to make them available in all countries in which IBM operates.
P24524
YTB-03008-CAEN


![E-Microsoft Alliance Survivable Branch Communication Zl Module Solution Brief Mar 10 WW Eng Ltr[1]](https://static.fdocuments.us/doc/165x107/577d2f8f1a28ab4e1eb20e02/e-microsoft-alliance-survivable-branch-communication-zl-module-solution-brief.jpg)