Brain Gain: Claims about Its Size and Impact on Welfare ...repec.iza.org/dp1599.pdf · Brain Gain:...
38
IZA DP No. 1599 Brain Gain: Claims about Its Size and Impact on Welfare and Growth Are Greatly Exaggerated Maurice Schiff DISCUSSION PAPER SERIES Forschungsinstitut zur Zukunft der Arbeit Institute for the Study of Labor May 2005
Transcript of Brain Gain: Claims about Its Size and Impact on Welfare ...repec.iza.org/dp1599.pdf · Brain Gain:...

IZA DP No. 1599
Brain Gain: Claims about Its Size and Impact onWelfare and Growth Are Greatly Exaggerated
Maurice Schiff
DI
SC
US
SI
ON
P
AP
ER
S
ER
IE
S
Forschungsinstitut
zur Zukunft der Arbeit
Institute for the Study
of Labor
May 2005

Brain Gain: Claims about Its Size and
Impact on Welfare and Growth Are Greatly Exaggerated
Maurice Schiff World Bank and IZA Bonn
Discussion Paper No. 1599 May 2005
IZA
P.O. Box 7240 53072 Bonn
Germany
Phone: +49-228-3894-0 Fax: +49-228-3894-180
Email: [email protected]
Any opinions expressed here are those of the author(s) and not those of the institute. Research disseminated by IZA may include views on policy, but the institute itself takes no institutional policy positions. The Institute for the Study of Labor (IZA) in Bonn is a local and virtual international research center and a place of communication between science, politics and business. IZA is an independent nonprofit company supported by Deutsche Post World Net. The center is associated with the University of Bonn and offers a stimulating research environment through its research networks, research support, and visitors and doctoral programs. IZA engages in (i) original and internationally competitive research in all fields of labor economics, (ii) development of policy concepts, and (iii) dissemination of research results and concepts to the interested public. IZA Discussion Papers often represent preliminary work and are circulated to encourage discussion. Citation of such a paper should account for its provisional character. A revised version may be available directly from the author.
IZA Discussion Paper No. 1599 May 2005
ABSTRACT
Brain Gain: Claims about Its Size and Impact on Welfare and Growth Are Greatly Exaggerated∗
Based on static partial equilibrium analysis, the “new brain drain” literature argues that, by raising the return to education, a brain drain generates a brain gain that is, under certain conditions, larger than the brain drain itself, and that such a net brain gain results in an increase in welfare and growth due to education’s positive externalities. This paper, on the other hand, argues that these claims are exaggerated. In the static case, and based on both partial and general equilibrium considerations, the paper shows that i) the size of the brain gain is smaller than suggested in that literature; ii) the impact on welfare and growth is smaller as well (for any brain gain size); iii) a positive brain gain is likely to result in a smaller human capital gain and may even have a negative impact on the stock of human capital; iv) an increase in the stock of human capital may have a negative impact on welfare and growth; and v) in a dynamic framework, the paper shows that the brain drain is unambiguously larger than the brain gain, i.e., that the steady state is characterized by a net brain loss. JEL Classification: D61, D62, F22, H20, H41, I12, J61 Keywords: brain gain size, welfare, growth, exaggerated claims Corresponding author: Maurice Schiff Development Research Group The World Bank Mailstop No. MC3-303 1818 H. St. NW Washington DC 20433 USA Email: [email protected]
∗ An early version of the paper was presented at the Royal Economic Society (RES) Meetings, March 21 -23, 2005. The paper was revised in April 2005 during my stay at ECLAC (CEPAL) as Visiting Scholar, and I’d like to thank José Luis Machinea and Andrés Solimano for their kind invitation. Thanks are also due to| Mohammad Amin, Frédéric Docquier, Maurice Kugler, Caglar Ozden, Pierre Pestieau, Hillel Rapoport, and participants at the RES session on “The New Economics of the Brain Drain: View and Counterview” for useful comments, to Vlad Manole for able research assistance, and to Maria L. Kasilag for excellent logistical support. The paper represents the author’s view and not necessarily those of the World Bank, its Executive Directors or the governments they represent.

Table of Contents 1. Introduction 1.1. Main findings 2. Smaller Brain Gain: Partial Equilibrium
2.1. Dynamic Implications of Endogenous Migration Probability 2.1.1. Who Determines the Brain Drain?
2.1.2. Migration Probability and Evolution of the Brain Drain and Brain Gain
2.1.3. An Unambiguous Net Brain Loss in the Steady State 2.2. Heterogeneity
2.2.1. Individual Heterogeneity 2.2.1.1. Transition Dynamics and Steady State 2.2.2. Group Heterogeneity
2.3. Unskilled Migration 2.4. Brain Waste 2.5. Uncertainty
3. Smaller Brain Gain: General Equilibrium 3.1. Public Expenditures and Tax Revenues
3.2. Brain Gain with Smaller or Negative Human Capital Gain
4. Negative Brain Gain 5. Smaller Impact on Welfare and Growth 5.1. Brain Gain Size 5.2. General Equilibrium Effects 5.3. Empirical Results 6. Conclusion
1
Brain Gain: Claims about Its Size and Impact on Welfare and Growth Are Greatly Exaggerated
1. Introduction
The traditional brain drain literature has viewed the exodus of human capital as
something of a curse for developing countries,1 and has considered policies to counter it
or reduce its negative impact on the emigration countries, including the taxation of
migrants’ income abroad (Bhagwati 1976, Bhagwati and Hamada 1976, Bhagwati and
Wilson 1989).2 That literature has viewed the benefits of the brain drain as including
increased trade, remittances, knowledge, capital flows--including FDI (partly attributed to
a “Diaspora” effect (Lucas 2005)), and the skills acquired by return migrants in the
destination country.3
A benefit not considered in the traditional brain drain literature is the brain-drain-
induced ‘brain gain,’ a central feature of the ‘new brain drain’ literature. Since a brain
drain implies that a share of skilled individuals will migrate and earn a higher wage
abroad, the new brain drain literature posits that:
i) the brain drain raises the expected return on education;
ii) this induces additional investment in education (a brain gain);
iii) conditions exist under which the brain gain dominates the brain drain (a
net brain gain); and
iv) a net brain gain raises welfare and growth.
1 This remains the view of the majority of analysts working on this issue (e.g., see Solimano 2001). 2 On a nationalist view of the brain drain in this literature, see Patinkin (1968). On an internationalist view, see Johnson (1968) and Bhagwati and Wilson (1989). 3 A recent contribution is Javorcik, Ozden and Spatareanu (2004). They show that a larger stock of immigrants from a given source country to the US results in greater US outward FDI to that country, with the effect essentially due to skilled immigrants.

2
These results are said to hold independently of other potential effects of the brain
drain on the level of education, whether through remittances or through the skills return
migrants might have acquired in the destination countries.
Seminal papers in the new brain drain literature include Mountford (1997), Stark
et al. (1997, 1998), Stark and Wang (2002), Stark (2004), Stark et al. (2004), Beine et al.
(2001, 2003), Docquier and Rapoport (2004), and Vidal (1998).4 Their work has led to a
reconsideration of the impact of the brain drain on the number of skilled individuals and
on economic welfare and growth in the source country.
Most studies in that literature are theoretical, though empirical results are slowly
emerging thanks to the work of Carrington and Detragiache (1998, 1999) and Docquier
and Marfouk (2004).5 6 These studies have estimated the stock of skilled migrants from
developing countries who are living in OECD countries. 7
The number of skilled migrants--and their share in total migration--has risen
dramatically in recent decades. Docquier and Hillel (2004) report that the number of
migrants residing in OECD countries increased by 50% between 1990 and 2000, with the
increase of skilled migrants 2.5 times that of unskilled ones (70% versus 28%).
A case in point is the flight of human capital in the health sector, with the more
extreme cases of emigration taking place in Sub-Saharan Africa and the Caribbean. For
instance, Grenada (Jamaica) has had to train twenty two (five) doctors in order to retain
4 Commander, Kangasniemi and Winters (2004) provide a survey of the brain drain literature. 5 Regional differences in the brain drain are examined in Docquier et al. (2005). 6 Adams (2003) used the same assumptions as Carrington and Detragiache and provides brain drain estimates for 24 countries in 2000. 7 Carrington and Detragiache used the 1990 US census data to estimate the brain drain for a number of developing countries in 1990. Docquier and Marfouk (2004) improved the measurement of the brain drain by expanding data sources to all OECD countries, estimating the brain drain for a larger number of developing countries, and doing so for the year 2000 as well as for 1990.

3
one (Stalker, 1994). This implies a brain drain of 95.5% for Grenada and 80% for
Jamaica. The large exodus of other healthcare providers is similarly worrisome.
The necessity to assess the validity of the claims of the new brain drain literature
has increased with the growing flight of skilled workers from developing countries, and
with the related skilled immigration programs recently put in place by a number of
destination countries. This paper provides such an assessment, based on a more detailed
analysis of the relationship between the brain drain and brain gain.
The remainder of the paper is organized as follows. Based on partial equilibrium
analysis, Section 2 shows why the brain gain is likely to be smaller than appears from the
new brain drain literature. Section 3 does so from a general equilibrium viewpoint. The
latter has so far not been incorporated in the new brain drain literature, despite the fact
that it is central to the analysis of the size of the brain gain and of the impact on welfare
and growth. Section 4 considers destination country policies that may result in a negative
brain gain, Section 5 examines the impact of the brain gain on welfare and growth, and
Section 6 concludes.
Section 2 also provides a dynamic analysis of the new brain drain literature’s
claim regarding the net brain gain. Specifically, Section 2.1.3 examines whether the claim
holds in the steady state.
1.1. Main Findings
This paper examines some of the assumptions underlying the theoretical and
empirical findings in the new brain drain literature. It finds that the impact of the brain
drain on welfare and growth is likely to be significantly smaller, and the likelihood of a

4
negative impact on welfare and growth significantly greater, than reported in that
literature. These findings are due to the fact that the brain gain is smaller than has been
obtained in the literature and because various negative effects of the brain gain on human
capital, welfare and growth have not been taken into account. These results are based on
both partial and general equilibrium analysis.
Last but certainly not least, an analysis of the dynamics of the brain drain and
brain gain shows that the steady state is characterized by a brain gain that is smaller than
the brain drain, i.e., by a net brain loss, irrespective of whether the transition path is
characterized by a net brain gain or net brain loss. This result holds despite the fact that
the analysis is based on the same assumptions about the brain gain as those prevailing in
the new brain drain literature. These assumptions are very optimistic because they do not
include the impact of a variety of partial and general equilibrium effects, all of which
result in a smaller brain gain.
Contributors to the early brain drain literature viewed the brain drain as entailing
a loss for the developing source countries. An implication of the arguments presented in
this paper is that their views were probably close to the mark.
2. Smaller Brain Gain: Partial Equilibrium
Sections 2 and 3 argue that the brain gain is smaller than is claimed by the new
brain drain literature. This section presents arguments based on static and dynamic partial
equilibrium analysis. General equilibrium considerations are examined in Section 3.
Before turning to these arguments, it seems useful to provide a simple graphical
representation of the central issue examined in this paper. It reflects a static partial

5
equilibrium view of the issue. Figure 1 shows the brain drain (BD), the brain gain (BG)
and the net brain gain (NBG = BG – BD), as functions of the skilled migration probability
p (i.e., the share of the brain drain in the skilled labor force). The brain drain BD is drawn
as a 45-degree line rising from zero at p = 0 to the entire skilled labor force at p = 1. The
brain gain BG = 0 for p = 0 and p = 1, and positive for 0 < p < 1.
Figure 1 presents two alternative brain gain curves, BG = BG1 and BG = BG2. In
the case of BG1--the type of brain gain assumed in the new brain drain literature, the net
brain gain NBG1 is positive for p < p1 and negative for p > p1. Thus, a brain drain would
result in a net increase in education for low migration probabilities (for a small brain
drain relative to the skilled labor force).
This paper argues that the actual brain gain is closer to BG2 than to BG1 (or is
actually equal to BG2) with a negative net brain gain (NBG2 < 0) or a net brain loss for
any p > 0. Note also that NBG is negative for large values of p, irrespective of whether
BG is equal to BG1 or BG2. This is one result on which the new brain drain literature and
this paper agree.
2.1. Dynamic Implications of Endogenous Migration Probability
Two assumptions prevalent in the new brain drain literature seem questionable,
namely that the source country determines the migration probability (i.e., the share of
migrants in the skilled population) and that this probability is exogenous. The second one
has fundamental effects on the dynamics of the brain drain and brain gain. Section 2.1.3
shows that a net brain loss must hold in the steady state, i.e., it must be the case that the
brain drain is greater than the brain drain.

6
2.1.1. Who Determines the Brain Drain?
The first assumption relates to the source country’s ability to determine the
probability or rate of migration. This assumption is found in most studies in the new brain
drain literature. For instance, Stark and Wang (2002) examine the role of a migration
policy implemented by source country governments.
In fact, though trade and capital flows have been greatly liberalized, destination
countries continue to impose strict barriers on immigration. Exceptions include a few
repressive regimes—e.g., Cuba, Myanmar and North Korea--that deny their citizens the
right to migrate. The number of such regimes has greatly diminished in recent years,
mainly due to the collapse of the Soviet bloc.
Thus, except for a few countries, migration controls are firmly in the hands of
destination countries’ authorities. This is particularly true for the more skilled migrants
who have less to gain by migrating illegally.
2.1.2. Migration Probability and Evolution of the Brain Drain and Brain Gain
The second assumption in the new brain drain literature is that the probability of
migration is exogenously given and is unaffected by individuals’ education decisions.
However, I am not aware of any destination country immigration policy that stipulates
that a specific percentage of a source country’s skilled individuals is allowed entry.
Rather, destination countries tend to use numerical quotas in order to restrict entry. In that
case, the migration probability is endogenous, and its value depends on the size S of the
skilled population. These quotas are (almost) always filled. Denote the quota by BD (the
brain drain).
7
The models in this literature typically start from a situation of zero migration and
compare it with that of positive migration. The starting migration probability p0 = BD/S0,
where BD is the destination-country-determined brain drain (i.e., the quota of skilled
immigrants) and S0 is the skilled population in period t = 0, before migration takes place.
The new destination-country migration policy is announced at t = 0.
The new brain drain literature’s models take the migration probability p as a
constant that is determined exogenously. If so, those who are considering at t = 0 whether
to acquire additional education take the migration probability at t = 1 (when they
graduate) as being the one they observe at the time t = 0 when they must make the
decision. That probability is p0. In other words, 01 ppe = , where ep1 is the probability
assumed to prevail at t = 1.8 The fact that 01 ppe = = BD/S0 is now positive raises the
expected return on education and results in a brain gain BG1 (where BD is the brain drain
(a flow), BG is the brain gain (a flow), and S0 is the skilled population at t = 0 (a stock).
Thus, BG1 is a function of 01 ppe = , i.e., BG1 = BG(p0). More generally:
),( 1−= tt pBGBG 0'',0' <> BGBG . (1)
8 The model where such expectations are used is known as the cobweb model. The assumption of such expectations is certainly more plausible for the brain gain than for crop prices, the case for which the cobweb model was originally developed. One reason is that the assessment about the probability of migration is made by different individuals every period and they do so only once, while the same farmers and traders operate over many periods and therefore have a better understanding of the markets in which they operate. A second reason is the availability of information. Information on commodity prices (spot and futures) is available on a continuous basis through various electronic media outlets, which is certainly not the case for the future migration probability. Consequently, learning about the latter is much harder than for agricultural prices and is thus less likely, making the assumed expectations formation rule quite plausible. Note that the same expectations rule obtains in the case of uncertainty (e.g., if there is a random disturbance term in equation (1)) in various rational expectations equilibrium models, resulting in what is known as a ‘random walk’, where pt+1 = pt + e t, and e t is a ‘white noise’ error term, so that Et (pt+1) = pt. Note that in this case, the expectations solution is the result of individuals exploiting all the available information rather than due to ignorance of the market.

8
Note that a number of individuals were acquiring education before migration
became an option, i.e., when the expected return to education was lower than under
migration. Denote the number of these individuals by E. With migration, the benefit of
education increases, and new individuals decide to acquire education (the brain gain), and
those individuals who acquired education in the absence of migration continue to do so
under migration. In other words, E is constant. Then, S1 = S0 + 1S∆ = S0 + (E + BG1 –
BD). More generally:
St = St-1 + tS∆ = St-1 + (E + BGt – BD) = ∑ =−++
t
i i BDBGES10 )( . (2)
The only variable that might vary over time is the brain gain BG. Note that if E >
BD, the skilled population rises over time (irrespective of the size--or existence--of the
brain gain), a situation that is not considered to be a brain drain problem. In order for a
brain drain problem to prevail, E must be smaller than BD (Lowell, 2003, provides
conditions for a brain drain, one of which is E < BD). This is assumed in the analysis
below.
2.1.3. An Unambiguous Net Brain Loss in the Steady State
The initial stock of educated people is S0. The increase in the stock between
periods 0 and 1 is 1S∆ = E + BG1 – BD, which is either positive or negative. Assume that
in the first transition path, E + BG1 – BD > 0 (with an ambiguous sign for the net brain
gain NBG = BG - BD). In that case, the number of skilled people increases to S1 > S0 and
the migration probability decreases to p1 = BD/S1 < p0 = BD/S0. From equation (1), BG2 <
BG1 and 2S∆ < 1S∆ . Over time, the stock St increases at a decreasing rate until period j
where jS∆ = 0, with a steady-state stock St = SP for all t ≥ j.

9
In the second transition path, 1S∆ = E + BG1 – BD < 0 (with the net brain gain
NBG = BG1 - BD < - E < 0). Then, S1 < S0, BG2 > BG1, 12 SS ∆<∆ , and St falls at a
decreasing rate. This process continues until period k where kS∆ = 0. The steady-state
stock is St = SN for all t ≥ k.
The first (second) transition path results in a steady-state stock SP (SN) that is
larger (smaller) than the initial stock, i.e., SP > S0 > SN. Though the steady-state stock
depends on the transition path, the change in stocks in the steady state does not, and
neither does the relationship between the brain drain and the brain gain. In the steady
state, we have:
jS∆ = kS∆ = E + BG – BD = 0, (3)
where BG is the value of BGt that solves equation (3).
Consequently, the net brain gain NBG ≡ BG – BD = – E < 0 in the steady state,
irrespective of the transition path. Thus, the brain gain can never compensate for the brain
drain in the steady state. The result also implies that a country that starts with a higher
initial level of education E (before migration takes place) will experience a larger net
brain loss NBL = E in steady state.
The result holds under other expectation formation rules as well, including perfect
foresight and rational expectations (see latter part of footnote 8), and adaptive
expectations.9 The new brain drain literature claims that a brain drain results in a net
brain gain under certain conditions. The steady-state result provides a powerful challenge
to this claim because no specific conditions are imposed for the result to hold.
9 Convergence to the steady state is faster under perfect foresight and rational expectations, and is slower under adaptive expectations.

10
Note that the steady state may never be reached. For instance, assuming that those
who obtain an education in the absence of migration have a greater ability than those who
obtain an education after migration is allowed (i.e., after the incentives to do so have
increased), and that the destination country possesses a perfect screening process and
only gives access to those with the higher ability level, it follows that there is no more
benefit in acquiring an education for the lower-ability group than in the absence of
migration. Thus, there is no brain gain and the change in the skilled population is E – BD,
which—as discussed earlier—is negative, implying that the skilled population falls
continuously.
The results obtained in this section are based on an optimistic assumption about
the size of the brain gain, an assumption shared by the new brain drain literature. As
examined below, there are additional reasons why the brain gain is smaller that suggested
in the new brain drain literature. Consequences for transitional dynamics and for the
steady state are also analyzed.
2.2. Heterogeneity
2.2.1. Individual Heterogeneity
Assume, for simplicity, that abilities are distributed uniformly and that an
individual’s ability affects the benefit of education but not its cost which is a constant C.
This is shown in Figure 2, which draws on Commander et al. (2004). Figure 2 also shows
three parallel lines declining from right to left, with the lower (higher) (middle) line
depicting the benefit of education obtained in the absence of migration (obtained in the

11
destination country) (expected, given the migration probability). The ability level also
declines from right to left. The education cost C is invariant with respect to ability.
In the absence of migration, the equilibrium is at A*. Under migration,
equilibrium is at A**, with a brain gain equal to (A** - A*). However, one cannot simply
compare (A** - A*) and (A* - AMAX) because of the different ability levels between the
two groups. Recalling that the distribution of abilities is uniform, individuals who
acquired education under no migration have an average ability level ANM = (A* + AMAX)/2,
which is greater than the average ability level AM = (A** + A*)/2 of those who acquired
education once migration became possible.
Thus, it would be incorrect to conclude that a net brain gain takes place when the
share of the brain gain (relative to the total number of educated individuals) S = (A** -
A*)/(A** - AMAX) is larger than the migration probability p since AM < ANM. This can be
seen with the help of Figure 2.
In the absence of migration, the source country benefits from the presence of its
most able individuals (those with abilities between AMAX and A*). Recall that the new
brain drain literature assumes that skilled migrants are selected randomly among all
skilled individuals. Thus, in the case of migration, a share p of migrants originates both in
the more able group (between AMAX and A*) and in the less able group (from A* to A**).
Consequently, the skilled individuals remaining in the source country consists of a
share (1 - p) of non-migrants from both the more able and the less able groups, with an
average ability of AMIG = (AMAX + A**)/2, compared to the higher average ability ANM =
(A* + AMAX)/2 of those who got educated in the absence of migration.
12
Thus, when S = p, i.e., when the number of skilled individuals in the source
country is the same irrespective of whether migration takes place or not, migration results
in a lower ability level in the source country by an amount equal to ANM - AMIG = (A* -
A**)/2 and thus in a lower effective human capital stock.
Thus, a brain drain results in a negative net effective brain gain or in a net
effective brain loss when the number of skilled individuals remains unchanged once
migration takes place, i.e., when S = p, and in a greater loss when S < p. A necessary but
not sufficient condition for a net effective brain gain is S > p.10
2.2.1.1. Transition Dynamics and Steady State
With heterogeneous abilities, the net effective brain gain (a flow) is smaller
relative to E—defined earlier as the number of individuals who acquired education in the
absence of migration and do so under migration (a flow)--compared to the uniform ability
case. Thus, if 1S∆ = E + BG1 – BD > 0 (< 0), convergence to the steady state will be
slower (faster). Moreover, in steady state, the condition E + BG – BD = 0 implies an even
greater net brain loss BD – BG. Accounting for screening would further reduce the
likelihood of a net effective brain gain. Its dynamic implications are examined at the end
of Section 2.1.3.11
10 In an interesting paper, Fan and Stark (2005) present a model where decision-making takes place in three stages or less, and which generates equilibrium unemployment of skilled workers. The model assumes heterogeneity with respect to educational ability. Given that ability in the job market tends to be positively related to educational ability, incorporating this feature changes a number of results. 11 As Winters (2005) states: “Screening is a critical dimension of the brain drain … because its existence tends to undermine the ‘beneficial brain drain’ argument of Mountford (1997) or Stark et al. (1997).” The extent to which the brain-drain-induced brain gain would be reduced would depend on the quality of the screening and its enforcement.

13
2.2.3. Group Heterogeneity
Heterogeneity may occur across groups rather than across individuals. This
situation is depicted in Figure 2 which shows three groups with different ability levels. In
the absence of migration, two groups acquire education and the lowest-ability group does
not. Once migration takes place, the expected return to education rises, though not
sufficiently for the low-ability group which does do not acquire education in this case
either. Thus, the brain drain does not result in a brain gain (A** = A*), and the source
country loses some of its most able individuals.12 Alternatively, if the low-ability group
acquires education, we obtain the same result as for individual heterogeneity (Section
2.2.1).
2.3. Unskilled Migration
Most analyses in the new brain drain literature examine the incentives to acquire
education in the absence of migration and compare them to the incentives prevailing in
the case of skilled worker migration. However, the reality is that out-migration of
unskilled workers is substantial in most source countries, and their expected wage is
higher under migration, just as is true for skilled workers.
Denote the migration probability of skilled (unskilled) labor by p (q), skilled
(unskilled) variables by subscript S (U), and destination country variables by *. In the
absence of migration (p = q = 0), the education benefit or skill premium is
12 Stark (…) includes two groups in his model where, as assumed here, low-ability individuals do not acquire education when migration takes place, though high-ability individuals invest more in education when incentives improve. The model presented here assumes, as in most papers dealing with the brain gain, that individuals can only acquire a fixed amount of education.

14
US WWB −=1 . (4)
With a brain drain (p > 0, q = 0), the expected benefit of education is
)()())1(( **2 SSUSUSS WWpWWWWppWB −+−=−−+= , (5)
i.e., 2B is equal to the domestic skill premium (as in equation (4)) plus the skilled labor
migration premium multiplied by the skilled labor migration probability p.
With migration by both skilled and unskilled labor (p, q > 0), the expected benefit
of education is
)()()())1(())1(( ****3 UUSSUSUUSS WWqWWpWWWqqWWppWB −−−+−=−+−−+= .
(6)
Thus, 3B is equal to the domestic skill premium plus the skilled labor migration
premium multiplied by the skilled labor migration probability p, minus the unskilled
labor migration premium multiplied by the unskilled labor migration probability q.
Equations (4) and (5) show that a brain drain raises the expected return to education by
the expected migration benefit
)( *12 SSS WWpBBB −=−≡∆ > 0. (7)
This implies a brain gain, a basic finding of the new brain drain literature.
Equations (5) and (6) show that when both skilled and unskilled labor can
migrate, the expected return to education falls compared to the case where only the
skilled can migrate, with the change equal to
0)( *23 <−−=−≡∆ UUU WWqBBB . (8)
Thus, the impact of a brain drain on the return to education is smaller under the
assumption that unskilled workers can migrate as well. This implies a smaller brain gain.

15
The steady-state outcome is unchanged. However, convergence to the steady state
is slower (faster) for 1S∆ = E + BG1 – BD > 0 (< 0).
2.4. Brain Waste
Foreign workers are often hired to do jobs for which they are overqualified.
Examples of Caribbean doctors or Eastern European scientists working as taxi drivers in
some large US city are well known. Similarly, Moroccan doctors in France are typically
working in less skilled positions (e.g., as interns) with significantly lower salaries.
Mattoo, Neagu and Ozden (2005) refer to this phenomenon as a “brain waste” in
their recent study of US immigration. They find that the extent of the brain waste—i.e.,
the difference in the skill content of a migrant’s job versus that of a native of the
destination country with similar education and experience—varies according to origin
country characteristics and US immigration policies.
Using the same notation as in Section 2.3 above, the expected benefit of education
4B under skilled migration and brain waste (BW) conditions is:
i) US WWB −=4 for SBW WW <* , (9a)
and
ii) )()())1(( **4 SBWUSUSBW WWpWWWWppWB −+−=−−+= for SBW WW >* . (9b)
In case (i), there is no brain drain or brain gain. In case (ii) where SBW WW >* and a
brain drain takes place, the difference in benefits without brain waste (B2 in equation (5))
and with brain waste (B4 in equation (9b)) is
0,0)( ***24 <∂∂<−=−≡∆ BWWWWpBBB BWSBWBW . (10)

16
That income loss reduces the impact of the brain drain on the benefit of education,
implying a smaller brain gain. As can be seen from equation (10), the income loss
depends on the extent of the brain waste and on the wage gap between skilled and ‘brain
waste’ jobs in the destination countries.
The steady-state outcome is unchanged. However, convergence to the steady state
is slower (faster) for 1S∆ = E + BG1 – BD > 0 (< 0).
2.5. Uncertainty
Risk aversion is likely to greatly reduce the brain-gain response to a brain drain.
The sources of uncertainty include the probability of success in school, the level of host
countries’ skilled wages, the level of the exchange rate and of skilled wages at home at
the time the studies are completed, host countries’ immigration policies, the probability
of obtaining a job abroad at that time, the allowed length of stay in the host country, the
value of the student’s time for the family during the entire period of studies. That value
rises when the family crop fails, its price falls, or a family member becomes ill, and it
may force some students to abandon their studies and lose their investment.
Assuming that the cost of education is C and risk aversion is represented by an
expected utility function EU. Then, due to the concavity of the utility function, we have:
>−−+− )])(1()([ * CWpCWpU SS )()1()( * CWUpCWpUEU SS −−+−= . (11)
In other words, and unsurprisingly, the expected utility of education’s benefit is
smaller than the utility of the expected benefit, implying a smaller brain gain.
Given that CWCWpCWp SSS −>−−+− ))(1()( * , we have under risk neutrality:
).()])(1()([ * CWUCWpCWpU SSS −>−−+− (12)

17
Equations (11) and (12) imply that under risk aversion:
))(1()( * CWpCWpUEU SS −−+−= > or < )( CWU S − , (13)
i.e., whether the expected utility from education with migration probability p is larger or
smaller than that from education and not migrating is ambiguous. If
))(1()( * CWpCWpUEU SS −−+−= < )( CWU S − , there will be no brain drain, no brain
gain, and no brain drain problem.
Consequently, once skilled migration is allowed by the destination country, risk
aversion results either in a smaller brain-drain induced brain gain, or in zero migration
and no brain gain.
In the former case, the steady-state outcome is unchanged and convergence to the
steady state is slower (faster) for 1S∆ = E + BG1 – BD > 0 (< 0). In the latter case, the
steady state is never reached and the number of skilled individuals falls continuously.
3. Smaller Brain Gain: General Equilibrium Effects
Additional resources for education means fewer resources for other activities. The
former is likely to include teachers, administrative personnel, books and other
educational tools, schools, student housing, and the students’ time. Education is typically
provided publicly and is heavily subsidized, though--as the costs listed above indicate--an
important part of the costs are borne by the students or their families, the main one being
the opportunity cost of the students’ time.
In the case of tertiary education, a report by the World Bank (2000) states that
“with developing country systems heavily dominated by public universities that tend to
have low tuition fees, the costs fall predominantly on the state.” The report estimates

18
these costs relative to GNP for 1995, and finds that the worldwide average amounts to
77% of GNP per capital.
Lucas (2004) updated the figures for the year 2000 and, based on both sources,
finds that 24 out of 90 countries had higher costs than the world average (Table 4.7). For
Sub-Saharan countries, the cost relative to GNP was over 500% of the world average.
Implications for the brain gain and human capital are examined below.
3.1. Public Expenditures and Tax Revenues Assuming that education is provided publicly,13 an increase in education will
require additional funds. Moreover, time spent acquiring additional education means less
work and lower tax revenues. Fiscally responsible authorities can respond to this situation
by i) a tax increase, ii) a reduction in educational subsidies, or iii) a reduction in other
public expenditures. 14
A reduction in disposable income associated with the tax increase will reduce the
demand for education and result in a smaller brain gain.15 Similarly, a reduction in
educational subsidies will raise the cost of education and will also result in a smaller
brain gain.
Implications for transition dynamics and for the steady state, these are the same as
in Section 2.3 and 2.4.
The third option entails a reduction in non-educational public expenditures. To
check the likelihood of substitution between the two categories of public expenditures, I
13 The results hold under privately provided education as well. 14 Note that if fiscal considerations were unimportant, it would very likely imply a weak education response to a brain drain and a net brain loss. 15 Of course, a smaller brain gain implies a smaller tax increase, which simply means that the equilibrium tax rate and brain gain must be solved simultaneously.

19
estimated a relationship between public education expenditures (log E) and other capital
expenditures (log K), both measured as a share of GDP. The sample covered over 70
developing countries, with an average of 7 observations per country and a total of over
600.
A negative and significant relationship between log K and log E was obtained
with a coefficient of -.47, significant at the 1% level. The coefficient indicates that a one
percent increase in the share of GDP devoted to education results in close to a half
percent reduction in the share of other capital expenditures.16
This is unlikely to affect the extent of the brain gain, though it might affect
welfare and growth (see Section 5.2) as well as the extent of the human capital gain. The
latter is examined below.
3.2. A Brain Gain that Results in a Smaller Human Capital Gain
As shown in the previous section, an increase in public education expenditures is
associated with a reduction in other public expenditures. Among those that might be
curtailed are investments in the country healthcare infrastructure, maintenance, and the
provision of healthcare services. This would have an adverse impact on the population’s
health status, and more so for poorer families that have little or no access to private
healthcare.
Moreover, because individuals who are studying do not contribute to family
income, expenditures will have to be reduced, especially in poorer families. If
16 Interestingly, Beine et al. (2003)’s model includes a variable representing physical capital, R&D expenditures and infrastructures. Its impact on growth in their regressions is significantly greater than that of the brain drain. Thus, it would seem plausible that a reduction in that variable, associated with an increase in the investment in education, would have a large impact on welfare and growth.

20
expenditures on healthcare are reduced, household health is likely to be adversely
affected. And if food expenditures are reduced, the nutrition and health status of the
family is likely to suffer as well.
Furthermore, purchases of household appliances may have to be postponed, and
may cause additional harmful effects. For instance, postponing the purchase of a
refrigerator might not necessarily affect nutrient intake but it would most likely have
adverse effects on nutritional status and health (Schiff and Valdés 1990a, 1990b).17 In his
AEA Presidential address entitled “Investment in Human Capital,” Schultz (1961, p. 5)
notes that, when adults have such a meager diet that they cannot work more than a few
hours a day, food should be treated partly as a productive input that raises the level of
human capital.
Since human capital depends on education as well as on health (Schultz, 1961,
p.3), the impact of the brain drain on human capital is likely to be smaller than its impact
on the brain gain. An educated workforce that is unable to work on a regular basis
because of illness is unlikely to be very productive. In fact, reduced spending on health
by individual families and the public sector might have devastating effects on the
populations’ health status and might lower the stock of human capital. Thus, a negative
human capital gain might obtain, even though the brain gain would probably be positive.
Dynamic implications are the same as in Sections 2.3 and 2.4.
17 In the face of high food income elasticity estimates at low incomes and the implication that the poor suffered from malnutrition, the nutrition literature argued that what mattered is not food but nutrient intake and showed a low income elasticity for a variety of nutrients (calories, proteins, etc.) because, starting at low incomes, food expenditures shift from nutrient to non-nutrient attributes as income increases (due to greater demand for variety, ease of preparation and taste), with the implication that the poor do not suffer from malnutrition. Schiff and Valdés (1990a, 1990b) contributed to that literature by arguing that what matters is not nutrient intake but nutritional status, which depends on various household and community variables as well as on nutrients. Since investments in the former clearly depend on income (e.g., refrigerators and clean water), nutritional status is likely to be quite elastic with respect to income (and thus be worse for poor people), even if nutrient intake is not.

21
4. Negative Brain Gain
Assume that below a critical level of education 0E , some destination countries
only hire unskilled workers, irrespective of their qualifications, and attracts both
unskilled and skilled migrants (with E < 0E ) because USU WWW >>* . This should reduce
the incentive to acquire education in source countries, and result in a negative brain gain.
The expected wage rate for unskilled labor is UUU WppWWE )1()( * −+= and that
for skilled labor is SUS WppWWE )1()( * −+= . The return to education in that case is
USUS WWWWp −<−− ))(1( , the return to education in the absence of migration. In other
words, the migration option lowers the return to education, resulting in a negative net
brain drain NBG or net brain loss. In other words, some who might have obtained
additional education in the absence of migration but who have decided to migrate might
choose to work before migrating (possibly to save for the expensive trip).
McKenzie and Rapoport (2005) found evidence of such an effect in the case of
rural Mexico. They found that migration led to a decrease in education inequality, and
that this decrease was due to a reduction in the educational level of those at the upper end
of the distribution rather than an increase at the bottom of the distribution.18 19
This type of outcome might also prevail under less extreme forms of “brain
waste.” For instance, with the high demand for Filipino nurses, some medical doctors
18 They also find that migration raises income inequality in the short term as only the better-off individuals are able to pay for migration costs, and reduces it over time as networks and information expand, resulting in lower migration costs and enabling poorer individuals to migrate. Taylor (1991) examined the impact of remittances on asset and income inequality and obtained similar results. 19 Note that for rural Mexico, a high level of education may not be much more than six years of schooling, while a low level of education is probably two years or less.

22
have gone back to school in order to become nurses, and some students have changed
their plans of becoming medical doctors and have chosen to become nurses.
5. Brain Gain , Welfare and Growth
5.1. Brain Gain Size
The previous section provided a number of static and dynamic arguments based
on both partial and general equilibrium analytical frameworks supporting the assertion of
a significantly smaller brain gain and, by implication, a significantly smaller (and
possibly negative) net brain gain than would appear from the literature. The obvious
implication is that the impact on welfare and growth would also be significantly smaller.
5.2. General Equilibrium Effects
Romer’s (1986) seminal paper on endogenous growth posited that, due to positive
externalities, returns to physical capital were increasing, and that policies affecting the
stock of physical capital could permanently change the economy’s growth rate. Lucas
(1988) also provided a model of endogenous growth but emphasized the role human
capital. I assume in this section that both human and physical capital affect the
economy’s growth rate through contemporaneous externalities, intergenerational
externalities (a la Beine et al., 2003), or both.
Section 3.1 listed three ways to deal with the higher public expenditures and
lower tax revenues associated with a brain gain, namely higher taxes, lower education
subsidies, or a reduction in other public expenditures. The first two lower the demand for
education. The third one either lowers the level of human capital if, say, healthcare

23
expenditures are reduced, or lowers other public expenditures that most likely generate
positive externalities.
The new brain drain literature assumes that education is the only sector that
generates positive externalities. In fact, positive externalities are also generated by a
number of other public (and private) sector activities as well. These activities include
healthcare provision, investment in R&D, and the provision of many other public goods
where benefits for from the presence of very large externalities and the temptation to free
ride explains why these are provided publicly rather than privately.
In such a case, a government would maximize welfare through a tax and
expenditure policy that results in the equalization of the per-currency-unit social marginal
present value across all activities, whether private or public, consumption or investment,
and pecuniary or not. Internalizing all the externalities associated with education, without
taking into account the reduction in other expenditures and the consequent loss of other
positive externalities, reduces the welfare gains and growth increase of the brain gain and
may result in a welfare loss, and similarly for the growth rate.
The full effect of an increase in the brain drain would have to include the loss due
to the brain drain itself. In other words, there are now two negative effects (the brain
drain and the reduction in other expenditures) and a positive one (the brain gain). Thus,
the likelihood of a beneficial brain drain seems much diminished.
5.3. Empirical Results
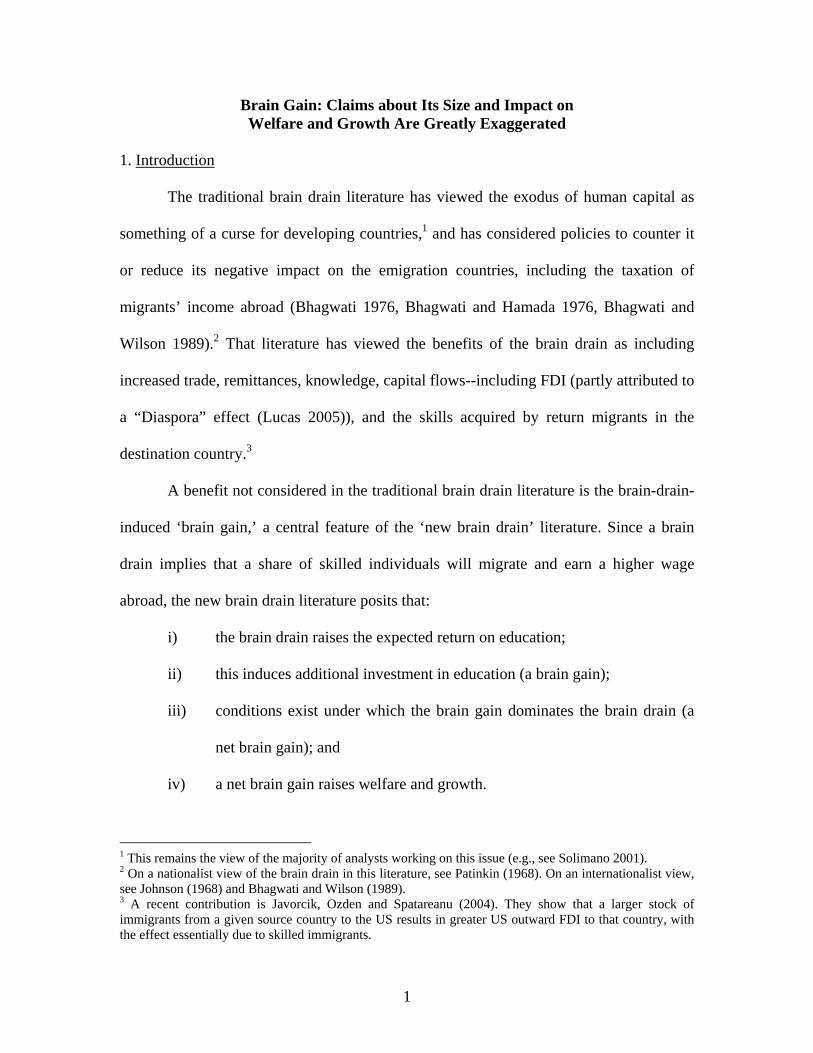
This paper has argued that the net brain gain NBG is closer to NBG2 (see Figure 1)
than to NBG1. In fact, NBG1 is quite similar to the function shown in Figure 6 in

24
Docquier and Rapoport (2004). It is reproduced here as Figure 4, with the vertical axis
measuring the effect on the annual growth rate rather than the effect on NBG. Despite the
fact that Figure 4 depicts an estimated relationship while Figure 3 does not, they tell a
similar story, namely that a beneficial brain drain is more likely at low migration rates.
As Beine et al. (2003, p.35) state: “ … most countries combining low levels of human
capital and low emigration rates of their highly-educated are positively affected by the
brain drain.”
On the other hand, and as shown in Figures 1 and 4, high migration rates (larger
than p2) inevitably result in a lower rate of growth. Consequently, countries in Sub-
Saharan Africa and the Caribbean (and possibly others) that are suffering form massive
outflows of medical personnel and other skilled workers cannot hope for much help from
the brain gain effect, irrespective of whether NBG = NBG1 or NBG = NBG2. 20
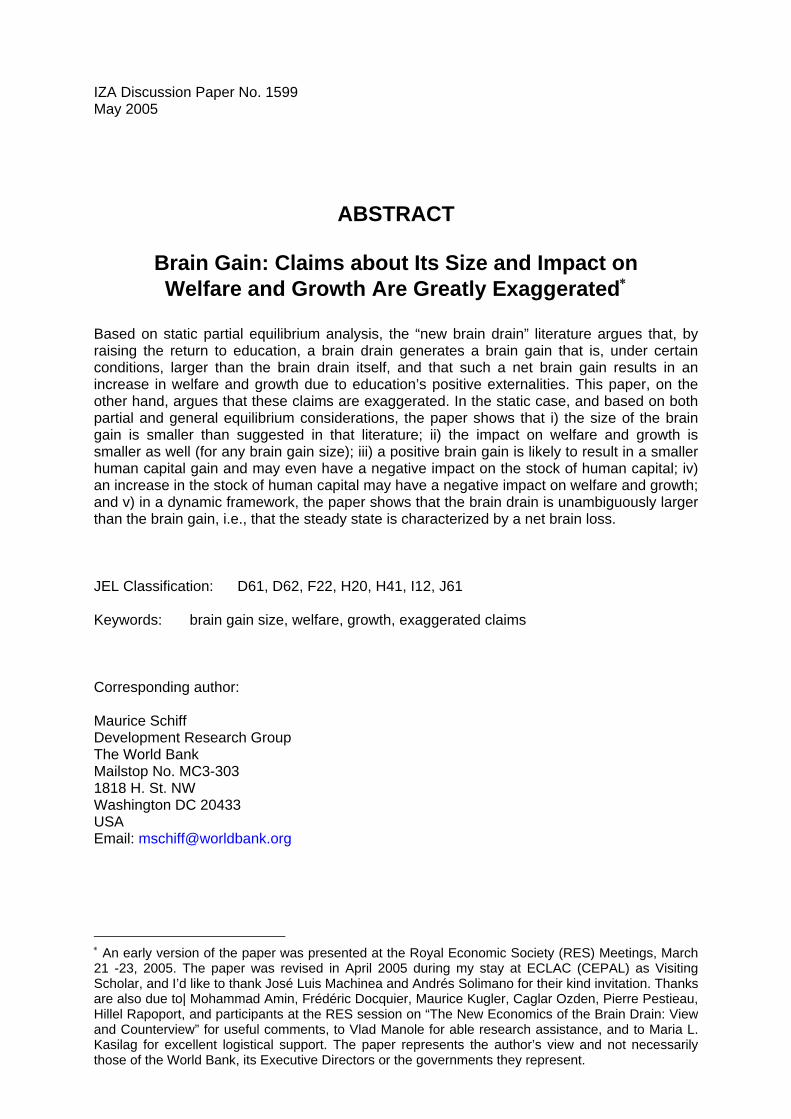
Three studies have examined the impact of the brain drain on education levels or
growth. As mentioned above, Beine et al. (2003) obtain a beneficial brain drain for
countries with low levels of human capital and skilled migration rates. On the other hand,
Faini (2005) finds little indication of a positive impact of the brain drain on growth in
source countries, while Lucas (2005)—using two alternative definitions for the education
variable—obtains a negative impact of the brain drain on education (see Table 1).
Thus, we have three empirical studies with three different sets of results with
respect to the impact of the brain drain: a positive impact on the level of education (Beine
et al.), a negative impact on the level of education (Lucas) and no impact on growth
(Faini). However, the results obtained from these analyses should be considered as being
20 Recall that Grenada (Jamaica) experienced a 95.5% (80%) brain drain in the case of doctors, with similar problems in sub-Saharan Africa and Central America.

25
preliminary, and additional conceptual and empirical work is needed before firm
conclusions can be reached.
6. Concluding Comments
Based on static analysis, this paper has shown that the size of the brain gain and
its impact on welfare and growth are significantly smaller that found in the new brain
drain literature and may even be negative. The main reasons for the smaller brain gain
size are:
i) heterogeneity ;
ii) unskilled migration;
iii) uncertainty;
iv) brain waste; and
v) general equilibrium effects.
The main reasons for the smaller—and possibly negative—impact of the brain
gain on welfare and growth are:
i) the smaller (or negative) brain gain size, and
ii) general equilibrium considerations, namely the fact that an increase in
public education expenditures results in welfare and growth costs
associated with increased taxes, lower education subsidies or a reduction
in other expenditures, with a decrease in their positive externalities.

26
Dynamic aspects of the brain-drain-induced brain gain are also examined in this
paper. It is shown that the brain drain BD dominates the brain gain BG in steady state. In
other words, the steady state is characterized by a negative net brain gain or a net brain
loss, irrespective of whether the net brain gain is positive or negative in the transition.
The steady-state result provides a powerful challenge to the claim by the new
brain drain literature that a brain drain results in a net brain gain under certain conditions,
the reason being that no conditions are imposed for the steady-state result to hold. The
reason for this result is that:
i) in steady state, all variable are invariant over time, including the number of
educated individuals. This implies that the number of individuals E who obtained
education in the absence of migration plus the net brain gain NBG associated with
migration must be equal to zero. Thus, the net brain gain NBG = - E < 0. In other words,
the source country unambiguously suffers a net brain loss.
Contributors to the early brain drain literature viewed the brain drain as entailing
a loss for the developing source countries. An implication of the arguments presented in
this paper is that these contributors were close to the mark.
The new brain drain literature and this paper are in agreement on one point,
namely that the net brain gain is negative for larger migration probabilities and certainly
in the most severe brain drain cases. In other words, the new brain drain literature offers
no solution to the most severe brain drain problems. This includes the exodus of
healthcare providers from Sub-Sahara Africa--the world’s poorest region--and the
Caribbean.21
21 These regions have been hit by two simultaneous shocks: increased mortality from highly contagious and often deadly diseases, and the flight of healthcare providers to rich destination countries.

27
Consequently, policies to slow down or stop the exodus of skilled labor are
urgently needed. This issue is beyond the scope of this paper, though it might be worth
examining the possibility of i) host countries supporting (financially and with expertise)
education in source countries in the areas where they expect to need skilled labor in the
future, together with ii) instituting programs of temporary migration (possibly with
migrant circulation). This should enable both source and host countries to benefit.
References Adams, R. 2003. “International Migration, Remittances and the Brain Drain: A Study of
24 Labor-Exporting Countries.” Policy Research Working Paper No. 2972. World Bank. Beine, M., F. Docquier and H. Rapoport. 2001. “Brain Drain and Economic Growth:
Theory and Evidence.” Journal of Development Economics 64 (1): 275-89. ______, ______ and ______. 2003. “Brain Drain and LDC’s Growth: Winners and
Losers.” IZA Discussion Paper No. 819 (July). Bhagwati, J. 1976. “The international brain drain and taxation. A survey of the issues.” In
J. Bhagwati (ed.). The brain drain and taxation. Theory and empirical analysis. North Holland: Amsterdam.
______ and J.D. Wilson. 1989. Income Taxation and International Mobility. MIT Press:
Cambridge, Mass. Carrington, W.J. and E. Detragiache. 1998. “How Big is the Brain Drain?” IMF Working
Paper No. 98. Washington, D.C. ______ and ______. 1999. “How extensive is the brain drain?” Finance & Development
(June): 46-49. Commander, S., M. Kangasniemi and L. A. Winters. 2004. “The Brain Drain: Curse or
Boon? A Survey of the Literature.” In R.E. Baldwin and L. A. Winters (eds.) Challenges to Globalization. Analyzing the Economics. University of Chicago Press: Chicago and London.
Docquier, F. and H. Rapoport. 2004. “Skilled Migration: The Perspective of Developing
Countries.” World Bank Policy Research Working Paper No. 3382. World Bank (August). _____, O. Lohest and A. Marfouk. 2005. “Brain drain in developing regions (1990-
2000).” Mimeo. CADRE. University of Lille.

28
_____ and A. Marfouk. 2004. “International migration by educational attainment (1990-
2000). Release 1.1.” Mimeo. CADRE. University of Lille. - Early version published as Policy Research Working Paper 3381. World Bank. _____ and H. Rapoport. 2004. “Skilled Migration and Human Capital Formation in
Developing Countries – A Survey.” (December, Preliminary version). Fan, C. S.. and O. Stark. 2005. “Addition Through Depletion: The Brain Drain as
Catalyst of Human Capital Formation and Economic Betterment.” Mimeo. Univ. of Klagenfurt. Jasso G. and Rosenzweig M.R. 1995. “Do immigrants screened for skills do better than
family reunification immigrants?” International Migration Review 29 (1): 85-111. Javorcik, B. S., C. Ozden and M. Spatareanu. 2004 (Dec.) “Does South-North Brain
Drain Contribute to North-South FDI?” Mimeo. DECRG-Trade. World Bank. Kugler, M. and H. Rapoport. 2005. "Skilled Emigration, Business Networks and FDI
Inflows." Paper presented at the Royal Economic Society (March). Nottingham. Lopez, R. and M. Schiff. 1998. "Migration and the Skill Composition of the Labor: The
Impact of Trade Liberalization in LDCs." Canadian Journal of Economics 31 (2): 318-36. Lowell, B. L. 2003. “Skilled Migration Abroad or Human Capital Flight? Migration
Information Source. San Diego: Migration Policy Institute (June). Lucas, R. E., Jr. 1988. “On the Mechanics of Economic Development.” Journal of
Monetary Economics. Lucas, R. E. B. 2004. International Migration Regimes and Economic Development.
Report prepared for the Swedish Ministry of Foreign Affairs (EGDI). Lucas, R. E. B. 2005. “International Migration: Lessons from Recent Data.” Presentation
in the Migration Seminar Series. World Bank. Washington, D.C. (March 8). Mattoo, A., I. C. Neagu and C. Ozden. 2005. “Brain Waste? Educated Immigrants in the
US Labor Market.” Mimeo. DECRG-TR. World Bank (March). McKenzie, D. and H. Rapoport. 2005. “Migration Incentives, Migration Networks and
the Dynamics of Education Inequality in Rural Mexico.” Mimeo. DECRG. World Bank. Mountford, A. 1997. “Can a brain drain be good for growth in the source economy?”
Journal of Development Economics 53 (2): 287-303. Patinkin, D. 1968. “A ‘Nationalist’ Model.” In Adams, W. (ed.) The Brain Drain. New
York: Macmillan. Romer, P. 1986. “Increasing Returns and Long Run Growth.” Journal of Political
Economy 94: 1002-37 (October). SOPEMI. 2003. Trends in International Migration. OECD. Paris.

29
Schiff, M. and A. Valdés. 1990. “Nutrition: Alternative Definitions and Policy Implications.” Economic Development and Cultural Change (January).
____ and ____. 1990. “Poverty, Food Intake and Malnutrition: Implications for Food Security in Developing Countries.” American Journal of Agricultural Economics (December).
Schultz, T. W. 1961. “Investment in Human Capital.” AEA Presidential Address.
American Economic Review 51 (1): 1-17. Solimano, A. 2001. “International Migration and the Global Economic Order: An
Overview.” Mimeo. World Bank. Washington, DC. Stalker, P. 1994. The work of strangers. A survey of international labour migration.
International Labour Office: Geneva. Stark, O. “Rethinking the Brain Drain.” 2004. World Development 32 (1): 15-22. ____, A. Casarico, C. Devillanova and S. Uebelmesser. 2004. “The New Economics of
the Brain Gain: Mapping the Gains.” Paper presented at the ‘Conference on Advanced Perspectives on Migration and Mobility.’ University of Bonn (Sept. 30-Oct.1).
____, C. Helmenstein and A. Prskawetz. 1997. “A brain drain with a brain gain.”
Economics Letters 55: 227-34. _____, C. Helmenstein and A. Prskawetz. 1998. “Human capital depletion, human capital
formation, and migration: a blessing or a “curse”?” Economics Letters 60: 363-67. _____, O. and Y. Wang. 2002. “Inducing Human Capital formation: Migration as a
Substitute for Subsidies.” Journal of Public Economics 86 (1): 29-46. Taylor, J. E. 1991. “Remittances and Inequality Reconsidered: Direct, Indirect, and
Intertemporal Effects.” Journal of Policy Modeling 14 (2): 187-208 (November). Vidal, J.-P. 1998. “The effect of emigration on human capital formation.” Journal of
Population Economics 11 (4): 589-600. Warner, A. 2002. “International Wage Determination and Globalization” (March). Winters, L. A. 2005. “Skilled Labor Mobility in Europe 1945-2000. Mimeo.
Development Economics Research Group. World Bank.

30
55 .69
39.91
91.90
No. obs. R sq
-0.112 (2.18)
0.797 (8.74)
0.887 (14.95)
Ln population
0.691 (9.31)
1.400 (9.48)
0.567 (9.11)
Ln income
-0.256 (2.32)
-0.331 (2.21)
-0.366 (3.53)
Ln brain drain
Ln tert enrolment
Ln increment of tertiary education at home 95-2000
(Change in Stocks)
ALL Low Income
OLS; SE Robust; t-stats in parentheses; intercepts included, not shown. Brain Drain: OECD (2000) Tertiary Enrollment: UNESCO (….)
Table 1: Impact of the Brain Drain on Education

31
Figure 1: Brain Grain (BG), Brain Drain (BD) and Net Brain Gain (NBG = BG-BD)
BG, BD,NBG
p10 1 p
NBG1
BG1
BD
NBG2
BG2
Figure 1: Brain Grain (BG), Brain Drain (BD) and Net Brain Gain (NBG = BG-BD)
BG, BD,NBG
p10 1 p
NBG1
BG1
BD
NBG2
BG2

32
Private returns
Cost of Education
Figure 2: Endogenous Migration Probability
A** A Max.
With educ. + migration
With educ.
E (With educ. + migration)
.
Private returns
Cost of Education
Figure 2: Endogenous Migration Probability
A** A Max.
With educ. + migration
With educ.
E (With educ. + migration)
Figure 2: Endogenous Migration Probability
A** A* A Max.
With educ. + migration
With educ.
E (With educ. + migration)
.
Private returns
Cost of Education
Figure 2: Endogenous Migration Probability
A** A Max.
With educ. + migration
With educ.
E (With educ. + migration)
.
Private returns
Cost of Education
Figure 2: Endogenous Migration Probability
A** A Max.
With educ. + migration
With educ.
E (With educ. + migration)
Figure 2: Endogenous Migration Probability
A** A* A Max.
With educ. + migration
With educ.
E (With educ. + migration)
.

33
Figure 3: Group Heterogeneity
A* = A** A Max.
With educ.
E (With educ. + migration)Private returns
Cost of Education
Figure 3: Group Heterogeneity
A* = A** A Max.
With educ.
E (With educ. + migration)Private returns
Cost of Education
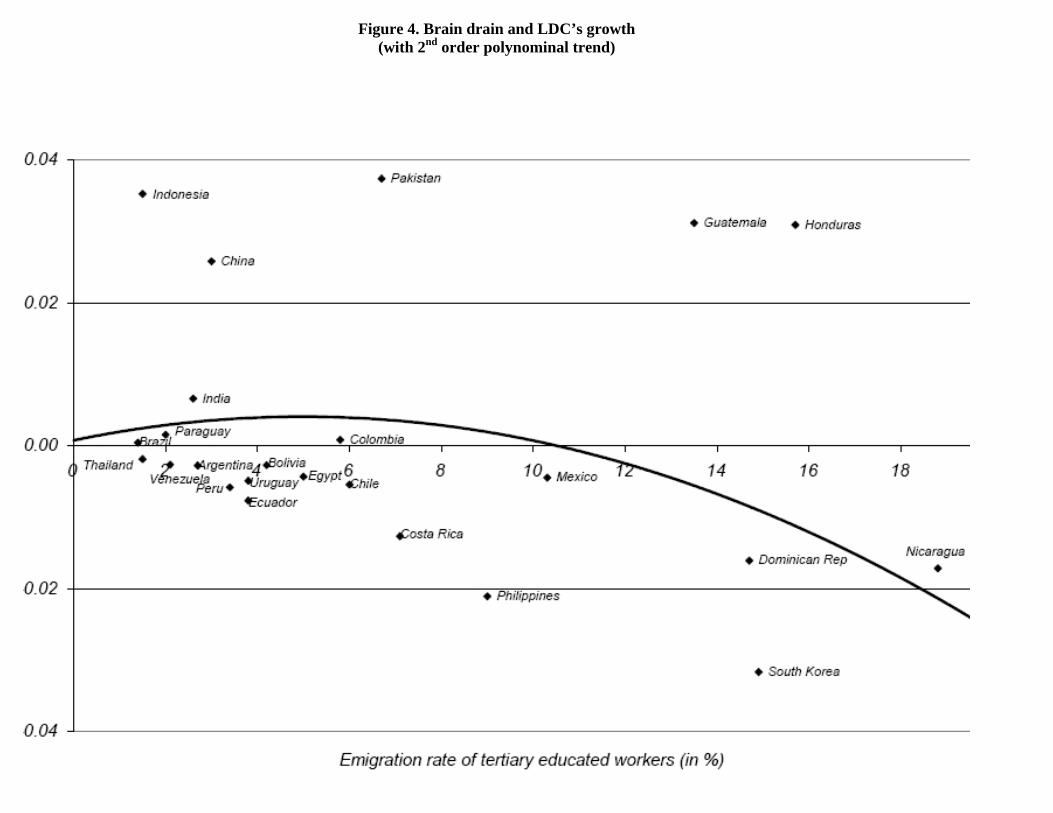
Figure 4. Brain drain and LDC’s growth (with 2nd order polynominal trend)