Brain connectivity dynamics during social interaction ...
6
Brain connectivity dynamics during social interaction reflect social network structure Ralf Schmälzle a,b , Matthew Brook O’Donnell b , Javier O. Garcia c , Christopher N. Cascio b , Joseph Bayer d , Danielle S. Bassett e,f , Jean M. Vettel c,e,g , and Emily B. Falk b,1 a Department of Communication, Michigan State University, East Lansing, MI 48824; b Annenberg School for Communication, University of Pennsylvania, Philadelphia, PA 19104; c Human Research and Engineering Directorate, US Army Research Laboratory, Aberdeen Proving Ground, MD 21005; d School of Communication, The Ohio State University, Columbus, OH 43210; e Department of Bioengineering, University of Pennsylvania, Philadelphia, PA 19104; f Department of Electrical & Systems Engineering, University of Pennsylvania, Philadelphia, PA 19104; and g Department of Psychological and Brain Sciences, University of California, Santa Barbara, CA 93106 Edited by Susan T. Fiske, Princeton University, Princeton, NJ, and approved March 31, 2017 (received for review September 30, 2016) Social ties are crucial for humans. Disruption of ties through social exclusion has a marked effect on our thoughts and feelings; however, such effects can be tempered by broader social network resources. Here, we use fMRI data acquired from 80 male adoles- cents to investigate how social exclusion modulates functional connectivity within and across brain networks involved in social pain and understanding the mental states of others (i.e., mental- izing). Furthermore, using objectively logged friendship network data, we examine how individual variability in brain reactivity to social exclusion relates to the density of participants’ friendship networks, an important aspect of social network structure. We find increased connectivity within a set of regions previously iden- tified as a mentalizing system during exclusion relative to inclusion. These results are consistent across the regions of interest as well as a whole-brain analysis. Next, examining how social network char- acteristics are associated with task-based connectivity dynamics, we find that participants who showed greater changes in connectivity within the mentalizing system when socially excluded by peers had less dense friendship networks. This work provides insight to un- derstand how distributed brain systems respond to social and emo- tional challenges and how such brain dynamics might vary based on broader social network characteristics. social exclusion | mentalizing | fMRI | functional connectivity | social networks H umans are fundamentally motivated to connect with others, spending considerable time and energy investing in social relationships. A lack of social connection resulting from social isolation has a significant negative impact on health and well- being (1, 2), with risks comparable to those associated with lifelong smoking (3). In fact, the acute disruption of ties through social exclusion has a marked effect on our thoughts and feel- ings, and hence brain responses (4). This neural responsiveness to exclusion is thought to help maintain social bonds (5). How- ever, people vary in how strongly they respond to social chal- lenges such as exclusion (6). One important factor that can moderate stress responses and that may contribute to individual differences in reactivity to social challenges such as exclusion is social network resources (7–9). In particular, individual differ- ences in how people react to being excluded may influence the types of social networks they build and thus the resources that limit the risks related to exclusion; likewise, different social en- vironments may influence how a given individual approaches and reacts to stressful events (10). Therefore, an individual’s network structure represents a potential moderator for the cognitive processing of social exclusion. Previous neuroimaging studies have investigated the neural substrates of social exclusion by using experimental designs in which participants are socially isolated through rejection by others; one frequently used task is Cyberball, a virtual ball-tossing game where the experimental participant is excluded from the game and receives no ball throws from other players (11, 12). Research on social exclusion has identified the role of two proposed networks: (i ) a social pain system associated with distress during exclusion (4, 5), characterized by enhanced activations in the anterior cingulate cor- tex (ACC) and the anterior insula (aINS); and (ii ) a mentalizing system with consistent activity in the dorsal and ventral medial prefrontal cortex (mPFC), precuneus, and bilateral temporo–parietal junction (TPJ) (13, 14). Although described rhetorically as two cohesive networks, limited research has examined functional in- teractions, or network dynamics, among the regions during social tasks. A small number of studies have focused on a single hotspot of univariate activation effects in the dorsal ACC (dACC) and have assessed its connectivity during social exclusion (15–17); however, no research has examined broader network dynamics during social exclusion. Furthermore, no research has examined how social environments might moderate brain network dynamics in the face of social interaction. This gap limits our ability to draw conclusions about how brain network and social network dynamics might underlie human processing of social interactions. To this end, we first capitalized on recent advances in network neuroscience to study the functional connectivity relationships among multiple brain regions (18, 19) during social exclusion and inclusion. Although initially focused on the resting state, these novel techniques have recently been extended to assess the dy- namics of connectivity patterns during task performance (20–27). Taking a dynamic network neuroscience perspective, we set out to examine the social pain and mentalizing networks holistically during social exclusion as well as broader network dynamics across the whole brain as a function of social exclusion and inclusion. Significance We examine brain dynamics during a common social experience— social exclusion—to determine whether cohesive networks in the brain support navigation of the social world and contribute to the shape of friendship networks. Specifically, exclusion is associated with increased cohesion within brain networks that support understanding what other people think and feel. Fur- thermore, using social network analysis, we find that variability in brain dynamics is associated with the shape of participants’ friendship networks. Bringing together findings related to brain network dynamics and social network dynamics illuminates ways that psychological processes may shape and be shaped by social environments. Author contributions: M.B.O., C.N.C., J.B., and E.B.F. designed research; M.B.O., C.N.C., and J.B. performed research; R.S., M.B.O., J.O.G., J.B., D.S.B., J.M.V., and E.B.F. contributed new reagents/analytic tools; R.S., M.B.O., and J.B. analyzed data; and R.S., M.B.O., J.O.G., C.N.C., J.B., D.S.B., J.M.V., and E.B.F. wrote the paper. The authors declare no conflict of interest. This article is a PNAS Direct Submission. 1 To whom correspondence should be addressed. Email: [email protected]. This article contains supporting information online at www.pnas.org/lookup/suppl/doi:10. 1073/pnas.1616130114/-/DCSupplemental. www.pnas.org/cgi/doi/10.1073/pnas.1616130114 PNAS Early Edition | 1 of 6 PSYCHOLOGICAL AND COGNITIVE SCIENCES Downloaded by guest on January 17, 2022
Transcript of Brain connectivity dynamics during social interaction ...

Brain connectivity dynamics during social interactionreflect social network structureRalf Schmälzlea,b, Matthew Brook O’Donnellb, Javier O. Garciac, Christopher N. Casciob, Joseph Bayerd,Danielle S. Bassette,f, Jean M. Vettelc,e,g, and Emily B. Falkb,1
aDepartment of Communication, Michigan State University, East Lansing, MI 48824; bAnnenberg School for Communication, University of Pennsylvania,Philadelphia, PA 19104; cHuman Research and Engineering Directorate, US Army Research Laboratory, Aberdeen Proving Ground, MD 21005; dSchool ofCommunication, The Ohio State University, Columbus, OH 43210; eDepartment of Bioengineering, University of Pennsylvania, Philadelphia, PA 19104;fDepartment of Electrical & Systems Engineering, University of Pennsylvania, Philadelphia, PA 19104; and gDepartment of Psychological and Brain Sciences,University of California, Santa Barbara, CA 93106
Edited by Susan T. Fiske, Princeton University, Princeton, NJ, and approved March 31, 2017 (received for review September 30, 2016)
Social ties are crucial for humans. Disruption of ties through socialexclusion has a marked effect on our thoughts and feelings;however, such effects can be tempered by broader social networkresources. Here, we use fMRI data acquired from 80 male adoles-cents to investigate how social exclusion modulates functionalconnectivity within and across brain networks involved in socialpain and understanding the mental states of others (i.e., mental-izing). Furthermore, using objectively logged friendship networkdata, we examine how individual variability in brain reactivity tosocial exclusion relates to the density of participants’ friendshipnetworks, an important aspect of social network structure. Wefind increased connectivity within a set of regions previously iden-tified as a mentalizing system during exclusion relative to inclusion.These results are consistent across the regions of interest as well asa whole-brain analysis. Next, examining how social network char-acteristics are associated with task-based connectivity dynamics, wefind that participants who showed greater changes in connectivitywithin the mentalizing system when socially excluded by peers hadless dense friendship networks. This work provides insight to un-derstand how distributed brain systems respond to social and emo-tional challenges and how such brain dynamics might vary based onbroader social network characteristics.
social exclusion | mentalizing | fMRI | functional connectivity |social networks
Humans are fundamentally motivated to connect with others,spending considerable time and energy investing in social
relationships. A lack of social connection resulting from socialisolation has a significant negative impact on health and well-being (1, 2), with risks comparable to those associated withlifelong smoking (3). In fact, the acute disruption of ties throughsocial exclusion has a marked effect on our thoughts and feel-ings, and hence brain responses (4). This neural responsivenessto exclusion is thought to help maintain social bonds (5). How-ever, people vary in how strongly they respond to social chal-lenges such as exclusion (6). One important factor that canmoderate stress responses and that may contribute to individualdifferences in reactivity to social challenges such as exclusion issocial network resources (7–9). In particular, individual differ-ences in how people react to being excluded may influence thetypes of social networks they build and thus the resources thatlimit the risks related to exclusion; likewise, different social en-vironments may influence how a given individual approaches andreacts to stressful events (10). Therefore, an individual’s networkstructure represents a potential moderator for the cognitiveprocessing of social exclusion.Previous neuroimaging studies have investigated the neural
substrates of social exclusion by using experimental designs inwhich participants are socially isolated through rejection by others;one frequently used task is Cyberball, a virtual ball-tossing gamewhere the experimental participant is excluded from the game andreceives no ball throws from other players (11, 12). Research on
social exclusion has identified the role of two proposed networks: (i)a social pain system associated with distress during exclusion (4, 5),characterized by enhanced activations in the anterior cingulate cor-tex (ACC) and the anterior insula (aINS); and (ii) a mentalizingsystem with consistent activity in the dorsal and ventral medialprefrontal cortex (mPFC), precuneus, and bilateral temporo–parietaljunction (TPJ) (13, 14). Although described rhetorically as twocohesive networks, limited research has examined functional in-teractions, or network dynamics, among the regions during socialtasks. A small number of studies have focused on a single hotspotof univariate activation effects in the dorsal ACC (dACC) andhave assessed its connectivity during social exclusion (15–17);however, no research has examined broader network dynamicsduring social exclusion. Furthermore, no research has examinedhow social environments might moderate brain network dynamicsin the face of social interaction. This gap limits our ability to drawconclusions about how brain network and social network dynamicsmight underlie human processing of social interactions.To this end, we first capitalized on recent advances in network
neuroscience to study the functional connectivity relationshipsamong multiple brain regions (18, 19) during social exclusion andinclusion. Although initially focused on the resting state, thesenovel techniques have recently been extended to assess the dy-namics of connectivity patterns during task performance (20–27).Taking a dynamic network neuroscience perspective, we set out toexamine the social pain and mentalizing networks holisticallyduring social exclusion as well as broader network dynamics acrossthe whole brain as a function of social exclusion and inclusion.
Significance
We examine brain dynamics during a common social experience—social exclusion—to determine whether cohesive networks inthe brain support navigation of the social world and contributeto the shape of friendship networks. Specifically, exclusion isassociated with increased cohesion within brain networks thatsupport understanding what other people think and feel. Fur-thermore, using social network analysis, we find that variabilityin brain dynamics is associated with the shape of participants’friendship networks. Bringing together findings related to brainnetwork dynamics and social network dynamics illuminatesways that psychological processes may shape and be shaped bysocial environments.
Author contributions: M.B.O., C.N.C., J.B., and E.B.F. designed research; M.B.O., C.N.C.,and J.B. performed research; R.S., M.B.O., J.O.G., J.B., D.S.B., J.M.V., and E.B.F. contributednew reagents/analytic tools; R.S., M.B.O., and J.B. analyzed data; and R.S., M.B.O., J.O.G.,C.N.C., J.B., D.S.B., J.M.V., and E.B.F. wrote the paper.
The authors declare no conflict of interest.
This article is a PNAS Direct Submission.1To whom correspondence should be addressed. Email: [email protected].
This article contains supporting information online at www.pnas.org/lookup/suppl/doi:10.1073/pnas.1616130114/-/DCSupplemental.
www.pnas.org/cgi/doi/10.1073/pnas.1616130114 PNAS Early Edition | 1 of 6
PSYC
HOLO
GICALAND
COGNITIVESC
IENCE
S
Dow
nloa
ded
by g
uest
on
Janu
ary
17, 2
022

Second, we examine how network connectivity during socialexclusion relates to an individual’s social network structure (28,29). Sociologists have long shown that social network variablescan characterize the social structure in which people are em-bedded and that social network structure can explain importantoutcomes ranging from measures of happiness to susceptibilityto disease (30–32); likewise, individual differences in personalitycan shape the structure of social networks (33–36). Building fromrecent advances in computational social science (37), social net-work analysis can objectively characterize social network struc-tures related to brain dynamics (28). Specifically, we focus on thedensity of an individual’s ego-network: A dense network indi-cates a participant whose friends are also friends with one an-other, whereas a sparse network indicates a participant whosefriends do not know each other. Perhaps most significantly,dense ego-networks are more close-knit (38, 39) and are lesslikely to include diverse communities. Thus, the friends of theego are more likely to know, interact, and share with each other(38, 39). On one hand, this density may make the consequencesof being excluded more dire, but such close-knit groups alsoconfer social support that may buffer an individual’s response toexclusion (40, 43).Our analysis focuses on a sample of 80 adolescent males be-
cause social ties become especially important during adolescence(42, 43). For each participant, we derived ego-network densityusing objective logs from the Facebook API. Then, while un-dergoing fMRI, participants completed Cyberball, a virtual ball-tossing game used experimentally to study the effects of socialexclusion (11, 12). An overview of the analysis is shown in Fig. 1.We tested the prediction that connectivity during exclusionwould increase, relative to inclusion, in regions of the social painand mentalizing networks derived from meta-analyses of pre-vious research in Neurosynth (36). We also explored whetherconnectivity between these two networks would increase duringexclusion relative to inclusion. To confirm the effects within thesetheoretically relevant networks, we also conducted a whole-brainanalysis based on a large-scale cortical parcellation comprising264 regions, including regions that overlap the social pain andmentalizing systems (44). In both analyses, we find that socialexclusion is associated with increased connectivity within the re-gions of the mentalizing network. Furthermore, we tested theprediction that brain dynamics reflecting sensitivity to exclusion willbe associated with individual differences in social network struc-ture. Specifically, we test competing hypotheses that increasedchanges in brain dynamics within the social pain and mentalizingsystems might be associated with (i) denser friendship networks,given greater consequences of exclusion in a dense network, or (ii)less dense friendship networks, because those with less densenetworks may have less deep social support to buffer the effects ofexclusion. Here, we find support for the latter hypothesis, thatparticipants who show greater connectivity changes in the men-talizing system during social exclusion have less dense friendshipnetworks.
ResultsStronger Connectivity in the Mentalizing Network During SocialExclusion than Inclusion. We first tested the prediction that func-tional connectivity would increase in the social pain and mental-izing systems during exclusion relative to inclusion. We alsoexplored whether connectivity between the two networks changedduring exclusion relative to inclusion. To do so, we examined thefunctional connectivity between regional time series during socialexclusion and social inclusion within a priori networks for socialpain processing and mentalizing derived from meta-analyses ofeach of these constructs (Fig. 1; also see SI Materials and Methods).We computed connectivity matrices as the Pearson correlationbetween the time series of every pair of nodes in the two networks.The resulting connectivity matrices for each individual then weregroup-averaged for display in Fig. 2. As can be seen in Fig. 2, nodesexhibited high connectivity within both the social pain and men-talizing networks and only weak connectivity across networks
during both inclusion and exclusion; this result supports previousresearch that has postulated that these regions form two cohesive,segregated networks or modules (45).Using this functional subdivision of the nodes, we computed the
within-system connectivity as the mean strength of the functionalinteractions within each system and the between-system connec-tivity as the mean of interactions between nodes from differentsystems (46). We then compared the resulting within- and between-system connectivity values for social inclusion and exclusion with apaired t test. As shown in Fig. 3, connectivity significantly increasedon average across participants during social exclusion within thementalizing network, t(79) = 3.67, P < 0.001, but not within thesocial pain network or between the social pain and mentalizingnetworks [t(79) = 1.23 and t(79) = −1.37, both not significant]. Wenext asked whether the strength of individual edges, i.e., the con-nectivity between two nodes, was modulated by exclusion. Similarly,
Fig. 1. Overview of task and analysis schema. While undergoing fMRIscanning, participants played Cyberball, a virtual game during which theywere socially excluded. Using a priori theorized regions from the social painand mentalizing networks derived from two meta-analyses, we extractedthe nodal time series to construct and compare brain network connectivityduring social exclusion and inclusion. Finally, we investigated the relation-ship between each individual’s ego-network density and their brain con-nectivity during social exclusion. Adapted from ref. 64.
2 of 6 | www.pnas.org/cgi/doi/10.1073/pnas.1616130114 Schmälzle et al.
Dow
nloa
ded
by g
uest
on
Janu
ary
17, 2
022
we found that social exclusion was associated with stronger con-nectivity between edges comprising the mentalizing network (Fig.S1). Thus, when people were socially excluded, on average, weobserved greater regional connectivity between regions of thementalizing network but not between regions of the social painnetwork or between regions of the two networks.To complement our connectivity analysis within a priori hy-
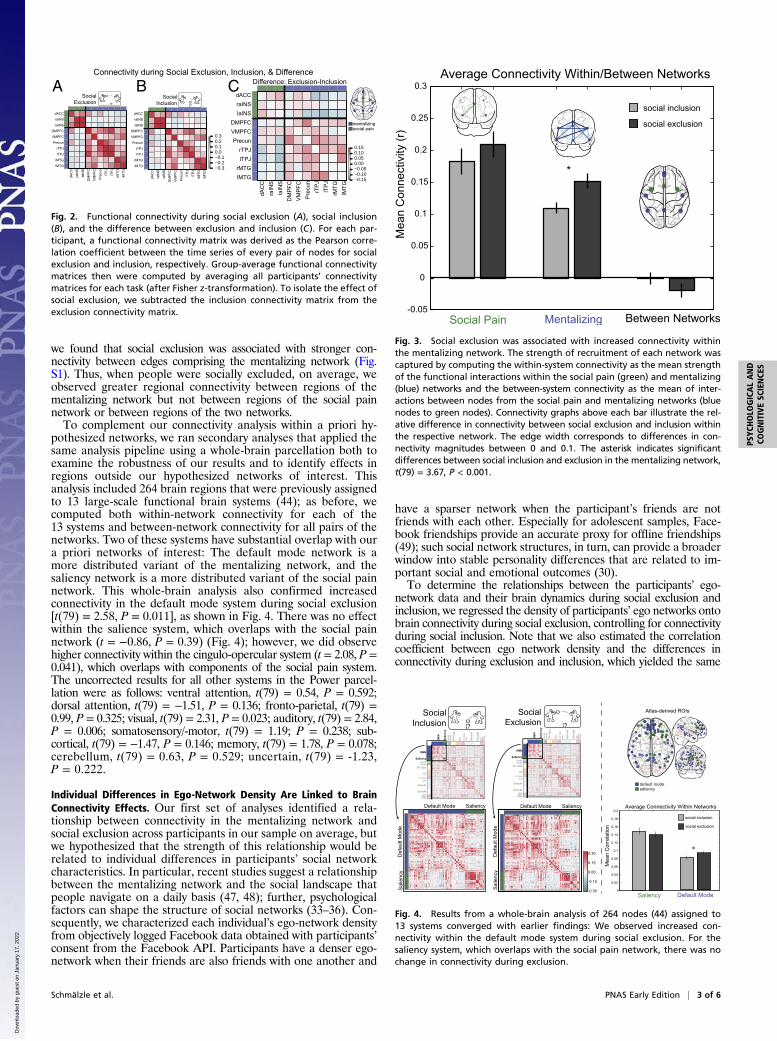
pothesized networks, we ran secondary analyses that applied thesame analysis pipeline using a whole-brain parcellation both toexamine the robustness of our results and to identify effects inregions outside our hypothesized networks of interest. Thisanalysis included 264 brain regions that were previously assignedto 13 large-scale functional brain systems (44); as before, wecomputed both within-network connectivity for each of the13 systems and between-network connectivity for all pairs of thenetworks. Two of these systems have substantial overlap with oura priori networks of interest: The default mode network is amore distributed variant of the mentalizing network, and thesaliency network is a more distributed variant of the social painnetwork. This whole-brain analysis also confirmed increasedconnectivity in the default mode system during social exclusion[t(79) = 2.58, P = 0.011], as shown in Fig. 4. There was no effectwithin the salience system, which overlaps with the social painnetwork (t = −0.86, P = 0.39) (Fig. 4); however, we did observehigher connectivity within the cingulo-opercular system (t = 2.08, P =0.041), which overlaps with components of the social pain system.The uncorrected results for all other systems in the Power parcel-lation were as follows: ventral attention, t(79) = 0.54, P = 0.592;dorsal attention, t(79) = −1.51, P = 0.136; fronto-parietal, t(79) =0.99, P = 0.325; visual, t(79) = 2.31, P = 0.023; auditory, t(79) = 2.84,P = 0.006; somatosensory/-motor, t(79) = 1.19; P = 0.238; sub-cortical, t(79) = −1.47, P = 0.146; memory, t(79) = 1.78, P = 0.078;cerebellum, t(79) = 0.63, P = 0.529; uncertain, t(79) = -1.23,P = 0.222.
Individual Differences in Ego-Network Density Are Linked to BrainConnectivity Effects. Our first set of analyses identified a rela-tionship between connectivity in the mentalizing network andsocial exclusion across participants in our sample on average, butwe hypothesized that the strength of this relationship would berelated to individual differences in participants’ social networkcharacteristics. In particular, recent studies suggest a relationshipbetween the mentalizing network and the social landscape thatpeople navigate on a daily basis (47, 48); further, psychologicalfactors can shape the structure of social networks (33–36). Con-sequently, we characterized each individual’s ego-network densityfrom objectively logged Facebook data obtained with participants’consent from the Facebook API. Participants have a denser ego-network when their friends are also friends with one another and
have a sparser network when the participant’s friends are notfriends with each other. Especially for adolescent samples, Face-book friendships provide an accurate proxy for offline friendships(49); such social network structures, in turn, can provide a broaderwindow into stable personality differences that are related to im-portant social and emotional outcomes (30).To determine the relationships between the participants’ ego-
network data and their brain dynamics during social exclusion andinclusion, we regressed the density of participants’ ego networks ontobrain connectivity during social exclusion, controlling for connectivityduring social inclusion. Note that we also estimated the correlationcoefficient between ego network density and the differences inconnectivity during exclusion and inclusion, which yielded the same
A B C
Fig. 2. Functional connectivity during social exclusion (A), social inclusion(B), and the difference between exclusion and inclusion (C). For each par-ticipant, a functional connectivity matrix was derived as the Pearson corre-lation coefficient between the time series of every pair of nodes for socialexclusion and inclusion, respectively. Group-average functional connectivitymatrices then were computed by averaging all participants’ connectivitymatrices for each task (after Fisher z-transformation). To isolate the effect ofsocial exclusion, we subtracted the inclusion connectivity matrix from theexclusion connectivity matrix.
Fig. 3. Social exclusion was associated with increased connectivity withinthe mentalizing network. The strength of recruitment of each network wascaptured by computing the within-system connectivity as the mean strengthof the functional interactions within the social pain (green) and mentalizing(blue) networks and the between-system connectivity as the mean of inter-actions between nodes from the social pain and mentalizing networks (bluenodes to green nodes). Connectivity graphs above each bar illustrate the rel-ative difference in connectivity between social exclusion and inclusion withinthe respective network. The edge width corresponds to differences in con-nectivity magnitudes between 0 and 0.1. The asterisk indicates significantdifferences between social inclusion and exclusion in the mentalizing network,t(79) = 3.67, P < 0.001.
Fig. 4. Results from a whole-brain analysis of 264 nodes (44) assigned to13 systems converged with earlier findings: We observed increased con-nectivity within the default mode system during social exclusion. For thesaliency system, which overlaps with the social pain network, there was nochange in connectivity during exclusion.
Schmälzle et al. PNAS Early Edition | 3 of 6
PSYC
HOLO
GICALAND
COGNITIVESC
IENCE
S
Dow
nloa
ded
by g
uest
on
Janu
ary
17, 2
022

results. We first entered as connectivity measures the mean strengthacross nodes from the mentalizing and social pain systems, re-spectively, but found no significant effects. Next we entered theconnectivity of individual edges, i.e., the correlations between thetime courses from each pair of nodes. After correcting for multiplecomparisons using the false-discovery rate (FDR, q = 0.05), wefound that connectivity between the left and right TPJ, two keynodes of the mentalizing network, was negatively related to ego-network density (Fig. 5). In other words, individuals who exhibit astronger TPJ coupling during exclusion tend to have a less densefriendship network. We did not observe effects between any pairs ofnodes from the social pain network, either corrected or uncorrected.Together, these results suggest that brain dynamics during key socialexperiences such as exclusion may contribute to the type of networkstructure people occupy. Likewise, the amount of interconnectionsamong friends of the excluded participant’s social network may alsoinfluence the impact of exclusion on brain connectivity.
DiscussionSocial relationships are a driving force for human behavior, andprevious research on social exclusion has identified robust in-volvement of two sets of brain regions activated during social painand mentalizing. We bring a network neuroscience perspective toexamine how social experiences may engage and reconfigure thesebrain networks in support of social cognition and how individualdifferences in the way people use their brains may correspondinglyinfluence or be influenced by the structure of their social networks.Specifically, we first tested the prediction that functional con-
nectivity would increase within the social pain and mentalizingnetworks during social exclusion relative to inclusion. We alsoexplored the relationships between the networks during both ex-clusion and inclusion. Here, we find support for tight coupling ofthe two proposed networks (social pain and mentalizing) duringsocial inclusion and exclusion. Next, we find that connectivitywithin the mentalizing system increases during exclusion relativeto inclusion. This result is confirmed using a whole brain analysisthat identified significant effects within the so-called default modenetwork. This atlas-derived default mode network overlaps withan a priori hypothesized mentalizing network.
Previous research has highlighted the role of the social painsystem in responding to exclusion (4, 50). Building on thisstarting point, the few studies examining brain connectivityduring social exclusion (15–17, 51) have focused on dACC seedregions as a hotspot of univariate activation effects in the socialpain network. Our findings highlight a broader network per-spective. Although connectivity is strong within both social painand mentalizing networks during both social exclusion and in-clusion, connectivity increases within the mentalizing system, butnot the social pain system, during exclusion relative to inclusion.This first finding highlights the critical value of coordinationbetween regions of the same subnetwork, revealing that within-network instead of between-network interactions were stronglycorrelated with the social exclusion condition. The second find-ing complements existing univariate accounts of increased ac-tivity within specific nodes of the social pain and mentalizingnetworks by highlighting a distinction in the temporal dynamicsof the social pain and mentalizing processes that was not capturedby average univariate activation results. Overall, these findings arein line with the wider literature arguing that connectivity and ac-tivity provide complementary information (52, 53) and thus canprovide complementary insights about cognitive processes.Functionally, this stronger coupling among mentalizing re-
gions may support considering the intentions of the individualswho are excluding the participant in the social event or internalruminations about the relevance of potential ongoing exclusionfor one’s broader social relations. In fact, verbal reports fromparticipants who have undergone this type of exclusion show thatsuch thoughts are frequent (11), although not uniformly dis-tributed across people. One benefit of the connectivity methodsused in the present paper is that they are, in principle, alsosensitive to thought processes that wax and wane multiple timesduring the exclusion period, such as fluctuations in mentalizing(e.g., about others’ thoughts and motives). Thus, we suggest thatincreased connectivity in the mentalizing network may tap intosuch dynamic aspects of the response to social exclusion over aperiod. One possible function of such a dynamic process may beto make sense of the situation and to reflect more broadly on themeaning of that experience, thereby supporting coping-relatedfunctions (54). These data highlight the value of examining func-tional connectivity in addition to mean activation because connec-tivity can provide different insight into the dynamics of psychologicalphenomena such as exclusion; although average activation in bothmentalizing and social pain systems are commonly observed inresponse to exclusion, changes in connectivity were significant inthis dataset only within the mentalizing system.Our social-cognitive interpretation of changing connectivity
within the mentalizing system as a means of coping with exclu-sion is also supported by the fact that this effect covaries withparticipants’ broader social network structures. Specifically,participants who showed increased connectivity during exclusionrelative to inclusion between the left and right TPJ, two regionsof the mentalizing system, also had less dense social networkstructures. One possibility is that outside the safety of dense ego-networks, which tend to be more close-knit (38, 39), individualsuse greater mentalizing resources, especially during stressfulsocial interactions such as exclusion. This effect is consistent withneurocognitive models that link intrapersonal effects of socialexclusion to the interpersonal contexts surrounding individualsduring daily life (53). Social exclusion, by its very nature, does notoccur in a vacuum. Rather, preexisting characteristics of one’s so-cial network provide the background or contextual standard fromwhich any new episode of exclusion is understood and compared(55). Within this framework, our measure of social network densitycan be understood as a social inclination. When excluded, peoplewho interact more with unconnected others may use mentalizingresources differently than those with denser ego-friendship net-works. That said, it is also likely that those who use mentalizingresources differently may position themselves differently in theirsocial networks, and that the ways in which individuals use theirbrains during social experiences shapes their preferences and
Fig. 5. Scatterplot illustrating the significant relationship between thefunctional connectivity between the lTPJ and rTPJ and the density of aparticipant’s ego-friendship network. Participants who show stronger re-gional coupling during exclusion have sparsely connected networks in whichfewer of their friends are also friends with each other.
4 of 6 | www.pnas.org/cgi/doi/10.1073/pnas.1616130114 Schmälzle et al.
Dow
nloa
ded
by g
uest
on
Janu
ary
17, 2
022

tendencies to occupy different types of network positions. Forexample, the extant literature suggests that the lack of diversecommunities in denser networks may relate to the degree ofmentalizing that individuals engage in during social tasks. Indeed,prior work has shown that network brokerage, which is inverselyrelated to density and associated with bridging diverse communi-ties, can moderate mentalizing activity during social decisionmaking (56). The present findings substantially extend prior re-search linking personality to the shape of social networks (33–36)by showing that individual differences in brain dynamics may un-derpin such links. In other words, the relationship between brainnetwork dynamics and social network dynamics is likely bidirec-tional, and the current findings open avenues to understand both.Our results add to a growing literature that links individual
differences and social network properties, and they also bringneuroscientific methods to bear in characterizing individual dif-ferences. For example, past research has linked social personalitytendencies, such as extraversion, self-monitoring, and cognitiveempathy (related to mentalizing) to personal network structure(35, 57). Our results also complement work across other socialspecies, including research with macaques (58). Researchershave studied the structure and connectivity of brain regions thatbelong to the default mode network, including the posteriorsuperior temporal sulcus (pSTS), which parallels our TPJ results.These regions are modulated on the basis of social networkcharacteristics, such as network size and position in a social hi-erarchy (59). Our data complement these findings by showingthat properties of an individual’s social networks are associatedwith intrapersonal reactions to exclusion, which then might re-ciprocally influence the interpersonal relationships that underliethese social networks. Taken together, these results also high-light the need to consider jointly the structural characteristics ofpersonal networks in combination with cognitive responses toacute episodes of exclusion.In sum, we find that social exclusion is associated with in-
creased connectivity within the mentalizing system. Furthermore,we explore whether the impact of social exclusion on brainconnectivity relates to the structure of participants’ friendshipnetworks, finding that participants with sparser friendship net-works show increased connectivity within key brain systems whenexcluded. These findings demonstrate that networked brain dy-namics during social-cognitive tasks can provide relevant infor-mation in addition to univariate activity. In particular, ourconnectivity analysis highlights the fundamental importance ofthe mentalizing system in responding to socially salient events,and it indicates how a participant’s social network structure maycapture critical differences between individuals in how socialexclusion influences these key dynamics of the underlying brainnetworks for social cognition. Together, our connectivity analysisoffers insights into the neural and social responses to commonsocial experiences such as exclusion and delineates how distrib-uted brain networks respond to powerful socio-affective chal-lenges that manifest in social networks indexed by online media.
Materials and MethodsParticipants. Eighty neurotypical 16- to 17-y-old adolescent males wererecruited through the Michigan state driver registry database as part of alarger study on peer influences on adolescent driving. Participants metstandard MRI safety criteria. In accordance with Institutional Review Boardapproval from the University of Michigan, legal guardians provided writteninformed consent, and adolescents provided written assent.
Social Exclusion Task. Participants completed the Cyberball game, which hasbeen validated in a number of behavioral and neuroimaging studies as areliable way of simulating the experience of social exclusion (5, 60), whileundergoing fMRI scanning. The Cyberball game consisted of two 3-minrounds, and the order of rounds was held constant to preserve the psy-chological experience across participants. In the inclusion round, the par-ticipant and two virtual players received the ball equally often, whereasduring the exclusion game the participant and virtual players started outplaying the ball, but the participant was left out after a few throws,
simulating social exclusion. After the scan, participants completed a setof questionnaires.
Social Network Assessment. In addition to the fMRI tasks, participants alsoprovided information about their social networks. This information wasassessed from logged online friendships using the Facebook API (collected in2011–2013). Following this data acquisition, density was computed for par-ticipants’ egocentric networks. In particular, we constructed a friendshipnetwork for a given individual (“ego”) and then removed the ego from thenetwork (because all friends are logically connected to it), and computed thedensity among the remaining nodes (n) of friends, assessing the proportionof existing connections (m) between friends vs. all possible connections [i.e.,n × (n − 1)/2 if all the ego’s friends are also friends with each other]. In otherwords, the density of the ego-network measures the extent to which par-ticipants’ Facebook friends are interconnected. After first removing the egofrom each individual’s friendship network, density was computed usingNetworkX with the formula: d = 2m/(n × (n − 1)), where m denotes thenumber of edges between persons and n denotes the number of nodes.
fMRI Acquisition and Analysis. Functional images were recorded using a re-verse spiral sequence (repetition time = 2,000 ms, echo time = 30 ms, flipangle = 90°, 43 axial slices, field of view = 220 mm, slice thickness = 3 mm,voxel size = 3.44 × 3.44 × 3.0 mm). We also acquired in-plane T1-weightedimages (43 slices, slice thickness = 3 mm, voxel size = 0.86 × 0.86 × 3.0 mm)and high-resolution T1-weighted images [spoiled gradient recall (SPGR) ac-quisition, 124 slices, slice thickness = 1.02 × 1.02 × 1.2 mm] for use in cor-egistration and normalization. Functional data were preprocessed andanalyzed using Statistical Parametric Mapping (SPM8, Wellcome Depart-ment of Cognitive Neurology, Institute of Neurology, London). The first fourvolumes were discarded before analysis. Functional images were despikedusing the 3dDespike program as implemented in the AFNI toolbox, correctedfor differences in slice time acquisition, and spatially realigned to the firstfunctional image. Functional and structural images were coregistered usinga two-stage procedure. First, in-plane T1 images were registered to themean functional image. Next, high-resolution T1 images were registered tothe in-plane image. Structural images then were skull-stripped and nor-malized to the skull-stripped MNI template provided by FSL (Oxford Centrefor functional MRI of the Brain).
Meta-Analytical Definition of Regions. Nodes for the social pain and men-talizing networks were derived from semiautomated and researcher-curatedmeta-analysis: We used Neurosynth (36) to perform two automated meta-analyses of the functional neuroimaging literature on “mentalizing” and“social pain,” respectively. In addition, we consulted two separate researcher-curated meta-analyses of mentalizing (61) and social pain (4), respectively (seeSI Materials and Methods for additional details). This procedure providedthe following coordinates for the mentalizing network (Fig. S2): dorsalmedial prefrontal cortex (dmPFC) (0, 53, 30); ventromedial PFC (vmPFC)(0, 48, −18); precuneus (0, −54, 44); right TPJ (rTPJ) (48, −56, 23); left TPJ(lTPJ) (−48, −56, 23); right middle temporal gyrus (rMTG) (53, −12, −16);and left MTG (lMTG) (−53, −12, −16) and the following coordinates for thesocial pain network: dACC (0, 16, 32); right aINS (r-aINS) (38, 7, −4); and leftaINS (l-aINS) (−38, 7, −4). In addition to the regions of these two a priorinetworks, we also examined connectivity changes during social exclusionusing a whole-brain parcellation that assigns 264 brain regions to 1 of13 functional networks (Fig. S2) (44).
Functional Connectivity Analysis. Analysis of functional connectivity wasperformed in Python 2.7 using the nilearn package (61). Data were bandpassfiltered between 0.06–0.12 Hz (22), detrended, standardized, and extractedfrom 8-mm-radius spheres around the nodes specified above. Artifactswere reduced using frame censoring and regression. In particular, frameswith framewise displacement (FD) >0.5 mm were censored; nuisance re-gressors included white matter and ventricular signals, the realignmentparameters, and high-variance confounds as implemented in the nilearnpackage. From the extracted time series corresponding to the social in-clusion and exclusion runs, we used Pearson’s correlation coefficient toconstruct task-specific undirected and weighted functional connectivitymatrices for each participant. To determine whether results observed couldbe explained by increased mind-wandering over time in the scanner, anadditional set of split-half analyses was also implemented using parallelmethods on the first and second half of each block (inclusion and exclusion),respectively (Fig. S3). Analyses were implemented using python packagesand in-house functions, and visualizations were created with Nilearn,Matplotlib, and Seaborn (61–63).
Schmälzle et al. PNAS Early Edition | 5 of 6
PSYC
HOLO
GICALAND
COGNITIVESC
IENCE
S
Dow
nloa
ded
by g
uest
on
Janu
ary
17, 2
022

ACKNOWLEDGMENTS. We thank Nicole Cooper, Qawi Telesford, andMarcelo Mattar for valuable comments and discussions; the Universityof Michigan Transportation Research Institute for research assistance;the staff of the University of Michigan fMRI Center; and Raymond Bingham,Jean Shope, Marie Claude Ouimet, Anuj Pradhan, Bruce Simons-Morton,Kristin Shumaker, Elizabeth Beard, Jennifer LaRose, Farideh Almani, andJohanna Dolle. This research was supported by the Eunice Kennedy ShriverNational Institute of Child Health and Human Development under AwardR21HD073549, by NIH New Innovator Award 1DP2DA03515601 (to E.B.F.), bythe Army Research Laboratory under Cooperative Agreement Number W911NF-10-2-0022, and the Defense Advanced Research Projects Agency Young Faculty
Award YFA-D14AP00048 (to E.B.F.). D.S.B. received support from the John D.and Catherine T. MacArthur Foundation, the Alfred P. Sloan Foundation,the Army Research Office through Contract W911NF-14-1-0679, NationalInstitute of Mental Health Grant 2-R01-DC-009209-11, National Institute ofChild Health and Human Development Grant 1R01HD086888-01, the Of-fice of Naval Research Award CRCNS BCS-1441502, CAREER PHY-1554488,and the National Science Foundation. The views and the conclusions con-tained in this document are those of the authors and should not be inter-preted as representing the official policies, either expressed or implied, ofthe NIH and its subdivisions, the Army Research Laboratory, or the USGovernment.
1. Muscatell KA, Eisenberger NI (2015) Neurocognitive and Physiological MechanismsLinking Stress and Health. Brain Mapping (Elsevier, Amsterdam), pp 29–33.
2. Cacioppo JT, Cacioppo S (2014) Social relationships and health: The toxic effects ofperceived social isolation. Soc Personal Psychol Compass 8:58–72.
3. Holt-Lunstad J, Smith TB, Layton JB (2010) Social relationships and mortality risk: Ameta-analytic review. PLoS Med 7:e1000316.
4. Rotge J-Y, et al. (2015) A meta-analysis of the anterior cingulate contribution to socialpain. Soc Cogn Affect Neurosci 10:19–27.
5. Eisenberger NI, Lieberman MD, Williams KD (2003) Does rejection hurt? An FMRIstudy of social exclusion. Science 302:290–292.
6. Slavich GM, Way BM, Eisenberger NI, Taylor SE (2010) Neural sensitivity to social re-jection is associated with inflammatory responses to social stress. Proc Natl Acad SciUSA 107:14817–14822.
7. Cobb S (1976) Presidential Address-1976. Social support as a moderator of life stress.Psychosom Med 38:300–314.
8. Cassel J (1976) . The contribution of the social environment to host resistance: TheFourth Wade Hampton Frost Lecture. Am J Epidemiol 104:107–123.
9. Schwarzer R, Leppin A (1989) Social support and health: A meta-analysis. PsycholHealth 3:1–15.
10. Miller G, Chen E, Cole SW (2009) Health psychology: Developing biologically plausiblemodels linking the social world and physical health. Annu Rev Psychol 60:501–524.
11. Williams KD, Cheung CK, Choi W (2000) Cyberostracism: Effects of being ignored overthe Internet. J Pers Soc Psychol 79:748–762.
12. Williams KD, Forgas JP, Von Hippel W (2013) The Social Outcast: Ostracism, SocialExclusion, Rejection, and Bullying (Psychology Press, East Sussex, UK).
13. Beyer F, Münte TF, Krämer UM (2014) Increased neural reactivity to socio-emotionalstimuli links social exclusion and aggression. Biol Psychol 96:102–110.
14. Powers KE, Wagner DD, Norris CJ, Heatherton TF (2013) Socially excluded individualsfail to recruit medial prefrontal cortex for negative social scenes. Soc Cogn AffectNeurosci 8:151–157.
15. Bolling DZ, et al. (2011) Development of neural systems for processing social exclusionfrom childhood to adolescence. Dev Sci 14:1431–1444.
16. Puetz VB, et al. (2014) Neural response to social rejection in children with early sep-aration experiences. J Am Acad Child Adolesc Psychiatry 53:1328–1337.e8.
17. Meyer ML, et al. (2013) Empathy for the social suffering of friends and strangersrecruits distinct patterns of brain activation. Soc Cogn Affect Neurosci 8:446–454.
18. Bullmore ET, Bassett DS (2011) Brain graphs: Graphical models of the human brainconnectome. Annu Rev Clin Psychol 7:113–140.
19. Smith SM, et al. (2013) Functional connectomics from resting-state fMRI. Trends CognSci 17:666–682.
20. Bassett DS, et al. (2011) Dynamic reconfiguration of human brain networks duringlearning. Proc Natl Acad Sci USA 108:7641–7646.
21. Bassett DS, et al. (2013) Task-based core-periphery organization of human brain dy-namics. PLOS Comput Biol 9:e1003171.
22. Bassett DS, Yang M, Wymbs NF, Grafton ST (2015) Learning-induced autonomy ofsensorimotor systems. Nat Neurosci 18:744–751.
23. Braun U, et al. (2015) Dynamic reconfiguration of frontal brain networks during ex-ecutive cognition in humans. Proc Natl Acad Sci USA 112:11678–11683.
24. Doron KW, Bassett DS, Gazzaniga MS (2012) Dynamic network structure of in-terhemispheric coordination. Proc Natl Acad Sci USA 109:18661–18668.
25. Ekman M, Derrfuss J, Tittgemeyer M, Fiebach CJ (2012) Predicting errors from reconfigu-ration patterns in human brain networks. Proc Natl Acad Sci USA 109:16714–16719.
26. Mantzaris AV, et al. (2013) Dynamic network centrality summarizes learning in thehuman brain. J Complex Netw 1:83–92.
27. Mattar MG, Cole MW, Thompson-Schill SL, Bassett DS (2015) A functional cartographyof cognitive systems. PLOS Comput Biol 11:e1004533.
28. O’Donnell MB, Falk EB (2015) Big data under the microscope and brains in socialcontext integrating methods from computational social science and neuroscience.Ann Am Acad Pol Soc Sci 659:274–289.
29. Schilbach L, et al. (2013) Toward a second-person neuroscience. Behav Brain Sci 36:393–414.
30. Burt RS (1992) Structural Holes: The Social Structure of Competition (Harvard UnivPress, Cambridge, MA).
31. Granovetter MS (1973) The strength of weak ties. Am J Sociol 78:1360–1380.32. Smith KP, Christakis NA (2008) Social networks and health. Annu Rev Sociol 34:
405–429.33. Andersson MA (2012) dispositional optimism and the emergence of social network
diversity. Sociol Q 53:92–115.34. Burt RS, Jannotta JE, Mahoney JT (1998) Personality correlates of structural holes. Soc
Networks 20:63–87.
35. Kalish Y, Robins G (2006) Psychological predispositions and network structure: Therelationship between individual predispositions, structural holes and network closure.Soc Networks 28:56–84.
36. Landis B (2016) Personality and social networks in organizations: A review and futuredirections. J Organ Behav 37:S107–S121.
37. Abraham A, Hassanien A-E, Snášel V eds (2010) Computational Social Network Analysis:Trends, Tools and Research Advances (Springer, London).
38. Hurlbert JS, Haines VA, Beggs JJ (2000) Core networks and tie activation: What kindsof routine networks allocate resources in nonroutine situations? Am Sociol Rev 65:598–618.
39. Parks MR (2011) Social networks and the life of relationships. The Sage Handbook ofInterpersonal Communication (SAGE Publications, Thousand Oaks, CA), pp 355–388.
40. Lin N (2002) Social Capital: A Theory of Social Structure and Action (Cambridge UnivPress, Cambridge, UK).
41. Monge PR, Contractor NS (2003) Theories of Communication Networks (Oxford Uni-versity Press, Oxford, UK).
42. Masten CL, et al. (2009) Neural correlates of social exclusion during adolescence:Understanding the distress of peer rejection. Soc Cogn Affect Neurosci 4:143–157.
43. Masten CL, Telzer EH, Fuligni AJ, Lieberman MD, Eisenberger NI (2012) Time spentwith friends in adolescence relates to less neural sensitivity to later peer rejection. SocCogn Affect Neurosci 7:106–114.
44. Power JD, et al. (2011) Functional network organization of the human brain. Neuron72:665–678.
45. Sporns O (2013) Network attributes for segregation and integration in the humanbrain. Curr Opin Neurobiol 23:162–171.
46. Gu S, et al. (2015) Emergence of system roles in normative neurodevelopment. ProcNatl Acad Sci USA 112:13681–13686.
47. Lewis PA, Rezaie R, Brown R, Roberts N, Dunbar RIM (2011) Ventromedial prefrontalvolume predicts understanding of others and social network size. Neuroimage 57:1624–1629.
48. Powell JL, Lewis PA, Dunbar RIM, García-Fiñana M, Roberts N (2010) Orbital pre-frontal cortex volume correlates with social cognitive competence. Neuropsychologia48:3554–3562.
49. Arnaboldi V, Guazzini A, Passarella A (2013) Egocentric online social networks:Analysis of key features and prediction of tie strength in Facebook. Comput Commun36:1130–1144.
50. Eisenberger NI (2012) The pain of social disconnection: Examining the shared neuralunderpinnings of physical and social pain. Nat Rev Neurosci 13:421–434.
51. Onoda K, et al. (2010) Does low self-esteem enhance social pain? The relationshipbetween trait self-esteem and anterior cingulate cortex activation induced by os-tracism. Soc Cogn Affect Neurosci 5:385–391.
52. van den Heuvel MP, Hulshoff Pol HE (2010) Exploring the brain network: A review onresting-state fMRI functional connectivity. Eur Neuropsychopharmacol 20:519–534.
53. Medaglia JD, Lynall M-E, Bassett DS (2015) Cognitive network neuroscience. J CognNeurosci 27:1471–1491.
54. Doré BP, Ochsner KN (2015) Emotion Regulation. Brain Mapping (Elsevier, Amsterdam),pp 53–58.
55. Kawamoto T, Ura M, Nittono H (2015) Intrapersonal and interpersonal processes ofsocial exclusion. Front Neurosci 9:62.
56. O’Donnell MB, Bayer J, Cascio CN, Falk EB (2017) Neural bases of recommendationsdiffer according to social network structure. Soc Cogn Affect Neurosci 12:61–69.
57. Roberts SGB, Wilson R, Fedurek P, Dunbar RIM (2008) Individual differences andpersonal social network size and structure. Pers Individ Dif 44:954–964.
58. Sallet J, et al. (2011) Social network size affects neural circuits in macaques. Science334:697–700.
59. Mars RB, et al. (2012) On the relationship between the “default mode network” andthe “social brain”. Front Hum Neurosci 6:189.
60. Williams KD, Sommer KL (1997) Social ostracism by coworkers: Does rejection lead toloafing or compensation? Pers Soc Psychol Rev. Available at: journals.sagepub.com/doi/abs/10.1177/0146167297237003. Accessed April 14, 2017.
61. Abraham A, et al. (2014) Machine learning for neuroimaging with scikit-learn. FrontNeuroinform 8:14.
62. Hunter JD (2007) Matplotlib: A 2D graphics environment. Comput Sci Eng 10.1109/MCSE.2007.55.
63. Waskom M, et al. (2014) seaborn: v0.5.0 (November 2014) (ZENODO), 10.5281/zenodo.12710.
64. Schmälzle R, et al. (December 23, 2016) Brain connectivity dynamics during socialinteraction reflect social network structure. bioRxiv, 10.1101/096420.
6 of 6 | www.pnas.org/cgi/doi/10.1073/pnas.1616130114 Schmälzle et al.
Dow
nloa
ded
by g
uest
on
Janu
ary
17, 2
022